monthly statistics package - fraser valley real estate ... · fraser valley real estate board ....
TRANSCRIPT
Fraser Valley Real Estate Board Monthly Statistics Package
October 2017
News Release Fraser Valley Real Estate Board
Contact Michael Gleboff, Communications Coordinator [email protected] Fraser Valley Real Estate Board Telephone 604.930.7630 Fax 604.930.7623 www.fvreb.bc.ca
For Immediate Release: November 2, 2017
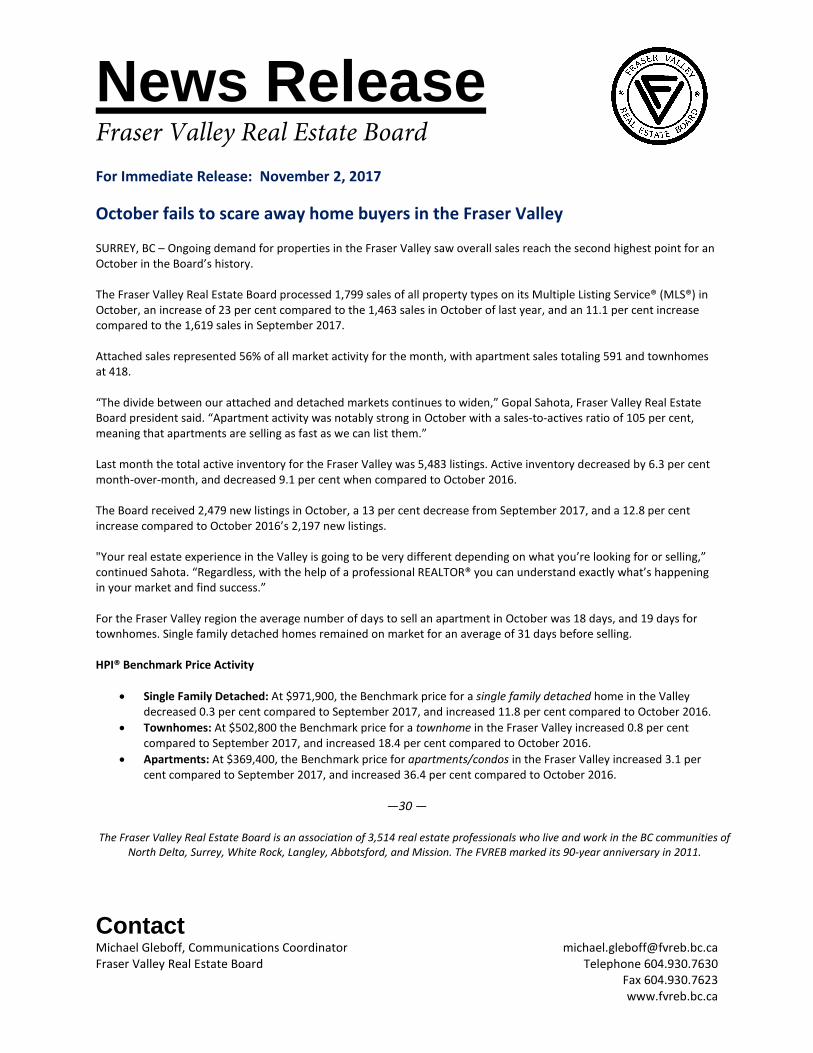
October fails to scare away home buyers in the Fraser Valley
SURREY, BC – Ongoing demand for properties in the Fraser Valley saw overall sales reach the second highest point for an October in the Board’s history. The Fraser Valley Real Estate Board processed 1,799 sales of all property types on its Multiple Listing Service® (MLS®) in October, an increase of 23 per cent compared to the 1,463 sales in October of last year, and an 11.1 per cent increase compared to the 1,619 sales in September 2017. Attached sales represented 56% of all market activity for the month, with apartment sales totaling 591 and townhomes at 418. “The divide between our attached and detached markets continues to widen,” Gopal Sahota, Fraser Valley Real Estate Board president said. “Apartment activity was notably strong in October with a sales-to-actives ratio of 105 per cent, meaning that apartments are selling as fast as we can list them.” Last month the total active inventory for the Fraser Valley was 5,483 listings. Active inventory decreased by 6.3 per cent month-over-month, and decreased 9.1 per cent when compared to October 2016. The Board received 2,479 new listings in October, a 13 per cent decrease from September 2017, and a 12.8 per cent increase compared to October 2016’s 2,197 new listings. "Your real estate experience in the Valley is going to be very different depending on what you’re looking for or selling,” continued Sahota. “Regardless, with the help of a professional REALTOR® you can understand exactly what’s happening in your market and find success.” For the Fraser Valley region the average number of days to sell an apartment in October was 18 days, and 19 days for townhomes. Single family detached homes remained on market for an average of 31 days before selling. HPI® Benchmark Price Activity
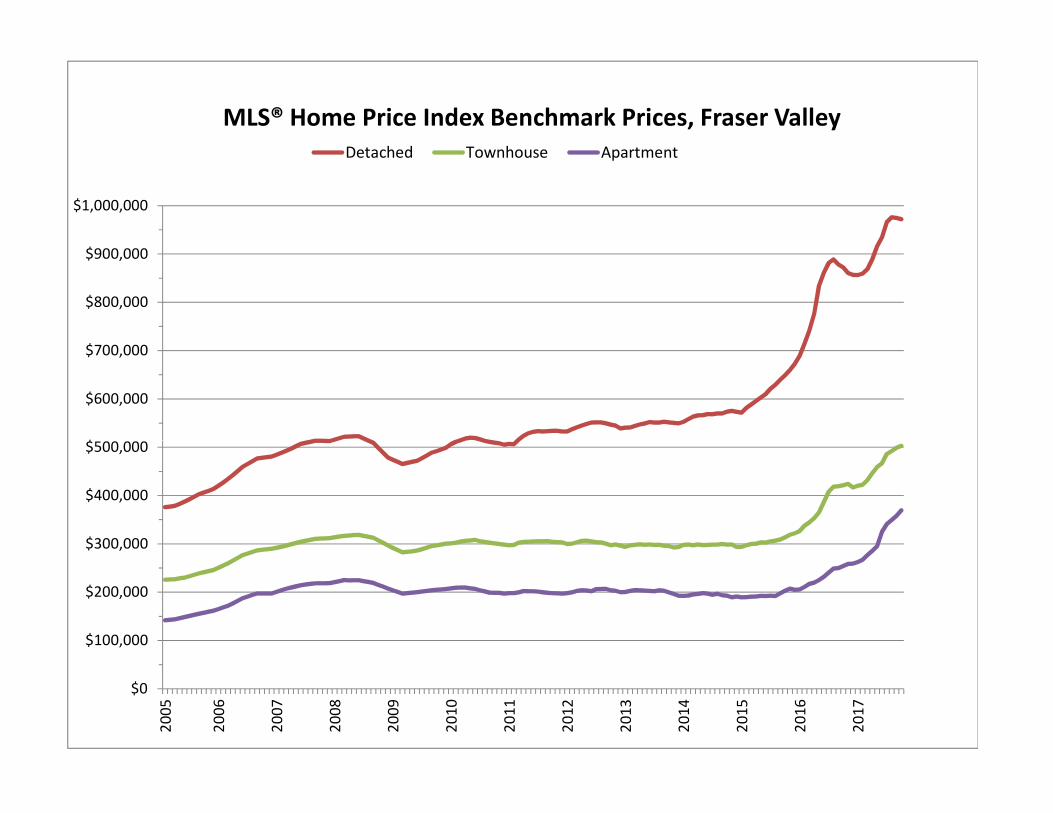
• Single Family Detached: At $971,900, the Benchmark price for a single family detached home in the Valley decreased 0.3 per cent compared to September 2017, and increased 11.8 per cent compared to October 2016.
• Townhomes: At $502,800 the Benchmark price for a townhome in the Fraser Valley increased 0.8 per cent compared to September 2017, and increased 18.4 per cent compared to October 2016.
• Apartments: At $369,400, the Benchmark price for apartments/condos in the Fraser Valley increased 3.1 per cent compared to September 2017, and increased 36.4 per cent compared to October 2016.
—30 —
The Fraser Valley Real Estate Board is an association of 3,514 real estate professionals who live and work in the BC communities of North Delta, Surrey, White Rock, Langley, Abbotsford, and Mission. The FVREB marked its 90-year anniversary in 2011.
Source: Fraser Valley Real Estate Board MLS Summary Page 1 of 3
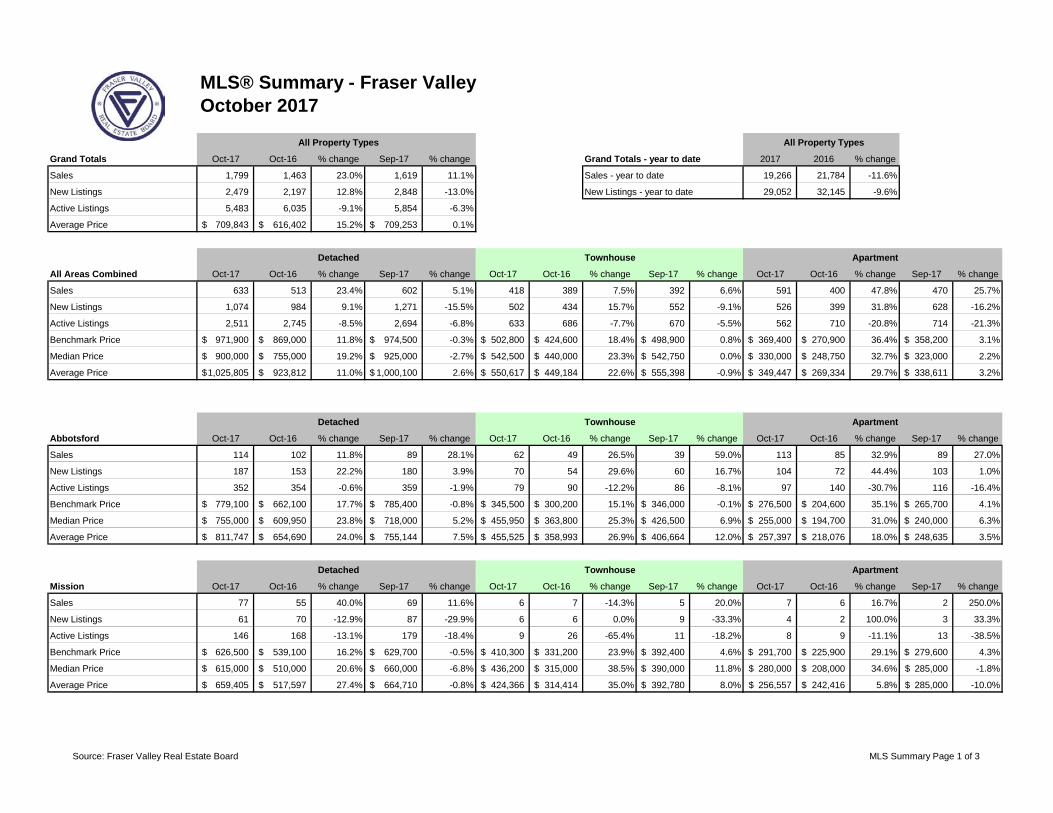
MLS® Summary - Fraser ValleyOctober 2017
All Property Types All Property Types
Grand Totals Oct-17 Oct-16 % change Sep-17 % change Grand Totals - year to date 2017 2016 % change
Sales 1,799 1,463 23.0% 1,619 11.1% Sales - year to date 19,266 21,784 -11.6%
New Listings 2,479 2,197 12.8% 2,848 -13.0% New Listings - year to date 29,052 32,145 -9.6%
Active Listings 5,483 6,035 -9.1% 5,854 -6.3%
Average Price 709,843$ 616,402$ 15.2% 709,253$ 0.1%
Detached Townhouse Apartment
All Areas Combined Oct-17 Oct-16 % change Sep-17 % change Oct-17 Oct-16 % change Sep-17 % change Oct-17 Oct-16 % change Sep-17 % change
Sales 633 513 23.4% 602 5.1% 418 389 7.5% 392 6.6% 591 400 47.8% 470 25.7%
New Listings 1,074 984 9.1% 1,271 -15.5% 502 434 15.7% 552 -9.1% 526 399 31.8% 628 -16.2%
Active Listings 2,511 2,745 -8.5% 2,694 -6.8% 633 686 -7.7% 670 -5.5% 562 710 -20.8% 714 -21.3%
Benchmark Price 971,900$ 869,000$ 11.8% 974,500$ -0.3% 502,800$ 424,600$ 18.4% 498,900$ 0.8% 369,400$ 270,900$ 36.4% 358,200$ 3.1%
Median Price 900,000$ 755,000$ 19.2% 925,000$ -2.7% 542,500$ 440,000$ 23.3% 542,750$ 0.0% 330,000$ 248,750$ 32.7% 323,000$ 2.2%
Average Price 1,025,805$ 923,812$ 11.0% 1,000,100$ 2.6% 550,617$ 449,184$ 22.6% 555,398$ -0.9% 349,447$ 269,334$ 29.7% 338,611$ 3.2%
Detached Townhouse Apartment
Abbotsford Oct-17 Oct-16 % change Sep-17 % change Oct-17 Oct-16 % change Sep-17 % change Oct-17 Oct-16 % change Sep-17 % change
Sales 114 102 11.8% 89 28.1% 62 49 26.5% 39 59.0% 113 85 32.9% 89 27.0%
New Listings 187 153 22.2% 180 3.9% 70 54 29.6% 60 16.7% 104 72 44.4% 103 1.0%
Active Listings 352 354 -0.6% 359 -1.9% 79 90 -12.2% 86 -8.1% 97 140 -30.7% 116 -16.4%
Benchmark Price 779,100$ 662,100$ 17.7% 785,400$ -0.8% 345,500$ 300,200$ 15.1% 346,000$ -0.1% 276,500$ 204,600$ 35.1% 265,700$ 4.1%
Median Price 755,000$ 609,950$ 23.8% 718,000$ 5.2% 455,950$ 363,800$ 25.3% 426,500$ 6.9% 255,000$ 194,700$ 31.0% 240,000$ 6.3%
Average Price 811,747$ 654,690$ 24.0% 755,144$ 7.5% 455,525$ 358,993$ 26.9% 406,664$ 12.0% 257,397$ 218,076$ 18.0% 248,635$ 3.5%
Detached Townhouse Apartment
Mission Oct-17 Oct-16 % change Sep-17 % change Oct-17 Oct-16 % change Sep-17 % change Oct-17 Oct-16 % change Sep-17 % change
Sales 77 55 40.0% 69 11.6% 6 7 -14.3% 5 20.0% 7 6 16.7% 2 250.0%
New Listings 61 70 -12.9% 87 -29.9% 6 6 0.0% 9 -33.3% 4 2 100.0% 3 33.3%
Active Listings 146 168 -13.1% 179 -18.4% 9 26 -65.4% 11 -18.2% 8 9 -11.1% 13 -38.5%
Benchmark Price 626,500$ 539,100$ 16.2% 629,700$ -0.5% 410,300$ 331,200$ 23.9% 392,400$ 4.6% 291,700$ 225,900$ 29.1% 279,600$ 4.3%
Median Price 615,000$ 510,000$ 20.6% 660,000$ -6.8% 436,200$ 315,000$ 38.5% 390,000$ 11.8% 280,000$ 208,000$ 34.6% 285,000$ -1.8%
Average Price 659,405$ 517,597$ 27.4% 664,710$ -0.8% 424,366$ 314,414$ 35.0% 392,780$ 8.0% 256,557$ 242,416$ 5.8% 285,000$ -10.0%
Source: Fraser Valley Real Estate Board MLS Summary Page 2 of 3
Detached Townhouse Apartment
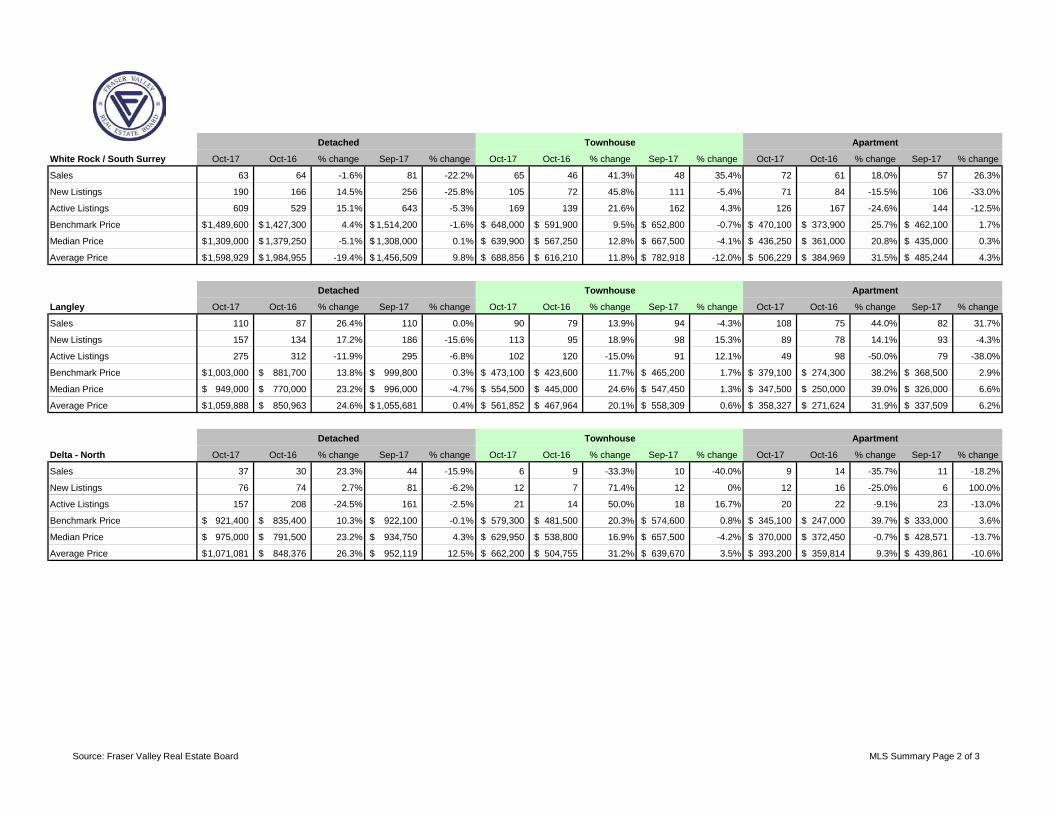
White Rock / South Surrey Oct-17 Oct-16 % change Sep-17 % change Oct-17 Oct-16 % change Sep-17 % change Oct-17 Oct-16 % change Sep-17 % change
Sales 63 64 -1.6% 81 -22.2% 65 46 41.3% 48 35.4% 72 61 18.0% 57 26.3%
New Listings 190 166 14.5% 256 -25.8% 105 72 45.8% 111 -5.4% 71 84 -15.5% 106 -33.0%
Active Listings 609 529 15.1% 643 -5.3% 169 139 21.6% 162 4.3% 126 167 -24.6% 144 -12.5%
Benchmark Price 1,489,600$ 1,427,300$ 4.4% 1,514,200$ -1.6% 648,000$ 591,900$ 9.5% 652,800$ -0.7% 470,100$ 373,900$ 25.7% 462,100$ 1.7%
Median Price 1,309,000$ 1,379,250$ -5.1% 1,308,000$ 0.1% 639,900$ 567,250$ 12.8% 667,500$ -4.1% 436,250$ 361,000$ 20.8% 435,000$ 0.3%
Average Price 1,598,929$ 1,984,955$ -19.4% 1,456,509$ 9.8% 688,856$ 616,210$ 11.8% 782,918$ -12.0% 506,229$ 384,969$ 31.5% 485,244$ 4.3%
Detached Townhouse Apartment
Langley Oct-17 Oct-16 % change Sep-17 % change Oct-17 Oct-16 % change Sep-17 % change Oct-17 Oct-16 % change Sep-17 % change
Sales 110 87 26.4% 110 0.0% 90 79 13.9% 94 -4.3% 108 75 44.0% 82 31.7%
New Listings 157 134 17.2% 186 -15.6% 113 95 18.9% 98 15.3% 89 78 14.1% 93 -4.3%
Active Listings 275 312 -11.9% 295 -6.8% 102 120 -15.0% 91 12.1% 49 98 -50.0% 79 -38.0%
Benchmark Price 1,003,000$ 881,700$ 13.8% 999,800$ 0.3% 473,100$ 423,600$ 11.7% 465,200$ 1.7% 379,100$ 274,300$ 38.2% 368,500$ 2.9%
Median Price 949,000$ 770,000$ 23.2% 996,000$ -4.7% 554,500$ 445,000$ 24.6% 547,450$ 1.3% 347,500$ 250,000$ 39.0% 326,000$ 6.6%
Average Price 1,059,888$ 850,963$ 24.6% 1,055,681$ 0.4% 561,852$ 467,964$ 20.1% 558,309$ 0.6% 358,327$ 271,624$ 31.9% 337,509$ 6.2%
Detached Townhouse Apartment
Delta - North Oct-17 Oct-16 % change Sep-17 % change Oct-17 Oct-16 % change Sep-17 % change Oct-17 Oct-16 % change Sep-17 % change
Sales 37 30 23.3% 44 -15.9% 6 9 -33.3% 10 -40.0% 9 14 -35.7% 11 -18.2%
New Listings 76 74 2.7% 81 -6.2% 12 7 71.4% 12 0% 12 16 -25.0% 6 100.0%
Active Listings 157 208 -24.5% 161 -2.5% 21 14 50.0% 18 16.7% 20 22 -9.1% 23 -13.0%
Benchmark Price 921,400$ 835,400$ 10.3% 922,100$ -0.1% 579,300$ 481,500$ 20.3% 574,600$ 0.8% 345,100$ 247,000$ 39.7% 333,000$ 3.6%
Median Price 975,000$ 791,500$ 23.2% 934,750$ 4.3% 629,950$ 538,800$ 16.9% 657,500$ -4.2% 370,000$ 372,450$ -0.7% 428,571$ -13.7%
Average Price 1,071,081$ 848,376$ 26.3% 952,119$ 12.5% 662,200$ 504,755$ 31.2% 639,670$ 3.5% 393,200$ 359,814$ 9.3% 439,861$ -10.6%
Source: Fraser Valley Real Estate Board MLS Summary Page 3 of 3
Detached Townhouse Apartment
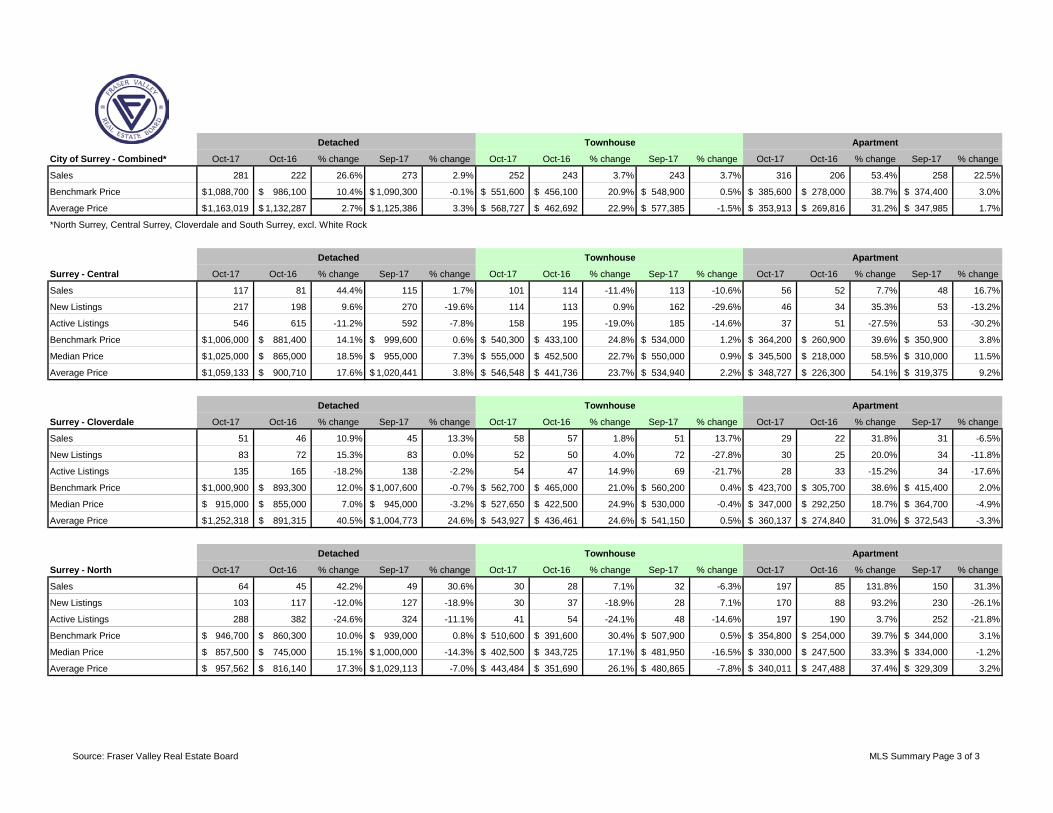
City of Surrey - Combined* Oct-17 Oct-16 % change Sep-17 % change Oct-17 Oct-16 % change Sep-17 % change Oct-17 Oct-16 % change Sep-17 % change
Sales 281 222 26.6% 273 2.9% 252 243 3.7% 243 3.7% 316 206 53.4% 258 22.5%
Benchmark Price 1,088,700$ 986,100$ 10.4% 1,090,300$ -0.1% 551,600$ 456,100$ 20.9% 548,900$ 0.5% 385,600$ 278,000$ 38.7% 374,400$ 3.0%
Average Price 1,163,019$ 1,132,287$ 2.7% 1,125,386$ 3.3% 568,727$ 462,692$ 22.9% 577,385$ -1.5% 353,913$ 269,816$ 31.2% 347,985$ 1.7%
*North Surrey, Central Surrey, Cloverdale and South Surrey, excl. White Rock
Detached Townhouse Apartment
Surrey - Central Oct-17 Oct-16 % change Sep-17 % change Oct-17 Oct-16 % change Sep-17 % change Oct-17 Oct-16 % change Sep-17 % change
Sales 117 81 44.4% 115 1.7% 101 114 -11.4% 113 -10.6% 56 52 7.7% 48 16.7%
New Listings 217 198 9.6% 270 -19.6% 114 113 0.9% 162 -29.6% 46 34 35.3% 53 -13.2%
Active Listings 546 615 -11.2% 592 -7.8% 158 195 -19.0% 185 -14.6% 37 51 -27.5% 53 -30.2%
Benchmark Price 1,006,000$ 881,400$ 14.1% 999,600$ 0.6% 540,300$ 433,100$ 24.8% 534,000$ 1.2% 364,200$ 260,900$ 39.6% 350,900$ 3.8%
Median Price 1,025,000$ 865,000$ 18.5% 955,000$ 7.3% 555,000$ 452,500$ 22.7% 550,000$ 0.9% 345,500$ 218,000$ 58.5% 310,000$ 11.5%
Average Price 1,059,133$ 900,710$ 17.6% 1,020,441$ 3.8% 546,548$ 441,736$ 23.7% 534,940$ 2.2% 348,727$ 226,300$ 54.1% 319,375$ 9.2%
Detached Townhouse Apartment
Surrey - Cloverdale Oct-17 Oct-16 % change Sep-17 % change Oct-17 Oct-16 % change Sep-17 % change Oct-17 Oct-16 % change Sep-17 % change
Sales 51 46 10.9% 45 13.3% 58 57 1.8% 51 13.7% 29 22 31.8% 31 -6.5%
New Listings 83 72 15.3% 83 0.0% 52 50 4.0% 72 -27.8% 30 25 20.0% 34 -11.8%
Active Listings 135 165 -18.2% 138 -2.2% 54 47 14.9% 69 -21.7% 28 33 -15.2% 34 -17.6%
Benchmark Price 1,000,900$ 893,300$ 12.0% 1,007,600$ -0.7% 562,700$ 465,000$ 21.0% 560,200$ 0.4% 423,700$ 305,700$ 38.6% 415,400$ 2.0%
Median Price 915,000$ 855,000$ 7.0% 945,000$ -3.2% 527,650$ 422,500$ 24.9% 530,000$ -0.4% 347,000$ 292,250$ 18.7% 364,700$ -4.9%
Average Price 1,252,318$ 891,315$ 40.5% 1,004,773$ 24.6% 543,927$ 436,461$ 24.6% 541,150$ 0.5% 360,137$ 274,840$ 31.0% 372,543$ -3.3%
Detached Townhouse Apartment
Surrey - North Oct-17 Oct-16 % change Sep-17 % change Oct-17 Oct-16 % change Sep-17 % change Oct-17 Oct-16 % change Sep-17 % change
Sales 64 45 42.2% 49 30.6% 30 28 7.1% 32 -6.3% 197 85 131.8% 150 31.3%
New Listings 103 117 -12.0% 127 -18.9% 30 37 -18.9% 28 7.1% 170 88 93.2% 230 -26.1%
Active Listings 288 382 -24.6% 324 -11.1% 41 54 -24.1% 48 -14.6% 197 190 3.7% 252 -21.8%
Benchmark Price 946,700$ 860,300$ 10.0% 939,000$ 0.8% 510,600$ 391,600$ 30.4% 507,900$ 0.5% 354,800$ 254,000$ 39.7% 344,000$ 3.1%
Median Price 857,500$ 745,000$ 15.1% 1,000,000$ -14.3% 402,500$ 343,725$ 17.1% 481,950$ -16.5% 330,000$ 247,500$ 33.3% 334,000$ -1.2%
Average Price 957,562$ 816,140$ 17.3% 1,029,113$ -7.0% 443,484$ 351,690$ 26.1% 480,865$ -7.8% 340,011$ 247,488$ 37.4% 329,309$ 3.2%
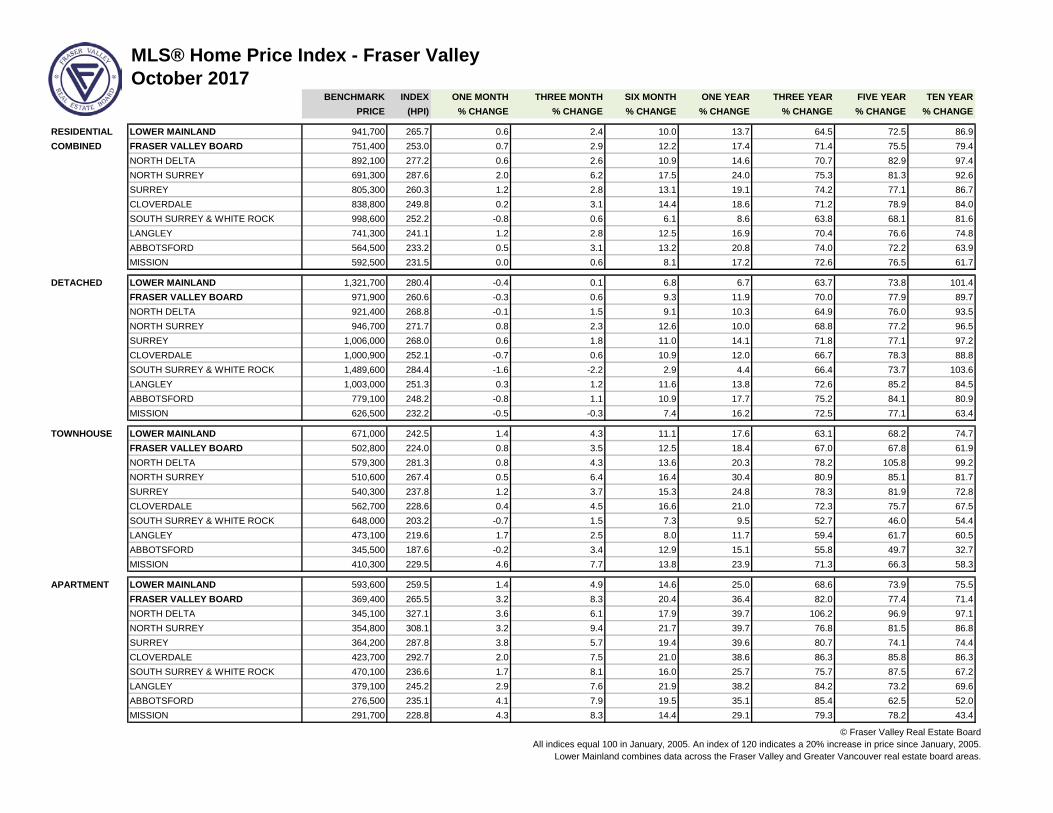
© Fraser Valley Real Estate BoardAll indices equal 100 in January, 2005. An index of 120 indicates a 20% increase in price since January, 2005.
Lower Mainland combines data across the Fraser Valley and Greater Vancouver real estate board areas.
MLS® Home Price Index - Fraser ValleyOctober 2017
BENCHMARK INDEX ONE MONTH THREE MONTH SIX MONTH ONE YEAR THREE YEAR FIVE YEAR TEN YEARPRICE (HPI) % CHANGE % CHANGE % CHANGE % CHANGE % CHANGE % CHANGE % CHANGE
RESIDENTIAL LOWER MAINLAND 941,700 265.7 0.6 2.4 10.0 13.7 64.5 72.5 86.9COMBINED FRASER VALLEY BOARD 751,400 253.0 0.7 2.9 12.2 17.4 71.4 75.5 79.4
NORTH DELTA 892,100 277.2 0.6 2.6 10.9 14.6 70.7 82.9 97.4NORTH SURREY 691,300 287.6 2.0 6.2 17.5 24.0 75.3 81.3 92.6SURREY 805,300 260.3 1.2 2.8 13.1 19.1 74.2 77.1 86.7CLOVERDALE 838,800 249.8 0.2 3.1 14.4 18.6 71.2 78.9 84.0SOUTH SURREY & WHITE ROCK 998,600 252.2 -0.8 0.6 6.1 8.6 63.8 68.1 81.6LANGLEY 741,300 241.1 1.2 2.8 12.5 16.9 70.4 76.6 74.8ABBOTSFORD 564,500 233.2 0.5 3.1 13.2 20.8 74.0 72.2 63.9MISSION 592,500 231.5 0.0 0.6 8.1 17.2 72.6 76.5 61.7
DETACHED LOWER MAINLAND 1,321,700 280.4 -0.4 0.1 6.8 6.7 63.7 73.8 101.4FRASER VALLEY BOARD 971,900 260.6 -0.3 0.6 9.3 11.9 70.0 77.9 89.7NORTH DELTA 921,400 268.8 -0.1 1.5 9.1 10.3 64.9 76.0 93.5NORTH SURREY 946,700 271.7 0.8 2.3 12.6 10.0 68.8 77.2 96.5SURREY 1,006,000 268.0 0.6 1.8 11.0 14.1 71.8 77.1 97.2CLOVERDALE 1,000,900 252.1 -0.7 0.6 10.9 12.0 66.7 78.3 88.8SOUTH SURREY & WHITE ROCK 1,489,600 284.4 -1.6 -2.2 2.9 4.4 66.4 73.7 103.6LANGLEY 1,003,000 251.3 0.3 1.2 11.6 13.8 72.6 85.2 84.5ABBOTSFORD 779,100 248.2 -0.8 1.1 10.9 17.7 75.2 84.1 80.9MISSION 626,500 232.2 -0.5 -0.3 7.4 16.2 72.5 77.1 63.4
TOWNHOUSE LOWER MAINLAND 671,000 242.5 1.4 4.3 11.1 17.6 63.1 68.2 74.7FRASER VALLEY BOARD 502,800 224.0 0.8 3.5 12.5 18.4 67.0 67.8 61.9NORTH DELTA 579,300 281.3 0.8 4.3 13.6 20.3 78.2 105.8 99.2NORTH SURREY 510,600 267.4 0.5 6.4 16.4 30.4 80.9 85.1 81.7SURREY 540,300 237.8 1.2 3.7 15.3 24.8 78.3 81.9 72.8CLOVERDALE 562,700 228.6 0.4 4.5 16.6 21.0 72.3 75.7 67.5SOUTH SURREY & WHITE ROCK 648,000 203.2 -0.7 1.5 7.3 9.5 52.7 46.0 54.4LANGLEY 473,100 219.6 1.7 2.5 8.0 11.7 59.4 61.7 60.5ABBOTSFORD 345,500 187.6 -0.2 3.4 12.9 15.1 55.8 49.7 32.7MISSION 410,300 229.5 4.6 7.7 13.8 23.9 71.3 66.3 58.3
APARTMENT LOWER MAINLAND 593,600 259.5 1.4 4.9 14.6 25.0 68.6 73.9 75.5FRASER VALLEY BOARD 369,400 265.5 3.2 8.3 20.4 36.4 82.0 77.4 71.4NORTH DELTA 345,100 327.1 3.6 6.1 17.9 39.7 106.2 96.9 97.1NORTH SURREY 354,800 308.1 3.2 9.4 21.7 39.7 76.8 81.5 86.8SURREY 364,200 287.8 3.8 5.7 19.4 39.6 80.7 74.1 74.4CLOVERDALE 423,700 292.7 2.0 7.5 21.0 38.6 86.3 85.8 86.3SOUTH SURREY & WHITE ROCK 470,100 236.6 1.7 8.1 16.0 25.7 75.7 87.5 67.2LANGLEY 379,100 245.2 2.9 7.6 21.9 38.2 84.2 73.2 69.6ABBOTSFORD 276,500 235.1 4.1 7.9 19.5 35.1 85.4 62.5 52.0MISSION 291,700 228.8 4.3 8.3 14.4 29.1 79.3 78.2 43.4
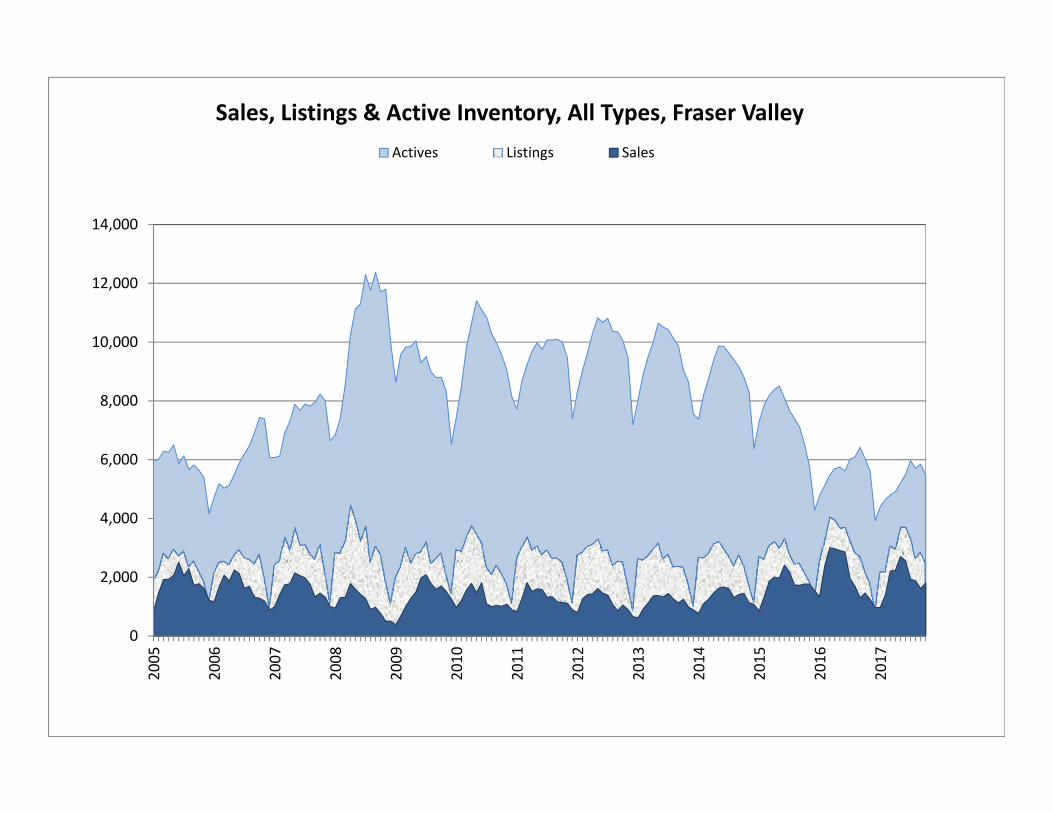
Sales, Listings & Active Inventory, All Types, Fraser ValleyActives Listings Sales
14,000
10,000
12,000
8,000
4,000
6,000
0
2,000
2005
2006
2007
2008
2009
2010
2011
2012
2013
2014
2015
2016
2017
30
40
50
60
Ratio
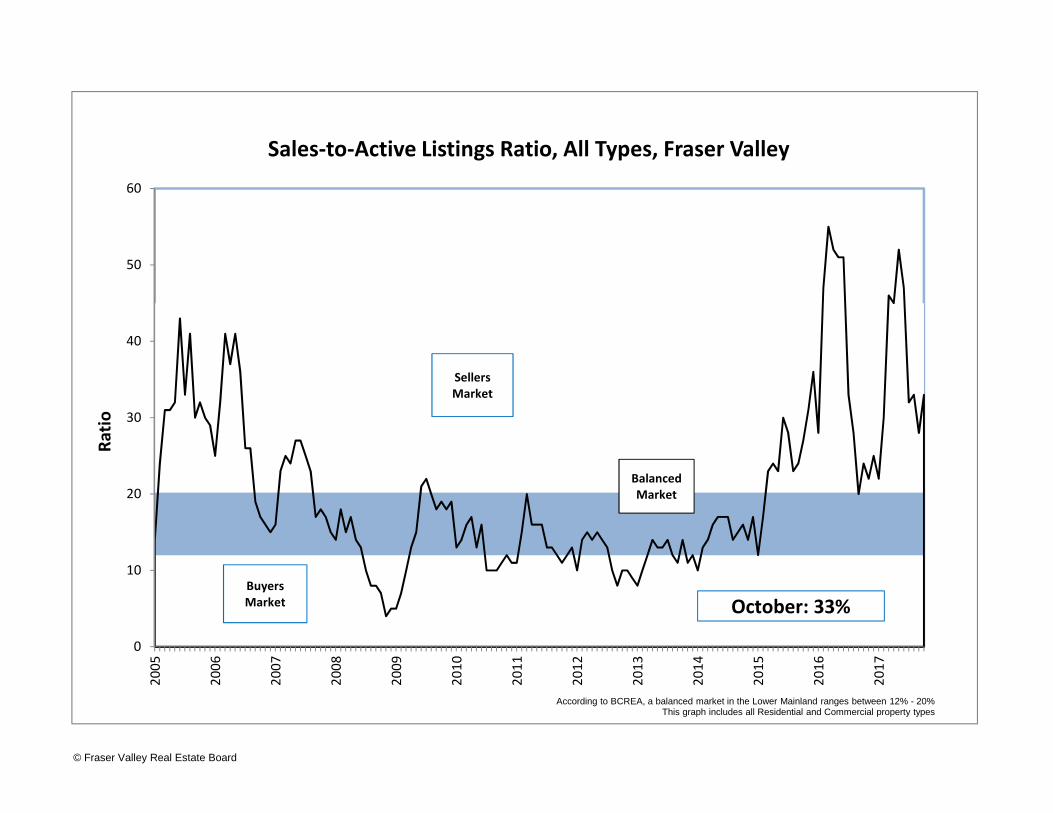
Sales‐to‐Active Listings Ratio, All Types, Fraser Valley
Sellers Market
0
10
20
2005
2006
2007
2008
2009
2010
2011
2012
2013
2014
2015
2016
2017
According to BCREA, a balanced market in the Lower Mainland ranges between 12% - 20%This graph includes all Residential and Commercial property types
Balanced Market
Buyers Market October: 33%
© Fraser Valley Real Estate Board
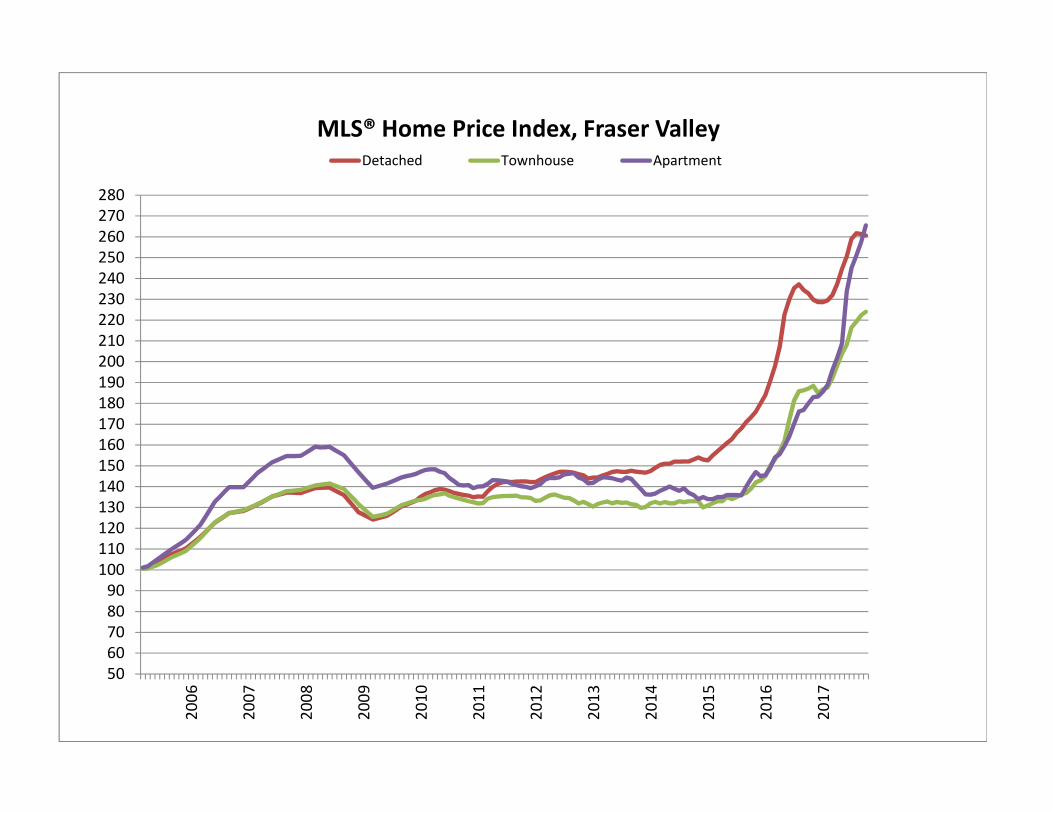
160170180190200210220230240250260270280
MLS® Home Price Index, Fraser ValleyDetached Townhouse Apartment
5060708090
100110120130140150
2006
2007
2008
2009
2010
2011
2012
2013
2014
2015
2016
2017
$
$600,000
$700,000
$800,000
$900,000
$1,000,000
MLS® Home Price Index Benchmark Prices, Fraser ValleyDetached Townhouse Apartment
$0
$100,000
$200,000
$300,000
$400,000
$500,000
2005
2006
2007
2008
2009
2010
2011
2012
2013
2014
2015
2016
2017
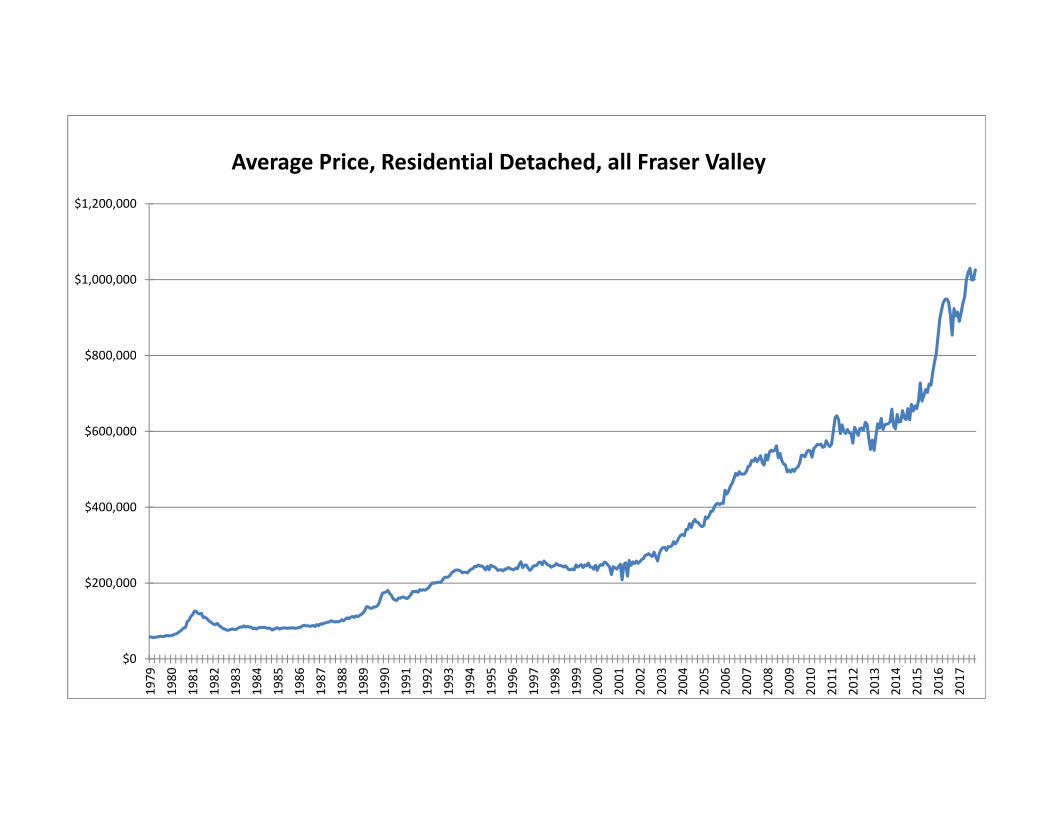
Average Price, Residential Detached, all Fraser Valley
$1,200,000
Average Price, Residential Detached, all Fraser Valley
$800 000
$1,000,000
$600,000
$800,000
$400,000
$200,000
$0
1979
1980
1981
1982
1983
1984
1985
1986
1987
1988
1989
1990
1991
1992
1993
1994
1995
1996
1997
1998
1999
2000
2001
2002
2003
2004
2005
2006
2007
2008
2009
2010
2011
2012
2013
2014
2015
2016
2017
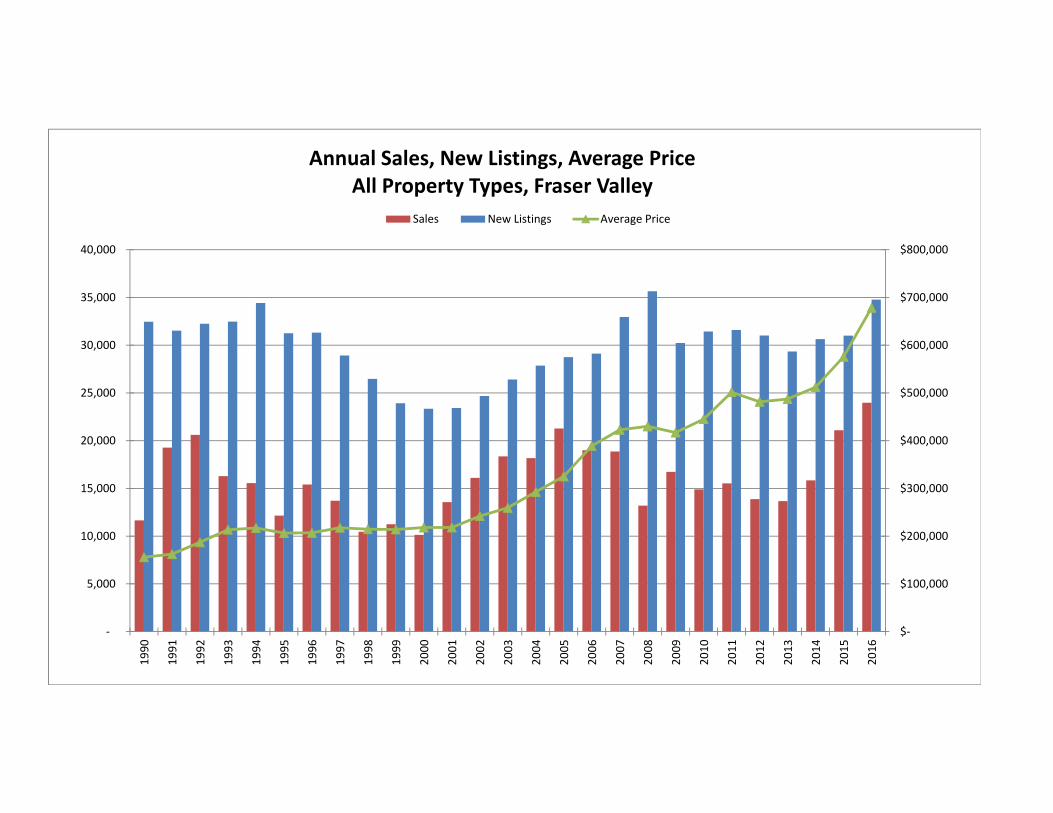
Annual Sales, New Listings, Average Price All Property Types, Fraser Valley
$800,000 40,000
All Property Types, Fraser ValleySales New Listings Average Price
$600,000
$700,000
30,000
35,000
$400,000
$500,000
20,000
25,000
$200,000
$300,000
10,000
15,000
$‐
$100,000
‐
5,000
1990
1991
1992
1993
1994
1995
1996
1997
1998
1999
2000
2001
2002
2003
2004
2005
2006
2007
2008
2009
2010
2011
2012
2013
2014
2015
2016