nippon commercial investment corporation · nippon commercial investment corporation pacific...
TRANSCRIPT
Nippon Commercial Investment Corporation
Nippon Commercial Investment Corporation
Pacific Commercial Investment Corporation
NIPPON COMMERCIAL INVESTMENT CORPORATION(Listed on the Tokyo Stock Exchange under securities code 3229)
October, 2007
1(This is a free translation edition. The original edition is written in Japanese.)Nippon Commercial Investment Corporation Pacific Commercial Investment Corporation
Table of ContentsTable of Contents
Table of Contents ・・・・・・・・・・・・・・・・・・・・・・・・・・・・・・・・・・・・1
Investment Highlight・・・・・・・・・・・・・・・・・・・・・・・・・・・・・・・・・・2
Growth Strategy・・・・・・・・・・・・・・・・・・・・・・・・・・・ 5
Financial Strategy ・・・・・・・・・・・・・・・・・・・・・・・・22
・・・・・・・・・・・・・・・・・・・・・・・・・・・・・・・・・・・・・・・・・・ 25
Disclaimer ・・・・・・・・・・・・・・・・・・・・・・・・・・・・・・・・・・・・・・・・・・ 36
Section 1
Section 2
Appendix
2(This is a free translation edition. The original edition is written in Japanese.)Nippon Commercial Investment Corporation Pacific Commercial Investment Corporation
Investment HighlightInvestment Highlight
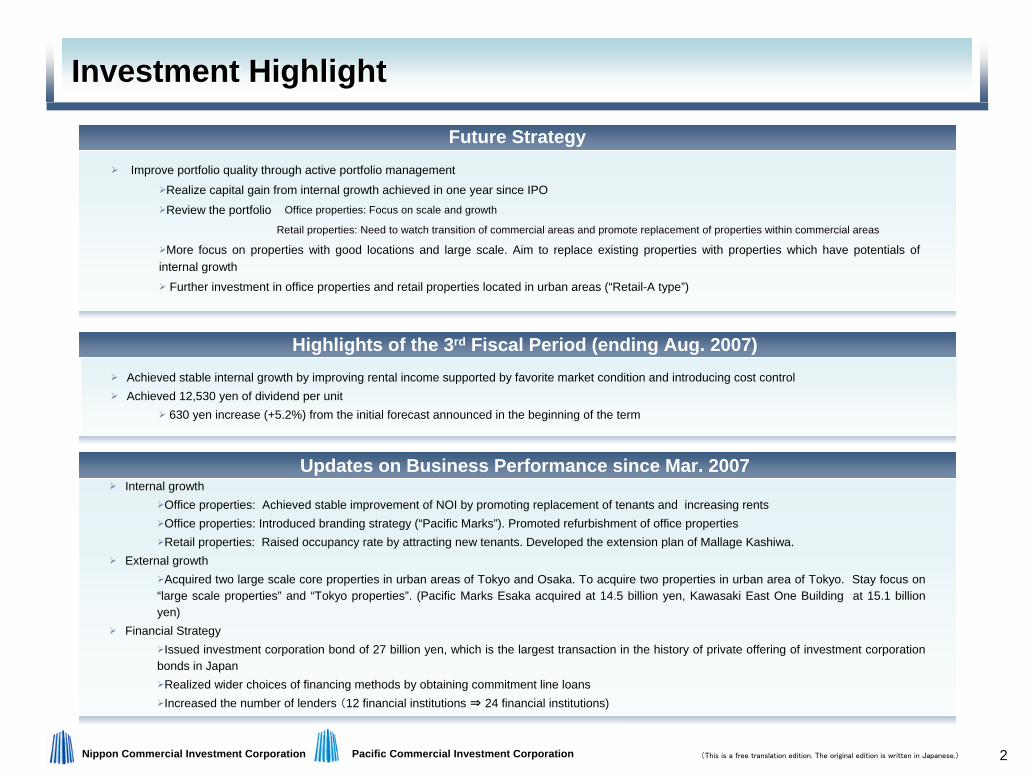
Achieved stable internal growth by improving rental income supported by favorite market condition and introducing cost controlAchieved 12,530 yen of dividend per unit
630 yen increase (+5.2%) from the initial forecast announced in the beginning of the term
Highlights of the 3rd Fiscal Period (ending Aug. 2007)
Internal growthOffice properties: Achieved stable improvement of NOI by promoting replacement of tenants and increasing rentsOffice properties: Introduced branding strategy (“Pacific Marks”). Promoted refurbishment of office propertiesRetail properties: Raised occupancy rate by attracting new tenants. Developed the extension plan of Mallage Kashiwa.
External growthAcquired two large scale core properties in urban areas of Tokyo and Osaka. To acquire two properties in urban area of Tokyo. Stay focus on
“large scale properties” and “Tokyo properties”. (Pacific Marks Esaka acquired at 14.5 billion yen, Kawasaki East One Building at 15.1 billion yen)
Financial StrategyIssued investment corporation bond of 27 billion yen, which is the largest transaction in the history of private offering of investment corporation
bonds in JapanRealized wider choices of financing methods by obtaining commitment line loansIncreased the number of lenders (12 financial institutions ⇒ 24 financial institutions)
Updates on Business Performance since Mar. 2007
Improve portfolio quality through active portfolio management
Realize capital gain from internal growth achieved in one year since IPO
Review the portfolio Office properties: Focus on scale and growth
Retail properties: Need to watch transition of commercial areas and promote replacement of properties within commercial areas
More focus on properties with good locations and large scale. Aim to replace existing properties with properties which have potentials of internal growth
Further investment in office properties and retail properties located in urban areas (“Retail-A type”)
Future Strategy
3(This is a free translation edition. The original edition is written in Japanese.)Nippon Commercial Investment Corporation Pacific Commercial Investment Corporation
Market Recognition and Future StrategyMarket Recognition and Future Strategy
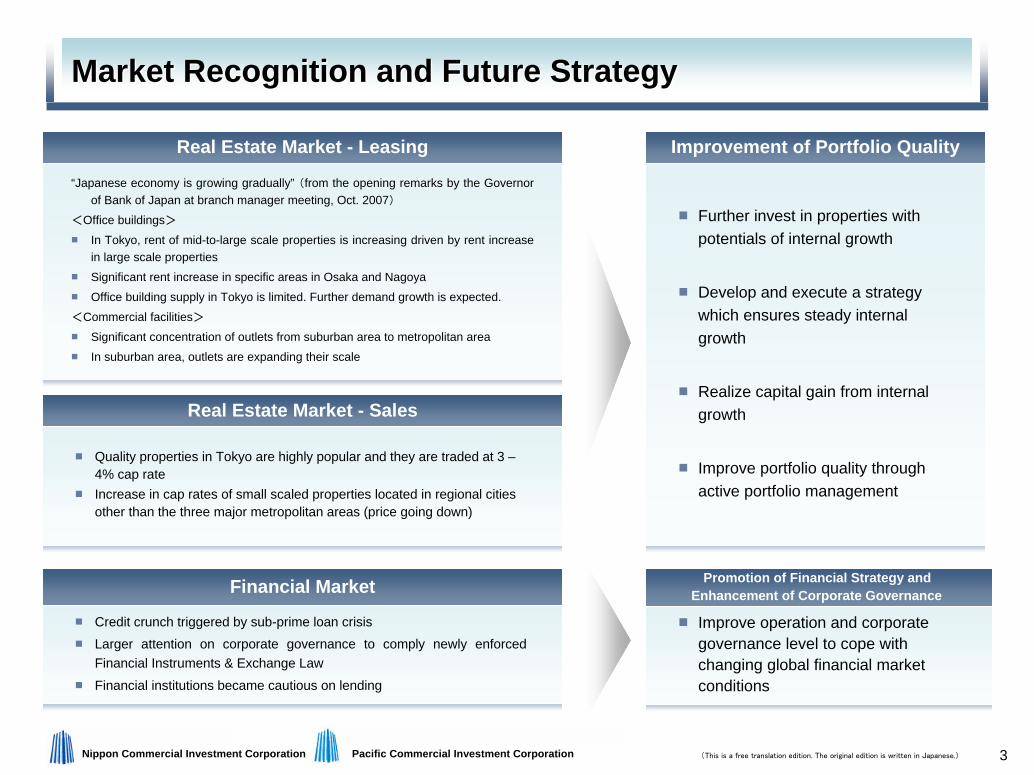
“Japanese economy is growing gradually” (from the opening remarks by the Governor of Bank of Japan at branch manager meeting, Oct. 2007)
<Office buildings>
In Tokyo, rent of mid-to-large scale properties is increasing driven by rent increase in large scale properties
Significant rent increase in specific areas in Osaka and Nagoya
Office building supply in Tokyo is limited. Further demand growth is expected.
<Commercial facilities>
Significant concentration of outlets from suburban area to metropolitan area
In suburban area, outlets are expanding their scale
Real Estate Market - Leasing
Credit crunch triggered by sub-prime loan crisisLarger attention on corporate governance to comply newly enforced Financial Instruments & Exchange Law
Financial institutions became cautious on lending
Financial Market
Quality properties in Tokyo are highly popular and they are traded at 3 –4% cap rateIncrease in cap rates of small scaled properties located in regional cities other than the three major metropolitan areas (price going down)
Real Estate Market - Sales
Improve operation and corporate governance level to cope with changing global financial market conditions
Promotion of Financial Strategy and Enhancement of Corporate Governance
Further invest in properties with potentials of internal growth
Develop and execute a strategy which ensures steady internal growth
Realize capital gain from internal growth
Improve portfolio quality through active portfolio management
Improvement of Portfolio Quality
4(This is a free translation edition. The original edition is written in Japanese.)Nippon Commercial Investment Corporation Pacific Commercial Investment Corporation
DispositionRealization of
capital gain
Internal growth results in improved asset value
Improved portfolio quality by replacement of properties
Achieve further external growth
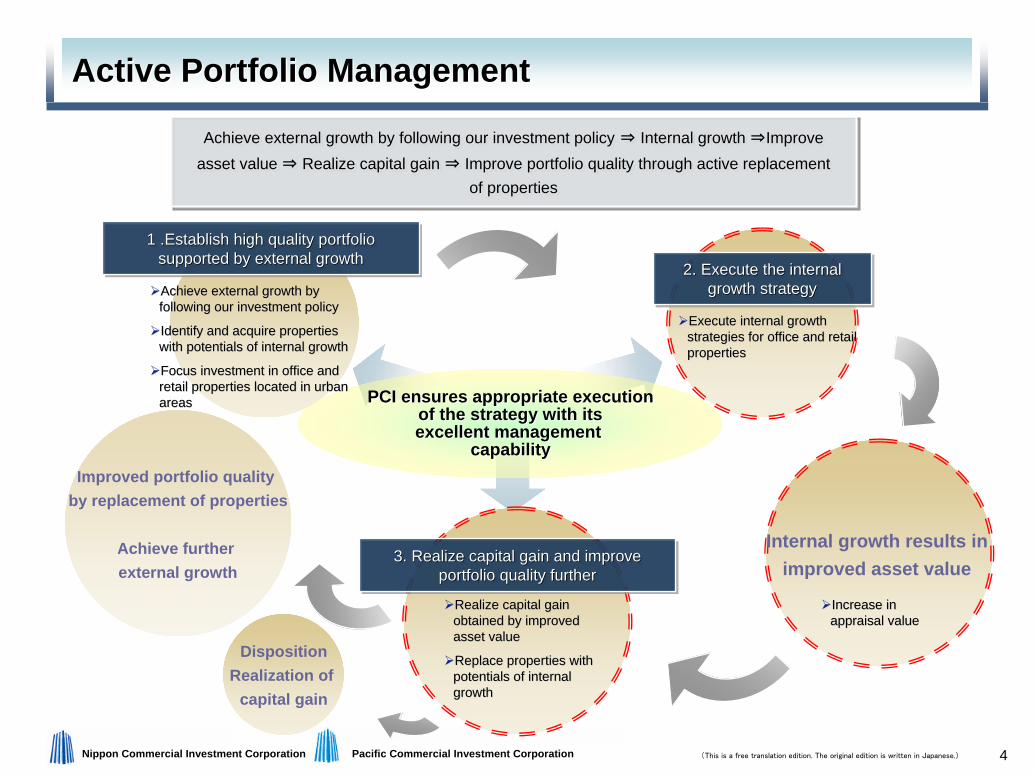
Active Portfolio ManagementActive Portfolio Management
PCI ensures appropriate executionPCI ensures appropriate executionof the strategy with itsof the strategy with itsexcellent management excellent management
capabilitycapability
Achieve external growth by Achieve external growth by following our investment policyfollowing our investment policy
Identify and acquire properties Identify and acquire properties with potentials of internal growth with potentials of internal growth
Focus investment in office and Focus investment in office and retail properties located in urban retail properties located in urban areasareas
Achieve external growth by following our investment policy ⇒ Internal growth ⇒Improve asset value ⇒ Realize capital gain ⇒ Improve portfolio quality through active replacement
of properties
Achieve external growth by following our investment policy ⇒ Internal growth ⇒Improve asset value ⇒ Realize capital gain ⇒ Improve portfolio quality through active replacement
of properties
Execute internal growth Execute internal growth strategies for office and retail strategies for office and retail propertiesproperties
Realize capital gain Realize capital gain obtained by improved obtained by improved asset valueasset value
Replace properties with Replace properties with potentials of internal potentials of internal growthgrowth
1 .Establish high quality portfolio supported by external growth
11 ..Establish high quality portfolio Establish high quality portfolio supported by external growthsupported by external growth
2. Execute the internal growth strategy
2.2. Execute the internal Execute the internal growth strategygrowth strategy
3. Realize capital gain and improve portfolio quality further
3.3. Realize capital gain and improve Realize capital gain and improve portfolio quality furtherportfolio quality further
Increase in Increase in appraisal valueappraisal value
Section 1Growth Strategy
6(This is a free translation edition. The original edition is written in Japanese.)Nippon Commercial Investment Corporation Pacific Commercial Investment Corporation
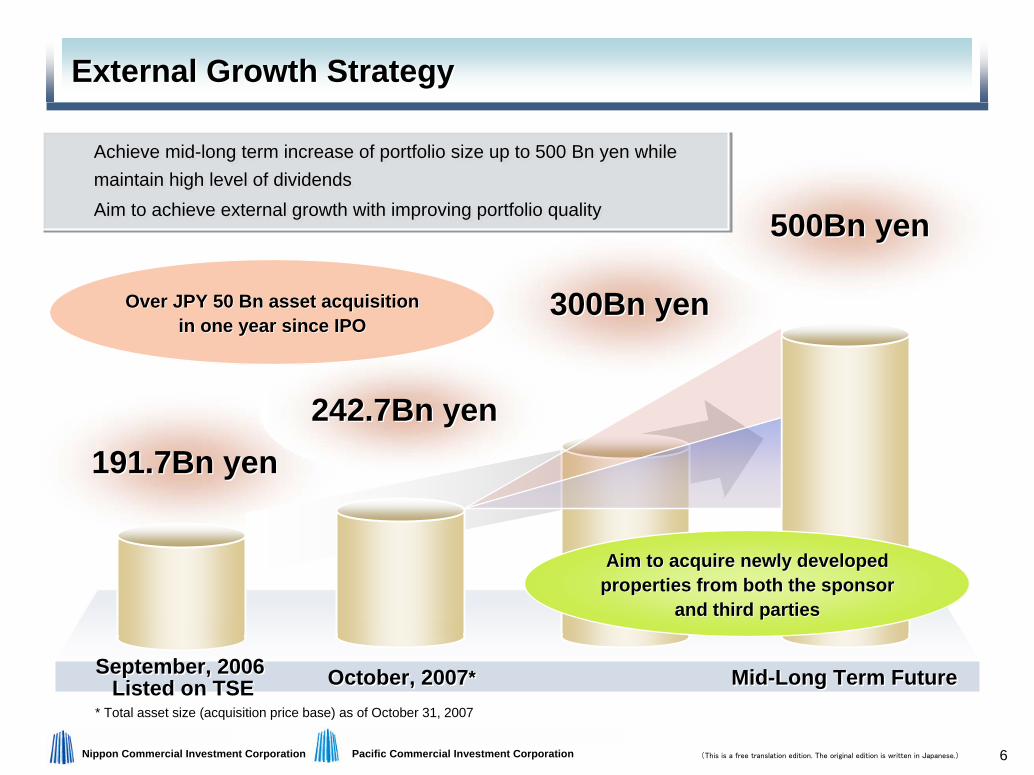
191191..77Bn yenBn yen
300Bn yen300Bn yen
500Bn yen500Bn yen
External Growth StrategyExternal Growth Strategy
Achieve mid-long term increase of portfolio size up to 500 Bn yen while maintain high level of dividendsAim to achieve external growth with improving portfolio quality
Achieve mid-long term increase of portfolio size up to 500 Bn yen while maintain high level of dividendsAim to achieve external growth with improving portfolio quality
October, 2007*October, 2007* Mid-Long Term FutureMid-Long Term Future
224242..77Bn yenBn yen
September, 2006 Listed on TSE
September, 2006 Listed on TSE
* Total asset size (acquisition price base) as of October 31, 2007* Total asset size (acquisition price base) as of October 31, 2007
Aim to acquire newly developed Aim to acquire newly developed properties from both the sponsor properties from both the sponsor
and third partiesand third parties
Over JPY 50 Bn asset acquisition Over JPY 50 Bn asset acquisition in one year since IPOin one year since IPO
7(This is a free translation edition. The original edition is written in Japanese.)Nippon Commercial Investment Corporation Pacific Commercial Investment Corporation
PMC私募ファンド運用残高
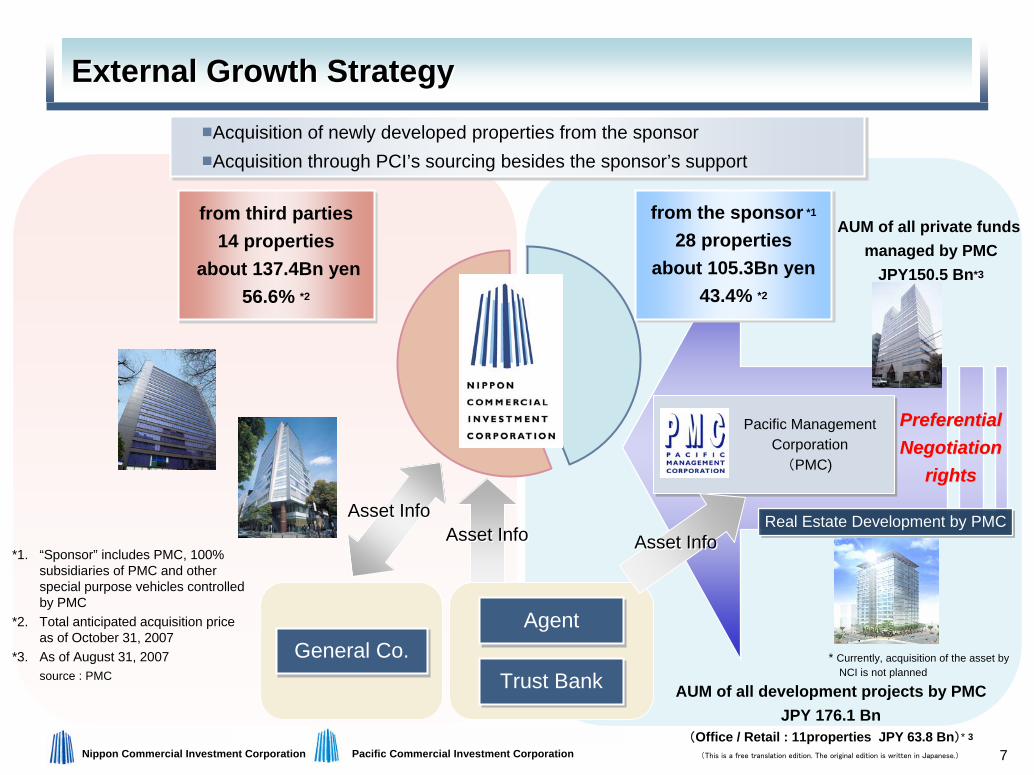
External Growth StrategyExternal Growth Strategy
Acquisition of newly developed properties from the sponsorAcquisition through PCI’s sourcing besides the sponsor’s support
Acquisition of newly developed properties from the sponsorAcquisition through PCI’s sourcing besides the sponsor’s support
Pacific Management Corporation
(PMC)
PreferentialPreferentialNegotiationNegotiation
rightsrights
Asset InfoAsset InfoAsset InfoAsset Info Asset InfoAsset Info
General Co.General Co.AgentAgent
Trust BankTrust Bank
*1. “Sponsor” includes PMC, 100% subsidiaries of PMC and other special purpose vehicles controlled by PMC
*2. Total anticipated acquisition price as of October 31, 2007
*3. As of August 31, 2007source : PMC
from third parties14 properties
about 137.4Bn yen56.6% *2
from third parties14 properties
about 137.4Bn yen56.6% *2
from the sponsor *1
28 propertiesabout 105.3Bn yen
43.4% *2
from the sponsor *1
28 propertiesabout 105.3Bn yen
43.4% *2
Real Estate Development by PMCReal Estate Development by PMC
* Currently, acquisition of the asset by NCI is not planned
AUM of all private funds managed by PMC
JPY150.5 Bn*3
AUM of all development projects by PMCJPY 176.1 Bn
(Office / Retail : 11properties JPY 63.8 Bn)* 3
8(This is a free translation edition. The original edition is written in Japanese.)Nippon Commercial Investment Corporation Pacific Commercial Investment Corporation
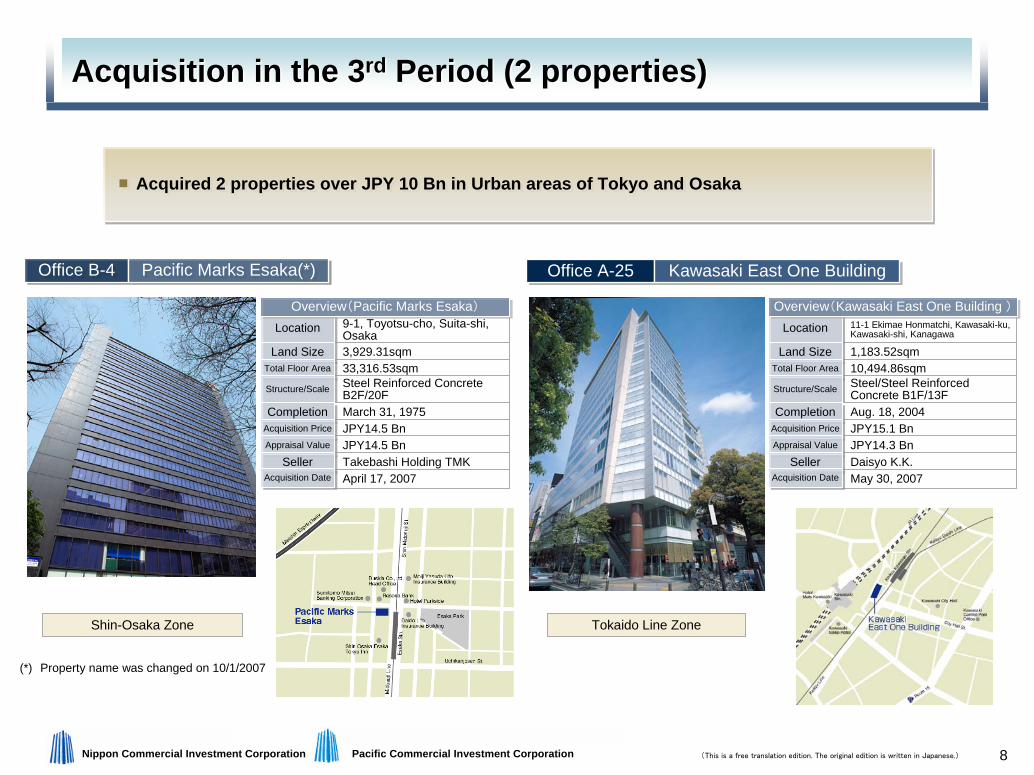
Acquisition in the 3rd Period (2 properties)Acquisition in the 3rd Period (2 properties)
Acquired 2 properties over JPY 10 Bn in Urban areas of Tokyo and OsakaAcquired 2 properties over JPY 10 Bn in Urban areas of Tokyo and Osaka
Shin-Osaka Zone Tokaido Line Zone
(注)
9-1, Toyotsu-cho, Suita-shi,Osaka 3,929.31sqm33,316.53sqmSteel Reinforced ConcreteB2F/20F
LocationLocation
Land SizeLand SizeTotal Floor AreaTotal Floor Area
Structure/ScaleStructure/Scale
March 31, 1975 JPY14.5 BnJPY14.5 BnTakebashi Holding TMKApril 17, 2007
CompletionCompletionAcquisition PriceAcquisition Price
Appraisal ValueAppraisal Value
SellerSellerAcquisition DateAcquisition Date
Overview(Pacific Marks Esaka)Overview(Pacific Marks Esaka)
(*) Property name was changed on 10/1/2007
Office B-4Office B-4 Pacific Marks Esaka(*)Pacific Marks Esaka(*) Office A-25Office A-25 Kawasaki East One BuildingKawasaki East One Building
11-1 Ekimae Honmatchi, Kawasaki-ku, Kawasaki-shi, Kanagawa
1,183.52sqm10,494.86sqmSteel/Steel Reinforced Concrete B1F/13F
LocationLocation
Land SizeLand SizeTotal Floor AreaTotal Floor Area
Structure/ScaleStructure/Scale
Aug. 18, 2004 JPY15.1 BnJPY14.3 BnDaisyo K.K.May 30, 2007
CompletionCompletionAcquisition PriceAcquisition Price
Appraisal ValueAppraisal Value
SellerSellerAcquisition DateAcquisition Date
Overview(Kawasaki East One Building )Overview(Kawasaki East One Building )
9(This is a free translation edition. The original edition is written in Japanese.)Nippon Commercial Investment Corporation Pacific Commercial Investment Corporation
LocationLocation
ZoneZone
Land SizeLand Size
Total Floor AreaTotal Floor Area
Structure/ScaleStructure/Scale
CompletionCompletion
Acquisition PriceAcquisition Price
Appraisal ValueAppraisal Value
SellerSeller
Acquisition DateAcquisition Date
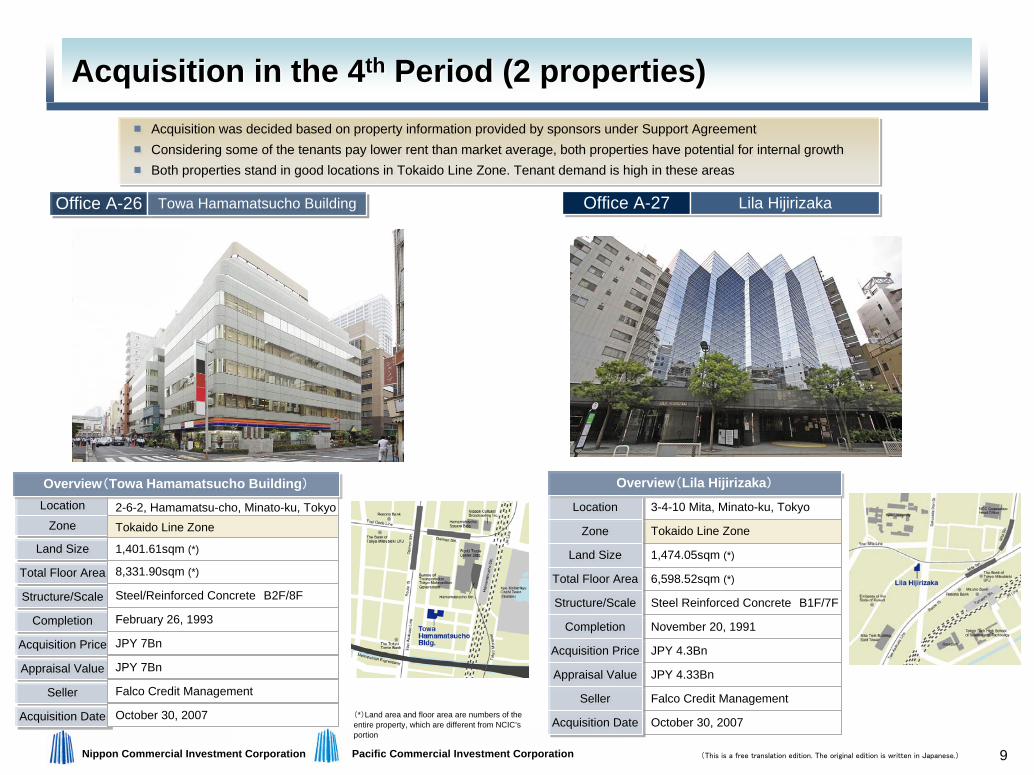
Acquisition in the 4th Period (2 properties)Acquisition in the 4th Period (2 properties)
(*)Land area and floor area are numbers of the entire property, which are different from NCIC’sportion
3-4-10 Mita, Minato-ku, Tokyo
Tokaido Line Zone
1,474.05sqm (*)
6,598.52sqm (*)
Steel Reinforced Concrete B1F/7F
November 20, 1991
JPY 4.3Bn
JPY 4.33Bn
Falco Credit Management
October 30, 2007
LocationLocation
ZoneZone
Land SizeLand Size
Total Floor AreaTotal Floor Area
Structure/ScaleStructure/Scale
CompletionCompletion
Acquisition PriceAcquisition Price
Appraisal ValueAppraisal Value
SellerSeller
Acquisition DateAcquisition Date
Overview(Lila Hijirizaka)Overview(Lila Hijirizaka)
2-6-2, Hamamatsu-cho, Minato-ku, TokyoTokaido Line Zone
1,401.61sqm (*)
8,331.90sqm (*)
Steel/Reinforced Concrete B2F/8F
February 26, 1993
JPY 7Bn
JPY 7Bn
Falco Credit Management
October 30, 2007
Overview(Towa Hamamatsucho Building)Overview(Towa Hamamatsucho Building)
Office A-27Office A-27 Lila HijirizakaLila HijirizakaOffice A-26Office A-26 Towa Hamamatsucho BuildingTowa Hamamatsucho Building
Acquisition was decided based on property information provided by sponsors under Support AgreementConsidering some of the tenants pay lower rent than market average, both properties have potential for internal growthBoth properties stand in good locations in Tokaido Line Zone. Tenant demand is high in these areas
Acquisition was decided based on property information provided by sponsors under Support AgreementConsidering some of the tenants pay lower rent than market average, both properties have potential for internal growthBoth properties stand in good locations in Tokaido Line Zone. Tenant demand is high in these areas
10(This is a free translation edition. The original edition is written in Japanese.)Nippon Commercial Investment Corporation Pacific Commercial Investment Corporation
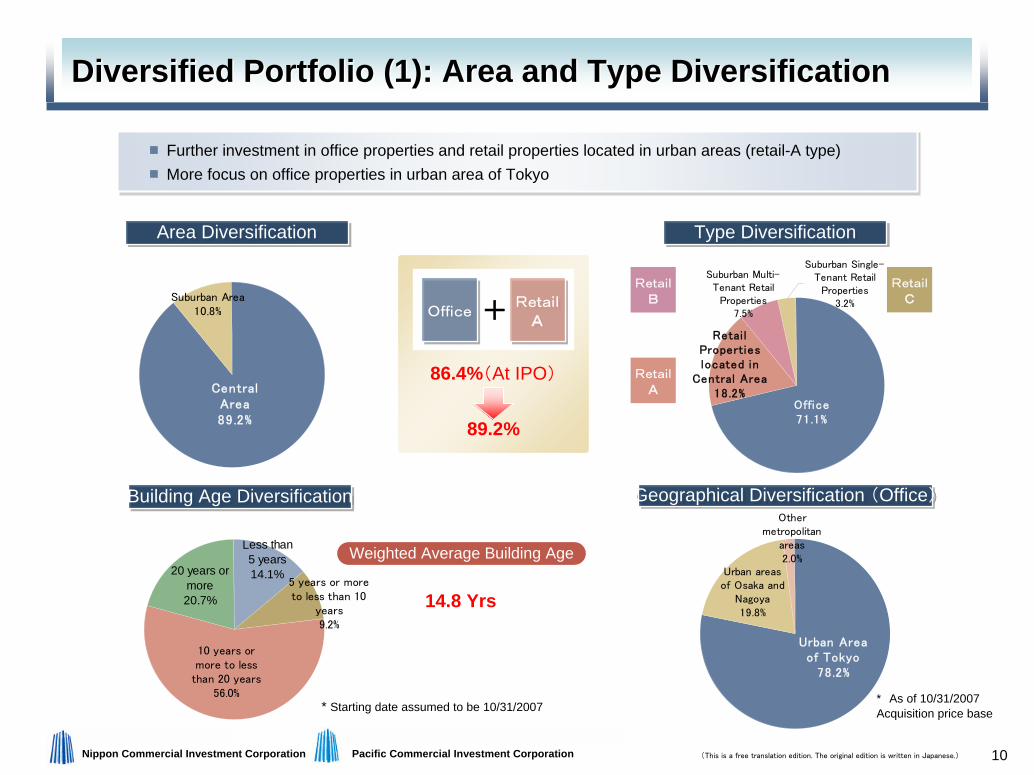
Retai lPropertieslocated in
Central Area18.2%
Suburban Multi-Tenant Retail
Properties7.5%
Suburban Single-Tenant Retail
Properties3.2%
Office71.1%
Diversified Portfolio (1): Area and Type DiversificationDiversified Portfolio (1): Area and Type Diversification
OfficeOffice RetailA
RetailA+
Area DiversificationArea Diversification Type DiversificationType Diversification
Building Age DiversificationBuilding Age Diversification Geographical Diversification (Office)Geographical Diversification (Office)
86.4%(At IPO)
89.2%
RetailA
RetailB
Further investment in office properties and retail properties located in urban areas (retail-A type)More focus on office properties in urban area of Tokyo
Further investment in office properties and retail properties located in urban areas (retail-A type)More focus on office properties in urban area of Tokyo
14.8 Yrs
Weighted Average Building Age
* As of 10/31/2007Acquisition price base* Starting date assumed to be 10/31/2007
RetailC
5 years or moreto less than 10
years9.2%
10 years ormore to less
than 20 years56.0%
20 years ormore20.7%
Less than5 years14.1%
Othermetropolitan
areas2.0%
Urban areasof Osaka and
Nagoya19.8%
Urban Areaof Tokyo
78.2%
CentralArea89.2%
Suburban Area10.8%
11(This is a free translation edition. The original edition is written in Japanese.)Nippon Commercial Investment Corporation Pacific Commercial Investment Corporation
21,161
19,310
17,954 19,40619,998
19,75419,844
20,858
21,61621,789
23,612
17,577
17,844
2.59
2.894.22
6.10
8.127.36
3.17
4.035.045.17
3.774.11
6.14
15,000
16,000
17,000
18,000
19,000
20,000
21,000
22,000
23,000
24,000
25,000
1995 1996 1997 1998 1999 2000 2001 2002 2003 2004 2005 2006 20070.0
1.0
2.0
3.0
4.0
5.0
6.0
7.0
8.0
9.0
10.0Av erage monthly rental rates f or new tenants (y en/tsubo)
Vacancy rate (%)
Av erage monthly rental rates f ornew tenants (y en/tsubo) Vacancy rate (%)
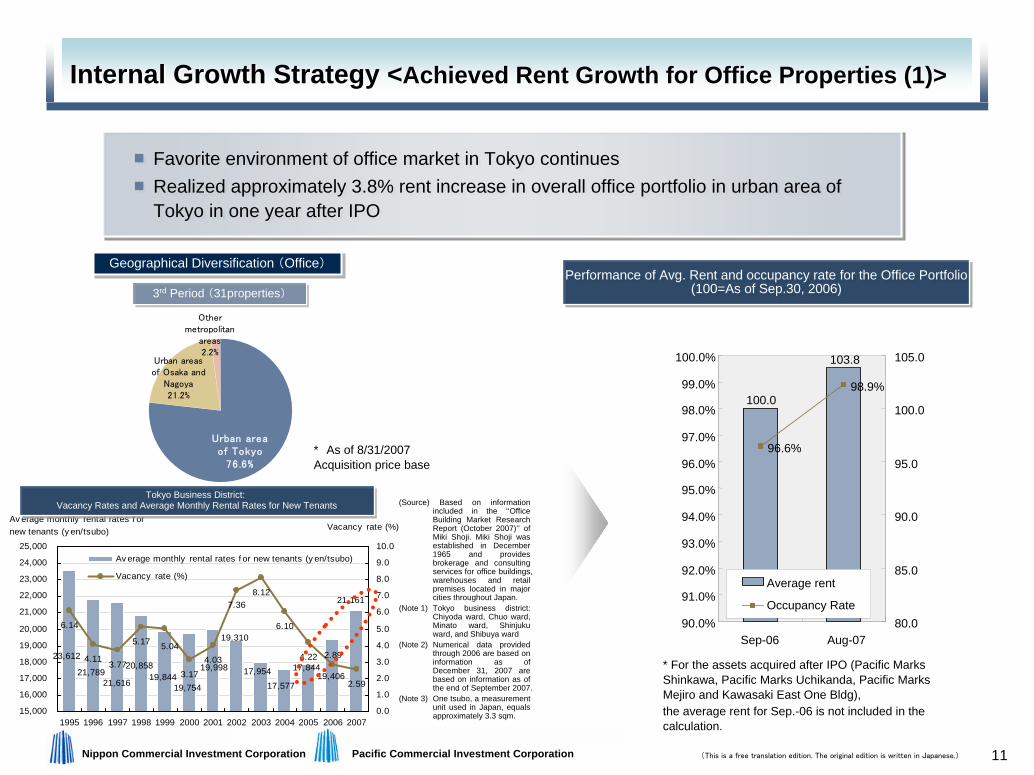
Urban areaof Tokyo
76.6%
Urban areasof Osaka and
Nagoya21.2%
Othermetropolitan
areas2.2%
Geographical Diversification (Office)
Internal Growth Strategy <Achieved Rent Growth for Office Properties (1)>Internal Growth Strategy <Achieved Rent Growth for Office Properties (1)>
Geographical Diversification (Office)
3rd Period (31properties)3rd Period (31properties)
Favorite environment of office market in Tokyo continuesRealized approximately 3.8% rent increase in overall office portfolio in urban area of Tokyo in one year after IPO
Favorite environment of office market in Tokyo continuesRealized approximately 3.8% rent increase in overall office portfolio in urban area of Tokyo in one year after IPO
Performance of Avg. Rent and occupancy rate for the Office Portfolio(100=As of Sep.30, 2006)
Performance of Avg. Rent and occupancy rate for the Office Portfolio(100=As of Sep.30, 2006)
* For the assets acquired after IPO (Pacific Marks Shinkawa, Pacific Marks Uchikanda, Pacific Marks Mejiro and Kawasaki East One Bldg), the average rent for Sep.-06 is not included in the calculation.
100.0
103.8
96.6%
98.9%
90.0%
91.0%
92.0%
93.0%
94.0%
95.0%
96.0%
97.0%
98.0%
99.0%
100.0%
Sep-06 Aug-0780.0
85.0
90.0
95.0
100.0
105.0
Average rent
Occupancy Rate
* As of 8/31/2007Acquisition price base
(Source) Based on information included in the ‘‘Office Building Market Research Report (October 2007)’’ of Miki Shoji. Miki Shoji was established in December 1965 and provides brokerage and consulting services for office buildings, warehouses and retail premises located in major cities throughout Japan.
(Note 1) Tokyo business district: Chiyoda ward, Chuo ward, Minato ward, Shinjuku ward, and Shibuya ward
(Note 2) Numerical data provided through 2006 are based on information as of December 31, 2007 are based on information as of the end of September 2007.
(Note 3) One tsubo, a measurement unit used in Japan, equals approximately 3.3 sqm.
Tokyo Business District: Vacancy Rates and Average Monthly Rental Rates for New Tenants
Tokyo Business District: Vacancy Rates and Average Monthly Rental Rates for New Tenants
12(This is a free translation edition. The original edition is written in Japanese.)Nippon Commercial Investment Corporation Pacific Commercial Investment Corporation
1.7%
28.5%
28.1%
12.1%
12.3%
9.8%
7.5%
Increase(30%~)
Increase(10~30%)
Increase(0~10%)
Agreed on Increase
Under negotiation
No change
Decrease
8.9%
22.7%
27.2%
6.0%
5.2%
27.7%
2.3%
Internal Growth Strategy <Achieved Rent Growth for Office Properties (2)>Internal Growth Strategy <Achieved Rent Growth for Office Properties (2)>
Approx. 4,300tsubo
Approx. 2,500tsuboApprox.
JPY7.5MM/month
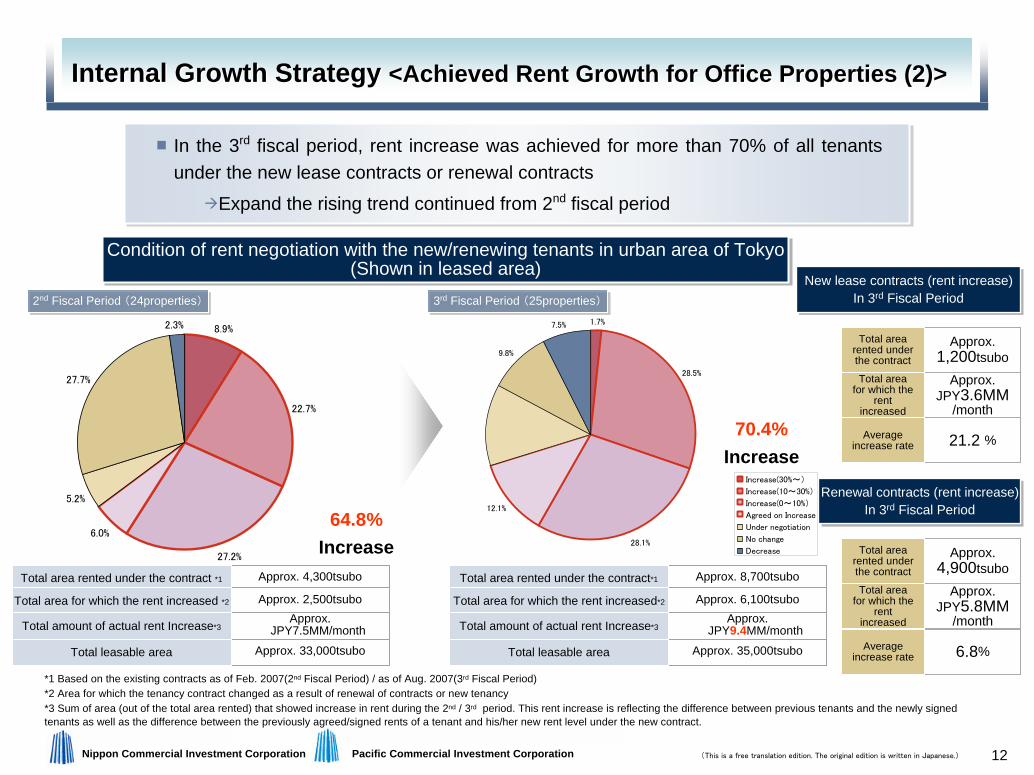
In the 3rd fiscal period, rent increase was achieved for more than 70% of all tenants under the new lease contracts or renewal contracts
Expand the rising trend continued from 2nd fiscal period
In the 3rd fiscal period, rent increase was achieved for more than 70% of all tenants under the new lease contracts or renewal contracts
Expand the rising trend continued from 2nd fiscal period
Total area rented under the contract *1
Total area for which the rent increased *2
Total amount of actual rent Increase*3
Approx. 8,700tsubo
Approx. 6,100tsuboApprox.
JPY9.4MM/month
Total area rented under the contract*1
Total area for which the rent increased*2
Total amount of actual rent Increase*3
Condition of rent negotiation with the new/renewing tenants in urban area of Tokyo(Shown in leased area)
Condition of rent negotiation with the new/renewing tenants in urban area of Tokyo(Shown in leased area)
2nd Fiscal Period (24properties)2nd Fiscal Period (24properties) 3rd Fiscal Period (25properties)3rd Fiscal Period (25properties)
Approx. 35,000tsuboTotal leasable areaApprox. 33,000tsuboTotal leasable area
64.8%Increase
70.4%Increase
New lease contracts (rent increase)In 3rd Fiscal Period
New lease contracts (rent increase)In 3rd Fiscal Period
Approx. 1,200tsubo
Approx. JPY3.6MM
/month
21.2 %
Total area rented under the contract
Total area for which the
rent increased
Average increase rate
Renewal contracts (rent increase)In 3rd Fiscal Period
Renewal contracts (rent increase)In 3rd Fiscal Period
Approx. 4,900tsubo
Approx. JPY5.8MM
/month
6.8%
Total area rented under the contract
Total area for which the
rent increased
Average increase rate
*1 Based on the existing contracts as of Feb. 2007(2nd Fiscal Period) / as of Aug. 2007(3rd Fiscal Period)*2 Area for which the tenancy contract changed as a result of renewal of contracts or new tenancy *3 Sum of area (out of the total area rented) that showed increase in rent during the 2nd / 3rd period. This rent increase is reflecting the difference between previous tenants and the newly signed tenants as well as the difference between the previously agreed/signed rents of a tenant and his/her new rent level under the new contract.
13(This is a free translation edition. The original edition is written in Japanese.)Nippon Commercial Investment Corporation Pacific Commercial Investment Corporation
0
2,000
4,000
6,000
8,000
10,000
12,000
14,000
16,000
18,000
4th Period 5th Period 6th Period 7th Period After 8th Period
(tsubo)
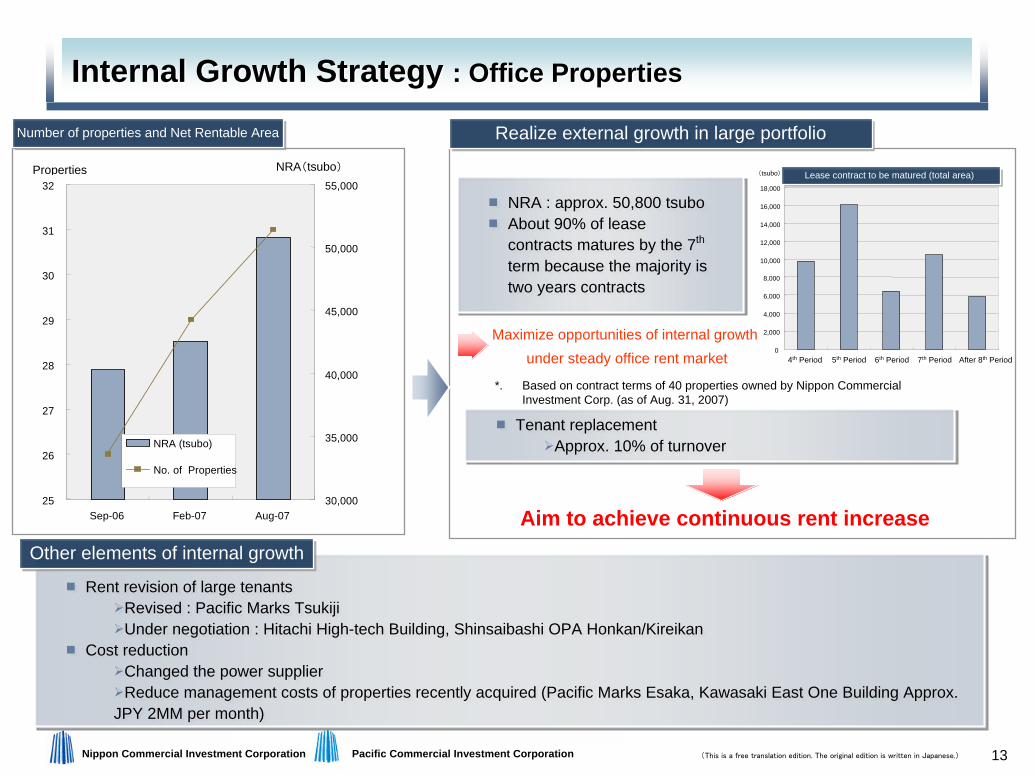
Internal Growth Strategy : Office PropertiesInternal Growth Strategy : Office Properties
Realize external growth in large portfolioRealize external growth in large portfolio
*. Based on contract terms of 40 properties owned by Nippon Commercial Investment Corp. (as of Aug. 31, 2007)
Number of properties and Net Rentable AreaNumber of properties and Net Rentable Area
Properties NRA(tsubo)
NRA : approx. 50,800 tsuboAbout 90% of lease contracts matures by the 7th
term because the majority is two years contracts
NRA : approx. 50,800 tsuboAbout 90% of lease contracts matures by the 7th
term because the majority is two years contracts
Tenant replacementApprox. 10% of turnover
Tenant replacementApprox. 10% of turnover
Maximize opportunities of internal growth under steady office rent market
Aim to achieve continuous rent increase
Rent revision of large tenantsRevised : Pacific Marks TsukijiUnder negotiation : Hitachi High-tech Building, Shinsaibashi OPA Honkan/Kireikan
Cost reductionChanged the power supplierReduce management costs of properties recently acquired (Pacific Marks Esaka, Kawasaki East One Building Approx.
JPY 2MM per month)
Other elements of internal growthOther elements of internal growth
Lease contract to be matured (total area)Lease contract to be matured (total area)
25
26
27
28
29
30
31
32
Sep-06 Feb-07 Aug-0730,000
35,000
40,000
45,000
50,000
55,000
NRA (tsubo)
No. of Properties
14(This is a free translation edition. The original edition is written in Japanese.)Nippon Commercial Investment Corporation Pacific Commercial Investment Corporation
14,000
14,500
15,000
15,500
16,000
16,500
17,000
17,500
End of Apr-06 End of Feb-07 End of Aug-07
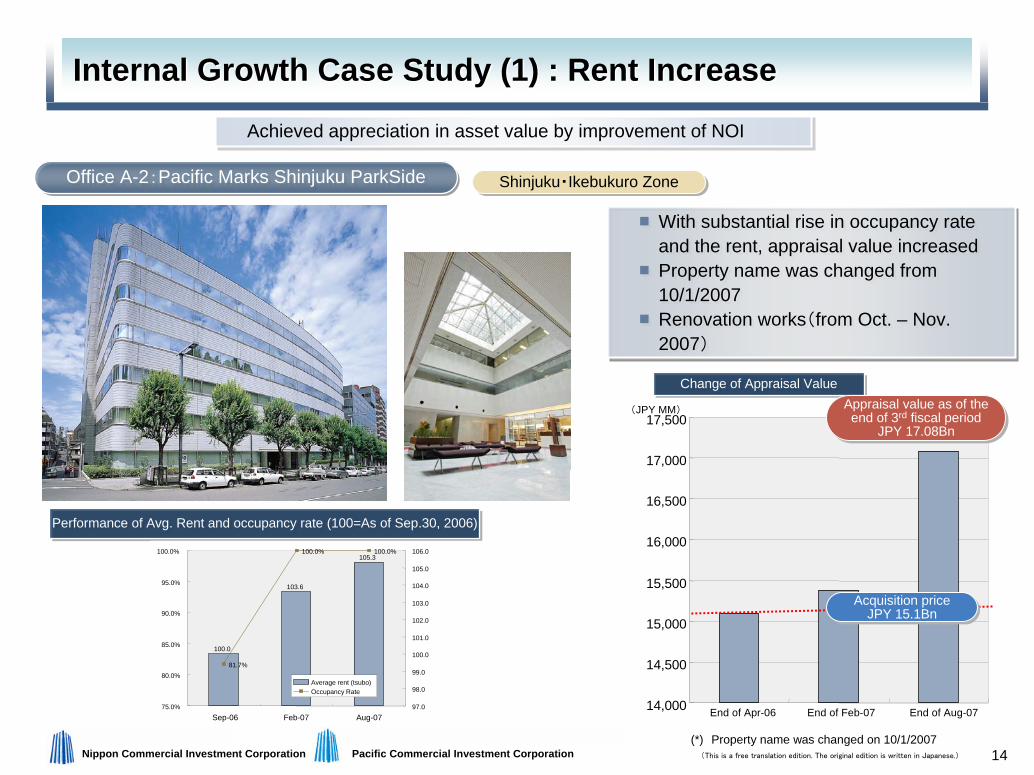
Internal Growth Case Study (1) : Rent IncreaseInternal Growth Case Study (1) : Rent Increase
Office A-2:Pacific Marks Shinjuku ParkSideOffice A-2:Pacific Marks Shinjuku ParkSide
Performance of Avg. Rent and occupancy rate (100=As of Sep.30, 2006)Performance of Avg. Rent and occupancy rate (100=As of Sep.30, 2006)
Shinjuku・Ikebukuro ZoneShinjuku・Ikebukuro Zone
(JPY MM)
Change of Appraisal ValueChange of Appraisal Value
With substantial rise in occupancy rate and the rent, appraisal value increasedProperty name was changed from10/1/2007Renovation works(from Oct. – Nov. 2007)
With substantial rise in occupancy rate and the rent, appraisal value increasedProperty name was changed from10/1/2007Renovation works(from Oct. – Nov. 2007)
Acquisition price JPY 15.1Bn
Acquisition price JPY 15.1Bn
Appraisal value as of the end of 3rd fiscal period
JPY 17.08Bn
Appraisal value as of the end of 3rd fiscal period
JPY 17.08Bn
(*) Property name was changed on 10/1/2007
Achieved appreciation in asset value by improvement of NOIAchieved appreciation in asset value by improvement of NOI
100.0
103.6
105.3
81.7%
100.0% 100.0%
75.0%
80.0%
85.0%
90.0%
95.0%
100.0%
Sep-06 Feb-07 Aug-0797.0
98.0
99.0
100.0
101.0
102.0
103.0
104.0
105.0
106.0
Average rent (tsubo)Occupancy Rate
15(This is a free translation edition. The original edition is written in Japanese.)Nippon Commercial Investment Corporation Pacific Commercial Investment Corporation
5,000
5,500
6,000
6,500
7,000
7,500
8,000
8,500
9,000
9,500
End of Apr-06 End of Feb-07 End of Aug-07
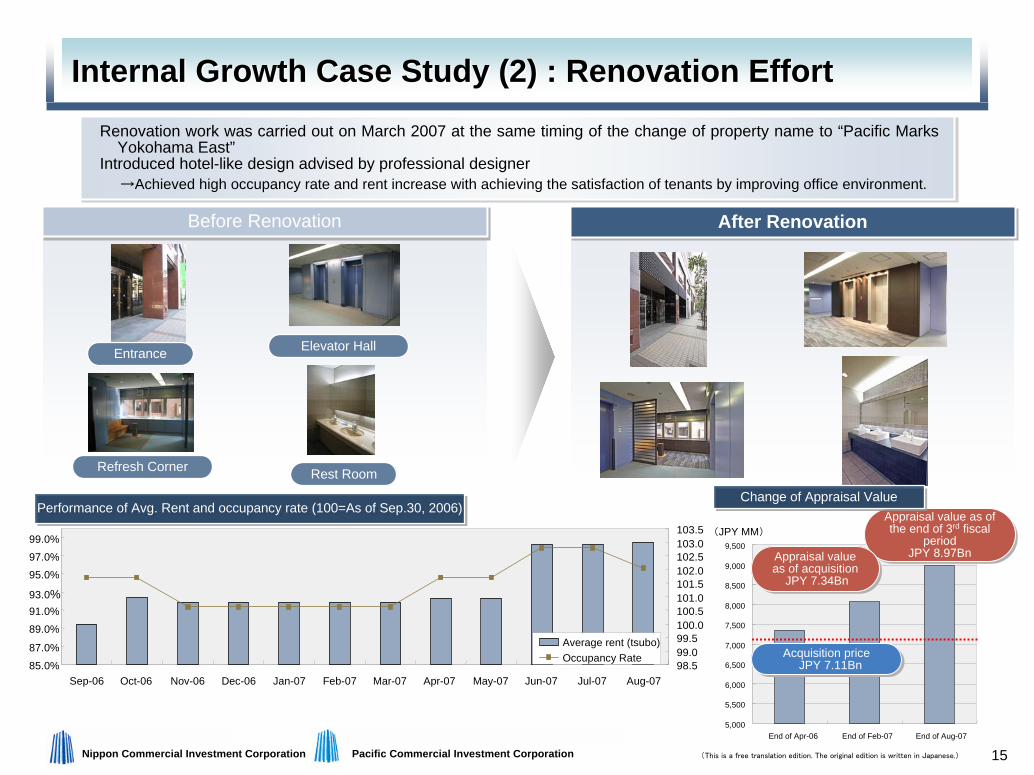
Internal Growth Case Study (2) : Renovation EffortInternal Growth Case Study (2) : Renovation Effort
Before RenovationBefore Renovation
Elevator Hall
Renovation work was carried out on March 2007 at the same timing of the change of property name to “Pacific Marks Yokohama East”
Introduced hotel-like design advised by professional designer→Achieved high occupancy rate and rent increase with achieving the satisfaction of tenants by improving office environment.
Rest RoomRefresh Corner
After RenovationAfter Renovation
Entrance
リニューアル工事の実施(JPY MM)
Acquisition price JPY 7.11Bn
Acquisition price JPY 7.11Bn
Appraisal value as of the end of 3rd fiscal
periodJPY 8.97Bn
Appraisal value as of the end of 3rd fiscal
periodJPY 8.97BnAppraisal value
as of acquisitionJPY 7.34Bn
Appraisal value as of acquisition
JPY 7.34Bn
85.0%
87.0%
89.0%
91.0%93.0%
95.0%
97.0%
99.0%
Sep-06 Oct-06 Nov-06 Dec-06 Jan-07 Feb-07 Mar-07 Apr-07 May-07 Jun-07 Jul-07 Aug-0798.599.099.5100.0100.5101.0101.5102.0102.5103.0103.5
Average rent (tsubo)Occupancy Rate
Change of Appraisal ValueChange of Appraisal ValuePerformance of Avg. Rent and occupancy rate (100=As of Sep.30, 2006)Performance of Avg. Rent and occupancy rate (100=As of Sep.30, 2006)
16(This is a free translation edition. The original edition is written in Japanese.)Nippon Commercial Investment Corporation Pacific Commercial Investment Corporation
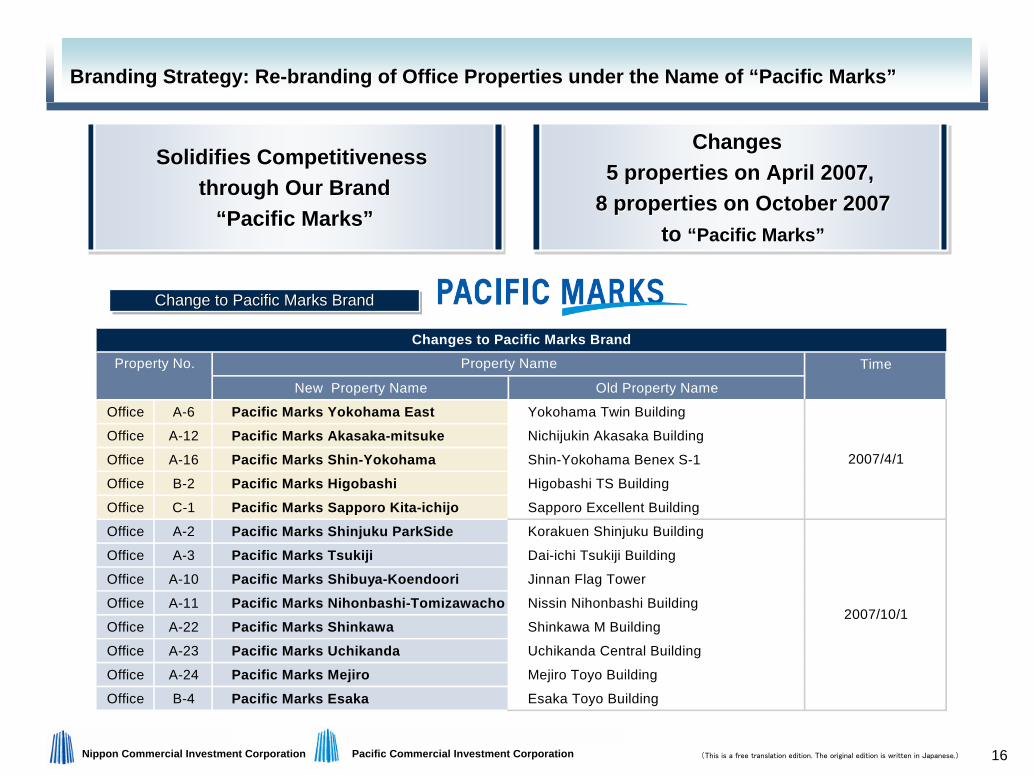
Branding Strategy: Re-branding of Office Properties under the Name of “Pacific Marks”Branding Strategy: Re-branding of Office Properties under the Name of “Pacific Marks”
Change to Pacific Marks BrandChange to Pacific Marks BrandChange to Pacific Marks Brand
Solidifies Competitiveness through Our Brand
“Pacific Marks”
Solidifies Competitiveness Solidifies Competitiveness through Our Brandthrough Our Brand
““Pacific MarksPacific Marks””
Changes 5 properties on April 2007,
8 properties on October 2007to “Pacific Marks”
Changes Changes 5 properties on April 2007,5 properties on April 2007,
8 properties on October 20078 properties on October 2007to to ““Pacific MarksPacific Marks””
Time
New Property Name Old Property Name
Office A-6 Pacific Marks Yokohama East Yokohama Twin Building
Office A-12 Pacific Marks Akasaka-mitsuke Nichijukin Akasaka Building
Office A-16 Pacific Marks Shin-Yokohama Shin-Yokohama Benex S-1
Office B-2 Pacific Marks Higobashi Higobashi TS Building
Office C-1 Pacific Marks Sapporo Kita-ichijo Sapporo Excellent Building
Office A-2 Pacific Marks Shinjuku ParkSide Korakuen Shinjuku Building
Office A-3 Pacific Marks Tsukiji Dai-ichi Tsukiji Building
Office A-10 Pacific Marks Shibuya-Koendoori Jinnan Flag Tower
Office A-11 Pacific Marks Nihonbashi-Tomizawacho Nissin Nihonbashi Building
Office A-22 Pacific Marks Shinkawa Shinkawa M Building
Office A-23 Pacific Marks Uchikanda Uchikanda Central Building
Office A-24 Pacific Marks Mejiro Mejiro Toyo Building
Office B-4 Pacific Marks Esaka Esaka Toyo Building
Changes to Pacific Marks BrandProperty NameProperty No.
2007/10/1
2007/4/1
17(This is a free translation edition. The original edition is written in Japanese.)Nippon Commercial Investment Corporation Pacific Commercial Investment Corporation
Retail PortfolioDisposition
Acquisition
Internal growth lead to higher asset value
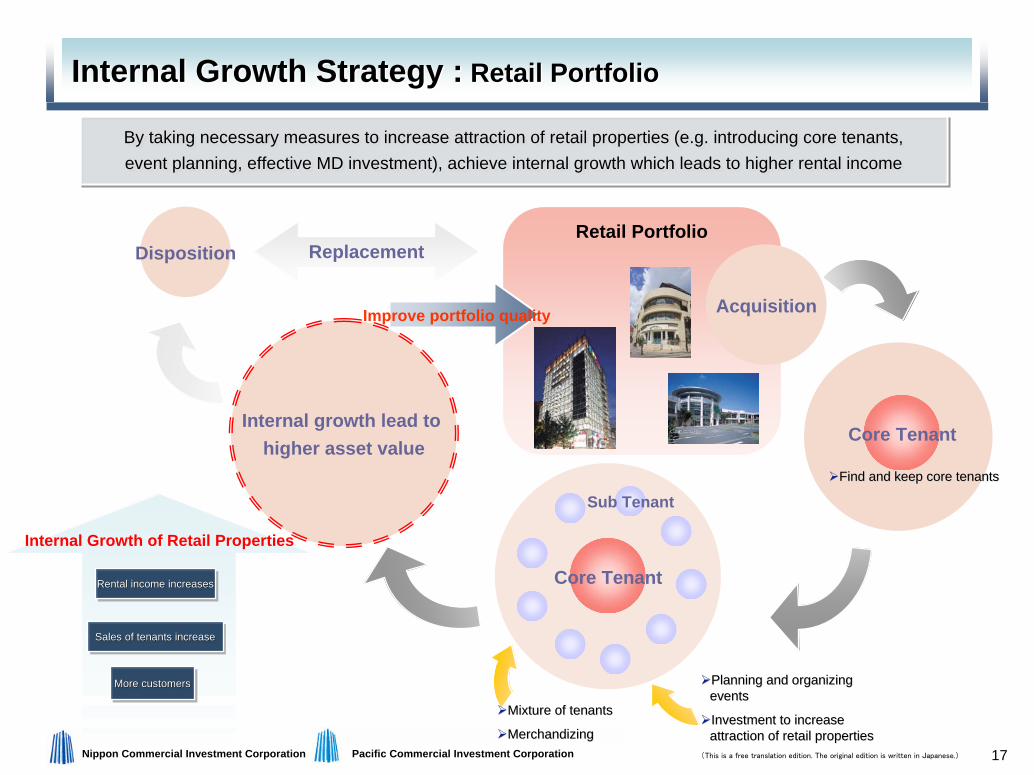
Internal Growth Strategy : Retail PortfolioInternal Growth Strategy : Retail Portfolio
By taking necessary measures to increase attraction of retail properties (e.g. introducing core tenants, event planning, effective MD investment), achieve internal growth which leads to higher rental incomeBy taking necessary measures to increase attraction of retail properties (e.g. introducing core tenants, event planning, effective MD investment), achieve internal growth which leads to higher rental income
Planning and organizing Planning and organizing eventsevents
Investment to increase Investment to increase attraction of retail propertiesattraction of retail properties
Core Tenant
Find and keep core tenantsFind and keep core tenants
Core Tenant
Sub Tenant
Mixture of tenantsMixture of tenants
MerchandizingMerchandizing
Sales of tenants increaseSales of tenants increaseSales of tenants increase
Rental income increasesRental income increasesRental income increases
More customersMore customersMore customers
Internal Growth of Retail Properties
Replacement
Improve portfolio quality
18(This is a free translation edition. The original edition is written in Japanese.)Nippon Commercial Investment Corporation Pacific Commercial Investment Corporation
70.0%
80.0%
90.0%
100.0%
110.0%
Mar-07 Apr-07 May-07 Jun-07 Jul-07 Aug-07
Core Tenants
Total
40.0%
60.0%
80.0%
100.0%
120.0%
140.0%
160.0%
Sep-
06
Oct-
06
Nov-
06
Dec-
06
Jan-
07
Feb-
07
Mar-
07
Apr-
07
May-
07
Jun-
07
Jul-
07
Aug-
07
No. of Passengers (Y-o-Y)
94
96
98
100
102
104
106
108
110
112
Apr-Aug 2006 Apr-Aug 2007
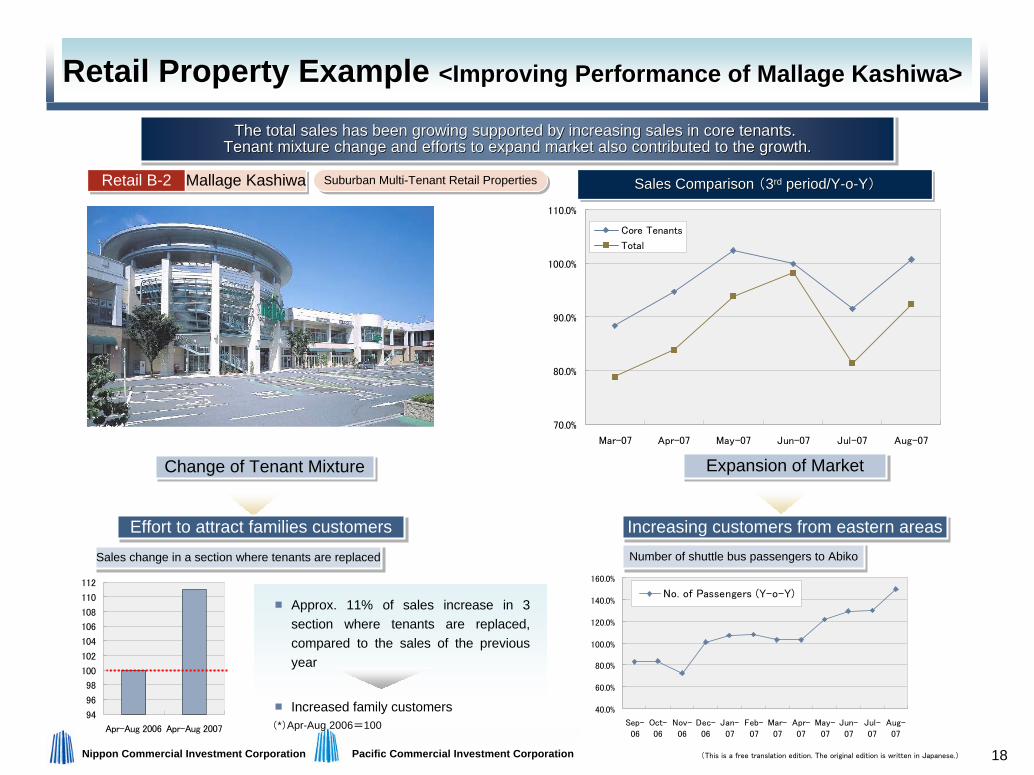
Retail Property Example <Improving Performance of Mallage Kashiwa>Retail Property Example <Improving Performance of Mallage Kashiwa>
The total sales has been growing supported by increasing sales in core tenants. Tenant mixture change and efforts to expand market also contributed to the growth.The total sales has been growing supported by increasing sales iThe total sales has been growing supported by increasing sales in core tenants. n core tenants.
Tenant mixture change and efforts to expand market also contribuTenant mixture change and efforts to expand market also contributed to the growth.ted to the growth.
Suburban Multi-Tenant Retail PropertiesSuburban Multi-Tenant Retail PropertiesRetail B-2Retail B-2 Mallage KashiwaMallage Kashiwa Sales Comparison (3rd period/Y-o-Y)Sales Comparison Sales Comparison ((33rdrd period/Yperiod/Y--oo--YY))
Expansion of MarketExpansion of Market
Increasing customers from eastern areasIncreasing customers from eastern areas
Number of shuttle bus passengers to AbikoNumber of shuttle bus passengers to AbikoSales change in a section where tenants are replacedSales change in a section where tenants are replaced
Change of Tenant MixtureChange of Tenant Mixture
Effort to attract families customersEffort to attract families customers
Approx. 11% of sales increase in 3 section where tenants are replaced, compared to the sales of the previous year
Increased family customers(*)Apr-Aug 2006=100
19(This is a free translation edition. The original edition is written in Japanese.)Nippon Commercial Investment Corporation Pacific Commercial Investment Corporation
290,000
300,000
310,000
320,000
330,000
340,000
350,000
360,000
370,000
380,000
390,000
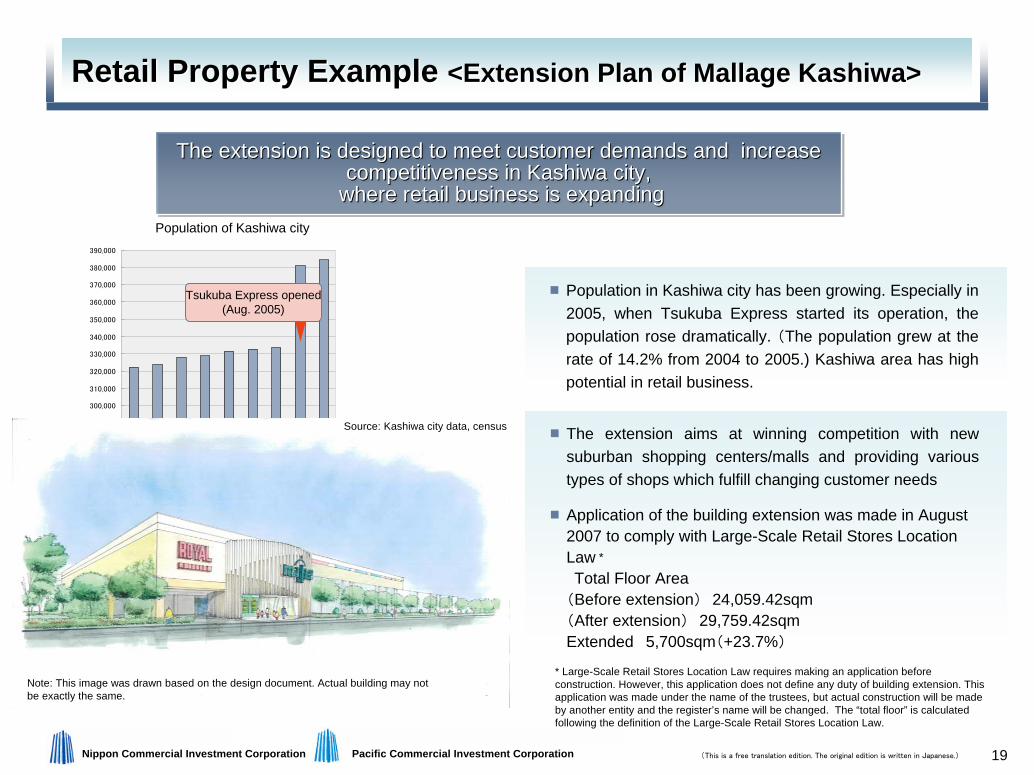
1998 1999 2000 2001 2002 2003 2004 2005 2006 The extension aims at winning competition with new suburban shopping centers/malls and providing various types of shops which fulfill changing customer needs
Application of the building extension was made in August 2007 to comply with Large-Scale Retail Stores Location Law *
Total Floor Area (Before extension) 24,059.42sqm(After extension) 29,759.42sqmExtended 5,700sqm(+23.7%)
Retail Property Example <Extension Plan of Mallage Kashiwa>Retail Property Example <Extension Plan of Mallage Kashiwa>
The extension is designed to meet customer demands and increasecompetitiveness in Kashiwa city,
where retail business is expanding
The extension is designed to meet customer demands and increaseThe extension is designed to meet customer demands and increasecompetitiveness in Kashiwa city,competitiveness in Kashiwa city,
where retail business is expandingwhere retail business is expanding
Note: This image was drawn based on the design document. Actual building may not be exactly the same.
* Large-Scale Retail Stores Location Law requires making an application before construction. However, this application does not define any duty of building extension. This application was made under the name of the trustees, but actual construction will be made by another entity and the register’s name will be changed. The “total floor” is calculated following the definition of the Large-Scale Retail Stores Location Law.
Tsukuba Express opened(Aug. 2005)
Population in Kashiwa city has been growing. Especially in 2005, when Tsukuba Express started its operation, the population rose dramatically. (The population grew at the rate of 14.2% from 2004 to 2005.) Kashiwa area has high potential in retail business.
Population of Kashiwa city
Source: Kashiwa city data, census
20(This is a free translation edition. The original edition is written in Japanese.)Nippon Commercial Investment Corporation Pacific Commercial Investment Corporation
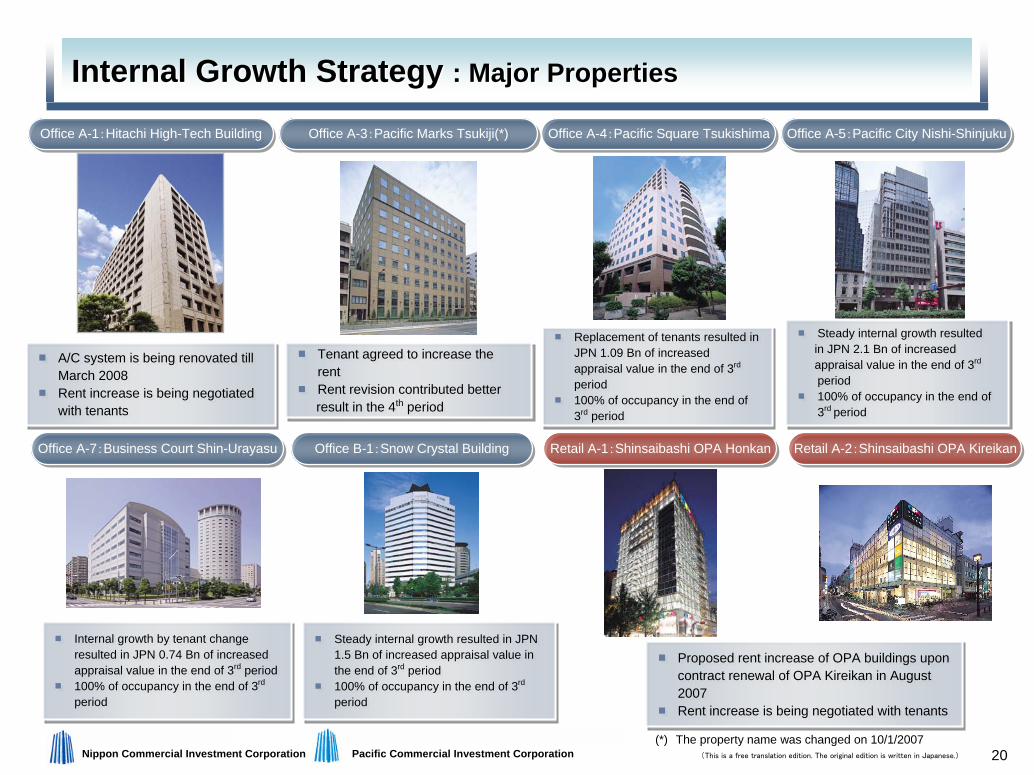
Internal Growth Strategy : Major PropertiesInternal Growth Strategy : Major Properties
Office A-1:Hitachi High-Tech BuildingOffice A-1:Hitachi High-Tech Building Office A-3:Pacific Marks Tsukiji(*)Office A-3:Pacific Marks Tsukiji(*)
Retail A-1:Shinsaibashi OPA HonkanRetail A-1:Shinsaibashi OPA Honkan Retail A-2:Shinsaibashi OPA KireikanRetail A-2:Shinsaibashi OPA Kireikan
A/C system is being renovated tillMarch 2008Rent increase is being negotiated with tenants
A/C system is being renovated tillMarch 2008Rent increase is being negotiated with tenants
Tenant agreed to increase the rentRent revision contributed betterresult in the 4th period
Tenant agreed to increase the rentRent revision contributed betterresult in the 4th period
Proposed rent increase of OPA buildings uponcontract renewal of OPA Kireikan in August2007Rent increase is being negotiated with tenants
Proposed rent increase of OPA buildings uponcontract renewal of OPA Kireikan in August2007Rent increase is being negotiated with tenants
Office A-5:Pacific City Nishi-ShinjukuOffice A-5:Pacific City Nishi-ShinjukuOffice A-4:Pacific Square TsukishimaOffice A-4:Pacific Square Tsukishima
Replacement of tenants resulted in JPN 1.09 Bn of increasedappraisal value in the end of 3rd
period100% of occupancy in the end of 3rd period
Replacement of tenants resulted in JPN 1.09 Bn of increasedappraisal value in the end of 3rd
period100% of occupancy in the end of 3rd period
Office A-7:Business Court Shin-UrayasuOffice A-7:Business Court Shin-Urayasu Office B-1:Snow Crystal BuildingOffice B-1:Snow Crystal Building
Internal growth by tenant changeresulted in JPN 0.74 Bn of increasedappraisal value in the end of 3rd period100% of occupancy in the end of 3rd
period
Internal growth by tenant changeresulted in JPN 0.74 Bn of increasedappraisal value in the end of 3rd period100% of occupancy in the end of 3rd
period
Steady internal growth resulted in JPN 1.5 Bn of increased appraisal value inthe end of 3rd period100% of occupancy in the end of 3rd
period
Steady internal growth resulted in JPN 1.5 Bn of increased appraisal value inthe end of 3rd period100% of occupancy in the end of 3rd
period
(*) The property name was changed on 10/1/2007
Steady internal growth resultedin JPN 2.1 Bn of increasedappraisal value in the end of 3rd
period100% of occupancy in the end of 3rd period
Steady internal growth resultedin JPN 2.1 Bn of increasedappraisal value in the end of 3rd
period100% of occupancy in the end of 3rd period
21(This is a free translation edition. The original edition is written in Japanese.)Nippon Commercial Investment Corporation Pacific Commercial Investment Corporation
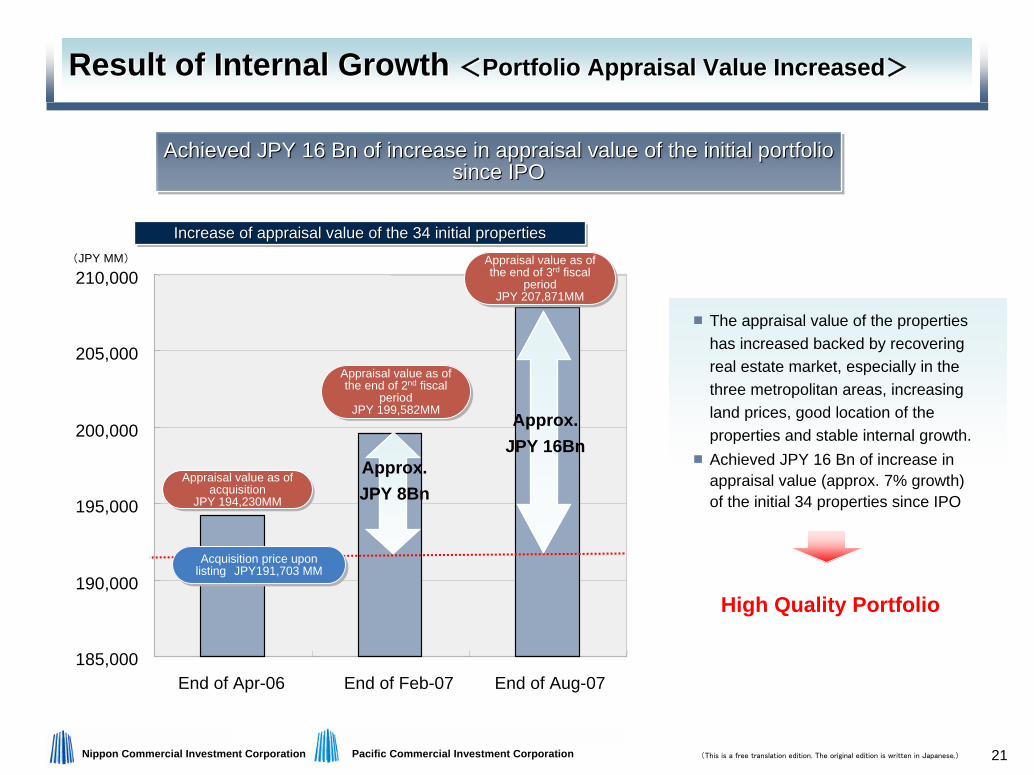
185,000
190,000
195,000
200,000
205,000
210,000
End of Apr-06 End of Feb-07 End of Aug-07
Appraisal value as of the end of 3rd fiscal
periodJPY 207,871MM
Appraisal value as of the end of 3rd fiscal
periodJPY 207,871MM
Approx.JPY 16Bn
(JPY MM)
High Quality Portfolio
Appraisal value as of acquisition
JPY 194,230MM
Appraisal value as of acquisition
JPY 194,230MM
Appraisal value as of the end of 2nd fiscal
periodJPY 199,582MM
Appraisal value as of the end of 2nd fiscal
periodJPY 199,582MM
Approx.JPY 8Bn
Achieved JPY 16 Bn of increase in appraisal value of the initial portfolio since IPO
Achieved JPY 16 Bn of increase in appraisal value of the initialAchieved JPY 16 Bn of increase in appraisal value of the initial portfolio portfolio since IPO since IPO
The appraisal value of the properties has increased backed by recovering real estate market, especially in the three metropolitan areas, increasing land prices, good location of the properties and stable internal growth.Achieved JPY 16 Bn of increase in appraisal value (approx. 7% growth) of the initial 34 properties since IPO
Acquisition price upon listing JPY191,703 MMAcquisition price upon
listing JPY191,703 MM
Increase of appraisal value of the 34 initial propertiesIncrease of appraisal value of the 34 initial propertiesIncrease of appraisal value of the 34 initial properties
Result of Internal Growth <Portfolio Appraisal Value Increased>Result of Internal Growth <Portfolio Appraisal Value Increased>
Section 2Financial Strategy
23(This is a free translation edition. The original edition is written in Japanese.)Nippon Commercial Investment Corporation Pacific Commercial Investment Corporation
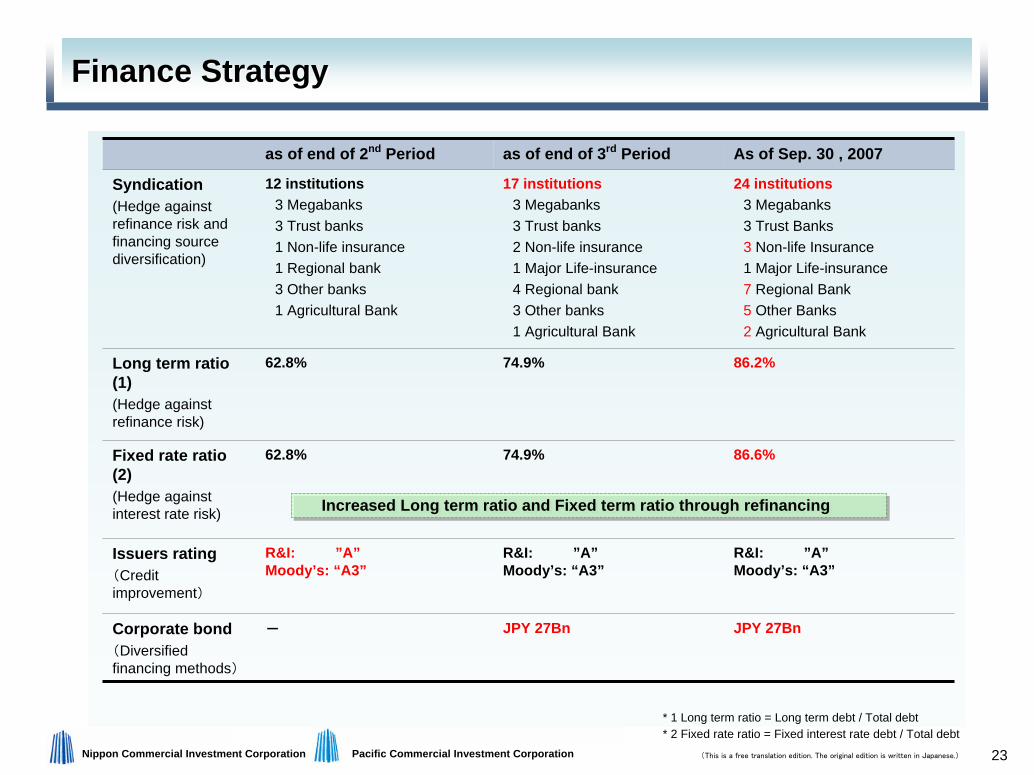
Finance StrategyFinance Strategy
as of end of 2nd Period as of end of 3rd Period As of Sep. 30 , 2007
Syndication(Hedge against refinance risk and financing source diversification)
12 institutions3 Megabanks3 Trust banks1 Non-life insurance1 Regional bank3 Other banks1 Agricultural Bank
17 institutions3 Megabanks3 Trust banks2 Non-life insurance1 Major Life-insurance 4 Regional bank3 Other banks1 Agricultural Bank
74.9%
74.9%
R&I: ”A”Moody’s: “A3”
JPY 27Bn
24 institutions3 Megabanks3 Trust Banks3 Non-life Insurance1 Major Life-insurance 7 Regional Bank5 Other Banks2 Agricultural Bank
Long term ratio (1)(Hedge against refinance risk)
62.8% 86.2%
Fixed rate ratio (2)(Hedge against interest rate risk)
62.8% 86.6%
Issuers rating(Credit improvement)
R&I: ”A”Moody’s: “A3”
R&I: ”A”Moody’s: “A3”
Corporate bond(Diversified financing methods)
- JPY 27Bn
* 1 Long term ratio = Long term debt / Total debt* 2 Fixed rate ratio = Fixed interest rate debt / Total debt
Increased Long term ratio and Fixed term ratio through refinancingIncreased Long term ratio and Fixed term ratio through refinancing
24(This is a free translation edition. The original edition is written in Japanese.)Nippon Commercial Investment Corporation Pacific Commercial Investment Corporation
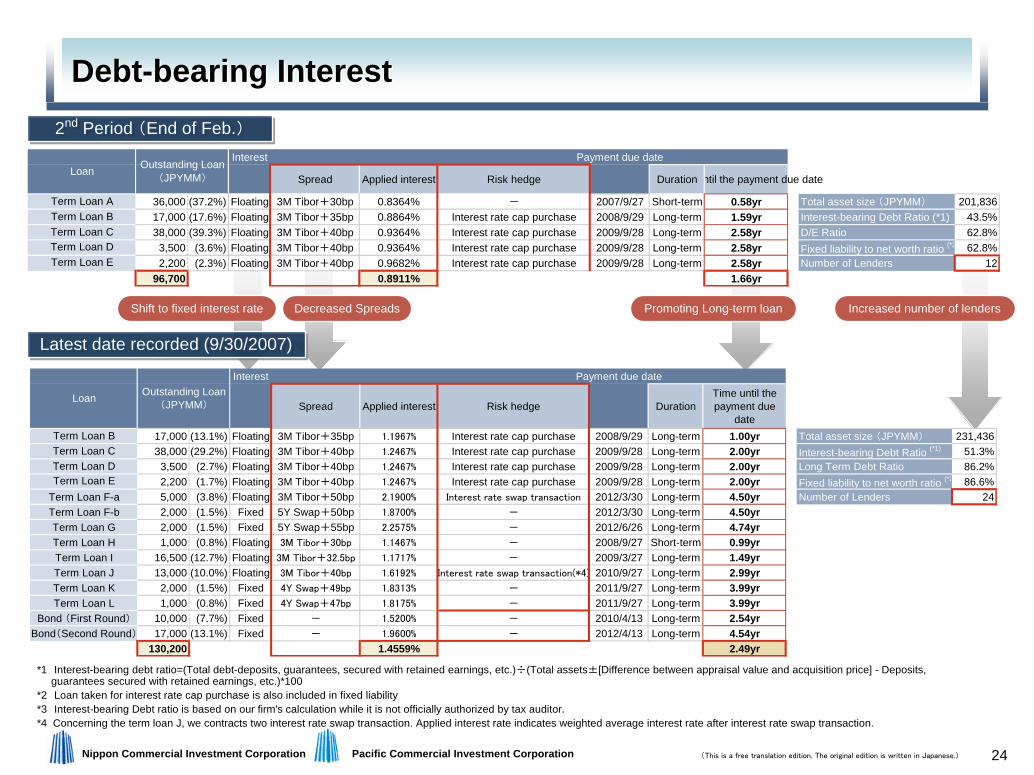
Promoting Long-term loan
Debt-bearing InterestDebt-bearing Interest2nd Period (End of Feb.)2nd Period (End of Feb.)
Latest date recorded (9/30/2007)Latest date recorded (9/30/2007)
Shift to fixed interest rate Increased number of lendersDecreased Spreads
*1 Interest-bearing debt ratio=(Total debt-deposits, guarantees, secured with retained earnings, etc.)÷(Total assets±[Difference between appraisal value and acquisition price] - Deposits,guarantees secured with retained earnings, etc.)*100
*2 Loan taken for interest rate cap purchase is also included in fixed liability*3 Interest-bearing Debt ratio is based on our firm's calculation while it is not officially authorized by tax auditor. *4 Concerning the term loan J, we contracts two interest rate swap transaction. Applied interest rate indicates weighted average interest rate after interest rate swap transaction.
Interest Payment due date
Spread Applied interest Risk hedge Duration ntil the payment due date
36,000 (37.2%) Floating 3M Tibor+30bp 0.8364% - 2007/9/27 Short-term 0.58yr Total asset size (JPYMM) 201,83617,000 (17.6%) Floating 3M Tibor+35bp 0.8864% Interest rate cap purchase 2008/9/29 Long-term 1.59yr Interest-bearing Debt Ratio (*1) 43.5%38,000 (39.3%) Floating 3M Tibor+40bp 0.9364% Interest rate cap purchase 2009/9/28 Long-term 2.58yr D/E Ratio 62.8%
3,500 (3.6%) Floating 3M Tibor+40bp 0.9364% Interest rate cap purchase 2009/9/28 Long-term 2.58yr Fixed liability to net worth ratio (*2 62.8%2,200 (2.3%) Floating 3M Tibor+40bp 0.9682% Interest rate cap purchase 2009/9/28 Long-term 2.58yr Number of Lenders 12
96,700 0.8911% 1.66yr
Term Loan ATerm Loan BTerm Loan CTerm Loan DTerm Loan E
Loan Outstanding Loan(JPYMM)
Interest Payment due date
Spread Applied interest Risk hedge DurationTime until thepayment due
date17,000 (13.1%) Floating 3M Tibor+35bp 1.1967% Interest rate cap purchase 2008/9/29 Long-term 1.00yr Total asset size (JPYMM) 231,43638,000 (29.2%) Floating 3M Tibor+40bp 1.2467% Interest rate cap purchase 2009/9/28 Long-term 2.00yr Interest-bearing Debt Ratio (*1) 51.3%
3,500 (2.7%) Floating 3M Tibor+40bp 1.2467% Interest rate cap purchase 2009/9/28 Long-term 2.00yr Long Term Debt Ratio 86.2%2,200 (1.7%) Floating 3M Tibor+40bp 1.2467% Interest rate cap purchase 2009/9/28 Long-term 2.00yr Fixed liability to net worth ratio (*2 86.6%
Term Loan F-a 5,000 (3.8%) Floating 3M Tibor+50bp 2.1900% Interest rate swap transaction 2012/3/30 Long-term 4.50yr Number of Lenders 24Term Loan F-b 2,000 (1.5%) Fixed 5Y Swap+50bp 1.8700% - 2012/3/30 Long-term 4.50yrTerm Loan G 2,000 (1.5%) Fixed 5Y Swap+55bp 2.2575% - 2012/6/26 Long-term 4.74yrTerm Loan H 1,000 (0.8%) Floating 3M Tibor+30bp 1.1467% - 2008/9/27 Short-term 0.99yrTerm Loan I 16,500 (12.7%) Floating 3M Tibor+32.5bp 1.1717% - 2009/3/27 Long-term 1.49yrTerm Loan J 13,000 (10.0%) Floating 3M Tibor+40bp 1.6192% Interest rate swap transaction(*4) 2010/9/27 Long-term 2.99yrTerm Loan K 2,000 (1.5%) Fixed 4Y Swap+49bp 1.8313% - 2011/9/27 Long-term 3.99yrTerm Loan L 1,000 (0.8%) Fixed 4Y Swap+47bp 1.8175% - 2011/9/27 Long-term 3.99yr
Bond (First Round) 10,000 (7.7%) Fixed - 1.5200% - 2010/4/13 Long-term 2.54yrBond(Second Round) 17,000 (13.1%) Fixed - 1.9600% - 2012/4/13 Long-term 4.54yr
130,200 1.4559% 2.49yr
Term Loan E
Loan
Term Loan BTerm Loan CTerm Loan D
Outstanding Loan(JPYMM)
Appendix
26(This is a free translation edition. The original edition is written in Japanese.)Nippon Commercial Investment Corporation Pacific Commercial Investment Corporation
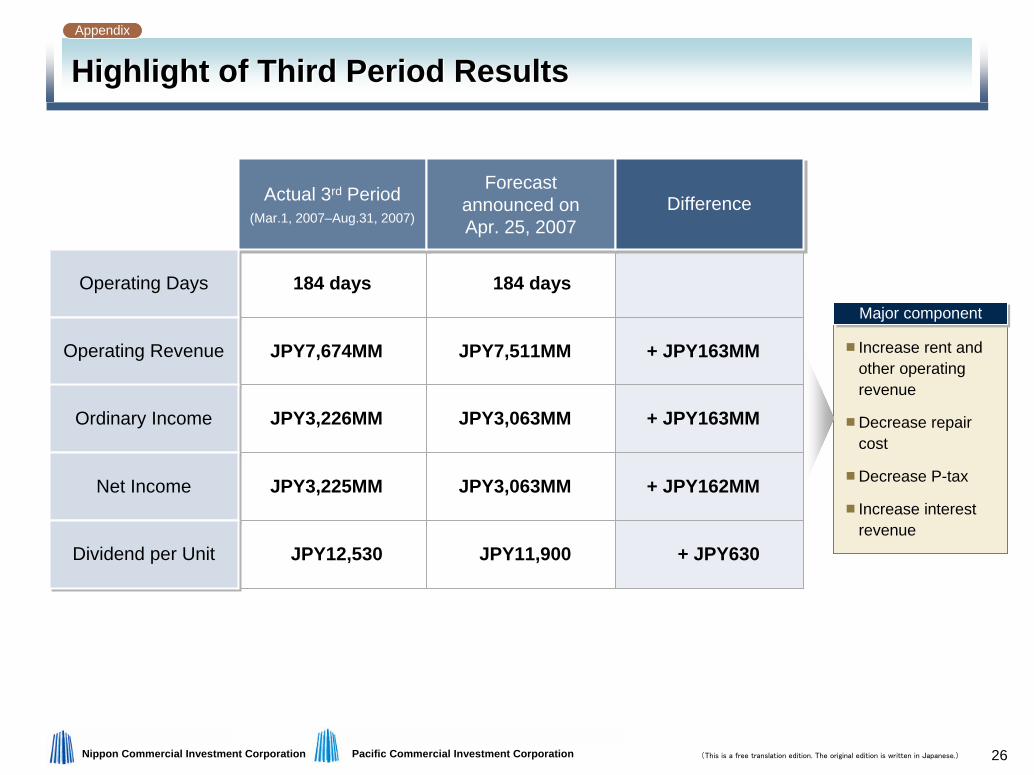
Highlight of Third Period ResultsHighlight of Third Period Results
184 days
JPY7,674MM
JPY3,226MM
JPY3,225MM
JPY12,530
184 days
JPY7,511MM
JPY3,063MM
JPY3,063MM
JPY11,900
+ JPY163MM
+ JPY163MM
+ JPY162MM
+ JPY630
Actual 3rd Period(Mar.1, 2007–Aug.31, 2007)
Actual 3rd Period(Mar.1, 2007–Aug.31, 2007)
Forecastannounced onApr. 25, 2007
Forecastannounced onApr. 25, 2007
DifferenceDifference
Operating DaysOperating Days
Operating RevenueOperating Revenue
Ordinary IncomeOrdinary Income
Net IncomeNet Income
Dividend per UnitDividend per Unit
Increase rent and other operating revenue
Decrease repair cost
Decrease P-tax
Increase interest revenue
Major componentMajor component
Appendix
27(This is a free translation edition. The original edition is written in Japanese.)Nippon Commercial Investment Corporation Pacific Commercial Investment Corporation
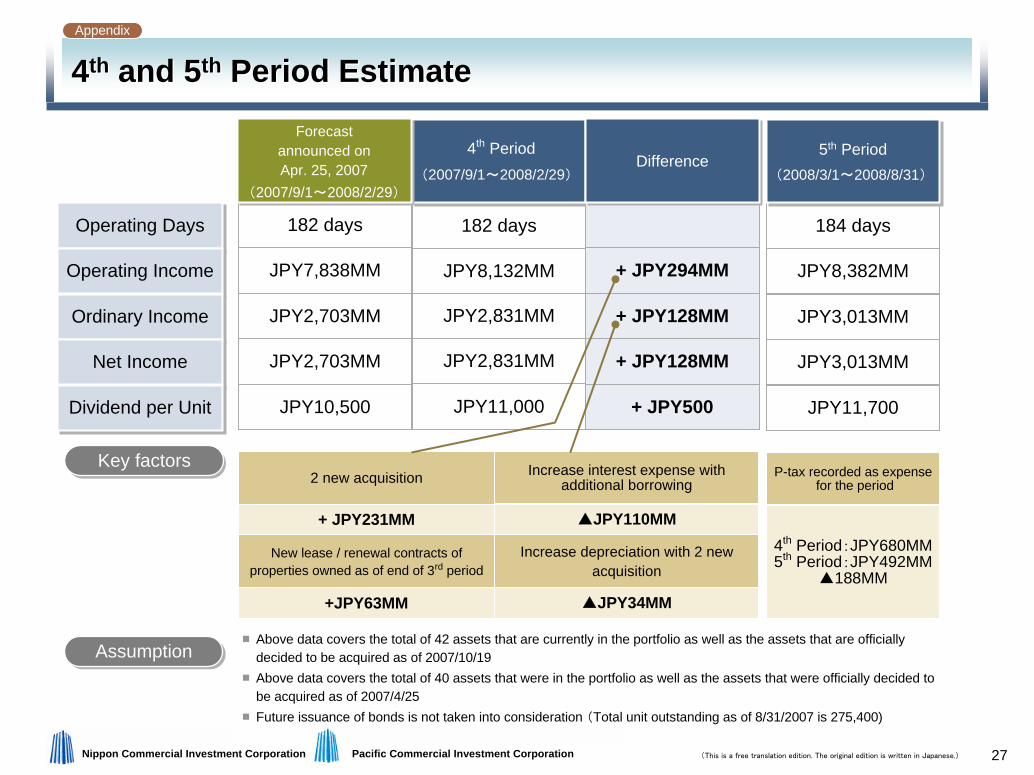
4th and 5th Period Estimate4th and 5th Period Estimate
Operating DaysOperating Days
Operating IncomeOperating Income
Ordinary IncomeOrdinary Income
Net IncomeNet Income
Dividend per UnitDividend per Unit
184 days182 days
JPY8,382MMJPY8,132MM
JPY3,013MMJPY2,831MM
JPY3,013MMJPY2,831MM
JPY11,700JPY11,000
Key factorsKey factors
▲JPY110MM
Increase interest expense with additional borrowing
4th Period:JPY680MM5th Period:JPY492MM
▲188MM
P-tax recorded as expensefor the period
4th Period(2007/9/1~2008/2/29)
4th Period(2007/9/1~2008/2/29)
5th Period(2008/3/1~2008/8/31)
5th Period(2008/3/1~2008/8/31)
▲JPY34MM
Increase depreciation with 2 new acquisition
182 days
JPY7,838MM
JPY2,703MM
JPY2,703MM
JPY10,500
+ JPY231MM
2 new acquisition
Forecastannounced onApr. 25, 2007
(2007/9/1~2008/2/29)
Forecastannounced onApr. 25, 2007
(2007/9/1~2008/2/29)
+JPY63MM
New lease / renewal contracts of properties owned as of end of 3rd period
+ JPY294MM
+ JPY128MM
+ JPY128MM
+ JPY500
DifferenceDifference
Above data covers the total of 42 assets that are currently in the portfolio as well as the assets that are officially decided to be acquired as of 2007/10/19Above data covers the total of 40 assets that were in the portfolio as well as the assets that were officially decided to be acquired as of 2007/4/25Future issuance of bonds is not taken into consideration (Total unit outstanding as of 8/31/2007 is 275,400)
AssumptionAssumption
Appendix
28(This is a free translation edition. The original edition is written in Japanese.)Nippon Commercial Investment Corporation Pacific Commercial Investment Corporation
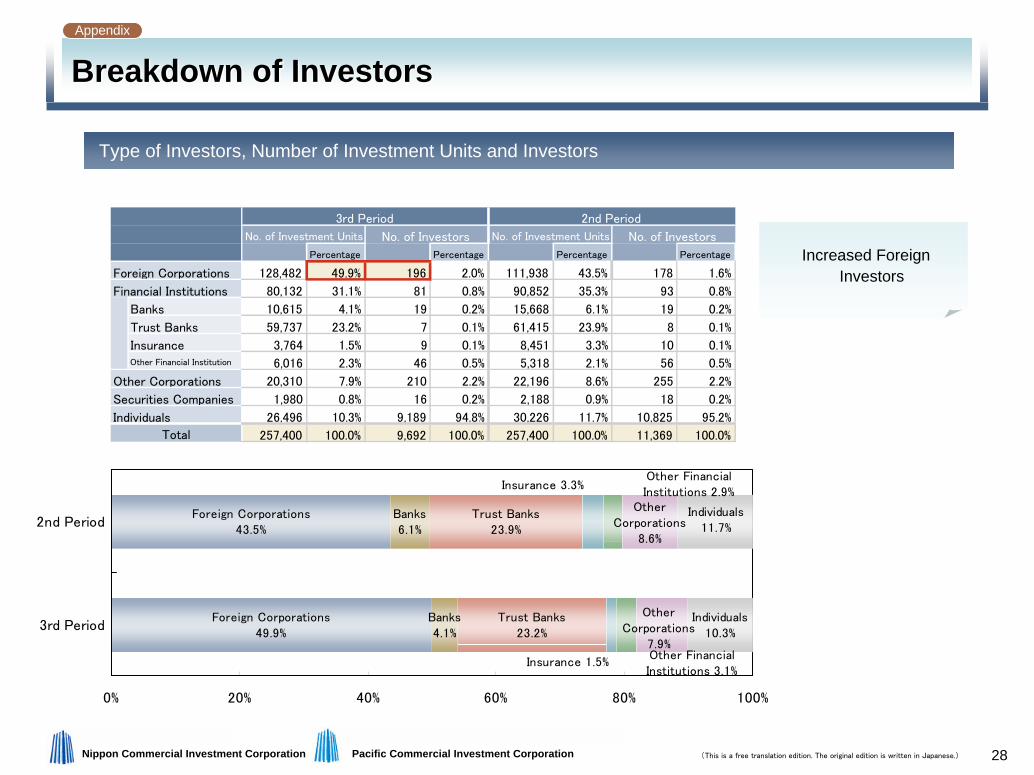
Breakdown of InvestorsBreakdown of Investors
Type of Investors, Number of Investment Units and Investors
Increased Foreign Investors
Foreign Corporations43.5%
Foreign Corporations49.9%
Banks6.1%
Banks4.1%
Trust Banks23.9%
Trust Banks23.2%
Insurance 1.5%
Insurance 3.3%Other FinancialInstitutions 2.9%
Other FinancialInstitutions 3.1%
OtherCorporations
7.9%
OtherCorporations
8.6%
Individuals11.7%
Individuals10.3%
0% 20% 40% 60% 80% 100%
3rd Period
2nd Period
Percentage Percentage Percentage Percentage
Foreign Corporations 128,482 49.9% 196 2.0% 111,938 43.5% 178 1.6%
Financial Institutions 80,132 31.1% 81 0.8% 90,852 35.3% 93 0.8%
Banks 10,615 4.1% 19 0.2% 15,668 6.1% 19 0.2%
Trust Banks 59,737 23.2% 7 0.1% 61,415 23.9% 8 0.1%
Insurance 3,764 1.5% 9 0.1% 8,451 3.3% 10 0.1%Other Financial Institution 6,016 2.3% 46 0.5% 5,318 2.1% 56 0.5%
Other Corporations 20,310 7.9% 210 2.2% 22,196 8.6% 255 2.2%
Securities Companies 1,980 0.8% 16 0.2% 2,188 0.9% 18 0.2%
Individuals 26,496 10.3% 9,189 94.8% 30,226 11.7% 10,825 95.2%
257,400 100.0% 9,692 100.0% 257,400 100.0% 11,369 100.0%Total
3rd Period 2nd Period
No. of Investment UnitsNo. of Investment Units No. of InvestorsNo. of Investors
Appendix
29(This is a free translation edition. The original edition is written in Japanese.)Nippon Commercial Investment Corporation Pacific Commercial Investment Corporation
0Units
4,000Units
8,000Units
12,000Units
16,000Units
20,000Units
24,000Units
JPY400,000
JPY450,000
JPY500,000
JPY550,000
JPY600,000
JPY650,000
JPY700,000
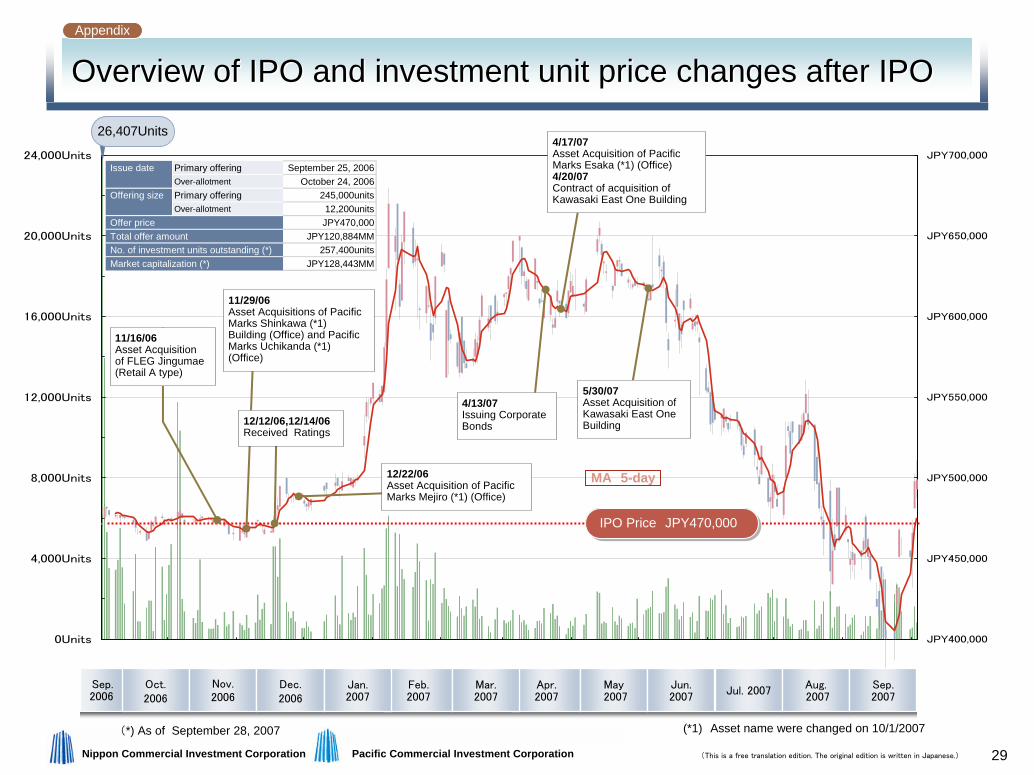
Overview of IPO and investment unit price changes after IPOOverview of IPO and investment unit price changes after IPO
MA 5-day
IPO Price JPY470,000IPO Price JPY470,000
11/16/06Asset Acquisition of FLEG Jingumae (Retail A type)
11/29/06Asset Acquisitions of Pacific Marks Shinkawa (*1)Building (Office) and Pacific Marks Uchikanda (*1) (Office)
12/12/06,12/14/06Received Ratings
12/22/06Asset Acquisition of Pacific Marks Mejiro (*1) (Office)
4/13/07Issuing Corporate Bonds
4/17/07Asset Acquisition of Pacific Marks Esaka (*1) (Office)4/20/07Contract of acquisition of Kawasaki East One Building
(*) As of September 28, 2007
5/30/07Asset Acquisition of Kawasaki East One Building
Issue date Primary offering September 25, 2006Over-allotment October 24, 2006
Offering size Primary offering 245,000unitsOver-allotment 12,200units
Offer price JPY470,000Total offer amount JPY120,884MMNo. of investment units outstanding (*) 257,400unitsMarket capitalization (*) JPY128,443MM
26,407Units
(*1) Asset name were changed on 10/1/2007
Oct. 2006
Nov. 2006
Dec.2006
Apr. 2007
Feb. 2007
Mar. 2007
Sep.2006
May2007
Jun. 2007
Jan. 2007
Jul. 2007Aug.2007
Sep. 2007
Appendix
30(This is a free translation edition. The original edition is written in Japanese.)Nippon Commercial Investment Corporation Pacific Commercial Investment Corporation
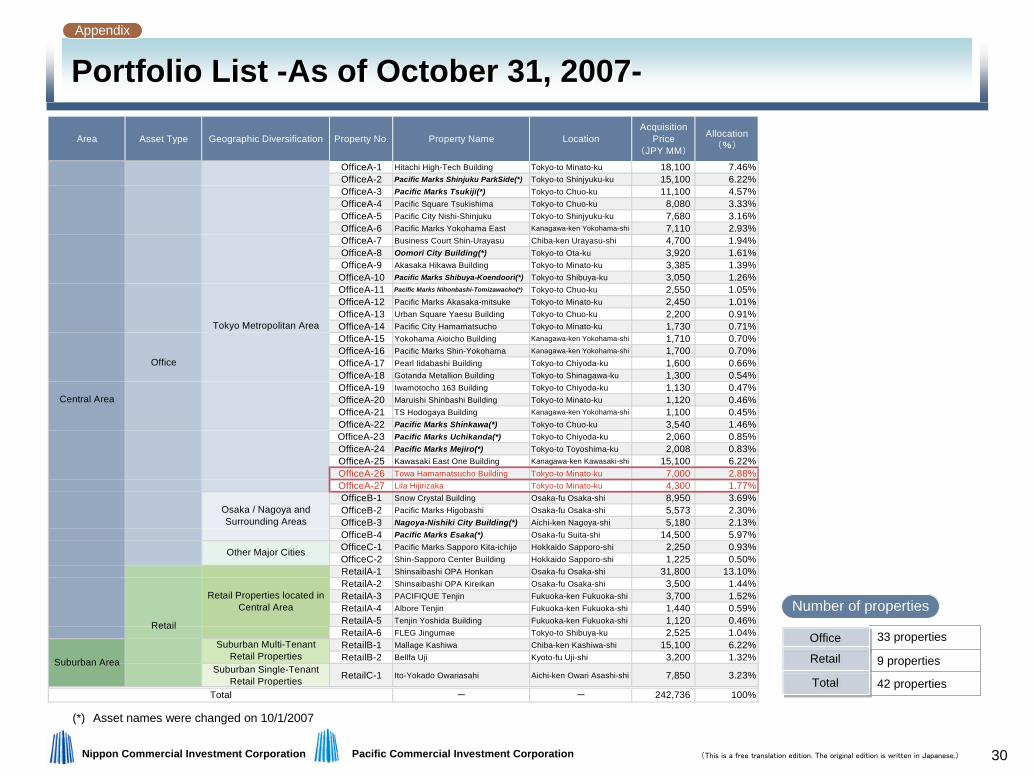
Area Asset Type Geographic Diversification Property No. Property Name LocationAcquisition
Price(JPY MM)
Allocation(%)
OfficeA-1 Hitachi High-Tech Building Tokyo-to Minato-ku 18,100 7.46%OfficeA-2 Pacific Marks Shinjuku ParkSide(*) Tokyo-to Shinjyuku-ku 15,100 6.22%OfficeA-3 Pacific Marks Tsukiji(*) Tokyo-to Chuo-ku 11,100 4.57%OfficeA-4 Pacific Square Tsukishima Tokyo-to Chuo-ku 8,080 3.33%OfficeA-5 Pacific City Nishi-Shinjuku Tokyo-to Shinjyuku-ku 7,680 3.16%OfficeA-6 Pacific Marks Yokohama East Kanagawa-ken Yokohama-shi 7,110 2.93%OfficeA-7 Business Court Shin-Urayasu Chiba-ken Urayasu-shi 4,700 1.94%OfficeA-8 Oomori City Building(*) Tokyo-to Ota-ku 3,920 1.61%OfficeA-9 Akasaka Hikawa Building Tokyo-to Minato-ku 3,385 1.39%
OfficeA-10 Pacific Marks Shibuya-Koendoori(*) Tokyo-to Shibuya-ku 3,050 1.26%OfficeA-11 Pacific Marks Nihonbashi-Tomizawacho(*) Tokyo-to Chuo-ku 2,550 1.05%OfficeA-12 Pacific Marks Akasaka-mitsuke Tokyo-to Minato-ku 2,450 1.01%OfficeA-13 Urban Square Yaesu Building Tokyo-to Chuo-ku 2,200 0.91%OfficeA-14 Pacific City Hamamatsucho Tokyo-to Minato-ku 1,730 0.71%OfficeA-15 Yokohama Aioicho Building Kanagawa-ken Yokohama-shi 1,710 0.70%OfficeA-16 Pacific Marks Shin-Yokohama Kanagawa-ken Yokohama-shi 1,700 0.70%OfficeA-17 Pearl Iidabashi Building Tokyo-to Chiyoda-ku 1,600 0.66%OfficeA-18 Gotanda Metallion Building Tokyo-to Shinagawa-ku 1,300 0.54%OfficeA-19 Iwamotocho 163 Building Tokyo-to Chiyoda-ku 1,130 0.47%OfficeA-20 Maruishi Shinbashi Building Tokyo-to Minato-ku 1,120 0.46%OfficeA-21 TS Hodogaya Building Kanagawa-ken Yokohama-shi 1,100 0.45%OfficeA-22 Pacific Marks Shinkawa(*) Tokyo-to Chuo-ku 3,540 1.46%OfficeA-23 Pacific Marks Uchikanda(*) Tokyo-to Chiyoda-ku 2,060 0.85%OfficeA-24 Pacific Marks Mejiro(*) Tokyo-to Toyoshima-ku 2,008 0.83%OfficeA-25 Kawasaki East One Building Kanagawa-ken Kawasaki-shi 15,100 6.22%OfficeA-26 Towa Hamamatsucho Building Tokyo-to Minato-ku 7,000 2.88%OfficeA-27 Lila Hijirizaka Tokyo-to Minato-ku 4,300 1.77%OfficeB-1 Snow Crystal Building Osaka-fu Osaka-shi 8,950 3.69%OfficeB-2 Pacific Marks Higobashi Osaka-fu Osaka-shi 5,573 2.30%OfficeB-3 Nagoya-Nishiki City Building(*) Aichi-ken Nagoya-shi 5,180 2.13%OfficeB-4 Pacific Marks Esaka(*) Osaka-fu Suita-shi 14,500 5.97%OfficeC-1 Pacific Marks Sapporo Kita-ichijo Hokkaido Sapporo-shi 2,250 0.93%OfficeC-2 Shin-Sapporo Center Building Hokkaido Sapporo-shi 1,225 0.50%RetailA-1 Shinsaibashi OPA Honkan Osaka-fu Osaka-shi 31,800 13.10%RetailA-2 Shinsaibashi OPA Kireikan Osaka-fu Osaka-shi 3,500 1.44%RetailA-3 PACIFIQUE Tenjin Fukuoka-ken Fukuoka-shi 3,700 1.52%RetailA-4 Albore Tenjin Fukuoka-ken Fukuoka-shi 1,440 0.59%RetailA-5 Tenjin Yoshida Building Fukuoka-ken Fukuoka-shi 1,120 0.46%RetailA-6 FLEG Jingumae Tokyo-to Shibuya-ku 2,525 1.04%RetailB-1 Mallage Kashiwa Chiba-ken Kashiwa-shi 15,100 6.22%RetailB-2 Bellfa Uji Kyoto-fu Uji-shi 3,200 1.32%
Suburban Single-TenantRetail Properties RetailC-1 Ito-Yokado Owariasahi Aichi-ken Owari Asashi-shi 7,850 3.23%
- - 242,736 100%
Osaka / Nagoya andSurrounding Areas
Retail Properties located inCentral Area
Central Area
Tokyo Metropolitan Area
Total
Other Major Cities
Suburban Multi-TenantRetail Properties
Office
Suburban Area
Retail
Portfolio List -As of October 31, 2007-Portfolio List -As of October 31, 2007-
(*) Asset names were changed on 10/1/2007
33 properties
Number of properties
9 properties
42 properties
OfficeOffice
RetailRetail
TotalTotal
Appendix
31(This is a free translation edition. The original edition is written in Japanese.)Nippon Commercial Investment Corporation Pacific Commercial Investment Corporation
Less thanJPY3Bn
7.2%
JPY10Bnor above66.8%
JPY5Bn-JPY10Bn
11.2%
JPY3Bn-JPY5Bn14.8%
JPY3Bn-JPY5Bn13.3%
JPY5Bn-JPY10Bn
28.7%
Less thanJPY3Bn15.1%
JPY10Bnor above42.8%
10,000spm-30,000spm
45.3%
30,000spm-50,000spm
26.1%
50,000spmor above11.2%
Less than10,000spm
17.5%
3,000spm-10,000spm
33.0%
10,000spmor above57.6%
Less than3,000spm
9.4%
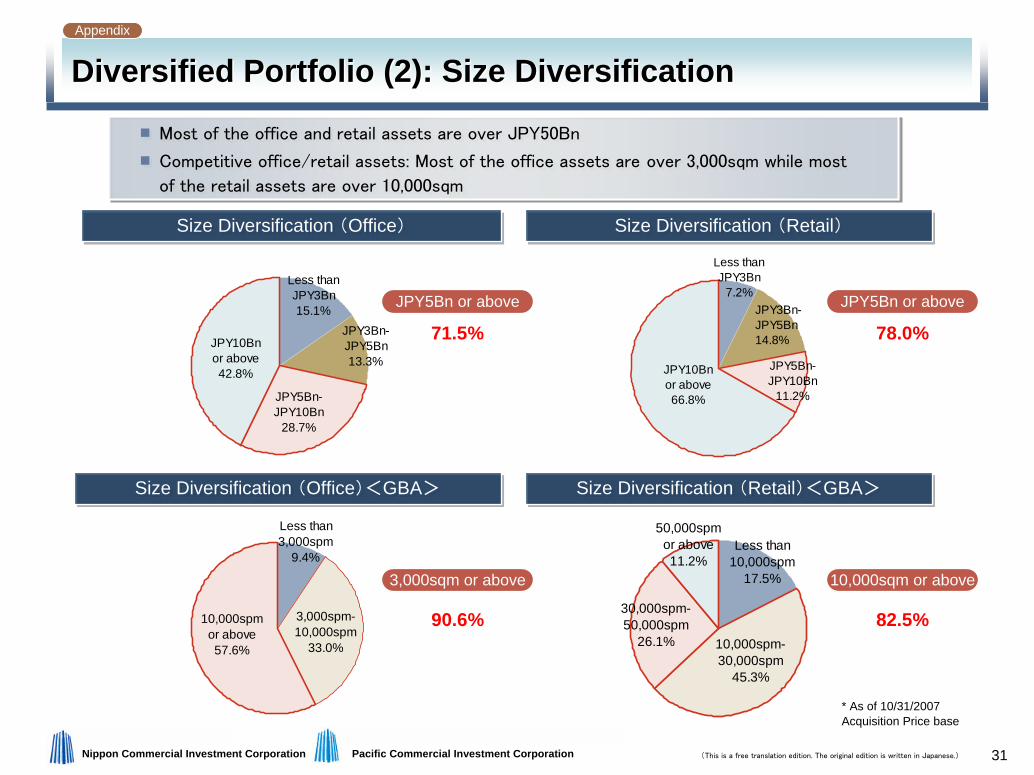
Diversified Portfolio (2): Size DiversificationDiversified Portfolio (2): Size Diversification
Most of the office and retail assets are over JPY50Bn
Competitive office/retail assets: Most of the office assets are over 3,000sqm while most
of the retail assets are over 10,000sqm
Most of the office and retail assets are over JPY50Bn
Competitive office/retail assets: Most of the office assets are over 3,000sqm while most
of the retail assets are over 10,000sqm
90.6%
3,000sqm or above
71.5% 78.0%
JPY5Bn or above
82.5%
10,000sqm or above
Size Diversification (Office)Size Diversification (Office) Size Diversification (Retail)Size Diversification (Retail)
Size Diversification (Office)<GBA>Size Diversification (Office)<GBA> Size Diversification (Retail)<GBA>Size Diversification (Retail)<GBA>
JPY5Bn or above
* As of 10/31/2007Acquisition Price base
Appendix
32(This is a free translation edition. The original edition is written in Japanese.)Nippon Commercial Investment Corporation Pacific Commercial Investment Corporation
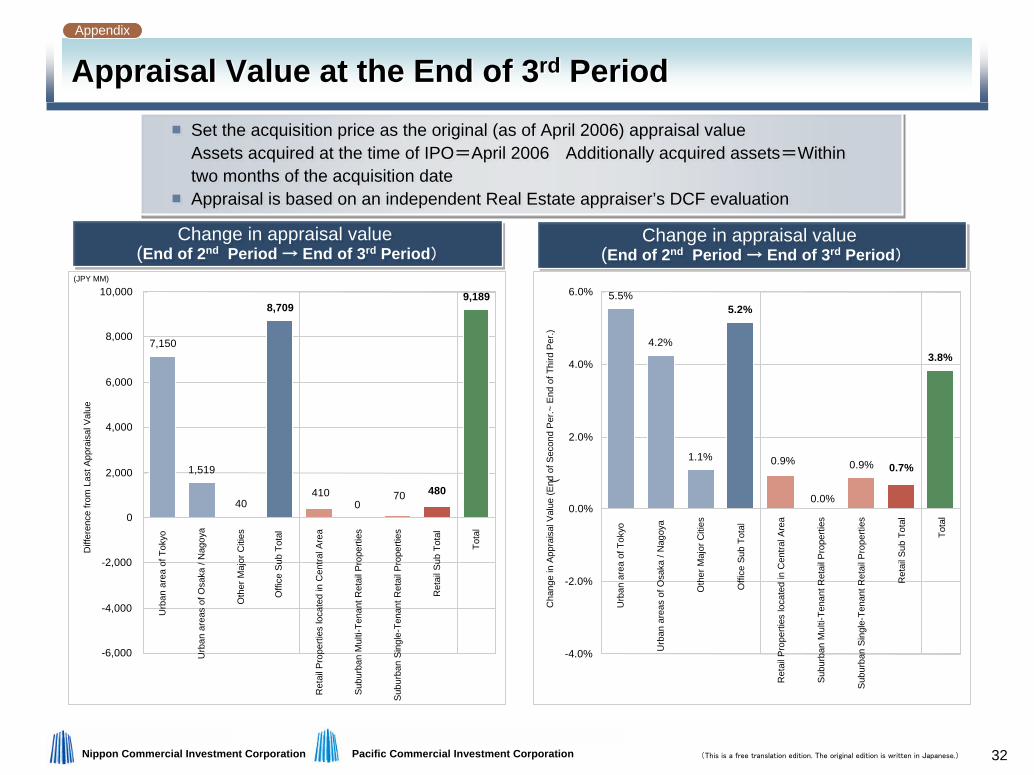
Appraisal Value at the End of 3rd Period Appraisal Value at the End of 3rd Period
Change in appraisal value (End of 2nd Period → End of 3rd Period)
Change in appraisal value (End of 2nd Period → End of 3rd Period)
Set the acquisition price as the original (as of April 2006) appraisal valueAssets acquired at the time of IPO=April 2006 Additionally acquired assets=Within two months of the acquisition dateAppraisal is based on an independent Real Estate appraiser’s DCF evaluation
Set the acquisition price as the original (as of April 2006) appraisal valueAssets acquired at the time of IPO=April 2006 Additionally acquired assets=Within two months of the acquisition dateAppraisal is based on an independent Real Estate appraiser’s DCF evaluation
7,150
1,519
40
9,1898,709
480700
410
-6,000
-4,000
-2,000
0
2,000
4,000
6,000
8,000
10,000
Diff
eren
ce fr
om L
ast A
ppra
isal
Val
ue
Urb
an a
rea
of T
okyo
Urb
an a
reas
ofO
saka
/ N
agoy
a
Oth
er M
ajor
Citi
es
Offi
ce S
ub T
otal
Ret
ail P
rope
rties
loca
ted
in C
entra
l Are
a
Sub
urba
n M
ulti-
Tena
nt R
etai
l Pro
perti
es
Sub
urba
n Si
ngle
-Ten
ant R
etai
l Pro
perti
es
Ret
ail S
ub T
otal
Tota
l
(JPY MM)
5.5%
4.2%
1.1%
5.2%
3.8%
0.7%0.9%
0.0%
0.9%
-4.0%
-2.0%
0.0%
2.0%
4.0%
6.0%
(C
hang
e in
App
rais
al V
alue
(End
of S
econ
d P
er.~
End
of T
hird
Per
.)
Urb
an a
rea
of T
okyo
Urb
an a
reas
ofO
saka
/ N
agoy
a
Oth
er M
ajor
Citi
es
Offi
ce S
ub T
otal
Ret
ail P
rope
rties
loca
ted
in C
entra
l Are
a
Sub
urba
n M
ulti-
Tena
nt R
etai
l Pro
perti
es
Sub
urba
n Si
ngle
-Ten
ant R
etai
l Pro
perti
es
Ret
ail S
ub T
otal
Tota
l
Change in appraisal value (End of 2nd Period → End of 3rd Period)
Change in appraisal value (End of 2nd Period → End of 3rd Period)
Appendix
33(This is a free translation edition. The original edition is written in Japanese.)Nippon Commercial Investment Corporation Pacific Commercial Investment Corporation
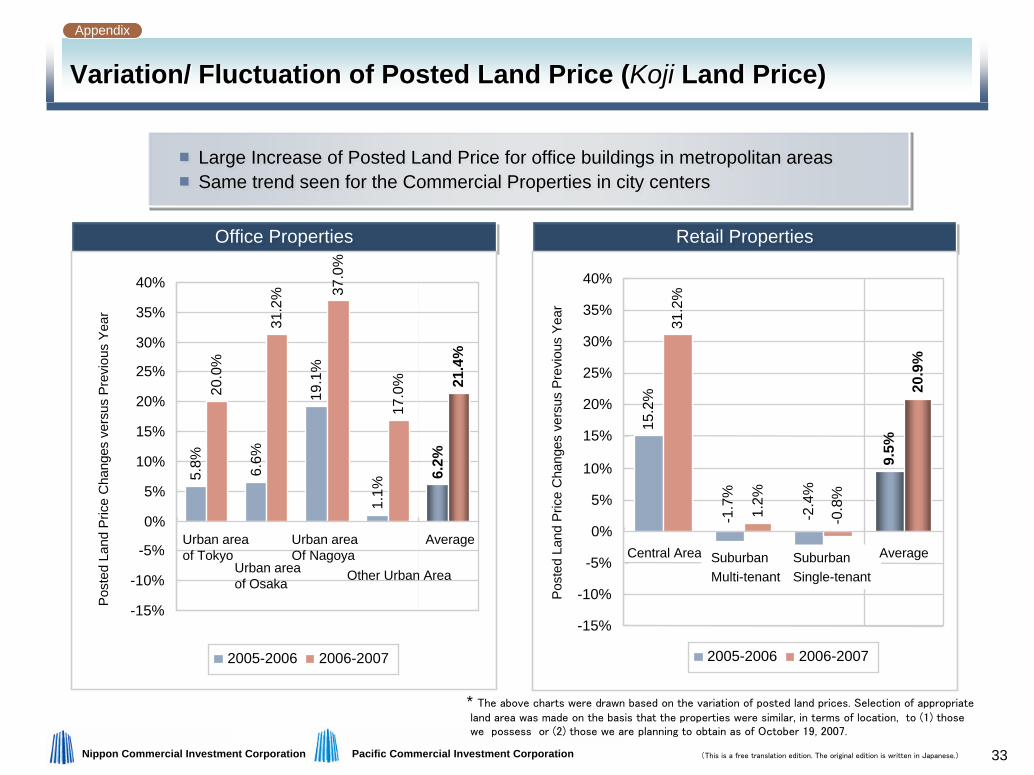
Variation/ Fluctuation of Posted Land Price (Koji Land Price)Variation/ Fluctuation of Posted Land Price (Koji Land Price)
Large Increase of Posted Land Price for office buildings in metropolitan areasSame trend seen for the Commercial Properties in city centersLarge Increase of Posted Land Price for office buildings in metropolitan areasSame trend seen for the Commercial Properties in city centers
* The above charts were drawn based on the variation of posted land prices. Selection of appropriateland area was made on the basis that the properties were similar, in terms of location, to (1) thosewe possess or (2) those we are planning to obtain as of October 19, 2007.
Office PropertiesOffice Properties
5.8% 6.6%
19.1
%
1.1%
20.0
%
31.2
% 37.0
%
17.0
%
6.2%
21.4
%
-15%
-10%
-5%
0%
5%
10%
15%
20%
25%
30%
35%
40%
2005-2006 2006-2007
Post
ed L
and
Pric
e C
hang
es v
ersu
s Pr
evio
us Y
ear
Urban area of Tokyo
Urban area of Osaka
Urban area Of Nagoya
Other Urban Area
Average
Retail PropertiesRetail Properties
15.2
%
31.2
%
1.2%
-2.4
%
-1.7
%
9.5%
-0.8
%
20.9
%
-15%
-10%
-5%
0%
5%
10%
15%
20%
25%
30%
35%
40%
2005-2006 2006-2007
Post
ed L
and
Pric
e C
hang
es v
ersu
s Pr
evio
us Y
ear
Central Areas SuburbanMulti-tenant
SuburbanSingle-tenant
Average
Appendix
34(This is a free translation edition. The original edition is written in Japanese.)Nippon Commercial Investment Corporation Pacific Commercial Investment Corporation
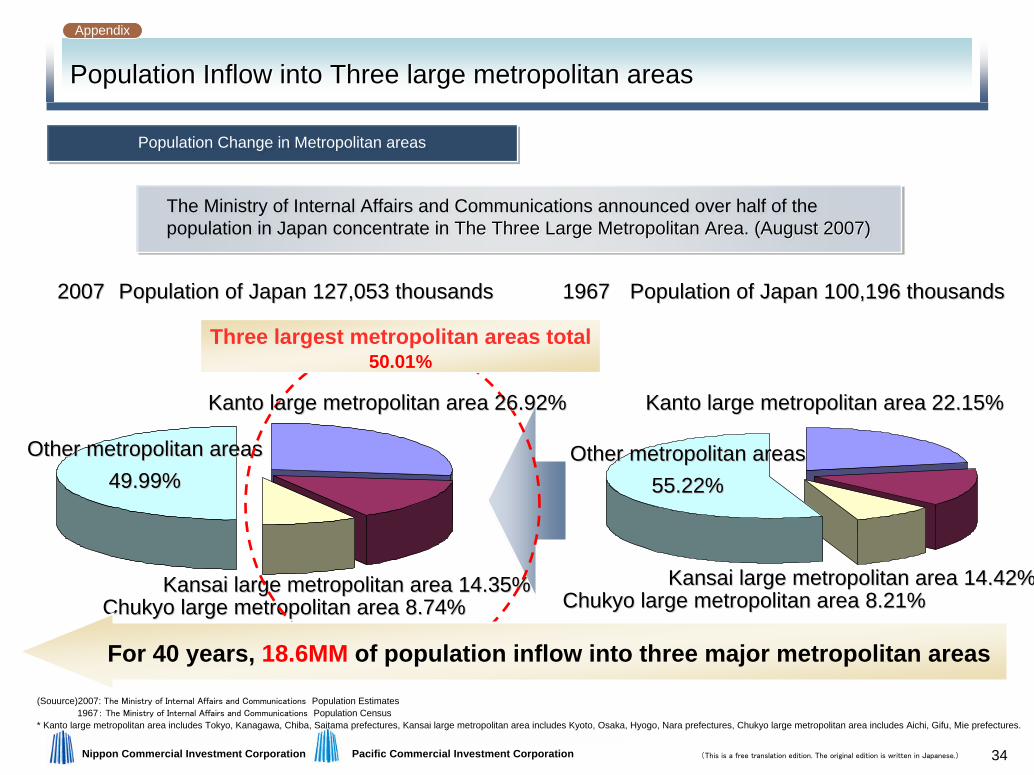
Population Inflow into Three large metropolitan areasPopulation Inflow into Three large metropolitan areas
Population Change in Metropolitan areasPopulation Change in Metropolitan areas
(Souurce)2007: The Ministry of Internal Affairs and Communications Population Estimates 1967: The Ministry of Internal Affairs and Communications Population Census
* Kanto large metropolitan area includes Tokyo, Kanagawa, Chiba, Saitama prefectures, Kansai large metropolitan area includes Kyoto, Osaka, Hyogo, Nara prefectures, Chukyo large metropolitan area includes Aichi, Gifu, Mie prefectures.
The Ministry of Internal Affairs and Communications announced over half of the population in Japan concentrate in The Three Large Metropolitan Area. (August 2007)The Ministry of Internal Affairs and Communications announced over half of the population in Japan concentrate in The Three Large Metropolitan Area. (August 2007)The Three Large Metropolitan Area. (August 2007)
19671967 Population of Japan 100,196 thousandsPopulation of Japan 100,196 thousands20072007 Population of Japan 127,053 thousandsPopulation of Japan 127,053 thousands
Kanto large metropolitan areaKanto large metropolitan area 22.15%22.15%
Kansai large metropolitan areaKansai large metropolitan area 14.35%14.35% Kansai large metropolitan areaKansai large metropolitan area 14.42%14.42%Chukyo large metropolitan areaChukyo large metropolitan area 8.74%8.74% Chukyo large metropolitan areaChukyo large metropolitan area 8.21%8.21%
Other metropolitan areasOther metropolitan areas49.99%49.99%
Other metropolitan areasOther metropolitan areas55.22%55.22%
Three largest metropolitan areas total50.01%
For 40 years, 18.6MM of population inflow into three major metropolitan areas
Kanto large metropolitan area Kanto large metropolitan area 26.92%26.92%
Appendix
35(This is a free translation edition. The original edition is written in Japanese.)Nippon Commercial Investment Corporation Pacific Commercial Investment Corporation
21,161
19,310
17,954 19,40619,998
19,75419,844
20,858
21,61621,789
23,612
17,577
17,844
2.59
2.894.22
6.10
8.127.36
3.174.03
5.045.17
3.774.11
6.14
15,000
16,000
17,000
18,000
19,000
20,000
21,000
22,000
23,000
24,000
25,000
1995 1996 1997 1998 1999 2000 2001 2002 2003 2004 2005 2006 20070.0
1.0
2.0
3.0
4.0
5.0
6.0
7.0
8.0
9.0
10.0Av erage monthly rental rates f or new tenants (y en/tsubo)
Vacancy rate (%)
Av erage monthly rental rates f ornew tenants (y en/tsubo) Vacancy rate (%)
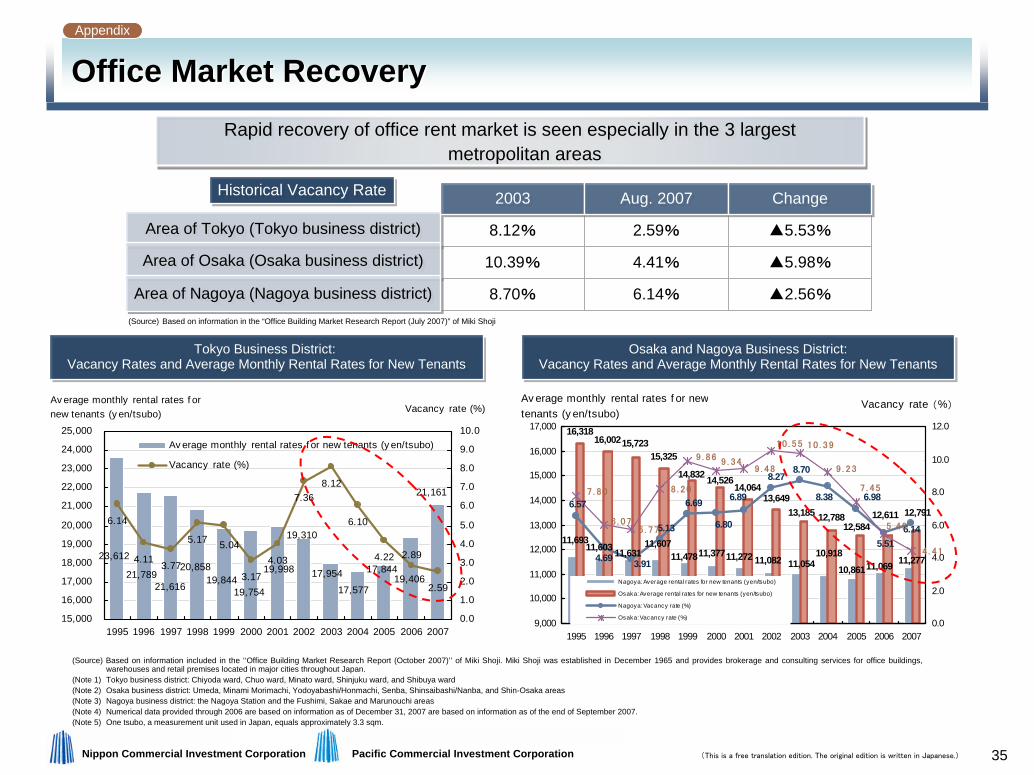
Office Market RecoveryOffice Market Recovery
Historical Vacancy RateHistorical Vacancy Rate
8.12%
10.39%
8.70%
2.59%
4.41%
6.14%
▲5.53%
▲5.98%
▲2.56%
Area of Tokyo (Tokyo business district)Area of Tokyo (Tokyo business district)
Area of Osaka (Osaka business district)Area of Osaka (Osaka business district)
Area of Nagoya (Nagoya business district)Area of Nagoya (Nagoya business district)
20032003 Aug. 2007Aug. 2007 ChangeChange
(Source) Based on information included in the ‘‘Office Building Market Research Report (October 2007)’’ of Miki Shoji. Miki Shoji was established in December 1965 and provides brokerage and consulting services for office buildings,warehouses and retail premises located in major cities throughout Japan.
(Note 1) Tokyo business district: Chiyoda ward, Chuo ward, Minato ward, Shinjuku ward, and Shibuya ward(Note 2) Osaka business district: Umeda, Minami Morimachi, Yodoyabashi/Honmachi, Senba, Shinsaibashi/Nanba, and Shin-Osaka areas(Note 3) Nagoya business district: the Nagoya Station and the Fushimi, Sakae and Marunouchi areas(Note 4) Numerical data provided through 2006 are based on information as of December 31, 2007 are based on information as of the end of September 2007.(Note 5) One tsubo, a measurement unit used in Japan, equals approximately 3.3 sqm.
Osaka and Nagoya Business District:Vacancy Rates and Average Monthly Rental Rates for New Tenants
Osaka and Nagoya Business District:Vacancy Rates and Average Monthly Rental Rates for New Tenants
11,60311,277
10,91811,27211,607
11,63111,693
10,86111,05411,08211,37711,478
11,069
13,64914,064
14,52614,832
15,32515,72316,002
16,318
13,185 12,78812,584
12,611 12,791
8 . 20
9 . 48
4 . 41
6.14
6.988.38
8.708.27
6.89
6.80
6.69
5.13
3.914.69
6.57
5.515 . 77
6 . 07
7 . 80
10 . 3910 . 55
9 . 239 . 34
9 . 86
5 . 49
7 . 45
9,000
10,000
11,000
12,000
13,000
14,000
15,000
16,000
17,000
1995 1996 1997 1998 1999 2000 2001 2002 2003 2004 2005 2006 20070.0
2.0
4.0
6.0
8.0
10.0
12.0
Nagoya: Average rental rates for new tenants (yen/tsubo)
Osaka: Average rental rates for new tenants (yen/tsubo)
Nagoya: Vacancy rate (%)
Osaka: Vacancy rate (%)
Av erage monthly rental rates f or newtenants (y en/tsubo)
Vacancy rate (%)
Rapid recovery of office rent market is seen especially in the 3 largest metropolitan areas
Rapid recovery of office rent market is seen especially in the 3 largest metropolitan areas
Tokyo Business District: Vacancy Rates and Average Monthly Rental Rates for New Tenants
Tokyo Business District: Vacancy Rates and Average Monthly Rental Rates for New Tenants
(Source) Based on information in the “Office Building Market Research Report (July 2007)” of Miki Shoji
Appendix
36(This is a free translation edition. The original edition is written in Japanese.)Nippon Commercial Investment Corporation Pacific Commercial Investment Corporation
DisclaimerDisclaimer
These materials do not constitute or form a part of a disclosure document or operational report required by or based on the Financial Instruments and Exchange Law of Japan, the Investment Trusts and Investment Corporations Law of Japan or Cabinet Office ordinance or regulations thereunder, Tokyo Stock Exchange listing regulations or other related rules and regulations.
These materials contain forward-looking statements. These statements are based on certain assumptions and judgments made on the basis of currently available information. Such statements may involve unknown risks and uncertainties, and may be affected by such risks, uncertainties, assumptions and other factors. Accordingly, these statements are not guarantees of performance, results of operations, financial conditions, etc., of Nippon Commercial Investment Corporation. Actual results may vary materially from future performance, results of operation, financial conditions, etc. that are expressed or implied by such forward-looking statements.
While every reasonable effort is undertaken to ensure the accuracy and reliability of the information contained in these materials, Nippon Commercial Investment Corporation and Pacific Commercial Investment Corporation makes no warranties or representations as to the accuracy, certainty, validity or fairness with respect to such information and the information is subject to revision or retraction without prior notice.
No information presented in these materials may be reproduced, distributed or otherwise used in any way without prior consent.
These materials, including summary notes, quotes, data and other information, are provided solely for informational purposes and not intended for the purpose of soliciting investment in, or as a recommendation to purchase or sell, any specific products including our investment units.
Asset Manager: Pacific Commercial Investment CorporationFinancial Instruments Dealer, Kanto Financial Bureau (Kin-sho) No. 377