of moss and men: using moss as a bioindicator of toxic ... · of moss and men: using moss as a...
TRANSCRIPT
“Science affects the way we think together.”Lewis Thomas
F I N D I N G S
I N S U M M A R YAir quality is a critical issue affecting the health of billions of people world-wide, yet often little is known about what is in the air we breathe. To reduce air pollution’s health impacts, pollution sources must first be reliably identified. Otherwise, it is impossible to design and effectively enforce environmental standards. However, urban networks of air quality monitors are often too widely spaced to identify the sources of air pollutants, especially for pollut-ants that do not disperse far from their sources. Developing high-resolution pollution maps with data from these widely spaced monitors is problematic.
In a recent study, scientists with the U.S. Forest Service Pacific Northwest Research Station tested a common tree moss for the presence of heavy metals at 346 locations in Portland, Oregon. The study yielded fine-scale maps show-ing air pollution distribution across the city at a level of spatial detail that had never been seen. The maps revealed two sources of cadmium that were emitting levels of pollutants many times higher than state health benchmarks. The Port-land moss study raised awareness of heavy metal pollution and the inad-equacy of current air monitoring net-works for detecting toxic emissions.
DEPAR TMENT OF AGRICULT URE
United States Department of AgricultureForest Service
issue two hundred five / march 2018
I N S I D EMining moss data................................................. 2Hotspots................................................................. 3Direct impact........................................................ 4
PNWPacif ic NorthwestResearch Station
Of Moss and Men: Using Moss as a Bioindicator of Toxic Heavy Metals at the City Scale
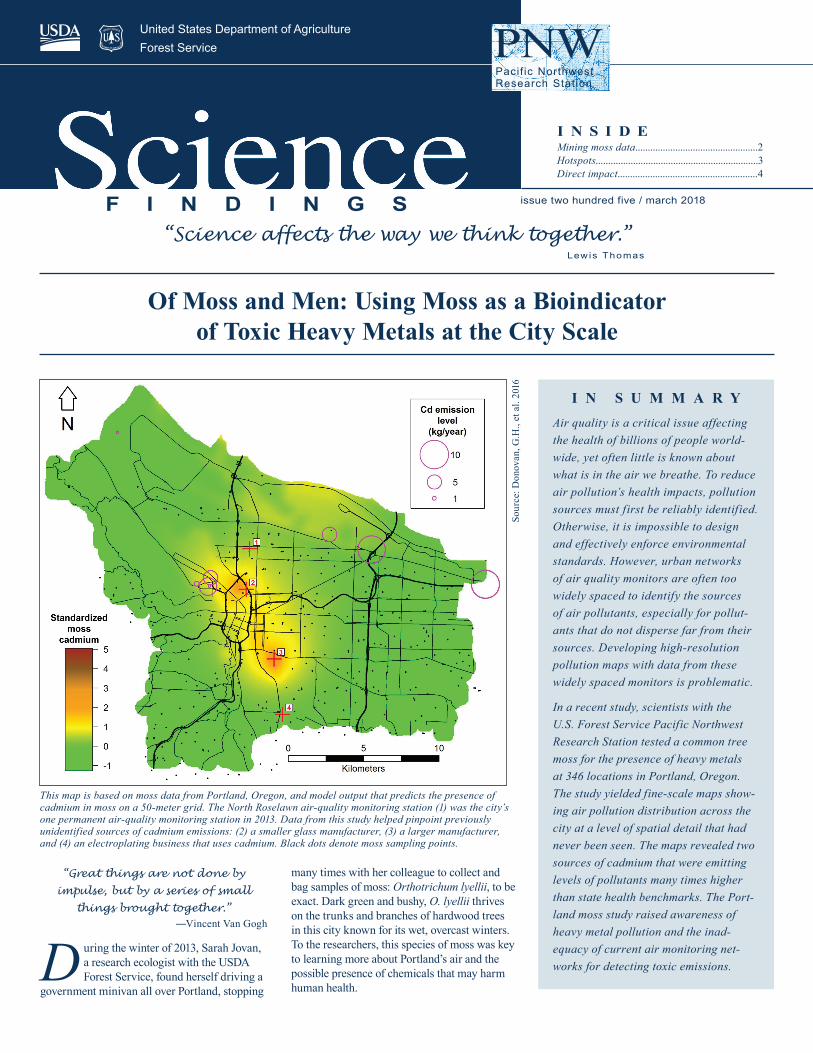
This map is based on moss data from Portland, Oregon, and model output that predicts the presence of cadmium in moss on a 50-meter grid. The North Roselawn air-quality monitoring station (1) was the city’s one permanent air-quality monitoring station in 2013. Data from this study helped pinpoint previously unidentified sources of cadmium emissions: (2) a smaller glass manufacturer, (3) a larger manufacturer, and (4) an electroplating business that uses cadmium. Black dots denote moss sampling points.
Sour
ce: D
onov
an, G
.H.,
et a
l. 20
16
“Great things are not done by
impulse, but by a series of small
things brought together.”―Vincent Van Gogh
D uring the winter of 2013, Sarah Jovan, a research ecologist with the USDA Forest Service, found herself driving a
government minivan all over Portland, stopping
many times with her colleague to collect and bag samples of moss: Orthotrichum lyellii, to be exact. Dark green and bushy, O. lyellii thrives on the trunks and branches of hardwood trees in this city known for its wet, overcast winters. To the researchers, this species of moss was key to learning more about Portland’s air and the possible presence of chemicals that may harm human health.

2
Purpose of PNW Science FindingsTo provide scientific information to people who make and influence decisions about managing land.
PNW Science Findings is published monthly by:
Pacific Northwest Research Station USDA Forest Service P.O. Box 3890 Portland, Oregon 97208
Send new subscription and change of address information to: [email protected]
Rhonda Mazza, editor; [email protected] Jennings, layout; [email protected]
Science Findings is online at: http://www.fs.fed.us/pnw/publications/scif i.shtml
To receive this publication electronically, change your delivery preference here:
http://www.fs.fed.us/pnw/publications/subscription.shtml
United States Department of Agriculture
Forest Service
K E Y F I N D I N G S
• The study found high levels of cadmium and arsenic in moss around art glass manu- facturers in Portland that were not known to regulators as sources. Heavy metals are used as pigments in art glass furnaces.
• The fine-scale pollution maps also revealed high nickel levels in one Portland neighborhood.
• The researchers found over a dozen smaller hotspots of heavy metals in moss in various neighborhoods, including several with high levels of multiple top-priority metals, such as arsenic, cadmium, chromium, cobalt, nickel, and lead.
Jovan works at the Pacific Northwest (PNW) Research Station and studies lichens and bryo-phytes—such as liverworts, hornworts, and mosses—and their roles as biological indica-tors of air quality. “People don’t tend to know much about them or notice them,” Jovan says. “But they are just fascinating. Moss are these beautiful little plants with leaves that are just one cell thick. I just like these oddball, lesser understood organisms.” Jovan’s winter moss sampling was part of an ambitious study that ultimately enabled the study team to use moss data to produce fine-scale maps of heavy met-al pollution, including cadmium in Portland.
“Initially I wanted to use lichens,” she says. “But there are areas in Portland where the air quality is compromised enough that even the most tolerant lichens don’t grow. What is neat about this moss is that it seems impervious to everything. It doesn’t mind growing right underneath the highway near a factory. It’s amazingly tolerant!”
The researchers measured 22 elements in moss but focused on cadmium first. The Oregon Department of Environmental Quality (DEQ) requested that Jovan and her co-lead Geoffrey Donovan, also with PNW Research Station, be on the lookout for high concen-trations of cadmium, a heavy metal used primarily in manufacturing nickel-cadmium batteries, and to a lesser degree in electroplat-ing and producing pigments used in glass manufacturing. Back in 2011, Oregon DEQ monitors had sensed curious concentrations of cadmium in Portland’s air, but could not pinpoint its source. Exposure to elevated lev-els of cadmium can cause cancer and kidney disease.
Mining moss data Scientists have used moss as biological indica-tors of air pollution since the late 1960s. Past studies have shown that levels of pollutants in moss correlate with atmospheric air pollu-tion measured by instruments, suggesting that moss can complement existing networks of air quality monitors.
And because moss is plentiful in Portland, this study would essentially take advantage of hundreds of fuzzy, green air quality monitors all over the city. Unlike most plants that absorb nutrients through their roots, mosses have root-like filaments that merely anchor them to trees or rocks. Instead, the plants absorb nutrients and water from the atmosphere through their gametophytes—networks of stem-like and leaf-like structures. Mosses also do not have a protective epidermis, so they absorb water, nutrients, and pollutants like a sponge.
Moss like this Orthotrichum lyellii thrives on hardwood trees in Portland, Oregon. Moss absorbs moisture, nutrients, and pollutants from the air. Moss tissue can serve as a living record of local pollution levels.
Sara
h Jo
van
Forest Service researcher Sarah Jovan collects samples of the common tree moss Orthotrichum lyellii from a tree in Portland, Oregon.
Mar
ie C
arve
r
At the time of the study, Oregon DEQ mea-sured daily air pollution using one permanent air quality monitor in Portland and two mobile monitors. That they had only one permanent monitor is not surprising. The instrument costs more than $50,000 to operate annu-ally. And with only one main and two mobile monitors, Oregon DEQ could only make air quality measurements on a region-wide scale. The instruments are just too few to make mea-surements that would point to the source of a pollutant. In contrast, the moss study team collected multiple samples of moss all over Portland, so they anticipated being able to describe pollution levels at a much finer and detailed scale. “It would cost over $17 million to use instruments at the same spatial resolu-tion as the moss,” Jovan says.
“We’re taking a snapshot,” Jovan adds. “Moss samples reflect several months to a year or
more of air quality.” Although air quality mon-itors can detect concentrations of heavy metals and plot trends in pollution levels through time,
3
moss data can help pinpoint sources of the pol-lutants. However, moss data can’t tell us about potential health effects like a monitor can.
In part, the success of this groundbreaking study was the variety of expertise that was ultimately folded into the team. To ensure their sampling method would enable them to develop a robust model for predicting pollution levels, Jovan and Donovan enlisted the help of Vicente Monleon. A research mathematical statistician with the PNW Research Station, Monleon developed the sampling design for collecting the moss.
“Developing these models requires informa-tion from points that are a variety of distances from each other and, particularly, at close distances,” Monleon explains. “So, we had a 1-km ‘base’ grid, but we added points at ran-domly selected shorter distances to be able to estimate this spatial correlation—the degree to which one data point is similar to another based on proximity. We also added additional points to estimate the measurement error. And we extended the grid a bit outside the city lim-its to add a buffer and avoid edge effects.”
Demetrios Gatziolis was another key member of the team. Gatziolis is a research forester with the PNW Research Station who spe-cializes in remote sensing and geographic information systems. “I was brought in to lend expertise on doing some of the spatial analysis,” he explains. More than just map-ping, this involved building models that could project expected levels of pollution while accounting for the influence of other variables on a data point. To facilitate this, the research-ers collected a variety of data along with the moss samples. For example, because rain can wash off particulate pollutants in moss, and temperature influences moss metabolism, the
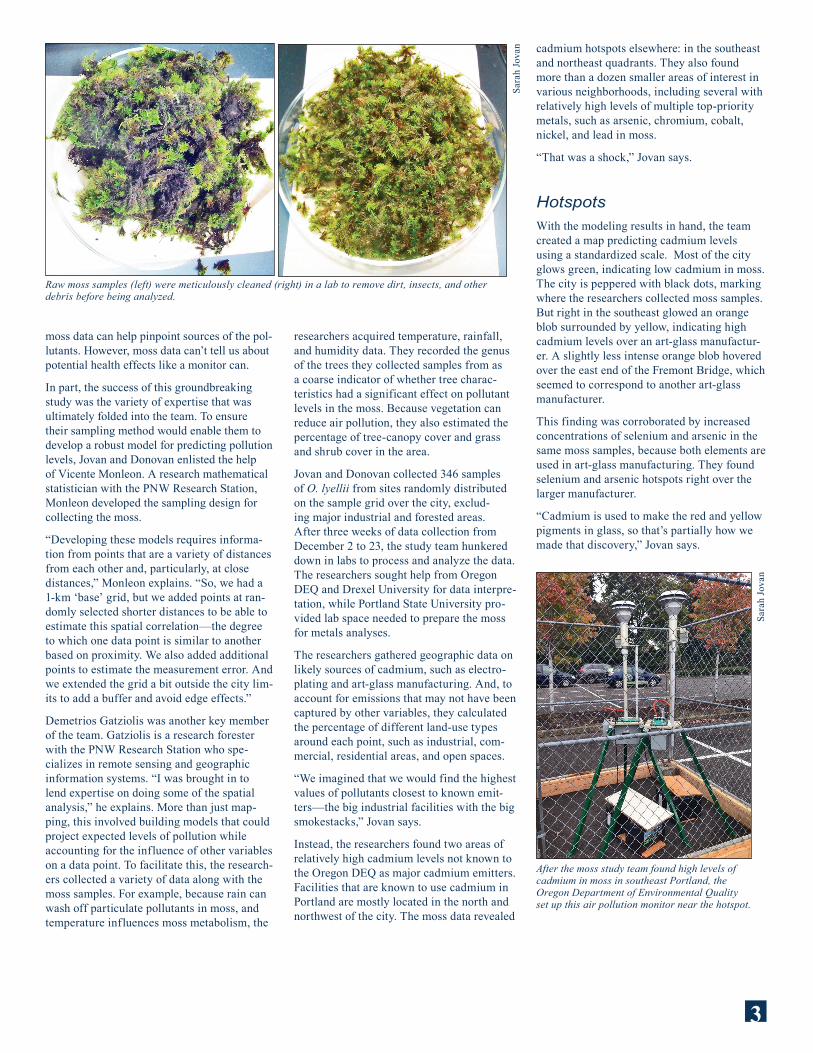
Raw moss samples (left) were meticulously cleaned (right) in a lab to remove dirt, insects, and other debris before being analyzed.
Sara
h Jo
van
researchers acquired temperature, rainfall, and humidity data. They recorded the genus of the trees they collected samples from as a coarse indicator of whether tree charac-teristics had a significant effect on pollutant levels in the moss. Because vegetation can reduce air pollution, they also estimated the percentage of tree-canopy cover and grass and shrub cover in the area.
Jovan and Donovan collected 346 samples of O. lyellii from sites randomly distributed on the sample grid over the city, exclud-ing major industrial and forested areas. After three weeks of data collection from December 2 to 23, the study team hunkered down in labs to process and analyze the data. The researchers sought help from Oregon DEQ and Drexel University for data interpre-tation, while Portland State University pro-vided lab space needed to prepare the moss for metals analyses.
The researchers gathered geographic data on likely sources of cadmium, such as electro-plating and art-glass manufacturing. And, to account for emissions that may not have been captured by other variables, they calculated the percentage of different land-use types around each point, such as industrial, com-mercial, residential areas, and open spaces.
“We imagined that we would find the highest values of pollutants closest to known emit-ters—the big industrial facilities with the big smokestacks,” Jovan says.
Instead, the researchers found two areas of relatively high cadmium levels not known to the Oregon DEQ as major cadmium emitters. Facilities that are known to use cadmium in Portland are mostly located in the north and northwest of the city. The moss data revealed
cadmium hotspots elsewhere: in the southeast and northeast quadrants. They also found more than a dozen smaller areas of interest in various neighborhoods, including several with relatively high levels of multiple top-priority metals, such as arsenic, chromium, cobalt, nickel, and lead in moss.
“That was a shock,” Jovan says.
HotspotsWith the modeling results in hand, the team created a map predicting cadmium levels using a standardized scale. Most of the city glows green, indicating low cadmium in moss. The city is peppered with black dots, marking where the researchers collected moss samples. But right in the southeast glowed an orange blob surrounded by yellow, indicating high cadmium levels over an art-glass manufactur-er. A slightly less intense orange blob hovered over the east end of the Fremont Bridge, which seemed to correspond to another art-glass manufacturer.
This finding was corroborated by increased concentrations of selenium and arsenic in the same moss samples, because both elements are used in art-glass manufacturing. They found selenium and arsenic hotspots right over the larger manufacturer.
“Cadmium is used to make the red and yellow pigments in glass, so that’s partially how we made that discovery,” Jovan says.
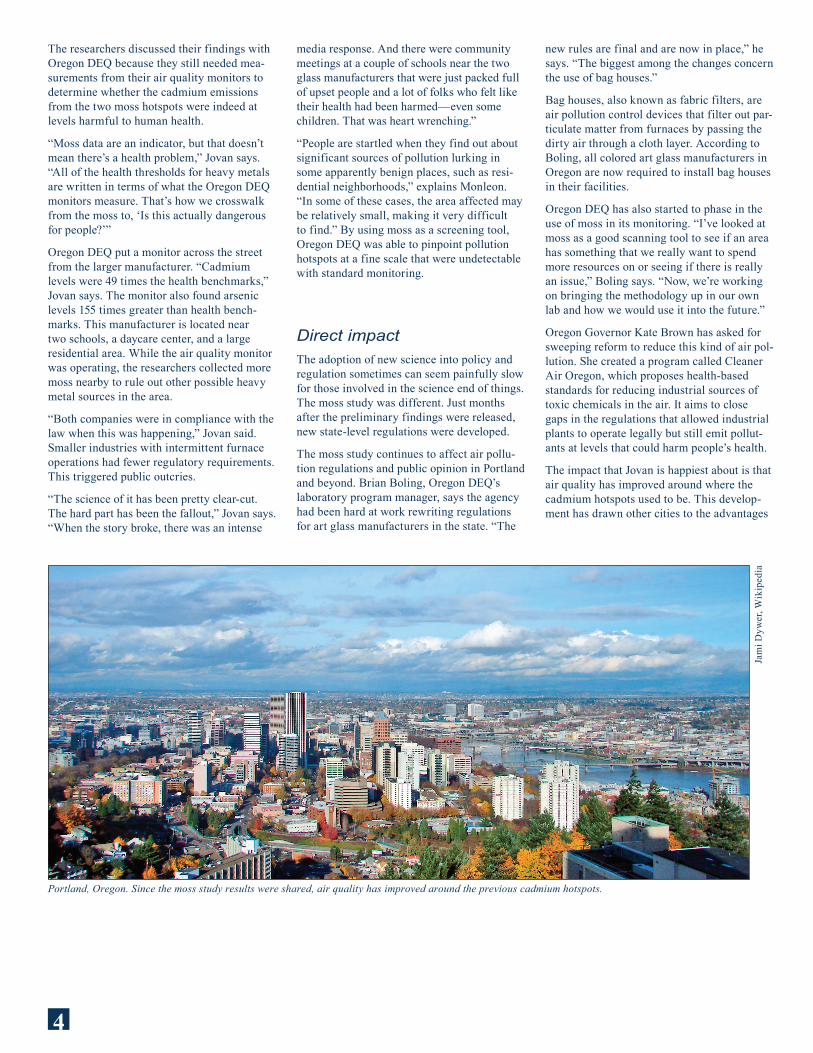
After the moss study team found high levels of cadmium in moss in southeast Portland, the Oregon Department of Environmental Quality set up this air pollution monitor near the hotspot.
Sara
h Jo
van
4
The researchers discussed their findings with Oregon DEQ because they still needed mea-surements from their air quality monitors to determine whether the cadmium emissions from the two moss hotspots were indeed at levels harmful to human health.
“Moss data are an indicator, but that doesn’t mean there’s a health problem,” Jovan says. “All of the health thresholds for heavy metals are written in terms of what the Oregon DEQ monitors measure. That’s how we crosswalk from the moss to, ‘Is this actually dangerous for people?’”
Oregon DEQ put a monitor across the street from the larger manufacturer. “Cadmium levels were 49 times the health benchmarks,” Jovan says. The monitor also found arsenic levels 155 times greater than health bench-marks. This manufacturer is located near two schools, a daycare center, and a large residential area. While the air quality monitor was operating, the researchers collected more moss nearby to rule out other possible heavy metal sources in the area.
“Both companies were in compliance with the law when this was happening,” Jovan said. Smaller industries with intermittent furnace operations had fewer regulatory requirements. This triggered public outcries.
“The science of it has been pretty clear-cut. The hard part has been the fallout,” Jovan says. “When the story broke, there was an intense
Direct impact The adoption of new science into policy and regulation sometimes can seem painfully slow for those involved in the science end of things. The moss study was different. Just months after the preliminary findings were released, new state-level regulations were developed.
The moss study continues to affect air pollu-tion regulations and public opinion in Portland and beyond. Brian Boling, Oregon DEQ’s laboratory program manager, says the agency had been hard at work rewriting regulations for art glass manufacturers in the state. “The
new rules are final and are now in place,” he says. “The biggest among the changes concern the use of bag houses.”
Bag houses, also known as fabric filters, are air pollution control devices that filter out par-ticulate matter from furnaces by passing the dirty air through a cloth layer. According to Boling, all colored art glass manufacturers in Oregon are now required to install bag houses in their facilities.
Oregon DEQ has also started to phase in the use of moss in its monitoring. “I’ve looked at moss as a good scanning tool to see if an area has something that we really want to spend more resources on or seeing if there is really an issue,” Boling says. “Now, we’re working on bringing the methodology up in our own lab and how we would use it into the future.”
Oregon Governor Kate Brown has asked for sweeping reform to reduce this kind of air pol-lution. She created a program called Cleaner Air Oregon, which proposes health-based standards for reducing industrial sources of toxic chemicals in the air. It aims to close gaps in the regulations that allowed industrial plants to operate legally but still emit pollut-ants at levels that could harm people’s health.
The impact that Jovan is happiest about is that air quality has improved around where the cadmium hotspots used to be. This develop-ment has drawn other cities to the advantages
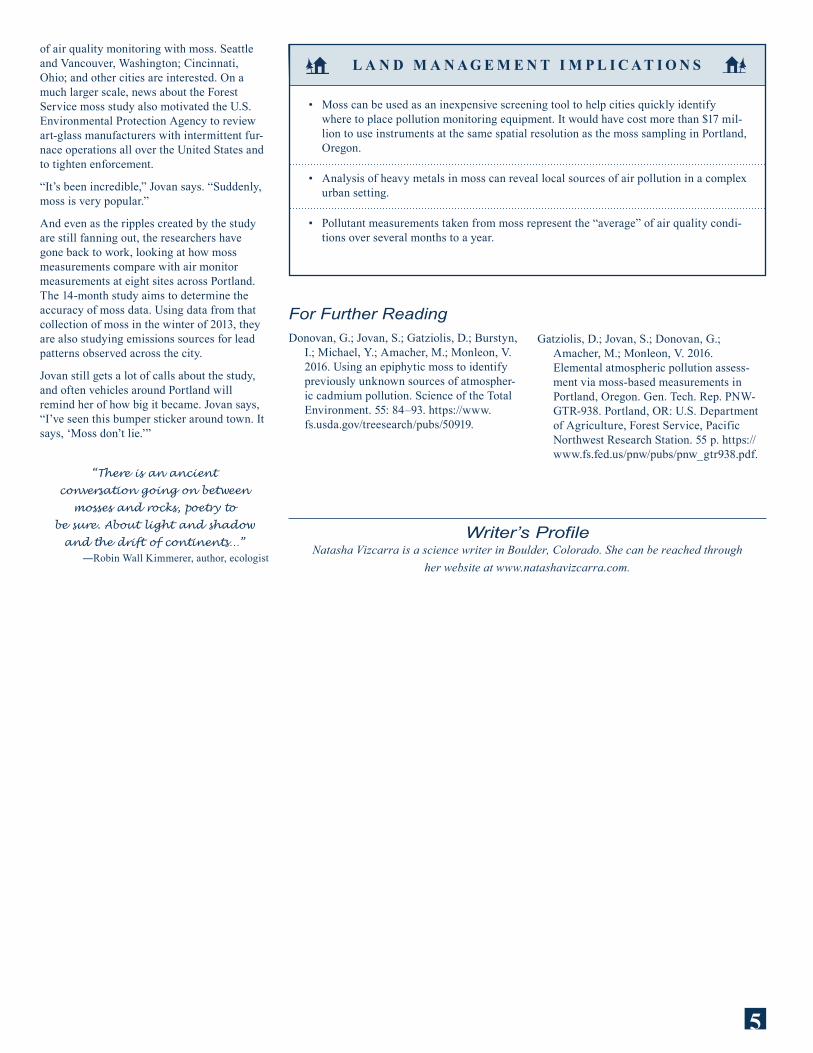
Portland, Oregon. Since the moss study results were shared, air quality has improved around the previous cadmium hotspots.
Jam
i Dyw
er, W
ikip
edia
media response. And there were community meetings at a couple of schools near the two glass manufacturers that were just packed full of upset people and a lot of folks who felt like their health had been harmed—even some children. That was heart wrenching.”
“People are startled when they find out about significant sources of pollution lurking in some apparently benign places, such as resi-dential neighborhoods,” explains Monleon. “In some of these cases, the area affected may be relatively small, making it very difficult to find.” By using moss as a screening tool, Oregon DEQ was able to pinpoint pollution hotspots at a fine scale that were undetectable with standard monitoring.
5
Writer’s ProfileNatasha Vizcarra is a science writer in Boulder, Colorado. She can be reached through
her website at www.natashavizcarra.com.
L A N D M A N A G E M E N T I M P L I C A T I O N S
• Moss can be used as an inexpensive screening tool to help cities quickly identify where to place pollution monitoring equipment. It would have cost more than $17 mil-lion to use instruments at the same spatial resolution as the moss sampling in Portland, Oregon.
• Analysis of heavy metals in moss can reveal local sources of air pollution in a complex urban setting.
• Pollutant measurements taken from moss represent the “average” of air quality condi-tions over several months to a year.
of air quality monitoring with moss. Seattle and Vancouver, Washington; Cincinnati, Ohio; and other cities are interested. On a much larger scale, news about the Forest Service moss study also motivated the U.S. Environmental Protection Agency to review art-glass manufacturers with intermittent fur-nace operations all over the United States and to tighten enforcement.
“It’s been incredible,” Jovan says. “Suddenly, moss is very popular.”
And even as the ripples created by the study are still fanning out, the researchers have gone back to work, looking at how moss measurements compare with air monitor measurements at eight sites across Portland. The 14-month study aims to determine the accuracy of moss data. Using data from that collection of moss in the winter of 2013, they are also studying emissions sources for lead patterns observed across the city.
Jovan still gets a lot of calls about the study, and often vehicles around Portland will remind her of how big it became. Jovan says, “I’ve seen this bumper sticker around town. It says, ‘Moss don’t lie.’”
“There is an ancient
conversation going on between
mosses and rocks, poetry to
be sure. About light and shadow
and the drift of continents…” ―Robin Wall Kimmerer, author, ecologist
For Further ReadingDonovan, G.; Jovan, S.; Gatziolis, D.; Burstyn,
I.; Michael, Y.; Amacher, M.; Monleon, V. 2016. Using an epiphytic moss to identify previously unknown sources of atmospher-ic cadmium pollution. Science of the Total Environment. 55: 84–93. https://www.fs.usda.gov/treesearch/pubs/50919.
Gatziolis, D.; Jovan, S.; Donovan, G.; Amacher, M.; Monleon, V. 2016. Elemental atmospheric pollution assess-ment via moss-based measurements in Portland, Oregon. Gen. Tech. Rep. PNW-GTR-938. Portland, OR: U.S. Department of Agriculture, Forest Service, Pacific Northwest Research Station. 55 p. https://www.fs.fed.us/pnw/pubs/pnw_gtr938.pdf.
F I N D I N G S
U.S. Department of AgriculturePacific Northwest Research Station1220 SW Third AvenueP.O. Box 3890Portland, OR 97208-3890
Official BusinessPenalty for Private Use, $300
PRSRT STD US POSTAGE
PAID PORTLAND OR
PERMIT N0 G-40
“USDA is an equal opportunity provider, employer, and lender.”
Scientist Profiles
SARAH JOVAN is a lichenolo-gist and research ecologist with the Pacific Northwest Research Station. Her research focuses on the use of nonvascular organisms, such as lichens and
bryophytes, as bioindicators of air quality and climate change. Jovan received her Ph.D. in ecology from Oregon State University.
DEMETRIOS GATZIOLIS is a research forester with the Pacific Northwest Research Station. He conducts research on applications of remote sensing technologies, spatial modeling, systems analysis,
and geographic information science. He spe-cializes in the integration of remotely sensed and Forest Inventory and Analysis program data, and the development of inventory tech-niques. Gatziolis has a Ph.D. in forestry from Michigan State University.
Jovan and Gatziolis can be reached at:
USDA Forest Service Pacific Northwest Research Station 620 SW Main St. Suite 400 Portland, OR 97205
Jovan: (503) 808-2070 E-mail: [email protected]
Gatziolis: (503) 808-2038 E-mail: [email protected]
VICENTE MONLEON is a research mathe-matical statistician with the Pacific Northwest Research Station. He conducts research on statistical methods for forest inventory and monitoring, and in applications of large-scale inventory data to address ecological and man-agement problems. Monleon has a Ph.D. in statistics from Oregon State University.
Monleon can be reached at:
USDA Forest Service Pacific Northwest Research Station 3200 SW Jefferson Way Corvallis, OR 97331
Phone: (541) 750-7299 E-mail: [email protected]
CollaboratorsIgor Burstyn and Yvonne L. Michael, Drexel University, Philadelphia, PA
Michael Amacher, retired, USDA Forest Service, Forest Sciences Laboratory, Logan, UT