portfolio monitor - dhs financialdhsfinancial.com/wp-content/uploads/2014/11/11-04... · portfolio...
TRANSCRIPT

Portfolio Monitor
Monthly Report for Matthew Tae
November 04, 2014
2014 Thesis Portfolio
?© 2013 Morningstar, Inc. All Rights Reserved. The information contained herein: (1) is proprietary to Morningstar and/or its content providers; (2) may not be copied or distributed to any third party; (3) is not warranted to be accurate, complete or timely; (4) is only forpersonal, noncommercial use of the individual generating it; (5) does not constitute investment advice of any kind; (6) is being furnished by Morningstar solely in its capacity as a third-party research provider; and (7) may not be used as sale literature of any kind.

Market Value
0
29
58
87
$116K
12-13 01-14 02-14 03-14 04-14 05-14 06-14 07-14 08-14 09-14 10-14 11-14
$3,066K
2,555
2,044
1,533
1,022
511
Years 5 10 20 30
75% Chance 116,752 143,930 234,466 397,141
50% Chance 155,425 215,715 415,526 800,415
25% Chance 206,910 323,303 736,403 1,613,190
Generated on November 04, 2014
Performance Overview | 2014 Thesis Portfolio | October 05, 2014 - November 04, 2014
2014 Thesis Portfolio
Personal Personal Return % of Mutual Fund ReportingMorningstar Rating This Period Outperformed Period
. 0.11% — —
Portfolio Performance
1-Wk 1-Mo 3-Mo YTD 1-Yr 3-Yr* 5-Yr* 10-Yr* Sin. Purch*
Total Return % 0.17 –0.93 2.10 12.17 — — — — 12.17
Personal Return % 1.14 0.11 3.70 13.48 — — — — 13.48
US Market Index Return % 0.90 2.03 3.14 8.72 — — — — 8.72
*Annualized
Top 5 GainersName Morningstar Rating Price $ Market Value $ 1-Mo Return %
Bristol-Myers Squibb Company x QQ 57.88 0.00 13.68
Apple Inc QQQ 108.16 5,408.00 8.75
Kroger Co Q 56.75 2,837.50 7.32
SPDR® S&P 500 ETF QQQQ 200.22 48,052.80 2.62
Top 5 LosersName Morningstar Rating Price $ Market Value $ 1-Mo Return %
Twitter Inc h QQQ 40.77 4,077.00 –10.25
Health Care Select Sector SPDR ... QQQ 67.03 0.00 –9.29
Financial Select Sector SPDR® ... QQ 23.77 0.00 –8.93
Molson Coors Brewing Co QQ 74.00 0.00 –7.27
Cedar Fair LP . 47.75 0.00 –6.48
Potential Value in 5, 10, 20 and 30 Years
Previous Balance $ 111,502.76
New Net Investment $ 400.28
Gain/Loss $ –979.38
Current Balance $ 111,986.38
Re-Invested Dividends $ 0.00
Re-Invested Interest $ 0.00Dividend $ (Top 10)
EPD 18.25
Total 18.25
Capital Gain/Loss $ (Top 10)
TWTR 1,172.25
XLV –350.00
XLF –220.00
TAP –107.60
FUN –90.60
C –9.00
EPD –68.63
AMLP –6.50
IBB –66.30
XLK –148.50
Total 1,062.71
In this section we provide ahypothetical outlook on your portfolio’sfuture performance highlighting thepercent chance of achieving the valueswe project.
?
Page 2 of 68

14 33 34
3 3 6
1 1 1
LargeM
edSm
all
Value Core Growth
Size
Valuation
0 0 0
0 0 0
0 0 0
HighM
edLow
Ltd Mod Ext
Credit Quality
Interest Rate Sensitivity
Generated on November 04, 2014
Portfolio X-Ray | 2014 Thesis Portfolio | October 05, 2014 - November 04, 2014
X-Ray Overview
Asset Allocation Equity Investment Style Fixed Income Style
Cash 6.65
U.S. Stocks 93.15
Foreign Stocks 0.19
Bonds 0.00
Other 0.00
Not Classified 0.00
Sector Weighting% Net Assets 1-Mo Return % Portfolio 1-Mo Return %
Portfolio S&P 500 Portfolio S&P 500 –0.05 –0.03 0 0.03 0.05
h Cyclical 40.92 30.39 0.05 0.22
r Basic Materials 3.63 3.30 0.00 –0.08
t Consumer Cyclical { 28.16 10.22 0.03 0.07
y Financial Services } 7.67 14.95 0.01 0.22
u Real Estate 1.46 1.92 0.00 0.02
j Sensitive 42.99 42.78 0.05 0.43
i Communication Services 2.28 4.03 0.00 0.17
o Energy 7.88 9.70 0.01 0.08
p Industrials } 5.96 11.02 0.01 0.19
a Technology { 26.88 18.02 0.03 0.00
k Defensive 16.09 26.83 0.02 –0.27
s Consumer Defensive 7.28 9.52 0.01 –0.55
d Healthcare 7.19 14.32 0.01 0.21
f Utilities 1.62 3.00 0.00 0.06
Not Classified 0.00 0.00 0.00 —
Stock StatisticsPortfolio Relative to S&P 500
Forward P/E Ratio 17.95 1.05
P/B Ratio 3.16 1.32
ROA 7.73 0.94
ROE 18.90 0.90
Portfolio Relative to S&P 500
5-Yr Proj EPS Growth % 2.16 0.22
Dividend Yield % 1.40 0.82
Average Market Cap $mil 53,664.61 0.77
Fees & ExpensesAverage Mutual Fund Expense Ratio % 0.36
Expense Ratio of Similarly WeightedHypothetical Portfolio %
0.44
Estimated Mutual Fund Expense $ 212.47
Total Sales Charge Paid $ 3.00
Regional Exposure% of Stocks
North America 99.81
Latin America 0.01
United Kingdom 0.01
Europe Developed 0.16
% of Stocks
Europe Emerging 0.00
Africa/Middle East 0.00
Japan 0.00
Australasia 0.00
% of Stocks
Asia Developed 0.00
Asia Emerging 0.01
Not Classified 0.00
Diagnostics
Asset Allocation
Your portfolio is aggressive. An assetmix such as yours normally generateshigh long-term returns but can be veryvolatile. Financial planners typicallyrecommend these types of mixes forinvestors who have investmenthorizons longer than 10 years, needhigh returns, and are comfortable witha high level of risk.
Equity Investment Style
Compared with the broader market,your portfolio's stock exposure isbiased toward large-cap companies.Among these issues, it is worth notingthat you have a good mix ofconservatively priced value stocks andaggressively-priced growth issues.Depending on your investment goals,you may want to further diversify yourportfolio by increasing your exposure tosmall- and mid-cap companies.
Sector Weighting
{Over Exposure}Under Exposure
Fees & Expenses
The mutual funds in your portfolio tendto have below average expense ratios,which is good because expense ratioshave been shown to be a major factorin mutual-fund performance over thelong term.
Regional Exposure
{Over Exposure}Under Exposure
?
Page 3 of 68

Generated on November 04, 2014
Holding Detail | 2014 Thesis Portfolio | October 05, 2014 - November 04, 2014
*Annualized
Morningstar Change % of Holding Personal Return %Name Ticker Rating in Rating Assets Value $ 1-Mo 3-Mo 1-Yr* 3-Yr* 5-Yr*
SPDR® S&P 500 ETF SPY QQQQ — 42.91 48,052.80 2.62 4.75 — — —
Macy's Inc M QQQ 0 7.49 8,386.50 –4.71 — — — —
Cash CASH$ . — 6.56 7,350.70 — — — — —
Chipotle Mexican Grill Inc Cla ... CMG h QQQ +1 5.76 6,450.00 –2.00 — — — —
Apple Inc AAPL QQQ 0 4.83 5,408.00 8.75 — — — —
Google Inc Class C GOOG QQQ 0 4.43 4,963.68 — — — — —
Vanguard Small-Cap ETF VB QQQQ — 4.09 4,584.80 — — — — —
Twitter Inc TWTR h QQQ +1 3.64 4,077.00 –10.25 8.72 — — —
Technology Select Sector SPDR® ... XLK QQQQ — 3.62 4,053.00 –2.27 0.32 — — —
Panera Bread Co Inc Class A PNRA QQQ 0 3.61 4,046.00 — — — — —
Twenty-First Century Fox Inc C ... FOX QQQQ 0 2.81 3,146.00 — — — — —
Kroger Co KR Q 0 2.53 2,837.50 7.32 — — — —
E I du Pont de Nemours & Compa ... DD QQQ 0 1.84 2,058.90 — — — — —
Alerian MLP ETF AMLP QQ — 1.63 1,830.50 –5.02 — — — —
Enterprise Products Partners L ... EPD h QQQQ +1 1.63 1,824.00 –5.67 — — — —
Walt Disney Co DIS QQQ 0 1.61 1,801.00 — — — — —
Facebook Inc Class A FB QQ 0 1.00 1,116.00 — — — — —
Financial Select Sector SPDR® ... XLF QQ — 0.00 0.00 –8.93 — — — —
Molson Coors Brewing Co TAP QQ 0 0.00 0.00 –7.27 — — — —
Market Vectors® Gold Miners ET ... GDX Q — 0.00 0.00 — –6.67 — — —
SPDR® S&P Transportation ETF XTN QQQQQ — 0.00 0.00 — — — — —
EOG Resources Inc EOG QQQ 0 0.00 0.00 — — — — —
Coach Inc COH QQQQ 0 0.00 0.00 — — — — —
Consumer Discret Sel Sect SPDR ... XLY QQQQ — 0.00 0.00 — — — — —
Materials Select Sector SPDR® ... XLB QQQQ — 0.00 0.00 — — — — —
Yahoo! Inc YHOO QQQ 0 0.00 0.00 — 10.88 — — —
Health Care Select Sector SPDR ... XLV QQQ — 0.00 0.00 –9.29 — — — —
Walgreen Co WAG x QQ –1 0.00 0.00 — — — — —
Bristol-Myers Squibb Company BMY x QQ –1 0.00 0.00 13.68 14.05 — — —
Whole Foods Market Inc WFM QQQQ 0 0.00 0.00 — 0.45 — — —
Citigroup Inc C QQQ 0 0.00 0.00 –5.77 1.99 — — —
Domino's Pizza Inc DPZ . — 0.00 0.00 –0.72 — — — —
Yum Brands Inc YUM h QQQQ +1 0.00 0.00 –1.07 3.93 — — —
iShares Nasdaq Biotechnology IBB QQQQQ — 0.00 0.00 –2.41 — — — —
Southern Co SO QQQ 0 0.00 0.00 — –0.81 — — —
JC Penney Co Inc JCP . — 0.00 0.00 — — — — —
Industrial Select Sector SPDR® ... XLI QQQ — 0.00 0.00 — — — — —
Cedar Fair LP FUN . — 0.00 0.00 –6.48 — — — —
Energy Select Sector SPDR® ETF XLE QQQQQ — 0.00 0.00 — –5.15 — — —
Utilities Select Sector SPDR® ... XLU QQQ — 0.00 0.00 — — — — —
Consumer Staples Select Sector ... XLP QQQ — 0.00 0.00 — — — — —
?
Page 4 of 68

Generated on November 04, 2014
Analyst Digest | 2014 Thesis Portfolio | October 05, 2014 - November 04, 2014
SPDR® S&P 500 ETF SPY | QQQQ
$200.22 h$3.70 | 1.88%ETF Valuation Rating (as of 11-03-2014) Fairly Valued
ETF Market Price (as of 11-03-2014) $201.77000
Fair Value Estimate $198.09
Consider Buying Price $181.78
Consider Selling Price $211.41
ETF Expected Return 9.12%
ETF Hurdle Rate 9.99%
ETF Expected Excess Return -0.86%
Morningstar Coverage 96.54% of assets
446 of 503 Holdings
Stock Quality (as % of assets) 47.05% Wide Moat
42.29% Narrow Moat
7.09% No Moat
Fair Value Uncertainty High
07-21-2014 | by Michael Rawson, CFA
The Thesis 07-21-2014Suitability SPDR S&P 500 SPY is a solid core equity holding as it is broadly diversifiedacross sectors and individual stocks. It is one of the most heavily traded securities inthe world. This liquidity makes it very cheap to trade in large blocks. It also offers alow expense ratio, though there are cheaper alternatives for long-term investors.The S&P 500 Index is the most oft-cited proxy for the U.S. market and is viewed asan indicator of the economic health of the nation. Though it lacks exposure to small-cap stocks, the S&P 500 Index was nearly perfectly correlated with the broad U.S.market as represented by the Morningstar US Market Index over the past decade.During that time it was 0.88 correlated with developed-markets international stocks,as represented by the the MSCI EAFE Index.Over long periods of time, stocks tend to outperform bonds but with greater risk.According to data from Ibbotson Associates, between 1926 and 2013, large-cap U.S.stocks returned 10.1% annualized compared with 5.5% per year for long-termgovernment bonds. On an inflation-adjusted basis, a dollar invested in stocks wouldhave grown to $358.97 by the end of this period compared with just $8.39 for a dollarinvested in bonds over the same span. The case for owning stocks would be a slam-dunk, were it not for their relatively greater volatility. At nearly 20.2%, the annualstandard deviation of large-cap stock returns has historically been nearly twice thatof long-term government bonds. In any given year, the stocks' returns can benegative, and their long-term upward trend is often obscured by volatility and bearmarkets. Stocks and long-term government bonds were uncorrelated over that 88-year period, suggesting that investors could achieve superior risk-adjusted returns byholding both stocks and bonds in a portfolio. Fundamental View The equity risk premium--which is simply the excess return on stocks over therisk free rate--has historically averaged 6% since 1926. Although that soundsattractive, stocks can experience extended periods of negative returns. Those who tryto time the market often end up with subpar returns, as emotions such as fear andgreed make it difficult to buy during market downturns and sell into strength. Whilethe historical equity risk premium is a widely accepted approach for setting futureexpectations for long-term stock returns, investors should not expect risingvaluations in the past to continue indefinitely.
The expected return for large-cap stocks can be broken down into two components:dividends and capital appreciation. The current dividend yield for the S&P 500 isaround 2.0%, about 48 basis points less than the 2.48% yield on the 10 year U.S.Treasury Note. Historically, the S&P 500’s dividend yield has been about 300 basispoints less than the yield on the 10 year Treasury, suggesting the dividend yield onstocks looks attractive. Thanks in part due to stimulus by the Federal Reserve meantto spur economic activity by forcing capital into productive assets. While manyexpect rates to rise, stocks dividend yields will likely remain attractive relative tobond yields for some time.Another driver of valuations, capital appreciation, results from growth in earningsand changes in the valuation multiple investors apply to those earnings. Realearnings growth for large cap stocks averaged around 2.5% between 1947 and 2009,a period in which real U.S. GDP grew by 3.3%. So earnings growth has historicallybeen less than GDP growth. Since 2010, GDP growth has averaged just 2.0%. If theeconomy continues to grow at a below average rate, it is reasonable to expectearnings will do the same and that valuations will fall. However, two factorscontinue to support elevated valuations despite slowing growth. One is low interestrates and the other is faster international growth. There is an inverse relationshipbetween interest rates and valuations because future cash flows are worth moretoday when they are discounted at lower rates, and vice versa. Since many S&P 500companies are multinational conglomerates, they benefit from global growth.As for changes in valuation multiples, investors should not bank on further expansionof the current price to earnings multiple. At 18.6 times trailing earnings, the currentprice to earnings ratio for the S&P 500 is above its median level of 16.3, dating backto 1947. In the past, when the valuation multiple has been above its long termaverage, future returns have tended to be lower versus periods marked by a belowaverage valuation multiple. In other words, the valuation multiple of the S&P 500 hasa tendency to revert to its historical average.That valuation multiple for the S&P 500 is based on as reported earnings. Analystsalso provide forecasts of future operating earnings. According to S&P, analystscurrently forecast earnings that result in a price to forward operating earningsmultiple of 15.3 for the index. This implies earnings growth over the coming year of15%, well above the 6% average earnings growth rate of the past two years,suggesting that analysts’ forecasts may prove overly optimistic.Based on Morningstar equity analysts’ fair value assessments of the S&P 500 Index’sunderlying holdings, the index was trading at a price/fair value multiple of 1.02 as ofmid-July. This indicates that they believe that from current levels, future returnsshould be in line with their historic average.
Fees & AlternativesThis ETF's 0.094% expense ratio, while low in absolute terms, is not the lowestamong ETFs tracking the S&P 500. Index replication and structural costs result in anestimated holding cost slightly higher than the expense ratio. Alternatives SPY has greater trading volume and assets under management than any otherETF, which result in extremely low market-impact cost. Given its abundant liquidity,frequent traders and investors moving tens of millions of dollars will likely prefer touse SPY over its closest peers.While SPY is structured as a unit investment trust, iShares S&P 500 Index IVV is aRegulated Investment Company, which allows it to reinvest dividends, engage insecurities lending, and use index futures if necessary--all of which result in lowerestimated holding costs. Not only does IVV have a slightly lower expense ratio(0.07%), it also has realized lower all-in holding costs in practice. At just 0.05%,Vanguard S&P 500 VOO is the lowest-cost way to track the index for buy-and-holdinvestors.Investors looking to complement this fund with an allocation to smaller-cap stocksmight look at Vanguard Extended Market Index ETF VXF, which covers all stocksoutside the S&P 500 and levies an annual fee of 0.10%. Investors looking forexposure to the broad U.S. market in one fund might consider the Vanguard TotalStock Market ETF VTI. With its full coverage of small-, mid-, and large-cap stocks androck-bottom expense ratio, it is one of our favorite U.S. equity ETFs.
?
Page 5 of 68

Generated on November 04, 2014
Analyst Digest | 2014 Thesis Portfolio | October 05, 2014 - November 04, 2014
Portfolio ConstructionThis fund tracks the S&P 500 Index, a market-cap-weighted benchmark composed oflarge- and mid-cap U.S. stocks. The index has a slight quality tilt because of itsconservative eligibility requirements pertaining to unprofitable companies and recentIPOs. However, that does not mean that the index will have superior performance orthat unprofitable companies will be removed from the index on a timely basis.Constituents are determined by a set of criteria and an index committee, which hasgreater flexibility than most indexes that follow more mechanical rules. The minimummarket cap for companies in the index is around $4 billion. Though it lacks exposureto small caps and has limited exposure to mid-cap stocks, the constituents of thisindex account for 80% of the total market capitalization of the U.S. stock market. Asthis fund holds large stakes in multinational firms, it also has substantial indirectinternational exposure. About 45% of the index's constituents' asset-weightedrevenues are generated outside of the U.S.
Unlike most modern ETFs, SPY is organized as a unit investment trust, whichprevents it from reinvesting dividends, holding securities not in the index such asfutures, or lending securities. This leads to slightly higher holding costs. It also has aone-month lag between the ex-date and the payment of dividends. The fund followsa full replication strategy, holding every stock in the index.
?
Page 6 of 68

Generated on November 04, 2014
Analyst Digest | 2014 Thesis Portfolio | October 05, 2014 - November 04, 2014
Macy's Inc M | QQQ
$55.91 -x$3.69 | –6.19%Fair Value Estimate $56
Consider Buying Price $33.6
Consider Selling Price $86.8
Fair Value Uncertainty High
Economic Moat None
Stewardship Grade Standard
08-14-2014 | by Paul Swinand
The Thesis 08-14-2014Department stores continue to be relevant, but because of competition,macroeconomic cycles, and low customer switching costs, we believe it is difficultfor most retailers to develop long-term sustainable competitive advantages.Nevertheless, we believe Macy's is stronger than it was before the financial crisisand well positioned to serve the American middle class, from millennials seekingfashion to families shopping for homegoods.The company has been benefiting fromits My Macy's localization initiative, which organizes stores into 69 districts, placingkey management in local markets while centralizing back-office functions. Thestrategy creates a more relevant retail experience for customers and improveseconomies of scale that leverage Macy's national size and status. We think this andother operational improvement programs can continue to affect results, as they arestill only a bit more than halfway rolled out in the chain, and the effect of shoppersreturning after positive experiences could carry on for several seasons.The MyMacy's strategy should continue to improve flexibility and foresight into inventoryand markdown levels, which over the long run should improve gross margins andreduce downside risk should the economy slow again. With lower fixed overheadcost, the company can allocate more resources to regions that are improving. At thesame time, Macy's can now better leverage its size and national presence inadvertising and marketing and also in vendor and landlord concessions. We think thisputs Macy's in a position to gain some market share in the medium term.Nationalscale, monobranded stores, and investments to standardize inventory managementacross channels have enabled further integration of online and stores, whichcontinue to be a driver of growth, and longer term should contribute to gross marginimprovement as buy-online-pick-up-in-store reduces shipping cost and centralinventory reduces markdowns. In our view, Macy's has been particularly strong inexpanding omnichannel capabilities, and is ahead of the competition, which has hadimportant implications for connecting with a new generation of customers.
ValuationOur fair value estimate remains $56 per share, which implies 13 times 2014 year-end(January 2015) earnings estimates. On an enterprise value/EBITDA basis, we valueMacy's at 6.3 times 2014 EBITDA, with free cash flow averaging a 10% yield. Macy'smaintained guidance for earnings per share of $4.40-$4.50, but reduced same-storesales forecasts for the full year to 1.5%-2.0% growth based on the first-halfunderperformance. For 2014 we model sales of $28.6 billion, representing 2.4%growth year over year as the company's push to localize its merchandising continuesto gain traction, as online sales continue to gain, but with virtually no store squarefootage growth. We believe these initiatives will continue to work into later years,and can still bring benefits independent of cost-cutting efforts that took place in 2013and are now providing SG&A benefits. We project sales growth to average in thelow-single digits over our explicit 10-year forecast, and note that the companyexpects to open only four net new stores though 2016.Sales growth combined with$100 million in annual savings from the previously mentioned 2013 cost-cutting
efforts should drive improved cash flows and earnings this year, along with control ofworking capital. We project operating margins to equal 10.2% in 2014 up from 9.9%last year, and then to normalize in the low-double digits to high-single digits over alonger horizon. Our model forecasts midteen returns on invested capital over the nextseveral years, above our 8.4% cost of capital assumption, which is affected by thedebt in the capital structure. We also note that the goodwill from prior mergers andstore leases lowers return on capital to the high single digits.
RiskWe've assigned Macy's a high uncertainty rating. Any weakness in consumerspending could weigh on performance, as Macy's serves mostly middle-classconsumers and has a high correlation to the national economy. There is also risk fromunderperforming stores and stores in weak or declining malls, which could continueto deteriorate, especially if they are located near declining or stagnatingdemographic areas. Additionally, specialty retailers and more value-orienteddepartment stores could continue to eat away at the market share of traditionaldepartment stores. Macy's has had success with the development of in-house andexclusive brands. But it faces the risk that consumers might change tastes andpreferences, and the brands Macy's has developed might fall out of favor. As Macy'scustomer base ages, the company must constantly reinvent new brands to attract thenext generation, and there can be no assurance that these new brands will be assuccessful.Over its long history, Macy's and the former department stores thatmerged to form the current entity have struggled after acquisitions. While no dealsare likely or obvious in our view, the spotty record of mergers and acquisitions poserisks for Macy's and the industry. Failed mergers can lead to sales and marginvolatility because of price competition in the industry. Post-merger integration canlead to management distraction and operational challenges for acquirers. Furtherrestructurings from national competitors such as Sears also pose risks.Today, manyretailers are investing in expanding outlet store concepts, while Macy's has only theBloomingdale's outlets. But we believe the segment could slow on toughcomparisons and as the industry eventually overbuilds outlet retail locations. ShouldMacy's ramp up its Bloomingdale's outlets, it runs the risk of expanding into a marketthat has already seen a large surge of capacity additions.
Management & StewardshipTerry Lundgren is CEO and chairman. He has served as CEO since 2004 and has spentmore than 25 years with the company in two stints. He had been COO and chiefmerchandising officer, including roles prior to the merger with Federated. We likethat Lundgren is required to own stock that is 5 times his base salary, and we alsobelieve the company's performance targets are balanced and well constructed. Wethink this helps to align his interests with those of shareholders. The board also hasinstituted one-year director terms, as opposed to its prior policy of three-year stints.This gives shareholders more flexibility to oust an underperforming board member,and puts pressure on management to perform since an outsider could more easilygain control, in our opinion. Additionally, the majority of the directors areindependent, and as part of their compensation they are required to own shares ofstock worth at least 5 times the annual cash retainer, which should motivate them toact in the interest of shareholders. Overall, we rate Macy's stewardship as standard.
ProfileMacy's operates about 840 Macy's and Bloomingdale's stores in the U.S. and PuertoRico, as well as Macys.com and Bloomingdales.com in 45 states, Guam, and PuertoRico. Its stores are primarily in malls and sell family apparel, accessories, cosmetics,home furnishings, and other consumer goods.
?
Page 7 of 68

Generated on November 04, 2014
Analyst Digest | 2014 Thesis Portfolio | October 05, 2014 - November 04, 2014
Chipotle Mexican Grill Inc CMG |
QQQ
$645.00 -x$29.50 | –4.37%Fair Value Estimate $600
Consider Buying Price $360
Consider Selling Price $930
Fair Value Uncertainty High
Economic Moat Narrow
Stewardship Grade Standard
10-27-2014 | by R.J. Hottovy
The Thesis 10-27-2014Not all fast-casual restaurant concepts are created equal. With a simple but uniquelycustomizable menu featuring naturally raised and organic products and aestheticallypleasing restaurant designs, Chipotle has developed a powerful brand intangibleasset, the basis for our narrow moat rating. In turn, this has helped to drive industry-leading comparable sales and restaurant-level margins during a lacklusterenvironment for most restaurant operators the past few years. Additionally, bysourcing from local ranchers and farmers, Chipotle has more clout over its suppliersthan chains of comparable size. Although many restaurant concepts have lookedpromising early before succumbing to overextension or competition, we areoptimistic that it will continue to balance growth with profitability, creating excesseconomic returns in the process.With $3.2 billion in sales during 2013, Chipotle is thedominant player in the $7 billion-plus domestic fast-casual Mexican restaurantcategory and one of the largest players in the $35 billion domestic fast-casualrestaurant category. We expect fast-casual restaurants--which offer higher-qualityingredients than quick-service chains but at lower average prices than casual diningrestaurants--to grow nearly 10% annually the next few years because of acompelling consumer value proposition and strong unit economics (lower real estateand labor costs than casual dining operators). This exceeds our low-single-digitgrowth forecast for the broader restaurant industry.In our view, Chipotle can outpaceits fast-casual peers. If the chain can match the density of its home market in Denver,we estimate that it ultimately could expand to 4,000 domestic units before nearingsaturation (compared with more than 1,700 today), implying double-digit unit growthfor several years. New restaurant prototypes that require less capital and have loweroccupancy costs could provide entry into secondary markets and push this numbereven higher. We also find Chipotle's secondary concepts (ShopHouse Asian Kitchenand Pizzeria Locale) and international growth plans intriguing, but it will take yearsbefore these initiatives have a cash flow impact.
ValuationWe are raising our fair value estimate to $600 from $570 due to a modest increase inour near-term revenue growth and operating margin outlook based on recentcomparable traffic trends. Our updated fair value implies fiscal 2015 price/earningsof 33 times, enterprise value/EBITDA of 17 times, and a free cash flow yield of 2%-3%. Although we believe the market's implied long-term growth expectations appearmildly aggressive, we remain optimistic about near-term comp momentum due to theaforementioned menu price increases, ongoing peak-hour throughput efforts, andcontribution from catering services.Based on 17% comps and contribution from 190new restaurants (12% unit growth), we anticipate top-line growth of 28% during2014. Looking to 2015, management's guidance calling for 190-205 restaurantopenings and low-single-digit food cost inflation (relative to third-quarter levels)appears realistic and is aligned with our model. However, the company's same-store
sales target in the low-to-mid-single-digit range appears extremely conservative,especially when considering that the 6% price increases will provide a tailwindthrough much of the first half of the year. We remain comfortable with our 2015comp outlook in the low-double-digit range and believe there is sufficient consumerdemand to support high-teen average annual revenue growth the next five years,including low-double-digit unit growth and high-single-digit comps.The leverageinherent in Chipotle's restaurant model continues to impress. We expect restaurantmargins to exceed 30% within five years (compared with 26.6% in 2013), puttingChipotle in the upper echelon of all industry operators. Food costs remain a headwindin certain categories, but we believe the company will continue to leverage labor andoccupancy costs and post roughly 100 basis points of restaurant margin expansion to27.6% this year. Our model assumes operating margins of 17.4% for 2014, comparedwith 16.6% in 2013, driven by restaurant margin gains but partly tempered byincreased marketing costs. Over a longer horizon, we expect margin expansion,based on expanded rollout of the lower-cost "A model" restaurant prototype, andG&A expense leverage. Our model assumes operating margins improve to 22% overthe next five years. ROIC (including capital leases) should improve to the mid-20%range (compared with our 10.0% cost of capital assumption), reinforcing our narroweconomic moat rating.
RiskIn our view, Chipotle's most significant risk is increased competition on severalfronts. Some quick-service restaurant chains are upgrading their menus and decor,while many casual-dining firms have become more focused on enhancing their valueproposition. Additionally, with retail landlords looking for tenants for unoccupied realestate and restaurant operators finding themselves with easier access to capital, webelieve new fast-casual restaurant entrants will increasingly come to the market overthe near future. This includes an emergent group of more upscale fast-casual playerssuch as LYFE Kitchen, Mendocino Farms, Piada, and others that could targetChipotle's affluent and millennial audiences.If its brand appeal isn't as wide as webelieve, Chipotle could face market saturation sooner than anticipated. Demographicshifts, an increasing number of meals prepared at home, and ongoing consumer-spending headwinds could dampen top-line results. Food, labor, energy, andoccupancy cost volatility could disrupt results. Chipotle's secondary concepts,including ShopHouse Southeast Asian Kitchen and Pizzeria Locale, and internationalexpansion carry their own set of execution risks.
Management & StewardshipChipotle features a seasoned management team with a great deal of restaurantindustry experience. Chairman and co-CEO Steve Ells, who holds a degree from theCulinary Institute of America, founded Chipotle in 1993. President and co-CEOMontgomery Moran formally joined the firm in early 2005, but had long served asChipotle's general counsel. CFO Jack Hartung, a two-decade veteran of McDonald's,has been with Chipotle since 2002. Ells beneficially owns about 1% of the totalequity (Class A and B common shares were collapsed into a single class of stock inDecember 2009) while Moran owns around 1.4%, providing enough of an incentive toincrease shareholder value, in our view. Although we'd prefer the roles of chairmanand co-CEO to be split and the board to declassify, we have not witnessed anyabuses of power under this corporate-governance structure. Chipotle historically hasbeen a solid allocator of capital, with the majority of free cash flow used to fundgrowth initiatives, namely high-return restaurant openings. Management also hasbeen opportunistic with share repurchases, buying back $622 million (an averageoverall price of $153 per share) over the past five years. However, given the loftyprice at which recent shares have been purchased, we'd prefer that value bereturned to investors in the form of a dividend, which limits our equity stewardshiprating to Standard.
ProfileChipotle Mexican Grill is the largest player in the $7 billion-plus domestic fast-casualMexican restaurant category. Its menu includes burritos, bowls, tacos, and saladsmade from higher-quality ingredients than at quick-service restaurants. Because
?
Page 8 of 68

Generated on November 04, 2014
Analyst Digest | 2014 Thesis Portfolio | October 05, 2014 - November 04, 2014
customers can choose from four different meats, two types of beans, and an array ofextras, more than 65,000 menu combinations are possible. As of September, the firmoperated almost more than 1,700 restaurants in 44 states, Canada, the UnitedKingdom, France, and Germany.
?
Page 9 of 68

Generated on November 04, 2014
Analyst Digest | 2014 Thesis Portfolio | October 05, 2014 - November 04, 2014
Apple Inc AAPL | QQQ
$108.16 h$8.54 | 8.57%Fair Value Estimate $100
Consider Buying Price $60
Consider Selling Price $155
Fair Value Uncertainty High
Economic Moat Narrow
Stewardship Grade Standard
10-22-2014 | by Brian Colello, CPA
The Thesis 10-22-2014We believe Apple's strength lies in its experience and expertise in integratinghardware, software, services, and third-party applications into differentiated devicesthat allow Apple to capture a premium on hardware sales. Although Apple has asterling brand, strong product pipeline, and ample opportunity to gain share in itsvarious end markets, short product life cycles and intense competition will preventthe firm from resting on its laurels, or carving out a wide economic moat, in ouropinion.We believe Apple has developed a narrow economic moat, thanks toswitching costs related to many attributes around the iOS platform that may makecurrent iOS users more reluctant to stray outside the Apple ecosystem for futurepurchases. In our view, much of Apple's exponential growth in recent years hasstemmed not from the firm's economic moat, but from the achievement of buildingthe first truly revolutionary smartphone, the iPhone, that integrated hardware andsoftware, as well as a robust apps store and ecosystem that attracted new users toplatform. Apple's first-mover advantage may be diminishing, and "easy growth"coming from early smartphone adopters may be winding down as the smartphonemarket moves up the adoption curve and competition ramps up. Yet we still foreseeiPhone growth, coming from both attracting new customers to iOS (mostly inemerging markets, although we still see U.S. growth as well) and retaining Apple'sexisting premium iPhone customers, where we think the company's moat will play anincreasingly important role. A partnership with China Mobile, the world’s largestwireless carrier, should also give iPhone growth a shot in the arm.Ultimately, wethink future smartphone and tablet competition will stem from software and services,as hardware is already approaching commoditization. We view Apple as wellpositioned to develop and expand enough services to enhance the user experience, inorder to build switching costs that will help the firm retain customers and generatesignificant repeat purchases will be critical for future iPhone growth in the yearsahead.
ValuationWe are raising our fair value estimate for Apple to $100 per share from $93, as weare more optimistic about long-term iPhone sales growth, in light of the firm’s stellarnear-term results around the iPhone 6 and 6 Plus launch. Our fair value estimateimplies fiscal 2015 (ending September 2015) price/earnings of 13.6 times (and only11 times after excluding Apple’s cash balance on hand). We project 11% revenuegrowth in fiscal 2015, as we project 15% iPhone revenue growth due to atremendous new iPhone launch. We model 9% Mac revenue growth and contributionof over $3 billion in revenue from Apple Watch in fiscal 2015.Longer term, Appleshould still attract late smartphone adopters in developed markets and newcustomers in emerging markets (especially China). As more consumers are previoussmartphone owners, rather than first-time buyers, we think Apple has a good chanceto retain a sizable portion of its iOS user base today, and perhaps gain further shareat the high end of the market. We model average iPhone revenue growth of 5% peryear over the next few years, above our prior expectations. Apple’s strategy of
staying at the high end of the smartphone market bodes well for future profitability,but might be the greatest headwind to tremendous iPhone unit sales growth. Basedon recent lackluster iPad sales, we project iPad revenue to decline by 9% in fiscal2015, partially due to the iPhone 6 Plus potentially cannibalizing the iPad Mini. Wemodel relatively flattish iPad revenue thereafter. We anticipate intense competitionin the tablet space, as well as headwinds to tablet adoption, as more customerssimply opt to rely on large-screen smartphones rather than stand-alone tablets. Wemodel modest long-term revenue growth from Mac, up from our prior estimates, asthe firm gains share in the declining PC industry. We do not make any profitabilityassumptions for any unannounced products, such as a long-rumored, revised AppleTV, but we recognize that future innovations may provide upside to our valuation.Weproject 38% gross margins in fiscal 2015, as well as mid- to high-30% gross marginsin the long term. In turn, operating margins hover in the mid- to high-20% range. Ourfair value uncertainty rating for Apple remains high.
RiskWe believe a large, well-diversified company like Apple faces several risks.Smartphone and tablet competition is rising, as Samsung, in particular, hasdeveloped compelling iPhone alternatives in the premium smartphone space.Meanwhile, we anticipate that a greater portion of smartphone sales come from low-end devices in emerging markets where Apple does not participate. If these devicesturn out to offer only a slightly worse user experience than iOS products, Apple maybe unable to capture an adequate premium on future hardware sales. Apple also hasto square off against several competitors with different strategies and financialprofiles, as firms like Amazon (with its Kindle Fire tablet), Google (with its Nexusdevices) and Xiaomi appear willing to sell hardware at close to cost, in order to driveother revenue streams.Despite its intentions to control as much of the userexperience as possible for its products, Apple still relies on a robust app developerbase and strong partnerships with third parties. Its decision to use an in-housemapping solution (and subsequent apology) may have diminished Apple's reputationand its customers' user experience, and other similar missteps may cause customersto leave the iOS ecosystem altogether. If Apple were to falter and its exceptionalbrand be diminished as customers departed iOS in droves, we’re not even sure thatApple’s mighty cash cushion could help the firm buy its way out of any problem.As apremium phone supplier, Apple also runs the risk that wireless carriers could reduceor eliminate the subsidies that they provide their customers on the iPhone, in turnraising customers' up-front costs and perhaps making other smartphones appear tobe better alternatives. Finally, Apple lost cofounder and visionary Steve Jobs inOctober 2011, and while we believe CEO Tim Cook is a more-than-capable leader,Apple runs the risk that its unique culture and sense of innovation may diminish overtime.
Management & StewardshipWe view Apple as a good steward of shareholder capital. Arthur Levinson, formerchairman and CEO of Genentech, is chairman of Apple's board of directors. Tim Cookbecame CEO in August 2011 after cofounder, longtime CEO, and visionary Steve Jobsstepped down from the CEO role before passing away in October 2011. Cook wasconsidered to be Jobs' right-hand man and served in various operations roles withApple before becoming COO in 2005. We believe Jobs' passing was a blow to thefirm, as he was a one-of-a-kind leader and creative mind. We’re comfortable withApple’s level of technological innovation over the past couple of years after Jobs’passing. Much of this innovation has come from new software and services withiniOS like Apple Pay, rather than brand-new smash-hit products. That said, we stillhave high hopes that the Apple Watch will deliver incremental earnings growth toApple, and the firm’s ability to execute and deliver another premium product willlikely be viewed by many as a sign that Tim Cook’s Apple can, or cannot, deliversuccessful new products over time.Although Apple maintains sterling brandrecognition and has hundreds of millions of loyal followers, the company has made acouple of missteps under Cook that, some skeptics would argue, would have neverhappened under Steve Jobs. Apple executed poorly when it decided to part wayswith Google Maps in iOS 6 and launch Apple Maps with a variety of bugs and errors,
?
Page 10 of 68

Generated on November 04, 2014
Analyst Digest | 2014 Thesis Portfolio | October 05, 2014 - November 04, 2014
leading to a formal apology and the ouster of VP Scott Forstall. Also, Apple wasrelatively slow to recognize demand for larger-screen iPhones, and although the firmrectified this issue with its iPhone 6 product lineup in late calendar 2014, Samsungand other Android-based competitors had a two-year head start and were able tosteal away some iOS customers who sought out a larger-screen device. Morerecently, Apple launched an iOS 8.0.1 update that was quickly recalled after itrendered some users' phones useless. This misstep could make it more difficult forApple to quickly push its iOS user base onto the latest version of its operating systemin future releases.On the other hand, while many may have questioned Apple’smanagement team about its decision to price the iPhone 5c at $549, rather than atlower prices that more directly addresses emerging market demand, we tend toapprove of Apple’s decisions to maintain its premium pricing position. We alsoapplaud Cook’s decision to initiate dividend and stock buyback programs, as well astake on debt in order to fund such programs. We recognize that many high-profileinvestors have called for larger buyback programs, but we think that Apple’s currentplan of $90 billion is satisfactory as long as buybacks (and the debt issuances neededto fund these buybacks) are made in a prudent manner. In retrospect, the misstepmay have come from not front-loading the buyback program in 2013, when bothApple’s share price and interest rates were lower than today.Perhaps moreimportantly, we think Apple’s frugality in terms of acquisitions is quite admirable.Apple's strategy of focusing on smaller, tuck-in deals and developing products in-house, rather than splashy but questionable deals like Microsoft's purchase of Skypeor Google's foray into hardware by acquiring Motorola Mobility and Nest, appears tohave served investors quite well in recent years. Even Apple's $3.0 billion acquisitionof Beats Music and Beats Electronics represented only a tiny portion of the firm'stotal cash balance, and we suspect that solid revenue growth and gross margins onheadphone hardware sales may have justified the valuation. Apple has also done agood job of attracting top-notch talent to the company in recent months, such asformer Burberry CEO Angela Ahrendts to run Apple’s retail and online stores, PaulDeneve, the former CEO of Yves Saint Laurent, and Kevin Lynch, former CTO ofAdobe. We are comfortable that these hires have strengthened Apple’s bench in theunlikely event of Cook departing the company, and each hire likely has aided inApple’s efforts to build and deliver Apple Watch, and perhaps future products aswell. All the while, Apple’s ongoing operations continue to generate operatingmargins and cash flow well above its peers in various hardware industries, whichbodes well for future free cash flow for investors.
ProfileApple designs consumer electronic devices, including PCs (Mac), tablets (iPad),phones (iPhone), and portable music players (iPod). Apple's products run internallydeveloped software, and this integration of hardware and software often allows thefirm to maintain premium pricing for its devices. Apple's products are distributedonline as well as through company-owned stores and third-party retailers.
?
Page 11 of 68

Generated on November 04, 2014
Analyst Digest | 2014 Thesis Portfolio | October 05, 2014 - November 04, 2014
Google Inc GOOG | QQQ
$551.52 -x$23.76 | –4.13%Fair Value Estimate $545
Consider Buying Price $327
Consider Selling Price $844.75
Fair Value Uncertainty High
Economic Moat Wide
Stewardship Grade Standard
10-14-2014 | by Rick Summer
Analyst Note 10-17-2014Google's third-quarter results showed robust demand by digital advertisers as thefirm's growth continues to outpace the market. Despite higher-than-expectedoperating expenses (particularly research and development), we did not see anythingin the quarter that would cause a structural change in our financial model. We aresticking with our $545 fair value estimate and our wide moat rating. Overall revenueexcluding traffic acquisition costs (excluding payments made to partners) grew 25%versus 2013, a slight deceleration from last quarter but still faster than rates the firmwas posting in 2012. Google showed particular strength in its websites segment(which includes the core search business and YouTube, among other owned andoperated websites), posting 23% growth, faster than our estimate for overall marketgrowth in the midteens. We are modeling for continued deceleration as the industryand company go through a normal maturation cycle. On the expense side, severalitems led to a dramatic uptick in costs, although we expect revenue growth tooutpace these expenses in the coming quarters. In particular, management pointed toa third-quarter hiring cycle for new college graduates as well as annual equitycompensations "refreshes" driving research and development to 16.1% of quarterlyrevenue, a 210-basis-point increase from the prior quarter and a 260-basis-pointincrease over 2013. The company remains in a heavy investment period, investingbeyond its core business in areas such as cloud computing, YouTube, and a recentlyrelaunched Google Express same-day delivery service.
The Thesis 10-14-2014With a dominant Internet search product as its foundation, Google has built animpressive portfolio that individuals use frequently, beyond search. These newproducts allow advertisers to reach out to potential customers multiple times, inmultiple ways.As consumers use multiple devices in a post-PC world, these changingbehaviors shine a light on other successful products Google has built in order to keepa hold on users and provide a greater benefit to advertisers. Google's mobileoperating system and browser help to unify users' experience as they move from onedevice to another. The firm's success in products such as Gmail, the Chrome browser,and Google Maps provides a cohesive experience for users and helps Google showmore relevant ads.Our general thesis for the online media sector assumes that digitalad spending will continue to consolidate around companies with unique assets andreach, such as Google and Facebook. A strong secular growth trend for onlineadvertising is core to our thesis. The market for Internet search advertising is stillgrowing in the double digits, while display advertising is growing thanks to newerinnovations tying display ads to specific actions, including clicks, leads, andcustomers. Faster-growing geographies such as Asia are propping up overall growthrates even as pockets of economic weakness hit various regions.As the pre-eminentleader in search, Google maintains more than 60% of worldwide market share; noother competitor has even 10%. We believe the company's early technicaladvantages attracted users who now use it habitually, creating a switching costbased on familiarity with the engine. Although we expect small movements in market
share, we believe Google's dominance will persist and not lose more than 3-5 pointsof share. Investors should be aware that new businesses and products are unlikely tobe as profitable as the desktop search market. As Google will be forced to sharepayments with other players in the value chain, such as content owners, applicationdevelopers, and handset makers, profit growth may ultimately lag revenue growthover the long run.
ValuationWe have increased our fair value estimate to $545 per share from $520 to accountfor cash earned and modestly higher growth in nonadvertising segments, particularlyenterprise cloud computing. Our fair value represents a 2014 adjusted price/earningsmultiple of 20 and an enterprise value/EBITDA multiple of 15.6. We forecast verymodest operating margin improvements from a 2012 trough. We forecast revenue togrow more than 12% annually during the next five years, slightly ahead of the growthrate for the overall online ad industry. Google reports its business in three marketsegments: Google websites, Google Network websites, and other.Revenue driven byGoogle websites include its search engine and Web properties such as YouTube andGoogle Finance. Although we expect minor short-term loss of market share in search,we believe that improvements in monetization (the conversion of a search to a paidclick on an advertisement) and overall market growth will help drive revenue.Additionally, with additional investment in display revenue technology and contenton YouTube, we have modeled Google websites to grow more than 13% per year.We also expect uplift from mobile search to support strong revenue growth in thiscore business. Excluding YouTube, search is the most significant cash generator andhighest-margin business for Google. We are more conservative in our view ofrevenue coming from Google Network. Google Network represents revenue earnedby the placement of ads on partner websites. We anticipate this growth will begreater than the market, growing in the midteens annually through 2016. Asoperating expenses have continued to climb, we are becoming more watchful of thefirm's limited potential for operating leverage as it enters new businesses. While webelieve Google could easily drive operating margins substantially above 40%, itwould have to ratchet down its investment in research and development and its datacenters to achieve these targets in the short term. It would also need to share lessrevenue with its partners, which we believe could disrupt the company's advertisingecosystem. We expect long-term operating margins to reach the mid-20s, as therevenue mix continues to move away from desktop search, its most profitablesegment. Because Google is heavily investing in new markets, we still expect freecash flow to be depressed over the next few years.
RiskAlthough we believe Internet search is habitual, explicit switching costs arerelatively low. Fickle consumers may move to a competitor that is able to establish astronger brand or a more useful experience. Google is investing in new businesseswhere it is less competitive, which may lead to a deterioration in its operatingmargin and return on capital. Advertisers may find new ways to reach their targetaudience in a cost-effective manner, like Facebook. Finally, competition in technologyis fierce, and employee retention may become more difficult and cause an increase inoperating costs.
Management & StewardshipCofounder Larry Page was named CEO in April 2011, taking over from Eric Schmidt,who had been CEO since 2001. Schmidt's tenure saw Google define its businessmodel, become a public company, and stay at the forefront of the Internet advertisingindustry as the largest company by revenue and enterprise value. Schmidt retains hisposition as chairman of the board and has a more active role in lobbying Washington.The company essentially has been managed by a three-person team of Schmidt,Page, and cofounder Sergey Brin. The company's equity has a dual-class structurethat concentrates the voting power in the hands of these three executives, who holdtwo thirds of the voting rights. They also have a significant economic interest in thefirm at more than 15%, which helps to align the interests of management with theshareholders. We are comfortable with management at the firm, but employee
?
Page 12 of 68

Generated on November 04, 2014
Analyst Digest | 2014 Thesis Portfolio | October 05, 2014 - November 04, 2014
retention will be a continual challenge for Google. Page's style and efforts will notmirror Schmidt's and may cause some short-term disruption. In fact, the senior vicepresident of product management resigned the week that Page's new title becameofficial. Although we don't view the move as emblematic of any loomingmanagement issues, we would not be surprised to see other similar moves, ascompetition for personnel is ruthless in the technology sector.Generally, we areencouraged by management's long-term focus on capital allocation, although thelack of transparency around milestones for new projects presents an analyticchallenge. We are encouraged that past acquisitions including DoubleClick, Android,and YouTube are bearing fruit and deepening the company's moat. Additionally, themanagement has been pruning products that have not been hitting internal successmetrics--a positive development, in our view. The company reached an agreement tosell Motorola's home business to Arris, another positive development, as we did notbelieve the segment generated excess returns and it also had no strategic benefit.
ProfileGoogle manages an Internet search engine that generates revenue when users clickor view advertising related to their searches. This activity generates more than 80%of the company's revenue. The remaining revenue comes from advertising thatGoogle places on other companies' websites and relatively smaller initiatives, suchas hosted enterprise products including email and office productivity applications.
?
Page 13 of 68

Generated on November 04, 2014
Analyst Digest | 2014 Thesis Portfolio | October 05, 2014 - November 04, 2014
Vanguard Small-Cap ETF VB | QQQQ
$114.62 h$4.06 | 3.67%ETF Valuation Rating (as of 11-03-2014) Fairly Valued
ETF Market Price (as of 11-03-2014) $115.69000
Fair Value Estimate $114.74
Consider Buying Price $97.29
Consider Selling Price $130.49
ETF Expected Return 10.18%
ETF Hurdle Rate 13.73%
ETF Expected Excess Return -3.55%
Morningstar Coverage 19.13% of assets
173 of 1494 Holdings
Stock Quality (as % of assets) 1.42% Wide Moat
11.43% Narrow Moat
5.96% No Moat
Fair Value Uncertainty High
10-29-2014 | by Michael Rawson, CFA
The Thesis 10-29-2014Suitability Vanguard Small Cap ETF VB provides low-cost exposure to U.S. small-cap stocksand is a suitable core holding as a supplement to U.S. large- and mid-cap equityfunds. Its constituent companies are widely diversified across both sectors and thevalue-growth spectrum. This fund is particularly well-suited for those seeking toprecisely control their market-cap exposure. It is designed to fit with Vanguard MegaCap ETF MGC and Vanguard Mid-Cap ETF VO in order to cover the vast majority ofthe U.S. equity market with minimal holdings overlap. However, the index that thisfund tracks only represents about 13% of the U.S. equity market. Consequently, thisfund should represent a similar percentage of the U.S. equity portion of a passiveinvestor's portfolio.U.S. small caps have historically provided some diversification benefits. The small-cap Russell 2000 Index was 0.92 correlated with the S&P 500 over the past 10 years.That said, small-cap stocks tend to be riskier as they exhibit greater sensitivity to thebusiness cycle and typically lack sustainable competitive advantages. Thus, theirearnings are more volatile and their stocks prices tend to fall farther during tougheconomic environments, but they may grow faster during economic expansions. Overthe past 10 years, the standard deviation of monthly returns of the Russell 2000Index was 20%, more than 5 percentage points greater than that of large-capequities, as represented by the S&P 500.For passive investors, holding a broad or total stock market fund is a more tax-efficient way to obtain small-cap exposure than holding separate funds to cover eachsize segment because a total stock market fund requires lower turnover.Consequently, it may be more efficient for investors to get the bulk of their exposureto small-cap stocks through a total market fund and then use a smaller position in asmall-cap fund for tactical purposes. Fundamental View Small-cap stocks have earned a return premium of about 2% over large-capstocks since 1926. However, this premium has become smaller in recent decades.From December 1978 through October 2014, the large-cap Russell 1000 slightlyoutpaced the small-cap Russell 2000 Index. The small-cap premium can also varydrastically over time. For example, during the entire decade of the 1990s, small-capstocks underperformed large caps by 3% per year.
While small-cap premium may be unreliable, it has been positive over the past 15years, as small-cap stocks have been on a tear since the bursting of the tech bubble.This stretch of outperformance has caused small caps to look expensive relative tolarge caps. Back in the tech bubble of the late 1990s, large caps traded at a premiumrelative to small caps. But this situation has reversed, and small caps now commanda premium valuation. For example, in the year 2000, large-cap stocks in the S&P 500traded at a price/projected earnings ratio of around 27 compared with 14 for thesmall-cap stocks in the Russell 2000 Index. Currently, large caps trade at aprice/projected earnings ratio of around 17, while small caps trade at a multiple ofabout 19 times prospective earnings.In addition to being more expensive, smaller-cap stocks often lack economic moats,or sustainable competitive advantages. Consequently, they tend to be less profitableand less resilient in the face of economic turbulence. Stocks in the large-cap S&P500 generated a return on invested capital of 15% over the past year, while thecorresponding figure for those in the Russell 2000 Index was only 2%. Richvaluations and pronounced vulnerability to rocky economic conditions are goodreasons to not give an overweighting to small caps at this time. These stocks makeup a small portion of the U.S. equity market.
Fees & AlternativesAt a mere 0.09% per year, this is one of the lowest-cost ways to get exposure tosmall-cap stocks. Historically, the fund has done a good job of tracking its index. Overthe trailing 12 months through September 2014, the fund lagged its index by lessthan its expense ratio. Alternatives This is our favorite small-cap ETF, but there are a number of alternatives thatmay be more appropriate for institutional traders or those who prefer to stick withanother index family. While Vanguard's may be one of the cheapest, iShares Russell2000 IWM is the most liquid option in this category. It trades $4 billion a day onaverage, compared with the $42 million traded in VB. But IWM is higher-cost at0.20%, and with a broader list of 2,000 holdings, it includes volatile micro-caps.IShares Core S&P Small-Cap ETF IJR has a 0.14% expense ratio and pairs well withS&P 500 and S&P MidCap 400 index funds. Schwab U.S. Small Cap ETF SCHAcharges just 0.08% and tracks the Dow Jones U.S. Small Cap Total Stock MarketIndex, which covers 1,750 stocks. Vanguard also manages small-cap ETFs followingthe Russell (Vanguard Russell 2000 Index ETF VTWO) and S&P small-cap indexes(Vanguard S&P Small-Cap 600 Index ETF VIOO). However, these ETFs do not havelarge trading volume or assets under management.Investors looking even further down the market-cap ladder at micro-caps and willingto take on the extra risk and higher expense may want to consider iShares RussellMicrocap Index IWC. This ETF holds only the smallest public companies traded onU.S. exchanges. This approach, however, results in higher volatility and an expenseratio of 0.60%. Those just looking for a complement to a large-cap U.S. stock holdingmight consider Vanguard Extended Market Index ETF VXF, which costs a mere 0.10%and is designed to track all stocks traded on U.S. exchanges except for those in theS&P 500.
Portfolio ConstructionVanguard Small Cap ETF switched its benchmark from the MSCI US Small Cap 1750Index to the CRSP US Small Cap Index. The switch was driven by Vanguard's long-term goal of minimizing costs. CRSP defines small caps as the 13% of the equitymarket between the 85th and 98th percentile of size. This methodology currentlyresults in about 1,463 constituent stocks in the CRSP US Small Cap Index. Becausethis index pulls in a handful of mid-cap names and fewer micro-cap names than theRussell 2000 Index, its average market cap is commensurately higher, clocking in at$2.7 billion compared with $1.4 billion for the Russell 2000. The CRSP benchmarkdoesn't employ many fundamental screens, so it lacks the slight quality tilt of theS&P SmallCap 600 Index. For example, the CRSP index has 30% of its value in stockswith negative retained earnings, compared with 18% for the S&P SmallCap 600. Theexchange-traded fund follows a full replication strategy, holding virtually all of thestocks in the index at nearly precise index weightings. Compared with large-cap
?
Page 14 of 68

Generated on November 04, 2014
Analyst Digest | 2014 Thesis Portfolio | October 05, 2014 - November 04, 2014
funds, small-cap indexes typically have more real estate and industrial sectorexposure but less exposure to energy and consumer staples stocks. The fund'sdividend yield is lower relative to a large-cap fund because many small-capcompanies do not pay a dividend.
?
Page 15 of 68

Generated on November 04, 2014
Analyst Digest | 2014 Thesis Portfolio | October 05, 2014 - November 04, 2014
Twitter Inc TWTR | QQ
$40.77 -x$13.17 | –24.42%Fair Value Estimate $39
Consider Buying Price $23.4
Consider Selling Price $60.45
Fair Value Uncertainty High
Economic Moat Narrow
Stewardship Grade Standard
07-30-2014 | by Rick Summer
Analyst Note 10-28-2014Twitter's third-quarter results and updated guidance are in line with our full-yearforecast, and the company's investments in advertising products are continuing todrive increased revenue on a per user basis. Although user growth has slowed, webelieve the uniqueness of Twitter's real-time content platform and mobile advertisinggrowth support our valuation and investment thesis. We are maintaining our narrowmoat rating and $39 fair value estimate based on the revision to our model. Althoughthe stock has come down toward our fair value estimate, we would encourageinvestors to wait for a margin of safety before investing. Advertising revenue grew109% and total revenue grew 114%, outpacing growth in monthly average users of23% to 284 million as improved pricing driven by new advertising products provedsuccessful. Management increased full-year guidance to $1.365 billion-$1.465billion, very modestly ahead of our prior forecast, while MAU growth continues to bewithin our expectations. Still, we note the slowdown in user growth and highlight ourbelief that Twitter will eventually reach 1 billion users over the next decade.However, because the firm can only monetize these users on line, the currentdeceleration in user growth may lead to negative sentiment in the stock.
The Thesis 07-30-2014Twitter and its users benefit from the network effects typical of a broad contentdistribution platform. The company counts 271 million monthly active users, animpressive number for a media platform that has captured both attention andbudgets from advertisers. Engagement with the Twitter platform is naturally social,reinforcing the desire to share and react to information in real time. The companywould argue that it is the largest "real-time" social network in the world, and wewould agree. There are many self-selected groups within Twitter, connected byinterests. Users may follow celebrities (for example, One Direction and LeBronJames), work interests (for example, human capital), and local interests (for example,Chicago events or breaking news). Each user's experience is highly personalized,based on how users create their networks, interact with the content, and post theirown content. Twitter is building a unique and proprietary customer data set. In ourview, the most important growth levers for Twitter are market share, users, and timespent. Perhaps the most important aspect supporting our positive view on growth isthe complementary nature of Twitter to traditional content and media. This will allowTwitter to more cheaply acquire content that flows through its media platform. Still,growth in users has been slowing. Furthermore, the company is competing foradvertising dollars with juggernauts such as Facebook and Google. Last, asadvertisers may struggle to measure the success of ad campaigns, the company maystruggle to attract new ad dollars.Still, we believe the marketing data that Twitter isgathering through the proprietary interest graph will piggyback on the momentumcreated by Facebook. As advertisers have continued shifting spending to onlinemedia, large tranches have remained offline--particularly in TV advertising--becauseof traditional considerations, including brand-building objectives and broad reach.
ValuationFor our valuation, we take a weighted average of our base-case, bull-case, and bear-case scenarios. Based on this weighted average, we are increasing our fair valueestimate to $39 per share from $29 to account for a significantly higher bull case andmodestly higher base case, driven by acceleration in monthly average users andhigher ad revenue per user metrics. In our base-case scenario, several growth leverscontribute to revenue and cash flow growth, and although the firm achievesmeaningful growth in users, Twitter's network reaches about half of Facebook's userbase. In this model, MAUs grow at a 21% compound annual growth rate through2022. Additionally, ad revenue per user grows at a 22% CAGR to nearly $13. We alsoconsider different usage levels within the user base. In the base case, heavy userscontribute $19 per year and casual users contribute only $4 per year. Total companyrevenue reaches $13 billion in 2022, while operating margins reach 28%. Returns oninvested capital are approximately 20% at the end of our forecast period. Based onour 10-year discounted cash flow model, this scenario yields a $30 fair valueestimate.
RiskThe biggest risk to our investment thesis is that the growth potential has saturated,and Twitter never grows into the mainstream Internet population. As a niche product,advertisers are unlikely to dedicate a large percentage of their advertising budgets tothe platform. Additionally, the company must successfully launch new advertisingproducts in order to increase ad revenue per user, translating into top-line sales andbottom-line cash flows. Ultimately, the operating model has not been proved, so ouroperating margin assumptions may prove unattainable as well.
Management & StewardshipDick Costolo has served as CEO since October 2010, having worked at the firm since2009. Before joining Twitter, Costolo ran several startup technology companies,including a company that was sold to Google, where he then worked for a couple ofyears. The management team consists of several nonfounders, including Mike Gupta(formerly of Zynga and Yahoo) as CFO and Adam Bain (from News Corporation) aspresident of global revenue.This management team has been credited with improvingthe infrastructure and technology powering the Twitter application, as well asdelivering new advertising products and scaling revenue growth. We believe itsinterests are aligned with shareholders', although we acknowledge that Twitter'slimited operating history and lack of history as a public company provide littleevidence. Still, we are encouraged that, unlike other high-profile initial publicofferings, this company has not used a dual-class structure for its commonshares.Investors should be aware that venture capital firms will own roughly 46% ofthe outstanding shares, and their objectives may be more short-term than othershareholders'. We would expect most of those shares to be sold into the openmarket some time after the lockup period expires (180 days after the company beginstrading).
ProfileTwitter is an Internet platform that individuals and companies use to post shortmessages (a maximum of 140 characters) that are publicly visible. The companycounts more than 271 million monthly active users. Individuals tend to self-organizebased on topics of interest (for example, finance or sports) and form a loose socialnetwork. Advertising generates nearly 90% of revenue. The service is mostly knownfor its real-time content.
?
Page 16 of 68

Generated on November 04, 2014
Analyst Digest | 2014 Thesis Portfolio | October 05, 2014 - November 04, 2014
Technology Select Sector SPDR® ETFXLK | QQQQ
$40.53 h$0.95 | 2.40%ETF Valuation Rating (as of 11-03-2014) Fairly Valued
ETF Market Price (as of 11-03-2014) $40.71000
Fair Value Estimate $38.41
Consider Buying Price $30.60
Consider Selling Price $46.66
ETF Expected Return 7.93%
ETF Hurdle Rate 15.71%
ETF Expected Excess Return -7.78%
Morningstar Coverage 98.99% of assets
68 of 72 Holdings
Stock Quality (as % of assets) 50.86% Wide Moat
44.89% Narrow Moat
3.10% No Moat
Fair Value Uncertainty High
09-11-2014 | by Robert Goldsborough
The Thesis 09-11-2014Suitability Technology Select Sector SPDR XLK offers investors broad exposure to thetechnology sector. As a sector-specific exchange-traded fund, XLK should be viewedas a tactical investment, suitable only for the satellite portion of a diversifiedportfolio. XLK holds large-cap names, so it is not suited for investors looking forexposure to more-speculative small- and mid-cap tech firms. This fund is very top-heavy; the top-10 holdings account for 58.5% of the portfolio. And XLK has a veryhigh-quality portfolio: Wide-moat and narrow-moat firms account for about 51% and44% of assets, respectively. In other words, Morningstar's equity analysts believethat 95% of XLK's portfolio is invested in firms that have sustainable competitiveadvantages.Sector SPDR ETFs are very high-quality because they draw from the S&P 500 Indexand have a very large-cap tilt.Even large-cap technology firms are more volatile than the broader market. That said,this ETF has had a volatility of return of 16.8% over the past decade. That's certainlyhigher than the S&P 500 Index's volatility of return of 14.7%, but it still is relativelylow and speaks to the stability offered by some of these large-cap tech behemoths. Fundamental View The single largest dynamic affecting the U.S. tech sector right now is theongoing shift toward mobile computing and the growth in cloud computing. Mobileand cloud computing are truly a disruptive force in the tech sector. As users shift tomobile devices, PC sales continue to fall. Global PC shipments dropped by 10% in2013, with the multiyear declines in developed markets now being accompanied bymoderate declines in emerging markets. Despite declines in PC sales, the totalnumber of devices sold actually is expected to rise meaningfully in the years to come,as consumers and businesses adapt to smartphones and tablets. In fact, our analystsproject that in 2017, some 2.6 billion-plus computing devices will ship--more thantwice the total number of devices that shipped in 2012.Across the U.S. tech sector, firms have been reshaping their portfolios for thisongoing transition. Microsoft MSFT recently acquired Nokia's NOK handsetbusiness and has developed the Windows Phone operating system, while Intel INTC
has been investing heavily in producing microprocessors optimized for mobiledevices. Apple AAPL long has led the marketplace with its iPhone and iPad,continually gaining share from struggling competitors. And Google GOOG long hashad a dominant position in Internet search but has been very successful ataggressively investing in its Android operating system for smartphones and tabletsand providing it free of any license fees, which means that having Google softwareon the device helps to ensure that when users search, they use Google. Enterprisehardware suppliers have been reshaping their businesses as well.Despite strong valuations in the U.S. tech sector, the merger and acquisition marketin the tech arena remains healthy. Investors should expect to see continued M&Aactivity from firms still looking to round out their portfolios, particularly in keystrategic areas of tech such as mobile and cloud-based computing. The multiples ofacquisition targets have risen as well, so investors should be on the lookout for thepossibility of tech firms overpaying for external growth. In most cases, buyers appearto be justifying paying steep multiples by citing some combination of cost andoperational synergies and forecasts of aggressive growth expectations.Broadly, we have confidence in tech firms' positioning for growth in the mediumterm. Tech stocks generally are pro-cyclical in their performance, and as the economystrengthens in the short and medium term, tech firms in general should do well. TheGartner Group forecasts that tech spending will grow 3.1% in 2014 to $3.8 trillion. Aslarge tech players manage and reshape their businesses to adapt to secular declinesin PC demand, we expect that they will continue to find ways to benefit fromsmartphone and tablet growth. To be sure, not all tech players will be winners in aworld dominated by mobile computing and cloud computing. For instance, we viewcloud computing as a moderate threat to all IT infrastructure suppliers, as cloudservice providers are technically savvy customers. That means that as enterprisesmigrate their infrastructure to these service providers, infrastructure suppliers'pricing power likely will decrease.Apple makes up 15.5% of XLK's assets, making it far and away this fund's largestholding. Apple has rebounded in 2014 after a turbulent 2013. The company hasbenefited from strong earnings reports that have beaten expectations and beendriven by solid iPhone unit sales in both developed markets and in China. Also drivingthe runup, Morningstar's equity analysts believe, was tremendous anticipation foriPhone 6s and the iWatch wearable device. As a result, Apple is keeping loyalcustomers in developed markets but is picking up millions of first-time iOS devicebuyers in China as well. Despite some concerns earlier in the year about little iPhonegrowth despite a new partnership with China Mobile CHL, the partnership clearly is asuccess thus far. IPad sales continue to decline significantly, but there are muchlower gross margins on tablets than on iPhones, and a shift toward "phablets" andaway from iPad Minis could be good news for Apple. Near-term headwinds remain astronger U.S. dollar, a rapidly declining iPod market, concerns around iCloud security,heightened phablet competition from Samsung's Galaxy Note Edge, greater revenuedeferrals on new product sales, and differences in the timing of iPhone and iPadlaunches in China. Still and all, Morningstar's equity analysts' long-term view ofApple's fundamentals remains unchanged.
Fees & AlternativesThis ETF carries a 0.16% expense ratio, which is cheap relative to similar technologyfunds but slightly higher than Vanguard Information Technology ETF's VGT 0.14%fee. Alternatives Investors seeking exposure to the tech sector can consider VanguardInformation Technology ETF VGT and iShares US Technology IYW, which carryexpense ratios of 0.14% and 0.43%, respectively. These funds and XLK are almostperfectly correlated but do have small portfolio differences. In addition to informationtechnology companies, the Vanguard ETF--like the Tech SPDR -- has a 7.5%allocation to IT services companies like Visa V and Accenture ACN. The Tech SPDRhas an 11% allocation to telecom services companies such as AT&T. The iSharesfund does not hold any telecom services or IT services companies and therefore canbe considered the pure-play broad technology ETF.A recently launched and very inexpensive option is Fidelity MSCI InformationTechnology ETF FTEC, which charges 0.12%. However, FTEC has minimal assets and
?
Page 17 of 68

Generated on November 04, 2014
Analyst Digest | 2014 Thesis Portfolio | October 05, 2014 - November 04, 2014
is thinly traded. FTEC tracks a slightly different index from Vanguard InformationTechnology ETF; FTEC tracks the MSCI USA IMI Information Technology Index, whileVGT tracks the MSCI US Investable Market Information Technology 25/50 Index.Fidelity customers with a minimum balance of $2,500 can buy FTEC commission-free,although they are subject to a short-term trading fee by Fidelity.The tech-heavy PowerShares QQQ QQQ (0.20% expense ratio) is also a suitablealternative as it has had a near-perfect (98%) positive correlation with XLK over thepast 10 years, thanks to its 59% exposure to the tech sector.
Portfolio ConstructionThis fund is one of nine Select Sector SPDRs. It tracks the technology sector of theS&P 500 Index and holds 71 companies. XLK's holdings are based on a modifiedmarket-cap-weighting methodology, and the top-10 holdings account for a verysignificant 58.5% of the total portfolio. The largest subsector weightings arecomputers and peripherals (21%), software (17%), IT services (15.5%), Internetsoftware and services (15%), and telecom services (11%). The average market cap ofXLK's holdings is $126 billion.
?
Page 18 of 68

Generated on November 04, 2014
Analyst Digest | 2014 Thesis Portfolio | October 05, 2014 - November 04, 2014
Panera Bread Co Inc PNRA | QQQ
$161.84 -x$6.05 | –3.60%Fair Value Estimate $178
Consider Buying Price $124.6
Consider Selling Price $240.3
Fair Value Uncertainty Medium
Economic Moat None
Stewardship Grade Standard
08-19-2014 | by R.J. Hottovy
Analyst Note 10-29-2014We have greater conviction in the assumptions underpinning Panera's $178 fair valueestimate following a third-quarter update indicating that recent customer experienceinvestments--including additional peak-hour throughput capacity, more assessablemenu price points, new marketing tactics, and digital ordering--are having a positiveimpact on comparable sales trends. The 2.1% increase in company-owned compswas backed in large part by a 1.4% uptick in transactions (with a notable 4%increase in transactions during the peak lunch hour between 12 p.m. and 1 p.m.).With these trends accelerating in the fourth quarter (October-to-date company-owned comps have increased 3.3%) and delivery/catering hubs poised to becomemore meaningful contributors in the years to come, we fully anticipate Panerasustaining average comps in the low- to mid-single-digit range over an extendedhorizon.As expected, the costs associated with these initiatives and commodity costheadwinds are expected to weigh on profitability through 2015, reflected inmanagement's updated outlook calling for a 200- to 225-basis-point decrease inoperating margins during 2014 (implying operating margins just under 11% in 2014)and our expectations for little, if any, margin improvement in 2015. However, ascomparable-transaction trends continue to improve over the next year at the sametime customer experience investments wind down, we believe Panera's longer-termmargin expansion opportunity will become more apparent. Over the next five years,we continue to forecast around 9% average annual top-line growth (6.0% unitgrowth and 3.5% comps) with consolidated operating margins reaching 14%.Certainly, a more competitive fast-casual restaurant landscape provides potentialdownside risks to our assumptions, but we believe transformation efforts will spurgreater unit-level productivity while enhancing Panera's operating leverage, betterpositioning it to compete with existing and emergent category rivals.
The Thesis 08-19-2014Despite increased competition, fast-casual operator Panera remains one of the moreintriguing stories in the restaurant industry. A brand that commands pricing power,customer loyalty, upscale restaurant environments, and margin-friendly menuadditions have put Panera among industry leaders in sales productivity (average unitvolumes of $2.4 million) and restaurant-level margins (19.6% in 2013). Althoughthere have been many chains that looked promising before succumbing tooverextension or competition, we are optimistic that Panera will balance growth withprofitability, creating excess economic returns. With systemwide sales of $4.3 billionin 2013, Panera represented 12% of the $35 billion domestic fast-casual industry andmore than half of the $8 billion domestic fast-casual bakery-cafe category. Weexpect fast-casual restaurants--which offer higher-quality ingredients than quick-service chains but at lower average prices than casual dining restaurants--to grownearly 10% during the next few years because of a compelling consumer valueproposition and strong unit economics (lower real estate and labor costs than casualdining operators). This exceeds our low-single-digit growth forecast for therestaurant industry, implying market-share gains for Panera. Based on consumers'
acceptance of the brand and commercial real estate availability, we believe Paneracan add 1,200 new locations over the next 10 years, implying 3,000 locations by theend of 2023.Despite Panera's positives, even well-managed chains are susceptible tounfavorable industry conditions, including consumer spending and food/labor costheadwinds and fast-casual category competition. Ultimately, we believe Panera canstill drive same-store sales though peak-hour throughput expansion, labor andproduction equipment investments, and a streamlined (but still innovative) menu,though these endeavors will limit margin expansion opportunities in 2014-15. We'realso intrigued by new growth avenues such as delivery and catering hubs, a greaterpush into consumer packaged goods, and usage of mobile devices and other digitaltechnology to engage with consumers and improve store-level operations.
ValuationOur fair value estimate is $178 per share, which implies 23 times our 2015 EPSestimate, an enterprise value that is 10 times our 2015 EBITDA estimate, and a freecash flow yield of about 3% following a reduction in the company's currentinvestment cycle. For 2014, our model is aligned with management's expectations of0%-1.5% same-store sales growth at company-owned locations, assumes 175 basispoints of operating margin contraction to 11.2% (compared with management'sforecast of 135-185 basis points of contraction), and EPS of $6.79 (which includesbuybacks and compares with current guidance calling for $6.65-$6.80). Lookingahead to 2015, we expect same-store sales to improve to 3% as Panera increasinglygains traction with restaurant productivity efforts such as peak-hour throughputinvestments, higher-ticket signature items, meal upgrade programs, catering, andcustomer loyalty program engagement. We also expect investments behind theseinitiatives to taper down during the back half of the year, resulting in a slight, 10-basis-point increase in operating margins.Over the next decade, we expect Panera toopen 120-130 units per year (representing mid-single-digit annual unit growth) anddeliver low- to mid-single-digit comps (even with increased fast-casual competition)resulting in high-single-digit average annual revenue growth. These assumptionsimply there will be 3,000 Panera locations by 2023. During that same time horizon,we expect restaurant-level margins to grow to the 23% range (compared with 19.6%in 2013) with operating margins to expanding to around 17% driven by higher-marginmenu additions (including a mix shift to the breakfast daypart), increased fixed-costleverage, a vertically integrated supply chain, and incremental contribution fromcatering and delivery operations.For 2014, management is projecting capitalexpenditures of $225 million-$250 million (9%-10% of revenue), but we expect thispace to moderate over the next 10 years (with approximately 4%-5% of revenuebeing an appropriate normalized run rate for capital expenditures over a longerhorizon).
RiskWe have assigned Panera a medium uncertainty rating. The company faces increasedcompetition on several fronts. Some quick-service restaurant chains are upgradingtheir menus and decor, while many casual dining firms have become more focusedon enhancing their value proposition. Additionally, with retail landlords looking fortenants for unoccupied real estate and restaurant operators finding themselves witheasier access to capital in recent months, we believe emergent fast-casualrestaurant concepts will set aggressive growth targets in the years to come. If itsbrand appeal isn't as wide as we believe, Panera could face market saturationsooner than anticipated. Demographic shifts, an increasing number of mealsprepared at home, and ongoing consumer spending headwinds could damp top-lineresults. Food, labor, energy, and occupancy cost volatility could disrupt quarter-to-quarter results.
Management & StewardshipFounder Ron Shaich, who came out of retirement in March 2012, resumed the role ofsole CEO when former co-CEO Bill Moreton transitioned to executive vice chairman inAugust 2013. Generally speaking, we do not expect any disruptions under thisleadership arrangement and we believe Panera's strategic planning and corporateoversight functions are on solid footing. Shaich earned $2.7 million in fiscal 2013 (a
?
Page 19 of 68

Generated on November 04, 2014
Analyst Digest | 2014 Thesis Portfolio | October 05, 2014 - November 04, 2014
base salary of $793,500, stock awards worth an estimated $600,000, and nonequityincentive plan compensation of $672,000), which strikes us reasonable relative toindustry peers. As of the most recent proxy statement, Shaich owned 4.8% ofPanera's Class A shares and 84.2% of its Class B shares (representing 11.8% of thecombined voting power), which is sufficient to align his interests with commonshareholders, in our view. Although we hold the executive management team in highregard, we believe corporate stewardship could be improved by the elimination ofmeasures to limit the powers of outside shareholders, including the dual-classstructure, staggered board elections, and other takeover defenses. Still, with a strongtrack record of capital allocation including making acquisitions at reasonable prices(traditionally between 5 and 6 times trailing EBITDA) and prudent share repurchaseactivity, we've assigned Panera a standard stewardship rating.
ProfilePanera Bread is the largest player in the almost $8 billion-plus fast-casual bakery-cafe restaurant category. The company owns and franchises bakery-cafes under thePanera Bread, Saint Louis Bread Co., and Paradise Bakery brands, specializing inbaked goods, sandwiches, soups, salads, and custom-roasted coffees. Locations areprimarily in suburban strip malls and regional malls across the United States. As ofJune 2014, the firm had almost 1,820 bakery-cafes, including 890 company-ownedand 930 franchised locations.
?
Page 20 of 68

Generated on November 04, 2014
Analyst Digest | 2014 Thesis Portfolio | October 05, 2014 - November 04, 2014
Twenty-First Century Fox Inc FOX |
QQQQ
$31.46 -x$1.57 | –4.75%Fair Value Estimate $37
Consider Buying Price $25.9
Consider Selling Price $49.95
Fair Value Uncertainty Medium
Economic Moat Wide
Stewardship Grade Standard
08-15-2014 | by Neil Macker
The Thesis 08-15-201421st Century Fox possesses a vast array of media enterprises worldwide. We believethe company enjoys strong competitive advantages based on its worldwide cablenetworks, along with its film and television studios. The filmed entertainmentsegment generates a number of hit television programs and movies annually. 20thCentury Fox owns both robust film franchises and a strong television productionstudio, both of which are important given our premise that the value of qualitycontent will increase. Its studios currently produce 70% of the prime-time slate onFox and the majority of the original programming on its cable channels, while alsocreating programs for other networks such as Modern Family on ABC. The criticalacclaim for the studio’s content, along with its willingness to place shows on theright outlet, creates a virtuous cycle which retains the creators of the studio’s hitshows and attracts new creators to the platform.Consumers still consume news andsports programming in real time, not time-shifted on a DVR--a trend that advertisersvalue. Fox News remains the market leader in news and its recent growth has turnedit into one of the 10 most-watched cable channels. As distributors cannot afford toblackout popular channels, we expect Fox to leverage this position into earninghigher affiliate fees over the next several years. The Fox broadcast network providesthe company with an important platform for showcasing content as broadcasters arethe only outlet to reach almost all 110 million households in the U.S. The networkholds the rights for the NFL, college football, MLB, and other sports. We believe thatthe combination of original programming and exclusive sports rights will allow FOXto sharply increase its revenue from retransmission fees and reverse compensation inthe near future.Fox also has a large international cable channel segment with over300 channels reaching 1.4 billion households. Pay-television penetration remainsbelow 50% in many emerging countries. While penetration in these countries maynever approach the 90% level of the U.S., we believe that it will continue to expandover the near future.
ValuationOur $37 fair value estimate for 21st Century Fox implies a 20.6 price/earnings ratioon our fiscal 2015 adjusted EPS estimate. We forecast total revenue to increase atan average annual clip of 7.7% from fiscal 2014 through 2018. We expect averageannual growth of 9.5% at the cable networks, fueled by affiliate fee increases in theU.S. and growth internationally where we expect pay-TV penetration to improve. Weforecast 2.0% average annual growth for the filmed entertainment studio and 4.0%growth for the television segment. We expect overall operating margins to expand to21.3% in fiscal 2018 from 17.6% in fiscal 2014 as the higher-margin cable networksbusiness continues to become a larger portion of the firm's overall operating profit.Note that our current fair value estimate retains the impact from the direct broadcastsatellite segment. Fox recently announced the sale of the segment to BSkyB (alsocontrolled by the Murdoch family). Sky Italia will be sold for $3.51 billion after the
transfer of its stake in the National Geographic channel back to 21st Century Fox.BSkyB will also pay GBP 2.9 billion or EUR 6.75 ($9.08) per share for Fox’s 57% stakein Sky Deutschland. The deal provides 21st Century Fox with cash for an improved bidon Time Warner. The sale is subject to shareholder and regulatory approvals. We arewaiting for the deal to close before removing the segment from our forecasts. Ourfair value estimate does not include any impact from a potential merger with TimeWarner. On July 16, Time Warner disclosed that its board rejected an unsolicitedstock and cash bid from Fox. The bid was reportedly for 1.531 FOXA shares and$32.42 in cash per TWX share, valuing Time Warner at $80 billion, or $85 per shareat the time of the offer. While Time Warner reportedly is not engaging with Fox,Murdoch has generally gotten his target even after being rebuffed the first time. Weexpect Fox to up its bid for Time Warner given the recent BSkyB transaction.
RiskThe new business models proliferating throughout the media sector could diminishFox's revenue growth or profitability. Viewership of its programs could fall belowexpectations, and advertisers could pull back on their spending, both of which coulddrag on advertising sales growth. The cost of sports rights may continue to skyrocket,putting pressure on margins. The company may overpay if Murdoch raises the bid forTime Warner.
Management & StewardshipFox's stewardship of shareholder capital is standard, which we base on the longcorporate history of News Corp. before the spin-off. Chairman and CEO RupertMurdoch begin in 1952 with his family's small newspaper firm in Australia, which hethen built into one of the largest global media conglomerates. Murdoch controlsroughly 40% of the voting power in Fox despite only having a 14% economic interestin the company. Murdoch's past successes include starting the Fox broadcastnetwork and Fox News Channel in the U.S. Murdoch’s recent moves reinforce ourbelief that he wants his family to remain in charge when he eventually retires. Hisyounger son James was recently promoted to co-COO of FOX and placed in charge ofthe Fox Networks Group, in addition to his prior responsibility of running the direct-broadcast satellite TV segment. James Murdoch will continue to report to presidentand COO Chase Carey and to serve as his right-hand man. Most observers believethat James is being groomed to eventually fill the CEO role. However, we believeCarey remains next in line for the CEO spot if it becomes available in the next fiveyears, as he is more prepared than James . We are confident that the companywould be in solid hands if Carey stepped into the CEO role. Carey previously served asix-year stint as CEO of DirecTV and served as COO of News Corp from 1996 to 2002.In the past, Fox has implemented shareholder-unfriendly provisions such as theintroduction of a poison pill and a staggered board of directors.
Profile21st Century Fox is a media conglomerate with a wide range of assets: a film studio,which creates television programs and movies; broadcast television, including theFox broadcast network and local TV stations in the U.S.; cable networks, whichcomprise over 300 channels around the world; and direct-broadcast satellite TV inthe form of SKY, a satellite pay-tv provider in Europe.
?
Page 21 of 68

Generated on November 04, 2014
Analyst Digest | 2014 Thesis Portfolio | October 05, 2014 - November 04, 2014
Kroger Co KR | Q
$56.75 h$3.87 | 7.32%Fair Value Estimate $37
Consider Buying Price $25.9
Consider Selling Price $49.95
Fair Value Uncertainty Medium
Economic Moat None
Stewardship Grade Exemplary
08-11-2014 | by Ken Perkins
Analyst Note 09-11-2014During the second quarter, Kroger reported its 43rd consecutive period of positiveidentical-store-sales growth, which was driven by growth in all categories andregions of the U.S. Management also increased its guidance for identical-store-salesgrowth to 3.50%-4.25%, which is up from 3.0%-4.0% previously, and we mayincrease our $37 fair value estimate slightly as we incorporate higher near-termsales guidance and the time value of money.We continue to believe that Krogerremains the strongest traditional grocer in the U.S., but the current share priceimplies that Kroger can sustain the high end of its identical-store-sales growth targetrange (2.5%-3.5%) and expand operating margins over the next 10 years. Theseresults are not beyond the realm of possibility, but given that competition continuesto increase from specialty grocers, nontraditional grocers, small-store chains, andonline competitors and switching costs are virtually nonexistent, we believe there ismore risk to buying shares of this no-moat grocer at current price levels, and wewould require a greater margin of safety.Identical-store-sales, excluding gas prices,increased 4.8%, driven by strong volume trends and inflation (which managementnoted was up a little more than 2% in the quarter). Further, management added thatconsumers are feeling more confident and willing to spend more on discretionaryitems, but that they also remain concerned about the economy. We believe thatthese consumer trends will persist, and while we expect that the low-end consumerwill remain very cost-conscious, we think Kroger’s broad customer base and private-label offerings will allow the company to generate 4% identical-store-sales growththis year and 3% longer term.
The Thesis 08-11-2014Of the traditional U.S. grocers, Kroger is best positioned to handle competitivepressures from nontraditional grocers, in our view. Switching costs are virtuallynonexistent in the grocery industry, and price competition has become even fiercerover the past few years due to expanded food offerings at firms such as Wal-Mart,Target, and Costco. These firms use food as a loss leader to drive traffic into stores,which makes it very difficult for traditional grocers, which generate profits from foodsales, to maintain price parity while preserving margins.Despite these pressures, webelieve Kroger has been more competitive than its traditional grocer peers. With over2,600 store locations and nearly $100 billion in sales, Kroger has established scalethat allows it to negotiate volume discounts with suppliers and better leverage fixedcosts to compete with large rivals. In addition, Kroger partners with consumeranalytics firm Dunnhumby to offer personalized promotions for customers possessingthe firm’s loyalty card. Kroger has also been successful at pushing its private-labelproducts (penetration more than 25%, versus the national average of about 20%),which typically carry higher margins. Kroger manufactures 40% of these company-branded products, giving the firm more control over its supply chain and allowing it tocapture all profits from producing and selling these goods. Finally, almost 50% ofKroger’s locations have gasoline offerings, which allow the company to weaken thethreat posed by rivals’ attempts to lure traffic by offering gasoline. We believe the
combination of these factors has allowed Kroger to invest enough in price to remaincompetitive relative to large multinationals.
ValuationWe are raising our fair value estimate for Kroger to $37 per share, up from $35 pershare, primarily to reflect adjustments for the time value of money. Our base-casefair value reflects square footage growth of about 1% annually over the next decade,and identical-store sales growth of around 3.5% over the next five years and near3% (the middle of management's 2.5%-3.5% long-term target) over the latter stagesof our explicit forecast period. These forecasts reflect modest traffic growth andpricing in line with inflation. Our updated fair value estimate also incorporatesKroger's recent acquisition of Harris Teeter, which should add about 4% to totalsales and generate cost synergies of $45 million-$50 million, a relatively immaterialamount relative to pro forma combined sales of more than $100 billion. We expectKroger will reinvest productivity improvements into gross margin, which we forecastto average between 20% and 21% over the next five years (versus a three-yearhistorical average of 20.7%). Similarly, we believe Kroger will reinvest cost SG&Acost savings into pricing to remain competitive, although we think the company couldbenefit modestly from fixed-cost leverage. We forecast operating margins to averagejust under 3% over the next decade, in line with (adjusted) historical figures. Weincorporate Kroger's underfunded pension plan into our fair value estimate; theunderfunded pension plan negatively affects our fair value estimate by approximately5%-10%.Despite our positive relative stance on Kroger, we believe the market priceleaves little margin for error. Increasing competition could pressure top-line growthand/or margins, but the current market price implies that Kroger can sustain 3.5%identical-store sales growth, the high end of management’s range, over the long termwhile generating 3.1% average operating margins (versus a 2.6% average marginover the past six years and a 2.8% margin in fiscal 2013). We think these results areachievable, but given competitive threats, we believe the probability of bothoccurring simultaneously is lower than the market projects.
RiskWe assign medium uncertainty risk rating to Kroger. The defensive nature of thegrocery industry, as well as Kroger’s past ability to endure the endless competitiveincursion from nontraditional food retailers, has allowed the company to generatesteady cash flows. Still, the company’s top-line growth could be challenged duringrecessionary economic environments, particularly if the pricing environment becomesultra-competitive as firms seek to drive traffic. In addition, input cost volatility couldchallenge Kroger’s profitability in any given period. Kroger manufactures myriadproducts ranging from milk to dog food, giving the firm diversified commodityexposure but also leaving it vulnerable to aggregate commodity inflation.
Management & StewardshipWe assign Kroger an Exemplary stewardship rating, as the company has consistentlydriven identical-store-sales growth, taken market share, and generated excessreturns on capital despite intensifying competition. We believe Kroger’s strongstewardship reflects an experienced management team and a performance-basedcompensation structure that encourages management to make decisions that arealigned with the long-term interests of shareholders. David Dillon, who was namedCEO of Kroger in 2003 and chairman of the board in 2004, stepped down as CEO atthe beginning of January 2014. Dillon is still chairman of the board but wassucceeded by current CEO Rodney McMullin, who has worked in several roles in his30-plus years at the firm. We think McMullin has ample experience to draw fromwhile making strategic decisions to confront new competition. Historically, onlyabout 10% of CEO pay was awarded in the form of base salary, while about 30%was from pension and deferred compensation and the remainder was awarded in theform of stock/option awards. To determine annual cash-based compensation, thecompany measures performance relative to annual targets for identical-store sales(excluding fuel) and EBITDA (excluding fuel). The annual bonus also takes intoaccount performance regarding strategic efforts (undisclosed due to competitivereasons) and fuel operations. Long-term compensation is determined based upon
?
Page 22 of 68

Generated on November 04, 2014
Analyst Digest | 2014 Thesis Portfolio | October 05, 2014 - November 04, 2014
three-year performance relative to stated goals. Kroger measures operating costs (asa percentage of sales), associate engagement levels, and return on invested capitalto determine long-term compensation.
ProfileKroger is one of the largest retailers in the U.S. The company operates more than2,600 supermarkets, 750 convenience stores, and 325 jewelry stores in 31 states. Inaddition to its namesake banner, Kroger operates several other banners, includingRalphs, Fred Meyer, King Soopers, Fry’s, and Food 4 Less. Kroger also acquired HarrisTeeter Supermarkets, Inc. at the end of fiscal 2013.
?
Page 23 of 68

Generated on November 04, 2014
Analyst Digest | 2014 Thesis Portfolio | October 05, 2014 - November 04, 2014
E I du Pont de Nemours & Company DD| QQQ
$68.63 -x$2.01 | –2.85%Fair Value Estimate $64
Consider Buying Price $38.4
Consider Selling Price $99.2
Fair Value Uncertainty High
Economic Moat Narrow
Stewardship Grade Standard
10-28-2014 | by Jeffrey Stafford
The Thesis 10-28-2014DuPont is known by most as a chemical producer, but over the years, its portfolio hasshifted markedly to agriculture, nutrition, and biosciences. The agriculture businessnow makes up about a third of DuPont's operating profit. The company brings newgenetically modified seed and crop chemical offerings to market in a similar way to apharmaceutical company researching and developing new drugs. Competition in theseed industry is stiff, with wide-moat Monsanto leading the pack. That said, webelieve DuPont has done work over the past several years to close the gap withMonsanto, particularly in corn seeds. Further, DuPont has bested Monsanto in recentyears in marketing and distribution with its more regional strategy and direct-sellingmodel. We think both companies will benefit from the demands that an increasing(and richer) population will put on farmers to grow more food. Another important cogin the portfolio is the performance chemical business, which houses titanium dioxideproduction. TiO2 is a commodity product used mainly as a hiding agent in paints.While the commodity nature of TiO2 can lead to wild swings in profits forperformance chemicals, DuPont benefits from its position on the low end of the costcurve. The company employs a unique chloride-ilmenite process that allows it toconvert low-grade feedstock to high-grade TiO2 at a lower cost than competitors.DuPont maintained double-digit operating profitability during the recession, whilecompetitors struggled to stay in business. Recently, DuPont announced plans to spinoff the performance chemicals business.DuPont's advanced materials business hasproduced some noteworthy (and high-profit) products over the years. The companyinvented products such as Lycra and Kevlar, which have wide applications in textilesand safety equipment. Teflon, which is used in nonstick cookware, and Tyvek,broadly used in construction materials, also demonstrate DuPont's successful productdevelopment and innovation. The company has a solid record of innovation, and wethink it will be able to replace earnings from older products as they fall out of favoror are leapfrogged by new technologies.
ValuationOur fair value estimate for DuPont is $64 per share. Our fair value estimate, based ona discounted cash flow model, implies a price/earnings ratio of 16 times and anenterprise value/EBITDA ratio of roughly 9 times based on 2014 estimates. Althoughthere will be near-term pressure on seed sales as some North American farmersswitch from corn to soybeans, we expect the agriculture segment will drive growthfor the company over the long run, as it introduces new products and grabs its fairshare of emerging-market growth, particularly in South America. The acquiredDanisco businesses also stick out as potential growth drivers. We think totalcompany margins will improve going forward, but we believe the company may fallshort of its target of 12% average growth in earnings per share. We use a 12% costof equity in our model.
RiskDuPont faces stiff competition in the seed and crop chemical markets. There is noguarantee the firm's investments in researching and developing the next generationof biotech traits will bear fruit, and the company could fall further behind Monsanto.Other risks in agriculture include the possibility that weeds and bugs could developresistance to the firm's products, rendering the company's technology useless.Additionally, consumer sentiment could turn against bioengineered crops in theUnited States and South America, similar to conditions currently prevailing in Europe.The failure to develop new products could also hit the firm's other businesses.Further, as a manufacturer, increased costs for raw materials and energy couldnegatively affect margins if the company is not able to pass on higher costs tocustomers. In DuPont's commodity products, including titanium dioxide, oversupplycould drive prices lower and damage profitability.Our uncertainty rating for DuPont ishigh. The company's ability to continue developing innovative products is uncertain,especially given tough competition. DuPont still produces a number of commodityproducts whose demand fluctuates with economic conditions. On the upside, growthcould accelerate if the company develops a new blockbuster product in agriculture ormaterials.
Management & StewardshipWe think DuPont's stewardship of shareholder capital is Standard. Ellen Kullmanbecame chairman and CEO in 2009, having been with the company for decades andworking in various divisions. She replaced CEO Charles Holliday, who had served thecompany since 1998. Kullman has put her stamp on shaping DuPont with theacquisition of Danisco, the divestiture of the performance coating business, and nowthe upcoming spin-off of the firm's performance chemicals unit. We like the efforts topush DuPont's portfolio toward more specialized businesses. DuPont purchasedDanisco in 2011 for $5.8 billion, valuing the company at nearly 14 times EBITDA.While the valuation was considered rich for the industry, DuPont probably paid a highenough price to ensure a successful closing of the deal without landing in apotentially costly bidding war (Royal DSM later announced that it had accumulatedDanisco's shares at the same time). Subsequently, DuPont sold its performancecoating business--which focused on auto OEM, refinishing, and industrial coatings--for $4.9 billion and $250 million in other postemployment benefits liabilityassumption. The sale price valued the segment at roughly 14 times trailing 12-monthEBITDA, which we think is an attractive valuation for DuPont's shareholders. Theperformance chemicals spin-off will focus DuPont on higher-growth industries, butwe liked the competitive advantages the unit holds in the production of titaniumdioxide. We expect the company will return cash to shareholders through an activestock-repurchase program and steady dividend stream.
ProfileDuPont is a diversified chemical company operating in more than 80 countries. Itsmassive portfolio includes agriculture, feed and nutrition, electronics andcommunication, construction and transportation, and safety and protection. DuPonthas tried to move into more specialized products, and acquiring Danisco plays to thisstrategy. The company has also increased its research into genetically modified seedtechnologies, making it one of the most prominent global seed providers.
?
Page 24 of 68

Generated on November 04, 2014
Analyst Digest | 2014 Thesis Portfolio | October 05, 2014 - November 04, 2014
Alerian MLP ETF AMLP | QQ
$18.31 -x$0.75 | –3.91%ETF Valuation Rating (as of 11-03-2014) Overvalued
ETF Market Price (as of 11-03-2014) $18.56000
Fair Value Estimate $19.54
Consider Buying Price $13.26
Consider Selling Price $17.79
ETF Expected Return 11.93%
ETF Hurdle Rate 22.19%
ETF Expected Excess Return -10.26%
Morningstar Coverage 58.19% of assets
12 of 26 Holdings
Stock Quality (as % of assets) 47.97% Wide Moat
10.08% Narrow Moat
% No Moat
Fair Value Uncertainty Medium
07-17-2014 | by Abby Woodham
The Thesis 07-17-2014Suitability Investors drawn to the yield and solid fundamentals of master limitedpartnerships have made ALPS Alerian MLP ETF one of the fastest-growing exchange-traded products today. MLP funds like AMLP attempt to address the complications ofdirect MLP ownership--namely, that K-1 forms must be filed in every state each MLPoperates in. AMLP offers advantages such as simplified tax filing (investors receive astandard 1099 form) and diversification. Because it is an exchange-traded fund,AMLP also passes the deferred tax treatment of MLP distributions on to its investors.However, the fund has major drawbacks. AMLP is a corporation, not a fundregistered under the Investment Company Act of 1940 like most ETFs, because open-end funds are not allowed to have more than 25% of their portfolio in MLPs. Thefund is liable for taxes at the corporate level, which has caused AMLP to lag itsunderlying index by a staggering 8% annualized since inception through the end ofFebruary. With other investment options available that track the performance ofMLPs much more closely, investors should carefully examine whether AMLP's costsare worth its benefits.AMLP's lagging performance is a byproduct of how tax-deferred MLP distributionsbehave in a fund structure. MLP unitholders are liable for taxes on their share of thepartnership's income every year. Fortunately, the bulk of MLP distributions isconsidered a return of capital because MLPs use depreciation to offset their netincome. Instead being an immediately taxable event, distributions reduce aninvestor's cost basis. Taxes are only owed on the distributions when an investor sellstheir units. At that point, the IRS views the income as recapture of past depreciationdeductions, and investors will owe their ordinary income rate. Functionally, theinvestor is able to defer paying taxes on distributions until they sell their shares.Because AMLP is a corporation, the fund itself has to pay corporate taxes on theadjusted cost basis when it sells underlying investments or if it ever liquidated.AMLP accrues for this future tax liability in its net asset value, which means AMLPmust give up about 38% of its return in every year when the fund's total return ispositive. Because MLPs have done so well in recent years, this tax drag caused thefund to significantly lag its benchmark. On the flip side, AMLP will decline less thanits ETN competitors in a down period because it can reverse its tax liability reserve. Fundamental View
Because MLPs must pass through the majority of their taxable income, theyneed to rely on debt financing for new projects. If interest rates rise again, the costof capital for MLPs would increase, which could result in lower distributions. MLPshave historically struggled during rising rate markets, but not to the extent of otherrate-sensitive investments like REITs or high-yield fixed income. During the bond sell-off of 2013, MLPs dipped but quickly recovered and went on to post strong returns forthe year to date through the end of the year and for 2014 through the end of thesecond quarter.The major performance drivers for MLPs are growing United States energyproduction and, to a lesser extent, worldwide energy demand. Higher U.S. productionmeans more volume flowing through pipelines, translating into revenue growth andhigher dividends for MLPs. The production outlook continues to be bright: Productiongrew by 13.9% in 2012 compared with 8% growth in 2011, and the U.S. currentlyproduces more natural gas than any other country in the world. Morningstar's energyanalysts predict that natural gas production will increase 4% through 2015.Production is expected to continue to increase into 2020 according to the U.S. EnergyInformation Administration, particularly from offshore and shale drilling. Worldwideenergy consumption, on the other hand, was less encouraging last year. The weakstate of the global economy pressured consumption in 2013 and 2012, withworldwide natural gas consumption down in 2013 and only up by 2.2% in both 2011and 2012. European demand will likely continue to be a demand headwind due to theregion's weak macro outlook. U.S. natural gas consumption was up 4.1% in 2012, butoil consumption declined 2.3%.This fund tracks infrastructure MLPs, which specialize in gathering and processing,petroleum transportation, and natural gas pipelines. Gathering and processing MLPstransport raw gas from the wellhead, process it, and move it to the cross-countrypipelines. They often keep the impurities and sell them for additional revenue.Natural gas pipeline MLPs take processed natural gas and transport it through theirextensive pipeline systems. They charge fees by volume with long-term contracts, soas long as the gas keeps flowing at increasing volumes, pipeline MLPs will maintaingood revenue growth. Petroleum pipelines transport crude oil to the processingplants and then ship the products to consumers. Propane MLPs operate in a similarmanner, transporting the product as a liquid. MLPs can engage in other businesses,including coal.Economic moats are common in the MLP space. The largest MLPs, like EnterpriseProducts Partners LP EPD, own several businesses to capitalize on their scale andoffer start-to-finish services. Federal regulations require new energy projects toundergo a rigorous vetting process, so economically unviable pipelines are rarelybuilt. As a result, most pipelines and processing facilities run by MLPs are localmonopolies. Almost 60% of the assets in AMLP's underlying index receive a WideMorningstar Moat Rating. A remaining 30% receive a Narrow moat rating, and 10%are rated as having no moat.
Fees & AlternativesAMLP charges a management fee of 0.85% annually, which is the typical going ratefor exchange-traded MLP products. However, because the fund has corporate taxliabilities, its actual gross expense ratio is 8.56%. After taxes, AMLP is one of themost expensive ETPs on the market. Alternatives Most MLP products are exchange-traded notes, which promise to pay theinvestor the return of the underlying index less fees. ETNs expose investors to thecredit risk of the issuer. We usually advise against ETNs when ETF alternatives areavailable, but because of AMLP's unusual costs, the ETN structure may make moresense for most MLP fund investors.JPMorgan Alerian MLP Index ETN AMJ was our pick for investing in MLPs until J.P.Morgan capped creations in June 2012. The decision effectively turned the note intoa closed-end product. AMJ struggled from March to September of 2013 to not tradeat a premium of 2%-5%. New investors should consider similar MLP exchange-traded products instead of purchasing AMJ at a premium. AMJ charges a 0.85%path-dependent fee.The closest substitute for AMJ is UBS E-TRACS Alerian MLP Index ETN AMU, whichtracks the same index. AMU's 0.80% expense ratio undercuts all of its competitors,
?
Page 25 of 68

Generated on November 04, 2014
Analyst Digest | 2014 Thesis Portfolio | October 05, 2014 - November 04, 2014
which charge 0.85% or more. AMU was launched a month after AMJ's cap wasannounced, but it has struggled to attract significant assets and trades on very lowvolume.UBS E-TRACS Alerian MLP Infrastructure ETN MLPI has grown significantly sinceAMJ stopped issuing new shares. MLPI tracks a more-concentrated index of 25infrastructure MLPs compared with AMJ's 50, and it charges a 0.85% expense ratio.
Portfolio ConstructionAMLP tracks the Alerian MLP Infrastructure Index, which is composed of 25 pipelineand processing MLPs. Owning MLPs outright creates a tax headache: K-1 forms mustbe filed in every state each MLP operates in. AMLP handles all K-1s instead andsends investors a single 1099, which is much easier to handle. The ETF structurepasses the tax deferment benefits of MLPs to holders of AMLP. However, because oflegislation forbidding open-end funds from owning more than 25% of their portfolioin MLPs, AMLP is structured as a C-corporation. If an owner holds an MLP for a longenough time that the reduced tax basis reaches zero, any further basis reductionsfrom distributions will be automatically taxed as a long-term capital gain.
?
Page 26 of 68

Generated on November 04, 2014
Analyst Digest | 2014 Thesis Portfolio | October 05, 2014 - November 04, 2014
Enterprise Products Partners LP EPD |
QQQQ
$36.48 -x$2.76 | –7.03%Fair Value Estimate $43
Consider Buying Price $30.1
Consider Selling Price $58.05
Fair Value Uncertainty Medium
Economic Moat Wide
Stewardship Grade Exemplary
08-22-2014 | by Jason Stevens
Analyst Note 10-30-2014Enterprise delivered another solid quarter, in line with our estimates for thepartnership, and we are reiterating our $43 per unit fair value estimate and wideeconomic moat rating. Gross operating margin for the quarter increased to $1.34billion, up $181 million, or 16%, year over year and just ahead of our $1.33 billionestimate. The largest contributor was a $73 million increase at Enterprise'spetrochemical services unit, driven by higher propylene sales, lower expenses, andlower maintenance expenses for pipeline integrity compared with last year. Thepartnership's core natural gas liquids services segment saw an 11% increase to $640million in gross operating margin, with contributions from the ATEX pipelineresponsible for about half the gain year over year.Distributable cash flow for thequarter came in at $975 million, up 7% year over year, and Enterprise raiseddistributions by 5.8%. Distribution coverage of 1.4 times provides Enterprise withplenty of running room to continue its methodical quarterly distribution increases.The large excess coverage also provides a cheap source of funding for thepartnership's growth projects, helping propel consistent cash flow growth. In ourview, Enterprise continues hitting on all cylinders.
The Thesis 08-22-2014We continue to believe that Enterprise is one of the best-run pipeline partnershipswe cover, with best-in-class assets that are positioned to monetize every link of themidstream value chain. Enterprise gathers natural gas from wellheads from theRockies to offshore Gulf of Mexico, operates gas processing plants that separatenatural gas liquids from the gas stream, transports crude oil, natural gas, and NGLson dedicated pipelines to market hubs, provides storage and fractionation for NGLs,and markets natural gas and NGLs to the petrochemical industry. In good times,Enterprise earns economic rents on each link of the midstream chain, and in badtimes, it can optimize flows across its system.We think the breadth of Enterprise'sasset base fosters attractive and often unique internal growth projects. In addition toinfill projects, such as processing plant expansions and connecting gathering systemsto new wells as they are completed, Enterprise is large enough to undertakesignificant new projects, such as the ATEX Express and looping Seaway pipeline,both of which entered service this year. ATEX moves ethane from the MarcellusShale to Enterprise's NGL and petrochemicals complex along the Gulf Coast, and theSeaway expansion doubles the partnership's capacity to move crude oil to the Gulf.Increasingly, Enterprise is leveraging its Gulf assets to provide export services forethane and LPG.While Enterprise's assets span the midstream energy space, itsdominance in NGLs is most pronounced. No other midstream firm has integrated itsgas and NGL operations as closely, and none can approach its downstreamintegration into refiners and the petrochemicals industry. We think this integrationpositions the partnership for stable base cash flows and provides a tremendousplatform for growth. Enterprise is constructing three more NGL fractionators,
expanding its propylene splitter, and has announced a propane dehydrogenation unit,all of which will provide attractive fee-based earnings and create a demand pullalong the partnership's gas and NGL pipelines and facilities.
ValuationOur fair value estimate is $43 per limited partner unit, adjusting for the 2:1 stock spliteffective on Aug. 21. We now forecast gross operating margin, Enterprise's preferredmetric, to grow roughly 11% a year through 2018 and model $5.4 billion for 2014.This should translate to 2014 EBITDA of $5.2 billion, by our modeling, anddistributable cash flow of $3.9 billion. We raised our distribution growth expectationto 9% a year and model a full-year 2014 distribution of $1.46 per unit (on a paid, notdeclared, basis). Our valuation is based on the average of two methods. Our standarddiscounted cash flow model values Enterprise at $43, while a distribution discountmodel also values the partnership at $43 per unit. Our fair value estimate impliesthat Enterprise is worth roughly 17.8 times our 2014 EBITDA estimate and a forwardyield of 3.4%.
RiskAccess to capital markets is a concern that could make it more difficult, or moreexpensive, to fund growth plans, though Enterprise demonstrated its ability to securefinancing in late 2008 while markets were otherwise seized. Enterprise also facesthe risk of extreme swings in natural gas and NGL prices, particularly with regard tothe margins earned from processing natural gas. Increasing competition amongpipeline companies could cut into Enterprise's margins. A portion of the company'sassets are susceptible to disruption from hurricanes. Evolving industry regulation,spills, fires, and explosions are always risks.
Management & StewardshipWe think Enterprise demonstrates exemplary stewardship. Enterprise hasoutperformed all other MLPs--and most asset classes, for that matter--over the pastthree, five, and 10 years and consistently generated returns in excess of capitalcosts. The 2010 decision to merge Enterprise and its general partner, Enterprise GPHoldings, eliminated incentive distributions and effectively reduced Enterprise's costof raising new equity; we think this was a savvy move that will pay dividends (or, inthis case, distributions) to limited partners for years. We are also fans of thepartnership's conservative distribution management, which focuses on steadydistribution increases while retaining cash to reinvest in the business, and hasallowed Enterprise to reduce its cash capital costs, thereby preserving a greatershare of future cash flows for current unitholders. We think Enterprise is very wellmanaged, and we're pleased with the leadership of CEO Michael Creel and COO JimTeague, an industry veteran with deep experience with NGLs and petrochemicals.Enterprise's board chairman is Randa Duncan Williams, daughter of the partnership'slate founder Dan Duncan. We also think that Enterprise boasts admirable benchstrength; business heads have deep expertise in midstream businesses and bring awealth of experience to the table. From a stewardship perspective, the only strikeagainst the firm is its structure; as a master limited partnership, common unitholdershave very limited rights and virtually no say in the management of the firm. As longas Enterprise continues to generate superior returns and sustainable cash flowgrowth, we're OK with that.
ProfileEnterprise Products Partners is a master limited partnership that transports andprocesses natural gas, natural gas liquids, crude oil, refined products andpetrochemicals. It is one of the largest midstream energy companies, with operationsserving most producing regions in the Lower 48. Enterprise is particularly dominant inNGLs and is one of the few MLPs that provides midstream services across the fullvalue chain. As a partnership, Enterprise pays no corporate income tax; its tax burdenflows through to individual stockholders.
?
Page 27 of 68

Generated on November 04, 2014
Analyst Digest | 2014 Thesis Portfolio | October 05, 2014 - November 04, 2014
Walt Disney Co DIS | QQQ
$90.05 h$1.60 | 1.81%Fair Value Estimate $84
Consider Buying Price $58.8
Consider Selling Price $113.4
Fair Value Uncertainty Medium
Economic Moat Wide
Stewardship Grade Standard
08-05-2014 | by Neil Macker
Analyst Note 08-06-2014Disney posted another strong quarter, with results coming in slightly ahead of ourforecast for fiscal 2014. Our $84 fair value estimate and wide economic moat ratingstand. While impressed by the execution, we would prefer a wider margin of safetyin the share price before investing.Third-quarter revenue grew 7.7% over last year to$12.5 billion, slightly above our estimate of $12.2 billion. EBITDA increased 13.5% to$4.0 billion, above our $3.7 billion estimate. The EBITDA margin widened to 32.0%.The strong quarter posted by the studio entertainment segment drove the majority ofthe upside surprise, as the segment continues to reap the benefits of "Frozen." Studioentertainment produced 13.6% revenue growth, well above our flat estimate.Revenue at the media networks business advanced 3.0%, but EBITDA margin lost 12basis points, owing to increased programming and content costs associated with theWorld Cup and the new deal with MLB. Revenue at the parks and resorts unit was8.2% ahead of a year ago, as higher guest spending and higher attendance at theU.S. resorts and cruise ships more than offset weakness at the international resorts.The consumer product business saw 16.4% top-line growth to $902 million, thanks togrowth at retail and in merchandising licensing. The company now owns eightfranchises with more than $1 billion each in global retail annual sales: MickeyMouse, Winnie the Pooh, Star Wars, Monsters, Spider-Man, Cars, Disney Jr., andPrincesses. Consolidated operating income grew 16.4% year over year to $3.7 billionwith a 29.4% margin. While we expect Disney to continue to execute and increasethe top and bottom lines, we remain sensitive to valuation. The shares currentlytrade in 3-star territory and at approximately 18 times our fiscal 2015 earnings pershare estimate. We reiterate our view that Disney is a high-quality business, butwe'd wait for at least a 10% discount to our fair value estimate before gettingexcited about investing.
The Thesis 08-05-2014While Disney is a media conglomerate, we view the company as two distinct yetcomplementary businesses: media networks, which include ESPN and ABC, andDisney-branded businesses, including parks, filmed entertainment, and consumerproducts. The crown jewel of Disney's media networks segment is ESPN. Itdominates domestic sports television with its 24-hour programming on ESPN, ESPN2,and its growing sister networks. ESPN has exclusive rights within both NFL andcollege football, the premier sports programming rights in the United States. ESPNprofits from the highest affiliate fees per subscriber of any cable channel, andgenerates revenue from advertisers interested in reaching adult males ages 18-49, akey advertising demographic that watches less scripted television than other groups.This dual income stream is a significant advantage not shared by the broadcastnetworks, which rely primarily on ad revenue. The Disney Channel also benefits fromattractive economics, as its programming consists of internally generated hits withDisney's vast library of feature films and animated characters. Disney's othercomponents rely on the world-class Disney brand, sought after by children andtrusted by parents. Over the past decade, Disney has demonstrated its ability to
monetize its characters and franchises across multiple platforms--movies, homevideo sales, merchandising, and theme parks. The stable of animated franchises willcontinue to grow as more popular movies get released by the animated studio andPixar, which has already generated hits such as "Toy Story," "Cars," and mostrecently, "Frozen." Similar to the animated franchises, Disney arranged the Marveluniverse to create a series of interconnected films and product tie-ins. With theacquisition of Lucasfilm, Disney appears to be positioning the Star Wars franchise inthe same manner. Disney's theme parks and resorts are almost impossible toreplicate, especially considering the tie-ins with its other business lines.
ValuationOur fair value estimate of $84 per share implies price/earnings of approximately 17.8times our fiscal 2015 earnings per share forecast. We expect average annual top-linegrowth of about 6.3% through fiscal 2018. We forecast 4.6% average annual salesgrowth from the media networks (5.5% for affiliate fees and 4.4% for advertising),driven by growth at ESPN and Disney Channel. We project 8.2% average annualsales growth during the next five years for parks and resorts. The investments thatrequired heavy capital expenditures over the past few years are bearing fruit nowincluding the launch of Shanghai Disneyland in fiscal 2016. We forecast operatingmargins for the segment to reach the upper-teens by 2018, eclipsing the recent high-water mark of 16.5% set in fiscal 2008. We have modeled 6.7% average annualgrowth for the filmed entertainment segment due to the addition of the Star Warsmovies and the growth in television, subscription VOD and other distribution outlets.We estimate 5.7% annual growth for consumer products, which should benefit fromcontinued global growth of key Disney brands, which now include Star Wars. Webelieve the interactive segment will continue to generate slightly positive operatingincome over the next five years, albeit a very small piece of the overall Disney pie.We project Disney's overall operating margin will improve to 23.5% in fiscal 2018from 21% in fiscal 2013. We think this profit expansion is achievable, as the highest-margin segment, cable networks, will grow at a faster clip than the overall firm.
RiskDisney’s results could suffer if the company cannot adapt to the changing medialandscape. Basic pay-television service rates have continued to increase, which couldcause consumers to cancel their subscriptions or reduce their level of service. ESPNgarners the highest affiliate fees of any basic cable channel and a decrease in pay-TV penetration would slow down revenue growth. The cost of sports rights maycontinue to skyrocket, putting pressure on margins. The company's ad-supportedbroadcast networks, along with the theme parks and consumer products, will suffer ifthe economy weakens. Making movies is a hit-or-miss business, which could resultin big swings in profitability for the filmed entertainment segment.
Management & StewardshipWhile we place Disney's stewardship of shareholder capital as Standard, we believethat the current management team is in the upper end of the tier of its direct peers.Chairman and CEO Bob Iger began his tenure as CEO in October 2005 and chairmanin March 2012 and is currently schedule to serve until June 2016. While Tom Staggs,former CFO and now head of the parks business, and Jay Rasulo, current CFO andformer head of the parks business, are still viewed as the top candidates to replaceIger, we believe that Iger could decide to extend his retirement date once again.Under Iger, Disney has embraced new technology and also reinvigorated itscommitment to high-quality content. He understood the importance of animation tothe company early in his tenure, purchasing Pixar, the computer animation studio, in2006, and then resurrecting Disney's own studio. Beyond Pixar, the company hasmade significant investment in new technology/distribution including buying ClubPenguin (an MMO for children) and Maker Studios (a network of YouTube channels).Iger also purchased two major content creators (Marvel and Lucasfilm) that expandedthe demographics served by the company.
Profile
?
Page 28 of 68

Generated on November 04, 2014
Analyst Digest | 2014 Thesis Portfolio | October 05, 2014 - November 04, 2014
Walt Disney owns the rights to some of the most globally recognized characters,from Mickey Mouse to Buzz Lightyear to Thor to Luke Skywalker. These charactersand others are featured in several theme parks that Disney owns or licenses aroundthe world. Disney makes live-action and animated films under several labels,including Pixar, Marvel, and Lucasfilm. Disney also operates media networksincluding ESPN, ABC, and Disney Channel, and several television production studios.
?
Page 29 of 68

Generated on November 04, 2014
Analyst Digest | 2014 Thesis Portfolio | October 05, 2014 - November 04, 2014
Facebook Inc FB | QQ
$74.40 -x$3.04 | –3.93%Fair Value Estimate $60
Consider Buying Price $36
Consider Selling Price $93
Fair Value Uncertainty High
Economic Moat Wide
Stewardship Grade Standard
07-23-2014 | by Rick Summer
Analyst Note 10-29-2014Facebook reported strong third-quarter earnings, posting 59% revenue growth and90% growth in GAAP operating income. The largest social network in the worldreaches 1.3 billion monthly active users and 864 million daily active users, and ourinvestment thesis for it remains intact. As we adjust our model to account for highernear-term expenses, our long-term model continues to assume operating marginexpansion, and we don't anticipate a material revision to our $60 fair value estimate.In our view, the stock is overvalued, and we wouldn't recommend allocating newmoney toward the name at this time. The negative effects of recently closedacquisitions Oculus Rift (a virtual reality company) and WhatsApp (a globalmessaging company) will amplify operating expenses in 2015 versus this calendaryear, according to comments made by management. While we currently modelrevenue to grow approximately 30% in 2015, expenses are now set to grow 55%-75% (50%-70% non-GAAP). We had not previously expected a dramatic compressionof operating margins. Management reiterated its intention to invest in projects thatmay not contribute significantly to revenue or cash flows for the next five years, andthe updated expense guidance supports that vision. In our opinion, if public equityinvestors have a shorter-term time horizon than management's, the stock is likely totrade below our fair value estimate, creating an attractive entry point for investors.Still, we are focused on near-term milestones such as WhatsApp user growth andrevenue contribution for the next several quarters, as we aren't fully convinced of thevalue some recent acquisitions bring to shareholders.
The Thesis 07-23-2014Facebook is building the foundation to revolutionize online advertising. However, thecompany will need to leverage its proprietary consumer data beyond Facebook as anintermediary to place advertising across the Internet at large.Facebook's massivebase and engagement arguably create advertising opportunities that capture reachand target based on specific criteria. Growth in Facebook's user base acrossgeographies has been impressive. Monthly active users exceed 1.3 billion, and thecompany operates the largest social network on the web. These users are logginginto Facebook at least once a month, communicating with friends, posting pictures,and using applications. We believe hundreds of millions of users face switchingcosts that keep them from leaving Facebook. People are unlikely to leave unless theycan take their network of friends, content, and applications with them.The company'sgrowth in mobile usage has been equally impressive, particularly considering thatFacebook was very slow to market with a downloadable application. The company'smobile usage is skyrocketing, and there are almost 1 billion mobile users. In fact,there are now more mobile users than desktop users, and revenue from mobile adproducts exceed revenue from desktop. After its long delay in building mobileadvertising products, we believe the company is a preeminent mobile advertiser.Inspite of our bullishness about the company's prospects, the company will need toaggressively grow advertising revenue per user to justify a premium marketvaluation, in our view. As the company is already the most visited desktop and
mobile site in the world, Facebook will have to find new and innovative ways tocontinue increasing advertising units and pricing. Ultimately, this growth is notlimitless, and we believe any meaningful slowdown will have negative impact onwhat the stock is worth.
ValuationWe are increasing our fair value estimate to $60 per share from $50 to account for arecent results and an increase in our 2014 forecast for growth and profitability. Ourvaluation represents a multiple of 40 and 23 times our 2014 adjusted earnings pershare and adjusted EBITDA estimates, respectively.In modeling the company, weforecast 10 years of financial statements. Admittedly, there is a great deal ofuncertainty about Facebook's ultimate growth trajectory and profit profile, but theexercise is important to us for several reasons. First, we believe the company willreach its structural maturity within 10 years, whereby it has normalized operatingmargins and cash flow yields. Second, understanding the size of the revenueopportunity at the end of our explicit forecast period helps quantify our level ofoptimism about the firm's revenue potential. While we would not feel comfortableabout our level of precision in forecasting the absolute level of revenue in threeyears, we do think our 10-year forecast results in a fair representation within a rangeof possible outcomes. The key value drivers in our model include revenue of $45billion in 2021, operating margins normalizing at approximately 42%, and forwardreturns on invested capital of more than 30%. Facebook's revenue would still bemeaningfully lower than Google's, according to our forecasts, but profitability metricswould be similar. We expect Facebook to have to continue investing in sales andmarketing, which would drive additional operating expenses. Additionally, thecompany will have to increase its revenue sharing with third parties for anadvertising network, and we would also expect local and payment businesses tohave higher-cost structures that the existing business.
RiskAlthough the revenue opportunity for Facebook is large, the company faces severalrisks that could ultimately prove our investment thesis to be overly optimistic. First,regulators may prevent the company from tracking its users. Significant regulatoryaction could detract from the value of its advertising platform. Second, excessiveadvertising or privacy fears could lead to a mass exodus of users. Other socialnetworks (for example, MySpace, owned by News Corporation NWS) haveexperienced declines. Lastly, if agencies and advertisers experience a permanentlack of visibility into advertiser return on investment, Facebook's advertisingopportunity may be significantly constrained.
Management & StewardshipMark Zuckerberg founded Facebook and has held the role of CEO since 2004. He alsoserves as chairman of the board. Chief operating officer Sheryl Sandberg has workedat Facebook since 2008 after spending more than seven years in an executive-levelrole at Google GOOG. We have a positive view of the skill set and performance of themanagement team to date and believe its patience and capital allocation haveenabled it to drive profits and competitive advantages. While we expect Facebook tocontinue to be patient as a young public company, we acknowledge managementmay feel pressure to pursue revenue growth in areas that may actually weaken thefirm's economic moat. The concern about capital allocation becomes even moreparamount because Zuckerberg controls about 57% of the voting shares of thecompany. In 2012, the company acquired Instagram, a social networking site forsharing photos. Although the purchase only represented approximately 1% of thevalue of Facebook, it has been reported that the deal happened with very littleinvolvement from the board of directors. If Zuckerberg loses discipline in allocatingthe company's capital, there can be no guarantee that any such mechanism wouldprevent the company from destroying shareholder value.
ProfileFacebook's 1.3 billion monthly active users create the world's largest online social
?
Page 30 of 68

Generated on November 04, 2014
Analyst Digest | 2014 Thesis Portfolio | October 05, 2014 - November 04, 2014
network. More than 800 million people use Facebook daily, spending more time therethan any other website, according to most third-party reports. Users go to Facebookto communicate with friends, share news, and play games, providing the companywith a treasure trove of information to target online advertising. Currently, the U.S.represents less than 20% of traffic but less than 45% of overall revenue.
?
Page 31 of 68

Generated on November 04, 2014
Analyst Digest | 2014 Thesis Portfolio | October 05, 2014 - November 04, 2014
Bristol-Myers Squibb Company BMY |
$57.88 h$7.03 | 13.82%Fair Value Estimate $53
Consider Buying Price $37.1
Consider Selling Price $71.55
Fair Value Uncertainty Medium
Economic Moat Wide
Stewardship Grade Standard
10-02-2014 | by Damien Conover
Analyst Note 10-30-2014Bristol reported strong Phase II lung cancer data with Opdivo that reinforce our peaksales estimate of $10 billion (versus $5 billion for consensus), so we don't expect anychange to our $53 fair value estimate. Based on the strong stock price movement inreaction to the data, the stock looks slightly overvalued. Nevertheless, the strongclinical data reinforces our wide moat rating for Bristol as Opdivo represents close to30% of our valuation for the entire company.The Phase II data showed impressiveefficacy in line with earlier clinical data. The one-year survival rate in heavilypretreated lung cancer patients was 41% (versus a historical rate of 6%-18%). Weexpect that this data will lead to the drug's approval in early 2015, which should giveBristol at least a one-year advantage over competition. We expect approval forMerck's competing drug Keytruda in lung cancer in early 2016.While severalimmuno-oncology drugs (similar mechanisms of action to Opdivo) are in developmentfor many types of cancer, we believe the lung cancer indication represents thelargest opportunity. We project the lung cancer market will represent an $18 billionopportunity by 2022 with immunotherapies claiming the lion's share of the market.Beyond lung cancer, renal cancer ($2 billion-$3 billion market) and melanoma ($2billion-$3 billion market) represent the other near-term opportunities for immuno-oncology.
The Thesis 10-02-2014Adept at partnerships and acquisitions, Bristol-Myers Squibb has built a strongportfolio of drugs and a robust pipeline. While the company faces significant patentlosses that continue through 2017, we expect its next generation of drugs will fill thepatent holes over the next decade, supporting its wide moat. Further, by selling offbusiness lines unrelated to its core pharmaceutical strategy, the company has beenstreamlined to focus primarily on specialty pharmaceuticals. Bristol has created astrong pipeline and brought in partners to share the development costs and diversifythe risks of clinical and regulatory failure. We believe the cardiovascular partnershipwith Pfizer represents one of the most important partnerships, managing theblockbuster potential of Eliquis in atrial fibrillation. While Bristol discovered the druginternally, we like its strategic partnering decisions, as the moves reduce risks andlowers development and marketing costs. Bristol's pipeline becomes even a biggersafety net as the company faces a plethora of patent losses over the next few years.The patent on blockbuster antipsychotic drug Abilify expires in 2015, followed bypatent losses on several virology drugs between 2015 and 2017. Within the pipeline,Bristol's astute acquisition of Medarex helps secure Bristol's strong first-moveradvantage in cancer immunotherapy, which should yield several major blockbustercompounds. In particular, Bristol's PD-1 cancer drug Opdivo holds the potential torevolutionize cancer treatment and should develop into a multi-billion-dollaropportunity for the company.Bristol is aggressively repositioning itself to growthrough the challenging patent losses. The company has shed its diabetes business,
medical imaging group, wound-care division, and nutritional business in an effort tofocus on the high-margin specialty drug group. Its more focused operations andincreasing cash account also make the company a more attractive acquisition targetfor a larger pharmaceutical firm.
ValuationWe are increasing our fair value estimate to $53 per share from $49 largely becauseof increased projections for new immuno-oncology drug Opdivo. Bristol announcedpricing for Opdivo in Japan at $143,000 annually, significantly above our estimated$80,000 global average price, which led to the increased projections. The strongJapanese pricing of Opdivo in melanoma patients should translate into strong pricingin both the U.S. and Europe in melanoma and other more important indications, suchas lung cancer. Generally speaking, Japanese pricing is a slight discount to U.S.pricing and close to European pricing, which means worldwide pricing in developedmarkets should be close to the Japanese price. Also, since the dosing is the same forOpdivo in melanoma as in lung cancer, we expect a similar price point for Opdivo inthe much larger lung cancer market. We continue to view Opdivo as holding the mostpotential for the firm. Based on strong survival data in an early-stage Opdivo study,we believe the drug and other immunotherapy drugs will take more than half of thelung cancer market by 2022. While the company faces several patent losses over thenext few years, we continue to have strong conviction in its pipeline, led by Opdivo,which has potential to significantly alter the treatment paradigm in several majorcancer settings (melanoma, lung, renal). We project the drug will reach risk-adjustedpeak sales of more than $10 billion. The recently approved drug Eliquis forcardiovascular disease should develop into a major blockbuster as well.In looking atthe whole company, we expect 6% average annual sales growth during the next 10years. While patent losses will slow the growth of the company over the next twoyears, new pipeline drugs should position the company for strong growth in 2016.We expect margins to eventually expand, but the high royalty rate paid on Eliquis toPfizer will weigh on gross margins for the firm.
RiskBristol is increasing its focus on branded drugs by selling off unrelated businesslines, which elevates its exposure to patent losses. Further, the increased brandeddrug focus raises the company's dependence on its pipeline. This will result in highersales volatility than observed at its more diversified peers. Additionally, the companyis exposed to risks facing the entire pharmaceutical group, including generic threats,decreasing pricing power due to managed-care constraints, and product liabilitycases. From a product-specific standpoint, we believe the company's largest pipelinerisk surrounds its immunotherapy drugs, which could develop into major blockbustersor fail to reach the market, depending on clinical data.
Management & StewardshipIn early 2010, Lamberto Andreotti and Charles Bancroft took over Bristol's top posts,replacing James Cornelius as CEO and Jean-Marc Huet as CFO, respectively. Whilethese appointments didn't signify a major shift in Bristol's strategy, the new leadershave their roots with Bristol and are replacing outsiders (before joining Bristol,Cornelius was the CEO of Guidant and Huet was the CFO at Royal Numico). We don'tsee any red flags stemming from the management flight; we believe Cornelius'decision to retire was consistent with his age of 66, and Huet's decision to take theCFO post at Unilever placed him at a larger company. Andreotti brings a strong recordof management in Bristol's European operations dating back to 1998. Before joiningBristol, he held several positions with Pharmacia (acquired by Pfizer). Bancroft alsobrings a solid Bristol tenure, as he joined the company in 1984 and has held positionsof increasing responsibility in finance.On the stewardship front, we rate currentmanagement as standard. Several acquisitions like Medarex have been excellentuses of capital, but other deals like Inhibitex and Amylin may representoverpayments for assets. However, additional time is needed to see how some ofthese deals will play out before making definitive judgments. Also, on the positiveside, Bristol has been aggressively cutting costs to adapt to its scale following patentlosses, which we believe will help open up capital for reinvestment in the business.
?
Page 32 of 68

Generated on November 04, 2014
Analyst Digest | 2014 Thesis Portfolio | October 05, 2014 - November 04, 2014
ProfileBristol-Myers Squibb discovers, develops, and markets pharmaceuticals for variousindications, such as cardiovascular and infectious diseases, cancer, and immunedisorders. Unlike some of its more diversified peers, Bristol has exited severalnonpharmaceutical businesses to focus on branded drugs.
?
Page 33 of 68

Generated on November 04, 2014
Analyst Digest | 2014 Thesis Portfolio | October 05, 2014 - November 04, 2014
Citigroup Inc C | QQQ
$52.74 h$0.42 | 0.80%Fair Value Estimate $48
Consider Buying Price $28.8
Consider Selling Price $74.4
Fair Value Uncertainty High
Economic Moat Narrow
Stewardship Grade Standard
07-14-2014 | by Jim Sinegal
Analyst Note 10-30-2014Citigroup announced that it will restate its third-quarter earnings from $3.4 billion toonly $2.8 billion due to increases in legal expenses. While this does not materiallyaffect our fair value estimate for the bank, it does reinforce our thesis that elevatedlegal and regulatory costs will continue to plague the nation's largest banks for theforeseeable future even as the absolute level of expenses declines as mortgage-related issues are settled. These costs, in addition to creating uncertainty around thetiming of interest rate changes, limit our near-term enthusiasm for the bank. We arestanding by our $48 per share fair value estimate.
The Thesis 07-14-2014There are plenty of reasons to be wary of Citigroup. Over the past few decades, thebank has teetered on the edge more than once, taking massive losses on emerging-markets loans in the 1980s, commercial real estate in the early 1990s, and subprime-related securities in the 2000s. Citigroup has made progress over the past five yearsby raising capital, shedding assets, and bulking up its board of directors andmanagement team. However, with operations spanning several continents, the bankin many ways still embodies the "too big to fail" concept.In our view, Citigroup's trulyglobal presence differentiates the bank from nearly all of its peers. With a largeportion of revenue coming from Latin America and Asia, the bank is poised to ride thegrowth of these economies over the coming decade. At the same time, Citigroup isnot merely a domestic lender, and it should remain a bank of choice for globalcorporations thanks to its ability to provide a variety of services across borders.Developing economies offer an attractive combination of high margins and rapidcredit growth--especially in comparison with the low rates and declining leverage weexpect will persist in the U.S. and other Western economies for the next few years.At the same time, investors should prepare for volatile results out of emergingeconomies, where governments and economic systems have generally not stood thetest of time to the same extent as developed markets. Since its bailout, Citigroupdoes not appear to be chasing growth at any cost. Instead, management isattempting to scale back operations and cut expenses--a proven plan for turningaround troubled banks. Citigroup is consolidating back-office functions and reducingconsumer operations in far-flung geographies like Pakistan and Paraguay andconcentrating its branch network in key international markets, including Brazil andHong Kong. We think investors should view further announcements along these lineswith relief rather than disappointment and focus on improvements in the bottom linemore so than growth in the top line.
ValuationWe are boosting our fair value estimate to $48 from $45 per share, equivalent to 0.7times book value per share and 10 times our 2015 earnings per share estimate. In ourbase-case valuation, we think assets will remain flat during the next five years withthe continued runoff of Citi Holdings' assets offset by the growth of loans outside theU.S. We think the net interest margin will improve slowly to approximately 3.0% by
2018 as nonperforming assets fall and interest rates normalize somewhat. Weforecast noninterest income to increase by approximately 4% cumulatively during thenext five years, as increases in fee-based income are offset by a decline in principaltransactions revenue. We expect net charge-offs to slowly decline during ourforecast period, averaging 1.8% in the long run. We expect the efficiency ratio toaverage 61% over the next five years. Our valuation reflects a middling level ofprofitability, with return on assets reaching 0.9% by the end of our forecast periodand return on equity reaching 8%. We assign Citigroup a 12% cost of equity basedon the volatility of the company's post-provision revenue, the moderate level ofoperating leverage inherent to the business, and the bank's high level of financialleverage relative to the rest of our coverage universe. We assume that the companywill utilize deferred tax assets over the medium term, and we assume a tax rateaveraging 27% over our forecast period.
RiskCitigroup's presence in emerging markets is the company's biggest advantage, butit's also the source of the most risk. Rapid credit growth can be highly profitable onthe way up, but almost never ends well. Citigroup is banking on the long-run rise ofthe global consumer, but there are bound to be bumps on the way, leading to volatilefinancial results. A secondary source of risk is the company's investment bank, abusiness that we consider to be a perennial source of disappointment for investors.
Management & StewardshipWe view Citigroup's recent stewardship of shareholder capital as standard. In ourview, an analysis of Citigroup's management must start with the board of directors,which has improved dramatically during the past five years. Chairman MichaelO'Neill turned around Bank of Hawaii during his time as CEO of the island institution,making shareholders multiples of their initial investment. Board member Robert Jossenjoyed similar success during his time at Westpac. Other members of the boardboast experience at premier financial services companies, including AmericanExpress, RenaissanceRe, and PIMCO, while others served as regulators. We think theboard is well positioned to oversee continued improvements at Citigroup.We alsothink new CEO Michael Corbat's experience will serve Citigroup shareholders well. Incontrast to Vikram Pandit, who brought investment banking and hedge fundexperience to the CEO role, Corbat has served in a variety of basic banking rolesaround the world during his time at Citigroup. We like that he appears to be focusedon scaling back the bank's operations, announcing cost cuts and branch closures inhis first major move as CEO. However, we think it will take time to change thecompany's culture, and missteps along the way are inevitable.In our view,management should be evaluated over the near term by its ability to cut expensesand return capital to shareholders. In addition to the amount of capital returned,we're interested to see how management balances dividends and repurchases.While the restoration of the company's dividend is a plus, we would look favorablyupon repurchases as well. A substantial buyback program seems a good fit for theearnings volatility possible thanks to Citigroup's investment bank and internationalconsumer book.
ProfileCitigroup is a global financial services company doing business in more than 160countries and jurisdictions. Citicorp, the company's core business, consists of theglobal consumer banking segment, which provides basic branch banking around theworld, and the institutional clients group, which provides large customers withinvestment banking, cash management, and various other products and services.Noncore businesses and questionable assets are now part of Citi Holdings.
?
Page 34 of 68

Generated on November 04, 2014
Analyst Digest | 2014 Thesis Portfolio | October 05, 2014 - November 04, 2014
Walgreen Co WAG | QQ
$64.79 h$4.02 | 6.62%Fair Value Estimate $58
Consider Buying Price $40.6
Consider Selling Price $78.3
Fair Value Uncertainty Medium
Economic Moat None
Stewardship Grade Standard
06-23-2014 | by Vishnu Lekraj
Analyst Note 09-30-2014Walgreen reported results for its fiscal 2014 fourth quarter that were in line with ourexpectations, and we are reiterating our $58 fair value estimate. Year over year, totalrevenue increased 6.2%, driven largely by a 9.3% increase in prescription sales.However, profitability remained pressured as gross margins decreased 98 basispoints to 27.95% and operating margins decreased 65 basis points to 5.08% for thequarter. Management cited several headwinds, but most notably the firm isexperiencing negative pricing trends from pharmaceutical suppliers and customers.From our perspective, this dynamic will remain a major obstacle for Walgreen overthe longer term and directly reflects our no-moat rating for the retail pharmacy firm.However, we believe the acquisition of Alliance Boots and integrated partnershipwith AmerisourceBergen will somewhat mitigate the pricing pressure Walgreen isfacing from pharmaceutical suppliers over the long haul. With that said, we are nottotally convinced these strategic partnerships will be able to significantly change thelong-term trajectory of the firm's ability to produce consistent economic profits.
The Thesis 06-23-2014The delivery of pharmaceuticals to consumers encompasses many firms along thesupply chain, and Walgreen stands out as a major player. The firm is one the largestpharmacy retailers in the United States as it processed a little more than 16% oftotal U.S. prescriptions during its fiscal 2013. Its large network of retail locationsspans the continental U.S., which gives Walgreen the ability to reach 75% of theU.S. population, according to its own estimates.However, we believe the firm doesnot possess any material competitive advantages. While approximately two thirds ofWalgreen's revenue is derived from the sale of prescription drugs, we believe thefirm is analogous to a mix of convenience and mass retail store. Management hassaid it will look to push front-store (nonpharmaceutical) products in order to driverevenue and profits. In our opinion, this demonstrates the weaker position along thepharmaceutical supply chain for Walgreen as it tries to offset a more pressured retailpharmacy operating environment with grocery and convenience goods. This strategywill also put the firm in even more direct competition with the mass grocers andretailers and into sectors where profits and outsize returns on invested capital arehard to come by.Walgreen also contends with a pharmaceutical customer base thathas enormous pricing power. It derives a significant majority of prescription revenuefrom third-party payers (employers, insurers, managed-care organizations,government programs) and large pharmacy benefit managers represent most of thesecustomers. Large PBMs are able to aggregate an enormous amount of claim volumeand leverage this into powerful pricing negotiating power. This dynamic putsenormous pressure on retail pharmacies, and the ability of these players to push backon pricing demands from customers is minimal. In the U.S., consumers of prescriptiondrugs typically use only five major intermediaries to adjudicate more than 65% of thetotal adjusted prescriptions filled annually. This effectively makes two thirds ofWalgreen's revenue heavily reliant upon only five major customers, which can leadto enormous pricing pressure.
ValuationWe are increasing our fair value estimate to $58 per share from $56. The firm hasbeen able to increase its back-end pharmaceutical sales at a mildly better clip thanour initial expectations for fiscal 2014. Accordingly, we have increased ourassumption for this variable slightly over our explicit forecast period. We believe thefirm will be able to realize solid synergies from its recent Alliance Boots andAmerisourceBergen partnerships. These partnerships should allow Walgreen to gaingreater distribution efficiency and enhanced manufacturer pricing leverage andultimately lead to increased profitability over our explicit forecast period. Weforecast adjusted prescriptions to grow moderately, driven by the firm's continuedrecovery from its dispute with Express Scripts, shifting U.S. demographics, andincreased pharmaceutical usage by health-care benefit payers. Offsetting thisdynamic is flat prescription drug pricing as generics become a greater percentage ofprescriptions filled and payers look for ways to hold the overall cost of employeebenefits in check. We also project the firm's sales from front-store products(nonpharmaceutical goods) to grow at a rate moderately higher than overall U.S. GDPgrowth. This mix of assumptions gives Walgreen a 4.2% five-year revenue compoundannual growth rate and average operating margins of 7.1% that range from 6.2% to7.8% over our explicit forecast. Additionally, because of the current composition ofthe Alliance Boots deal, Walgreen will not be able to take full ownership of theEuropean pharmacy retailer until 2015 (Walgreen currently owns 45% of the firm'sequity with an option to acquire the balance in the first quarter of 2015). Thus, wevalue the Alliance Boots operations separately, assuming Walgreen will acquire theremaining outstanding equity in 2015. We value the deal at the purchase price plussynergies the Alliance Boots-specific operations will be able to obtain from futurebusiness integrations.
RiskThe main risk facing Walgreen is another contract dispute with a major customerthat could cause a contraction in both top- and bottom-line results. With what iseffectively an oligopoly, the firm's retail pharmacy operations faces sizable pricingpressure. This variable will be even more heightened given the focus of many drugplan payers on significantly curbing overall plan costs. Additionally, a significantportion of Walgreen's results depends on consumer discretionary spending, whichcan fluctuate materially during an economic cycle.
Management & StewardshipThe recent strategic moves made by management have added positively toWalgreen's long-term outlook. After suffering negative results because of amiscalculation during the Express Scripts contract negotiations, management hasmade a series of partnership moves that have enhanced the firm's long-termoperations. Most notably, the firm has begun the process of acquiring Alliance Boots,a major European pharmacy distributor/retailer. This acquisition should enhance thefirm's overall retail operations and build more efficiency into its distributioncapabilities. Additionally, the firm has effectively increased its manufacturer pricingnegotiation power as it can now use the combined demand of both major retailers.The firm also recently announced an alliance with AmerisourceBergen, where themajor U.S. pharmaceutical distributor will eventually be the primary supplier of a vastmajority of Walgreen drug products. This move again helps to bolster both thedistribution efficiency and supplier negotiating leverage for the firm.However, thefirm's recent partnership with Express Scripts is perhaps the most important andpositive. The decision to allow Express Scripts' mail-order customers the option topick up their mail-order prescriptions at Walgreen locations is a major positive, in ouropinion. This move will allow Walgreen to capture a piece of Express Scripts' mail-order volume and offset CVS Caremark's advantage in this delivery channel. Mostimportant, though, is that we believe this action demonstrates management's abilityto turn a negative into a positive. The strained relationship with Express Scripts overretail drug pricing seems to be fading as Walgreen has changed an adversarialrelationship into a positive partnership, benefiting shareholders greatly as a result.While the synergy outcomes and ultimate net present values of these projects arestill yet to be realized, management's emphasis on vertical integration is directionally
?
Page 35 of 68

Generated on November 04, 2014
Analyst Digest | 2014 Thesis Portfolio | October 05, 2014 - November 04, 2014
correct.
ProfileWalgreen is the nation's largest retail pharmacy, with about 8,600 drugstoresthroughout the United States. This large network of stores allows the firm the abilityto reach a significant portion of the U.S. population, providing excellent brandrecognition. Prescription drugs account for about two thirds of sales, with most of therest attributable to front-store products such as grocery, health, and beauty items.The firm also operates in-store and work-site health clinics.
?
Page 36 of 68

Generated on November 04, 2014
Analyst Digest | 2014 Thesis Portfolio | October 05, 2014 - November 04, 2014
Energy Select Sector SPDR® ETF XLE |
QQQQQ
$83.57 -x$4.60 | –5.22%ETF Valuation Rating (as of 11-03-2014) Fairly Valued
ETF Market Price (as of 11-03-2014) $86.04000
Fair Value Estimate $102.82
Consider Buying Price $81.90
Consider Selling Price $124.90
ETF Expected Return 16.83%
ETF Hurdle Rate 15.76%
ETF Expected Excess Return 1.06%
Morningstar Coverage 98.09% of assets
40 of 44 Holdings
Stock Quality (as % of assets) 33.64% Wide Moat
57.20% Narrow Moat
7.09% No Moat
Fair Value Uncertainty High
12-18-2013 | by John Gabriel
The Thesis 12-18-2013Suitability Energy Select Sector SPDR XLE can be used by investors as a tactical satelliteholding to achieve broad exposure to the energy sector. At roughly one third of totalassets, integrated oil and gas firms make up the largest weighting in the fund,followed by exploration and production firms (31%), equipment and servicescompanies (17%), refiners (8%), pipelines (5%), and drillers (4%). The fundrepresents an inexpensive and efficient way to invest in the U.S. energy sector,without assuming too much idiosyncratic (or firm-specific) risk.As a market-cap-weighted fund, this ETF's portfolio is fairly top-heavy. Verticallyintegrated supermajors Exxon Mobil XOM and Chevron CVX alone make up morethan 30% of XLE's portfolio. While these two firms represent a large chunk of assets,they operate in a diverse set of businesses across the energy complex. Theiroperations range from exploration and production all the way down to distribution.This helps damp the supermajors' volatility and sensitivity to energy prices but doesnot eliminate it entirely. Keep in mind that as a U.S. sector fund, XLE does not offerexposure to international supermajors such as BP PLC BP, Royal Dutch Shell PLCRDS.A, or Total SA TOT.Other segments of the oil patch, such as exploration and production, are much moresensitive to volatile energy prices. Investors should expect the underlying firms'reliance on energy prices to translate into higher volatility for XLE relative to thebroader market. For example, the S&P 500 experienced a standard deviation ofreturns of 15% over the trailing 10 years. Over the same period, the standarddeviation of returns for XLE was about 23%.Over the years, the diversification potential of XLE seems to have been eroding. Overthe trailing 10-year period, XLE has been 70% correlated with the S&P 500. However,over the trailing five- and three-year periods, its correlation to the S&P 500 hasincreased to 84% and 88%, respectively. Still, the fund remains an effective tool forinvestors seeking to have an overweighting to the energy sector within a broadlydiversified portfolio. The energy sector currently makes up about 10% of the S&P 500Index. Fundamental View
Integrated oil and gas companies have operations that span the full energyvalue chain. These companies, which represent about a third of XLE's assets, explorefor and produce oil and gas, transport it, refine or process it, and sell it to end users.The integrated model has historically provided firms like Exxon Mobil and Chevronwith competitive advantages. By integrating across the energy value chain, thesefirms are able to gain much tighter control over the production and sale of oil andgas, and they get to keep profits they would otherwise have paid out to middlemen inthe form of economic rents.In an attempt to secure long-term access to large-scale resources, the largeintegrated firms are now competing for huge new projects and increasinglypartnering with foreign national oil companies seeking to exploit government-ownedresources. In a world of diminishing investable resources, securing such partnershipsis important to help drive growth. This puts added emphasis on firms' technicalexpertise, ability to execute on time and budget, safety record, and cost of capital.Exploration and production companies, which make up roughly 31% of XLE'sportfolio, concentrate their efforts almost exclusively on exploring for, acquiring, andproducing oil and natural gas. These firms face myriad risks, including commodityprice volatility, exploration risks, operational risks, and political and regulatoryscrutiny. Given the intense competition in this segment as well as the difficultyindividual firms face in establishing competitive advantages, getting diversifiedexposure through an ETF like XLE may be appropriate for most investors.Equipment and services firms, which represent approximately 17% of XLE's assets,provide the expertise necessary to improve oil and gas well economics and boostwell productivity. The industry does serve U.S. independent oil and gas firms, but itslargest customers tend to be the major international and government-owned oilcompanies. Demand for services in any given year tends to wax and wane,depending on customer expectations around commodity prices, particularly in NorthAmerica, where contracts are usually very short.The cyclical nature of the industry can obscure some of the positive long-term trends,which look very favorable. Oil, in particular, is becoming harder to find and extract.Global oil production has been stagnant since 2005, even after a trillion-dollarinvestment by the oil and gas industry. The number of oil discoveries as well as thesize of discoveries made has been declining for decades. Oil-services firms' expertiseis growing increasingly more valuable as the industry seeks to explore and extract oilfrom ever-more-challenging frontiers in new deep-water and even Arctic efforts.Large efforts are also under way to boost recovery rates from old fields.As of this writing, our equity analysts estimate that XLE is trading at a 6% discountto its aggregate fair value. In our discounted cash flow models, they use benchmarkoil and gas prices based on Nymex futures contracts over the near term. If thoseforecasts prove incorrect, then their fair value estimates will be off en masse.
Fees & AlternativesSelect Sector SPDR ETFs are among the cheapest and most-liquid sector fundsavailable. The fund's 0.18% expense ratio is low even by ETF standards. Alternatives The two most appropriate alternatives to this ETF are Vanguard EnergyETF VDE and iShares S&P Global Energy IXC. Vanguard Energy, which is the cheapestof the group with an expense ratio of just 0.14%, does also provide a bit morediversification--it holds more than 160 names--but it is just as top-heavy as the SPDRfund. Similar to XLE, about 60% of VDE's assets are invested in the top 10 holdings.Despite VDE's additional holdings, the historical volatility of its portfolio has beennearly identical to that of XLE.IXC provides exposure to the international energy space, but that only serves toincrease the fund's already substantial large-cap bias. Oil is a fungible commodity, soglobal prices tend to be highly correlated. We view international diversificationwithin the energy space to be less beneficial than in other sectors of the market. Infact, XLE and VDE have been 98% correlated with IXC over the past five years.Moreover, the volatility of IXC fund is right in line with that of XLE. Given that theiShares fund charges 0.48%, which is more than twice that of the SPDR andVanguard funds, we would prefer sticking with one of the cheaper domestic fundsunder most scenarios.
?
Page 37 of 68

Generated on November 04, 2014
Analyst Digest | 2014 Thesis Portfolio | October 05, 2014 - November 04, 2014
Portfolio ConstructionThis exchange-traded fund holds 44 oil and gas and energy-services companiesincluded in the S&P 500 Index. These firms make up the energy sector's entire 10%weighting in the S&P 500. The weightings of each stock roughly correspond to eachstock's market cap. Thus Exxon Mobil, the largest oil firm in the world, makes uproughly 17% of assets, and the top 10 holdings soak up approximately 60%.Constituents are leading U.S. companies that meet S&P's profitability criteria. Thesecriteria eliminate non-U.S. oil companies, including Royal Dutch Petroleum, Total,and BP. Large-cap stocks make up about 85% of the portfolio, with mid-capsrepresenting the remaining 15% of assets. The holdings-weighted average marketcapitalization of the fund's portfolio is $62 billion.
?
Page 38 of 68

Generated on November 04, 2014
Analyst Digest | 2014 Thesis Portfolio | October 05, 2014 - November 04, 2014
EOG Resources Inc EOG | QQQ
$89.88 -x$6.69 | –6.93%Fair Value Estimate $98
Consider Buying Price $68.6
Consider Selling Price $132.3
Fair Value Uncertainty Medium
Economic Moat Narrow
Stewardship Grade Standard
07-21-2014 | by Mark Hanson
Analyst Note 08-06-2014EOG reported second-quarter results that topped our production expectations,delivering average volumes of 591 Mboe/d, up 5% sequentially and 17% year overyear. The company’s incremental production was heavily weighted toward liquidsvolumes, which accounted for 61% of total production compared with 55% in theyear-ago period. United States crude oil and condensate production continued tosurge during the quarter and climbed 33% year over year to 275 Mbbl/d, led byEOG’s Eagle Ford and Bakken assets. Surprisingly, second-quarter natural gasproduction was meaningfully above management's guidance and our expectations, inpart because of strong associated gas production in the lower 48.EOG increased itscrude oil inventory during the period through the successful application of enhancedcompletion techniques in the Second Bone Spring Sand, as well as ongoingdownspacing efforts targeting the Leonard A zone. While the play is still consideredprospective, EOG’s delineation of its 73,000 net acre position across the Leonardshale has uncovered several high-returning wells, and the company expects to drillseveral additional wells through the remainder of the year and potentially increaseactivity in 2015.EOG updated its full-year production guidance to reflect its stronger-than-expected growth during the first half of the year, particularly from its portfolioof U.S. crude oil plays (the Eagle Ford exited June at 253 Mboe/d, up from 207Mboe/d in March). As a result, the company raised its total production growthestimate by 2 percentage points to 14%. Total capital spending excludingacquisitions remains unchanged at a midpoint of $8.2 billion. Our current forecastcalls for 14.3% firmwide growth and 32% oil growth in 2014.We will update ourmodel to reflect EOG’s latest results, though at this time we do not anticipate achange to our narrow moat rating or any meaningful revision to our fair valueestimate of $98 per share.
The Thesis 07-21-2014Around the middle of 2011, the Eagle Ford took the lead-dog position in EOG'sportfolio from the Bakken and hasn't looked back. Eagle Ford production increasedeightfold from early 2011 to 2013, thanks to EOG's enviable position in the sweetspot of the oil window and improvement in drilling and completion methods thathave helped the company deliver ever more impressive well results. With more than10 years of remaining drilling inventory and an innovative crude-by-rail systemhelping to optimize prices, we don't expect EOG's Eagle Ford production to slowanytime soon. All this isn't to suggest that old man Bakken is dead. Down-spacingand secondary recovery efforts look promising and should help extend the productivelife of this field. Beyond these two giants, EOG remains active in multiple fieldsacross the Permian and continues to look for new horizontal liquids plays in andoutside the U.S.EOG's liquids-rich assets--almost all of which have been proved upand captured since 2006--include dominant acreage positions in the Bakken/ThreeForks and Barnett Combo plays and strong footholds in the Eagle Ford and Niobrararegions. EOG also holds oil-rich acreage in the Permian Basin (including its Leonardcombo and Wolfcamp positions). We believe EOG's liquids-rich portfolio will
generate the majority of the company's incremental production growth over the nexthandful of years, with especially strong contributions from the Eagle Ford region.Niobrara is a bit of a wild card for EOG, given the company's modest drilling activityto date, although with 215,000 net acres in this play and attractive preliminary wellresults, EOG is well positioned to ramp up activity should the economics provecompelling.EOG's gas assets include its substantial legacy position in the BarnettShale, which should continue to generate strong production despite its relativematurity, as well as sizable acreage positions in the Horn River in Canada, theHaynesville/Bossier plays in eastern Texas and western Louisiana, and the MarcellusShale in Pennsylvania. The firm is unlikely to commit any meaningful amount ofcapital to these plays until gas prices recover, however.
ValuationWe are increasing our fair value estimate for EOG by $16.50, to $98 per share, due totwo factors: first, we've updated our estimate to reflect the time value of money(approximately $3 per share) and second, we've incorporated the firm's most recentresults--which continue to exceed our expectations--and management's announcedplans to more aggressively develop the firm's oil-rich properties (approximately$13.50 per share). These plans include greater investment in the DJ and PowderRiver Basins, as well as enhancements to our Eagle Ford type curve and potentialdownspacing in the Williston Basin. Our fair value estimate implies a forward 2014enterprise value/EBITDAX multiple of 6 times and is based on our five-yeardiscounted cash flow model and an assessment of trading multiples, comparabletransactions, and longer-term resource potential.We project average daily productionof 3.5 billion cubic feet of equivalent in 2014, 4.0 bcfe in 2015, and 4.5 bcfe in 2016,with EOG's liquids production growing at a 20% compound annual rate over thisperiod. We expect the Eagle Ford and Permian to drive most of EOG's oil and naturalgas liquids production growth. In the Eagle Ford, we expect EOG to increase netproduction by more than 250 mboe/d from 2013 to 2016, reaching 400 mboe/d. In thePermian, we forecast a rig count of eight by 2016, with production increasing to 56mboe/d.We project EOG's EBITDAX to reach $9.7 billion in 2014, $11.4 billion in2015, and $12.4 billion in 2016, driven by strong production growth and improvinggas prices. EOG's hedges cover only a modest portion of our projected volumes,exposing the firm's cash flows to oil and gas price movements.Because EOG'sportfolio contains acreage positions with significant resource potential that will taketime and investment to convert to cash, we also consider longer-term reserve growthpotential and the marketplace for these reserves in our valuation. Our analysisindicates that proven reserves could climb from 12.7 trillion cubic feet equivalent atthe end of 2013 to 20.1 tcfe by 2016. This growth trajectory in proven reserves andgreater ultimate resource potential--considered within the context of historicalmarketplace transactions (on an EV/reserves basis)--supports valuation in line withour fair value estimate.
RiskEOG's biggest risk is a substantial and prolonged drop in oil and gas prices, whichwould depress profits, slow development plans, and reduce the value of itsproperties. Other risks include infrastructure bottlenecks that could reduce drillingactivity or lead to lower selling prices, higher services costs given tight supply inemerging plays, and headwinds from Washington, D.C.--including budget proposalsand stricter environmental regulations--that could eat into profitability.
Management & StewardshipEOG is led by Bill Thomas, who has more than 30 years of service with the company.He was named president in February 2011 and took over as CEO in mid-2013.EOG hasdemonstrated good stewardship over the years, with reasonable managementcompensation packages closely tied to returns on capital, a steadily increasingcommon stock dividend, and encouragement of equity ownership by key individualsthrough options issuance. EOG's executives currently own 1% of the common stock.We believe investors would benefit from greater and more consistent disclosure,however, especially regarding average operating metrics across certain plays.
?
Page 39 of 68

Generated on November 04, 2014
Analyst Digest | 2014 Thesis Portfolio | October 05, 2014 - November 04, 2014
ProfileEOG Resources explores for, produces, and markets natural gas and oil primarily inNorth America, with additional operations in Trinidad, the United Kingdom, andChina. The company focuses on horizontal drilling in unconventional plays. At year-end 2013, EOG's proven reserves totaled 12.7 trillion cubic feet of natural gasequivalent, with daily production of 3.1 bcfe. Natural gas made up 44% of productionand 40% of reserves.
?
Page 40 of 68

Generated on November 04, 2014
Analyst Digest | 2014 Thesis Portfolio | October 05, 2014 - November 04, 2014
iShares Nasdaq Biotechnology IBB |
QQQQQ
$292.83 h$17.50 | 6.36%ETF Valuation Rating (as of 11-03-2014) Fairly Valued
ETF Market Price (as of 11-03-2014) $296.31000
Fair Value Estimate $278.40
Consider Buying Price $233.55
Consider Selling Price $313.23
ETF Expected Return 7.16%
ETF Hurdle Rate 13.01%
ETF Expected Excess Return -5.85%
Morningstar Coverage 72.85% of assets
26 of 119 Holdings
Stock Quality (as % of assets) 23.57% Wide Moat
41.27% Narrow Moat
8.02% No Moat
Fair Value Uncertainty High
09-02-2014 | by Robert Goldsborough
The Thesis 09-02-2014Suitability Investors seeking exposure to the highly uncertain but potentially promisingprospects of the biotech industry can consider adding iShares Nasdaq Biotechnologyto their portfolios as a tactical satellite position to a diversified equity portfolio. Thisexchange-traded fund holds 121 biotech firms listed on the Nasdaq with market capsof at least $200 million. More than 20% of assets are small-cap names applyinginnovative techniques to research, develop, and commercialize various drugstargeting certain diseases or therapeutic niches. The jarring pace of change, single-product liability, regulatory uncertainties, and intellectual property rights makepicking stocks in the biotech sector a high-risk/high-reward proposition. As such, wethink investing in the industry via an ETF makes a lot of sense; it's a low-cost way togain diverse exposure to the industry in one trade. And this particular ETF may bebest suited for investors looking for as much diversification as possible; it has thebroadest number of holdings of any biotech ETF currently trading.Unlike several competing biotech ETFs that track equal-weight indexes, this fundtracks a market-cap-weighted index, which ensures that the more-established,larger-cap biotech firms hold more sway. As a result, IBB has been less volatile overthe past five years than any other biotech ETF and has been less volatile than all butone actively managed, biotech mutual fund. While an equal-weight strategy maysound like a reasonable choice for a lotterylike industry such as biotechnology, a cap-weighted strategy has resulted in better risk-adjusted returns over the past five and10 years. Fundamental View To win regulatory approval for a drug, a biotech company must take its therapythrough a 10- to 15-year research and development gauntlet in a process that costs$1 billion on average. After all that, success rates are low. Only about 20% of drugsreaching Phase I of clinical development ever actually hit the market. With all thesefactors, many smaller biotech firms don't turn a profit. Many give up their drugs'marketing rights to industry giants in exchange for royalties on sales and even cashupon reaching certain development milestones. The upshot: A biotech firm that cansuccessfully bring its products to market will reap bountiful rewards, grow
significantly, and create an instant economic moat.Led by large-cap biotechs, the shares of biotech firms have dramaticallyoutperformed the broader market over the past five years. The firms at the top of thisETF, such as Regeneron REGN, Biogen BIIB, Celgene CELG, Gilead GILD, and AmgenAMGN, have led the rally, benefiting from key drug approvals, strong sales ofalready-approved drugs, an attractive regulatory environment, and successfulintegrations of the acquisitions of smaller players. Acquisitions by largepharmaceutical companies also have fueled the biotech space's performance, as BigPharma has sought to improve its relatively empty drug pipelines in part by buying upbiotech firms. That has culminated in deals such as GlaxoSmithKline's GSKacquisition in 2012 of Human Genome Sciences. Given Big Pharma's flush balancesheets, we expect more biotechs to be acquired by large pharmaceutical firms in thenear term.One issue facing the biotech industry is health-care reform. Medicaid startedcovering more people in 2014, which should be a positive for volumes and the drugindustry. On the negative side, higher rebates already are in place for Medicaidpatients, which means biotechs will see lower net prices for their drugs.From a reimbursement standpoint, we like that most biotechs tend to focus onbiologics that address serious, chronic, or life-threatening illnesses; this means thatboth government and private insurers will in fact reimburse as medical benefits thehighly profitable infused drugs approved to treat major ailments. We also like thatbiotechs remain less vulnerable to generic competition than Big Pharma because ofthe difficulty of manufacturing, the cost of clinical trials, and the still-developingpathway for these products in the United States.In our view, the biotech industry is much less susceptible to government interventionthan other health-care subsectors--like hospital operators or MCOs. And we think anETF is the appropriate tool for investing in this notoriously volatile subsector. Onedrug's odds of success typically have no bearing on another's; we like thediversification among individual firms that this fund offers, which helps protectagainst single-stock risk.We're still cognizant that roughly half of this fund's holdings are early-stage playerswith no drug on the market yet. These smaller firms, with decidedly uncertainprospects but explosive upside potential, loom large. Bimodal businesses like upstartbiotech firms--which are plentiful here--are very difficult to forecast, subjecting anyfair value estimates to significant uncertainty. Thus, we'd demand a wide margin ofsafety before investing here.
Fees & AlternativesThe fund's 0.48% expense ratio is reasonable, but cheaper ETF options exist. Forinstance, both SPDR S&P Biotech XBI and Market Vectors Biotech ETF BBH chargejust 0.35%. Still, we think that IBB's price tag is quite reasonable given the biotech-industry diversification that it offers investors. What's more, IBB's estimated holdingcost is a more attractive 0.23%. Estimated holding costs are primarily composed ofthe expense ratio but also include transaction costs, sampling error, and share-lending revenue.
Alternatives Investors seeking exposure solely to biotechs also can consider SPDR S&PBiotech XBI (0.35% expense ratio), which is a fairly concentrated, equal-weightportfolio. While its expense ratio is reasonable, XBI has lagged many peersacross different time frames. XBI's 78-stock portfolio sports a holdings-weightedaverage market cap of $2.0 billion.An even more concentrated option is First Trust NYSE Arca Biotechnology Index FBT(0.60%), which has posted solid performance over the past five years. However, itsperformance has trailed IBB over the past few years, and it has displayed muchgreater volatility than IBB. It's also fairly pricey. FBT holds 20 biotech firms andclocks in at an average market cap of $9.8 billion.Two other ETF options are PowerShares Dynamic Biotech & Genome PBE (0.63%)and Market Vectors Biotech BBH (0.35%). The Market Vectors ETF is more of at radi t ional cap-weighted fund, hold ing the largest b iotechs ( th inkAmgen, Gilead, Celgene, and Biogen). As a result, BBH's portfolio of 25 biotech
?
Page 41 of 68

Generated on November 04, 2014
Analyst Digest | 2014 Thesis Portfolio | October 05, 2014 - November 04, 2014
stocks has an average market cap of $28.8 billion. For a quantitative-active approachto the biotech subsector, investors also can consider PBE, which holds 30 names andhas an average market cap of $7.3 billion.There also are several actively managed, open-end mutual funds offering exposure tobiotech that investors might want to consider. These include Bronze-rated FidelitySelect Biotechnology FBIOX (0.75%), Rydex Biotechnology RYBOX (1.61%), andFranklin Biotechnology Discovery FBDIX (1.10%). However, these funds' performancelargely has been comparable to IBB's, both in recent periods and over three- and five-year time frames, although the Rydex fund has lagged meaningfully over the pastyear.
Portfolio ConstructionThis ETF tracks the Nasdaq Biotechnology Index, which encompasses 121 Nasdaq-listed stocks that are either biotechnology or pharmaceuticals firms, as defined bythe FTSE and Dow Jones' Industry Classification Benchmark. As a practical matter,this ETF is both in name and focus a biotech-heavy ETF, with about 78% of the assetsin this ETF invested in firms that are classified as operating in biotechnology. Theremaining 21.5% of assets are invested in small- and mid-cap pharmaceutical firmssuch as Mylan MYL, Salix SLXP, and Theravance THRX. (This ETF holds Nasdaq-listedfirms only, and the U.S.' largest pharmaceutical firms trade on the New York StockExchange.)
IBB's index is one of eight subsectors that make up the Nasdaq Composite Index.While each firm must have an average daily trading volume of at least 100,000shares and a minimum market cap of $200 million, the portfolio spreads its assetsacross the market-cap range, with about 58% of assets in large caps, 21.5% in mid-caps, and 20% in small caps. The fund tracks a cap-weighted index and investsalmost 58.5% of assets in its top 10 holdings. The holdings-weighted average marketcap is $16 billion.
?
Page 42 of 68

Generated on November 04, 2014
Analyst Digest | 2014 Thesis Portfolio | October 05, 2014 - November 04, 2014
Whole Foods Market Inc WFM |
QQQQ
$39.82 h$1.61 | 4.21%Fair Value Estimate $45
Consider Buying Price $31.5
Consider Selling Price $60.75
Fair Value Uncertainty Medium
Economic Moat Narrow
Stewardship Grade Exemplary
11-03-2014 | by Ken Perkins
The Thesis 11-03-2014Whole Foods Market is the largest retailer of natural and organic foods and is alsothe first Certified Organic grocer in the United States. In many regards, the WholeFoods banner serves as an icon for health and quality, and this brand image allowsthe company to sell groceries at premium price points, drive private-label penetrationhigher, and sustain excess returns on capital. With a first-mover advantage in a nichesegment of the grocery market, Whole Foods can also leverage its brand equity todeploy capital into highly profitable new stores. As Whole Foods increases its storedensity across major markets, it also lowers per-unit costs.Whole Foods estimatesthat annual sales of natural products sold through U.S. retail channels approximate$80 billion, less than 15% of the roughly $600 billion U.S. consumers spend on foodconsumed at home. Whole Foods leads the market segment with more than 350stores (13 million square feet), and its differentiated value proposition (wide organicproduct range and customer service) has helped the firm avoid aggressivecompetition from nascent rivals. Notable competitors are The Fresh Market andSprouts Farmers Market, both of which operate approximately 150 stores that aresmaller (about 20,000 square feet for TFM and 25,000-28,000 square feet for SFM)than the average Whole Foods store (38,000 square feet) and carry fewer stock-keeping units (9,000-10,000 at TFM versus more than 20,000 at Whole Foods). Manyother concepts are popping up across the country, and some large grocery storeoperators are looking to expand organic and natural food offerings.Competitivesourcing could be a challenge in the future if retailer demand for organic and naturalfoods outpaces supply. Whole Foods makes most of its purchasing decisions on aregional or national scale to maximize volume discounts. The firm sources nearly onethird of its purchases from United Natural Foods Inc., and its distribution agreementwith UNFI extends through 2020. Despite this supplier concentration, we think WholeFoods has ample negotiating leverage since its brand equity, and not that of asupplier (and or its products), is the primary traffic driver.
ValuationOur fair value estimate is $45 per share, which implies a forward price/earnings ratioof roughly 26, an enterprise value/EBITDA ratio of approximately 11 times, and a freecash flow yield approximating 3%. The key long-term drivers that determine our fairvalue estimate are low-double-digit revenue growth and operating margins reachingnew historical peaks over the next decade. Whole Foods sees an opportunity tooperate at least 1,200 stores in the U.S. alone, nearly triple its current store count. Atthe firm's current pace of 30-40 new stores additions per year, Whole Foods shouldbe able to increase square footage by 7% annually over the next decade. Based uponthe historical relationship between new store openings and comparable store salesgrowth, we think Whole Foods can generate 5%-6% annual same-store sales growthover the next decade. We anticipate that per-unit costs could decrease as the firm'sstore density and private-label penetration (Whole Foods' 365 private-label brand)
increase, but we assume that the firm reinvests these costs savings into price. Thatsaid, we expect that Whole Foods can expand operating margins by leveraging store,general, and administrative expenses, and we forecast operating margins to expandto a peak of more than 7% over the next decade.
RiskWhole Foods faces several risks, including the risks of slower organic foodconsumption growth, aggressive competition from new entrants, traditional grocers,mass merchants, and wholesale clubs, real estate missteps resulting from openingmore than 30 new stores per year, real or perceived concerns about product quality,and supply chain disruptions. Another economic slowdown that causes consumers totrade down to lower-priced conventional products could also weigh on Whole Foods'comparable-store sales and profit margins.
Management & StewardshipWe assign Whole Foods an Exemplary stewardship rating, as we believemanagement's capital allocation policies have bolstered the firm's economic moat.Whole Foods' returns on invested capital have improved over the past several years,largely because of the firm's ability to expand operating margins. This marginexpansion has been driven by a number of factors, including distribution, direct store,and general and administrative expense leverage and lower new store openingexpenses. The firm has been able to reinvest cost savings into lower prices, whichimprove its price perception and ultimately protect the company's intangible assetmoat source. We also think the acquisition of Wild Oats has proved to be value-accretive to shareholders despite less-than-ideal timing and a dividend cut.The boardconsists of 11 directors, nine of whom are independent. John Mackey, co-founderand co-chief executive officer, and Walter Robb, co-CEO, are the nonindependentboard members. Mackey held both the CEO and chairman positions from 1978through December 2009. He voluntarily gave up the chairman role in December 2009for better governance. Mackey also divided his CEO role with Robb in May 2010.Before that, Robb served as co-president and chief operating officer from 2004 toMay 2010, chief operating officer from 2001 to September 2004, and executive vicepresident from 2000 to February 2001. Executive compensation for both cash andstock at Whole Foods is in line with shareholder interests and based on a number ofcriteria that include comparable-store sales growth, earnings before interest, taxes,and noncash expenses, net operating profits after taxes (NOPAT), return on investedcapital, and economic value added. Senior executive compensation at Whole Foodsis below traditional grocery operator industry peers, despite much betterperformance. In 2007, Mackey voluntarily reduced his annual salary to $1 and electedto forgo any future bonus and stock option awards. For the other senior executives,annual salaries are capped at 19 times the company's average annual wages.
ProfileWhole Foods Market is the world's leading retailer of natural and organic foods andis the first Certified Organic grocer in the U.S. Whole Foods' only operating segmentconsists of natural and organic foods supermarkets. As of fiscal 2013, the companyhad 344 stores in the U.S., 8 stores in Canada, and 7 stores in the U.K. The averagestore size is about 38,000 square feet. During fiscal 2013, about 12% of thecompany's sales were derived from the sale of private-label products.
?
Page 43 of 68

Generated on November 04, 2014
Analyst Digest | 2014 Thesis Portfolio | October 05, 2014 - November 04, 2014
Market Vectors® Gold Miners ETF GDX| Q
$17.78 -x$2.85 | –13.81%ETF Valuation Rating (as of 11-03-2014) Fairly Valued
ETF Market Price (as of 11-03-2014) $17.91000
Fair Value Estimate $23.71
Consider Buying Price $16.82
Consider Selling Price $31.31
ETF Expected Return 19.59%
ETF Hurdle Rate 19.12%
ETF Expected Excess Return 0.47%
Morningstar Coverage 61.56% of assets
14 of 42 Holdings
Stock Quality (as % of assets) % Wide Moat
3.56% Narrow Moat
57.99% No Moat
Fair Value Uncertainty Very High
03-26-2014 | by Samuel Lee
The Thesis 03-26-2014Suitability Gold miners' failure to ride the gold bull market up has traditionally beenblamed on the rise of physical gold exchange-traded funds, which supposedly drewaway investors who had used mining stocks to obtain gold exposure. While theremay a smidgen of truth to the story, it doesn't explain gold miners' continuedweakness (markets are forward-looking) or the fact that miners underperformed goldeven before the rise of ETFs.A better explanation: Gold miners have historically been terrible capital allocators inan industry that requires continuous capital expenditures to replace tapped-outmines. For most of the bull market, miners kept payouts low, using their surgingprofits to acquire or develop more mines, the symptom of a short-sighted growth-at-all-costs mind-set. They issued torrents of new shares to fund their spending sprees.From the beginning of 2005 to the end of 2012, gold miners' aggregate market capgrew by more than 16% annualized, while their aggregate price grew only about7.7% annualized. The 8% annualized gap between market cap and price performancerepresents share dilution. History shows that share issuances tend to signal futureunderperformance, in part because managers time the market to sell at peaks and inpart because firms often fail to realize the expected benefits of major capitalexpenditures.If the miners had just focused on returning cash to shareholders and keeping costsdown, their stock returns would have been a sight to behold. It takes a colossal effortto fail to exploit operational leverage when the prices of your goods are skyrocketing.I'm sympathetic to the common opinion that gold miners are some of the worst-managed firms out there.So, why own gold miners now after a history of epic waste, mismanagement, and, insome cases, fraud? First, the market has wised up to the sector's deficiencies.Miners now trade at very low valuations. The irony is this near-death experience isthe catalyst needed to set gold miners straight, to clean out incompetent managersand hire people who'll focus on prudent capital allocation. Second, miners are nowan attractive substitute for physical gold exposure. Finally, miners don't actually haveto provide exceptionally high returns to be worthwhile because their low correlation
to conventional stocks and bonds mean they can improve a portfolio's overall risk-adjusted returns. Fundamental View It's generally not a good idea to own firms that require large, ongoing capitalexpenditures under conditions of high uncertainty. Humans are overconfident andoptimistic, so they tend to overestimate the rewards and underestimate the costs ofmajor capital expenditures (whether it's a merger, a tunnel connecting New Jersey toNew York, or a new mining complex). Managers are rewarded for short-termperformance, but shareholders end up with long-term performance, so it's no surprisethat managers often overstate the rewards of these big projects that don't pay outuntil years later.There's also that dreaded institutional imperative at work, the tendency for managersto grow their companies just for the sake of growing. These aren't insolubleproblems, of course. Oil firm Exxon Mobil XOM has faced similar problems and madeshareholders a lot of money. XOM achieved this in large part because of itsshareholder-centric culture. XOM's dividend has steadily grown since the 1970s. Fewgold-mining firms have shown a similarly obsessive focus on prudent capitalallocation and sustainable growth over as long a period. Of those Morningstar equityanalysts cover, only Eldorado Gold Corp EGO earns the highest Stewardship Ratingof Exemplary. Analyst Kristoffer Inton has written that only EGO has an economicmoat as it, "boasts lower production costs relative to the rest of the gold miningindustry, with total unit cash costs of just $551 per ounce in 2013, compared with theaverage industry figure of close to $700 per ounce." However, both firms werefounded in the 1990s, whereas gold-mining has been a business for centuries--wheredid all the wide-moat firms of yesteryear go? They probably never existed.David Einhorn is perhaps the most famous gold-miner bull right now (though thereare plenty of others). As of Dec. 31, 2013, his hedge fund Greenlight Capital owned8.8 million shares of Market Vectors Gold Miners ETF GDX, making him the fund'sfifth-biggest institutional shareholder. Einhorn said in November 2011, "With gold attoday's price, the mining companies have the potential to generate double-digit cashflow returns and offer attractive risk-adjusted returns even if gold does not advancefurther." GDX was then trading at nearly $60 a share. Now it's trading under $25 asof this writing.Over the long run, gold miners will probably fail to offer attractive risk-adjustedreturns, barring a big runup in gold prices or a cultural sea change. In the mediumterm, gold miners look like a decent buy. They could be a good long-term buy ifmanagements are competent and gold prices don't take a nosedive. Two big ifs.
Fees & AlternativesThe fund carries a reasonable 0.52% price tag, similar to comparable equityprecious-metals funds. However, funds that hold the physical commodity are a bitcheaper. Van Eck has hired the Bank of New York Mellon as the fund's securitieslending agent, who on behalf of the fund lends out the underlying shares for a bit ofextra income. The funds pay "reasonable fees" and may share some of the incomewith the lending agent, but the annual report is vague as to how much the fund ispaying the agent.
GDX is probably best held in a taxable account. Its high volatility means it offersample tax-loss-harvesting opportunities. And its heavy international stake meansU.S. investors may be able to recover some of the funds' foreign withholding taxes bytaking a tax credit or deduction. Alternatives GDX doesn't face much competition. It is by far the biggest, most liquid goldminer ETF, though not the cheapest. The second biggest miner fund is MarketVectors Junior Miners ETF GDXJ. It charges a tad higher expense ratio--0.55%--andinvests in "junior miners," which are typically focused on the exploration and initialprospecting. The lotterylike payoff structure of this market segment has historicallymeant low risk-adjusted returns, as investors have been willing to pay dearly for thedream of hitting it big.The lowest-cost fund, iShares MSCI Global Gold Miners RING, charges 0.39%, but itsassets and secondary market liquidity are negligible. Unlike GDX, RING is able toown stocks listed on foreign exchanges, lending the fund a more mid-cap flavor.
?
Page 44 of 68

Generated on November 04, 2014
Analyst Digest | 2014 Thesis Portfolio | October 05, 2014 - November 04, 2014
Investors looking for direct exposure to gold should consider SPDR Gold Shares GLDor iShares Gold IAU. GLD is more heavily traded than IAU, but its 0.40% expenseratio is higher than IAU's 0.25%. GLD can be cheaper than IAU for rapid-fire traderswho turn over their positions frequently owing to the fund's narrower bid-ask spreadas a percentage of price.
Portfolio ConstructionThis fund tracks the NYSE Arca Gold Miners Index, a modified market-cap-weightedbenchmark of companies involved in gold and/or silver mining whose commonshares, American Depository Receipts (ADRs), or Global Depository Receipts (GDRs)are listed and electronically quoted on a major exchange that can be accessed byforeign investors. Although most of the fund's holdings are primarily focused on goldmining, it also includes a handful of silver miners, such as Silver Wheaton Corp SLW.Most of the fund's holdings are based outside the United States.
Because the gold-mining industry is top-heavy, the index has diversification rules. Nosingle stock can make up more than 20% of the portfolio, and stocks that each makeup more than 4.5% of the portfolio are capped at 50% of the index's total assets.Despite the rules, the top three holdings make up more than a third of assets.
The index composition is reviewed and rebalanced quarterly.
?
Page 45 of 68

Generated on November 04, 2014
Analyst Digest | 2014 Thesis Portfolio | October 05, 2014 - November 04, 2014
Financial Select Sector SPDR® ETFXLF | QQ
$23.77 h$0.49 | 2.08%ETF Valuation Rating (as of 11-03-2014) Fairly Valued
ETF Market Price (as of 11-03-2014) $23.93000
Fair Value Estimate $23.41
Consider Buying Price $16.78
Consider Selling Price $31.23
ETF Expected Return 9.49%
ETF Hurdle Rate 20.24%
ETF Expected Excess Return -10.75%
Morningstar Coverage 93.53% of assets
69 of 86 Holdings
Stock Quality (as % of assets) 19.42% Wide Moat
61.30% Narrow Moat
12.60% No Moat
Fair Value Uncertainty High
07-17-2014 | by Robert Goldsborough
The Thesis 07-17-2014Suitability Financial Select Sector SPDR is appropriate as a tactical satellite holding forbroad exposure to the U.S. financial-services sector. Unlike many other U.S. equitysectors, the financial-services sector still has never come back to its pre-crisis highs.The reasons for this have been well-documented, including greater regulation,continued ultralow interest rates, asset write-downs, and higher capitalrequirements.The index this ETF seeks to replicate defines the financial-services sector broadly toinclude commercial banks, diversified financial-services firms, capital-marketscompanies, insurers, REITs, and consumer finance firms. The result is a market-cap-weighted portfolio of 84 firms with a certain amount of concentration, as XLF's top-10 holdings make up slightly less than 50% of its assets.The financials sector offers high-beta exposure to the U.S. economy. The reason isthat even seemingly small changes in unemployment and consumer confidence canhave an outsize impact on loan repayment rates and the willingness to borrow. Otheraspects of the economy, including the health of the housing market and even theshape of the yield curve, can provide headwinds or tailwinds for financials firms.In recent years, owning XLF has required investors to be comfortable with far morevolatility as a whole. Indeed, XLF's 18.7% volatility of return over the past five yearshas been some 60% greater than the S&P 500 Index's 13.4% volatility of return overthat same interval. An investor in this fund should have a high risk tolerance butcould benefit from positive trends that may continue in the near term, including animproving macroeconomic environment, a further strengthening in the housingsector, and continued strong equity-market performance.This ETF offers the diversification that we think is prudent in a sector where someaspects of companies' operations are so opaque that it can be difficult to gaugecompanies' true risk exposure. One need look no further than the multi-billion-dollartrading loss at J.P. Morgan JPM in 2012 to understand the perils of single-stockinvesting in the financial-services sector. The fund's comprehensive sector portfoliomitigates company-specific risk while offering pure exposure to the U.S. financial-services industry. We believe this ETF is an effective tool for investors seeking to
overweight the financials sector within a broadly diversified portfolio. Fundamental View In the first half of 2014, the market performance of the U.S. financial-servicessector trailed the broader U.S. equity market by several hundred basis points.Thus far this year, there have been some small bumps in the road for a sector thathas enjoyed a robust comeback during the past five years, but where volatilityremains meaningfully high and uncertainty even higher. While no one doubts thatlarge banks, which dominate the financial sector, are far better capitalized than theywere heading into the financial crisis, the final results in March of the FederalReserve's annual stress test on the United States' 30 largest banks demonstrate botha lack of robustness on the part of some large lending institutions--includingCitigroup C--as well as the clear presence of a prominent headwind in the form ofelevated compliance, regulatory, and legal costs across the industry.Another headwind is the U.S. economy. While it unquestionably has shown somebright spots during the past several years, concerns about a less-than-strongeconomy generally have weighed on banks, which feel less inclined to lend in suchan environment. Less lending means less growth for banks.Interest rates remain a major issue for the financial-services sector. Continued lowinterest rates have meant continued pressure for banks' net interest margins.Morningstar's equity analysts don't expect interest-spread revenue at U.S. banks togrow anytime soon. Instead, it's more likely that low loan yields will mean interest-spread revenue will remain the same or even decline. Another issue that remains amajor headwind for U.S. banks is recurring regulation and litigation expenses, whichcontinue to hit banks' income statements. Other headwinds for U.S. banks includehigher compliance costs and still-high unemployment, which generally tends to keepborrowing and repayment rates low.To counteract lower spread revenue and thus tighter margins, U.S. banks havecontinued to reduce expenses, including cutting staff and branch locations. Bankshave not been shy about shuttering underperforming branches that cannot justifytheir continued operation. U.S. banks have positioned themselves well for the future;stress tests show that U.S. banks generally are better capitalized than in the pastand can withstand serious economic shock. As a result of the aggressive steps bankshave taken to recapitalize in the wake of the financial crisis and conservativeunderwriting in recent years, banks' capital ratios are improving. The strongerhousing market also has lessened the need for reserves, allowing banks to reduceprovisions for loan losses. (Banks broadly have had modest success growing theirbalance sheets.)Elsewhere in the financial-services industry, we continue to hold the view thatinvestment banks and asset managers will follow the market. Investment banks havebeen enjoying strong underwriting volumes, and the strength in the equity marketshas boosted the earnings of investment banks with asset management businesses.One clear concern with investment banks is the prospect of higher interest rates andtheir possible impact on debt underwriting, fixed-income trading, and the valuation ofthe banks' fixed-income securities. Certainly for asset managers, flows have taperedoff, particularly in the fixed-income market.One other issue facing XLF relates to European banks. European-domiciled financialsfirms make up a minuscule 2.2% of the assets of this ETF. However, problems withEurope's economy could have a contagion effect on large U.S. banks, becauseEuropean banks are counterparties to large U.S. banks. As such, a continued inabilityto solve sovereign debt problems in Europe could eventually cascade across theAtlantic, and we could see U.S. banks stuck absorbing some of the losses. That said,European banks are finally starting to catch up to their U.S. counterparts on thecapital front, reducing this risk (although they still meaningfully lag those of U.S.banks).
Fees & AlternativesThe fund's 0.16% expense ratio is lower than its closest peers'. Its high tradingvolume and deep asset base keep its bid-ask spread tight. State Street engages inshare lending, the practice of lending out the fund's underlying shares in exchangefor a fee. It passes 85% of the gross proceeds to investors, which partially offsetsthe fund's expenses. Alternatives
?
Page 46 of 68

Generated on November 04, 2014
Analyst Digest | 2014 Thesis Portfolio | October 05, 2014 - November 04, 2014
Vanguard Financials ETF VFH dips further down the market-cap ladder to offerbroader exposure to the U.S. financial industry. It owns all 539 financial-servicesfirms in the MSCI U.S. Investable Market 2500 index, including mid- and small-capcompanies. VFH is also less top-heavy. Its top 10 holdings account for 36% of theportfolio. This better diversification gave VFH a slightly less volatile profile than XLFover the past five years. Yet, during that time, these funds were nearly perfectlycorrelated. VFH charges 0.19%. We wouldn't recommend another large and liquidoption, iShares U.S. Financials IYF, which offers a broad portfolio of 272 financial-services firms but charges an unappealing 0.44% fee. During the past five years, IYFand XLF were nearly perfectly correlated.A recently launched and very inexpensive option is Fidelity MSCI Financials ETFFNCL, which charges 0.12%. However, FNCL has minimal assets and is thinly traded.FNCL tracks a slightly different index from Vanguard Financials ETF; FNCL tracks theMSCI USA IMI Financials Index, while VFH tracks the MSCI US Investable MarketFinancials 25/50 Index. Fidelity customers with a minimum balance of $2,500 can buyFNCL commission-free, although they are subject to a short-term trading fee byFidelity.Investors looking for more direct exposure to U.S. banks and less exposure tononbank financial institutions might consider SPDR S&P Bank ETF KBE. This fundoffers equal-weight exposure to 58 U.S. banks, with more than two thirds of theportfolio invested in small- and mid-cap companies. KBE charges 0.35%.
Portfolio ConstructionThe fund employs full replication to track the S&P Financial Select Sector Index,which includes all financials stocks in the S&P 500. This modified market-cap-weighted benchmark limits individual constituents to 23% of the index, and the sumof securities whose weightings are greater than 4.8% cannot exceed 50% of theindex. These limits allow XLF to qualify as a Regulated Investment Company. S&Prebalances the index quarterly.
?
Page 47 of 68

Generated on November 04, 2014
Analyst Digest | 2014 Thesis Portfolio | October 05, 2014 - November 04, 2014
Consumer Discret Sel Sect SPDR® ETFXLY | QQQQ
$66.99 h$0.04 | 0.06%ETF Valuation Rating (as of 11-03-2014) Fairly Valued
ETF Market Price (as of 11-03-2014) $68.10000
Fair Value Estimate $68.39
Consider Buying Price $49.03
Consider Selling Price $91.25
ETF Expected Return 10.26%
ETF Hurdle Rate 20.02%
ETF Expected Excess Return -9.76%
Morningstar Coverage 94.06% of assets
71 of 85 Holdings
Stock Quality (as % of assets) 49.75% Wide Moat
30.96% Narrow Moat
13.15% No Moat
Fair Value Uncertainty High
09-12-2014 | by Robert Goldsborough
The Thesis 09-12-2014Suitability Consumer Discretionary Select Sector SPDR XLY offers investors exposure tofirms in the S&P 500 Index that largely depend on discretionary consumer spending.The low-cost, highly liquid exchange-traded fund, which holds 85 companies, is fairlyconcentrated and owns retail firms, restaurants, media companies, apparel andluxury goods companies, automobile manufacturers, and leisure firms. This ETF isbest treated as a tactical satellite holding to complement a diversified portfolio andfor investors looking to bulk up their exposure to the consumer.Over the past 10 years, this ETF has had a volatility return of 18.2%, compared withthe S&P 500 Index's volatility of return of 14.7%. XLY's five-year beta relative to theMSCI ACWI Index is 0.91. That's in the middle relative to the betas of competingconsumer discretionary ETFs. That means that XLY would be expected to exhibitmore volatility across a cycle than competing fund iShares US Consumer ServicesIYC, which has a five-year beta relative to that benchmark of 0.84, but less volatilitythan Vanguard Consumer Discretionary ETF VCR, whose five-year beta relative tothat index is 0.97. The biggest difference between the three ETFs is that IYC holdsWal-Mart WMT (which is IYC's top holding), while the other two funds do not. Fundamental View Investors should take note that the Consumer Discretionary Select Sector SPDRis a cyclical play tied to consumer spending. At the same time, cyclical firms usuallydo rally before the economy fully emerges from a slump.Consumer confidence in the United States has continued to advance. In August 2014,a key measure of consumer confidence, the Thomson Reuters/University ofMichigan's consumer sentiment index, increased to the index's highest reading sinceJuly 2007. At the same time, consumer spending fell slightly (0.1%) in July 2014,which was its first decline in six months. Consumer spending has been mostly on anupward trajectory for more than a year, and many economists forecast that tocontinue in the near term, amid growing confidence and some continuedimprovement in macro trends, such as employment, business spending, andmanufacturing. Job gains, a rebounding housing market, and a stock market thatcontinues to hit highs offer good reasons to be bullish on consumer confidence in the
medium term. Morningstar's director of economic analysis Robert Johnson forecastsgross domestic product growth of 2.0% to 2.5% in 2014, with employment growth of190,000 jobs per month and inflation at 1.8% to 2.0%. He also anticipates consumerspending that is stable to modestly higher.While it's not news that e-commerce has become a growing force in the NorthAmerican retail industry, e-commerce may have hit a tipping point in 2014 asconsumers' embracing of online shopping has seemed to be accelerating and leavingmany traditional bricks-and-mortar retailers unable to keep up. Up to now, manytraditional retailers have followed an omnichannel strategy, and it was reasonablyeffective in 2013 for a number of publicly traded retailers, which adopted tacticalmeasures to compete with online retailers, such as price-matching efforts, otherpromotional activities, store-within-store partnerships with key suppliers, onlineorder fulfillment from local stores, and even the development of mobile phone appsthat enhance in-store shopping trips.The 2013 holiday season may have marked a change, as Amazon has continued toboost its fulfillment capabilities while also remaining a formidable competitor from apricing standpoint. Investors interested in the retail space should note that sometraditional retail business models, such as home-improvement and auto-parts retail,have characteristics that insulate them from e-commerce competition (need forsalesperson help, immediacy of need, specialized nature, diversity of productassortment), other areas of retail, such as toys, office supplies, and consumerelectronics, should expect to see continued price compression as consumers shift toe-commerce.Because of these recent headwinds, the consumer discretionary sector is relativelyundervalued right now, according to Morningstar's equity analysts. It strikes us thatsome fairly short-term dynamics are pressuring a good number of consumerdiscretionary names, and we could see a number of those reversing (or at leastceasing to be drags). For the sector to outperform in the medium term, we wouldexpect to see further gains in the housing and job markets, with real wage growth. Inaddition, the global stage would need to take part as well, with rebounding strengthin Europe and, in particular, emerging markets. (We like the idea of a growing baseof middle-class consumers in emerging markets helping to offset broader economicconcerns over the long run.) With those factors in place, we could see the consumerdiscretionary sector resuming its rally.Although all of this ETF's holdings are domiciled in the U.S., many of the companieshave significant operations overseas, and those holdings have the potential to beaffected by a slower world economy that is being forecast. The good news is thatemerging markets are showing signs of stabilization, even if Europe's problems arefurther away from being solved. Some of this ETF's holdings with the most overseasexposure are restaurant operators such as McDonald's MCD (foreign operationsmake up 68.5% of revenue, and Europe represents 40% of sales) and YumBrands YUM (foreign operations represent 77.5% of sales). If Europe continues tostruggle or emerging-markets countries began slowing again, that could impede bothcompanies.
Media companies make up the biggest slice of this ETF, comprising about 30.5% ofassets. However, very little of this fund's media stake is invested in "old media"companies like Gannett GCI. Instead, XLY holds a raft of entertainment companiesand cable network owners, such as Walt Disney DIS, Twenty-First Century Fox FOXA,and Viacom VIAB, as well as cable and satellite system companies such as Comcast,Time Warner Cable, and DirecTV DTV. Although entertainment firms often facechoppy results from the hit-or-miss nature of blockbuster movies, firms like Disney,News Corp., and Viacom possess deep libraries of content that can reduce volatilityand generate stable cash flows. When evaluating those firms, investors also shouldwatch economic trends closely, as economic stagnation can have a meaningfulimpact on the broadcast and cable networks those firms own. Meanwhile, the cableand satellite system companies have broad coverage but operate in what weconsider to be fairly mature markets (thus driving Comcast and Time Warner topursue a merger). They also are finding themselves with some tough competitors,including phone companies and Internet-based video distribution.
Fees & Alternatives
?
Page 48 of 68

Generated on November 04, 2014
Analyst Digest | 2014 Thesis Portfolio | October 05, 2014 - November 04, 2014
The fund's 0.16% expense ratio is low, although there are lower-priced funds in theconsumer discretionary space. Vanguard Consumer Discretionary ETF VCR chargesslightly less, at 0.14%, and Fidelity MSCI Consumer Discretionary Index ETF FDIScharges 0.12%. XLY's estimated holding cost of 0.20% is slightly higher than itsexpense ratio. Estimated holding costs are primarily composed of the expense ratiobut also include transaction costs, sampling error, and share lending revenue. Alternatives There are several alternatives for comparable exposure to discretionaryconsumer spending. Investors can consider Vanguard Consumer DiscretionaryETF VCR (0.14% expense ratio), which--given that it holds 386 companies--is a farmore diversified way to invest in the space.Another option is First Trust Consumer Discretionary AlphaDEX FXD (0.70%), whichspreads its 133 stocks more evenly; its top 10 holdings comprise 14% of assets. ThisETF uses an enhanced index that takes valuation into account when it drawscomponent firms. Because of that structure, its holdings generally are less "growthy"than those found in XLY or VCR. Despite its higher price and its stock-selectionmethodology, FXD's performance has slightly lagged its larger consumerdiscretionary ETF peers over the past three and five years.A recently launched and very inexpensive option is Fidelity MSCI ConsumerDiscretionary ETF FDIS, which charges 0.12%. However, FDIS has minimal assets andis thinly traded. FDIS tracks a slightly different index from Vanguard ConsumerDiscretionary ETF; FDIS tracks the MSCI USA IMI Consumer Discretionary Index,while VCR tracks the MSCI US Investable Market Consumer Discretionary 25/50Index. Fidelity customers with a minimum balance of $2,500 can buy FDIScommission-free, although they are subject to a short-term trading fee by Fidelity.An international option is iShares Global Consumer Discretionary RXI (0.47%).However, investors should note that with this fund they are essentially getting anoverweighting to the automotive industry, given that RXI's top 25 holdings includeToyota TM, Daimler, Ford F, Volkswagen, General Motors GM, and Honda HMC.The performance of all of the above-mentioned ETFs is very highly correlated. Thehigh performance correlations between all consumer discretionary ETFs give us allthe more conviction in urging investors to consider the option with the bestcombination of liquidity and price, VCR. In addition, VCR's estimated holding cost isjust 0.09%.
Portfolio ConstructionXLY follows a full replication strategy and holds every consumer discretionary stockin the S&P 500 Index. The sector comprises about 12% of the broader S&P 500 Index.Sticking to S&P 500 companies provides an initial screen for quality, as holdingsmust meet the standards of the S&P selection committee. The fund makes dividenddistributions on a quarterly basis. As one of the Select Sector SPDR ETFs, XLYfollows S&P's rules for index construction. S&P has the flexibility to make changes tothe S&P 500 Index any time as needed, with no annual or semiannual reconstitution.Then, a company's stock is assigned to a particular Select Sector index on the basisof its sales and earnings composition and on the sensitivity of its stock price andbusiness results to the common factors affecting other companies in each SelectSector index. Under the rules, every constituent in the S&P 500 Index is assigned to aparticular Select Sector index, and no company can be included in more than oneindex.
?
Page 49 of 68

Generated on November 04, 2014
Analyst Digest | 2014 Thesis Portfolio | October 05, 2014 - November 04, 2014
Utilities Select Sector SPDR® ETF XLU| QQQ
$45.45 h$2.91 | 6.84%ETF Valuation Rating (as of 11-03-2014) Overvalued
ETF Market Price (as of 11-03-2014) $45.77000
Fair Value Estimate $41.52
Consider Buying Price $38.03
Consider Selling Price $44.23
ETF Expected Return 5.24%
ETF Hurdle Rate 8.94%
ETF Expected Excess Return -3.70%
Morningstar Coverage 100.00% of assets
31 of 31 Holdings
Stock Quality (as % of assets) 5.49% Wide Moat
90.78% Narrow Moat
3.46% No Moat
Fair Value Uncertainty Medium
10-03-2014 | by Robert Goldsborough
The Thesis 10-03-2014Suitability Utilities Select Sector SPDR XLU is an option for investors who want broadexposure to defensive, high-yielding United States utilities companies. This fund'sholdings include regulated utilities, diversified utilities, and unregulated powergenerators, and such companies are known for their reliability and incomegeneration. This exchange-traded fund is suitable as a satellite holding for adiversified equity portfolio, given that the utilities sector makes up about 3% of theS&P 500 Index. The fund also can serve as a tactical bet on low interest rates andlong-term growth in electricity demand.Like most ETFs that invest in utilities companies, XLU pays a healthy yield. The fundis currently yielding 3.8% and over the past few years, its yield has averaged around4.2%.Prior to 2000, utilities' reputation among investors was one of reliability and incomegeneration, and not necessarily price appreciation. However, since that time, thelong decline in interest rates likely broadened utilities companies' investor base.However, since the yield spread--the difference between utilities companies'dividend yields and 10-year U.S. Treasury rates--began its compression in June 2012,utilities companies have meaningfully trailed the broader equity market. Longer-term,in a rising-rate environment, we would expect flat returns at best for utilitiescompanies and underperformance when compared with other equity sectors. Higherrates generally make fixed-income instruments more attractive on a relative basisand make bondlike equities, such as utilities companies, less attractive.This ETF's volatility is low. Over the past five years, this ETF's volatility of return of11.7% is lower than the 13.2% that the S&P 500 Index has experienced. Fundamental View The U.S. utilities sector has posted strong recent performance. Since the start of2014, the utilities sector has significantly outperformed the broad U.S. equity marketafter lagging it (and every other U.S. equity sector) by a meaningful amount in 2013.Even so, 2013 was a historically good year for utilities companies, whose 14% totalreturn was nearly twice the sector's long-term annual return.Driving utilities companies in 2014 have been two dynamics: weather and interest
rates. Early in the year, extreme winter weather helped utilities companies and inparticular gas utilities. Then, another pullback in interest rates has been a nicebenefit for the highest-yielding and most-defensive utilities. Right now,Morningstar's equity analysts believe that utilities appear to be pricing in 4% 10-yearU.S. Treasury rates. That means that even a modest rise in interest rates should notbe a meaningful negative for the share prices of utilities companies. Our analystsalso believe that if Treasury rates stabilize closer to 3%, utilities actually couldoutperform the market.Because dividends are such a major part of the story for investors in utilitiescompanies, it's worth discussing the outlook for payout ratios. The headline is thatwe see no wholesale threat to dividends across the sector. Given strong companyfundamentals, our equity analysts are forecasting a sector average payout of 59% for2014, which is in line with historical averages. In addition, with sustainable payoutratios, our analysts believe that dividends could grow as much as 5% annually, whichbests the median 3% earnings growth that investors have seen in the sector duringthe past three years.Several dynamics that utilities-sector investors should watch closely includecontinued low electricity demand, the impact of low natural gas prices on higher-costcoal and nuclear plants (and broadly, on unregulated power producers), and newenvironmental regulation, which could result in coal plant closures, reducedemissions, and increased capital investments. In the medium term, newenvironmental regulation could have the effect of taking plants off line, resulting inpower shortages, higher power prices, and a boost for diversified utilities andindependent power generators over the next five to 10 years.To cope with low power prices in the short run, diversified utilities and independentpower producers continue to pursue mergers and acquisitions to improve costefficiency and geographic diversification and to expand into new growth markets.Good-sized recent deals include Exelon's EXC proposal to acquire Pepco POM,Berkshire Hathaway's BRK.A December 2013 acquisition of NV Energy, Exelon'sacquisition of Constellation Energy, UIL Holdings' UIL bid for Philadelphia GasWorks, TECO Energy's TE September 2014 acquisition of New Mexico Gas, and NRGEnergy's NRG acquisition of GenOn Energy. (Another big merger was NortheastUtilities' NU purchase of NSTAR, but those are both regulated utilities, so themerger had nothing to do with power prices and everything to do with costefficiencies.) If power prices remain low, industry consolidation will likely continue.Most utilities companies include debt as part of their capital structure, generallyborrowing to fund capital expenditures and issuing dividends from retained earnings.Regulated utilities are by definition subject to regulators, who allow utilitiescompanies to pay dividends, borrow for capital expenditures, and then raise rates tofund debt service. Payout ratios for utilities companies generally are in the 50%-60%range, with a very stable outlook for those ratios. Our analysts assign most regulatedutilities narrow moats, as they have reliable cash-flow streams and somemonopolylike characteristics but also are subject to regulators. Our analysts assignno moat to unregulated utilities, which are effectively commodity producers with nodifferentiated characteristics.
Fees & AlternativesThe fund charges a reasonable 0.16% expense ratio, making it the second-lowest-cost, large and liquid utilities fund available. Both the fund and its holdings areliquid, which keeps its bid-ask spread tight and minimizes deviations from net assetvalue. State Street engages in share lending, the practice of lending out the fund'sunderlying shares in exchange for a fee. It passes 85% of the gross proceeds toinvestors, which partially offsets the fund's expenses. Alternatives Investors looking for better-diversified exposure to the utilities sector shouldconsider Vanguard Utilities ETF VPU. VPU extends its reach further down the market-cap ladder and rests on a broader base of 78 stocks. Despite its better-diversifiedportfolio, VPU exhibited volatility comparable to XLU over the past five years. VPU's0.14% expense ratio is less than XLU's, but the Vanguard fund is less than one thirdits size, which may give it a wider bid-ask spread. Over the past five years, VPU andXLU were nearly perfectly correlated.IShares U.S. Utilities IDU is a more-expensive alternative. Its fees take a 0.43% bite
?
Page 50 of 68

Generated on November 04, 2014
Analyst Digest | 2014 Thesis Portfolio | October 05, 2014 - November 04, 2014
out of the fund's returns each year. For this hefty price, investors get a portfolio of 60large-, mid-, and small-cap stocks in the Dow Jones Utilities Index. However, morethan 95% of IDU's assets overlap with VPU. IDU also has less than half the assets ofVPU.A recently launched and very inexpensive option is Fidelity MSCI Utilities Index ETFFUTY, which charges 0.12%. However, FUTY has minimal assets and is thinly traded.FUTY tracks a slightly different index from Vanguard Utilities ETF; FUTY tracks theMSCI USA IMI Utilities Index, while VPU tracks the MSCI US Investable MarketUtilities 25/50 Index. Fidelity customers with a minimum balance of $2,500 can buyFUTY commission-free, although they are subject to a short-term trading fee byFidelity.
Portfolio ConstructionXLU tracks the Utilities Sector Select Index, investing in all 30 utilities companies inthe S&P 500 Index, and it weights these holdings in proportion to their float-adjustedmarket capitalization. S&P's cap-weighting approach limits individual positions to19% of the portfolio, though XLU's largest holding falls well below that mark. Electricutilities represent 56% of the portfolio, but diversified utilities also have meaningfulweight (38%). Gas utilities and independent power producers & energy tradersrespectively account for 4% and 1% of the portfolio. Because of its limited number ofholdings, the portfolio is highly concentrated. The top 10 holdings soak up more than59% of the fund's assets. Additionally, its holdings only account for between 3% and4% of the total assets in the S&P 500. XLU has consistently fallen in the deep-valuezone of the Morningstar Style Box.
?
Page 51 of 68
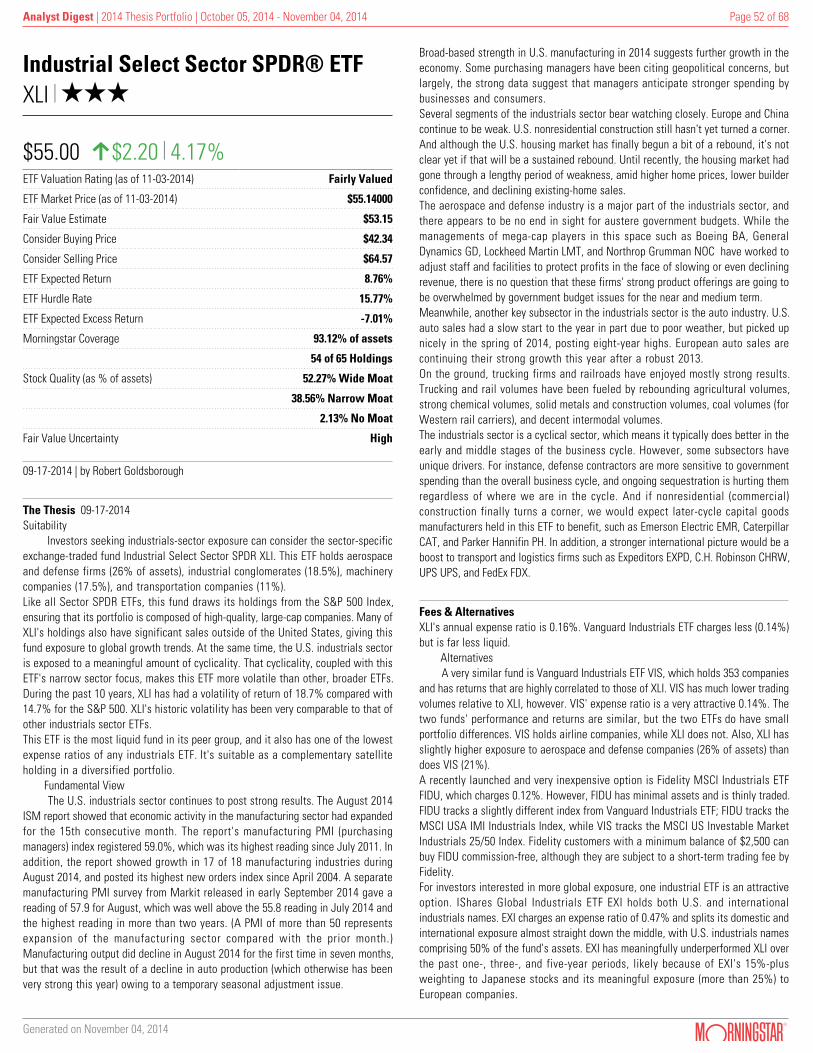
Generated on November 04, 2014
Analyst Digest | 2014 Thesis Portfolio | October 05, 2014 - November 04, 2014
Industrial Select Sector SPDR® ETFXLI | QQQ
$55.00 h$2.20 | 4.17%ETF Valuation Rating (as of 11-03-2014) Fairly Valued
ETF Market Price (as of 11-03-2014) $55.14000
Fair Value Estimate $53.15
Consider Buying Price $42.34
Consider Selling Price $64.57
ETF Expected Return 8.76%
ETF Hurdle Rate 15.77%
ETF Expected Excess Return -7.01%
Morningstar Coverage 93.12% of assets
54 of 65 Holdings
Stock Quality (as % of assets) 52.27% Wide Moat
38.56% Narrow Moat
2.13% No Moat
Fair Value Uncertainty High
09-17-2014 | by Robert Goldsborough
The Thesis 09-17-2014Suitability Investors seeking industrials-sector exposure can consider the sector-specificexchange-traded fund Industrial Select Sector SPDR XLI. This ETF holds aerospaceand defense firms (26% of assets), industrial conglomerates (18.5%), machinerycompanies (17.5%), and transportation companies (11%).Like all Sector SPDR ETFs, this fund draws its holdings from the S&P 500 Index,ensuring that its portfolio is composed of high-quality, large-cap companies. Many ofXLI's holdings also have significant sales outside of the United States, giving thisfund exposure to global growth trends. At the same time, the U.S. industrials sectoris exposed to a meaningful amount of cyclicality. That cyclicality, coupled with thisETF's narrow sector focus, makes this ETF more volatile than other, broader ETFs.During the past 10 years, XLI has had a volatility of return of 18.7% compared with14.7% for the S&P 500. XLI's historic volatility has been very comparable to that ofother industrials sector ETFs.This ETF is the most liquid fund in its peer group, and it also has one of the lowestexpense ratios of any industrials ETF. It's suitable as a complementary satelliteholding in a diversified portfolio. Fundamental View The U.S. industrials sector continues to post strong results. The August 2014ISM report showed that economic activity in the manufacturing sector had expandedfor the 15th consecutive month. The report's manufacturing PMI (purchasingmanagers) index registered 59.0%, which was its highest reading since July 2011. Inaddition, the report showed growth in 17 of 18 manufacturing industries duringAugust 2014, and posted its highest new orders index since April 2004. A separatemanufacturing PMI survey from Markit released in early September 2014 gave areading of 57.9 for August, which was well above the 55.8 reading in July 2014 andthe highest reading in more than two years. (A PMI of more than 50 representsexpansion of the manufacturing sector compared with the prior month.)Manufacturing output did decline in August 2014 for the first time in seven months,but that was the result of a decline in auto production (which otherwise has beenvery strong this year) owing to a temporary seasonal adjustment issue.
Broad-based strength in U.S. manufacturing in 2014 suggests further growth in theeconomy. Some purchasing managers have been citing geopolitical concerns, butlargely, the strong data suggest that managers anticipate stronger spending bybusinesses and consumers.Several segments of the industrials sector bear watching closely. Europe and Chinacontinue to be weak. U.S. nonresidential construction still hasn't yet turned a corner.And although the U.S. housing market has finally begun a bit of a rebound, it's notclear yet if that will be a sustained rebound. Until recently, the housing market hadgone through a lengthy period of weakness, amid higher home prices, lower builderconfidence, and declining existing-home sales.The aerospace and defense industry is a major part of the industrials sector, andthere appears to be no end in sight for austere government budgets. While themanagements of mega-cap players in this space such as Boeing BA, GeneralDynamics GD, Lockheed Martin LMT, and Northrop Grumman NOC have worked toadjust staff and facilities to protect profits in the face of slowing or even decliningrevenue, there is no question that these firms' strong product offerings are going tobe overwhelmed by government budget issues for the near and medium term.Meanwhile, another key subsector in the industrials sector is the auto industry. U.S.auto sales had a slow start to the year in part due to poor weather, but picked upnicely in the spring of 2014, posting eight-year highs. European auto sales arecontinuing their strong growth this year after a robust 2013.On the ground, trucking firms and railroads have enjoyed mostly strong results.Trucking and rail volumes have been fueled by rebounding agricultural volumes,strong chemical volumes, solid metals and construction volumes, coal volumes (forWestern rail carriers), and decent intermodal volumes. The industrials sector is a cyclical sector, which means it typically does better in theearly and middle stages of the business cycle. However, some subsectors haveunique drivers. For instance, defense contractors are more sensitive to governmentspending than the overall business cycle, and ongoing sequestration is hurting themregardless of where we are in the cycle. And if nonresidential (commercial)construction finally turns a corner, we would expect later-cycle capital goodsmanufacturers held in this ETF to benefit, such as Emerson Electric EMR, CaterpillarCAT, and Parker Hannifin PH. In addition, a stronger international picture would be aboost to transport and logistics firms such as Expeditors EXPD, C.H. Robinson CHRW,UPS UPS, and FedEx FDX.
Fees & AlternativesXLI's annual expense ratio is 0.16%. Vanguard Industrials ETF charges less (0.14%)but is far less liquid. Alternatives A very similar fund is Vanguard Industrials ETF VIS, which holds 353 companiesand has returns that are highly correlated to those of XLI. VIS has much lower tradingvolumes relative to XLI, however. VIS' expense ratio is a very attractive 0.14%. Thetwo funds' performance and returns are similar, but the two ETFs do have smallportfolio differences. VIS holds airline companies, while XLI does not. Also, XLI hasslightly higher exposure to aerospace and defense companies (26% of assets) thandoes VIS (21%).A recently launched and very inexpensive option is Fidelity MSCI Industrials ETFFIDU, which charges 0.12%. However, FIDU has minimal assets and is thinly traded.FIDU tracks a slightly different index from Vanguard Industrials ETF; FIDU tracks theMSCI USA IMI Industrials Index, while VIS tracks the MSCI US Investable MarketIndustrials 25/50 Index. Fidelity customers with a minimum balance of $2,500 canbuy FIDU commission-free, although they are subject to a short-term trading fee byFidelity.For investors interested in more global exposure, one industrial ETF is an attractiveoption. IShares Global Industrials ETF EXI holds both U.S. and internationalindustrials names. EXI charges an expense ratio of 0.47% and splits its domestic andinternational exposure almost straight down the middle, with U.S. industrials namescomprising 50% of the fund's assets. EXI has meaningfully underperformed XLI overthe past one-, three-, and five-year periods, likely because of EXI's 15%-plusweighting to Japanese stocks and its meaningful exposure (more than 25%) toEuropean companies.
?
Page 52 of 68

Generated on November 04, 2014
Analyst Digest | 2014 Thesis Portfolio | October 05, 2014 - November 04, 2014
Portfolio ConstructionOne of nine Select Sector SPDRs, this fund tracks the industrials sector of the S&P500 Index and holds 64 companies. XLI's holdings are market-cap-weighted, with thetop 20 accounting for almost 68% of the total portfolio. The largest subsectorweightings are aerospace and defense, industrial conglomerates, and machinery,which account for 26.0%, 18.5%, and 17.5% of fund assets, respectively.
Note that this fund does not hold any steel or materials companies. Investors lookingfor exposure to that sector can take a look at Materials Select Sector SPDR XLB orVanguard Materials ETF VAW.
?
Page 53 of 68

Generated on November 04, 2014
Analyst Digest | 2014 Thesis Portfolio | October 05, 2014 - November 04, 2014
Yum Brands Inc YUM | QQQQ
$71.69 h$0.06 | 0.08%Fair Value Estimate $80
Consider Buying Price $56
Consider Selling Price $108
Fair Value Uncertainty Medium
Economic Moat Narrow
Stewardship Grade Standard
10-10-2014 | by R.J. Hottovy
The Thesis 10-10-2014Yum Brands is one of the more compelling global growth stories in our consumercoverage. Its core brands--KFC, Pizza Hut, and Taco Bell--occupy leading categorypositions and possess sizable international appeal, which should help extend itsleadership in China and succeed in other emerging markets. Although rivalry amongquick-service restaurants is on the rise globally, we remain optimistic about Yum'sability to generate positive returns thanks to an economic moat stemming from itsbrand intangible assets, cohesive franchise network, bargaining clout with suppliers,and scale advantages.Yum China will come under pressure during the back half of2014 and early 2015 after food-quality concerns at one of the region's key beef andpoultry suppliers, but we remain confident that its brands can withstand theseissues. Although we anticipate double-digit comp declines from Yum China in theback half of 2014, we believe quality-assurance marketing and a menu revamp canhelp mitigate brand impairment issues. We remain optimistic about Yum's potentialin China due to an established distribution infrastructure and local site developmentteams, and find management's division goal of 20% restaurant margins and 15%normalized operating income growth feasible based on low double-digit unit growth,midteen system sales growth, and moderate G&A expense leverage (but partlytempered by promotional activity and labor cost inflation).With roughly 40% of Yum'soperating income coming from China, the stock is tied to market perceptions ofmacro and consumer trends in the region. However, we view Yum as more than aChina story, and encourage investors to evaluate Yum's other divisions. As Yumshifts to a brand reporting structure (KFC, Pizza Hut, and Taco Bell have beenconsolidated by brand in every region except China and India), we expect acceleratedunit and comp growth with margin expansion through centralized brand support andbest practice sharing across regions. Although we recognize near-term emergingmarket consumer headwinds, we view these pressures as temporary and view acompanywide long-term goal of 10% operating income growth as reasonable.
ValuationAlthough management's updated outlook for 2014 (provided on its third-quarterupdate) was a shade below our expectations amid top-line pressures and subsequentoperating expense deleverage in China due to negative publicity surrounding aformer food supplier, we're maintaining our $80 fair value estimate. Our fair valuerepresents fiscal 2015 price/earnings of 21 times, enterprise value/EBITDA of 11times, and a free cash flow yield of around 4%. Our assumptions remain moreconservative than management's internal DCF projections (which pegs the intrinsicvalue of the stock at $85 to $95 per share) and its sum-of-the-parts valuation (whichimplies values of approximately $40, $34, and $16 per share for the China division,global franchising fees and licensing revenue streams, and company-ownedrestaurants outside of China, respectively). Based on recent sales pressures in China,we've cut our consolidated revenue growth forecast to 3% in 2014 (versus 4%previously). For the full year, we now anticipate Yum's China division to post high-single-digit unit growth, a nominal decline in same-store sales growth (with double-
digit declines in the back half of the year negating 12% comps in the first half of theyear), 16% restaurant margins (implying 50 basis points of improvement), and a littlemore than 11% operating income growth. In Yum's other regions (formerly the U.S.and YRI segments), we anticipate low-single-digit comp growth amid increasedcompetition and emerging market consumer spending pressures and low-single-digitunit growth, bringing our consolidated revenue growth forecast to 7% for KFC and2% for Pizza Hut. We've assumed a low-single-digit revenue decline for Taco Bell in2014 due to refranchising efforts. Over the next 10 years, we assume Yum will growto almost 60,000 restaurants (including nearly 14,000 units in China) and deliverglobal comps in the low- to mid-single-digit range, bringing our average 10-yearrevenue growth forecast to 8%.We expect consolidated restaurant margins toimprove 20 basis points to 15.2% and operating margins to expand by between 200basis points in 2014 to 15.7%. We view management's updated EPS outlook for 2014calling for an increase of 6%-10% (implying $3.14-$3.27) as realistic. However, weexpect longer-term contribution from additional franchise locations, new sales layers,and increased scale in emerging markets, which should help to drive consolidatedoperating margins to just under 20% by 2023.
RiskRivalry among quick-service and fast-casual restaurants is on the rise, with chainsincreasingly competing with one another on price, product differentiation, and acrossdifferent dayparts. We generally view the U.S. quick-service restaurant industry asmature, suggesting players will increasingly fight each other for market share. Inaddition to industry competition, Yum and its franchisees must contend with anuneven consumer spending environment, aggressive and often irrational industrypromotional activity, wage inflation, and volatile commodity costs, each of whichcould diminish profitability. Moreover, credit market volatility could impedefranchisees from adding new restaurants, performing renovations, or purchasingequipment.With approximately 40% of total operating profits coming from its Chinasegment the past three years, Yum is more sensitive to fluctuations in the regionthan its peers, including currency movements, increased labor costs, thesustainability of GDP growth, and negative publicity tied to food quality concerns.Additionally, we believe the company will face increasing competition fromMcDonald's and other Western quick-service restaurant rivals as they expand furtherin China and other foreign markets.
Management & StewardshipIn May 2014, Yum outlined a succession plan for current CEO David Novak. Novakwill make the transition to the role of executive chairman on Jan. 1, 2015, withcurrent Taco Bell CEO Greg Creed taking the reins as Yum's CEO. In conjunction withthe CEO succession, Novak plans to form the office of the chairman, which willinclude vice chairman and Yum China CEO Sam Su and Creed, to develop the longer-term strategic vision for the company.We view Creed as a wise choice to succeedNovak. Under Creed's leadership, Taco Bell has been one of the bright spots in theotherwise lackluster U.S. quick-service restaurant category the past few years,highlighted by strong product innovation (namely Doritos Locos Tacos and theCantina Bell platform). Creed has helped to position Taco Bell as a potentially globalbrand, with management targeting $14 billion in system sales by 2022, driven by newunit development, daypart expansion, and other store productivity measures. Webelieve many of the initiatives Creed deployed at Taco Bell can serve as a blueprintfor productivity improvements across the system.On the whole, we take a positiveview of Yum's corporate governance, backed by a seasoned management team witha record of balancing growth and profitability. Senior executives and board memberscollectively own approximately 2% of the fully diluted outstanding shares, which issufficient to align their interests with those of other shareholders, in our view. Thefirm has adopted several shareholder-friendly stewardship practices during the pastseveral years, including the elimination of director classes and poison pills and theadoption of majority voting standards. Our Standard stewardship rating is basedlargely on underperformance in the United States and other developed markets,although we'd consider moving our rating to Exemplary if fundamentals in thesecountries continue to improve because of recent segment reorganization plans and
?
Page 54 of 68

Generated on November 04, 2014
Analyst Digest | 2014 Thesis Portfolio | October 05, 2014 - November 04, 2014
management changes.
ProfileWith 40,600 units across more than 125 countries as of September, Yum operatesone of the largest global QSR systems based on number of units. It generatesrevenue through company-owned restaurants, franchise fees, and licensingarrangements. Concepts include KFC (19,000 locations), Pizza Hut (15,200), and TacoBell (6,100). Yum generated $43 billion in system sales in 2013 (19% China, 38%KFC, 23% Pizza Hut, 19% Taco Bell) and $2.2 billion in operating profit beforecorporate expenses (35% China, 29% KFC, 15% Pizza Hut, 21% Taco Bell).
?
Page 55 of 68

Generated on November 04, 2014
Analyst Digest | 2014 Thesis Portfolio | October 05, 2014 - November 04, 2014
Yahoo! Inc YHOO | QQQ
$46.59 h$5.56 | 13.55%Fair Value Estimate $42
Consider Buying Price $25.2
Consider Selling Price $65.1
Fair Value Uncertainty High
Economic Moat Narrow
Stewardship Grade Standard
09-18-2014 | by Rick Summer
Analyst Note 10-22-2014Yahoo's third-quarter earnings report benefited from improvements in several facetsof the firm's core business, yet we are hesitant to suggest there is early evidence ofa turnaround in the pursuit of next-generation digital advertising. The largerdeterminants of shareholder return, at least over the short term, will be the taxstrategies the company is able to achieve to minimize cash tax payments for gainsrelated to future liquidations of its investment in Alibaba Group. Based on the valueof the company's media assets, we are maintaining our narrow moat rating. We alsodon't anticipate revising our $42 fair value estimate at this time. Clearly, Yahoo'srelevance to the digital advertising market is not improving, as revenue lags that ofcompanies such as Google and Facebook. Management is encouraging investors tofocus on emerging advertising categories (video, native, social, and mobile), whichare growing in the double digits, rather than the declining desktop display revenuethese business segments are cannibalizing. In total, Yahoo's turnaround is lessobvious. Overall revenue (excluding traffic acquisition costs) rose 1.2%, as continuedweakness in display (down 6% ex-TAC) was offset by relative outperformance insearch (up 5.6% ex-TAC). Management revealed mobile revenue of more than $200million for the quarter, or nearly 20% of total revenue, a bright spot in the quarter. Asa media property, Yahoo may be able to successfully gain audience on smartphonesand tablets. Still, we remain concerned about Yahoo's lack of mobile assets, and itsdeveloper platform has less functionality than Apple's iOS store or the Google Playplatform, in our view.
The Thesis 09-18-2014We believe that today's stock price is predicated on a robust valuation andsuccessful exit of Yahoo's investment in Alibaba Group. Investors should be awarethat a significant amount of Yahoo's enterprise value is tied up in its 35% interest ofYahoo Japan and resulting 16.3% interest in Alibaba Group holdings as well as cashfrom the IPO. Alibaba Group has ownership interests in privately held Taobao andAlipay, as well as publicly traded Alibaba.com. Because lack of control over theseholdings as well as reinvestment risk, we do not believe its value can support asound investment thesis. Yahoo may be able to turn around its core business, but thedivide between possible and probable is wide. Marissa Mayer has been at the helmfor more than a year, but declaring a successful turnaround is premature, in our view.We believe the company can improve its near-term fortunes, but Yahoo's longer-termpositioning and durability of its advantages are unclear. Yahoo’s large base of morethan 800 million users is an important asset, but management must appropriatelynavigate several hurdles in order to effectively turn around its core business. First,although Yahoo's focus on display has been its strength, users and advertisers arespending more time and money on other websites like Facebook, a social networkinggiant. Second, while Yahoo’s media properties including its homepage, YahooSports, and Yahoo Finance are well suited to a desktop world, the company has donevery little to connect mobile applications to its more traditional web experience.Yahoo has continued to lose market share in online advertising to other destination
sites such as Facebook and Twitter. Currently, Facebook is the most heavily traffickedwebsite in the world. Furthermore, Facebook has been able to gather superiorinformation about its users, which helps advertisers target their campaigns. Althoughthis industry is still relatively nascent, we believe these efforts will shift offlinedollars to social networking companies more rapidly than to more traditional firmsdependent on display like Yahoo and AOL.
ValuationWe are raising our fair value estimate to $42 per share from $39 in consideration ofAlibaba Group's IPO. Our fair value estimate considers approximately $11 per sharefor Yahoo's core business, with the balance represented by cash and its ownershipinterest in Yahoo Japan and Alibaba Group. It is important to note that we stillbelieve we are at a distinct information disadvantage in valuing the interest inAlibaba Group, and we would be hard-pressed to encourage aggressive investmentexposure to what is essentially a venture capital investment. Furthermore, corporategovernance is a serious issue at Alibaba Group, and it's not apparent that Yahooshareholders will ever receive a value that is close to Alibaba Group's current fairvalue. We expect revenue to grow in the single digits in 2014 and beyond. We alsobelieve search revenue will grow at a rather pedestrian rate as well because weremain concerned about Yahoo's ability to drive search query volume. We expectoverall revenue growth to average 5% over the next five years. We are encouragedthat the new management team will instill greater discipline in managing operatingexpenses, although we expect a reasonably heavy investment period over the nextcouple of years in mobile applications.
RiskIf the search partnership with Microsoft continues to underperform, advertisers mayabandon placing ads in Yahoo's search property, leading to declines in revenues.Furthermore, if the relationship with Microsoft sours, it's not clear that Yahoo hasany better options to support its search technology. Social networking sites likeFacebook also represent a risk to Yahoo. If these sites are able to continue growingusers and building tools for advertisers to selectively target large and specificdemographic groups, Yahoo may quickly become an inferior place for advertisements.Additionally, Yahoo's mobile strategy is less than clear, and the company risksinvesting in several low-return projects. Lastly, financial interests in Yahoo Japanand Alibaba Group ultimately may be worth much less on an after-tax basis than thefirm currently believes. As a private company, Alibaba Group is challenging to value.We have no information advantage relative to management of Yahoo or AlibabaGroup in in pricing this holding. Although we recognize the ultimate value of AlibabaGroup could prove quite lucrative, there is a wide range of values that this interestmay hold for Yahoo shareholders. With respect to Yahoo Japan, it will be challengingto unload this large of an interest without taking a discount or encountering apotential tax liability.
Management & StewardshipAfter several years of management turmoil and a decade of questionable boardoversight, we think the company made several moves in 2012 that are more alignedwith shareholders’ interests. First of all, the majority of Yahoo’s board of directorswas replaced, including longstanding chairman Roy Bostock. Additionally, thecompany pursued a high-profile CEO, naming Marissa Mayer to the post. While wearen’t convinced that her background will provide a long-term halo effect to thecompany’s shares, we do believe she is quite capable as a manager, a motivator, anda recruiter for new talent. Mayer, a former Google executive, has served as CEOsince July 2012. In her short tenure, she has appointed several hand-pickedexecutives in an effort to improve company morale, enhance product development,and turn around its core business. It is too early to evaluate Mayer’s performance,but several datapoints are positive, in our view. First of all, Mayer has stated thatshe believes the company will pursue small technology and product-basedacquisitions rather than large transformative deals. We agree with this strategy andembrace her long-term view. However, even if Mayer’s strategy is successful, we donot anticipate more positive financial results until 2014. The board also appointed
?
Page 56 of 68

Generated on November 04, 2014
Analyst Digest | 2014 Thesis Portfolio | October 05, 2014 - November 04, 2014
Ken Goldman as CFO in 2012. Goldman was CFO of Fortinet prior to joining Yahoo.With respect to Yahoo’s ownership in Alibaba Group, the company’s liquidity planhas successfully begun. Alibaba Group bought back half of Yahoo’s interest, freeingup sufficient capital for Yahoo to return $1.5 billion to shareholders through a stockrepurchase program. The company plans to repurchase an additional $1.5 billion in2013 as well. Furthermore, we are encouraged that there are additional measures inplace to monetize the remaining ownership interest in Alibaba Group over the nextseveral years. There continues to be turmoil in the engineering, sales, and executivetalent, and these changes product delays and sales challenges. Unlike the pastturnover, we believe these changes are part of building cohesive team wherebyeveryone is pursuing the same strategy. As with many technology companies,employees have a significant amount of compensation in the form of stock optionsand restricted stock. A portion of these performance-based awards vest dependingon certain financial goals and stock performance goals. We do not find these variablecompensation practices overly concerning.
ProfileYahoo is one of the most heavily visited collection of websites on the Internet. Someof its more trafficked websites include Yahoo Search, Yahoo Mail, and Yahoo News.The company has undertaken significant effort to offload nonstrategic businessesand outsource the underlying search algorithm and operations to Microsoft. In 2013,display advertising represented 39% of total revenue, and search advertisingrepresented 38%. Yahoo also owns 35% of Yahoo Japan and 16.3% of AlibabaGroup.
?
Page 57 of 68

Generated on November 04, 2014
Analyst Digest | 2014 Thesis Portfolio | October 05, 2014 - November 04, 2014
Health Care Select Sector SPDR® ETFXLV | QQQ
$67.03 h$2.62 | 4.07%ETF Valuation Rating (as of 11-03-2014) Fairly Valued
ETF Market Price (as of 11-03-2014) $67.35000
Fair Value Estimate $62.64
Consider Buying Price $53.01
Consider Selling Price $71.09
ETF Expected Return 6.13%
ETF Hurdle Rate 11.95%
ETF Expected Excess Return -5.82%
Morningstar Coverage 99.63% of assets
55 of 56 Holdings
Stock Quality (as % of assets) 65.91% Wide Moat
31.02% Narrow Moat
2.59% No Moat
Fair Value Uncertainty Medium
07-24-2014 | by Robert Goldsborough
The Thesis 07-24-2014Suitability Investors seeking high-quality North American health-care companies canconsider Health Care Select Sector SPDR XLV. Given the sector's lack of economicsensitivity, investors seeking a defensive tilt for a broad portfolio may viewthis exchange-traded fund as a suitable satellite holding. XLV's holdings comprise allof the S&P 500's health-care exposure, so owning this ETF and SPDR S&P 500 SPYmeans investors effectively are doubling up on their health-care exposure. In July2014, health care represented about 13.2% of the S&P 500 Index.While XLV offers exposure to many industries in the health-care sector, Big Pharmafirms comprise 45% of the fund's assets. XLV's heavy Big Pharma exposure shouldn'tby itself deter investors, however, as the subsector weightings are representative ofthe entire health-care industry. Fundamental View Historically defensive and noncyclical, the health-care sector is gaining addedgrowth from an aging America. Demand is relatively stable because people requiretreatment regardless of the economy, and the need among approximately 78 millionbaby boomers in the United States for greater treatment makes for a compellingsecular growth story. An aging population bodes well for the industry's futureprospects because the majority of people's lifetime medical costs are spent in theirfinal few years.The biggest development in the health-care sector of late has been the opening ofstate-based health-care exchanges, which allow individuals and small businesses topurchase standardized health-insurance policies, receive government subsidies tooffset premiums and cost sharing, and determine Medicaid eligibility. While U.S.health-care reform introduced new costs for several industries, Morningstar's equityanalysts believe that several health-care subsectors are poised to benefit from theexchanges: health-care providers (although the magnitude of benefit is uncertain),managed-care organizations that already have economic moats, pharmacy benefitmanagers (who may well be the biggest beneficiaries), and pharmaceuticalcompanies (especially generics). Medical-device manufacturers are not expected tosee any measurable boost from the exchanges.
Elsewhere in the health-care sector, Morningstar's equity analysts see twoheadwinds and one potential tailwind. The headwinds are problems in Europe and anuncertain impact from sequestration in the U.S. Even Medicare--once viewed as asacred cow that would never be subject to cuts--is now at risk of undergoingstructural changes. One tailwind is the rebounding pharmaceutical industry. BigPharma growth rates are bouncing back after patent losses peaked in 2012, andcompetition is starting to dissipate. Pharmaceutical firms released a huge number ofblockbuster drugs in 2013 and have released a significant number more in 2014, andalso will benefit from cost-cutting, external growth, and overseas growth.The aging of China offers a medium- and long-term opportunity for U.S. health-carefirms. As the country ages and becomes wealthier, Morningstar's equity analystsanticipate the country to start moving the needle for large U.S. players in a variety ofsubsectors, including pharmaceuticals and medical technology. Right now, Chinaspends about 5% of GDP on health care, which is far below the global average of10% but commensurate with what one might expect for its income level. As incomesrise and China's population ages, we expect China's health-care market to grow to$1.7 trillion in 2022. That means the growth potential for Chinese health-carespending is far greater than that for GDP. Assuming a normal path as China growsricher and older, health care's share of Chinese GDP should grow by 40% by 2022.(China's market for health products and services currently is roughly the same size asthat of Germany and France combined.) For this growth to take place, China needs tocontinue to spend on its health-care infrastructure, with the central and localgovernments expanding spending on hospitals. One other current issue in Chinarelates to corruption, as there have been recent bribery scandals in thepharmaceutical and the medical-device industries. Chinese authorities have beguntaking steps to tighten up practices in the pharmaceutical space, and we expect themto do the same with the device firms as well.The health-care sector outperformed other sectors nicely in 2013 and for the first sixmonths of 2014. Our view is that the investment community understands the varioussector headwinds but nonetheless has settled on a positive long-term outlook. Thatsaid, our analysts also consider the sector to be largely fairly valued at this time witha few exceptions, most notably in pharmacy benefit managers.
Fees & AlternativesThe fund's 0.16% expense ratio makes it one of the cheaper health-care sector ETFsavailable.
Alternatives Vanguard Health Care ETF VHT provides similar exposure to the sector (but ithas many more holdings: 312 in total) and charges a 0.14% expense ratio. Fully100% of XLV's holdings are held in VHT, and the funds' performance correlationduring the past five years has been an extremely high 99%. Another alternative isiShares U.S. Health Care IYH (0.43% expense ratio), which holds 109 stocks andsports a 99% performance correlation with XLV during the past five years.A recently launched and inexpensive option is Fidelity MSCI Health Care Index ETFFHLC, which charges 0.12%. However, FHLC has minimal assets and is thinly traded.FHLC tracks a slightly different index from Vanguard Health Care ETF; FHLC tracks theMSCI USA IMI Health Care Index, while VHT tracks the MSCI US Investable MarketInformation Health Care 25/50 Index. Fidelity customers with a minimum balance of$2,500 can buy FHLC commission-free, although they are subject to a short-termtrading fee by Fidelity.Investors seeking some international flavor for their health-care exposure canconsider iShares Global Healthcare IXJ (0.47%), as it invests 37% of assets inforeign-domiciled firms. Those seeking exposure only to those firms domiciledoutside North America might take a look at SPDR S&P International Health CareSector ETF IRY (0.50%).
Portfolio ConstructionThis ETF owns the 53 health-care companies in the S&P 500, weighted according tomarket cap. These include firms focused on drugs (both Big Pharma and biotech),health-care equipment and supplies, hospitals, medical devices, and health insurers.
?
Page 58 of 68

Generated on November 04, 2014
Analyst Digest | 2014 Thesis Portfolio | October 05, 2014 - November 04, 2014
Because the index draws its constituents from the broader S&P 500, it has aninherent quality screen. In fact, seven of the top-10 holdings sport wide moat ratings.About 66% of assets are invested in wide-moat stocks, and 96% of assets areinvested in companies with narrow or wide moats. S&P 500 holdings have to meetthe standards of the S&P's selection committee, and this includes profitability andstatus as a leading U.S. company. Because the criteria eliminate foreign health-carecompanies, the index excludes international health-care behemoths such as NovartisNVS, GlaxoSmithKline GSK, Roche, and Sanofi SNY. That said, we'd note that mostof the firms included here are large multinational firms with businesses spanning theglobe.
?
Page 59 of 68

Generated on November 04, 2014
Analyst Digest | 2014 Thesis Portfolio | October 05, 2014 - November 04, 2014
Materials Select Sector SPDR® ETFXLB | QQQQ
$47.50 -x$0.94 | –1.94%ETF Valuation Rating (as of 11-03-2014) Fairly Valued
ETF Market Price (as of 11-03-2014) $48.06000
Fair Value Estimate $23.07
Consider Buying Price $18.38
Consider Selling Price $28.02
ETF Expected Return 11.19%
ETF Hurdle Rate 16.69%
ETF Expected Excess Return -5.50%
Morningstar Coverage 88.70% of assets
28 of 31 Holdings
Stock Quality (as % of assets) 19.03% Wide Moat
42.37% Narrow Moat
27.15% No Moat
Fair Value Uncertainty High
09-29-2014 | by Alex Bryan
The Thesis 09-29-2014Suitability Materials Select Sector SPDR XLB is currently the most-liquid materialsexchange-traded fund on the market. It owns every materials company included inthe S&P 500 Index. This includes companies operating in the chemicals, metals andmining, paper and forest products, containers and packaging, and constructionmaterials industries. Most of these companies sell into commodity markets and aresusceptible to cyclical demand. They also have to contend with volatile raw-materialand energy prices and high fixed costs. The fund's concentrated portfolio adds tothese operational risks. As a result, during the past five years, XLB was about 50%more volatile than the S&P 500. Because of its industry concentration, this fundwould be most suitable as a tactical holding in a diversified portfolio.The fund invests in an eclectic mix of companies, including Monsanto MON,Freeport-McMoRan Copper & Gold FCX, industrial gas companies Praxair PX and AirProducts & Chemicals APD, as well as global metals producers Alcoa AA andNucor NUE. But this is primarily a chemicals fund. In fact, chemicals companies soakup nearly 75% of the fund's assets. This is because most of the low-cost metals andmining and other commodity producers are based outside of the United States.Investors looking for broader exposure to this sector should consider a globalmaterials fund such as iShares Global Materials MXI.Chemicals companies' products are found nearly everywhere. They are incorporatedinto plastics, paints, homes, electronics, cars, petroleum, industrial gas, coatings,fabrics, and agricultural products, among others. Consequently, demand for theseproducts is cyclical. Yet, some of the fund's top holdings enjoy competitiveadvantages that partially insulate their profits from this cyclical demand. The mostdurable competitive advantages in the chemicals industry are built around specialtyproducts and access to low-cost inputs. Fund holdings Monsanto, DuPont DD, andPPG Industries PPG have built competitive advantages by moving up the value chaininto more-specialized, higher-margin products. However, wide moats are scarce inthis industry. Fundamental View The shale gas boom has reduced feedstock costs for North American chemical
producers relative to chemical manufacturers in Europe, which are more dependenton higher-cost naphtha (a heavy crude-based feedstock). However, industry marginscould contract as chemical producers continue to add new capacity. Cyclical demandalso poses a challenge. In order to reduce the volatility of their earnings, some of thefund's chemicals holdings are shifting toward less-cyclical, higher-margin specialtyproducts, though most are still dependent on cyclical basic chemicals. DuPont andDow Chemical DOW are taking steps to divest a portion of their commoditychemicals businesses. These two companies have also developed significantagricultural chemicals and genetically modified seed businesses to reduce theirdependence on commodity chemicals.The fund also has significant exposure to the agricultural industry through pure-playagriculture chemical and seed maker Monsanto and fertilizer makers MosaicMOS and CF Industries CF. Crop prices can have a significant impact on demand foryield-enhancing seeds, chemicals, and fertilizer in the short term because farmers'incomes are closely tied to them. But ultimately, these firms' ability to stay ahead oftheir competitors in the race to meet the growing demand for food will drive theirperformance. Growth in global population and meat consumption in emergingmarkets will require agricultural output to increase substantially over the next fewdecades, according to projections from the Food and Agricultural Organization.Because the amount of arable land is relatively fixed, these long-term trends likelywill increase demand for yield-enhancing products.Chinese infrastructure development has a significant impact on the demand forindustrial metals. However, Chinese demand for industrial metals may soften overthe long run, as the country starts to shift away from its investment-driven growthmodel.The Chinese real estate market is starting to show signs of weakness, with an 11%year-over-year decline in housing starts for the period January through August and a9% decline in commercial building sales. According to Morningstar equity analysts,prices have fallen in most of China’s major cities and may remain soft in the face of asupply glut and weakening demand. That could be bad for iron and copper prices andthe companies that mine them because the Chinese real estate market accounts for alarge portion of global demand for those metals.Gold miners, such as Freeport-McMoRan and Newmont Mining Corporation NEM,also face a challenging operating environment. Gold prices have receded from recordhighs, as costs remain elevated. While the outlook for the industry is not promising,metals and mining stocks only represent about 13% of the portfolio.Based on Morningstar equity analysts’ fair value assessments of the funds’underlying holdings, it is trading at a price/fair value multiple of 1.04, as of thiswriting. Because its holdings face significant risks, it might be worthwhile to waituntil the fund trades at a discount to its fair value before buying. As of the end ofAugust, the fund was trading at a slightly higher price/forward earnings ratio (19.1)than the S&P 500 (17.5).
Fees & AlternativesThe fund's 0.16% expense ratio is low relative to comparable materials-sector ETFs.It is also by far the most liquid materials-sector ETF available. State Street engagesin securities lending, the practice of lending out the fund's underlying shares inexchange for a fee. It passes 85% of the gross proceeds to investors, which partiallyoffsets the fund's expenses. Alternatives Vanguard Materials ETF VAW (0.14% expense ratio) and iShares US BasicMaterials IYM (0.46% expense ratio) are the closest alternatives. Both VAW and IYMclimb further down the market-cap ladder to offer broader portfolios. Because small-cap companies in this sector tend to lack many of the competitive advantages theirlarge-cap counterparts enjoy, they tend to be more volatile. As a result, VAW andIYM gave investors a slightly bumpier ride than XLB over the past three years.However, the Vanguard fund is a worthy option for investors looking forcomprehensive exposure to the sector. Because of its high expense ratio, we wouldstay away from IYM.Investors looking for more balanced exposure to the materials sector might consideriShares Global Materials MXI (0.48% expense ratio). In contrast to XLB, MXI investsin both U.S. and non-U.S. materials stocks. MXI's global reach allows it to hold many
?
Page 60 of 68

Generated on November 04, 2014
Analyst Digest | 2014 Thesis Portfolio | October 05, 2014 - November 04, 2014
of the industry leaders in the metals and mining industry that are not available toXLB. Consequently, relative to XLB, MXI offers greater exposure to the metals andmining industry and less exposure to the chemicals industry. Investors looking for broad commodity-linked equity exposure might also consider anatural-resources fund, such as SPDR S&P Global Natural ResourcesETF GNR (0.40% expense ratio). GNR tracks the 90 largest stocks from around theworld in the energy, agriculture, and metals and mining industries.
Portfolio ConstructionThe fund employs full replication to track the S&P Materials Sector Select Index,which includes all 30 materials companies in the S&P 500 Index. It weights theseholdings in proportion to their float-adjusted market capitalization. S&P limitsindividual positions to 23% of the portfolio, though the fund's largest holding fallswell below that mark. Chemicals companies represent approximately 75% of theportfolio, followed by metals and mining (13%), containers and packaging (6%),paper and forest products (3%), and construction materials companies (3%). Becauseof its limited number of holdings, the portfolio is highly concentrated. The top 10holdings soak up more than 65% of the fund's assets. However, the materials sectorrepresents a small sliver of the U.S. stock market. In fact, the fund's holdings accountfor less than 4% of the total assets in the S&P 500 Index.
?
Page 61 of 68

Generated on November 04, 2014
Analyst Digest | 2014 Thesis Portfolio | October 05, 2014 - November 04, 2014
Southern Co SO | QQQ
$46.61 h$2.47 | 5.60%Fair Value Estimate $45
Consider Buying Price $36
Consider Selling Price $56.25
Fair Value Uncertainty Low
Economic Moat Narrow
Stewardship Grade Exemplary
05-07-2014 | by Mark Barnett
Analyst Note 10-29-2014Southern Company reported third-quarter EPS on Oct. 29 that was once again hit bycharges at the Kemper IGCC in Mississippi, as delays and projected start-up costs ledto a $0.29 per share charge, bringing the year-to-date EPS impact to $0.55. Excludingcharges, results were flat at $1.09 per share versus $1.08 per share in the thirdquarter of last year. Guidance stands at $2.72-$2.80 per share for the full year,excluding the Kemper charges. Our current EPS forecast excluding Kemper remains$2.76. We are maintaining our stable narrow moat rating and $45 per share fairvalue estimate.While Kemper remains frustrating, our attention is focused oneconomic activity in the company's footprint and on the progress and regulatorytreatment of the new Vogtle nuclear plant in eastern Georgia. Managementprojected a continuing 3% growth trend in GDP in its footprint. While GDP isn't aperfect measure, we do expect demand in Southern's service territories to growabove the national average for the foreseeable future. However, residential andcommercial weather-adjusted demand in third-quarter 2014 was not promising, withresidential down 0.3% and commercial down over 1%. Both gauges remain flat tomodestly down for the full year. The bright spot was industrial demand, whichimproved 5% year over year and stands at a 3.6% positive delta year to date.On theVogtle front, management played down the potential for delays at the site, givenconcerns after SCANA announced significant delays and cost overrun expectations.The terms of the project agreement are different as Southern's project is fixed-priceturnkey. However, we believe delays are likely. We believe Southern will be able torecover most cost overruns, but we continue to project a 75% chance of $500 millionin overruns for investors.
The Thesis 05-07-2014Southern's total return proposition remains appealing for patient investors in a worldof few decent income alternatives. This giant Southeast utility enjoys some of thebest regulation in the United States and strong, consistent regulatory relationships inits key service territories of Alabama and Georgia. The company is in the middle of ahuge investment program aimed at phasing out or retrofitting its massive coal fleet,building a low-carbon coal unit in Mississippi, and constructing the first new nuclearplant in the U.S. (in Georgia) after a more than 30-year freeze. While regulatory riskis higher--as evidenced by ongoing cost disputes in Mississippi and cost overruns atthe Vogtle nuclear project--earnings and cash flow growth will swell as expendituresclose to rates, driving 3.5% earnings and dividend growth through 2018. Althougheconomic growth in the firm's four service territories might not remain aboveaverage, capital investment remains the primary engine of our growth forecast andmuch of it closes to cash returns annually, keeping cash lag to a minimum.Southernhas more upside to economic improvement than most peers and has traditionallytraded at a premium to peers. While that premium has shrunk with uncertaintyaround Kemper and Vogtle, investors shouldn't underestimate Southern'sconstructive regulatory structure, despite above-average recovery risk during thisinvestment cycle. Favorable and supportive regulation is a key driver behind the
company's huge construction program and above-average returns.
ValuationWe are maintaining our fair value estimate of $45 per share after incorporating first-quarter 2014 results, the increase in Kemper charges, management's new capitalexpenditure guidance through 2016, and updates to our power demand forecast. Wecontinue to include a 75% chance that Southern settles with Chicago Bridge & Ironon the Vogtle cost dispute, assuming shareholders could bear roughly $300 million ina settlement. We also include an incremental $200 million in cost overruns at bothVogtle and Kemper. However, it's possible that Southern could pass any settlementcosts to customers or win a fully litigated case in court, neutralizing the impact oninvestors.Our forecast for total capital investment through 2018 is roughly $23 billionand incorporates expenditures to meet coal plant emissions limits in the federal airtoxics rule and revised costs for the Kemper plant and Vogtle project. We nowforecast this spending can deliver 4% average annual EBIT growth through 2018. Weexpect Southern's regulated utilities to continue earning near its industry-leadingallowed returns, though we project modest declines in allowed returns on equitythrough the current rate cycle. We forecast 7.9% average ROIC during the next fiveyears.We forecast average power demand growth of just below 1.5% for Southern'sutilities from a strong start to 2014 through 2018. During the next five years, weassume consolidated operating margins average 26%. We anticipate Southern willincrease its dividend 3.5% annually during the next few years, largely in line withmanagement's projections. We use an 8% cost of equity and 5.6% weighted averagecost of capital in our discounted cash flow valuation.
RiskAlthough we are bullish on this company's prospects overall, some uncertaintiesremain, including the impact of nuclear cost overruns, possible emissions legislation,and other fossil fuel regulations. However, compliance measures could prove to beless painful to shareholders than some might expect; regulators will allow Southernto pass most of the incremental costs on to customers, preserving the firm's long-term earnings power. The biggest threat that Southern faces is a deterioration of itsregulatory relationships in its four retail service territories. Much of the company'ssuccess hinges on the relationships it has built through years of low power pricesand excellent customer service. While the Kemper facility has been a financialsetback, we don't believe it has any long-term impact on Southern's regulatoryrelationships in Mississippi and certainly not elsewhere. The risk of decliningcustomer usage has increased, although Southern's best-in-class regulation shouldhelp mitigate the effects. Nuclear construction expenses are approved twice a year,but there is still a risk that additional expenses might not be recovered. Cost overrunscould also lead to further stranded capital at the new coal gasification plant or at thenew nuclear plants, though a revised process in Georgia eases the burden ofapproval for new costs. If tough federal environmental regulations further raiseinvestment needs and costs for customers, regulators might be less willing tosupport above-average allowed returns on equity.
Management & StewardshipSouthern's management team historically has comprised highly capable andconservative individuals. Many high-level executives running other utilities tracetheir roots to Southern. Management has fostered excellent regulatory relations inits service territory, but that didn't stop Southern from joining in the foolishness ofexpanding beyond regulated operations like so many of its peers in the late 1990s.The company's eventual spin-off of troubled subsidiary Mirant in 2001 was a nicefeat of timing before the Enron collapse. Since then, management has operatedSouthern's nonregulated business very conservatively, earning returns on capital inline with its regulatory allowed returns. CEO Thomas Fanning served as CFO and COOof Southern as part of his 30-year tenure with the company before his promotion inlate 2010. He has executive experience as well, having served as president and CEOof Gulf Power. Importantly, management has maintained a focus on preservinggoodwill and constructive exchange between its utilities and its state regulators,which we believe is a crucial driver of utility returns over the long run.
?
Page 62 of 68

Generated on November 04, 2014
Analyst Digest | 2014 Thesis Portfolio | October 05, 2014 - November 04, 2014
ProfileSouthern generates and distributes electricity to more than 4.4 million customers inthe Southeast. It owns four electric utilities in Alabama, Georgia, Florida, andMississippi and has more than 45,500 megawatts of generating capacity, nearly halfof which comes from coal-fired plants. Southern also operates a conservative butgrowing merchant generation segment, Southern Power.
?
Page 63 of 68

Generated on November 04, 2014
Analyst Digest | 2014 Thesis Portfolio | October 05, 2014 - November 04, 2014
Consumer Staples Select SectorSPDR® ETF XLP | QQQ
$47.01 h$1.57 | 3.44%ETF Valuation Rating (as of 11-03-2014) Fairly Valued
ETF Market Price (as of 11-03-2014) $46.89000
Fair Value Estimate $44.73
Consider Buying Price $40.97
Consider Selling Price $47.65
ETF Expected Return 7.47%
ETF Hurdle Rate 9.41%
ETF Expected Excess Return -1.94%
Morningstar Coverage 97.62% of assets
38 of 41 Holdings
Stock Quality (as % of assets) 70.39% Wide Moat
18.85% Narrow Moat
8.08% No Moat
Fair Value Uncertainty Medium
08-14-2014 | by Robert Goldsborough
The Thesis 08-14-2014Suitability Consumer Staples Select Sector SPDR is suitable as a complementary satelliteholding to a diversified portfolio. This exchange-traded fund, which offers exposureto mega-cap household names whose products consumers generally continue to buyregardless of the economic climate, could also be viewed as a defensive portfolio tilt.Food and staples retailers make up 25% of this ETF's assets, followed by householdproducts firms (20%), beverage producers (19.5%), food producers (18%), andtobacco companies (15%). This fund has been 75% correlated with the S&P 500during the past five years.During the past 10 years, this ETF has been meaningfully less volatile than thebroader market. It also has displayed less volatility than competing consumer staplesETFs. The fund is less volatile because unlike iShares US Consumer Goods IYK, XLPholds Wal-Mart WMT and several other large, defensive drug and discountretailers. These relatively steadier names have helped mitigate XLP's volatility. Inaddition, unlike one other competing staples ETF, XLP does not hold any auto-relatedfirms, which generally are far more volatile. Fundamental View In general, consumers buy consumer staples products and services regardless ofthe economic climate. As a result, the holdings in this ETF generally have stablerevenue growth and cash flows.During the past year, the market performance of the U.S. consumer staples sectorhas lagged many other U.S. equity sectors. The two biggest contributors, we believe,are the recent slowdown in consumer spending in emerging markets (which are aperceived growth catalyst for many consumer staples companies) and some generalconcerns about the U.S. consumer. Most recently, some staples firms with strongoverseas sales have been facing foreign-currency headwinds that have had negativeimpacts on reported quarterly operating profits. That said, Morningstar's equityanalysts are relatively optimistic about consumer staples firms' prospects inemerging-markets economies over the long run.Food and staples retailers comprise 25% of this ETF. XLP's largest retail holding isWal-Mart WMT, which has been reinforcing its everyday-low-price strategy through
major price cuts and is making better capital-allocation decisions, such as shifting itscapital toward higher-return domestic small stores, instead of lower-return foreignones. However, Wal-Mart has a Negative Moat Trend from Morningstar's equityanalysts, as it is facing greater competit ion from Costco COST andAmazon.com AMZN, both of which have lower fixed-asset bases and are willing torun their businesses at lower margins. (Amazon, which is not held in this ETF, alsohas begun competing in the online grocery space in California, and our equityanalysts believe that the rollout of this service across major urban centers in 2014could be a key turning point in the evolution of online grocery sales.) Wal-Mart'ssmall-store expansion may well cut into pure-play grocers held in this ETF, such asSafeway SWY and Kroger KR. Finally, drug retailers held in this ETF, such as CVSCaremark CVS and Walgreen WAG, over the longer term stand to benefit fromhealth-care spending growth and an aging population, although their success in thenondrug portions of their stores is less certain.Tobacco companies, which make up around 15% of this fund's assets, have longbeen under pressure from increased government regulations, including requiringgreater marketing restrictions, and higher taxation. Companies' more mature marketsare experiencing lower cigarette demand, but their Asian operations are expected tobe an engine for future growth. Philip Morris International PM in particular has awell-balanced portfolio between developed and emerging countries; it is thedominant player in the European Union and has a leading position in much of EasternEurope, the Middle East, Africa, and Asia. Unit volumes for Philip Morris areexpected to rise in the coming decade in overseas markets such as Asia, Africa, andEastern Europe, where populations are growing and there are looser restrictions ontobacco marketing. In the short term, however, we do expect weakening emerging-markets currencies to provide a stiff headwind to the company's financial results.Other tobacco companies held in this ETF, such as Altria MO and Reynolds AmericanRAI, are more focused on the declining U.S. market. And while CVS will cease sellingcigarettes and tobacco products across its 7,600 U.S. stores by October 2014,convenience stores and gas stations--both of which are fragmented markets--comprise the bulk of U.S. cigarette sales. So even if other pharmacies such asWalgreen and Rite Aid RAD follow suit, tobacco should remain widely available foradults to purchase.Commodity costs and consumer staples firms' ability to extract pricing fromconsumers are something to monitor in this sector. Recently, inflation has been fairlyminimal, which has meant that pricing has been a bit more muted. Even so, someconsumer staples firms, such as McCormick MKC, Hershey HSY, and Clorox CLX,have been able to make price increases stick. In fact, in response to higher inputcosts, Clorox has made 66 price increases since 2005, and Morningstar's equityanalysts have noted that 64 of those are still in place. So some firms held in this ETFare able to extract pricing from consumers, albeit with an occasional lag.Consumer staples ETFs' dividend yields typically are in the 2.7%-3.1% range, whichis slightly higher than that of the S&P 500 Index. Morningstar's equity analystsbelieve that ultralow interest rates have been helping to fuel the valuations of theconsumer staples sector as a whole, with many investors stretching for yield. As aresult, our analysts caution that rising rates could revise investors' required returnsupward, detracting from total returns on consumer staples stocks, despite steadydividend payments and earnings growth.Although some merger and acquisition activity has been taking place in the sector(most recently, Tyson Foods' TSN plans to acquire Hillshire Brands HSH), investorsalso should pay close attention to recent pressures that consumer staples companieshave been facing to split apart, in an effort to drive better focus, share gains, andultimately earnings growth. Potential breakup targets include Unilever UN, NestleNSRGY, Procter & Gamble PG, and PepsiCo PEP.
Fees & AlternativesThe fund's 0.16% expense ratio is the second-lowest expense ratio of any large andliquid ETF in its category. XLP's estimated holding cost is slightly higher at 0.21%.Estimated holding costs are primarily composed of the expense ratio but also includetransaction costs, sampling error, and share-lending revenue. Alternatives Investors seeking nondiscretionary exposure to the consumer have plenty of ETF
?
Page 64 of 68

Generated on November 04, 2014
Analyst Digest | 2014 Thesis Portfolio | October 05, 2014 - November 04, 2014
choices. The most similar alternative to XLP is the smaller and less-liquid VanguardConsumer Staples ETF VDC (0.14% expense ratio). XLP holds just 40 stocks versusVDC's 106, but the two ETFs show almost perfectly positively correlated performanceduring the past five years (99%). In terms of assets under management and averagedaily trading volumes, XLP dwarfs VDC. Thus, large institutional investors demandingdeep liquidity in order to move in and out of positions without having a marketimpact might favor the greater liquidity of XLP or might consider working with an ETFliquidity specialist. However, in our view, VDC still offers sufficient liquidity forindividual investors.XLP and VDC have very similar subsector weightings and in fact have the same top-10 holdings. However, XLP tilts slightly more toward large-cap companies (88% ofassets versus 82% of VDC's assets). Probably the biggest difference between thetwo ETFs is one of concentration--XLP's index assigns heavier weightings to itslargest holdings than VDC's index does.Another option is iShares US Consumer Goods IYK (0.43% expense ratio), whichoffers very similar exposure but excludes the major retailers held by VDC and XLP.Unlike XLP and VDC, IYK also holds auto manufacturers such as Ford F and someapparel companies not found in other consumer staples ETFs, such as Nike NKE.A recently launched and very inexpensive option is Fidelity MSCI Consumer StaplesIndex ETF FSTA, which charges 0.12%. However, FSTA has minimal assets and isthinly traded. It tracks a slightly different index from Vanguard Consumer StaplesETF; FSTA tracks the MSCI USA IMI Consumer Staples Index, while VDC tracks theMSCI US Investable Market Consumer Staples 25/50 Index. Fidelity customers with aminimum balance of $2,500 can buy FSTA commission-free, although they aresubject to a short-term trading fee.Those interested in gaining exposure to international consumer staples titans canconsider iShares Global Consumer Staples KXI (0.47% expense ratio). KXI consistsalmost entirely of food and beverage producers and large European retailers.
Portfolio ConstructionA market-cap-weighted ETF, XLP invests in the consumer staples stocks of the S&P500 and employs a cap-weighted structure. Sticking to S&P 500 companies providesan initial screen for quality, as holdings must meet the standards of S&P's selectioncommittee. In fact, some 70% of XLP's assets are invested in wide-moat firms, and19% are allocated to firms that Morningstar's equity analysts deem as having narroweconomic moats (Morningstar's equity analysts define economic moats as durablecompetitive advantages). Constituents usually have to be leading U.S. companiesthat meet S&P's profitability criteria. The criteria eliminate large internationalcompanies, including Unilever and Diageo DEO. XLP holds 40 companies.
Consumer staples ETFs track indexes that are labeled either "consumer staples" or"consumer goods." Both types of indexes contain food producers, beveragecompanies, tobacco firms, and personal-goods firms. However, consumer staplesindexes--and by extension, the ETFs that track them--contain food and drug retailers,as well as Wal-Mart, while consumer goods indexes do not. Similarly, consumergoods indexes contain automakers, automotive retailers, and auto componentsmanufacturers, while consumer services indexes do not.
?
Page 65 of 68

Generated on November 04, 2014
Analyst Digest | 2014 Thesis Portfolio | October 05, 2014 - November 04, 2014
Molson Coors Brewing Co TAP | QQ
$74.00 -x$0.01 | –0.01%Fair Value Estimate $57
Consider Buying Price $34.2
Consider Selling Price $88.35
Fair Value Uncertainty High
Economic Moat Narrow
Stewardship Grade Standard
09-15-2014 | by R.J. Hottovy
The Thesis 09-15-2014Molson Coors owns an impressive portfolio of brands, along with a vast distributionnetwork that allows it to generate excess returns on invested capital and gives thecompany a narrow economic moat. The firm has built a solid reputation forsuccessfully cutting costs in order to improve margins. However, given that its coremarkets of Canada, the United States, and the United Kingdom have beenexperiencing waning lager demand for several years, it is likely that Molson Coors'margins will soon level off. Faced with a formidable opponent in Anheuser-Busch,Canada-based Molson merged with U.S.-based Coors in 2005 to gain scaleadvantages related to distribution and advertising. Since the merger, the combinedfirm's management team has slashed costs and created the MillerCoors joint venturewith SABMiller in the United States. The joint venture combined under one roofsome powerful brands, including Miller Lite, Keystone Light, Coors Light, and BlueMoon. Beyond the efficiencies that resulted from the Molson merger, MillerCoorsenabled the firm to reap additional cost savings and synergies.The premium beersegment (including such brands as Coors Light and Miller Lite) is of utmostimportance to MillerCoors. Unfortunately for Molson Coors, premium beer volumehas been waning in recent years as unemployment rates for young men remainstubbornly high and consumers imbibe greater amounts of spirits, wine, and craftbrews. Recognizing America's increasing preference for craft beer, MillerCoorscreated Tenth and Blake, an in-house craft beer division. We believe Tenth and Blakebrands, which include Blue Moon and Leinenkugel, have much greater growthpotential than MillerCoors' premium lights as a result of consumers' increasingproclivity to drink craft beer. Canada is another large market for Molson Coors. Thefirm's 40% market share is second only to Anheuser-Busch's 43% share. Andalthough Canadian beer volume has been anemic during the past few years, it isMolson Coors' most profitable segment.
ValuationWe are raising our fair value estimate to $57 from $56 because of the time value ofmoney, which implies fiscal 2014 price/earnings of 13.5 times and a free cash flowyield of roughly 8%. Although the firm faces lackluster volume growth in its threecore markets, we think that market-average multiples are justified, given its narroweconomic moat and solid history of cost-cutting while building brands. With pricingand volume fairly stable, Molson Coors has benefited from its 42% economic interestin MillerCoors' joint venture, which has realized $750 million of annual cost savingsand synergies. We believe the company's top line will organically grow 2%-3% peryear during the next decade and operating margins will eventually improve to nearly26% (versus mid-20s over the past two years). While it may be some time before theU.S. economy materially improves, Molson Coors should be able to reap the benefitsof a declining unemployment rate as more workers typically equate to greaterdemand for premium beer. Although we also think the Molson Coors franchise couldbe an attractive acquisition target for SABMiller, our fair value estimate does notinclude any acquisition premium at this time.
RiskBeer volumes within Molson Coors' core markets are impacted by general economicconditions and unemployment as well as competition from wine and spirits. Shouldunemployment worsen or other alcohol beverage categories capture greater share,Molson Coors' volumes, utilization rates, and profit margins likely would suffer.Additionally, alcohol is highly regulated and taxed and governments may enactpolicies that reduce beer consumption. Finally, Molson Coors may be tempted tofurther participate in the consolidation of the global beer market and could overpayfor an acquisition.
Management & StewardshipWe believe Molson Coors' management team has been a standard steward ofshareholders' capital. While we applaud some of the team's strategic moves thathave delivered an abundance of shareholder value, such as the MillerCoors jointventure, the company's acquisition of Kaiser in Brazil did not go as planned anddestroyed shareholder value.Additionally, minority shareholders have very littleinfluence over the firm. Class A shares have voting rights and are 84% controlled bythe Molson and Coors families, and Class B shares, which are held by minorityshareholders, provide owners with very little influence. Only 3 of the 15 boardmembers are elected by minority shareholders. The New York Stock Exchangeconsiders Molson Coors controlled, meaning the firm is exempt from independentdirector minimums. Predictably, Molson and Coors family members have a heavypresence on the board, and the company's bylaws mandate that the chairman andvice chairman roles alternate between the families every two years. AlthoughMolson Coors has just a 42% economic interest in the MillerCoors joint venture, ithas 50% voting control. The joint venture's bylaws would allow Molson Coors topurchase up to a 50% interest and appoint the CEO in perpetuity should there be achange of control at SABMiller. Additionally, neither company can make a hostileoverture to the other until 2018. However, since July 2013, either party can transferits economic or voting interests in MillerCoors to another party as long as the otherparty maintains the right of first refusal.During the company's 2013 analyst day,management noted that incentive compensation will be more closely linked to profitafter a capital charge. We believe such an incentive scheme appropriately alignsmanagement behavior with the best interests of shareholders and should encouragethe firm to take on projects that increase its ROICs above its cost of capital.
ProfileMolson Coors is one of the largest brewers in the world. Major brands include CoorsLight, Molson Canadian, Staropramen, Carling, Miller Lite, Keystone, Blue Moon, andLeinenkugel. The firm's largest markets include Canada, the United States, Centraland Eastern Europe, and the United Kingdom. Molson Coors retains 40% share of theCanadian beer market, 28% of the U.S. beer market (via its MillerCoors joint venturewith SABMiller), and 21% of the U.K. beer market.
?
Page 66 of 68

Generated on November 04, 2014
Analyst Digest | 2014 Thesis Portfolio | October 05, 2014 - November 04, 2014
Coach Inc COH | QQQQ
$33.26 -x$1.85 | –5.27%Fair Value Estimate $45
Consider Buying Price $27
Consider Selling Price $69.75
Fair Value Uncertainty High
Economic Moat Narrow
Stewardship Grade Exemplary
10-28-2014 | by Paul Swinand
The Thesis 10-28-2014Coach has developed a narrow economic moat through a brand that enables pricing,sourcing and distribution advantages, and capital efficiency. Despite the company'srecent struggles, it is still creating economic profits, and at a level greater than mostretailers.Attention to capital efficiency and consumers' strong brand loyalty havebeen key drivers of Coach's economic returns. We judge brand to be more importantin bags and leather accessories than other softgoods categories as consumers tendto be more brand-loyal. Despite Coach's long-run plans to increase penetration infootwear and ready-to-wear, we believe accessories will remain the core of thebusiness. The men's business also offers some upside; it currently constitutes around14% of sales. Coach's international business is still underdeveloped and representsan opportunity if growth there can continue for the long run. Although fiscal 2013 and2014 struggles highlight Coach's market concentration in North America, using long-run success in Japan as a guide, we think there is plenty of room for Coach to takemarket share in other geographies. In Japan, Coach has had flat to low-single-digitgrowth for the past 10 years while competitors generally have experienced declines.The company entered Europe in 2012 through department store partnerships and isnow penetrating further wholesale accounts and opening retail stores. We believethere is room for a brand such as Coach offering uniquely American styles and high-quality products at lower price points. In China, Coach lags other luxury brands withrespect to sales, but has greater growth potential. The company increased its Chinabusiness to more than $100 million in 2010 and approximately $550 million in fiscal2014. Coach should also see higher operating margins in China as it expandsbecause of lower operating costs and higher gross margins. In Europe, where Coachhas just a small number of boutiques and is developing dedicated shops indepartment stores, the company should leverage selling, general, and administrativeexpenses over time and now projects $100 million in revenue in fiscal 2015.
ValuationOur fair value estimate remains $45 per share, as we have incorporated fiscal first-quarter results and management's reiteration of full-year guidance for low-double-digit revenue declines and high teens operating margins. Our fair value estimateimplies 18 times forward fiscal June 2015 year-ending earnings per share. On anenterprise value/EBITDA basis, our valuation implies 9 times fiscal June 2015estimates, and on a cash flow yield basis, our fair value estimate suggestsapproximately 3.7% cash flow yield for fiscal 2015, at the low end of a five-yearhistorical range of 4%-6%. Fiscal 2015 metrics include $55 million in one-timecharges for store closings and restructuring. Our estimate for earnings per share infiscal 2015 has not changed from $1.69 GAAP, and our adjusted earnings per shareestimate is up by one penny to $1.82.For fiscal 2015 (year ended June), we project arevenue decline of 13.1% (unchanged), with mid-20s negative same-store salesgrowth implied in North America. Gross margins are now forecast to be below 68%,less than company guidance for around 70%. Although cost pressure worries havediminished, increased SG&A around the design changes should cause operating
margins to dip below 18%, in line with the company's expectations of high-teensoperating margin but more negative than our prior assumptions. We model roughly100 basis points of additional gross margin decline, year over year, in fiscal 2015, aswe remain concerned that some inventory clearing may still have to occur in theoutlets and that fresh product from the new designer may face some reluctantconsumer acceptance. In fiscal 2015, we model capital spending of $450 million.Overour 10-year explicit forecast period, we model operating margins first averaging23.7% for the first five years going from under 18% in fiscal 2015 to over 27% inyear five, and remaining between 26% and 27% after that. This is somewhat moreconservative than the company's plans to return to 30% operating margins by fiscal2019. Top-line growth to reach our cash flow-based valuation averages just over 4%,or just over 6% excluding the previously mentioned 13% decline forecast for fiscal2015. Although we have increased our capital spending assumptions for fiscal 2015through 2017, we model spending eventually returning to 4%-5% of sales.
RiskRemaining fashionable and extending the brand are constant risks at Coach, and assuch we assign the firm a high uncertainty rating. If Coach extends the brand beyondwhat consumers understand it to be, the company could damage its core image orcreate confusion in consumers' minds. Coach has embarked on an ambitious plan toexpand its product lines and become a full lifestyle brand, not unlike many older andmore prestigious European luxury brands, but the strategy is not without risk. It isalso now undertaking a pullback on promotions and a repositioning of the store base,in the same year it will launch new product lines from recently hired chief designofficer Stuart Vevers. New designers hold promise, but there is always the risk thatnew lines and looks are not accepted by the public. In addition, there is fashion andexecution risk at the product levels. Footwear does leverage some competitiveadvantages in leather sourcing but, in our opinion, is a different category from bagsand accessories. Men's accessories have lower risk, in our opinion, and we agreethat the men's leather goods market is underserved, but we cannot be sure that theextension will not dilute the women's business. The new fashion designs have metwith very positive reviews in the fashion press, yet no amount of testing and publicitycan assure success with consumers.While Coach has established a niche in thefashion world, and customers are very brand-loyal in the handbag and accessoriescategory, it runs the risk that changes in tastes and preferences will eventually leadconsumers to believe it is a brand for a past era. Coach also has been successful thusfar extending the brand into new geographies, and a portion of our fair valueestimate is based on that continued expansion. Today, sales growth prospectsappear strong, but there is a risk that new entrants or other market forces couldderail the international projects that today look promising for Coach.
Management & StewardshipLew Frankfort was replaced by Victor Luis at the beginning of 2014. Luis, who washead of international operations, has been assembling a new team of designers andmanagement, including a new creative director, Stuart Vevers. His experienceincludes terms as CEO of Baccarat, running North America, and with other LVMHbrands earlier in his career. We believe his international experience will be importantto develop the future growth of the firm. A majority of Coach's board is independent,and officers and directors own nearly 5% of the shares outstanding. Frankfort iscurrently chairman but will retire after the November annual meeting. Jide Zeitlin,currently the lead outside director, will be appointed the next chairman of the board.Thus the chairman and CEO roles will remain split, a structure we view favorably. Webelieve management does a good job of providing transparency around the business.Overall, corporate governance is sound and aligned with shareholders, in our opinion,and we rate Coach's stewardship of shareholder capital as exemplary given its longrecord of above-average returns and recent actions to return cash to shareholders.We note that in 2013, Frankfort bought Coach shares on the open market, despitehaving announced his diminishing role.
ProfileCoach is a manufacturer, distributor, and retailer of handbags and accessories and is
?
Page 67 of 68

Generated on November 04, 2014
Analyst Digest | 2014 Thesis Portfolio | October 05, 2014 - November 04, 2014
expanding to broader product categories. Its products offer the quality of higherluxury brands but at more attractive price points. While 60% of sales come frommore than 500 North American retail stores, Coach also sells its products throughdepartment stores, international shops, the Internet, its catalog, and Coach stores inJapan and China. Coach recently established a foothold in Europe, where it plans toreach $100 million in sales in fiscal 2015.
?
Page 68 of 68