pre -colonial political centralization and contemporary...
TRANSCRIPT
Working Paper No. 141
PRE-COLONIAL POLITICAL
CENTRALIZATION AND
CONTEMPORARY DEVELOPMENT IN
UGANDA
by Sanghamitra Bandyopadhyay and Elliott
Green
i Copyright Afrobarometer
AFROBAROMETER WORKING PAPERS
Working Paper No. 141
PRE-COLONIAL POLITICAL
CENTRALIZATION AND CONTEMPORARY
DEVELOPMENT IN UGANDA
by Sanghamitra Bandyopadhyay and Elliott Green
November 2012
Sanghamitra Bandyopadhyay is Lecturer in Economics, School of Business and Management, Queen Mary,
University of London. Email: [email protected]
Elliott Green is Lecturer in Development Studies, Department of International Development, London School
of Economics. Email: [email protected]
ii Copyright Afrobarometer
AFROBAROMETER WORKING PAPERS
Editor
Michael Bratton
Editorial Board
E. Gyimah-Boadi
Carolyn Logan
Robert Mattes
Leonard Wantchekon
Afrobarometer publications report the results of national sample surveys on the attitudes of
citizens in selected African countries towards democracy, markets, civil society, and other aspects of
development. The Afrobarometer is a collaborative enterprise of the Centre for Democratic Development
(CDD, Ghana), the Institute for Democracy in South Africa (IDASA), and the Institute for Empirical
Research in Political Economy (IREEP) with support from Michigan State University (MSU) and the
University of Cape Town, Center of Social Science Research (UCT/CSSR). Afrobarometer papers are
simultaneously co-published by these partner institutions and the Globalbarometer.
Working Papers and Briefings Papers can be downloaded in Adobe Acrobat format from
www.afrobarometer.org.
Idasa
co-published with:

iii
ABSTRACT
The effects of pre-colonial history on contemporary African development have become an important
field of study within development economics in recent years. In particular (Gennaioli & Rainer, 2007)
suggest that pre-colonial political centralization has had a positive impact on contemporary levels of
development within Africa at the country level. We test the (Gennaioli & Rainer, 2007) hypothesis at
the sub-national level for the first time with evidence from Uganda. Using a variety of datasets we
obtain results which are striking in two ways. First, we confirm the (Gennaioli & Rainer, 2007)
hypothesis that pre-colonial centralization is highly correlated with modern-day development
outcomes such as GDP, asset ownership and poverty levels, and that these correlations hold at the
district, sub-county and individual levels. We also use an instrumental variable approach to confirm
this finding using the distance from ancient capital of Mubende as an instrument. However, our
second finding is that public goods like immunization coverage and primary school enrollment are not
correlated with pre-colonial centralization. These findings are thus consistent with a correlation
between pre-colonial centralization and private rather than public goods, thereby suggesting the
persistence of poverty and wealth from the pre-colonial period to the present.
1
INTRODUCTION1
The long-term effects of history on contemporary economic development have become an important field of
study within development economics in recent years (cf. Nunn (2009) for an overview). While the impact of
colonialism on post-colonial outcomes has long been a focus for scholars, a smaller but growing field of
study has developed, linking pre-colonial formations with post-colonial developments in former colonies
(Englebert, 2000; Green, 2012; Hjort, 2010; Jha, 2008). In one recent example of this trend, Gennaioli and
Rainer (2007) suggest that pre-colonial political centralization has had an impact on contemporary levels of
development within Africa. Measuring pre-colonial centralization by using data from Murdock (1967), they
show a robust positive correlation between the percentage of each country's population that is from a
centralized ethnic group and outcomes such as paved roads, immunization, literacy and infant mortality rates.
The analysis presented by (Gennaioli & Rainer, 2007) is provocative and adds to a growing literature on the
importance of history for contemporary African development. Their analysis, however, cannot be considered
definitive for at least three reasons. First, their unit of observation is the country level, leaving them with
between 24 and 45 observations per regression. Despite their efforts at providing a variety of robustness
checks there are nonetheless numerous ways in which such a small sample can produce unreliable results.
Second, as they acknowledge (Gennaioli & Rainer, 2007, p. 192), if the effect of pre-colonial centralization
on contemporary development is to have an effect, it should primarily exist at the sub-national level rather
than the national level as differences within countries are reflected within localities. Finally, the analysis is
open to the potential criticism of omitted variable bias and reverse causality, especially if pre-colonial
economic development may have contributed both to the development of pre-colonial centralized states and
to contemporary development outcomes.
We therefore test the Gennaioli and Rainer (2007) hypothesis at the sub-national level in a single country for
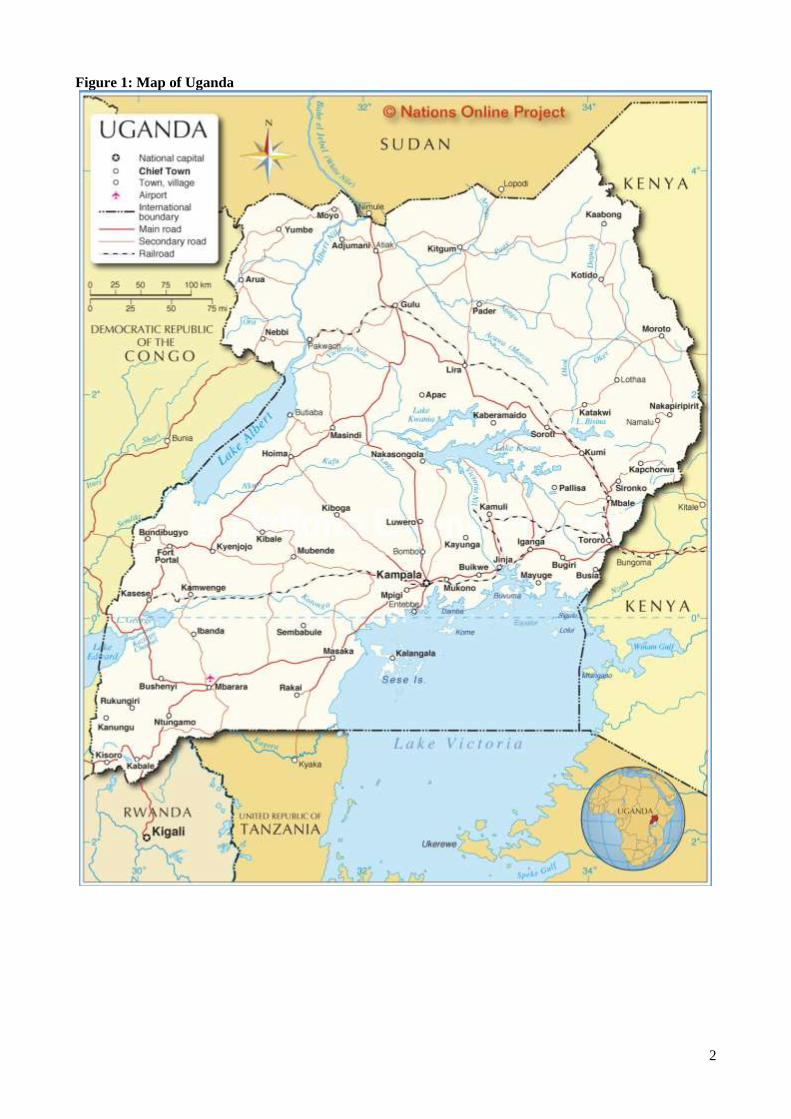
the first time. We use the example of Uganda, a map of which can be found in Figure 1, for several reasons.
First, Gennaioli and Rainer (2007, pp. 188-191) themselves consider Uganda an ideal case study because it
demonstrates large variance in historical centralization across different parts of the country, leading them to
use it as their primary qualitative example. Second, due to decentralization policies that began after the
current government took office in 1986, local governments have played a large role in local public goods
provision, thereby allowing us to test Gennaioli and Rainer (2007)’s proposed mechanism that centralization
has affected development outcomes via local government legitimacy. Third, due to the availability of
development data at the district and sub-county level, we are able to use much larger samples than were
employed by Gennaioli and Rainer (2007), with 56 to 76 observations at the district level and 958 at the sub-
county level. Fourth, due to the fact that Uganda is one of twenty countries in Africa to have been surveyed
by the Afrobarometer in its most recent round of surveys in 2008, we can also employ survey data which
contains information on assets, public goods, ethnicity and a variety of control variables. Fifth, unlike most
African censuses which fail to record any data on ethnicity2, the most recent Ugandan census from 2002
contains data on ethnicity disaggregated down to the level of the sub-county, thereby allowing us to construct
a detailed picture of pre-colonial centralization. Finally, the focus on a single country allows us to identify an
instrument for pre-colonial centralization which can thereby help to clarify the direction of causality.
1We would like to thank Jeffrey Conroy-Krutz for sharing data with us and Cecilia Lanata Briones for research
assistance. All errors remain our own. Elliot Green is the corresponding author. 2Morning (2008) finds that only 44% of African countries ask questions about ethnicity on their censuses, tied with
Europe for the lowest proportion among all regions in the world. Some countries like Tanzania have not asked
questions about ethnicity since the 1960s.
2
Figure 1: Map of Uganda

3
Our results are striking in two ways. First, using a variety of dependent variables, we confirm the Gennaioli
and Rainer (2007) hypothesis that pre-colonial centralization is highly correlated with modern-day
development outcomes at the district, sub-county, and individual levels. These results are robust to the use of
various control variables and clustered standard errors; we also use distance from the ancient capital of
Mubende as an instrument and find that most of our results are stronger. Our second finding, however, is that
a number of dependent variables are not correlated with pre-colonial centralization, specifically those that
measure public goods provision, like immunization and access to hospitals, police, and other public services.
Moreover, using Afrobarometer results, we find that there is no relationship between local levels of pre-
colonial centralization and the quality of public services. These findings are thus consistent with a correlation
between pre-colonial centralization and private rather than public goods, suggesting the persistence of
poverty and wealth from the pre-colonial period to the present.
The paper is organized as follows. First, we give an overview of the theory and empirics behind Gennaioli
and Rainer (2007) before describing our data, including how we ascribed different levels of pre-colonial
complexity to each of Uganda's 55 ethnic groups. Second, we present our empirical analysis, using data at
the district, sub-county and individual levels as well as the use of an instrumental variable. Third, we show
how our results differ according to private versus public goods. Fourth and finally, we conclude.
THEORETICAL AND EMPIRICAL OVERVIEW
There is a growing emphasis within development economics on the effects of history in determining
contemporary development outcomes. Much of this recent work owes to the seminal influence of Acemoglu,
Johnson and Robinson (2001), who argue that the quality of colonial institutions are an important
determinant of economic development across the post-colonial world. While much of this work has
examined the legacies of colonialism, a small but growing literature has discussed the role of the pre-colonial
period in determining modern-day outcomes. One important work in this regard is Englebert (2000), who
argues that the degree of congruence in Africa between the post-colonial and pre-colonial state is an
important determinant of both good governance and economic growth. Similarly, Green (2012) shows that
low pre-colonial population densities in Africa led colonizers to construct large states with artificial straight-
line borders, a pattern which persists to the present day, while Huillery (2011) has shown that the congruence
between pre-colonial and post-colonial wealth patterns in French West Africa is due to European tendencies
to settle in rich yet peaceful areas. In southern Africa Hjort (2010) argues that Botswana's post-colonial
success derives from pre-colonial cultural characteristics that favored good inter-ethnic relations, democratic
institutions and individual property rights. Finally, in India, Jha (2008) shows a positive correlation between
pre-colonial trade and contemporary peaceful Muslim-Hindu relations.
In one recent provocative article, Gennaioli and Rainer (2007) argue that pre-colonial centralization is a
determinant of post-colonial African development. They measure pre-colonial centralization by using data
from Murdock (1967), which lists data about ethnic groups from around the world along a variety of
dimensions. One of these dimensions is political complexity, which ranges from 0 for acephalous or stateless
societies such as the Herero (Namibia), Kikuyu (Kenya) and Nuer (Sudan) to 4 for highly centralized groups
like the Javanese, Siamese (Thai) and Vietnamese. Using this data, Gennaioli and Rainer (2007) thus
calculate the percentage of each African country's population that is a member of an ethnic group with a pre-
colonial complexity score of 2 or higher. They regress contemporary measures of paved roads,
immunization, literacy and infant mortality rates on political centralization and find statistically significant
relationships between centralization and all five public goods, with results that are robust to the use of sub-
samples and a number of control variables. They claim that the mechanism linking pre-colonial
centralization to modern-day development outcomes is the legitimacy of local government institutions. More
centralized groups have been able to introduce modern technologies and coordinate government activities
better than non-centralized groups.
Gennaioli and Rainer (2007)’s argument is intriguing but cannot be considered definitive, in part due to the
low number of observations in their sample. More recently Michalopoulos and Papaioannou (2012) use
satellite images to examine the impact of pre-colonial centralization on regional nighttime light density. In
their analysis the basic unit of observation for pre-colonial centralization is the ethnic group, while their
observational unit for light density is the ethnic group homeland. As with Gennaioli and Rainer (2007) they
show a robust positive impact of pre-colonial centralization on contemporary outcomes, both at the ethnic

4
group level and at the sub-ethnic group level of the pixel from their luminosity data. By using the level of
pre-colonial centralization for the entire ethnic homeland, however, Michalopoulos and Papaioannou (2012)
assume that the level of political centralization was a constant across each ethnic homeland, an implausible
assumption given the rich literature on how even the most centralized pre-colonial African states saw their
power trail off as one got closer to their borders (see Herbst (2000) for a general overview). The core of
19th-century Burundi was controlled by the Mwani (king) while outlying regions were instead ruled over by
various princes and chiefs (Lemarchand, 1994; p. 37). In Rwanda as well the state controlled the core but the
peripheral populations near its borders lived more autonomously and “were perceived pejoratively as not
very ‘Rwandan’” (Chértien, 2003, p. 161). Indeed, the literature suggests a strong link between declining
political influence as one travelled outward from the state core and a declining tendency to identify
ethnically with the state's core ethnic group (Chrétien, 2003; Green, 2008).3
In contrast to Gennaioli and Rainer (2007) and Michalopoulos and Papaioannou (2012), we examine here the
role of pre-colonial centralization at the sub-national level in Uganda. Not only is Uganda a good case study
for the reasons noted above, but also by using local districts and sub-counties as our units of observations
and measuring the percentage of the population within each unit that is from a centralized ethnic group, we
are able to avoid the assumption of local uniformity in Michalopoulos and Papaioannou (2012). We use the
same methodology for computing pre-colonial centralization in Uganda as Gennaioli and Rainer (2007),
albeit at the district and sub-county level; as elsewhere in Africa, we record several stateless societies at level
0 in our Ugandan sample but no highly complex groups at level 4. The district is the highest level of local
government; in recent years, the national government has repeatedly created new districts, such that in our
analysis below the number of districts varies between 56 and 80 depending on the date the data was
collected. (For more on district creation in Uganda see Green (2010)). The sub-county is the third-highest
level of local government (out of five different levels); in contrast to the ever-increasing number of districts,
there has been no increase in the number of sub-counties in recent years.
For 21 ethnic groups such as the Acholi, Baganda, Basoga, Iteso and Langi—members of which account for
over 82% of the population of Uganda—we can use the Ethnology data directly. However, for most ethnic
groups (34 out of the 55 groups listed in the 2002 census) we have to infer the level of pre-colonial
complexity by using the attributes of a related group. To do so we used the Ethnologue database to find
ethnic groups who speak languages closely related to those listed in the Ugandan census data. For instance,
in northern Uganda we substitute the Karamojong and assorted sub-groups like the Dodoth and Ethur with
data from another Karamojong sub-group, the Jie; for the Babukusu, Bagwe, Banyole and Samia we use data
from the related Tiriki (Luhya) group in Kenya; and for groups such as the Aringa, Japadhola, Napore and
Pokot we employ data from other Nilo-Saharan-speaking peoples in Uganda such as the Acholi, Iteso,
Kakwa, Lugbara and Sebei. In southern Uganda, we infer data for the Bagungu from the Banyoro and
Batoro, for the Bagwere from the Basoga, for the Baruli from the Baganda and Banyoro, and for the
Batagwenda we infer data from the Baganda and Banyankole.
In all of these cases so far the inference from related groups is relatively non-controversial; however, for two
sets of ethnic groups the decision is more complex. In the first case, that of the Nubi, the ethnic group in
question did not exist prior to the onset of colonial rule and thus do not have an ethnic homeland; some, like
Hansen (1991), have even questioned whether in fact they are an ethnic group at all or merely a community
open to all who wished to join. The Nubi are made up of descendants of Dinka immigrants from Sudan and
Ugandans from northern ethnic groups like the Kakwa and Lugbara—such as former President Idi Amin—
who joined the group through the military. In any case, their classification here is simplified by the fact that
the Dinka, Kakwa and Lugbara are all coded the same by Murdock (1967). In the second case, that of the
Babwisi and Basongora, we use the Baamba and Bakhonzo (complexity scores of 0) as the inferred groups.
We do so despite lexical similarities in all three cases to the Batoro (complexity score of 3) inasmuch as all
three groups were subsumed under the Kingdom of Toro in the colonial period and continued to resist Toro
3This problem of decreasing levels of centralization across space assumes that the mechanism is transferred across time
via territory irregardless of who now lives in the relevant geographical unit. If instead it is transferred inter-
generationally within members of centralized ethnic groups then Michalopoulos and Papaioannou (2012)'s model
assumes that each homeland is ethnically homogenous, a highly problematic assumption.

5
rule throughout the 20th century as part of the Ruwenzuru movement.4 All ethnic groups with their level of
centralization and the ethnic group from which their level of centralization was inferred (if applicable) are
listed in Appendix 1.
To calculate the percentage of residents in each local government unit from a centralized ethnic group we
used the most recent Ugandan census from 2002, which lists ethnic identity down to the level of the sub-
county (Government of Uganda, 2002). As noted above, the detailed nature of this data is unusual for
African censuses, and it is also unusual for Ugandan censuses, which have never before listed ethnic data at
the sub-county level. (The only previous census to list ethnic data at the county level was the 1931 census.)
We also consider the use of census data to be superior to ethnic data used by Gennaioli and Rainer (2007)
and Michalopoulos and Papaioannou (2012), not only because their data are from the 1960s, but also because
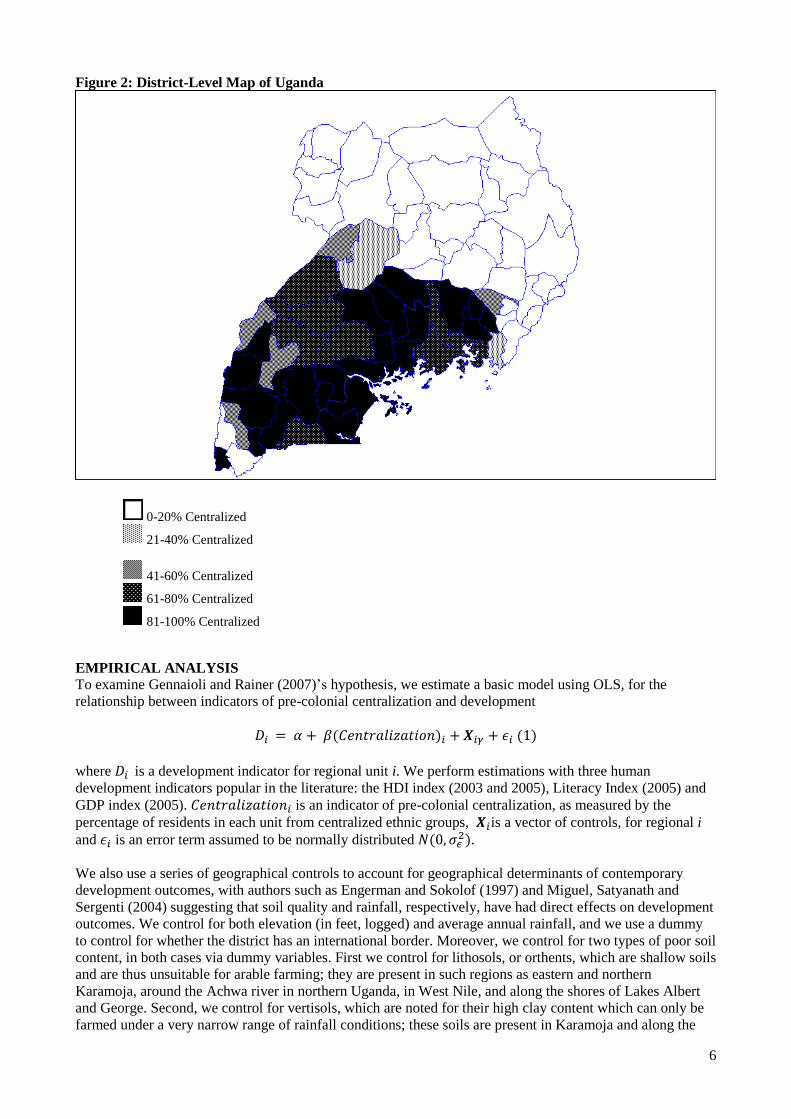
the census allows individuals to choose their own identity rather than have it assigned by researchers. Figure
2 displays a map of Uganda with 80 districts shaded five different ways according to the percentage of
residents from centralized ethnic groups.
4All three groups live in the mountainous Ruwenzuru mountain chain on the DRC/Uganda border; their lack of political
centralization thus fits into the general trend of political decentralization amongst mountainous people described by
Scott (2009). Nonetheless our results are essentially the same if we assume that these three groups have a complexity
score of 3 instead (results available from authors).
6
Figure 2: District-Level Map of Uganda
0-20% Centralized
21-40% Centralized
41-60% Centralized
61-80% Centralized
81-100% Centralized
EMPIRICAL ANALYSIS
To examine Gennaioli and Rainer (2007)’s hypothesis, we estimate a basic model using OLS, for the
relationship between indicators of pre-colonial centralization and development
where is a development indicator for regional unit i. We perform estimations with three human
development indicators popular in the literature: the HDI index (2003 and 2005), Literacy Index (2005) and
GDP index (2005). is an indicator of pre-colonial centralization, as measured by the
percentage of residents in each unit from centralized ethnic groups, is a vector of controls, for regional i
and is an error term assumed to be normally distributed .
We also use a series of geographical controls to account for geographical determinants of contemporary
development outcomes, with authors such as Engerman and Sokolof (1997) and Miguel, Satyanath and
Sergenti (2004) suggesting that soil quality and rainfall, respectively, have had direct effects on development
outcomes. We control for both elevation (in feet, logged) and average annual rainfall, and we use a dummy
to control for whether the district has an international border. Moreover, we control for two types of poor soil
content, in both cases via dummy variables. First we control for lithosols, or orthents, which are shallow soils
and are thus unsuitable for arable farming; they are present in such regions as eastern and northern
Karamoja, around the Achwa river in northern Uganda, in West Nile, and along the shores of Lakes Albert
and George. Second, we control for vertisols, which are noted for their high clay content which can only be
farmed under a very narrow range of rainfall conditions; these soils are present in Karamoja and along the

7
shores of the Albert Nile and Lake Albert. More details about all of the variables can be found in Appendix
2.
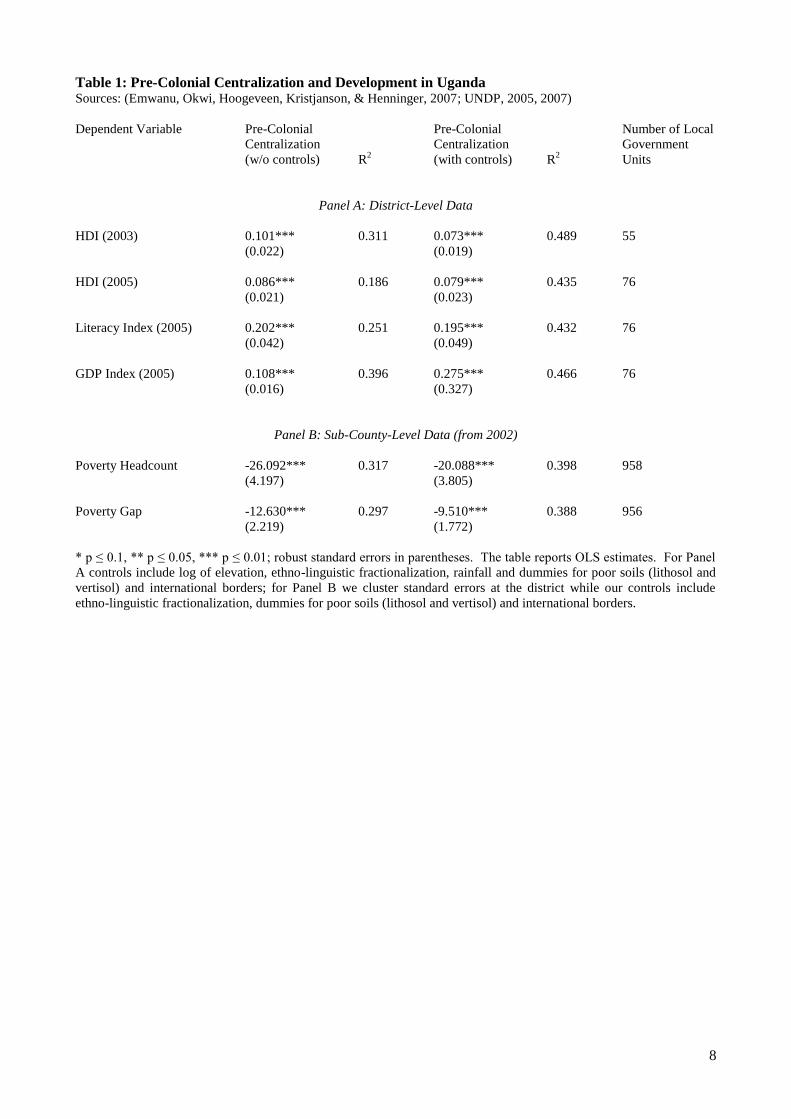
In Table 1 we present our first set of results: we list the dependent variables in the first column, followed by
results without controls and then with controls alongside the number of observations. In Panel A we list
district-level results. Our first set of data comes from the 2005 Ugandan Human Development Report
(HDR), which calculated a Human Development Index (HDI) for each of Uganda's then 56 districts. The
second set of data comes from the 2007 Ugandan HDR, which not only calculated an updated list of HDIs
per district—which came to 76 at the time of their analysis—but also their component parts such as indices
for literacy and GDP. We were unfortunately unable to match Gennaioli and Rainer (2007)'s analysis for
road coverage as data only exists for 20 districts (Government of Uganda, 2010, p. 169); we present our
results for schooling, immunization and life expectancy below. Our results show a positive and statistically
significant coefficient for all four development outcomes.
8
Table 1: Pre-Colonial Centralization and Development in Uganda Sources: (Emwanu, Okwi, Hoogeveen, Kristjanson, & Henninger, 2007; UNDP, 2005, 2007)
Dependent Variable Pre-Colonial Pre-Colonial Number of Local
Centralization Centralization Government
(w/o controls) R2 (with controls) R
2 Units
Panel A: District-Level Data
HDI (2003) 0.101*** 0.311 0.073*** 0.489 55
(0.022) (0.019)
HDI (2005) 0.086*** 0.186 0.079*** 0.435 76
(0.021) (0.023)
Literacy Index (2005) 0.202*** 0.251 0.195*** 0.432 76
(0.042) (0.049)
GDP Index (2005) 0.108*** 0.396 0.275*** 0.466 76
(0.016) (0.327)
Panel B: Sub-County-Level Data (from 2002)
Poverty Headcount -26.092*** 0.317 -20.088*** 0.398 958
(4.197) (3.805)
Poverty Gap -12.630*** 0.297 -9.510*** 0.388 956
(2.219) (1.772)
* p ≤ 0.1, ** p ≤ 0.05, *** p ≤ 0.01; robust standard errors in parentheses. The table reports OLS estimates. For Panel
A controls include log of elevation, ethno-linguistic fractionalization, rainfall and dummies for poor soils (lithosol and
vertisol) and international borders; for Panel B we cluster standard errors at the district while our controls include
ethno-linguistic fractionalization, dummies for poor soils (lithosol and vertisol) and international borders.

9
Panel B of Table 1 reports results with sub-county level data, again compiled by the Ugandan Bureau of
Statistics. For this dataset, we have obtained the poverty headcount measure, and a poverty gap measure
which calculates the average gap in expenditure necessary for the poor in each region to reach the poverty
line, as poverty development indicators. Here we cluster errors at the district level to account for district-
level effects.
In both cases in Panel B, pre-colonial centralization is both statistically significant and has the correct sign.
Moreover, in many regressions without controls pre-colonial centralization explains a great deal of variation
in the dependent variable; in the case of the poverty headcount, for instance, it alone explains almost one-
third of the variation across 958 sub-counties.
We plot the relationship between centralization and the six dependent variables from Table 1 in Figures 3a-
3f; as can be seen there are no serious outliers driving our results. To confirm the lack of outliers we also
computed the Dfbetas from each regression, removed all values where √ ; where n = number
of observations (Belsley et al., 1980, p. 28), and reran our regressions, with no differences in our findings
(we performed these tests for all regressions reported in Tables 4, 5 and 6 as well with no changes in our
results, which are available from authors upon request). We also checked for and eliminated observations
with a high Cook's Distance; our results again remained the same. For additional robustness we also test an
alternative measure of centralization, where only groups which score 3 are coded as centralized and all others
are recorded as decentralized. This change thus gives districts which have Bagwere, Bahehe, Bakenyi and
Basoga residents a lower centralization score, which makes a difference in eastern Uganda.5 The results,
which are available from the authors, yield even stronger results than those in Table 1. Finally, we reran our
results excluding all districts and sub-counties with less than 20% of their residents from centralized groups,
for two reasons. First, as seen in Figure 2 there is a strong divide between northern and eastern Uganda, with
almost no residents from centralized groups, and the rest of the country. It is of interest to see if the same
results hold when excluding the north and east. Second, our dependent variables were measured during the
height of the war involving the Lord's Resistance Army, which only affected northern Uganda, and thus the
war could be driving our results as well. However, we found no changes in our results upon excluding the
relevant districts and sub-counties (results available upon request).
5 We cannot, however, perform the exercise using a score of 1 as the threshold, since it only yields six districts with less
than half of their residents from centralized ethnic groups

10
Figures 3a-3f: Political Centralization and Development Outcomes (from Table 1)
.2.3
.4.5
.6
Hum
an D
eve
lopm
ent In
de
x 2
00
3
0 .2 .4 .6 .8 1Percentage of Residents from Centralized Ethnic Groups
.2.3
.4.5
.6.7
Hum
an D
eve
lopm
ent In
de
x 2
00
5
0 .2 .4 .6 .8 1Percentage of Residents from Centralized Ethnic Groups
0.2
.4.6
.81
Litera
cy Ind
ex 2
00
5
0 .2 .4 .6 .8 1Percentage of Residents from Centralized Ethnic Groups
.3.4
.5.6
.7
GD
P In
de
x 2
005
0 .2 .4 .6 .8 1Percentage of Residents from Centralized Ethnic Groups
02
04
06
08
01
00
Po
vert
y H
ea
dcou
nt
0 .2 .4 .6 .8 1Percentage of Residents from Centralized Ethnic Groups
02
04
06
0
Po
vert
y G
ap
0 .2 .4 .6 .8 1Percentage of Residents from Centralized Ethnic Groups

21
SURVEY BASED EMPIRICAL ESTIMATES
We next turn to results from the Afrobarometer Round 4 survey in Uganda, which in 2008 asked over 2400
respondents a variety of questions relevant to our analysis. The Afrobarometer is a cross-country survey that
first started in 1999 and had completed 4 rounds across 20 countries in Africa; it measures public attitudes to
a variety of social, economic and political phenomena. It is particularly useful for several reasons. First, it
allows us to work with individual-level data, thus providing us with an accurate representation of the reach
of public policies as well as allowing respondents to freely identify their ethnic groups. Second, it has a very
large number of respondents who are well represented across Uganda. Third, it yields a wider choice of
variables with which we can work than the local government data. More specifically, while our previous
dependent variables focused on literacy, human development and income and poverty, the Afrobarometer
survey provides responses on ownership of assets and access to vital necessities, all or some of which are
often discussed in the literature as being much more directly related to public expenditures than macro-level
variables such as HDI indices, literacy indices and income and poverty levels. For our principle explanatory
variable, pre-colonial centralization, we use the individuals’ response on his/her ethnic identity to create a
dummy variable which captures whether or not the respondent's ethnic group was centralized or not. The
dataset also provides us with variety of socio-economic variables which we use as controls, such as age, age
squared, a dummy for gender, household head, and sub-county ethno-linguistic fractionalization (ELF). For
our dependent variable, we use responses to questions on access to vital necessities in the past year: namely,
food, water, medical care, cooking fuel and cash income. Responses to the question range from never (coded
as 0) to always (coded 4).
The model we estimate is given by the following equation and we use ordered logit regressions to estimate
it.
where corresponds to response to question "How often have you gone without ___ in past year" (0-4, with
0 = never and 4 = always) for individual i. We perform estimations with responses on food, water, medical
care, cooking fuel and cash income. is a dummy which captures whether or not
the respondent's ethnic group was centralized or not, is a vector of controls, for regional unit i and is an
error term assumed to be normally distributed . In Panel A of Table 2 presents ordered logit
estimates of the equation 2.
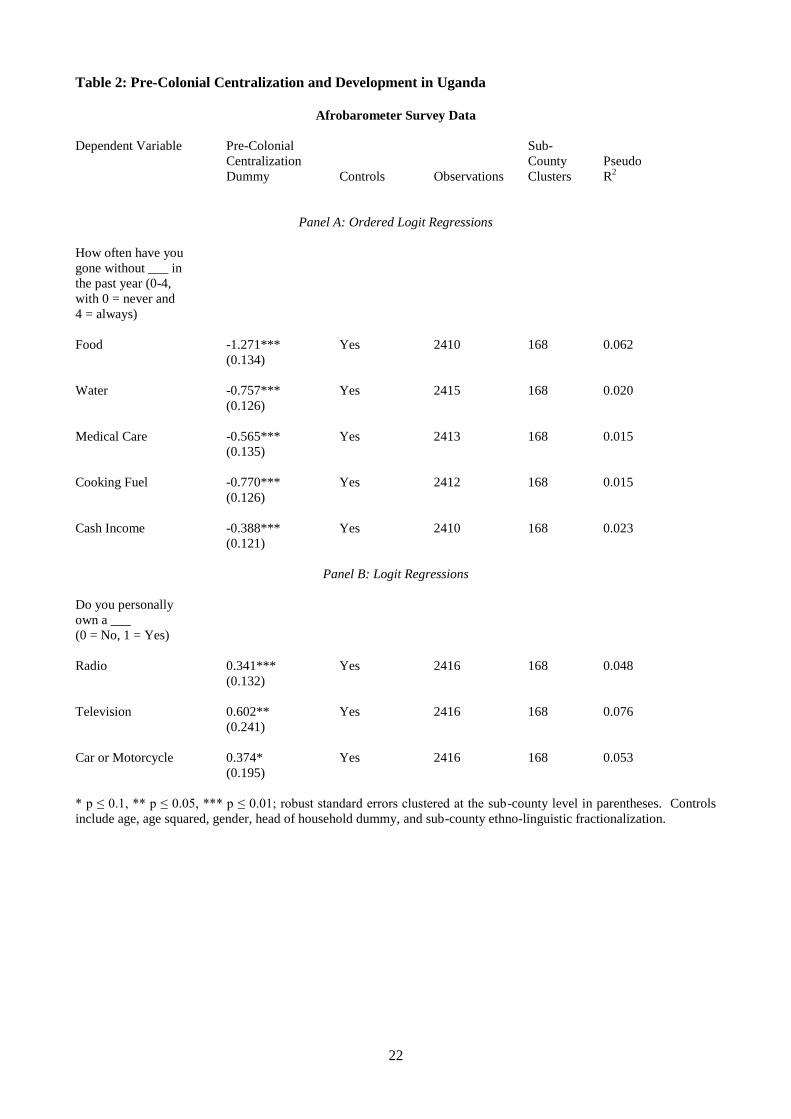
In Panel B of Table 2 we present estimates of logit regressions of a similar relationship of precolonial
centralization with the ownership of assets such as a radio, television and a car or motorcycle. We estimate
the following model:
where corresponds to response to question “Do you personally own a ___” (0 = no and 1 = yes) for
individual i. is a vector of controls (the same controls used in equation 2), for regional unit i and is
an error term assumed to be normally distributed .
In all cases we cluster the standard errors at the sub-county level, with our results robust to clustering at
alternative levels of local government as well. Our results are unequivocal: all of the coefficients of the
centralization variable have the correct sign (i.e. positive) and are statistically significant at the 5% level with
the sole exception of car or motorcycle ownership, which is significant at the 10% level.
22
Table 2: Pre-Colonial Centralization and Development in Uganda
Afrobarometer Survey Data
Dependent Variable Pre-Colonial Sub-
Centralization County Pseudo
Dummy Controls Observations Clusters R2
Panel A: Ordered Logit Regressions
How often have you
gone without ___ in
the past year (0-4,
with 0 = never and
4 = always)
Food -1.271*** Yes 2410 168 0.062
(0.134)
Water -0.757*** Yes 2415 168 0.020
(0.126)
Medical Care -0.565*** Yes 2413 168 0.015
(0.135)
Cooking Fuel -0.770*** Yes 2412 168 0.015
(0.126)
Cash Income -0.388*** Yes 2410 168 0.023
(0.121)
Panel B: Logit Regressions
Do you personally
own a ___
(0 = No, 1 = Yes)
Radio 0.341*** Yes 2416 168 0.048
(0.132)
Television 0.602** Yes 2416 168 0.076
(0.241)
Car or Motorcycle 0.374* Yes 2416 168 0.053
(0.195)
* p ≤ 0.1, ** p ≤ 0.05, *** p ≤ 0.01; robust standard errors clustered at the sub-county level in parentheses. Controls
include age, age squared, gender, head of household dummy, and sub-county ethno-linguistic fractionalization.

23
We are also lucky to have an additional set of survey results, this time from a study conducted by a joint
team from Uganda and the World Bank in 2010. While the subject of the survey was international migration
and remittances, surveyors nonetheless asked about ethnicity as well as a wide range of questions about
asset ownership which allows us to utilize the survey results here. We estimate equation 3 using logistic
regression, where corresponds to information on whether an individual "has/owns ____" (0 = no and 1 =
yes) for individual i. Here we control for age, age squared, gender, the number of people in the household
and urbanization; since the sub-counties are not listed in the dataset we control for district-level ELF and
cluster the standard errors at the enumeration level. (As before the results are robust to clustering at the
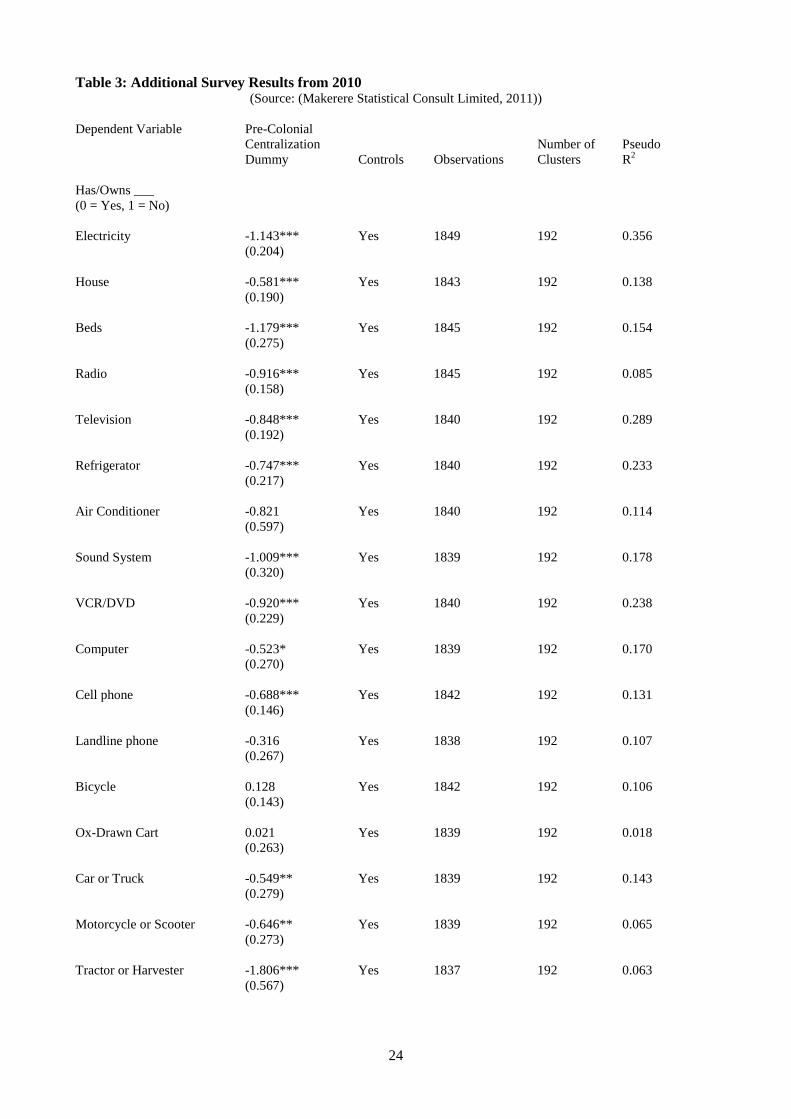
district level as well). As can be seen in Table 3, for the seventeen relevant questions the pre-colonial
centralization variable has the right sign in fifteen regressions and is statistically significant at the 5% level in
twelve regressions.
24
Table 3: Additional Survey Results from 2010 (Source: (Makerere Statistical Consult Limited, 2011))
Dependent Variable Pre-Colonial
Centralization Number of Pseudo
Dummy Controls Observations Clusters R2
Has/Owns ___
(0 = Yes, 1 = No)
Electricity -1.143*** Yes 1849 192 0.356
(0.204)
House -0.581*** Yes 1843 192 0.138
(0.190)
Beds -1.179*** Yes 1845 192 0.154
(0.275)
Radio -0.916*** Yes 1845 192 0.085
(0.158)
Television -0.848*** Yes 1840 192 0.289
(0.192)
Refrigerator -0.747*** Yes 1840 192 0.233
(0.217)
Air Conditioner -0.821 Yes 1840 192 0.114
(0.597)
Sound System -1.009*** Yes 1839 192 0.178
(0.320)
VCR/DVD -0.920*** Yes 1840 192 0.238
(0.229)
Computer -0.523* Yes 1839 192 0.170
(0.270)
Cell phone -0.688*** Yes 1842 192 0.131
(0.146)
Landline phone -0.316 Yes 1838 192 0.107
(0.267)
Bicycle 0.128 Yes 1842 192 0.106
(0.143)
Ox-Drawn Cart 0.021 Yes 1839 192 0.018
(0.263)
Car or Truck -0.549** Yes 1839 192 0.143
(0.279)
Motorcycle or Scooter -0.646** Yes 1839 192 0.065
(0.273)
Tractor or Harvester -1.806*** Yes 1837 192 0.063
(0.567)

25
* p ≤ 0.1, ** p ≤ 0.05, *** p ≤ 0.01; robust standard errors clustered at the enumeration area in parentheses. The table
reports logit estimates. Controls include age, age squared, gender, number of people in household, district-level ethno-
linguistic fractionalization and an urban dummy variable.
INSTRUMENTAL VARIABLE REGRESSIONS As noted above, one issue with Gennaioli and Rainer (2007) is that they do not deal with the potential
problem of reverse causality between pre-colonial centralization and the development outcome variables
using an instrumental variable analysis. More specifically, it is possible that pre-colonial economic
development led both to the emergence of pre-colonial states and to the persistence of economic
development outcomes to the present day. Of course, finding an instrument for pre-colonial centralization at
the country-level is extremely difficult given the complex pre-colonial history of Africa. The use of the a
single country, however, simplifies the search for such an instrument given the large literature on pre-
colonial state formation in Uganda.
Here we employ the log of distance from Mubende town as an instrument for pre-colonial political
complexity. Mubende town, in what is now Mubende district, was the legendary capital of the medieval
Bacwezi empire established by King Ndahura, who supposedly “conquered lands in various directions” from
his capital (Chértien, 2003, p. 97). While much of the history of the Bacwezi is shrouded in uncertainty,
recent archeological evidence suggests a significant human presence at Mubende between 1275 and 1400
(Robertshaw & Taylor, 2000, p. 16).6
Moreover, historians are much more certain about the pre-colonial history of the kingdom of Bunyoro,
whose capital was established at Mubende at one point and which spawned the other neighboring kingdoms
of southern and western Uganda over subsequent centuries (Chrétien, 2003, p. 103; Oliver, 1955, p. 115).
Even in the 20th century Mubende remained symbolically important: when the British took what is now
Kibaale district from Bunyoro and gave it to Buganda in the early colonial period, in response prominent
Banyoro created the Mubende Banyoro Committee as a lobbying organization to return the region to
Bunyoro.7
We plot the relationship between the log of distance and pre-colonial centralization for 79 districts in Figure
3; due to the fact that we are forced to drop Mubende district the number of observations decreases by one in
relation to Table 1. The relationship is not driven by any outliers. Distance from Mubende explains a great
deal of the variation in pre-colonial centralization. In Table 4, we regress pre-colonial centralization on
distance from Mubende for the two datasets of districts and the sub-counties alongside four other
geographical controls, namely elevation, rainfall and poor soil as measured by lithosol and vertisol dummy
variables. Distance from Mubende is negative, statistically significant and precisely measured across all three
regressions; vertisols and lithosols are also strongly and weakly significant, respectively, both in the
expected direction.8 Finally, the F-statistic in all three regressions is high, suggesting that distance from
Mubende is a strong instrument.
6 Robertshaw and Taylor (2000) also discuss evidence of an earlier settlement at Ntusi, some 65km south-west of
Mubende in what it is now the neighboring district of Sembabule; while there is no legend attaching Ntusi to the growth
of the region's subsequent kingdoms, the evidence nonetheless does suggest the existence of a centralized chiefdom
some two hundred years earlier than at Mubende. If we use an instrument measuring distance from Ntusi rather than
from Mubende we obtain essentially the same results as reported here (results available from authors). 7 The two so-called `lost counties' which comprise Kibaale district were returned to Bunyoro in a referendum in 1964;
for more details on this subject see Green (2008). 8 We do not include vertisol and lithosol as instruments since bivariate regressions show that they explain much smaller
percentages of the variation in complexity than distance from Mubende; nonetheless, our results are robust to the use of
both soil types as additional instruments (results available from authors).

26
Figure 4: Log of Distance from Mubende and Pre-Colonial Centralization
Table 4: Determinants of Pre-Colonial Centralization in Uganda (1) (2) (3)
Mubende Distance (log) -0.414*** -0.486*** -0.432***
(0.077) (0.068) (0.026)
Lithosol -0.123* -0.108* -0.135***
(0.067) (0.059) (0.034)
Vertisol -0.255*** -0.170** -0.179***
(0.074) (0.069) (0.025)
Elevation (log) 0.343 0.208
(0.235) (0.186)
Rainfall -0.035 -0.033
(0.030) (0.022)
N 54 75 957
R2
0.614 0.556 0.423
F-statistic 14.56 36.28 167.71
Prob > F 0.000 0.000 0.000
* p ≤ 0.1, ** p ≤ 0.05, *** p ≤ 0.01; robust standard errors in parentheses. The table reports OLS estimates.
R² = 0.5122
0
0.1
0.2
0.3
0.4
0.5
0.6
0.7
0.8
0.9
1
3.5 4.5 5.5 6.5
Pe
rce
nta
ge o
f R
esi
de
nts
fro
m a
Ce
ntr
aliz
ed
Eth
nic
Gro
up
Log of Distance from Mubende Town
Pre-Colonial Complexity and Distance from Mubende
27
As with any instrumental variable, the question arises as to whether distance from Mubende has influenced
contemporary developmental outcomes via channels other than pre-colonial centralization. For instance, it is
plausible that the areas near Mubende where centralized polities were established in the pre-colonial period
had better climatic conditions for agriculture and thus had higher levels of development which have persisted
to the present day. After controlling for soil, rainfall and elevation, the variable measuring distance from
Mubende is still statistically significant. Moreover, historical evidence suggests that the center of power for
Bunyoro had shifted northwards from Mubende far before independence. From the late 18th to the mid-19th
century its capitals were located in what is now Kibaale district (Nyakatura, 1973, pp. 88, 92, 98), while its
late-19th century capitals were in what are now Hoima and Masindi districts (Doyle, 2006, p. 39). The
colonial period saw the establishment of the capitals of Bunyoro in the towns of Hoima (1900-1912 and
1924-present) and Masindi (1912-1924), while the new railway system which was constructed from Kasese
in western Uganda all the way to Nairobi and the Indian Ocean coast bypassed Mubende (as can be seen in
Figure 1). The result is Mubende today remains a relative backwater town in one of the poorer parts of
Buganda kingdom, suggesting that proximity to Mubende does not have any direct effect on contemporary
developmental outcomes.
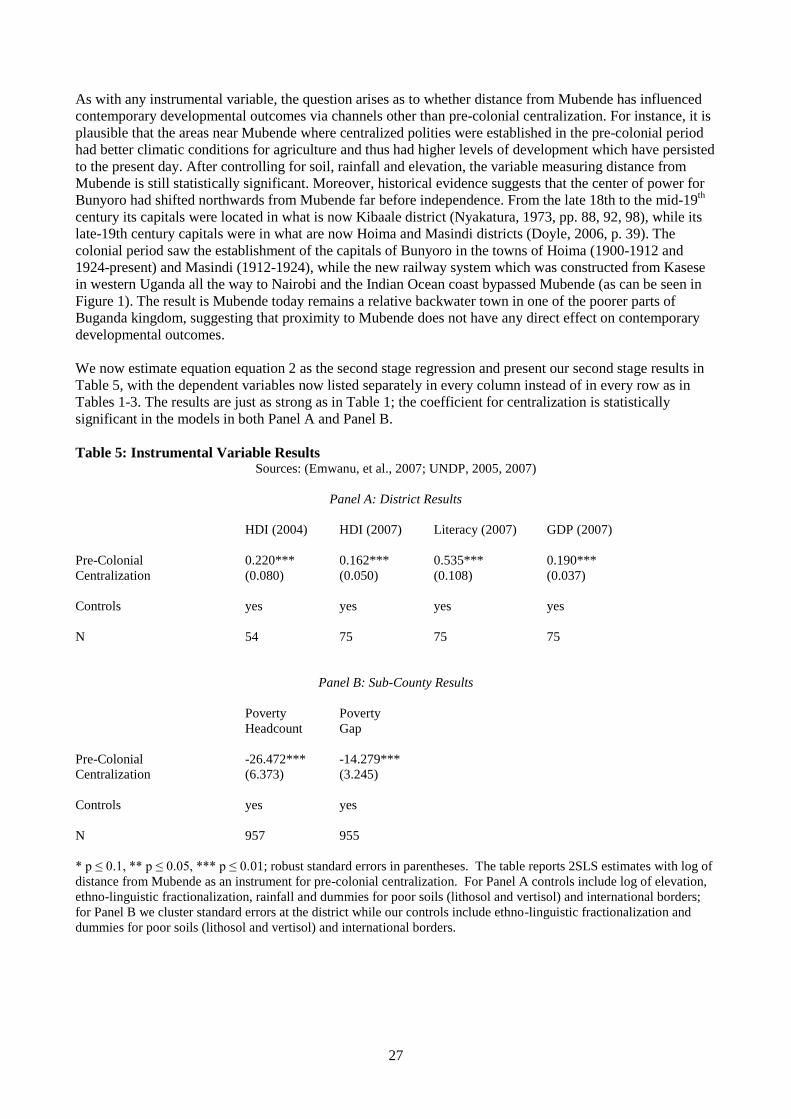
We now estimate equation equation 2 as the second stage regression and present our second stage results in
Table 5, with the dependent variables now listed separately in every column instead of in every row as in
Tables 1-3. The results are just as strong as in Table 1; the coefficient for centralization is statistically
significant in the models in both Panel A and Panel B.
Table 5: Instrumental Variable Results Sources: (Emwanu, et al., 2007; UNDP, 2005, 2007)
Panel A: District Results
HDI (2004) HDI (2007) Literacy (2007) GDP (2007)
Pre-Colonial 0.220*** 0.162*** 0.535*** 0.190***
Centralization (0.080) (0.050) (0.108) (0.037)
Controls yes yes yes yes
N 54 75 75 75
Panel B: Sub-County Results
Poverty Poverty
Headcount Gap
Pre-Colonial -26.472*** -14.279***
Centralization (6.373) (3.245)
Controls yes yes
N 957 955
* p ≤ 0.1, ** p ≤ 0.05, *** p ≤ 0.01; robust standard errors in parentheses. The table reports 2SLS estimates with log of
distance from Mubende as an instrument for pre-colonial centralization. For Panel A controls include log of elevation,
ethno-linguistic fractionalization, rainfall and dummies for poor soils (lithosol and vertisol) and international borders;
for Panel B we cluster standard errors at the district while our controls include ethno-linguistic fractionalization and
dummies for poor soils (lithosol and vertisol) and international borders.

28
TESTING MECHANISMS Gennaioli and Rainer (2007) propose three competing hypotheses for the relationship between pre-colonial
centralization and contemporary development. First, areas which were already developed in the pre-colonial
period have remained more developed to the present day, a mechanism which they call the “advancement”
hypothesis. Second, it could be that centralized ethnic groups have more legitimate local chiefs and that these
chiefs thereby have both better incentives and better abilities to implement
modernization programs, which Gennaioli and Rainer (2007) called the “local accountability” hypothesis.9
Third, the relationship could be driven by national-level mechanisms, whereby centralized ethnic groups
improve national level development patterns. Since we are attempting to explain within-country differences
we can obviously eliminate the third hypothesis, which leaves us with the first two hypotheses.
Gennaioli and Rainer (2007) propose that the second mechanism, which they call the “local accountability”
hypothesis, is correct. They do so by measuring splitting each country's population along a 2 x 2 matrix of
two binary variables, namely centralization and class stratification, with the latter variable also taken from
Murdock (1967). They then designate various types of public goods as characterized by high levels of
geographic spillover (education and infant mortality), such that local chiefs are forced to cooperate, and low
levels of spillover (paved roads and immunization), which instead has little influence outside the community
in question. As such Gennaioli and Rainer (2007) predict that for low spillover goods the benefits of pre-
colonial centralization will be higher for more stratified groups, since such groups would have particularly
poor public goods provision due to class divisions. In converse, however, for high spillover goods the effect
of pre-colonial centralization should be uniform across stratified and egalitarian groups. Their cross-national
results appear to confirm these hypotheses.
Data limitations prevent us from undertaking the same exercise here, for two reasons. First, Murdock (1967)
is missing data on stratification for the Banyoro ethnic group, one of the largest in Uganda. Second, unlike
with centralization, inferring data from related groups is more difficult with stratification, as the fragmented
Nilo-Saharan groups for which we have data are split between the stratified Alur and Kuku and the
egalitarian Acholi, Lugbara, Iteso and Madi. Gennaioli and Rainer (2007) also test for a variety of
measurements of pre-colonial advancement such as geographical measures like the length of inland
waterways and a dummy for landlocked countries, or for the existence of writing, metalworking or money. In
the former case sub-national level data for Uganda is either not available (such as waterways) or is not
applicable, such as the landlocked dummy. In the latter case, Gennaioli and Rainer (2007) take their
measures from a total of only 34 ethnic groups across Africa as recorded by Murdock and Provost (1973),
only one of which (the Baganda) is located in Uganda. Gennaioli and Rainer (2007) also add as control
variables the degree of dependence on agriculture, whether or not societies had slavery and a dummy for
permanent vs. nomadic settlements. In these three cases we again lack data for the Banyoro as well as other
groups and also are left with very little variation, with only the Jie and Topoth, for instance, coded as
nomadic groups.
We have a variety of other data, however, which allows us to test for mechanisms here, both at the district
and the individual levels. If the “advancement” mechanism is correct, then its effects should be obvious at
the individual level and not just the local government level; moreover, if true, then it implies that individuals
from centralized ethnic groups should be richer than those from decentralized ethnic groups, but that these
differences should not necessarily be obvious at the level of public goods. If instead it is the “local
accountability” hypothesis that is correct, we should instead see a set of correlations between centralization
and public goods outcomes. The “local accountability” hypothesis relies on the higher levels of legitimacy
for local governments in more centralized areas, so we should also observe higher levels of local government
performance in more centralized areas.
We first test these two hypotheses with a variety of data on public goods provision at the district level in
Table 6. The first two dependent variables are the other two measures included in the UNDP 2007 district
HDI measurements, namely gross primary school enrollment and a life expectancy index. In both cases the
data are not strictly the same as those used by Gennaioli and Rainer (2007), but nonetheless function as good
9 Michalopoulos and Papaioannou (2012, p. 3) also suggest that one potential mechanism is via the greater
accountability of local chiefs, although they do not test mechanisms against each other in their paper.
29
proxies for measuring the quality of education and health in each district, respectively.10
We then use the
most recent government data on access to safe drinking water (in 2008) and the percentage of district health
posts that were actually filled (in 2009). Finally, we use a number of different measures from the most recent
Ugandan Statistical Yearbook (Government of Uganda, 2010). We first measure the total number of health
centers per 10,000 inhabitants as well as the average level of coverage between 2007 and 2009 for four
different types of immunization: BCG (against tuberculosis), DPT (against diphtheria, pertussis and tetanus),
Measles, and Oral Polio Vaccines. Finally, we use data on four different indicators for primary education,
namely gross intake rate, net intake rate, gross enrolment rate and net enrollment rate. (See Appendix 2 for
more details on the differences between these variables.) As with immunization, in all four cases we take the
average level between 2007 and 2009.
The model estimated is given by:
where is the development outcome variable, either an education, life expectancy of health outcome. is
a vector of controls or regional unit i and is an error term assumed to be normally distributed .
Equation 4 is estimated using OLS.
10
Incidentally, Gennaioli and Rainer (2007, p. 193) note that their results are nearly identical if they substitute life
expectancy for infant mortality.

30
Table 6: Pre-Colonial Centralization and Public Goods in Uganda Sources: (Government of Uganda, 2008, 2009, 2010; UNDP, 2007)
Dependent Variable Pre-Colonial Number of
Centralization Controls R2 Districts
Gross Enrollment Index -0.009 yes 0.284 76
(2005) (0.103)
Life Expectancy Index 0.016 yes 0.305 76
(2005) (0.037)
Access to Safe Drinking -0.047 yes 0.157 76
Water (0.068)
Percentage of District -0.093 yes 0.146 80
Health Posts Filled (0.060)
Health Centers per 0.079 yes 0.078 80
10,000 inhabitants (0.267)
BCG Immunization -0.850 yes 0.238 80
(6.403)
DPT Immunization -13.017* yes 0.160 80
(7.277)
Measles Immunization -17.176** yes 0.224 80
(7.499)
Oral Polio Vaccine -12.600* yes 0.214 80
(6.926)
Gross Intake Rate -13.747 yes 0.152 80
(18.539)
Net Intake Rate 4.370 yes 0.073 80
(6.649)
Gross Enrolment Rate -9.567 yes 0.189 80
(11.975)
Net Enrolment Rate -5.203 yes 0.133 80
(8.679)
* p ≤ 0.1, ** p ≤ 0.05, *** p ≤ 0.01; robust standard errors in parentheses. The table reports OLS estimates. Controls
include log of elevation, ethno-linguistic fractionalization, rainfall and dummies for poor soils (lithosol and vertisol) and
international borders. Data for the dependent variable is from (UNDP, 2007) for the first two rows, (Government of
Uganda, 2008) for the third row, (Government of Uganda, 2009) for the fourth row and (Government of Uganda, 2010)
for the rest of the table. The last eight rows are all based on the average measurement between 2007 and 2009.
31
The results, reported in Table 6, show a striking lack of correlation between pre-colonial centralization and
these eleven variables measuring education and health outcomes. With three of the four immunization
variables we observe a negative relationship between centralization and public goods provision, although this
result is not robust to dropping soil types as control variables. Of course, the lack of any relationship between
centralization and these education and health outcomes could be the result of central government decisions
rather than local government policies. Education and health spending in Uganda, however, have been
decentralized since the early 1990s, whereby district and sub-county governments receive 35% and 42% of
all locally-generated revenue, respectively (Francis & James, 2003, p. 328). Moreover, the central
government sends money to local governments in the form of conditional, unconditional and equalization
grants, which in the last case are for districts which are behind the national average for a particular public
service. For example, scholars have found that local government spending on nonwage education
expenditures are a fraction of the actual grant sent by the central government, and it varied significantly
across regions, suggesting a strong degree of local autonomy over education spending (Reinikka &
Svensson, 2004).
If, according to the local accountability hypothesis, there should be a positive correlation between
centralization and local government accountability and performance, then we should be able to observe this
relationship using Afrobarometer data. The Afrobarometer records information on citizens’ trust in local
government, the degree to which citizens feel that local government councilors listen to them, and the
performance of local governments in handling the following: maintaining roads, maintaining market places,
maintaining food standards at restaurants and food stalls, keeping the council clean, collecting license fees
and property taxes, making their work known to citizens, providing information about their budgets,
allowing citizens to participate in decision-making, consulting others, handling complaints and using
government revenues well. We estimate model 4 using ordered logit regressions, with Afrobarometer
variables on service provision as our dependent variables.
In our analysis the independent variable of interest is not, however, a centralization dummy based on each
individual's ethnic identity but rather the percentage of people in each sub-county from centralized ethnic
groups, as in Tables 1 and 5. In all cases we use the same set of control variables as in Table 2 and cluster
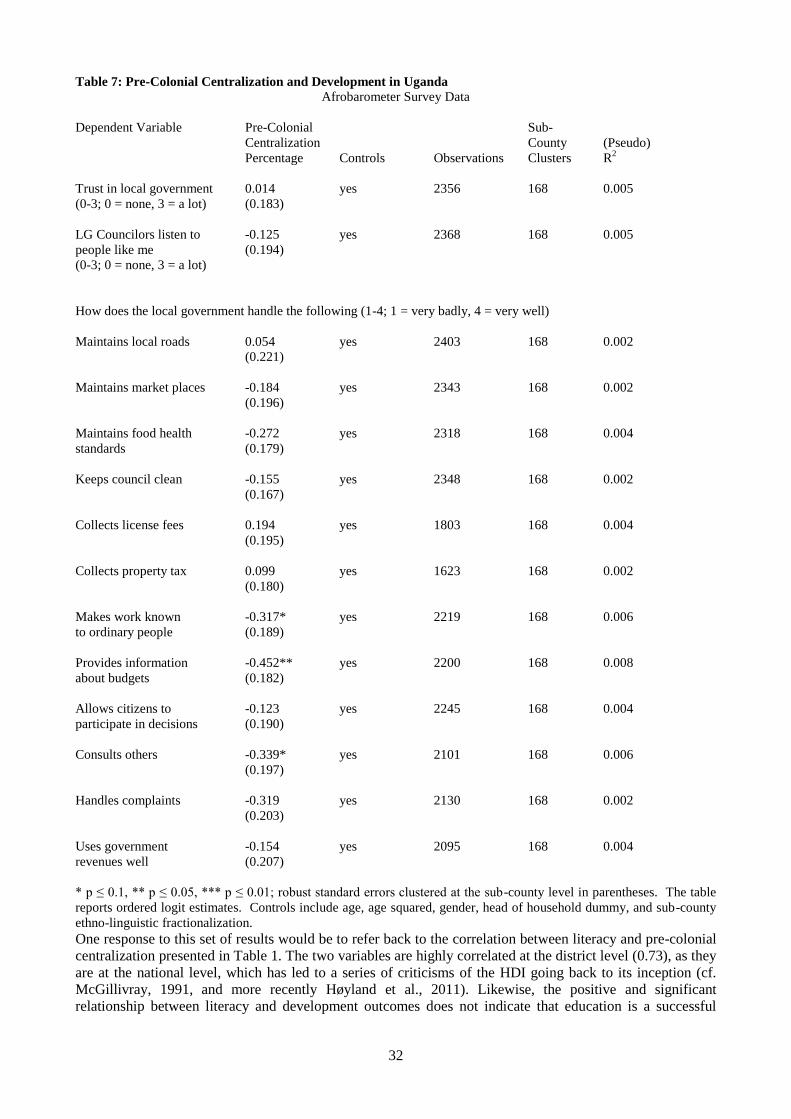
errors at the sub-county level. The results, which can be found in Table 7, demonstrate a lack of correlation
between sub-county pre-colonial centralization and perceptions of local government performance, which in
most cases results in a negative (albeit non-significant) relationship.
32
Table 7: Pre-Colonial Centralization and Development in Uganda
Afrobarometer Survey Data
Dependent Variable Pre-Colonial Sub-
Centralization County (Pseudo)
Percentage Controls Observations Clusters R2
Trust in local government 0.014 yes 2356 168 0.005
(0-3; 0 = none, 3 = a lot) (0.183)
LG Councilors listen to -0.125 yes 2368 168 0.005
people like me (0.194)
(0-3; 0 = none, 3 = a lot)
How does the local government handle the following (1-4; 1 = very badly, 4 = very well)
Maintains local roads 0.054 yes 2403 168 0.002
(0.221)
Maintains market places -0.184 yes 2343 168 0.002
(0.196)
Maintains food health -0.272 yes 2318 168 0.004
standards (0.179)
Keeps council clean -0.155 yes 2348 168 0.002
(0.167)
Collects license fees 0.194 yes 1803 168 0.004
(0.195)
Collects property tax 0.099 yes 1623 168 0.002
(0.180)
Makes work known -0.317* yes 2219 168 0.006
to ordinary people (0.189)
Provides information -0.452** yes 2200 168 0.008
about budgets (0.182)
Allows citizens to -0.123 yes 2245 168 0.004
participate in decisions (0.190)
Consults others -0.339* yes 2101 168 0.006
(0.197)
Handles complaints -0.319 yes 2130 168 0.002
(0.203)
Uses government -0.154 yes 2095 168 0.004
revenues well (0.207)
* p ≤ 0.1, ** p ≤ 0.05, *** p ≤ 0.01; robust standard errors clustered at the sub-county level in parentheses. The table
reports ordered logit estimates. Controls include age, age squared, gender, head of household dummy, and sub-county
ethno-linguistic fractionalization.
One response to this set of results would be to refer back to the correlation between literacy and pre-colonial
centralization presented in Table 1. The two variables are highly correlated at the district level (0.73), as they
are at the national level, which has led to a series of criticisms of the HDI going back to its inception (cf.
McGillivray, 1991, and more recently Høyland et al., 2011). Likewise, the positive and significant
relationship between literacy and development outcomes does not indicate that education is a successful
33
public good. Evidence from Uganda suggests that despite the abolition of school fees households still have to
cover indirect private costs such as meals, uniforms and transportation (Nishimura et al., 2008).
To sum up this section, the set of results presented in Table 6 show a striking lack of correlation between
pre-colonial centralization and public goods in education and health, while in Table 7 the results showed a
lack of correlation between pre-colonial centralization and local government accountability and performance.
These results contrast strong with the results presented in Tables 1-3 and Table 5, which clearly showed a
strong relationship between pre-colonial centralization and such measurements as GDP, poverty and asset
ownership. These dual set of results clearly suggest that pre-colonial centralization is correlated with
contemporary access to private goods rather than public goods.
CONCLUSIONS
In this paper we tested Gennaioli and Rainer (2007)'s hypothesis that pre-colonial political centralization is a
determinant of post-colonial African development against data from Uganda. Employing a wide variety of
evidence from the UN, Afrobarometer, World Bank and the Government of Uganda, we showed that pre-
colonial centralization is indeed highly correlated with contemporary measurements of GDP, poverty and
asset ownership, a result which is robust to the use of various control variables, clustered standard errors and
distance from the ancient capital of Mubende as an instrumental variable. We also showed, however, that
pre-colonial centralization is neither correlated with public goods provision in the case of health and
education nor with local government accountability or efficacy.
Our results suggest a correlation between pre-colonial centralization and private rather than public goods,
leading us to propose that structural patterns of wealth and poverty have persisted in Uganda from the pre-
colonial period to the present day. Indeed, the qualitative historical record supports this conclusion in three
ways. In the first case we can document a positive effect of pre-colonial states on local welfare. States like
Buganda and Bunyoro were not only centers of wealth but had the ability to use this wealth to feed the poor
in times of famine (Doyle, 2006, p. 31). Nor is pre-colonial Uganda unique in this regard: as noted by
McCaskie (2003, p. 31), pre-colonial states like the Asante in West Africa “cannot be remotely classified as
an economy of generalized want and hunger.” Secondly, there is recent evidence that pre-colonial
centralization is actually negatively correlated with contemporary levels of democracy outside Europe,
whereby the spread of colonial institutions was hindered by strong pre-colonial states (Hariri, 2012). In other
words, pre-colonial centralization appears to be correlated with lower rather than levels of political
accountability, at least at the country level. Third and finally, people in centralized pre-colonial states were
generally better off than stateless peoples due to the effects of states in promoting underdevelopment among
stateless peoples, particularly through slave-raiding. The effects of the inter-continental slave trade on
African underdevelopment have already been explored by Nunn\ (2008), who finds a robust relationship
between the number of slaves exported and contemporary GDP per capita; Nunn and Wantchekon (2011)
suggest that the relevant mechanism was the way in which slavery led to greater levels of mistrust within
Africa. Indeed, in pre-colonial Sub-Saharan Africa land was abundant but labor scarce in the pre-colonial
era, which meant that poverty at the time was more defined by a lack of access to labor than to land (Iliffe,
1987). Slave-raiding was therefore the ideal way to alleviate labor shortages, especially by raiding
neighboring groups: “it is inaccurate to think that Africans enslaved their brothers—although this sometimes
happened. Rather, Africans enslaved their enemies” (Lovejoy, 2000, p. 22).
Thus the Bunyoro state would often raid for slaves among the Alur of north-west Uganda (Doyle, 2006, p.
37), while neighboring Acholi, Lugbara and Madi people were similarly targeted by Arabic slave traders
from what is now Sudan (Leopold, 2006, pp. 181-185).11
The effect of such raids was not only to negatively
affect those who became slaves, but also those left behind where labor was scarcer than it had been before,
thereby only exacerbating pre-colonial inequalities between centralized and stateless peoples.12
The nature of
11
Michalopoulos and Papaioannou (2012) attempt to control for this possibility by introducing a dummy variable
measuring the existence/non-existence of slavery within each ethnic group; they find no statistical relationship between
this slavery variable and light intensity. However, the existence of slavery was not necessarily correlated with slave
raiding; thus the Alur and Lugbara, to take two examples, are both recorded by Murdock (1967) as using slaves yet
suffered from slave-raiding much more than they gained. 12
Again, for evidence outside Africa see Scott (2009), who suggests that stateless peoples in south-east Asia
deliberately refused to adopt writing in order to frustrate state attempts at capturing and classifying them; being pre-
literate (or post-literate as Scott (2009) calls them) would have also inhibited economic development in obvious ways.

34
the impact of pre-colonial slavery within Africa on post-colonial development—as opposed to the effects of
the inter-continental slave trade—remains, however, a topic for further discussion.
Regarding Gennaioli and Rainer (2007), our results support their findings, but not their proposed mechanism
about the quality of local government in centralized areas. In suggesting the persistence of poverty from the
pre-colonial period to the present we thereby argue against the noted “Reversal of Fortune” thesis proposed
by Acemoglu, Johnson and Robinson (2002), whereby colonialism made poorer areas rich and turned richer
areas poor. Our results instead match with those of Bandyopadhyay and Green (2012), who argue that this
reversal did not take place within Africa, alongside those of Hjort (2010) and others who suggest that pre-
colonial social formations have persistent effects on contemporary development.13
Moreover, our results also add to a growing literature on the specific impact of pre-colonial political
centralization on subsequent economic and political development. For instance, Lange, Mahoney and Vom
Hau (2006) suggest that both Spain and the UK imposed varying levels of direct colonialism according to
local levels of pre-colonial centralization, and that the consequent different degrees of colonialism has had a
major impact across the former Spanish and British empires. Similarly, Gerring, Ziblatt, Van Gorp and
Arévalo (2011) show that pre-colonial centralization is positively and robustly correlated with indirect
colonial rule, which suggests that much of the impact of colonialism on contemporary development may be
attributable instead to the influence of pre-colonial development. Finally, Bockstette, Chanda and Putterman
(2002) suggest that a history of a state over the past 2000 years is highly correlated at the cross-national level
with contemporary measures of political stability and economic development.
We hope this analysis has contributed toward the growing literature on the role of history in contemporary
African development. Further work on this subject could investigate the same relationships in another
context, whether in another African country or somewhere else with similarly large variation in pre-colonial
centralization. Indeed, examining the relationship between pre-colonial centralization and contemporary
development across different colonies might add significantly to our growing knowledge about varieties of
colonialism, both in terms of different colonizer but also as regards local variation in the colonies
themselves.
13
Our results do not, however, correspond to those of Bruhn and Gallego (2012), who provide sub-national evidence
supporting the thesis that there was a Reversal within the Americas.

35
REFERENCES
Acemoglu, D., Johnson, S., & Robinson, J. A. (2001). The Colonial Origins of Comparative Development:
An Empirical Investigation. American Economic Review 91(5): 1369-1401.
Acemoglu, D., Johnson, S., & Robinson, J. A. (2002). Reversal of Fortune: Geography and Institutions in the
Making of the Modern World Income Distribution. Quarterly Journal of Economics 117(4): 1231-1294.
Bandyopadhyay, S. & Green, E. D. (2012). The Reversal of Fortune Thesis Reconsidered. Journal of
Development Studies 48(7): 817-831.
Basalirwa, C. (1995). Delineation of Uganda into Climatological Rainfall Zones Using the Method of
Principal Component Analysis. International Journal of Climatology 15(10): 1161-1177.
Belsley, D. A., Kuh, E. & Welsch, R. E. (1980). Regression diagnostics: Identifying influential data and
sources of collinearity. New York: Wiley.
Besley, T. & Ghatak, M. (2010). Property Rights and Economic Development, in Handbook of Development
Economics, Volume 5, ed. D. Rodrik and M. Rosenzweig. Amsterdam: North-Holland, 4525-4595.
Bockstette, V., Chanda, A., \& Putterman, L. (2002). States and Markets: The Advantage of an Early Start.
Journal of Economic Growth 7(4): 347-369.
Bruhn, M. & Gallego, F. (2012). Good, Bad and Ugly Colonial Activities: Do They Matter for Economic
Development? Review of Economics and Statistics: 94(2), 433-461.
Chrétien, J.-P. (2003). The Great Lakes of Africa: Two Thousand Years of History (S. Straus, Trans.). New
York: Zone Books.
Doyle, S. (2006). Crisis and Decline in Bunyoro: Population and Environment in Western Uganda, 1860-
1955. Oxford: James Currey.
Emwanu, T., Okwi, P. O., Hoogeveen, J. G., Kristjanson, P., & Henninger, N. (2007). Nature, Distribution
and Evolution of Poverty and Inequality in Uganda. Nairobi: Uganda Bureau of
Statistics/International Livestock Research Institute.
Engerman S.L. & Sokoloff, K.L. (1997). Factor endowments, institutions, and differential paths of growth
among New World economies: a view from economic historians of the United States. In How Latin America
Fell Behind, ed. S Harber, pp. 260--304. Stanford, CA: Stanford University Press.
Englebert, P. (2000). State Legitimacy and Development in Africa. Boulder, CO: Lynne Rienner Publishers.
Francis, P. & James, R. (2003). Balancing Rural Poverty Reduction and Citizen Participation: The
Contradictions of Uganda's Decentralization Program. World Development 31(2): 325-337.
Gennaioli, N. & Rainer, I. (2007). The Modern Impact of Precolonial Centralization in Africa. Journal of
Economic Growth 12(3): 185-234.
Gerring, J., Ziblatt, D., Van Gorp, J., & Ar\'{e}valo, J. (2011). An Institutional Theory of Direct and Indirect
Rule. World Politics 63(3): 377-433.
Government of Uganda. (1967). Atlas of Uganda. Kampala.
Government of Uganda. (2002). Uganda Population and Housing Census. Kampala.
Government of Uganda. (2010). 2010 Statistical Abstract. Kampala.

36
Green, E. D. (2008). Understanding the Limits to Ethnic Change: Evidence from Uganda's Lost Counties.
Perspectives on Politics 6(3): 473-485.
Green, E. D. (2010). Patronage, District Creation and Reform in Uganda. Studies in Comparative
International Development 45(1): 83-103.
Green, E. D. (2012). On the Size and Shape of African States. International Studies Quarterly, 56(2), 229-
244.
Hansen, H. B. (1991). Precolonial Immigrants and Colonial Servants: The Nubians in Uganda Revisited.
African Affairs 90(361): 559-580.
Hariri, J. G. (2012). The Autocratic Legacy of Early Statehood. American Political Science Review 106(3):
471-494.
Hjort, J. (2010). Pre-colonial culture, post-colonial economic success? The Tswana and the African
economic miracle. Economic History Review 63(3): 688-709.
Høyland, B., Moene, K. & Willumsen, F. (2011). The tyranny of international index rankings. Journal of
Development Economics 97(1), 1-14.
Huillery, E. (2011). The Impact of European Settlement within French West Africa: Did Pre-colonial
Prosperous Areas Fall Behind? Journal of African Economies 20(2): 263-311.
Iliffe, J. (1987). The African Poor: A History. Cambridge: Cambridge University Press.
Jha, S. (2008). Trade, Institutions and Religious Tolerance: Evidence from India. Mimeo, Graduate School
of Business, Stanford University.
Lange, M., Mahoney, J., & Vom Hau, M. (2006). Colonialism and Development: A Comparative Analysis of
Spanish and British Colonies. American Journal of Sociology 111(5): 1412-1462.
Lemarchand, R. (1994). Burundi: Ethnocide as Discourse and Practice. Cambridge: Cambridge University
Press.
Leopold, M. (2006). Legacies of Slavery in North-West Uganda: The Story of the ‘One Elevens’. Africa:
Journal of the International African Institute 76(2): 180-199.
Lovejoy, P. E. (2000). Transformations in Slavery: A History of Slavery in Africa (2 ed.). Cambridge:
Cambridge University Press.
Makerere Statistical Consult Limited. (2011). Uganda - Migration Household Survey 2010. Washington,
DC: World Bank.
McCaskie, T. C. (2003). State and Society in Pre-Colonial Asante. Cambridge: Cambridge University Press.
McGillivray, M. (1991). The Human Development Index: Yet Another Redundant Composite Development
Indicator? World Development 19(10): 1461-1468.
Michalopoulos, S., & Papaioannou, E. (2012). Pre-colonial Ethnic Institutions and Contemporary African
Development. Econometrica, forthcoming.
Miguel, E., Satyanath, S. & Sergenti, E. (2004). Economic Shocks and Civil Conflict: An Instrumental
Variables Approach. Journal of Political Economy 112(4): 725-753.
Morning, A. (2008). Ethnic Classification in Global Perspective: A Cross-National Survey of the 2000
Census Round. Population Research and Policy Review 27(2): 239-272.

37
Murdock, G. P. (1967). Ethnographic Atlas. Pittsburgh: University of Pittsburgh Press.
Murdock, G. P., & Provost, C. (1973). Measurement of Cultural Complexity. Ethnology 12(4): 379-392.
Nishimura, M., Yamano, T., Sasaoka, Y. (2008). Impacts of the universal primary education policy on
educational attainment and private costs in rural Uganda. International Journal of Educational Development
28(2): 161-175.
Nunn, N. (2008). The Long-Term Effects of Africa's Slave Trades. Quarterly Journal of Economics 123(1):
139-176.
Nunn, N. (2009). The Importance of History for Economic Development. Annual Review of Economics, 1,
65-92.
Nunn, N. & Wantchekon, L. (2011). The Slave Trade and the Origins of Mistrust in Africa. American
Economic Review 101(7): 3221-3252.
Nyakatura, J. W. (1973). Anatomy of an African Kingdom: A History of Bunyoro-Kitara (T. Muganwa,
Trans.). New York: NOK.
Oliver, R. (1955). The Traditional Histories of Buganda, Bunyoro, and Nkole. Journal of the Royal
Anthropological Institute of Great Britain and Ireland, 85(1/2): 111-117.
Reinikka, R. & Svensson, J. (2004). Local Capture: Evidence from a Central Government Transfer Program
in Uganda. Quarterly Journal of Economics 119(2): 678-704.
Robertshaw, P. & Taylor, D. (2000). Climate Change and the Rise of Political Complexity in Western
Uganda. Journal of African History 41(1): 1-28.
Scott, J. (2009). The Art of Not Being Governed: An Anarchist History of Upland Southeast Asia. New
Haven, CT: Yale University Press.
UNDP. (2005). Uganda Human Development Report 2005: Linking Environment to Human Development.
New York: United Nations.
UNDP. (2007). Uganda Human Development Report 2007: Rediscovering Agriculture for Human
Development. New York: United Nations.

38
Appendix 1: Ethnic Groups and Pre-Colonial Centralization
Ethnic Group Centralization Similar Ethnic Group
Acholi 1
Alur 1
Aringa 1 Acholi/Iteso/Kakwa
Baamba 0
Babukusu 1 Tiriki (Luhya; in Kenya)
Babwisi 0 Baamba
Bafumbira 3 Banyarwanda
Baganda 3
Bagisu 1
Bagungu 3 Banyoro/Batoro
Bagwe 1 Tiriki (Luhya; in Kenya)
Bagwere 2 Basoga
Bahehe 2
Bahororo 3 Banyankole
Bakenyi 2 Basoga
Bakhonzo 0
Bakiga 0
Banyankole 3
Banyara 3 Baganda/Banyoro
Banyarwanda 3
Banyole 1 Tiriki (Luhya; in Kenya)
Banyoro 3
Baruli 3 Baganda/Banyoro
Basamia 1 Tiriki (Luhya; in Kenya)
Basoga 2
Basongora 0 Baamba
Batagwenda 3 Banyankole/Batoro
Batoro 3
Ethnic Group Centralization Similar Ethnic Group
Batuku 3 Batoro
Batwa 0 Mbuti (in the DRC)
Chope 1 Acholi/Iteso/Kakwa
Dodoth 1 Jie
Ethur 1 Jie
Ik (Teuso) 1 Acholi/Iteso/Kakwa
Iteso 1
Jie 1
Jopadhola 1 Acholi/Iteso/Kakwa
Kumam 1 Acholi/Iteso/Kakwa
Jonam 1 Acholi/Iteso/Kakwa
Kakwa 1
Karimojong 1 Jie
Kebu(okebu) 1 Acholi/Iteso/Kakwa
Kuku 1
Kumam 1 Acholi/Iteso/Kakwa
Langi 0
Lendu 1 Acholi/Iteso/Kakwa
Lugbara 1
Madi 1
Mening 1 Iteso
Mvuba 1 Acholi/Iteso/Kakwa
Napore 1 Acholi/Iteso/Kakwa
Nubi 1 Dinka (in Sudan)/Kakwa/Lugbara
Nyangia 1 Acholi/Iteso/Kakwa
Pokot 1 Acholi/Iteso/Kakwa
Sabiny/Sebei 1
So/Tepeth/Topotha 1
39
Appendix 2: Data Sources
Dependent Variables
Access to Safe Drinking Water: Access to safe drinking water in 2008. Source: (Government of Uganda,
2008).
BCG Immunization: Average coverage of BCG (tuberculosis) immunization between 2007 and 2009.
Source: (Government of Uganda, 2010).
DPT Immunization: Average coverage of DPT (diphtheria, pertussis and tetanus) immunization between
2007 and 2009. Source: (Government of Uganda, 2010).
GDPIndex: GDP per capita Index for 2005. Source: (UNDP, 2007).
HDI2003: Human Development Index for 2003. Source: (UNDP, 2005).
HDI2005: Human Development Index for 2005. Source: (UNDP, 2007).
Gross Enrollment Index: Index of the ratio of all pupils enrolled in primary school to the total population
of six- to twelve year olds in the district for 2005. Source: (UNDP, 2007).
Gross Enrollment Ratio: the average ratio of all pupils enrolled in primary school to the total population
of six- to twelve year olds in the district between 2007 and 2009. Source: (Government of Uganda,
2010).
Gross Intake Ratio: the average ratio of all pupils enrolled in primary grade one to the total population of
six-year olds per district between 2007 and 2009. Source: (Government of Uganda, 2010).
Health Centres per 10,000 inhabitants: total number of health centres per 10,000 inhabitants. Source:
(Government of Uganda, 2010).
Inequality: Gini index of inequality, ranging from 0 (perfect equality) to 1 (perfect inequality). Source:
(Emwanu, et al., 2007).
Life Expectancy Index: Average Life Expectancy Index for 2005. Source: (UNDP, 2007).
Literacy Index: Adult Literacy Index for 2005. Source: (UNDP, 2007).
Measles Immunization: Average coverage of measles immunization between 2007 and 2009. Source:
(Government of Uganda, 2010).
Net Enrollment Ratio: the average ratio of pupils enrolled in primary school aged 6-12 to the total
population of six- to twelve year olds in the district between 2007 and 2009. Source: (Government of
Uganda, 2010).
Net Intake Ratio: the average ratio of pupils aged six enrolled in primary grade one to the total population
of six-year olds per district between 2007 and 2009. Source: (Government of Uganda, 2010).
Oral Polio Vaccine: Average coverage of oral polio vaccine between 2007 and 2009. Source:
(Government of Uganda, 2010).
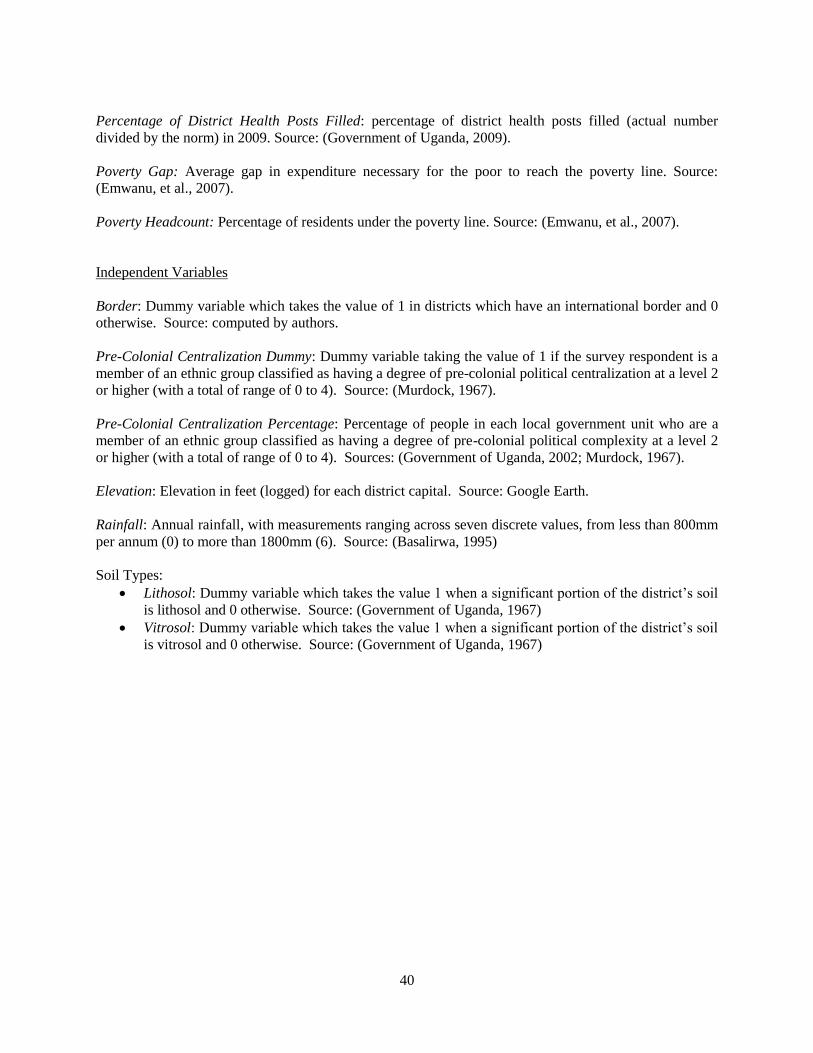
40
Percentage of District Health Posts Filled: percentage of district health posts filled (actual number
divided by the norm) in 2009. Source: (Government of Uganda, 2009).
Poverty Gap: Average gap in expenditure necessary for the poor to reach the poverty line. Source:
(Emwanu, et al., 2007).
Poverty Headcount: Percentage of residents under the poverty line. Source: (Emwanu, et al., 2007).
Independent Variables
Border: Dummy variable which takes the value of 1 in districts which have an international border and 0
otherwise. Source: computed by authors.
Pre-Colonial Centralization Dummy: Dummy variable taking the value of 1 if the survey respondent is a
member of an ethnic group classified as having a degree of pre-colonial political centralization at a level 2
or higher (with a total of range of 0 to 4). Source: (Murdock, 1967).
Pre-Colonial Centralization Percentage: Percentage of people in each local government unit who are a
member of an ethnic group classified as having a degree of pre-colonial political complexity at a level 2
or higher (with a total of range of 0 to 4). Sources: (Government of Uganda, 2002; Murdock, 1967).
Elevation: Elevation in feet (logged) for each district capital. Source: Google Earth.
Rainfall: Annual rainfall, with measurements ranging across seven discrete values, from less than 800mm
per annum (0) to more than 1800mm (6). Source: (Basalirwa, 1995)
Soil Types:
Lithosol: Dummy variable which takes the value 1 when a significant portion of the district’s soil
is lithosol and 0 otherwise. Source: (Government of Uganda, 1967)
Vitrosol: Dummy variable which takes the value 1 when a significant portion of the district’s soil
is vitrosol and 0 otherwise. Source: (Government of Uganda, 1967)
41
AFROBAROMETER WORKING PAPERS No. 140 Sacks, Audrey. “Can Donors and Non-State Actors Undermine Citizens’ Legitimating Beliefs” 2012
No. 139 Justesen, Mogens K. and Christian Bjørnskov. “Exploiting the Poor: Bureaucratic Corruption and Poverty
in Africa” 2012
No. 138 De Luca, Giacomo and Marijke Verpoorten. “From Vice to Virtue? Civil War and Social Capital in
Uganda” 2012
No. 137 Kerr, Nicholas “Perceptions versus Reality: Assessing Popular Evaluations of Electoral Quality in Africa”
2011.
No. 136 Resnick, Danielle and Daniela Casale “Political Participation of Africa’s Youth: Turnout, Partisanship, and
Protest” 2011.
No. 135 Conroy-Krutz, Jeffrey and Carolyn Logan “Museveni and the 2011 Ugandan Election: Did the Money
Matter?” 2011.
No. 134 Carter, Danielle “Sources of State Legitimacy in Contemporary South Africa: A Theory of Political Goods”
2011.
No.133 Justesen, Mogens K “Too Poor to Care? The Salience of Aids in Africa” 2011.
No.132 Kasara, Kimuli “Separate and Suspicious: Local Social and Political Context and Ethnic Tolerance in
Kenya” 2011.
No.131 Mattes, Robert “The ‘Born Frees’: The Prospects for Generational Change in Post-Apartheid South Africa”
2011.
No.130 Baldwin, Kate. “When Politicians Cede Control of Resources: Land, Chiefs and Coalition-Building in
Africa” 2011.
No.129 Conroy-Krutz, Jeffrey and Dominique Lewis “Mapping Ideologies in African Landscapes” 2011.
No.128 Logan, Carolyn. “The Roots of Resilience: Exploring Popular Support for African Traditional Authorities”
2011.
No.127 Bratton, Michael, Ravi Bhavnani and Tse-Hsin Chen “Voting Intentions in Africa: Ethnic, Economic or
Partisan?” 2011.
No.126 D’Arcy, Michelle “Why Do Citizens Assent to Pay Tax? Legitimacy, Taxation and the African State” 2011.
No.125 LeBas, Adrienne “Ethnicity and the Willingness to Sanction Violent Politicians: Evidence from Kenya”
2010.
No.124 Mattes, Robert, Francis Kibirige and Robert Sentamu “Understanding Citizens Attitudes to Democracy in
Uganda” 2010.
No.123 Logan, Carolyn and Robert Mattes “Democratizing the Measurement of Democratic Quality: Public
Attitude Data and the Evaluation” 2010.
No.122 Bratton, Michael “Anchoring the “D-Word” in Africa” 2010
No.121 Isaksson, Ann-Sofie “Political participation in Africa: Participatory inequalities and the role of resources”
2010
No.120 Harding, Robin “Urban-Rural Differences in Support for Incumbents Across Africa” 2010.
No. 119 Bratton, Michael “Citizen Perceptions of Local Government Responsiveness in Sub-Saharan Africa” 2010.