retail tobacco display bans - centre can · retail tobacco display bans⇤ abstract bans on retail...
TRANSCRIPT

Working Paper SeriesDocument de travail de la serie
RETAIL TOBACCO DISPLAY BANS
Ian Irvine and Hai V. Nguyen
Working Paper No: 2014-07
www.canadiancentreforhealtheconomics.ca
March 22, 2014
Canadian Centre for Health EconomicsCentre canadien en economie de la sante
155 College StreetToronto, Ontario

CCHE/CCES Working Paper No. 2014-07March 22, 2014
Retail Tobacco Display Bans
⇤
Abstract
Bans on retail tobacco displays, of the type proposed by New York’s Mayor Bloomberg in March2013, have been operative in several economies since 2001. Despite an enormous number of stud-ies in public health journals using attitudinal data, we can find no population-based econometricstudies of the type normally used in Economics. This paper attempts to fill that gap by using datafrom the annual Canadian Tobacco Use Monitoring Surveys. These data a↵ord an ideal opportu-nity to study events of this type given that each of Canada’s provinces implemented display bansat various points between 2003 and 2009. We use di↵erence-in-di↵erences methods to study threebehaviors following the introduction of bans: participation in smoking, the intensity of smokingand quit intentions. A critical element of the study concerns the treatment of contraband to-bacco. Our estimates provide little support for the hypothesis that behaviors changed significantlyfollowing the bans, although there is evidence that the ban reduced smoking intensity among youth.
JEL Classification: H2, I12, I18
Key words: cigarettes, display ban, smoking participation, intensity, quit intention
Corresponding Authors:
Ian IrvineConcordia University1455 de Maisonneuve Boulevard [email protected]
Hai V. NguyenDuke-NUS Graduate Medical School Singapore8 College Road, [email protected]
⇤This research is unfunded. Comments welcome to Nguyen at [email protected] or Irvine at
1
1 Introduction
In March of 2013, New Yorkís Mayor Bloomberg proposed that cigarette vendors be pre-
vented from displaying their products openly in retail outlets. Such displays are most fre-
quently located on shelves behind the cashier. In Mr. Bloombergís view, and in the view
of many health advocates, they serve to ënormalizeí cigarettes and also act as advertising.
Their presence may furthermore prompt unplanned purchases and hence increase tobacco
consumption. Since cigarettes are an accepted carcinogen, responsible for many thousands
of deaths in New York each year, the proposal might contribute to the long-term objective
of reducing mortality and morbidity.
Should a retail display ban (RDB) progress to legislation, it would make New York the
Örst city in the US to adopt it. Broadly, vendors would be required to put cigarettes and
other tobacco products out of customer view - in covered shelving, or camouáaged by a
blind of some type. In addition to possibly reducing the purchase of cigarettes by adults,
this proposal would a§ord children and teens greater shelter from a toxic product.
The New York Times reported on March of 2013 that the Village of Haverstraw, NY,
passed a similar ban in 2012, but rescinded the law because it had insu¢cient resources to
Öght a legal challenge presented by convenience stores and tobacco manufacturers.
Tobacco retail displays are a unique marketing mechanism. Universally these displays
form a ëpower wallí at the point of payment. Tobacco sales carry a high margin for vendors,
and manufacturers have feared losing their right to display their products in this way (Harper,
2005). These retail displays are distinguished from other point-of-sale marketing techniques
by their scale, their ubiquity and permanence. Numerous studies examine the impact on
sales of product- and brand-speciÖc promotions (for example, Gedenk and Neslin, 1998).
The tobacco power walls however form a marketing mechanism both for individual brands
and tobacco as a whole.
The purpose of this paper is to investigate the e¢ciency of such a deterrent measure, using
data from Canadaís provinces. A precisely similar measure was implemented at di§erent
2

points in time in each of Canadaís Provinces in the most recent decade. The annual Canadian
Tobacco Use Monitoring Surveys (CTUMS) contain a wealth of information. They contain
the responses to monthly interviews with twenty thousand individuals each year on their
smoking habits, and are available from 1999 to the present time. Since the interview month
is reported in the data, and given that the month and year during which the retail display
bans were introduced vary by province, these data provide an ideal opportunity to examine
whether bans of the type proposed for New York may be e§ective either at the extensive
margin - in reducing smoking participation, or at the intensive margin - in reducing the
number of cigarettes smoked per person per week, or indeed whether they induce people to
adopt an intention to quit.
Measures of this type have been operative for a number of years. Both England and
Wales adopted bans for large retail outlets in 2012, and corner stores will be required to
adhere to the ban by 2015. Scotland introduced such a measure for large stores in 2013;
smaller stores will become subject to the ban in 2015. Singapore, at the time of writing,
is preparing for a public discussion on the introduction of the measure. Several states in
Australia have adopted bans (Ash, 2012). Ireland joined the club in 2009 (Cancer Research,
2009); Norway joined in 2012; Iceland was an early adopter in 2001. In sum, display bans
are operative in numerous jurisdictions, and the key question for policy makers is whether
such bans are e§ective in changing behavior, and if they are, to what degree.
The existing research on display bans contains few, if any, population-based econometric
studies. This is partly because the measures are relatively new in most economies, and partly
because the survey data necessary for the analysis is sparse. In particular, only one of the
above economies (Australia) has a federal structure that permits bans to be implemented
in a decentralized (and hence asynchronous) manner, which improves the possibility of be-
ing able to Önd some signals in the data. Most studies that have addressed the potential
e§ectiveness of these bans have asked individuals if they approve of the measures, or if they
think the measures should be helpful in quitting, or if individuals exposed to marketing make
3

respondents more susceptible to smoking. The very large samples that are available through
the CTUMS makes it possible to investigate if the bans have actually deterred smoking or
have reduced the intensity of smoking.
Being able to measure the impact of speciÖc policy measures on actual smoking behavior,
rather than beliefs about the e§ectiveness of bans, has assumed greater importance in view
of a recent ruling in the District of Columbia Court of Appeals in 2012: A federal judge ruled
in favor of tobacco manufacturers in their objection to the Food and Drug Administrationís
proposals to require graphic health warnings (GHWs) on cigarette and tobacco packaging in
general. The Court was not satisÖed with the results from ëattitudinalí studies, and ruled
that the FDA had provided ìnot a shred of evidenceî that the introduction of GHWs would
reduce the number of American smokers (Huang, Chaloupka and Fong, 2013). These authors
also provide a timeline for this ruling. At the end of the day, the Court was not satisÖed with
distal attitudinal evidence, and its ruling was based on the lack of solid proximate evidence
on the impact of that measure on smoking prevalence. In the absence of such evidence the
Court ruled that the First Amendment rights of the tobacco manufacturers would be violated
by the GHWs proposed by the FDA under a section of the 2009 Family Smoking Prevention
and Tobacco Control Act. This precedent set by the Court suggests that if RDBs are to
be put in place in the US, solid evidentiary Öndings on their impact on actual behaviors in
other economies could be critical.
The paper proceeds as follows. In the next section, we review the relevant literature.
Section 3 describes the timeline of RDB adoption across provinces in Canada, the empirical
methodology that can exploit such variation in adoption dates, and the implication of the
presence in the market of contraband tobacco for our estimation. Section 4 describes the
data source. Section 5 presents the main results and robustness checks. Section 6 o§ers a
discussion and concludes.
4

2 Existing literature and approaches
The results that emerge from many of the public health studies on RDBs (also termed point-
of-purchase (PoP) bans) are suggestive rather than conclusive. For example, McNeill et al
(2010) found that vendor compliance to PoP bans was high in Ireland, that support for the
law grew post implementation, and that interviewees thought it would be easier to quit as
a result of the display ban law being enacted. But they found no evidence of signiÖcant
short-term prevalence changes among youth or adults. Yet the article concludes positively:
ìthere were encouraging signs that the law helped to denormalize smokingî. Using the same
data, Quinn et al (2011) found that no statistically signiÖcant change in sales during the
twelve months following the introduction of the display ban. The interesting conclusion
drawn by the authors is that a change in behavior should not be observable in the near term:
ìThe removal of point of sale displays is aimed at reducing the pernicious e§ects of tobacco
advertising on children and is therefore likely to have an impact on sales over a much more
protracted time period.î1 Sche§els and Ravik (2011) used Norwegian data. Focus group
interviews were carried out before and after the ban among smokers and non-smokers. Be-
havior changes are not recorded, and the article concludes ìConsumers believed that the ban
could contribute to preventing smoking initiation among young people and to some extent
also support cessation e§orts.î Hoek et al (2009) interviewed 20 individuals in depth fol-
lowing the implementation of the ban in New Zealand. They write: ìparticipants strongly
supported banning tobacco retail displays primarily because they thought this would reduce
youth initiation, promote greater consistency with smoke-free promotions and assist those
attempting to quit.î Brown et al (2011) followed several thousand smokers in Canada be-
tween 2006 and 2009. They found strong support among smokers for the ban, and concluded
that ìthe implementation of tobacco control measures, such as the removal of tobacco dis-
plays, appear to sustain support among smokers, those most likely to oppose such measures.î
1Such a strong conclusion might suggest that any signiÖcant positive near-term impact recovered througheconometric analysis might spurious. We do not share this perspective.
5

Clattenberg et al (2012) focus upon unplanned purchases of cigarettes, given that these may
be triggered by displays. They interviewed 301 Vermont smokers immediately after their
tobacco purchases, and found that 11% of cigarette purchases were unplanned, with 31%
of total buyers agreeing that point-of-sale-advertising made quitting more di¢cult. Con-
sequently the authors conclude that ìReducing unplanned purchases prompted by tobacco
point of sale advertising could improve the likelihood of successful cessation among smok-
ers.î WakeÖeld et al (2008) report a similar Önding. These authors do not state that there
is no guarantee that if a smoker forgets to buy cigarettes as a result of no PoP promotion,
he or she may still purchase cigarettes at another retail outlet before exhausting his or her
stock. Hence, a Önding such as this provides little guidance as to whether actual prevalence
or number of cigarettes smoked decline in response to PoP bans.
A second characteristic of this literature is that the statistical work su§ers from several
inference-related issues. One is endogeneity. Several studies (e.g. MacFadyen, Hastings
and MacIntosh (2001) Önd that teens who possess promotional materials from cigarette
manufacturers are more likely to smoke than students who do not. But the possession of
such materials could equally well be an outcome rather than a cause of smoking. A second
is measurement. For example, Sargent et al (2002) correlated susceptibility to smoking on
the part of middle-school students with the number of exposures to cigarette messages in
movies. The number of messages is the product of movies watched times messages per
movie. But the causation could either be attributable to the intensity of tobacco messages
per movie or to the number of movies watched. A third problem relates to unobservables.
For example Henriksen, Feighery et al (2004) Önd that students who are more exposed to
promotion and messaging in corner stores are more susceptible to smoking than students
who are less exposed. Again this exposure measure might indeed capture the impact of the
amount of promotion, but equally may reáect individual type - teens who tend to ëhang outí
in corner stores may be a personality type more likely to smoke. A widely cited review of
this literature (Paynter and Edward, 2009) presents a favorable perspective on RDBs, but
6

it does not venture into the speciÖcation of models or the possibility that the conclusions
o§ered in the articles reviewed may be consistent with more than one hypothesis.
In contrast to this literature there exist a number of econometric studies that focus on
particular subgroups of the general population. For example, Harris et al (2014), Adams
et al (2012 ) or Abrevaya (2006) focus upon the impact of tobacco use and tobacco con-
trol measures on birth outcomes and behavior during pregnancy. However, we can Önd no
econometric studies on the e§ectiveness of RDBs whose focal point is the general popula-
tion. There appears to be no large data base available apart from the CTUMS that enables
treatment and control groups to be formed with actual behaviors as the outcomes.
3 Empirical Methodology
3.1 Cigarette Display Bans in Canada
Table 1 shows the dates when the RDB legislation was introduced in Canadaís provinces.
Substantial variation characterizes the timing of the law. The ban Örst came into e§ect in
Saskatchewan in October 2002 and remained operative until March 2004 when it was chal-
lenged successfully by the tobacco manufacturers. The ban was reinstated in Saskatchewan
by a higher-court order in January 2005.2 After Saskatchewan, all of Canadaís provinces
implemented the ban: Manitoba (October 2005); PEI (June 2006); Nova Scotia (December
2006); Ontario and Quebec simultaneously (May 2008); Alberta and British Columbia (July
2008); New Brunswick (January 2009) and Newfoundland (January 2010). Compliance to
the laws would seem to be universal. In contrast to regulations such as the prohibition of
sales to minors, where veriÖcation is more di¢cult, veriÖcation of the banning of retail dis-
plays is immediate and simple. Cohen et al (2011) indicate that their survey of retail outlets
yielded a 99.8% compliance rate.
2In the regression analysis, our policy variable is switched on and o§ to match these sub periods.
7

3.2 Di§erence-in-Di§erences Design
To estimate the causal e§ect of the display bans, we employ the di§erence-in-di§erences
(DD) methodology that exploits the variation in the timing of the law coming into e§ect
across Canadian provinces, as noted in Table 1. The DD method is often used to evaluate
the treatment e§ect of a medical or policy intervention on a subset of groups.3 It explicitly
accounts for variations in treatment across groups and over time by calculating the change
over time for each group (the Örst di§erence) and then subtracting the resulting change
in the control group from the treatment group (the second di§erence). The control group
in our study is composed of those years and months of data in provinces prior to the ban
implementation; the treatment group is the complement of this.
As long as the treatment and control groups are a§ected by time-varying confounding
variables in a similar way, the DD estimates will reáect the e§ect of the legislation. Formally,
we estimate a DD regression of the following form, for individual i in year t in province p:
Yipt = % + &(DisplayBan)pt +X0ipt/+ 0p + 1t + 2ipt (1)
Y indicates outcome variables; DisplayBan is the di§erence-in-di§erences indicator variable
of interest, equal to one if the individual is in a province and a time period when the law is
e§ective, and zero otherwise; & represents the di§erence-in-di§erences estimate of the e§ect
of the legislation; The interpretation of the policy coe¢cient is the change in the outcomes
following the policy, compared to the pre-policy period and to the provinces with no bans in
place. X is a vector of control variables that include individual characteristics (education,
gender, marital status, etc.). The time e§ects 1 include monthly dummies (there are 11
month dummies which control for seasonal e§ects) and yearly dummies (which control for
year speciÖc unobserved factors and shocks). The province-speciÖc Öxed e§ects 0 control for
3Classic studies on the di§erence-in-di§erences methodology include Rubin, 1974; Meyer, 1995; Atheyand Imbens, 2006, among others. For recent studies that use the di§erence-in-di§erences method in thehealth domain, see for example, Currie et al. (2009), Cutler et al. (2010) and Carpenter et al. (2011).
8

time-invariant di§erences across provinces (such as smoking cultures, levels of spending on
healthcare, etc.).
The DD technique assumes that the trends in the smoking outcomes for both the treated
and control groups would be the same in the absence of the legislation. We will examine
and explicitly control for any di§erences in the trends before the legislation by including
province-speciÖc linear and quadratic time trends.
3.3 The Problem of Contraband Product
While the CTUMS that we use in this paper form a detailed month-to-month description of
smoking behaviors across the economy, the behaviors reported are subject to the ináuence of
illegal tobacco products.4 Illegal product accounts for almost one quarter of the total market
in many developed economies. This is the estimate of West et al. (2008) for the UK for
example. Even in the US, where tobacco taxes have been low historically, there are concerns
about the possible growth in supply from Indian reservations in the face of recent dramatic
increases in state taxes. At the time of writing, a pack of cigarettes costs around $10 in New
York City and this has given rise to legal disputes over the treatment of reservation sales
(Tobacco Free Kids, 2009).
Although the presence of illegal products in the Canadian market does not distinguish it
4Illegal tobacco is a world-wide phenomenon. Many developed economies have seen an enormous tax-induced wedge open up between unit production cost and the legal retail price. For example, in Canadawhere most of the illicit product comes through First Nations reserves, zip-lock bags of 200 cigarettes sellfor between $10 and $20 to the end user, and still yield substantial proÖts to the vendors (Royal CanadianMounted Police, 2011). This translates into a price per pack to the smoker of between $1 and $2, comparedto a retail price in the legal market in the neighborhood of $10.Evidently, at such low prices, cigarettes are cheap to produce and distribute, and organized gangs see this
product as being as proÖtable as drugs such as cocaine, heroin or marijuana, but tra¢c in cigarettes (andmarijuana) carry lower penalties than the ëharderí substances (Easton, 2004).Internationally, certain economies appear to turn a blind eye to the existence of production facilities set
up domestically that are geared to supply an illegal overseas market. These cigarettes are referred to asëillicit whitesí. An example of this is a brand called ìJin Lingî; it is produced in a Russian tax-free zone(Kaliningrad). Other examples are ìRaquelî from Cyprus and ìRichmanî from the United Arab Emirates(Joossens and Raw, 2011). A variant of this behavior involves established legal producers in the Westexporting product, duty free, knowing that it will be imported illegally elsewhere. Joossens and Raw reportthat the magnitude of this particular form of contraband has declined as a result of investigations of, andlawsuits against, manufacturers.
9

from most other tobacco markets in the modern era, its presence has signiÖcant consequences
for data analysis. First, the price of the cigarette aggregate, as registered by an o¢cial
price index, may vastly overstate the price that consumers are paying at times when the
illegal product accounts for a large share of the market. Second, individuals who actually
purchase the illegal product are less likely to report their behaviors truthfully in surveys.
The consequence of the Örst problem is that the o¢cial price series is biased upwards for
those time periods when illegal sales are signiÖcant. This errors-in-variables problem may
result in biased coe¢cient estimates (Wooldridge, p. 318, 2009). The consequence of the
second problem is that total sales of cigarettes ñ as measured by consumer responses - will
be biased downwards by more than the normal degree.5
The extent to which these two problems a§ect the coe¢cient estimates on the display
bans also depends upon the correlation between the timing of peak illegal sales and the
behavior of the key variable in our analysis ñ the implementation dates of the display bans.
Figure 1 describes the pattern of illegal sales we have estimated for the Canadian market
using a fairly standard method described in Physicians for a Smoke-Free Canada (2011). In
essence we compute an estimate of the total market by assuming there is no illegal product
in the early years and then use surveys to predict total sales, legal and illegal, in future years
by ináating survey responses. From this total we subtract legally-reported sales to yield the
illegal market share as a residual.
A critical aspect of Figure 1 is that it indicates illegal sales were at their peak at the
time display bans were introduced in Quebec and Ontario (see table 1 above) ñ markets
which together account for a substantial share of the total market. Since artiÖcially higher
prices and the illegal share are at their maximum at a time when the retail display bans
were introduced in these markets, we cannot be sure that our models will correctly attribute
causation.5Smokers ënormallyí under-report their consumption; but the magnitude of this under-reporting can be
estimated by ináating survey responses to represent the population, and by comparing the result with legalshipments data.
10

Two solutions to this collinearity cum errors-in-variables combination suggest themselves:
one is to use data up to the beginning of the contraband problem (roughly 2005); the second
is to exclude those provinces where contraband was most serious. Quebecís MinistËre de la
SÈcuritÈ Publique (2011) proposes that virtually the complete contraband problem for all
years is conÖned to Quebec and Ontario. Accordingly, our primary strategy is to estimate
the DD models for eight of Canadaís ten provinces using data for all thirteen years of the
survey. We also estimate the models up to and including the year 2005 for all provinces.
The latter is a weaker approach because the identiÖcation of the ban e§ects hinge essentially
on two provinces ñ Saskatchewan (which introduced the ban in 2002, then shelved it and
re-imposed it in 2005 following a successful court ruling), and Manitoba, which implemented
the ban midway through 2005.
4 Data and Descriptive Analysis
The Canadian Tobacco Use Monitoring Surveys interview people aged 15 and above and
provide the most comprehensive data on tobacco use by Canadians. Our analysis employs
all CTUMS cycles available, from 1999 to 2011 for eight of the ten Canadian provinces.
These cross sectional surveys have a number of nice features that make them well suited for
this analysis. First, the CTUMS are available for the years before and after the ban, thus
facilitating the application of the DD methods. Second, they report the month associated
with each interview, so we can identify the period before and after the policy at the monthly
level. Third, since its lowest admissible age is 15, we can study the e§ect of display bans
on both youth and adult groups separately. This is valuable given that part of the public
health push for display bans is premised on the idea that, in addition to reducing unplanned
purchases, young smokers and young potential smokers grow up seeing that smoking is a
ënormalí activity. Fourth, the CTUMS have rich information on smoking behaviors ñ not
only on participation, but also on intensity and quit intentions. This allows us to study a
11

variety of potential policy impacts.
Our analysis focuses on three outcome variables: (i) an indicator of whether a person
currently smokes; (ii) the number of cigarettes smoked weekly by a smoker; and (iii) whether
the person intends to quit in the next 1 and 6 months.
Table 2 displays the characteristics of the CTUMS data used in our analyses. 20% of our
sample consists of current smokers. Among those who smoke, the reported average number
of cigarettes consumed per week is 69, about 10 per day. The average age is 44, with youngest
age being 15 and oldest respondents being 95. 61% of the sample has secondary education or
lower or is still in school, while 17% has a college degree and the remaining 22% a university
degree. The survey deliberately oversamples youth, but we use weighted observations in all
of our estimations. About 1/4 of the sample are single. Household size averages 3 persons.
89% of the sample speaks English and 2% uses French while the rest use other languages.
95% of the sample can speak either French or English. Males account for 50% of the sample.
The trends in participation and number of cigarettes smoked per smoker, for each province,
are presented in Figures 2 and 3. The vertical lines denote the times at which RDBs were
introduced. These unconditional graphics do not immediately suggest breaks in behavior.
5 Regression Results
5.1 Baseline Estimates
5.1.1 E§ect on smoking participation
The e§ect of the RDB on smoking prevalence is reported in table 3. Column 1 displays
estimates from the base line regression using the strategy described above ñ the sample for
eight provinces for the period 1999-2011. All regressions include month and province Öxed
e§ect variables, though we do not report the associated coe¢cients. The policy coe¢cient
estimate is interpreted as the change (in percentage points) in the probability of smoking
12

following the policy in the adopting province, relative to the period before the display ban
adoption and relative to the provinces where the ban had not yet become e§ective. The
coe¢cient estimates indicate that the ban has no detectable impact on smoking participation:
the numerical value is small (circa 0.001) and not statistically signiÖcant.6 Other covariates
have expected signs: the age variable has an inverted U-shape; compared with the omitted
education category of less-than-secondary schooling, people of higher education are less likely
to smoke; married people or those living in common law are less likely to smoke, while those
who are separated are the opposite; those who speak either English or French are more likely
to be smokers than those who use other languages; men are more likely to smoke than women
and those who live in larger households are less likely to smoke.
As the DD regressions assume the trends in outcomes across provinces are similar, in
the next 2 columns we include the province-speciÖc linear time trends in the regressions (in
column 2) and quadratic trends (column 3) to control for the potential di§erences in time
trends across provinces. The trends are almost invariably negative, and where the quadratic
term is included it is generally positive, indicating that the rate of participation decline slows
down. Surprisingly, the price variable does not have a signiÖcant impact in this regression.
This may be because prices truly are not signiÖcant in ináuencing participation, or because
they have a strong common trend during the period 2000-2005.7 To test the degree of
collinearity between province-level prices and time trends we regressed the real cigarette
price in each province against time and time squared.8 As anticipated, the coe¢cient on the
linear term was positive; it was also signiÖcant in every case. The coe¢cient on the quadratic
6Recent econometric literature has drawn attention to the issue of underestimated standard errors inestimation that involves clustered data (see, Moulton, 1990; Bertrand et al. 2004). Among recommendedremedies to this problem, Donald and Lang (2007) proposed to use t-distribution with G $ L degrees offreedom rather than the standard normal distribution for inference, where L is the number of repressors thatare invariant within clusters. In particular, for the case of few G clusters such as ours (i.e. G=8 provinces),Cameron and Miller (2010) suggested using t-distribution with at least G $ 1 degrees of freedom. MonteCarlo simulations by Cameron, Gelbach, and Miller (2008) suggest that this technique works reasonablywell. We will follow this approach and use t-distribution with G$ L degrees of freedom for inference.
7We say common trend because cigarette taxation is a shared federal-provincial jurisdiction, and changesin federal excise tax rates usually trigger a responsive increase in provincial taxes.
8These results are available upon request.
13

term was negative and signiÖcant in every case. This pattern corresponded to expectations
given that virtually all of the price increase in every province took place between 2000 and
2005. The R-squared varied between 0.85 and 0.95. Ultimately we are not concerned with
the precise value of the price elasticity provided that the treatment of the price variable does
not contaminate the coe¢cient on the display ban.
5.1.2 E§ect on smoking intensity
The second set of regressions examines the impact of the ban on smoking intensity measured
by the log of the number of cigarettes smoked per week. For this analysis we use the
subsample of smokers only. Therefore, the policy coe¢cient is the percentage change in the
number of cigarettes smoked per week as the result of introducing the RDB. We also estimate
these regressions using OLS, which means that this analysis is equivalent to a second-stage
estimation of a traditional two-stage smoking model. It is worth mentioning that because
the ban did not change the composition of who smokes, as shown in the previous section,
there is no compositional bias for the estimates from these intensity regressions.
The results are reported in Table 4. The coe¢cient on the policy dummy from the baseline
regression reported in column 1 is negative but small (-0.04) and statistically insigniÖcant.
All other covariates carry signs and statistical signiÖcance levels that are consistent with
their values in the participation equation.
The second and third columns of this table furnish estimates from regressions that include
province-speciÖc time trends. The display ban e§ects become larger in magnitude (from -
0.04 to -0.05 and -0.08) but are still not statistically signiÖcant. In contrast to the result
in the participation regression above, the price coe¢cients become larger and statistically
signiÖcant, indicating that higher prices lead to lower smoking intensity.
14

5.1.3 E§ect on quit intentions
Table 5 contains estimates associated with a 6-month ahead quit intention variable. The
CTUMS ask interviewees two questions on quit intentions: if smokers intend to quit within
the coming month, and if they intend to quit in the coming six months. In these regressions
our samples are composed of all smokers, again estimated without time trends and then with
linear and quadratic terms included. Once again we can detect no evidence of the ban having
an impact on quit intentions. While the coe¢cient is negative in all of the six regressions,
in no case is it signiÖcant.9
5.2 Robustness Tests
5.2.1 Choice of estimator
To test if the DD approach might yield results contrary to a qualitative choice estimator
we reran the participation regression using a probit model, in conjunction with a dummy
variable for the display ban. The results failed to reject the null hypothesis of no ban impact.
The coe¢cient values (reported in the upper panel of table 6) were very small and close to
those returned from the DD estimates and not signiÖcant (except for the regression with a
quadratic trend included).
5.2.2 Using quit attempts instead of quit intentions
We estimated the models using actual quit attempts instead of quit intentions as the outcome.
Quit attempts represent a stronger form of quitting e§orts than quit intentions and are an
indicator of smoking cessation or relapse among those who have recently tried to quit. As quit
attempts may be related to unplanned purchases, a mechanism through which a display ban
might a§ect smoking behavior, they may capture better the e§ect of the display on smoking
behavior. As quit attempts are count variables with many zero values, we modelled this
9The ësixí regressions include the 1-month ahead quit intention as well as the 6-month ahead. The formerare available from the authors upon request.
15

outcome using the zero ináated negative binomial estimator. The results indicate that the
ban did not lead to an increase in the number of quit attempts, nor increase the probability
of having any 24-hour quit attempt.10
5.2.3 Excluding smuggling period
We estimated the models up to and including the year 2005. As there was little smuggling
before this year, this supports including all ten provinces in the regressions. A disadvantage
of this exercise is that the identiÖcation of the ban e§ects hinges essentially on two provinces
ñ Saskatchewan (which introduced the ban in 2003, then shelved it and re-imposed it in 2005
following a successful court ruling), and Manitoba, which had the ban in place for half of
2005. The results are reported in the second panel (for participation outcome), the third
panel (for intensity outcome) and the Önal panel (for quit intention outcome) in table 6. The
display ban coe¢cients are small and not statistically signiÖcant.
5.2.4 E§ects on di§erent age groups and smoking statuses
Although the e§ect of the ban on smoking participation for the whole population appears
insigniÖcant, it might still impact some speciÖc age groups. Media and policy discussions
often suggest that youth would be less likely to smoke in the absence of tobacco displays. To
explore this, we re-estimated the regressions for several speciÖc age groups, focussing upon
youth (15-24), prime age (25-64) and older (65+) smokers.
The top panel of table 7 displays estimates from the participation regression. In all three
speciÖcations, the display ban coe¢cients are small and statistically insigniÖcant for each
age group. The middle panel reports estimates for the intensity regressions. The display
ban is negative in all three age groups, and we Önally encounter a negative and signiÖcant
coe¢cient - for the youngest age group 15-24. However, this e§ect is not invariant to the
10These results are available upon request. The output of a zero ináated negative binomial regressionhas 2 sets of coe¢cients: the Örst set of coe¢cients is from the equation predicting counts for the ìpositiveoutcomeî group. The second set of coe¢cients is from the equation that predicts membership in ìzerooutcomeî group. These can be interpreted as logit coe¢cients.
16

inclusion of province-speciÖc time trends. Estimates for the quit intention regression are
reported in the bottom panel of table 7. Again, the display ban has no signiÖcant e§ect on
quit intentions for any age group. The display ban coe¢cients are either positive (though
small and statistically insigniÖcant) or have the wrong sign.
Since the impact of RDBs on youth may depend upon whether young smokers obtain
their tobacco legally or not, we reestimated the above set of equations for those individuals
above the legal age limit. Those aged 16, for example, may obtain their tobacco from friends
and thus not be subject to the impact of point-of-sale marketing. When the age of 18 is used
as a cut-o§ we found no impact of the RDBs on participation, but found a positive impact
on intensity in most, though not all, of the regressions. Also, since the legal age of smoking
is 19 in some provinces, we used the corresponding subset of provinces to reestimate the
equations. Ontario has a legal age of 19, though has large illegal sales in some years. So
we explored the impact both including and excluding Ontario. When Ontario was excluded
the RDBs were found, as before, to impact intensity but not participation. When Ontario
was included the intensity e§ect disappeared. Some signiÖcant impacts on intentions were
present. In summary, the bans may have impacted the intensity of legal youth smoking,
though not the participation rates.
5.2.5 Occasional and daily smokers
As occasional and daily smokers might behave di§erently in response to the ban, we re-
estimate the DD regressions for these two separate smoker groups. Intensity outcomes are
reported in the upper panel of table 8, and indicate that bans have no e§ect on either of
these two groups of smokers. Neither does the display ban impact smoker quit intentions:
as shown in the lower panel of table 8, the coe¢cients on the display ban are small and
statistically insigniÖcant.
17

6 Concluding Remarks
Our objective in exploring the impact of retail tobacco display bans has been to see if a
population-based econometric study might shed light on actual behaviors following the in-
troduction of such bans. They have been introduced in several jurisdictions and a large
literature in the public health Öeld supports such bans. Many of these studies are ëattitudi-
nalí: they are based upon data describing how smokers and nonsmokers feel about the bans.
For example, do they ëbelieve the bans are goodí, or that the bans should ëhelp smokers quití,
or ëdenormalize smoking for minorsí? Some of these studies also lend themselves to being
interpreted in more than one way because of problems associated with the speciÖcation of
variables and the models. Other econometric studies that do Önd signiÖcant impacts (both
small andlarge) aim at particular subpopulations, such as pregnant women.
Consequently, the current study may be the Örst of its type, and while the data base used
is ideal for confronting the question at hand, we Önd no systematic support for a signiÖcant
impact of the bans on participation or quit intentions, and just limited support (among
youth) for a reduction in intensity. Our Öndings were invariant to a number of robustness
checks. In particular, province speciÖc time trends were included in most of our regressions
in order to capture the impact of changes in culture, and the impacts of whatever other
economic and societal changes took place during this period (for example the implementation
of public-place smoking bans). Time trends frequently deprive the coe¢cients of interest of
signiÖcance, if the two are correlated. This is not the case in our analysis. In virtually
all regressions, whether a time trend was included or not, the RDB coe¢cient was largely
una§ected. Hence the RDB impacts are not being swept up by the time trend.
That said, the hypotheses we have tested warrant some ampliÖcation. Our study focused
on investigating an immediate signiÖcant break in behaviors, not a lagged break at say three
months, or six months, or some other number of months. Such testing for an immediate
break possesses several merits. First, in the absence of reasonable priors or theory on how
long lags should be, one could test numerous lag structures and perhaps one such structure
18

might enable us to reject the null for some behaviors; but the statistical meaning of such an
approach is not obvious. Second, the theory suggests that the break should be immediate for
a large class of smokers. A repeated claim in the public health literature is that display bans
trigger the memory of potential buyers ñ and the absence of the trigger means that many
unplanned purchases that would have been concluded in the presence of the display are no
longer made. We emphasized in the introduction that it is incorrect to infer that smoking
would necessarily decline in the absence of the display trigger - an individual who is not
prompted to purchase cigarettes by the absence of a RDB may still remember to purchase
his or her cigarettes before exhausting their stock. Third, a majority of smokers at any given
time intend to quit. In view of this it is reasonable to think of policy measures as ëtippingí
event. That is, they help individuals who have in a particular sense already decided to quit,
to make the transition. And it is reasonable to expect a new policy measure in that context
to have an impact right away, or not at all. Having said that, just as our results suggest
no participation impact, it is possible that the bans may still contribute to a longer term
denormalization of tobacco use which could in turn impact participation. Measuring such
an impact remains a challenge.
Finally, the literature in this area is very short on evaluating and trading o§ the value
of reductions in participation and intensity. Quitting has always been the main objective of
public health advocates. However, the appropriateness of focussing on participation to the
virtual exclusion of reduction supposes a particular form for the damage reduction function:
that it is concave. A strongly concave damage function in the number of cigarettes smoked
implies that participation becomes overwhelmingly important, whereas reducing intensity at
most levels of consumption has small value: technically, going to zero cigarettes from a small
number has substantial value. A convex damage function implies the opposite - reducing
intensity is all important, particularly for heavy smokers, whereas reducing consumption
from a low intensity to zero has modest value. Hence, being able to trade o§ Öndings of
the type we have supplied in this paper begs the nature of the damage function in the Örst
19

instance, and the impact of these measures on heavy and low intensity smokers on the other.
Much remains to be established in this area.
20

Table 1. Timeline of display bans in Canada
Province Display ban in e§ectSaskatchewan Oct 2002 - Mar 2004
19 Jan 2005*Manitoba 15 Aug 2005PEI 1 Jun 2006Nova Scotia 1 Dec 2006Ontario 31 May 2008Quebec 31 May 2008Alberta 1 Jul 2008British Columbia 1 Jul 2008New Brunswick 1 Jan 2009NFL 1 Jan 2010* http://www.mhp.gov.on.ca/en/smoke-free/factsheets/Tobacco_PointOfSale-041505.pdf
21

Table 2. Summary statistics
Variable Mean Std. Dev. Min Max ObsCurrent smoker status 0.196 0.397 0 1 218,479Weekly quantity of cigs 68.931 68.837 0 630 57,631Log weekly quantity 4.165 1.101 0 6.44 43,293Age 43.888 18.025 15 95 218,479Less than secondary 0.207 0.405 0 1 215,445Secondary 0.402 0.490 0 1 215,445College 0.167 0.373 0 1 215,445University 0.224 0.417 0 1 215,445Married/common law 0.622 0.485 0 1 216,778Widowed/separated 0.106 0.307 0 1 216,778Single 0.264 0.441 0 1 216,778Male 0.496 0.500 0 1 218,479Hhsize 2.868 1.255 1 9 218,479French 0.023 0.149 0 1 216,932English 0.890 0.312 0 1 217,391Notes: CTUMS 1999-2011; Sample contains 8 provinces (excluding Quebec and Ontario)
22

Table 3. E§ect of display ban on smoking participation
(1) (2) (3)Baseline (1) + Linear trend (2) + Quadratic trend
Display ban 0.0011 0.0007 0.0016(0.0036) (0.0033) (0.0037)
Price (in log) -0.0436 0.0197 0.0220(0.0323) (0.0144) (0.0213)
Age 0.0130*** 0.0130*** 0.0130***(0.0010) (0.0010) (0.0010)
Age squared -0.0002*** -0.0002*** -0.0002***(0.0000) (0.0000) (0.0000)
Secondary school -0.0514*** -0.0514*** -0.0514***(0.0053) (0.0053) (0.0053)
College -0.0960*** -0.0960*** -0.0960***(0.0102) (0.0102) (0.0102)
University -0.1813*** -0.1815*** -0.1816***(0.0149) (0.0148) (0.0149)
Married/common law -0.0528*** -0.0527*** -0.0527***(0.0028) (0.0027) (0.0027)
Widowed/separated 0.0443*** 0.0443*** 0.0443***(0.0104) (0.0103) (0.0103)
French 0.0234* 0.0228* 0.0231*(0.0108) (0.0106) (0.0105)
English 0.0686*** 0.0683*** 0.0685***(0.0064) (0.0063) (0.0063)
Male 0.0350*** 0.0350*** 0.0350***(0.0016) (0.0016) (0.0016)
Hhsize -0.0148*** -0.0150*** -0.0150***(0.0022) (0.0021) (0.0021)
Constant 0.2743* 0.0466 0.0578(0.1293) (0.0584) (0.0808)
Observations 213,580 213,580 213,580R-squared 0.062 0.063 0.063Notes: Each column shows the results from a DD regression estimated by OLS. Data from 8
provinces (excluding Ontario and Quebec) for the period 1999-2011. All models include province,month, and year Öxed e§ects. Standard errors throughout are clustered at the province level andestimates are weighted. Inference uses t-distribution with 5 degrees of freedom. SigniÖcance levelsare: *** p<0.01, ** p<0.05, * p<0.1.
23

Table 4. E§ect of display ban on smoking intensity
(1) (2) (3)Baseline (1) + Linear trend (2) + Quadratic trend
Display ban -0.0440 -0.0506 -0.0833(0.0452) (0.0503) (0.0562)
Price (in log) -0.2607 -0.4402** -0.4563**(0.1558) (0.1428) (0.1605)
Age 0.0735*** 0.0735*** 0.0736***(0.0037) (0.0037) (0.0037)
Age squared -0.0007*** -0.0007*** -0.0007***(0.0000) (0.0000) (0.0000)
Secondary school -0.1536*** -0.1535*** -0.1535***(0.0134) (0.0133) (0.0132)
College -0.2823*** -0.2819*** -0.2815***(0.0352) (0.0352) (0.0351)
University -0.5947*** -0.5947*** -0.5948***(0.0312) (0.0313) (0.0309)
Married/common law 0.0427* 0.0423* 0.0421*(0.0204) (0.0203) (0.0204)
Widowed/separated 0.0927*** 0.0925*** 0.0925***(0.0224) (0.0226) (0.0225)
French 0.3225*** 0.3241*** 0.3246***(0.0598) (0.0601) (0.0604)
English 0.4766*** 0.4764*** 0.4772***(0.0385) (0.0389) (0.0390)
Male 0.2334*** 0.2332*** 0.2334***(0.0111) (0.0111) (0.0109)
Hhsize -0.0506*** -0.0504*** -0.0505***(0.0092) (0.0093) (0.0093)
Constant 3.3580*** 4.1269*** 4.2374***(0.6047) (0.5826) (0.6533)
Observations 42,487 42,487 42,487R-squared 0.1163 0.1165 0.1168Notes: Each column shows the results from a DD regression estimated by OLS. Data from 8
provinces (excluding Ontario and Quebec) for the period 1999-2011. All models include province,month, and year Öxed e§ects. Standard errors throughout are clustered at the province level andestimates are weighted. Inference uses t-distribution with 5 degrees of freedom. SigniÖcance levelsare: *** p<0.01, ** p<0.05, * p<0.1
24

Table 5. E§ect of display ban on intention to quit
(1) (2) (3)Baseline (1) + Linear trend (2) + Quadratic trend
Display ban 0.0049 0.0040 -0.0010(0.0218) (0.0225) (0.0234)
Price (in log) -0.0561 0.0237 -0.0530(0.0481) (0.0948) (0.0967)
Age 0.0013 0.0013 0.0013(0.0011) (0.0011) (0.0011)
Age squared -0.00005*** -0.00005*** -0.00005***(0.0000) (0.0000) (0.0000)
Secondary school 0.0218* 0.0220* 0.0220*(0.0097) (0.0096) (0.0096)
College 0.0686*** 0.0685*** 0.0684***(0.0154) (0.0155) (0.0154)
University 0.0492** 0.0493** 0.0494**(0.0204) (0.0204) (0.0203)
Married/common law 0.0493*** 0.0499*** 0.0500***(0.0101) (0.0103) (0.0104)
Widowed/separated 0.0553*** 0.0559*** 0.0557***(0.0146) (0.0149) (0.0148)
French 0.0761** 0.0756** 0.0764**(0.0312) (0.0309) (0.0308)
English 0.0915* 0.0913* 0.0915*(0.0428) (0.0427) (0.0427)
Male -0.0118 -0.0118 -0.0117(0.0086) (0.0086) (0.0086)
Hhsize 0.0090** 0.0088** 0.0088**(0.0031) (0.0032) (0.0032)
Constant 0.7283** 0.4562 0.6466(0.2172) (0.3964) (0.3939)
Observations 40,965 40,965 40,965R-squared 0.021 0.022 0.022Notes: Each column shows the results from a DD regression estimated by OLS. Data from 8
provinces (excluding Ontario and Quebec) for the period 1999-2011. All models include province,month, and year Öxed e§ects. Standard errors throughout are clustered at the province level andestimates are weighted. Inference uses t-distribution with 5 degrees of freedom. SigniÖcance levelsare: *** p<0.01, ** p<0.05, * p<0.1.
25
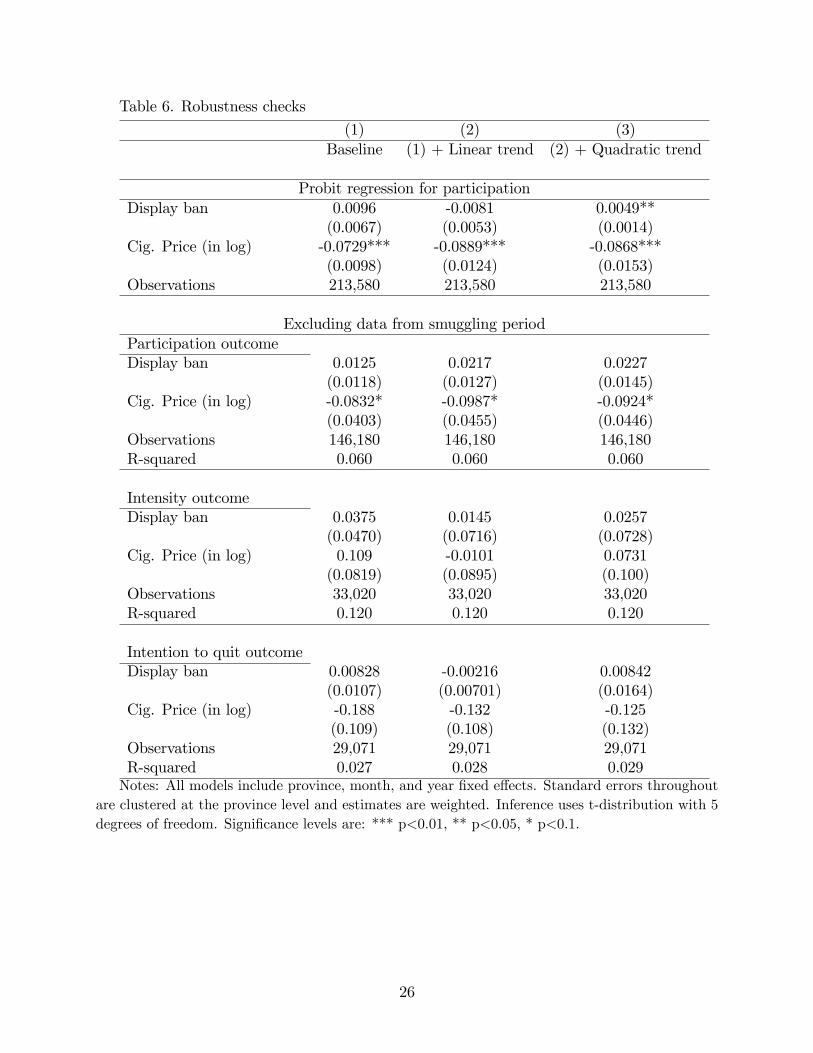
Table 6. Robustness checks
(1) (2) (3)Baseline (1) + Linear trend (2) + Quadratic trend
Probit regression for participationDisplay ban 0.0096 -0.0081 0.0049**
(0.0067) (0.0053) (0.0014)Cig. Price (in log) -0.0729*** -0.0889*** -0.0868***
(0.0098) (0.0124) (0.0153)Observations 213,580 213,580 213,580
Excluding data from smuggling periodParticipation outcomeDisplay ban 0.0125 0.0217 0.0227
(0.0118) (0.0127) (0.0145)Cig. Price (in log) -0.0832* -0.0987* -0.0924*
(0.0403) (0.0455) (0.0446)Observations 146,180 146,180 146,180R-squared 0.060 0.060 0.060
Intensity outcomeDisplay ban 0.0375 0.0145 0.0257
(0.0470) (0.0716) (0.0728)Cig. Price (in log) 0.109 -0.0101 0.0731
(0.0819) (0.0895) (0.100)Observations 33,020 33,020 33,020R-squared 0.120 0.120 0.120
Intention to quit outcomeDisplay ban 0.00828 -0.00216 0.00842
(0.0107) (0.00701) (0.0164)Cig. Price (in log) -0.188 -0.132 -0.125
(0.109) (0.108) (0.132)Observations 29,071 29,071 29,071R-squared 0.027 0.028 0.029Notes: All models include province, month, and year Öxed e§ects. Standard errors throughout
are clustered at the province level and estimates are weighted. Inference uses t-distribution with 5degrees of freedom. SigniÖcance levels are: *** p<0.01, ** p<0.05, * p<0.1.
26

Table 7. E§ect of display ban by age group
Baseline Linear trend Quadratic trend NParticipation outcomeAge 15-24 0.00686 0.00602 0.00478 101,303
(0.00968) (0.00948) (0.0102)Age 18-24 0.00658 0.00466 0.00323 65,526
(0.0113) (0.0112) (0.0128)Age 25-64 0.00160 0.00171 0.00621 88,368
(0.00332) (0.00388) (0.00535)Age 65+ -0.00454 -0.00450 -0.0126 23,909
(0.0103) (0.00932) (0.00719)Intensity outcomeAge 15-24 -0.0784* -0.0743* -0.0964** 21,029
(0.0339) (0.0370) (0.0290)Age 18-24 -0.102** -0.0926* -0.112** 16,894
(0.0366) (0.0394) (0.0295)Age 25-64 -0.0309 -0.0383 -0.0725 19,480
(0.0449) (0.0493) (0.0521)Age 65+ -0.110 -0.132 -0.149 1,978
(0.139) (0.151) (0.191)6 month quit intention outcomeAge 15-24 0.0207 0.0233 0.0360 20,667
(0.0219) (0.0231) (0.0209)Age 18-24 0.0208 0.0241 0.0405* 16,443
(0.0180) (0.0189) (0.0171)Age 25-64 0.00663 0.00344 -0.000809 18,312
(0.0274) (0.0286) (0.0346)Age 65+ -0.0796 -0.0702 -0.111* 1,986
(0.0478) (0.0422) (0.0492)Notes: Each column shows the results from a DD regression estimated by OLS. Data from 8
provinces (excluding Ontario and Quebec) for the period 1999-2011. All models include province,month, and year Öxed e§ects. Standard errors throughout are clustered at the province level andestimates are weighted. Inference uses t-distribution with 5 degrees of freedom. SigniÖcance levelsare: *** p<0.01, ** p<0.05, * p<0.1.
27

Table 8. E§ect of display ban, daily smokers versus occasional smokers
(1) (2) (3)Baseline (1) + Linear trend (2) + Quadratic trend
Intensity outcomeDaily smokers Display ban -0.0251 -0.0298 -0.0282N=34,415 (0.0267) (0.0286) (0.0387)
Price -0.122 -0.145* -0.0674(0.0649) (0.0690) (0.0940)
Occasional smokers Display ban -0.0359 -0.0414 -0.0571N=7,262 (0.0518) (0.0542) (0.0683)
Price 0.0307 0.156 -0.0202(0.158) (0.203) (0.310)
Quit intentionDaily smokers Display ban 0.00307 0.00228 -0.000393N=31,202 (0.0257) (0.0266) (0.0279)
Price 0.0107 0.0717 0.0299(0.0516) (0.105) (0.111)
Occasional smokers Display ban 0.00317 0.00318 -0.0132N=9,176 (0.0214) (0.0199) (0.0173)
Price -0.361** -0.215* -0.402**(0.104) (0.109) (0.128)
Notes: Each column shows the results from a DD regression estimated by OLS. Data from 8provinces (excluding Ontario and Quebec) for the period 1999-2011. All models include province,month, and year Öxed e§ects. Standard errors throughout are clustered at the province level andestimates are weighted. Inference uses t-distribution with 5 degrees of freedom. SigniÖcance levelsare: *** p<0.01, ** p<0.05, * p<0.1.
28

Figure 1: Trend in Illegal Sales Market Estimates
The vertical axis is the estimated percentage of the Canadian market for cigarettes ac-counted for by illegal cigarettes. Calculations by the authors follow the method used byPhysicians for a Smoke Free Canada (PSFC), 2011. The trends are obtained by assumingthat there was essentially no illegal product in the market in 2001, or 2002 or 2003. Thisassumption matches police reports, in this period of relatively low legal prices. For eachof these base years the authors establish a factor of proportionality between the quantityof cigarettes smoked economy wide on the basis of responses to the CTUMS on the onehand, and actual reported legal sales on he other. When such a factor of proportionatelyis applied to sales in the mid and later years of the decade a substantial gap is observedbetween reported legal sales and predicted total consumption. The di§erence is attributedto contraband product. This method is considered superior to measures based on policeseizures of illegal product, on account of the variability of the latter and also on account ofthe fact that seizures are recognized to represent just a tiny fraction of total contraband.
29

Figure 2. Monthly prevalence of smoking
30

3.00
4.00
5.00
6.00
Feb99
Dec06
Dec11
Nova Scotia 3.00
4.00
5.00
6.00
Feb99
Jun0
8Dec
11Ontario 3.00
4.00
5.00
6.00
Feb99
Jul08
Dec11
British Columbia 3.00
4.00
5.00
6.00
Feb99
Jun0
6Dec
11P.E.I
3.00
4.00
5.00
6.00
Feb99
Jan0
9Dec
11New Brunswick 3.00
4.00
5.00
6.00
Feb99
Jun0
8Dec
11Quebec 3.00
4.00
5.00
6.00
Feb99
Sep05
Dec11
Manitoba 3.00
4.00
5.00
6.00
Feb99
Oct02
Dec11
Saskatchewan
3.00
4.00
5.00
6.00
Feb99
Jul08
Dec11
Alberta 3.00
4.00
5.00
6.00
Feb99
Jan1
0Dec
11Newfoundland
Wee
kly
quan
tity
of c
igar
ette
s (in
log)
Year
Figure 3: Weekly quantity of cigarettes (in log)
31

References
% Abrevaya, J. 2006. "Estimating the e§ect of smoking on birth outcomes using amatched panel data approach." Journal of Applied Econometrics 21(4): 489-519.
% Adams, E. K., S. Markowitz, V. Kannan, P. M. Dietz, V. T. Tong and A. M. Malarcher.2012. "Reducing prenatal smoking: the role of state policies." American Journal ofPreventive Medicine 43(1): 34-40.
% Ash, 2012. http://www.ashaust.org.au/lv3/action_pos.htm
% Athey, S., and G. Imbens. 2006. "IdentiÖcation and inference in nonlinear di§erence-in-di§erence models.î Econometrica, 74(2), p431-498.
% Bertrand, M.; Duáo, E.; Mullainathan, S. 2004. ìHowmuch should we trust di§erences-in-di§erences estimates?î Quarterly Journal of Economics, 119(1), p249-275.
% Brown, A., C. Boudreau, C. Moodie, G. Fong, G. Li, A. McNeill, M. Thompson, L. Has-san, A. Hyland, J. Thrasher, H. Yong, R. Borland, G. Hastings, D. Hammond. 2011.ìSupport for removal of point-of-purchase tobacco advertising and displays: Findingsfrom the International Tobacco Control (ITC) Canada survey.î Tobacco Control, 2011,p555-559.
% Cameron, A., J. Gelbach, D. Miller. 2008. ìBootstrap-based improvements for infer-ence with clustered errors.î Review of Economics and Statistics, 90(3), p414-427.
% Cameron, D. and D. Miller. 2010. ìRobust inference with clustered data.î WorkingPaper Series # 10(6), Department of Economics, University of California, Davis.
% Cancer Research, 2009. http://www.cancerresearchuk.org/cancer-info/news/archive/pressrelease/2009-10-10-irish-display-ban
% Carpenter, C., S. Postolek and C. Warman. 2011. ìPublic place smoking laws andexposure to environmental tobacco smoke.îAmerican Economic Journal ñ EconomicPolicy, 3(3), p35-61.
% Clattenburg, E., J. Elf and B. Apelberg. 2012. ìUnplanned cigarette purchases andtobacco point of sale advertising: a potential barrier to smoking cessation.î TobaccoControl. doi:10.1136/tobaccocontrol-2012-050427
% Cohen, J., L. Planinac, A. Lavack, D. Robinson, S. OíConnor, and J. DiNardo. 2011.ìChanges in retail tobacco promotions in a cohort of stores before, during, and aftera tobacco product display ban". American Journal of Public Health, October 101(10),p1879-81.
% Currie, J., E. Hanushek, E. Kahn, M. Neidell and S. Rivkin. 2009. ìDoes pollutionincrease school absences?î Review of Economics and Statistics, 91(4), p682-694.
32

% Cutler, D., W. Fung, M. Kremer, M. Singhal and T. Vogl. 2010. ìEarly-life malariaexposure and adult outcomes: evidence from malaria eradication in India.î AmericanEconomic Journal: Applied Economics, 2(2), p72-94.
% Department of Health and Human Services (DHSS), Food and Drug Administration,21 CFR Part 1141 [Docket No. FDAñ2010ñNñ0568] RIN 0910ñAG41. ìRequiredwarnings for cigarette packages and advertisements.î Federal Register / Vol. 76, No.120 / Wednesday, June 22, 2011 / Rules and Regulations.
% Donald, S., and K. Lang. 2007. ìInference with di§erence-in-di§erences and otherpanel data.î Review of Economics and Statistics, 89(2), p221-233.
% Gedenk, K. and S. Neslin, 1998. ìThe role of retail promotion in determining futurebrand loyalty: its e§ect on purchase event feedback."Journal of Retailing, (75(4), p433-59.
% Harper, T. ìWhy the tobacco industry fears point-of-sale display bans." Tobacco Con-trol, 15(3), p270-71.
% Harris, J., A. Balsa and P. Triunfo. 2014. ìTobacco control campaign in Uruguay:Impact on smoking cessation during pregnancy and birth outcomes." National Bureauof Economic Research, Working paper 19878.
% Hoek, J., H. Gi§ord, G. Pirikahu, G. Thomson and R. Edwards. 2009. ìHow dotobacco retail displays a§ect cessation attempts? Findings from a qualitative study.îTobacco Control, 19(4), p334-337.
% Huang, F. Chaloupka and G. Fong, November 2013. ìCigarette graphic warning la-bels and smoking prevalence in Canada: a critical examination and reformulation of theFDA regulatory impact analysis.îTobacco Control, 2013;0:1ñ6. doi:10.1136/tobaccocontrol-2013-051170.
% McNeill, A., S. Lewis, C. Quinn, M. Mulcahy, L. Clancy, G. Hastings and R. Edwards.2011. ìEvaluation of the removal of point-of-sale tobacco displays in Ireland.î TobaccoControl, 20(2), p137-143.
% Meyer, B., 1995. ìNatural and Quasi-Experiments in Economics.î Journal of Businessand Economic Statistics, 13(2), p151-161.
% Moulton, B., 1990. ìAn illustration of a pitfall in estimating the e§ects of aggregatevariables on micro units. Review of Economics and Statistics, 72, p334-38.
% Paynter, J., and R. Edwards, 2009, ìThe impact of tobacco promotion at the pointof sale: A systematic review." Nicotine and Tobacco Research, 11(1): 25-35. doi:10.1093/ntr/ntn002.
% Physicians for a Smoke-Free Canada. 2011. ìEstimating the volume of contrabandsales of tobacco in Canada: 2006-2010.î December, Ottawa, Ontario, Canada.
33

% Quinn, C., S. Lewis, R. Edwards and A. McNeill. 2011. ìEconomic evaluation of theremoval of tobacco promotional displays in Ireland.î Tobacco Control, 20, p151-155.
% Rubin, D., 1974. ìEstimating causal e§ects of treatments in randomized and nonran-domized studies.î Journal of Educational Psychology, 66, p688-701.
% Sche§els, J. and R. Lavik. 2011. ìOut of sight, out of mind? removal of point-of-sale tobacco displays in Norwayî. Tobacco Control, doi:10.1136/tobaccocontrol-2011-050341
% WakeÖeld, M., D. Germain and L. Henriksen. 2008. ìThe e§ect of retail cigarette packdisplays on impulse purchase.î Addiction, 103(2), p322-328.
% Wooldridge J. 2009. Introductory Econometrics: A Modern Approach, 4th Edition
34