seismic reflection techniques for base metal exploration in eastern canada: examples from buchans,...
TRANSCRIPT
E L S E V I E R Journal of Applied Geophysics 32 (1994) 105-116
IFFLIEE I EEFI SliC5
Seismic reflection techniques for base metal exploration in eastern Canada: examples from Buchans, Newfoundland
C. Wright, J.A. Wright, J. Hall Centre for Earth Resources Research, Department of Earth Sciences, Memorial University of Newfoundland, St. John's, Nfld. A I B 3X5,
Canada
(Received March 19, 1993; accepted after revision February 24, 1994)
Abstract
In 1989, as part of the Lithoprobe East program, high-resolution 60-fold seismic reflection profiles were recorded using Vibroseis sources in the vicinity of the Buchans mine. The area is considered to be a fold and thrust belt in which the massive sulphide-barite orebodies occurring within volcanic and sedimentary units of the Buchans Group are repeated in a large number of thrust systems. The main objective was to image the individual faults, generally narrow zones of brittle shear, some of which have been intruded by diabase sills. In 1991, Memorial University of Newfoundland recorded a 24-fold line using explosives as sources, coincident with one of the Lithoprobe lines, in order to compare the resolution of shallow structures of economic importance with that obtained using Vibroseis. The explosive sources provided reflections richer in high frequencies than the Vibroseis sources for depths less than 1 km. The resolution of the reflections is greatly improved by two processes: (1) the application of refraction static corrections, and (2) spectral balancing of the NMO-corrected CMP gathers over two octaves prior to stacking. Compared with Vibroseis, the approach using small explosive sources is considered preferable for future work in mineral exploration and mine development because of lower costs and better resolution of shallow moderately-dipping faults.
1. Introduction
Although the seismic reflection technique was used successfully in Germany as long ago as 1958 to locate a new siderite lode (Schmidt, 1959), it has not gained widespread acceptance by the mineral exploration industry. Many attempts have been made, especially in the seventies and eighties, to adapt seismological tech- niques used in petroleum exploration or engineering for mineral exploration in different parts of the world, including Australia (Nelson, 1984), Malaysia (Singh, 1983), Norway (Dahle et al., 1985), and South Africa (Pretorius et al., 1989). Much of this work was prom- ising, but seismic profiling is still used only rarely by the mining industry, possibly because of the large expense of the fieldwork and processing of data
0926-9851/94/$07.00 © 1994 Elsevier Science B.V. All rights reserved SSDI0926-985 1 ( 9 4 ) 0 0 0 1 5 - G
recorded in areas of both low reflectivity and geological complexity.
There are several important differences in the use of seismic reflection techniques for hydrocarbon explo- ration and for mineral exploration. Generally, seismic exploration for minerals involves working in basement rocks, defined here as igneous and metamorphic rocks, and also in well-indurated sedimentary rocks with low porosities (0.1-1.0%) of Palaeozoic or earlier age. Such rocks are characterised by high P-wave velocities ( >4.5 km/s) . The aim of seismic work in such areas is to map structures in rocks that are often more exten- sively deformed and that may not have the horizontal or sub-horizontal lithological or facies boundaries that are commonly mapped in many sedimentary basins. Structures such as thrust duplexes and major associated
106 C. Wright et al./ Journal of Applied Geophysics 32 (1994) 105-116
faults and moderately-dipping shear zones are of inter- est. Sometimes mapping of ore bodies themselves may be attempted (Schmidt, 1959), especially if they are massive sulphides which often have similar seismic velocities but quite different densities from the host rocks (Nelson, 1984; Pant and Greenhalgh, 1989). In most instances, weak reflections from geometrically complicated structures suggest that a different approach to data acquisition and processing from that used in hydrocarbon exploration is required.
In 1989, as part of the Lithoprobe East program, high-resolution 60- fold seismic reflection profiles were recorded using Vibroseis sources in the vicinity of the
Buchans mine in central Newfoundland. The main objectives were to image the faults comprising the thrust systems that host the ore bodies and to evaluate the potential of the seismic relection technique in base metal exploration (Boerner et al., 1990; Spencer et al., t 993). In June 1991, high-resolution seismic reflection profiling in the Buchans area was undertaken by the Centre for Earth Resources Research, Department of Earth Sciences, Memorial University of Newfoundland (CERR). There were three main objectives of the CERR work: first, to test a data acquisition procedure involving the use of small quantities of explosive as the seismic source in a location where a Vibroseis line had
W15000 W7500 0 E7500 E15000
BUCHANS AREA
I + + ÷ + + + ÷ + + + + + + + + + + + + + + ~
i @ + + + + + ÷ + + + ÷ + + + + + + + + + + +
+ + + + + + + + + + ~ + + + + + + + ~ + + +
+ . . . . . . . . . . : ~ ' ~
NEWFOUNDLAND
1200 k m I
I / 1 I /
/ / / 1 1
i / / / I
1 / / I /
1 1 / / /
" " " / ? K 1 1 " 1 ~ 0
V V V
v V v , j
V ~ / V / f
V V V V V
/ /" / N / i
/ / / I / / I / / z / / / i / / l n / / ~
/ t t I
1 / / / / Z
( 7 " " " " - - I i , / /
1 t7 I / / I /
" < G " " " " ,,/ / I / I --
/ / / I ~i, / / / I
/ / / /
N / -
~, " -~ / ,~ ~ ' - ' , , " . . . . . . . . ~ , - 4 " ' . ' . . . . . M " . " ' . ' . " ' . . . ~ . . . . ,', - "b . . . . . . . ",~, , • . . . . ~ .... , , .~ . . . . . . . . . . . . . . . . . . . . . . . . . .
, ~ , ~- ~ ~ . . U ~ d .~ ,~ . . . . . . . . .
I d t - ' ,, / \ / , . . . . . ~:,; . . . . . . . . . DEEP $BIOMK:MNE
I , ~= / - / # o , , . , , • • ° , , • ° • ,
~ , ~ - / . . . . ~ . . . . . . . . . . . / v _ •
S ~ " " " < ~ : " ~ " " ~ , ," ~ " "~ / " ' ~=~ " ~ , ' ~ 3 / ' ~ ' ~ v ~ , - "~ " D'- . . . . . . ~ '{'-'2v:"
! !
, , . , • , , , , m . , , I i , o • i i i ! m i i m i i i g ¢ J 3
. . . . . . . . . ] 0 , ~ - ' . 1 I , I
.'.':..'.'.".:'.'.'.'.'... i . , . . ! . i . . , . '
~ - ' . ~ - . . . . . - : . : : , r .~ I . . . . . . • ~ " ..,p~. ". ". - - ' . ". • . . . . " R e d I n d i a n L a k e . . . . . . . . . . . . . . . . . . 1 rl L a k e ] I I |
~ SandyLake ~ BuchansRIver ~ SklHIII ~ - ~ LundbergHIII Formation Formation Formation Formation
~ Hungry Mountain ~ Thrust Geological $5000 Mine Complex Fault -- " J 'J Contact Co-ordinates
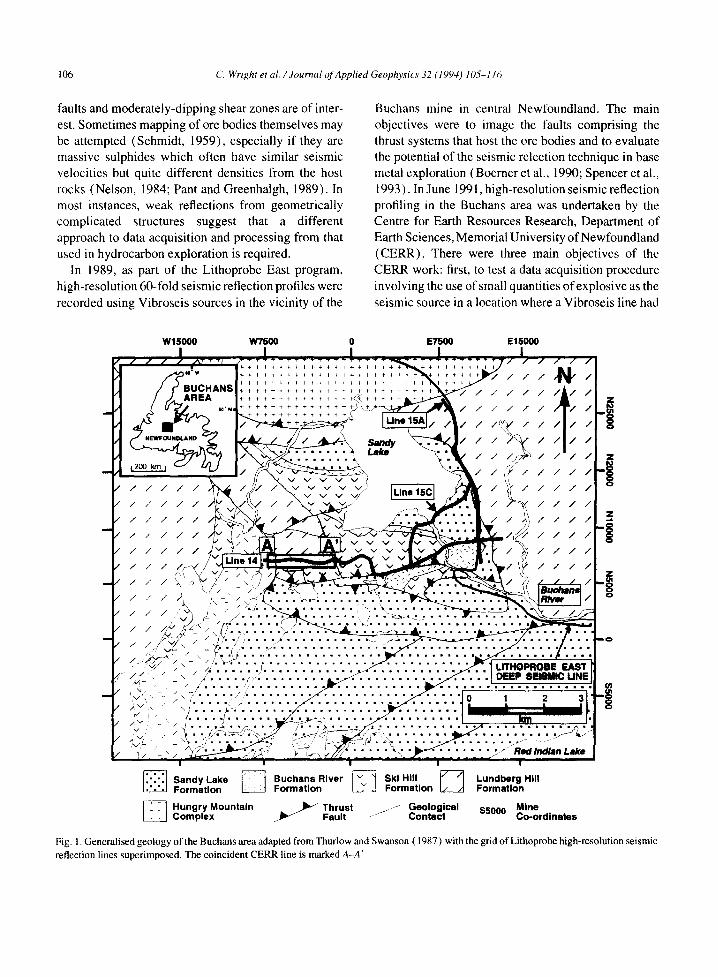
Fig . 1. Generalised geology of the Buchans area adapted from Thurlow and Swanson ( 1 9 8 7 ) with the grid of Lithoprobe high-resolution seismic reflection lines superimposed. The coincident CERR line is marked A-A'
C. Wright et al. / Journal of Applied Geophysics 32 (1994) 105-116 107
already been recorded; second, to compare the resolu- tion of shallow structures of economic importance with that obtained using Vibroseis; and third, to develop a processing strategy for providing clear images of reflec- tors to depths of at least 1 km.
2. Geology of survey region
The area of the seismic survey (shown in Fig. 1) is regarded as a fold and thrust belt in which volcanic and sedimentary rocks of the Ordovician Buchans Group form an extensive thrust system (Thurlow and Swan- son, 1981, 1987; Calon and Green, 1987; Thurlow et al., 1992). The volcanic rocks of the Buchans River Formation, listed in Table 1, host the polymetallic mas- sive sulphide-barite Buchans orebodies within imbri- cated antiformal stacks. The individual faults of these thrust stacks are generally narrow zones of brittle shear, some of which have been intruded by diabase sills.
In the present survey, the principal targets are the Old Buchans Fault at relatively shallow depths ( < 500 m) and the deeper Powerline Fault ( ~ 1000 m depth); both involve faulting with similar lithologies on either side of the fault plane in the region of the CERR survey (Thurlow et al., 1992; Spencer et al., 1993). Both of these faults were well-imaged by the Lithoprobe East high-resolution Vibroseis seismic survey (Boerner et al., 1990; Spencer et al., 1993). A comparison of the
Table 1 Stratigraphy of the Buchans Group (after Thurlow and Swanson, 1987)
Sandy Lake Formation Basaltic pillow lava, pillow breccia, felsic volcaniclastic sedimentary rocks. Locally abundant pyroclastic and tuffaceous sedimentary rocks.
Buehans River Formation Felsic pyroclastics and breccia, rhyolite, pyritic siltstone, polylithic breccia-conglomerate, granite-boulder conglomerate, massive sulphide and barite orebodies.
Ski Hill Formation Basaltic to andesitic pyroclastics, pillow lava and pillow breccia, massive marie flows and minor felsic tuff.
Lundberg Hill Formation Felsic pyroclastics and breccia, rhyolite, tuffaceous sedimentary rocks and minor chert.
images of these faults as derived from the present explosive-source survey and from the earlier data is of paramount importance in evaluating the present seis- mic field techniques. The area chosen for the compar- ison lies roughly along the strike of the structures as illustrated in Fig. 1, indicating that the apparent dips are much less than true. The reason for recording along strike was to concentrate on studying fault-zone reflec- tivity, leaving the problem of imaging steep dips and structural complexities to later experiments.
3. Field techniques
3.1 Explosive sources
The field parameters used by CERR along Litho- probe Line 14 are listed in Table 2. The recording spread consisted of 48 takeouts spaced at 9.8 m inter- vals with a single 14 Hz geophone at each one. 20 cm lengths of Primaflex ( ~ 40 g of explosive) were buried in shallow holes drilled to depths ranging from 25 to 70 cm. After experimentation with one or two lengths of Primaflex per shot, the preferred configuration was selected to be two lengths detonated simultaneously in holes in line with the recording spread separated by about 3 m. These shot pairs were placed as close as possible to the line of receivers, with the maximum lateral offset being 16 m. Shot centres were 9.8 m off- end of the geophone spread. A shot spacing of 9.8 m gives a 24-fold stack. Record lengths were 1 s at a sampling rate of 1 ms. Significant seismic energy was
Table 2 CERR Data Acquisition Parameters
Source
Source depth
Geophones
Recording system Recording geometry Recording fold Profile length
Primaflex ( ~40 g); two 20 cm lengths (in separate holes 3 m apart) per shot 25-70 cm; (shot hole pair separation ~3 m) Single 14 Hz geophone per takeout, 9.8 m spacing 48-channel DFS V, I ms sampling rate Off-end (1 station) 24 (shot point interval, 9.8 m) 2 km
* - - X X Shot 1 Receivers 48 (Gap 10 m)
108 C. Wright et al. / Journal of Applied Geophysics 32 (1994) 105-116
Table 3 Lithoprobe LI4 Data Acquisition Parameters
Source
Vibroseis. Source interval: 20 m. Sweep frequency: 40-125 Hz (linear). Sweep length: 10 s. Number of sweeps: 4. Number of vibrators: 2 (nose to tail). Correlated record length: 6 s
Geophones
Recording system
Recording geometry Recording fold
12 bunched 14 Hz geophones per takeout, deployed over 1 m 2, 10 m spacing. 240-channel twin DFS V Calder, 2 ms sampling rate Asymmetric split spread. 6O
Source
X X * X X
1 Receivers 78 79 Receivers 240 (Gap 10 m)
recorded up to at least 250 Hz. 40-Hz geophones may be used in future work to reduce the effects of noise encountered at frequencies in the range of 14--40 Hz.
3.2 Vibroseis sources
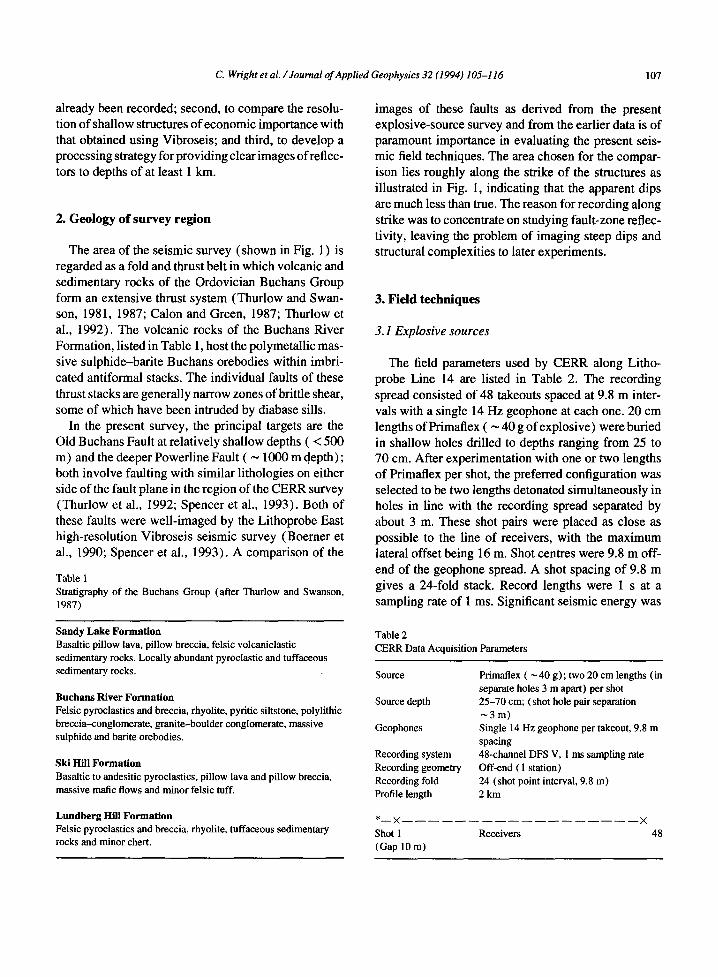
minus) method (Hagedoorn, 1959; Hawkins, 1961). Numerical tests showed that there was no advantage in using the generalised reciprocal method (Palmer, 1981) because the offset distance X shown in Fig. 2 was much less than one station spacing (X is the dis- tance at which ray paths sloping in opposite directions cross the overburden-bedrock boundary at the same location). Apparent velocities at each station location were computed by summary-value smoothing of the first break times for each shot gather ( Bolt, 1978) using window lengths of 120-140 m. A weighted mean was calculated for all shots contributing velocity values at each particular shot location. These mean apparent velocities were used to estimate the small correction times required in the reciprocal method to accommo- date deviations from straight line geometry. In applying the reciprocal method shown in Fig. 2, shot and receiver static corrections were assumed to be the same. Although the receiver and shot static terms can be esti- mated separately with a more refined analysis, a major improvement in the quality of the stacked output was
The recording parameters used in the Lithoprobe survey are listed in Table 3, and the field procedure and processing of the data have been described by Spencer et al. (1993). The differences from the CERR survey in addition to the type of source are as follows. In the Lithoprobe work, arrays of 14-Hz geophones were bunched over a small area ( ~ 1 m 2) ; 240 channels of recording with an asymmetric split spread configura- tion and source points 20 m apart gave 60-fold record- ing compared with 24-fold for the CERR survey. Most importantly, the vibrator sweep was from 40-125 Hz with recording at a 2 ms sampling rate, resulting in a much narrower signal bandwidth than with the explo- sive source. The broader bandwidth of the signals from explosives is important in providing better resolution of structures down to depths of about 1 km.
4. Processing strategy
A $ 1 $2R2 R3 / ~ , t / / " 1 , ~ / / / j
/ / % / / / // J~ / / Y xxOVERBURDE~ \ / / / A / / / / ~ + * + ~
- - B O.OCK
X
$1 $2 Rz R4
/ / . V ," / / 4: \ O V E R B U R D E N \ / /
+ + + . .
÷ + ~ ~ , % . ÷ ~ . ÷ ~ . ÷ . ÷ : ÷ . - - . . . . . "++- +++++++++~.+~+" + + J" " - BEDROCK ~.+++ ~*.
4.1 Static corrections
First breaks were picked for all seismic records and static corrections, including the allowance for elevation changes, were computed using the reciprocal (or plus-
Fig. 2. Ray diagrams illustrating the application of the reciprocal and generalised reciprocal methods to estimating refraction static correc- tions for off-end shooting. Shots and receivers are denoted Si and Rj, respectively. (A) Ray paths for the reciprocal method. (B) Ray paths for the generalised reciprocal method designated to measure the distance X = S2R 3.
C. Wright et al. / Journal of Applied Geophysics 32 (1994) 105-116 109
J
c~
c13
Or]
0 ¢5
0 ~5
I
C)
I
o
o
# o.
2 I
o
'L2 I
120.
,llqlllINlllllllaw,,"""''''' . . . . . . . . . .
I I
120. 140.
R e c e i v e r L o c a t i o n 140. 160. 180. 200. 220. 240. 260. 280. 300.
FIELD STATICS
REFRACTION STATICS
I I I I I I I
160. 180. 200. 220. 240. 260. 280.
R e c e i v e r L o c a t i o n .00.
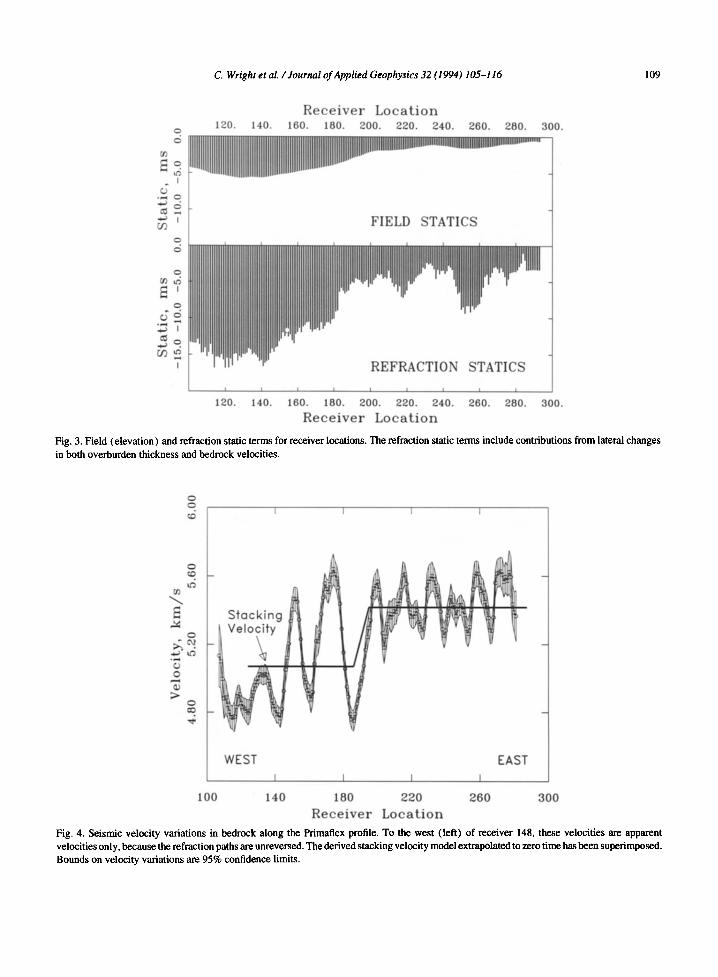
Fig. 3. Field (elevation) and refraction static terms for receiver locations. The refraction static terms include contributions from lateral changes in both overburden thickness and bedrock velocities.
0
~6
¢D
tt~
O
¢)
0
O CO
i I I I
WEST EAST
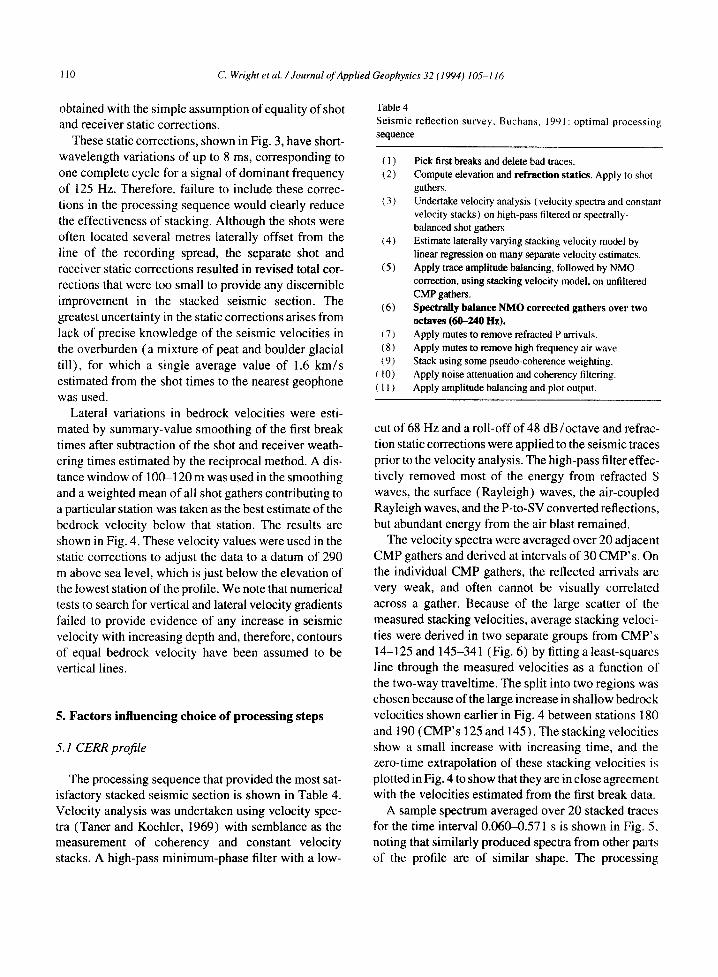
Fig. 4. Seismic velocity variations in bedrock along the Primaltex profile. To the west (left) of receiver 148, these velocities are apparent velocities only, because the refraction paths are unreversed. The derived stacking velocity model extrapolated to zero time has been superimposed. Bounds on velocity variations are 95% confidence limits.
I I I I
1 0 0 1 4 0 1 8 0 2 2 0 2 6 0 3 0 0
R e c e i v e r L o c a t i o n
110 (2. Wright et al. / Journal (~'Applied Geophysics 32 (1994) 105-116
obtained with the simple assumption of equality of shot and receiver static corrections.
These static corrections, shown in Fig. 3, have short- wavelength variations of up to 8 ms, corresponding to one complete cycle for a signal of dominant frequency of 125 Hz. Therefore, failure to include these correc- tions in the processing sequence would clearly reduce the effectiveness of stacking. Although the shots were often located several metres laterally offset from the line of the recording spread, the separate shot and receiver static corrections resulted in revised total cor- rections that were too small to provide any discernible improvement in the stacked seismic section. The greatest uncertainty in the static corrections arises from lack of precise knowledge of the seismic velocities in the overburden (a mixture of peat and boulder glacial till), for which a single average value of 1.6 km/s estimated from the shot times to the nearest geophone was used.
Lateral variations in bedrock velocities were esti- mated by summary-value smoothing of the first break times after subtraction of the shot and receiver weath- ering times estimated by the reciprocal method. A dis- tance window of 100-120 m was used in the smoothing and a weighted mean of all shot gathers contributing to a particular station was taken as the best estimate of the bedrock velocity below that station. The results are shown in Fig. 4. These velocity values were used in the static corrections to adjust the data to a datum of 290 m above sea level, which is just below the elevation of the lowest station of the profile. We note that numerical tests to search for vertical and lateral velocity gradients failed to provide evidence of any increase in seismic velocity with increasing depth and, therefore, contours of equal bedrock velocity have been assumed to be vertical lines.
5. Factors i n f l u e n c i n g c h o i c e o f proces s ing steps
5.1 C E R R profile
The processing sequence that provided the most sat- isfactory stacked seismic section is shown in Table 4. Velocity analysis was undertaken using velocity spec- tra (Taner and Koehler, 1969) with semblance as the measurement of coherency and constant velocity stacks. A high-pass minimum-phase filter with a low-
Table 4 Seismic reflection survey, Buchans, 1991: optimal processing sequence
( 1 ) Pick first breaks and delete bad traces. (2) Compute elevation and refraction statics. Apply to shot
gathers. ( 3 ) Undertake velocity analysis ( velocity spectra and constant
velocity stacks) on high-pass filtered or spectrally- balanced shot gathers.
(4) Estimate laterally varying stacking velocity model by linear regression on many separate velocity estimates.
(5) Apply trace amplitude balancing, followed by NMO correction, using stacking velocity model, on unfiltered CMP gathers.
(6) Spectrally balance NMO corrected gathers over two octaves (60-240 I-lz).
(7) Apply mutes to remove refracted P arrivals. (8) Apply mutes to remove high frequency air wave. (9) Stack using some pseudo-coherence weighting.
(10) Apply noise attenuation and coherency filtering. ( 11 ) Apply amplitude balancing and plot output.
cut of 68 Hz and a roll-off of 48 dB/octave and refrac- tion static corrections were applied to the seismic traces prior to the velocity analysis. The high-pass filter effec- tively removed most of the energy from refracted S waves, the surface (Rayleigh) waves, the air-coupled Rayleigh waves, and the P-to-SV converted reflections, but abundant energy from the air blast remained.
The velocity spectra were averaged over 20 adjacent CMP gathers and derived at intervals of 30 CMP's. On the individual CMP gathers, the reflected arrivals are very weak, and often cannot be visually correlated across a gather. Because of the large scatter of the measured stacking velocities, average stacking veloci- ties were derived in two separate groups from CMP's 14-125 and 145-341 (Fig. 6) by fitting a least-squares line through the measured velocities as a function of the two-way traveltime. The split into two regions was chosen because of the large increase in shallow bedrock velocities shown earlier in Fig. 4 between stations 180 and 190 (CMP's 125 and 145). The stacking velocities show a small increase with increasing time, and the zero-time extrapolation of these stacking velocities is plotted in Fig. 4 to show that they are in close agreement with the velocities estimated from the first break data.
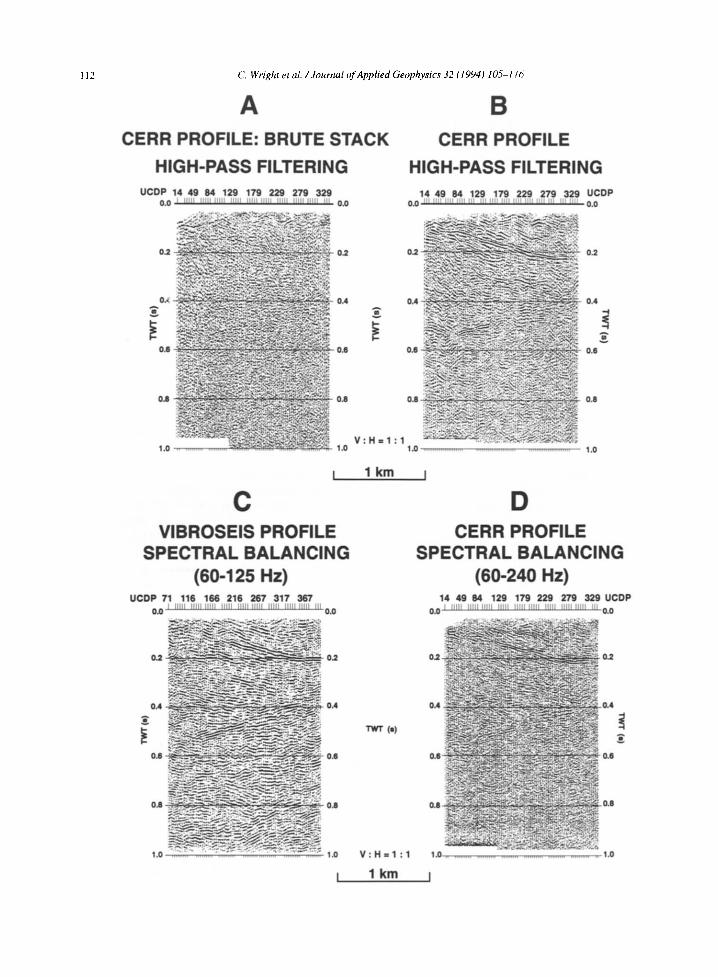
A sample spectrum averaged over 20 stacked traces for the time interval 0.0604).571 s is shown in Fig. 5, noting that similarly produced spectra from other parts of the profile are of similar shape. The processing
C . W r i g h t e t a l . / J o u r n a l o f A p p l i e d G e o p h y s i c s 3 2 ( 1 9 9 4 ) 1 0 5 - 1 1 6 1 1 1
AMPLITUDE SPECTRUM PRIMAFLEX SOURCE CMP'S 141 - 160: WINDOW 60 - 571 m
0 60 120 180 240 300 360 420 480 0 [ . . . . . . . . . . I . . . . . . . . . . I . . . . . . . . . . I . . . . . . . . . . I . . . . . . . . . . . I . . . . . . . . . . . I . . . . . . . . . . . I . . . . . . . . . . I . . . , 0
~ d'a^ 1 -20 ~ - 2 0
-30 ' ~'" y ~ -30
40 ~ . . . . . . . . . . . . 1 ,.40 60 1'~0 ld0 240 300 3(~0 49'0 41~0
FREQUENCY (Hz)
Fig. 5. Average amplitude spectrum for 20 consecutive stacked traces produced by explosive sources. The time window is from 60 to 571 ms, and covers a time window starting after the P arrival and includes reflections from the Old Buchans Fault (see Fig. 8). A high-pass filter has been applied to show the frequency band that has little contamination from unwanted seismically generated energy.
sequence used in producing the stacked traces for spec- tral analysis was as shown in Table 4, except that high- pass filtering (low-cut frequency of 68 Hz and roll-off of 48 db/octave) was used at step 6 rather than spectral balancing, and is the cause of the maximum in the amplitude spectrum between 60 and 70 Hz. The spectra show that there is reflected energy at frequencies beyond 250 Hz, thus illustrating that the broad band- width of the explosive sources can be well-exploited in this geological environment to give high-resolution reflections from fault zones. The decay in amplitude between 60 and 240 Hz is about 15 db (amplitude reduction by a factor of about 0.18).
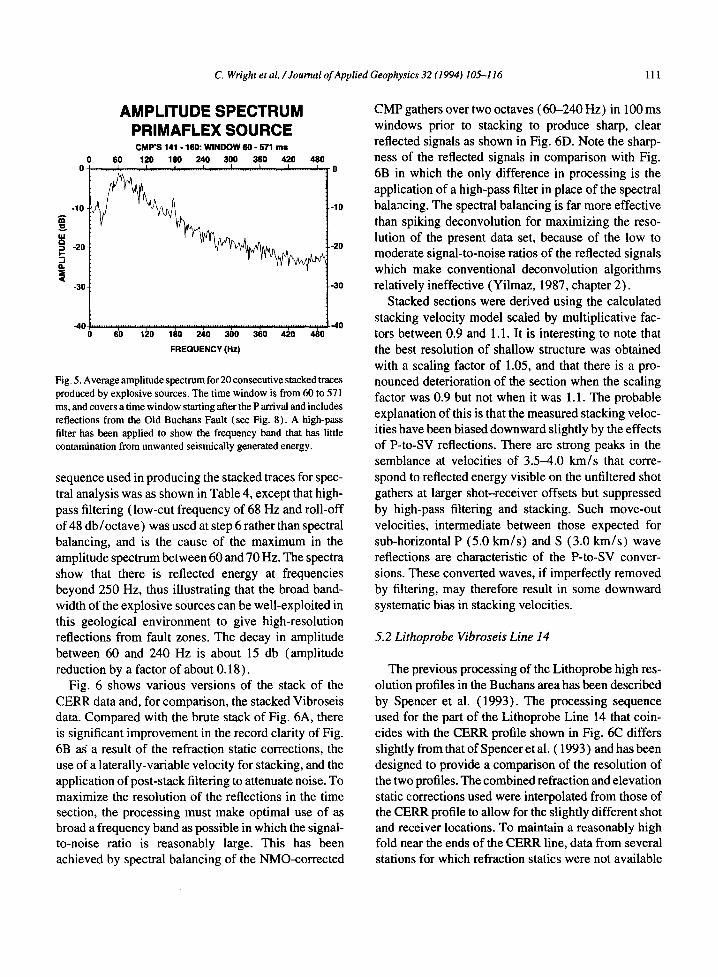
Fig. 6 shows various versions of the stack of the CERR data and, for comparison, the stacked Vibroseis data. Compared with the brute stack of Fig. 6A, there is significant improvement in the record clarity of Fig. 6B as" a result of the refraction static corrections, the use of a laterally-variable velocity for stacking, and the application of post-stack filtering to attenuate noise. To maximize the resolution of the reflections in the time section, the processing must make optimal use of as broad a frequency band as possible in which the signal- to-noise ratio is reasonably large. This has been achieved by spectral balancing of the NMO-corrected
CMP gathers over two octaves (60-240 Hz) in 100 ms windows prior to stacking to produce sharp, clear reflected signals as shown in Fig. 6D. Note the sharp- ness of the reflected signals in comparison with Fig. 6B in which the only difference in processing is the application of a high-pass filter in place of the spectral balancing. The spectral balancing is far more effective than spiking deconvolution for maximizing the reso- lution of the present data set, because of the low to moderate signal-to-noise ratios of the reflected signals which make conventional deconvolution algorithms relatively ineffective (Yilmaz, 1987, chapter 2).
Stacked sections were derived using the calculated stacking velocity model scaled by multiplicative fac- tors between 0.9 and 1.1. It is interesting to note that the best resolution of shallow structure was obtained with a scaling factor of 1.05, and that there is a pro- nounced deterioration of the section when the scaling factor was 0.9 but not when it was 1.1. The probable explanation of this is that the measured stacking veloc- ities have been biased downward slightly by the effects of P-to-SV reflections. There are strong peaks in the semblance at velocities of 3.5-4.0 km/s that corre- spond to reflected energy visible on the unfiltered shot gathers at larger shot-receiver offsets but suppressed by high-pass filtering and stacking. Such move-out velocities, intermediate between those expected for sub-horizontal P (5.0 km/s) and S (3.0 km/s) wave reflections are characteristic of the P-to-SV conver- sions. These converted waves, if imperfectly removed by filtering, may therefore result in some downward systematic bias in stacking velocities.
5.2 Lithoprobe Vibroseis Line 14
The previous processing of the Lithoprobe high res- olution profiles in the Buchans area has been described by Spencer et al. (1993). The processing sequence used for the part of the Lithoprobe Line 14 that coin- cides with the CERR profile shown in Fig. 6C differs slightly from that of Spencer et al, (1993) and has been designed to provide a comparison of the resolution of the two profiles. The combined refraction and elevation static corrections used were interpolated from those of the CERR profile to allow for the slightly different shot and receiver locations. To maintain a reasonably high fold near the ends of the CERR line, data from several stations for which refraction statics were not available
112 C. Wright et al. / J o u r n a l ~S Applied Geophysics 32 (1994) 105-1/6
A B CERR PROFILE: BRUTE STACK
HIGH-PASS FILTERING U C D P 14 4 9 8 4 129 179 2 2 9 2 7 9 3 2 9
o,0 J iiiii Hill ~Jl~ HII IIJII lIHJ Illlt IHII I]111 Ill 0.0
; ~ . ~,~ ~ ~ 0.4
0.6 ~ 0.6
1.0 ~ - ................... - 1.0
CERR P ~ I L E HIGH-PASS FILTERING
14 4 9 8 4 129 1 7 9 2 2 9 2 7 9 3 2 9 U C D P 0.0 Ill IIII Illl lill Ill }rl IIII IIII IJI] tJll lift JIl fli II]1 0.0
0.2 ~ ~ ' : : : 0.2
0.4
C
0.6 ¸
VI~OSEIS PROFILE SPECTRAL BALANCING
(60-125 Hz) U C D P 71 116 1 6 6 2 1 6 2 6 7 3 1 7 3 6 7
o.oJ~lJt#l II1[I rllll iiiIi Hill iiiii IIIII Iltll rllll Iii o.o
o , : ~ ~ 0.8
0.8
V : H = I : I . . . . . . . . . . 1.0
1 km
TWT (~)
V : H = I : I
I 1 km
0.4 .-I
O.S
0.0
1,0
D CERR PROFILE
SPECTRAL BALANCING (60-240 Hz)
14 4 9 8 4 129 179 2 2 9 2 7 9 3 2 9 U C D P 0.0 J IIIH IIIll Illl] Jill[ III1! flfll_llltJ ltlll IHII III 0.0
0 2 - 0.2
0,4 0.4
0.6-: 0.6
0.8- 0.8
1 . 0 ~ -1.0
C. Wright et al. / Journal of Applied Geophysics 32 (1994) 105-116 113
AMPLITUDE SPECTRUM VIBROSEIS SOURCE CMP'S 198 - 2 1 7 : W I N D O W 6 0 - 570 ms
0 4 0 80 120 1 6 0 2 0 0 2 4 0 0 . . . . . . . . . . . . . . . . . . . . . . . . . . . . . . . . . . I . . . . . . . ~ 0
A - 1 0 - - - 1 0
u,I (:Z " , - 20 - . - 20 I -
o . = i
< -30 - - -30
-40 4~0 8'0 1~'0 1(~0 2 6 0 2,40 -40
F R E Q U E N C Y (Hz)
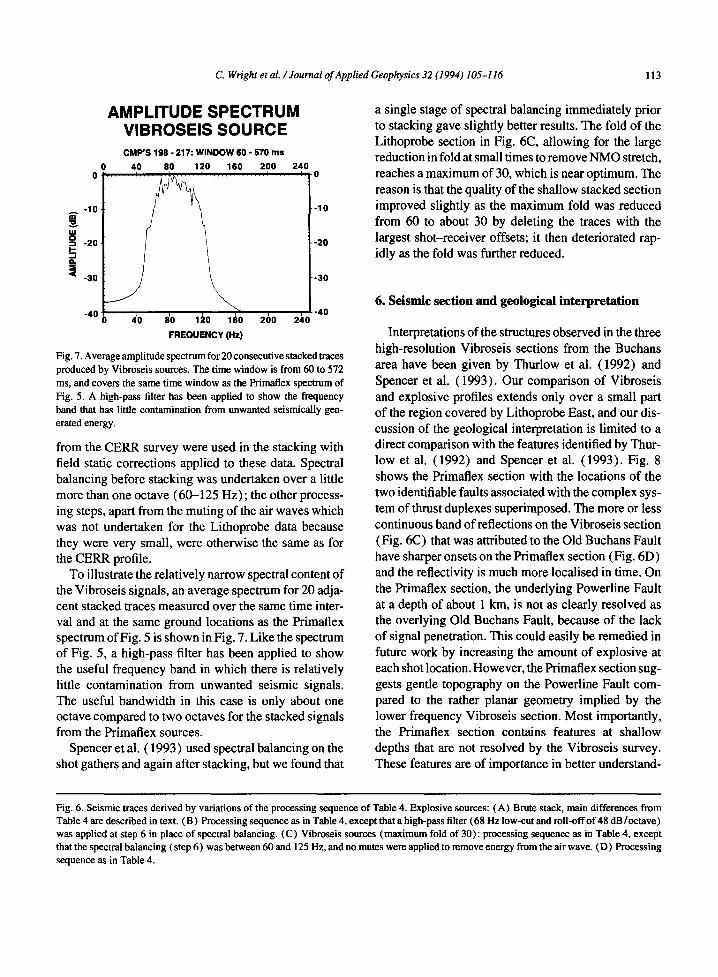
Fig. 7. Average amplitude spectrum for 20 consecutive stacked traces produced by Vibroseis sources. The time window is from 60 to 572 ms, and covers the same time window as the Primatiex spectrum of Fig. 5. A high-pass filter has been applied to show the frequency band that has little contamination from unwanted seismically gen- erated energy.
from the CERR survey were used in the stacking with field static corrections applied to these data. Spectral balancing before stacking was undertaken over a little more than one octave (60-125 Hz); the other process- ing steps, apart from the muting of the air waves which was not undertaken for the Lithoprobe data because they were very small, were otherwise the same as for the CERR profile.
To illustrate the relatively narrow spectral content of the Vibroseis signals, an average spectrum for 20 adja- cent stacked traces measured over the same time inter- val and at the same ground locations as the Primaflex spectrum of Fig. 5 is shown in Fig. 7. Like the spectrum of Fig. 5, a high-pass filter has been applied to show the useful frequency band in which there is relatively little contamination from unwanted seismic signals. The useful bandwidth in this case is only about one octave compared to two octaves for the stacked signals from the Primaflex sources.
Spencer et al. (1993) used spectral balancing on the shot gathers and again after stacking, but we found that
a single stage of spectral balancing immediately prior to stacking gave slightly better results. The fold of the Lithoprobe section in Fig. 6C, allowing for the large reduction in fold at small times to remove NMO stretch, reaches a maximum of 30, which is near optimum. The reason is that the quality of the shallow stacked section improved slightly as the maximum fold was reduced from 60 to about 30 by deleting the traces with the largest shot-receiver offsets; it then deteriorated rap- idly as the fold was further reduced.
6. Seismic section and geological interpretation
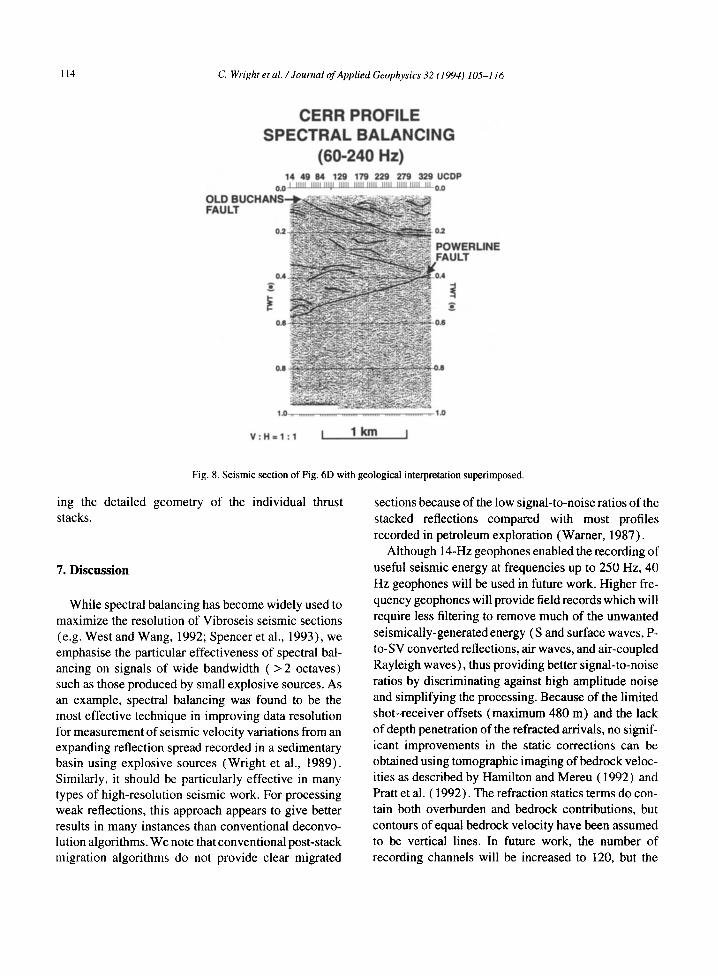
Interpretations of the structures observed in the three high-resolution Vibroseis sections from the Buchans area have been given by Thurlow et al. (1992) and Spencer et al. (1993). Our comparison of Vibroseis and explosive profiles extends only over a small part of the region covered by Lithoprobe East, and our dis- cussion of the geological interpretation is limited to a direct comparison with the features identified by Thur- low et al. (1992) and Spencer et al. (1993). Fig. 8 shows the Primaflex section with the locations of the two identifiable faults associated with the complex sys- tem of thrust duplexes superimposed. The more or less continuous band of reflections on the Vibroseis section (Fig. 6C) that was attributed to the Old Buchans Fault have sharper onsets on the Primaflex section (Fig. 6D) and the reflectivity is much more localised in time. On the Primaflex section, the underlying Powerline Fault at a depth of about 1 km, is not as clearly resolved as the overlying Old Buchans Fault, because of the lack of signal penetration. This could easily be remedied in future work by increasing the amount of explosive at each shot location. However, the Primaflex section sug- gests gentle topography on the Powerline Fault com- pared to the rather planar geometry implied by the lower frequency Vibroseis section. Most importantly, the Primaflex section contains features at shallow depths that are not resolved by the Vibroseis survey. These features are of importance in better understand-
Fig. 6. Seismic traces derived by variations of the processing sequence of Table 4. Explosive sources: (A) Brute stack, main differences from Table 4 are described in text. (B) Processing sequence as in Table 4, except that a high-pass filter (68 Hz low-cut and roll-off of 48 dB/octave ) was applied at step 6 in place of spectral balancing. (C) Vibroseis sources ( maximum fold of 30): processing sequence as in Table 4, except that the spectral balancing (step 6) was between 60 and 125 Hz, and no mutes were applied to remove energy from the air wave. (D) Processing sequence as in Table 4.
114 C. Wright et al. / Journal of Applied Geophysics 32 (1994) 105-116
O L [ F A L l
CERR PROFILE SPECTRAL BALANCING
(60-240 Hz) 14 49 84 129 179 229 279 329 UCDP
o.o j I[III li l l l IIl!l ll l l l IIIII llllJ IIIII ~ L W ~ _ . ~ O, 0
) W E R L I N E b, ULT
1 "0 . . . . . . . . . . . . . . . . 1 10
V : H = I : I I 1 km j
Fig. 8. Seismic section of Fig. 6D with geological interpretation superimposed.
ing the detailed geometry of the individual thrust stacks.
7. Discussion
While spectral balancing has become widely used to maximize the resolution of Vibroseis seismic sections (e.g. West and Wang, 1992; Spencer et al., 1993), we emphasise the particular effectiveness of spectral bal- ancing on signals of wide bandwidth ( > 2 octaves) such as those produced by small explosive sources. As an example, spectral balancing was found to be the most effective technique in improving data resolution for measurement of seismic velocity variations from an expanding reflection spread recorded in a sedimentary basin using explosive sources (Wright et al., 1989). Similarly, it should be particularly effective in many types of high-resolution seismic work. For processing weak reflections, this approach appears to give better results in many instances than conventional deconvo- lution algorithms. We note that conventional post-stack migration algorithms do not provide clear migrated
sections because of the low signal-to-noise ratios of the stacked reflections compared with most profiles recorded in petroleum exploration (Warner, 1987).
Although 14-Hz geophones enabled the recording of useful seismic energy at frequencies up to 250 Hz, 40 Hz geophones will be used in future work. Higher fre- quency geophones will provide field records which will require less filtering to remove much of the unwanted seismically-generated energy (S and surface waves, P- to-SV converted reflections, air waves, and air-coupled Rayleigh waves), thus providing better signal-to-noise ratios by discriminating against high amplitude noise and simplifying the processing. Because of the limited shot-receiver offsets (maximum 480 m) and the lack of depth penetration of the refracted arrivals, no signif- icant improvements in the static corrections can be obtained using tomographic imaging of bedrock veloc- ities as described by Hamilton and Mereu (1992) and Pratt et al. (1992). The refraction statics terms do con- tain both overburden and bedrock contributions, but contours of equal bedrock velocity have been assumed to be vertical lines. In future work, the number of recording channels will be increased to 120, but the
C. Wright et al. / Journal of Applied Geophysics 32 (1994) 105-116 115
maximum shot-receiver offset will be kept below 500 m. The resulting denser spatial sampling may enable the type of analyses described by Hamilton and Mereu (1992), Pratt et al. (1992), and Spencer et al. (1993) to be effectively applied in fine-tuning the static cor- rections.
Other attempts have been made in the past to com- pare seismic sections recorded in areas of weak reflec- tivity, using both Vibroseis and explosive sources (e.g. Damotte and Bois, 1989; Brocher and Hart, 1991). However, these previous studies compare records from explosive sources that were of very high energy relative to the Vibroseis source in the context of imaging deep crustal structure. The present work is concerned with the use of explosive sources that are relatively small in energy content relative to the Vibroseis source in order to emphasise the high frequency content of the reflec- tions and minimise field costs.
be increased to about 100 g of explosive in future work. Otherwise the present field procedure is satisfactory for mapping faults and shear zones in rocks that host base metal ores and it is relatively inexpensive. It now needs to be evaluated in areas of steeply-dipping reflectors where extensive pre-stack processing will be essential.
Acknowledgements
This research was supported by NSERC Operating Grants to C. Wright and J.A. Wright and by a Strategic NSERC Grant to J. Hall and J.A. Wright. We thank P. Barnes, I. Kalaydjiev, and I. Kelly for assistance with field operations and S. Stoker for helping with the first break picking and refraction statics analysis. We also acknowledge the continued interest of L. Reed in this work and thank BP Minerals for allowing access to their property.
8. Conclusions
Small explosive charges provided a better source than Vibroseis for resolving shallow structures at Buch- ans because the explosives allowed the recording of reflected signals with a useful bandwidth of two octaves (60-240 Hz) compared with about one octave ( 6 0 - 125 Hz) for Vibroseis. The Buchans rocks allow the effective use of a broad-band source. These rocks, although characterised by weak reflectivity, have a high quality factor Q (low attenuation of seismic energy) that enables reflected energy with high frequency con- tent to be recorded. In future studies at mine sites, it will be advantageous to use high-frequency vibrators that can generate frequencies up to at least 200 Hz (Chapman et al., 1981), and, therefore, provide an input signal bandwidth similar to that attainable using small explosive sources. The section produced by the explosive sources contained reflections far more local- ised in time and contained more fine structure at shal- low depths ( < 1 km) of interest to structural geologists and mining companies than the Vibroseis section. The application of refraction statics and pre-stack two- octave spectral balancing (to make optimal use of the signal bandwidth) were the most important factors in providing a good seismic section for both the Vibroseis and the explosive sources. If structures at depths greater than 1 km are of interest, the source strength needs to
References
Boerner, D.E., Spencer, C.P., Wright, J.A., Carroll, P. and Reed, L.P., 1990. Developing new methods at an old mine: high reso- lution seismic and electromagnetic mapping at Buchans mine, Newfoundland. Eng. Min. J., July, 5 pp.
Bolt, B.A., 1978. Summary value smoothing of physical time series with unequal intervals. J. Comput. Phys., 29: 357-369.
Brocher, T.M. and Hart, P.E., 1991. Comparison of Vibroseis and explosive source methods for deep seismic reflection profiling in the Basin and Range Province. J. Geophys. Res., 96: 18,197- 18,213.
Calon, T.J. and Green, F.K., 1987. Preliminary results of a detailed structural analysis of the Buchans Mine area. In: R.V. Kirkham (Editor), Buchans Geology, Newfoundland. Geol. Surv. Can. Pap., 86-24: 273-288.
Chapman, W.L., Brown, G.L. and Fair, D.W., 1981. The Vibroseis system: a high-frequency tool. Geophysics, 46: 1657-1666.
Dahle, A., Gjoystdahl, H., Grammelvedt, G. and Soyland Hansen, T., 1985. Application of seismic reflection methods for ore pros- pecting in crystalline rock. First Break, 3 (2): 9-16.
Damotte, B. and Bois, C., 1990. Near-vertical Vibroseis versus large- offset dynamite seismic reflection: example of the ECORS north- ern France profile. Tectonophysics, 173:95-106.
Hagedoom, J.G., 1959. The plus-mians method of seismic refraction measurements. Geophys. Prospect., 7: 158-182.
Hamilton, D. and Mereu, R.F., 1992.2-D seismic tomography studies of the Canadan Shield. Eos Trans. Am. Geophys. Union, 73 (Spring Meet. Issue Suppl.): 316.
Hawkins, L.R., 1961. The reciprocal method of routine shallow seis- mic refraction investigation. Geophysics, 26: 806-819.
116 C. Wright et al./ Journal of Applied Geophysics 32 (1994) 105-116
Nelson, R.G., 1984. Seismic reflection and mineral prospecting. Explor. Geophys., 15: 229-250.
Palmer, D., 1981. An introduction to the generalised reciprocal method of seismic refraction interpretation. Geophysics, 46: 1508-1518.
Pant, D.R. and Greenhalgh, S.A., 1989. Multicomponent seismic reflection profiling over an ore-body structure - a scale model investigation. Geophys. Res. Lett., 16: 1089-1092.
Pratt, R.G., Wang, W. and West, G.F., 1992. Tomographic estimation of near-surface velocities and static corrections for deep crustal reflection data. Eos Trans. Am. Geophys. Union, 73 (Spring Meet. Issue Suppl.): 214.
Pretorius, C.C., Jamison, A.A. and Irons, C., 1989. Seismic explo- ration in the Witwatersrand Basin, Republic of South Africa. In: G.D. Garland (Editor), Proc. Exploration '87, 3rd Decennial Int. Conf. Geophysical and Geochemical Exploration for Minerals and Groundwater. Ont. Geol. Surv. Spec. Vol., 3, pp. 241-253.
Schmidt, G., 1959. Results of underground seismic reflection inves- tigations in the Siderite District of the Siegerland. Geophys. Pros- pect.. 7: 287-290.
Singh, S., 1983. A study of shallow seismic reflection for placer tin evaluation and mining. Geoexploration, 21: 105-135.
Spencer, C., Thurlow, J.G., Wright, J.A., White, D., Carroll, P., Milkereit, B. and Reed, L., 1993. A Vibroseis reflection seismic survey at the Buchans mine in central Newfoundland. Geophys- ics, 58: 154-166.
Taner, M.T. and Koehler, F., 1969. Velocity spectra - digital com- puter derivation and applications of velocity functions. Geo- physics, 34:859-881.
Thurlow, J.G. and Swanson, E.A., 1981. Geology and ore deposits of the Buchans area, central Newfoundland. In: E.A. Swanson, DF. Strong and J.G. Thurlow (Editors), The Buchans Orebod- ies: Fifty Years of Geology and Mining. Geol. Assoc. Can. Spec. Pap., 22, pp. 113-142.
Thurlow, J.G. and Swanson, E.A., 1987. Stratigraphy and structure of the Buchans Group. In: R.V. Kirkham (Editor), Buchans Geology, Newfoundland. Geol. Surv. Can. Pap., 86-24: 35-46.
Thurlow, J.G., Spencer, C., Boerner, D., Reed, L. and Wright, J.A., 1992. Geological interpretation of data from a high resolution seismic survey at the Buchans Mine, Newfoundland. Can. J. Earth Sci., 29: 2022-2034.
Warner, M., 1987. Migration - why doesn't it work for deep conti- nental data? Geophys. J.R. Astron. Soc., 89:21-26.
West, G.F. and Wang, W., 1992. Reprocessing of Lithoprobe crustal seismic reflection data from the Kapuskasing Structural Zone, Ontario, Canada. Eos Trans. Am. Geophys. Union, 73 (Spring Meet. Issue Suppl.): 214--215,
Wright, C., Barton, T., Goleby, B.R. and Taylor, F.J., 1989. Seismic velocity variations in the northern Amadeus Basin, central Aus- tralia, from an expanding spread reflection profile. Explor. Geo- phys., 20:435 444.
Yilmaz, 0., 1987. Seismic Data Processing. In: S.M. Doherty (Edi- tor), Investigations in Geophysics, Vol. 2. Soc. Explor. Geo- phys., Tulsa, OK, 526 pp.