tvnz annual report fy2011 tvnz/tvnzar_fy… · the politically incorrect guide to teenagers,...
TRANSCRIPT

1 TVNZ ANNUAL REPORT FY2011

2 TVNZ ANNUAL REPORT FY2011
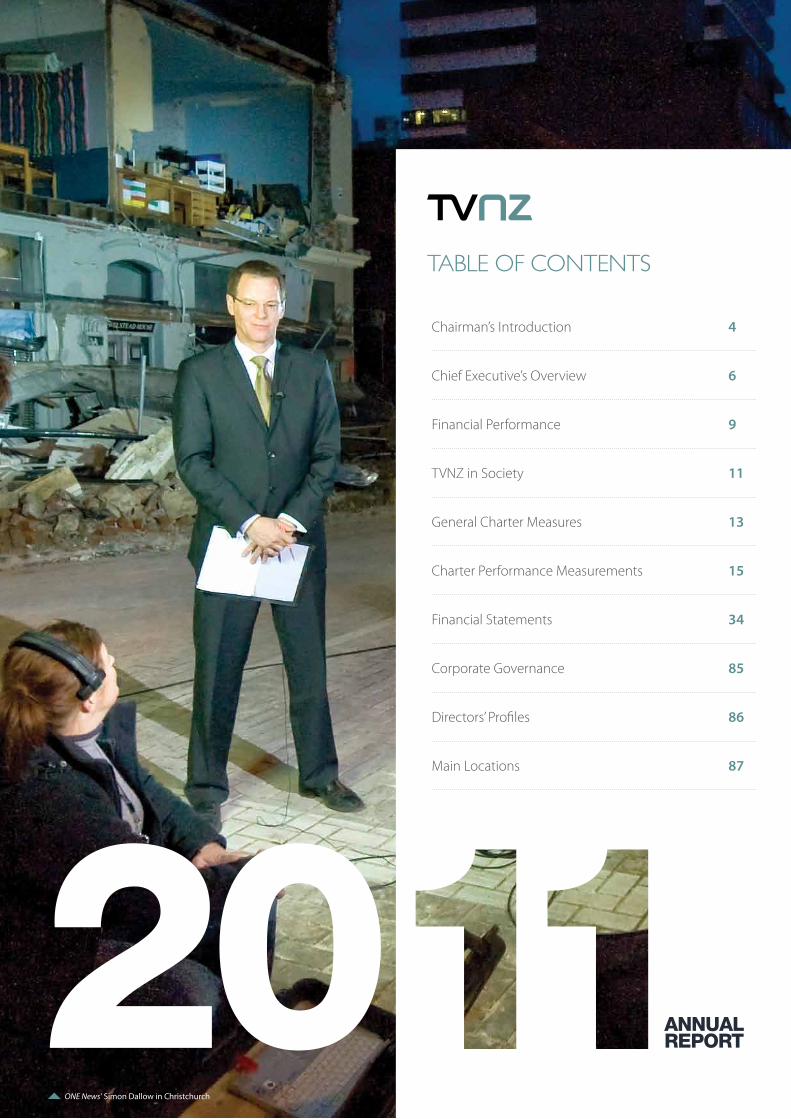
Cover: Aftermath of the 22 February 2011 Christchurch earthquake
3TVNZ ANNUAL REPORT FY2011
Chairman’s Introduction 4
Chief Executive’s Overview 6
Financial Performance 9
TVNZ in Society 11
General Charter Measures 13
Charter Performance Measurements 15
Financial Statements 34
Corporate Governance 85
Directors’ Profiles 86
Main Locations 87
TAbLE OF CONTENTs
ONE News’ Simon Dallow in Christchurch
4 TVNZ ANNUAL REPORT FY2011
ThEsE ARE ExCiTiNg TimEs. ThERE ARE ENORmOUs ChANgEs gOiNg ON wiThiN ThE iNdUsTRY ANd TVNZ is wELL POsiTiONEd TO REsPONd TO ThE ChALLENgEs ANd OPPORTUNiTiEs ThEY PREsENT.
ChAiRmAN’s iNTROdUCTiON
Sir John Anderson
5TVNZ ANNUAL REPORT FY2011
TVNZ has reported a positive performance this year. The Company delivered a net profit after tax of $2.1 million and underlying earnings of $31.8 million, up 164% from the previous year.
The Board is pleased to declare a dividend to the Shareholder of $13.8 million, an increase on the previous year’s dividend of $4.9 million.
Credit for this excellent result must go to TVNZ management and staff. The Board thanks them for their contribution and commitment to bringing to life the Company’s vision of Inspiring New Zealanders on Every Screen.
Advertising-reliant media companies in New Zealand and abroad faced a challenging year. TVNZ took effective action to mitigate the impact of the global financial crisis on its business through disciplined cost management and an ongoing programme of business diversification and transformation.
The performance of both TV ONE and TV2 has contributed to a lift in TVNZ’s advertising revenues and television market share. TVNZ secured 80.6% of all growth in television advertising for the year.
The Company continued to expand its digital broadcasting horizons. During the year it completed the implementation of a multi-million dollar digital infrastructure and playout facility. This allows the Company to reach more New Zealanders in more ways as it expands its television and online services.
The new digital facility enabled TVNZ to launch two new channels: channel U, a free-to-air youth channel aimed at 15 to 24-year-olds that uses a groundbreaking live interface with Facebook and; TVNZ Kidzone24, a new pay channel on Sky serving the needs of pre-schoolers and their parents.
In July this year the Government’s amendment to the Television New Zealand Act 2003 was passed into law. The Act provides confirmation of TVNZ’s role as New Zealand’s national free-to-air television and digital media company. The legislation removed the TVNZ Charter but enshrined TVNZ’s obligation to provide high-quality content for New Zealand audiences and to maintain a strong commercial performance.
These are exciting times. There are enormous changes going on within the industry and TVNZ is well positioned to respond to the challenges and opportunities they present.
Kua puta te whakatau whai hua ā Te Reo Tātaki mo tēnei tau. Ko taua hua nō muri mai ō nga tākē, kā eke ki te $2.1 miriona, e whakāta āna, e $31.8 miriona te painga. Kotahi rau ono tekau ma wha ōrau te painga āke.
E hari ana te rūnanga ki te pānui ki te kāwanatanga ngā hua mo te tau, kua eke nei ki te $13.8 miriona. He painga i kō noa ātu i te $4.9 miriona o tē tau kua hori.
Ko ngā whakapainga mo tēnei ahuatanga na ngā kaiwhakahaere rātou me te hunga mahi i tāea ai. Na rātou, me tō rātou kaha, mē te tino ū ki te whakatau, Te Whakaaratanga o Aotearoa ki ngā Rīangi Whakaata Katoa.
Na nga tikanga whakatahu o nga Whare Pakihi o Aotearoa, me rāwahi i uaua ai te ara. Na nga karo a Te Reo Tātaki me nga kaupare atu i nga taumahatanga o nga tikanga ā ao, me te kukuti anō o nga ahuatanga utu i pai ai. Nā te titiro whānui anō ki ngā huarahi i te wātea mai, i ū ai.
Nā ngā taumata whakaritenga a TV ONE raua ko TV2 i eke ai nga hua o nga kaupapa whakawai me te wāhanga e tika āna mo nga pouaka whakaata, huri noa. E 80.6 ōrau te huanga ō nga tikanga whakawai ō ngā pouaka whakaata mo te tau.
I Ākitia e Te Reo Tātaki ōna pae mamati. I tēnei wā i oti te whakatū i nga taputapu, e hia miriona nei te utu, e taea ai te pānui i aua mea mamati. Ma ēnei āhuatanga ē taea ai e mātou nga kaupapa whakaata, me ōna hononga ki nga ahuatanga maha ki nga rorohiko.
Na ēnei ahuatanga i māunu ai i Te Reo Tātaki nga whakāturanga hou, kō U tera, ma te hunga taitamariki, me te hono atu ki era o nga tikanga e whāia nei e te rangatahi, a Facebook me TVNZ KIDZone24. He tino hou ēnei tikanga. He teihana ā utu anō kua timata ma nga tamariki nohinohi me ō rātou mātua kua kanapa mai ki te ao i runga i a Sky.
I te marama o Hurae i tenei tau i puta he wāhanga hou ki te ture o te tau 2003, e pa ana ki ngā Pouaka Whakaata. Kua mana te rangatiratanga o Te Reo Tātaki me ōna kārangatanga maha hei Pouaka Whakaata Matua mo Aotearoa. I whakakoretia te TVNZ Charter, engari kua ūhia ātu te whakahau kia puta i a ia nga taonga mā ngā iwi o Aotearoa, me tōnā kore anō e wareware ki te taha whai hua.
Ko te wā tēnei hei whakakorikori, hei whakaohooho mo nga mea hou kei mua i ā tātou. Kei te tū matāra ā Te Reo Tātaki ki ngā wero me ngā angitu ka pupū mai ki tōna aroaro i tēnei wā.
Sir John Anderson

6 TVNZ ANNUAL REPORT FY2011
ChiEF ExECUTiVE's OVERViEw
Rick Ellis
wE ARE CONTiNUiNg TO bUiLd mOmENTUm. A NUmbER OF kEY TRANsFORmATiONAL PROjECTs wERE COmPLETEd This YEAR whiCh iNCREAsEd PROdUCTiViTY ANd EFFiCiENCY ANd shARPENEd OUR CONsUmER ANd CUsTOmER FOCUs.
7TVNZ ANNUAL REPORT FY2011
TVNZ has produced an excellent annual result that confirms its position as New Zealand’s leading free-to-air television and digital media company.
The Company rationalised operating costs, increased advertising market share and recorded excellent on screen performances. We’ve succeeded by continuing to be agile, and by pushing ahead with our strategy to grow our business.
Despite a challenging economic climate, TVNZ maintained its leadership position in the New Zealand advertising media sector by keeping customer focus and innovation at the forefront of its business.
TVNZ has evolved from an analogue two channel television network into a multi-channel, multi-platform digital broadcaster in the space of a few short years.
A number of key transformational projects were completed this year which increased productivity and efficiency and sharpened our consumer and customer focus. Our goal is to do even better in the year ahead.
The Company’s progress against the business priorities contained in our 2011 Statement of Intent is set out below.
Adapt TV ONE’s brand and content strategies to meet commercial performance expectations and maintain the performance of TV2.
TV ONE and TV2 are at the heart of TVNZ’s business. Our two flagship channels dominate New Zealand primetime; between them, they broadcast 19 out of the 20 most watched programmes.
Both channels exceeded all their commercial audience and yield targets for the year. They were the only free-to-air channels to grow audience share over the year – up 2.4% – a pleasing achievement in today’s increasingly fragmented and competitive media market.
TV ONE is TV’s answer to the Kiwi backyard. This authentic, confident and passionate brand positioning reflects contemporary New Zealand life and has clearly resonated with viewers throughout the year.
TV ONE’s commercial performance was fuelled by strong local content in the form of MasterChef New Zealand, North, The Politically Incorrect Guide to Teenagers, Intrepid Journeys and Country Calendar.
The channel’s stable of news and current affairs programming continues to outperform the competition. ONE News again won the coveted Qantas Award for Best News in recognition of outstanding journalism.
TV2 is second to none in its demographic. At the close of the financial year, TV2 boasted an unbroken 32-month run as the country’s most watched channel in its target demographic of all people 18-39. The channel’s success is underpinned by a compelling mix of local and international drama and comedy. Our homegrown hit, Shortland Street, anchored the channel’s weeknight performance, and another New Zealand
commission, Go Girls, finished its third season as the country’s most popular local weekly drama.
Complete the current transformation projects and deliver a more efficient and lower operating cost structure across the Company.
The Company completed the implementation of its new multi-million dollar digital infrastructure, on time and under budget. This marks a major milestone in our evolution as a modern, well-equipped television and digital media company.
The new digital playout facility has reduced costs, streamlined operations and fundamentally changed the way we work. It provides high definition capability and will continue to improve how we produce, manage and deliver content to screens in the years to come.
At the same time, news and current affairs operations have been restructured to fit the Company’s multi-media strategy. The transformation involved the introduction of new technology, training to develop multi-skilled staff and a reorganisation of news gathering processes. Instead of a number of different programmes chasing after the same story and duplicating resources, a reporter and a producer are assigned to see a story through the whole day across a number of programmes and platforms.
Align commissioning, production resources and facilities to support the content strategies and meet agreed TVNZ commercial objectives.
Being the nation’s content leader is one of the central pillars of our Inspiring New Zealanders on Every Screen strategy. To survive in this multi-device world where choice is only a click away, TVNZ must deliver content that is accessible, relevant and interesting in form and delivery.
To this end, TVNZ established an in-house Creative Hub to bring our people’s incredible talent and creative work to the forefront of our business. The Hub has consolidated the creative effort to deliver integrated marketing campaigns for our clients, customers and viewers. Bringing our Digital, Commissioning, News, Sales and Production Facility teams into closer alignment enables the organisation to respond with greater agility to market demands.
TVNZ’s Technology department has also been reshaped to better support the new digital playout facility workflows. The new structure has better leveraged our current investments, consolidated operations and systems, reduced complexity and improved performance.
Grow TVNZ’s market share of television advertising and share of the total advertising market across TVNZ’s content and channels.
TVNZ cemented its position as the preferred television and digital media company for advertisers and agencies. Our Sales team has done an exceptional job of converting the Company’s audience growth into significant revenue gains.
8 TVNZ ANNUAL REPORT FY2011
TVNZ increased its share of ad revenue to 63% from 61% and secured the lion’s share (80.6%) of the market’s total growth of 5%. Our strong advertising revenue and share growth are a testament to the strength of our programming and our overarching business imperative to reach more New Zealanders in more ways.
Grow the existing, and develop new, business activities where they generate positive commercial returns.
TVNZ is continuing to expand the distribution of its core programming to non-traditional screens. During the year the Company launched two new channels; free-to-air interactive channel U – which replaced TVNZ 6 – and a second pay channel, TVNZ Kidzone24, on the Sky platform.
The Kidzone brand began life on TVNZ 6 before becoming a channel in its own right. Today, TVNZ Kidzone24 is the country’s only locally produced children’s channel.
The youthful start-up channel U attracted a cumulative audience of 1.4 million Kiwis in the four week period ending 14 May 2011 – the largest audience reach at launch recorded outside the five main free-to-air channels.
Heartland celebrated its first anniversary on air in June 2011. Its 100% local line-up has succeeded in carving out a niche with its target demographic of 40-64 year olds, reaching on average 29% of this audience each month.
TVNZ’s expanded screen presence has created new opportunities for our commercial clients. Rather than simply purchasing air time, advertisers are turning to TVNZ for broad-based media propositions and business solutions.
TVNZ continues to grow and diversify its digital media presence. TVNZ Ondemand is the market leading platform for video on demand; its unique viewers grew 7.4%, while tvnz.co.nz’s unique browsers grew 19.2%. Our new iPhone and iPad apps have been downloaded over 150,000 times and have over 55,000 active monthly users.
TVNZ has a 33% stake in Hybrid Television, the licensee of the TiVo PVR in New Zealand and Australia. Hybrid has faced an extremely competitive market in Australia and operating margins could not be sustained. While the investment in Hybrid has not produced the expected returns, TVNZ is committed to Hybrid’s ongoing support of the TiVo media device.
Reach agreement with the Shareholder on the demarcation between TVNZ’s public and commercial broadcasting activities.
The Government has decided not to fund TVNZ 7 past June 2012. After this cut-off, TVNZ’s remaining public service broadcast activities – audio descriptions, captioning, the TVNZ Pacific Service and maintenance of non-commercial transmission sites – will be a comparatively small part of the Company’s broadcast operations.
Participate in Digital Switch On (DSO) planning and implementation.
The Government has announced that New Zealand will complete the switch to digital television by November 2013. All of New Zealand will receive the benefit of enhanced reception, better picture quality and more channels when the country transitions from analogue transmission to a digital television environment. TVNZ is taking an active role in the switch over, working closely with the Ministry for Culture and Heritage, the Ministry of Economic Development and key industry groups to help pave the way for a smooth and successful transition. Already 80% of homes with TVs have made the switch. In September 2012 the Hawke’s Bay and the West Coast will be the first regions in New Zealand to receive television signals via digital transmission only. The rest of the country will be switched over in four stages with the process completed by the end of 2013.
Our hard work over the last year has really paid off. Our strategy is working, and we’re delivering strongly for our clients, our viewers and consumers.
Along the way, we picked up a number of top industry awards for content, business innovation and creativity. TVNZ won the CAANZ Media Brand of the Year Award for 2011, and was named one of New Zealand’s top three most attractive employers by Randstad.
With deep professional respect and personal admiration I want to thank management and staff for their work this year.
Our people showed true grit in testing times. The Christchurch earthquakes and Pike River mine disaster brought home the vital importance of our news service to the country. I want to pay special tribute to all our hardworking staff who kept New Zealand informed in the aftermath of these tragic events.
The economic environment will continue to throw challenges our way. Despite the enormous changes going on in the industry, the Company faces the future with confidence and enthusiasm.
Rick Ellis
TVNZ’s ExPANdEd sCREEN PREsENCE hAs CREATEd NEw OPPORTUNiTiEs FOR OUR COmmERCiAL CLiENTs.
9TVNZ ANNUAL REPORT FY2011
TVNZ has reported total revenue of $377.9 million, a 6.3% increase on the prior year; and underlying operating earnings of $31.8 million, up 164% from the previous year.The increase in total revenue of $22.5 million from the prior year was driven by improved television advertising revenues.
Television advertising revenues increased $18 million (6.5%) on the prior year to $302.7 million. TVNZ increased its share of all television advertising from 61% to 63%, and captured 80.6% of all growth in television advertising for the year ended 30 June 2011. TVNZ share of television advertising revenue in the June 2011 quarter was the highest since the March 2006 quarter.
The reduction in government funding revenue reflects the withdrawal of the direct funding that TVNZ received for giving effect to the TVNZ Charter and the closure of TVNZ 6 digital channel during the year.
Programme funding is recognised as revenue as the programme cost is recognised as an expense (programme amortisation) in the income statement. The reduced level of funding revenue also reflects the lower level of TVNZ directly funded programmes being broadcast.
Total operating costs have been broadly kept at the prior year levels (a year on year increase of 0.8%). The cost reduction initiatives adopted in 2009/2010 in response to the recession have been sustained through the current financial year.
While the Company continues to restructure to reduce operating costs, it has also continued to invest in the transformation of TVNZ. During the year TVNZ completed its new digital media management and multi-channel playout infrastructure and largely completed the News multi-media transformation project.
TVNZ’s programme of transformation continues with the announcement of plans to move the production of the Good Morning programme to Auckland in 2012 and the exit and sale of the Avalon television production facility after June 2013.
Underlying operating earnings were $31.8 million, an increase of $19.8 million (164%) on prior year and an increase of $25.4 million on FY2009.
The disciplined approach to managing costs out of the business while continuing to focus on the performance of our channels, increasing our revenue share and digital media activities has delivered an outstanding turnaround of our underlying operating earnings over the past two years.
TVNZ has reported an after tax profit of $2.1 million, compared with an after tax loss of $26 million for the prior year. TVNZ has impaired its investment in Hybrid Television Services (ANZ) Pty Ltd (Hybrid), recognised a share of operating losses and made provision for future operating costs of the company. This has resulted in a one-off charge of $17.7 million against this year’s operating results.
Excluding this one-off adjustment, the normalised after tax profit was $19.7 million. This is an increase of $12.8 million on the normalised after tax profit for the prior year. Note: the prior year result included two non-recurring accounting adjustments relating to a programme amortisation revision and tax legislation changes for depreciation allowances on buildings.
TVNZ declared a dividend of $13.8 million, being 70% of normalised after tax profit, to be paid at the end of September.
FiNANCiAL PERFORmANCE
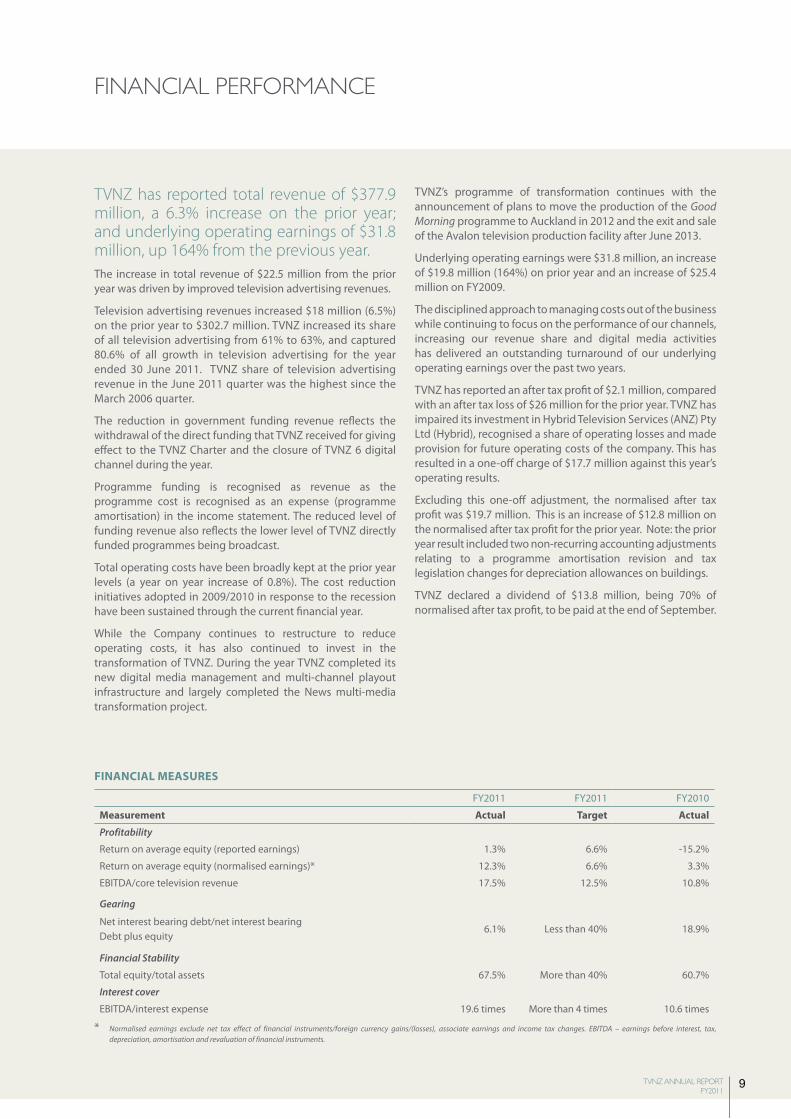
FiNANCiAl mEASuRES
FY2011 FY2011 FY2010
measurement Actual Target Actual
Profitability
Return on average equity (reported earnings) 1.3% 6.6% -15.2%
Return on average equity (normalised earnings)* 12.3% 6.6% 3.3%
EBITDA/core television revenue 17.5% 12.5% 10.8%
Gearing
Net interest bearing debt/net interest bearing Debt plus equity
6.1% Less than 40% 18.9%
Financial Stability
Total equity/total assets 67.5% More than 40% 60.7%
Interest cover
EBITDA/interest expense 19.6 times More than 4 times 10.6 times
* Normalised earnings exclude net tax effect of financial instruments/foreign currency gains/(losses), associate earnings and income tax changes. EBITDA – earnings before interest, tax, depreciation, amortisation and revaluation of financial instruments.
10 TVNZ ANNUAL REPORT FY2011
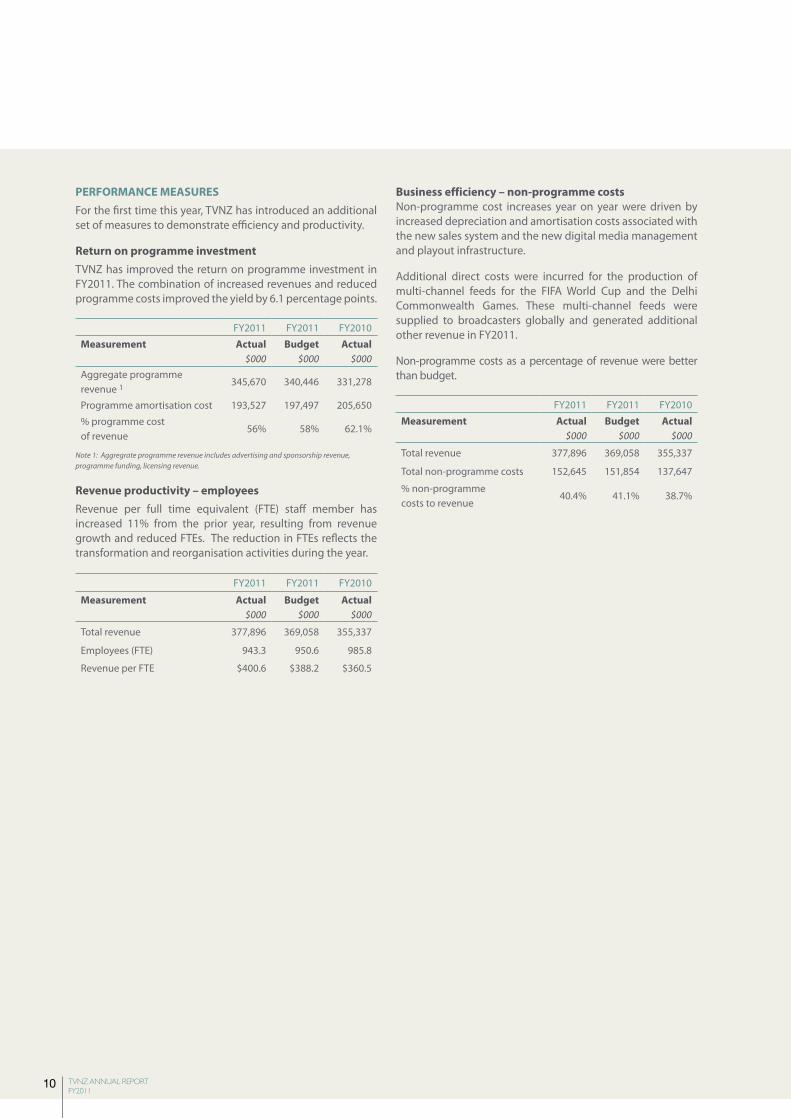
PERFORmANCE mEASuRESFor the first time this year, TVNZ has introduced an additional set of measures to demonstrate efficiency and productivity.
Return on programme investment TVNZ has improved the return on programme investment in FY2011. The combination of increased revenues and reduced programme costs improved the yield by 6.1 percentage points.
FY2011 FY2011 FY2010
measurement Actual $000
Budget $000
Actual $000
Aggregate programme revenue 1
345,670 340,446 331,278
Programme amortisation cost 193,527 197,497 205,650
% programme cost of revenue
56% 58% 62.1%
Note 1: Aggregrate programme revenue includes advertising and sponsorship revenue, programme funding, licensing revenue.
Revenue productivity – employeesRevenue per full time equivalent (FTE) staff member has increased 11% from the prior year, resulting from revenue growth and reduced FTEs. The reduction in FTEs reflects the transformation and reorganisation activities during the year.
FY2011 FY2011 FY2010
measurement Actual $000
Budget $000
Actual $000
Total revenue 377,896 369,058 355,337
Employees (FTE) 943.3 950.6 985.8
Revenue per FTE $400.6 $388.2 $360.5
Business efficiency – non-programme costsNon-programme cost increases year on year were driven by increased depreciation and amortisation costs associated with the new sales system and the new digital media management and playout infrastructure.
Additional direct costs were incurred for the production of multi-channel feeds for the FIFA World Cup and the Delhi Commonwealth Games. These multi-channel feeds were supplied to broadcasters globally and generated additional other revenue in FY2011.
Non-programme costs as a percentage of revenue were better than budget.
FY2011 FY2011 FY2010
measurement Actual $000
Budget $000
Actual $000
Total revenue 377,896 369,058 355,337
Total non-programme costs 152,645 151,854 137,647
% non-programme costs to revenue
40.4% 41.1% 38.7%
11TVNZ ANNUAL REPORT FY2011
TVNZ’s public profile carries a special mandate for it to step out of the box and be a positive influence in society. This reflects both its privileged position in the homes of the nation as a primary source of information and entertainment, and its responsibilities to the public as a Crown-owned company.
ENViRONmENTAl SuSTAiNABiliTYTVNZ has adopted a number of measures to lessen its impact on the environment. Greener travel choices, waste management and energy efficiency initiatives have successfully reduced TVNZ’s carbon footprint this year.
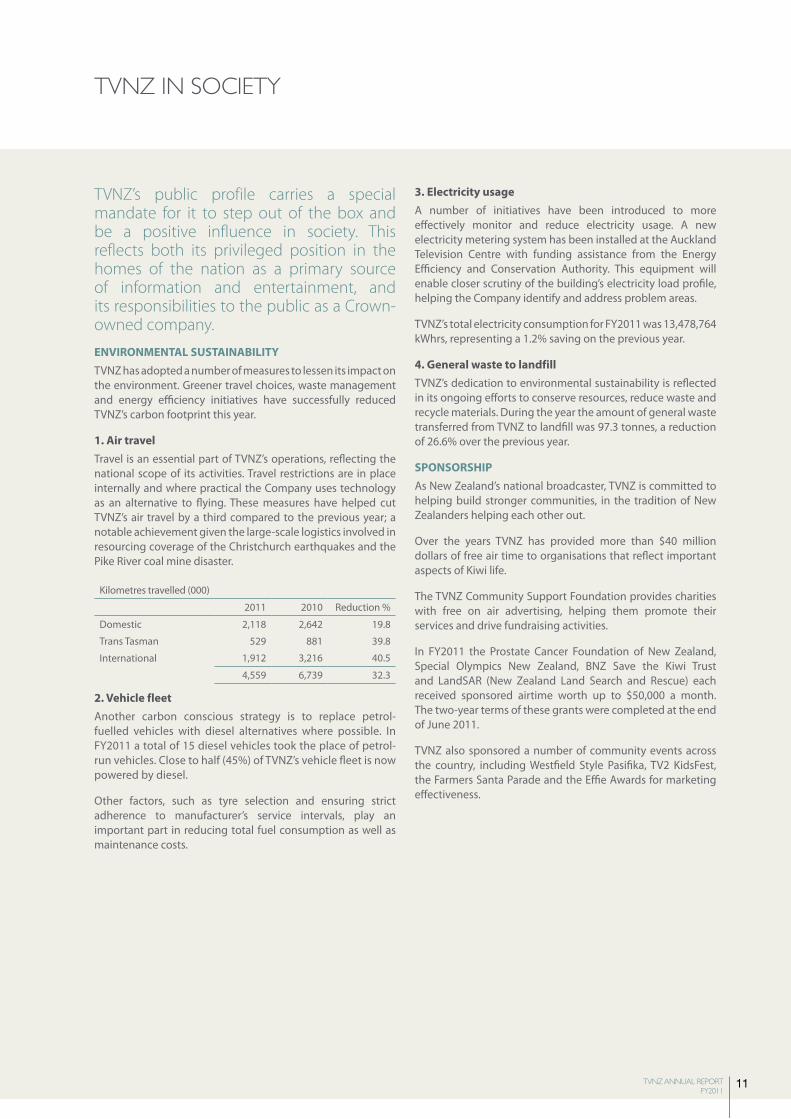
1. Air travel Travel is an essential part of TVNZ’s operations, reflecting the national scope of its activities. Travel restrictions are in place internally and where practical the Company uses technology as an alternative to flying. These measures have helped cut TVNZ’s air travel by a third compared to the previous year; a notable achievement given the large-scale logistics involved in resourcing coverage of the Christchurch earthquakes and the Pike River coal mine disaster.
Kilometres travelled (000)
2011 2010 Reduction %
Domestic 2,118 2,642 19.8
Trans Tasman 529 881 39.8
International 1,912 3,216 40.5
4,559 6,739 32.3
2. Vehicle fleet Another carbon conscious strategy is to replace petrol-fuelled vehicles with diesel alternatives where possible. In FY2011 a total of 15 diesel vehicles took the place of petrol-run vehicles. Close to half (45%) of TVNZ’s vehicle fleet is now powered by diesel.
Other factors, such as tyre selection and ensuring strict adherence to manufacturer’s service intervals, play an important part in reducing total fuel consumption as well as maintenance costs.
3. Electricity usage A number of initiatives have been introduced to more effectively monitor and reduce electricity usage. A new electricity metering system has been installed at the Auckland Television Centre with funding assistance from the Energy Efficiency and Conservation Authority. This equipment will enable closer scrutiny of the building’s electricity load profile, helping the Company identify and address problem areas.
TVNZ’s total electricity consumption for FY2011 was 13,478,764 kWhrs, representing a 1.2% saving on the previous year.
4. General waste to landfill TVNZ’s dedication to environmental sustainability is reflected in its ongoing efforts to conserve resources, reduce waste and recycle materials. During the year the amount of general waste transferred from TVNZ to landfill was 97.3 tonnes, a reduction of 26.6% over the previous year.
SPONSORSHiPAs New Zealand’s national broadcaster, TVNZ is committed to helping build stronger communities, in the tradition of New Zealanders helping each other out.
Over the years TVNZ has provided more than $40 million dollars of free air time to organisations that reflect important aspects of Kiwi life.
The TVNZ Community Support Foundation provides charities with free on air advertising, helping them promote their services and drive fundraising activities.
In FY2011 the Prostate Cancer Foundation of New Zealand, Special Olympics New Zealand, BNZ Save the Kiwi Trust and LandSAR (New Zealand Land Search and Rescue) each received sponsored airtime worth up to $50,000 a month. The two-year terms of these grants were completed at the end of June 2011.
TVNZ also sponsored a number of community events across the country, including Westfield Style Pasifika, TV2 KidsFest, the Farmers Santa Parade and the Effie Awards for marketing effectiveness.
TVNZ iN sOCiETY
12 TVNZ ANNUAL REPORT FY2011
CAPABiliTYOur staff give us a competitive edge. During the year TVNZ devoted significant energy into developing internal capacity to support the business’ ongoing transformation and diversification.
Senior executives embarked on a leadership programme that concentrated on working in a matrix environment. This dynamic new way of operating draws people together across disciplines to address an issue, promoting faster response and collaboration.
The Company’s in-house management development programme tapped into the potential of high performing staff. This initiative supports succession and development planning for both TVNZ and the individual.
Now in its third year, TVNZ’s performance framework continues to drive a culture of excellence and accountability.
Work continued in the News and Current Affairs and Production Services and Technology areas to embed a new working environment. The establishment of these progressive new work hubs has been supported with ongoing training and skills development.
GOOD EmPlOYER TVNZ supported its Christchurch employees through the September and February earthquakes as they dealt with the enormity of the situation in their city. The recovery effort will be an ongoing process and TVNZ will there for the long haul. The Company will continue to provide confidential counselling and sustained support to all affected staff.
TVNZ was named one of New Zealand’s top three most attractive employers at the 2011 Randstad Awards. Decided by public vote, the awards are a clear sign that Kiwi jobseekers think TVNZ is an employer of choice.
In-house, our culture and branding work continues apace. A lively and engaging staff programme of events enhances the experience of being part of the TVNZ team. TVNZ’s “inside out” approach reflects that staff play a definitive role in shaping the organisation’s success.
Employees are kept informed through various communication channels, including strategy and Company update sessions with the CEO.
There continues to be support for wellness initiatives such as on-site yoga classes, and subsidies for gym membership. Employees also enjoy a subsidised cafeteria with healthy options and an on-site child care facility.
13TVNZ ANNUAL REPORT FY2011
gENERAL ChARTER mEAsUREs
These measures highlight national and international programming across all genres that entertains, informs and educates New Zealand audiences.
General output measures Number of local content hours per genre across TV ONE and TV2.*
6am – 12 midnight
First run Repeat Total
Entertainment 194.2 253.1 447.3
Factual and arts 1,049.8 233.4 1,283.2
Kids 210.0 201.3 411.3
Maori 208.5 45.0 253.5
Lifestyle 15.5 61.9 77.4
News and current affairs 1,682.2 78.3 1,760.5
Sport 335.2 5.6 340.8
3,695.4 878.6 4,574.0
local content totals
TV ONE TV2 TVNZ
Total hours 3,601.4 972.4 4,573.8
% schedule 54.8% 14.8% 34.8%
* Genres by percentage of schedule for both digital channels are reported on in the Statement of Service Performance.
General engagement measures Average monthly cumulative audience (all people 5+) of TVNZ channels:
• 3,821,100 people aged 5+ watched a TVNZ channel in an average month, which represents 94.8% of all the 5+ population.
Number of TVNZ programmes within the yearly top 20 programme lists in the demographics of 5+, 25-54 and 18-39:
• 20 out of 20 programmes in all people 5+• 19 out of 20 programmes in 25-54• 19 out of 20 programmes in 18-39.
Online measuresThe average monthly number of unique viewers of TVNZ Ondemand streams for FY2011: 308,586, up 7.4% from FY2010.(Source: Nielsen Online NZ Market Intelligence)
The average monthly number of unique browsers for tvnz.co.nz: 1,737,381, up 19.2% from FY2010.(Source: Nielsen Online NZ Market Intelligence)
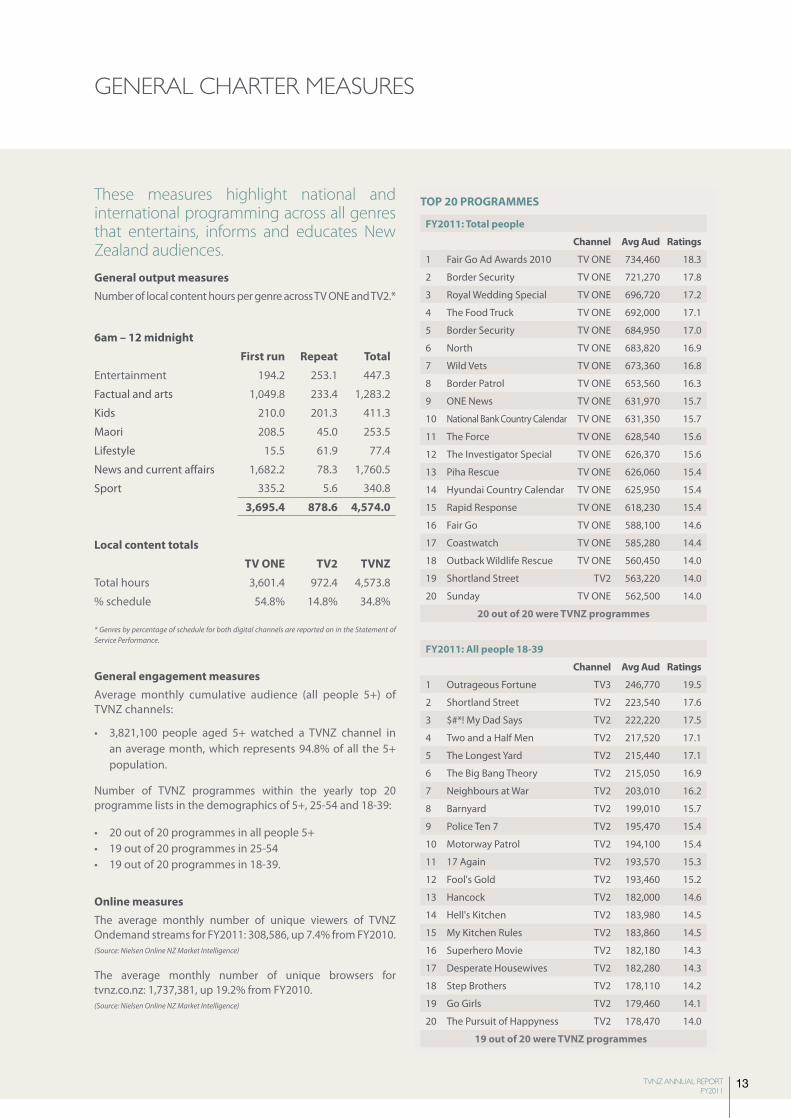
TOP 20 PROGRAmmES
FY2011: Total people
Channel Avg Aud Ratings
1 Fair Go Ad Awards 2010 TV ONE 734,460 18.3
2 Border Security TV ONE 721,270 17.8
3 Royal Wedding Special TV ONE 696,720 17.2
4 The Food Truck TV ONE 692,000 17.1
5 Border Security TV ONE 684,950 17.0
6 North TV ONE 683,820 16.9
7 Wild Vets TV ONE 673,360 16.8
8 Border Patrol TV ONE 653,560 16.3
9 ONE News TV ONE 631,970 15.7
10 National Bank Country Calendar TV ONE 631,350 15.7
11 The Force TV ONE 628,540 15.6
12 The Investigator Special TV ONE 626,370 15.6
13 Piha Rescue TV ONE 626,060 15.4
14 Hyundai Country Calendar TV ONE 625,950 15.4
15 Rapid Response TV ONE 618,230 15.4
16 Fair Go TV ONE 588,100 14.6
17 Coastwatch TV ONE 585,280 14.4
18 Outback Wildlife Rescue TV ONE 560,450 14.0
19 Shortland Street TV2 563,220 14.0
20 Sunday TV ONE 562,500 14.0
20 out of 20 were TVNZ programmes
FY2011: All people 18-39
Channel Avg Aud Ratings
1 Outrageous Fortune TV3 246,770 19.5
2 Shortland Street TV2 223,540 17.6
3 $#*! My Dad Says TV2 222,220 17.5
4 Two and a Half Men TV2 217,520 17.1
5 The Longest Yard TV2 215,440 17.1
6 The Big Bang Theory TV2 215,050 16.9
7 Neighbours at War TV2 203,010 16.2
8 Barnyard TV2 199,010 15.7
9 Police Ten 7 TV2 195,470 15.4
10 Motorway Patrol TV2 194,100 15.4
11 17 Again TV2 193,570 15.3
12 Fool's Gold TV2 193,460 15.2
13 Hancock TV2 182,000 14.6
14 Hell's Kitchen TV2 183,980 14.5
15 My Kitchen Rules TV2 183,860 14.5
16 Superhero Movie TV2 182,180 14.3
17 Desperate Housewives TV2 182,280 14.3
18 Step Brothers TV2 178,110 14.2
19 Go Girls TV2 179,460 14.1
20 The Pursuit of Happyness TV2 178,470 14.0
19 out of 20 were TVNZ programmes
14 TVNZ ANNUAL REPORT FY2011
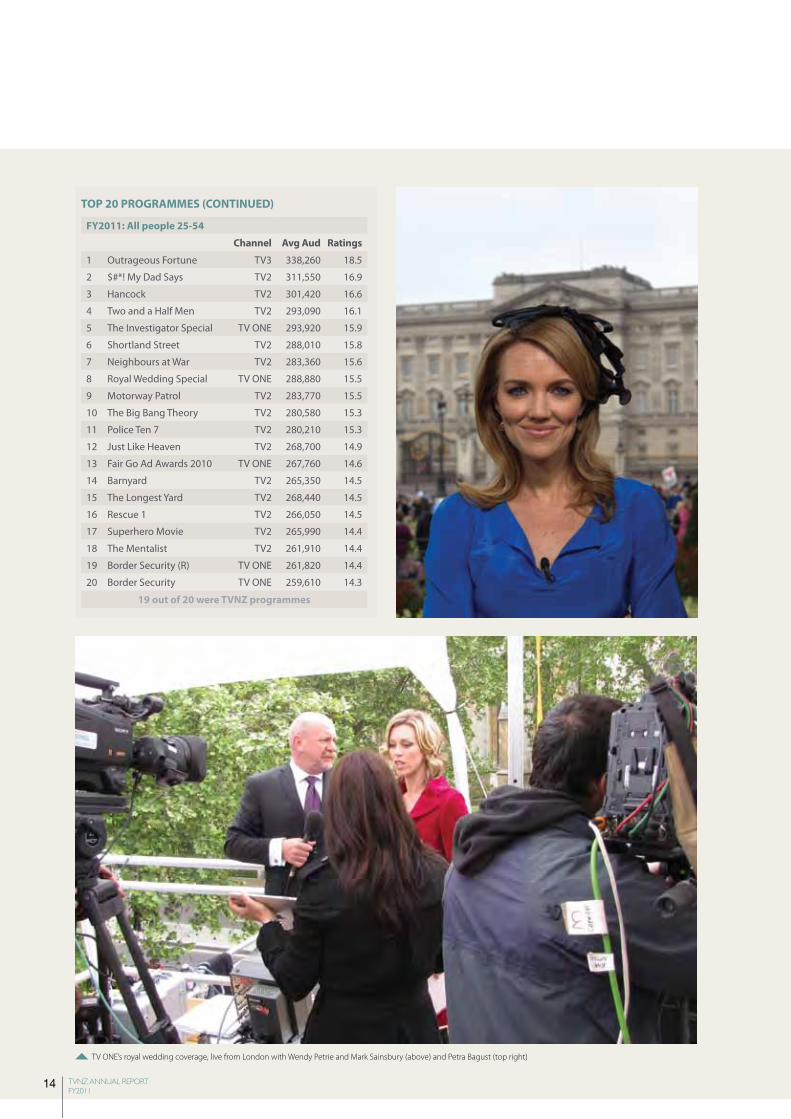
TOP 20 PROGRAmmES (CONTiNuED)
FY2011: All people 25-54
Channel Avg Aud Ratings
1 Outrageous Fortune TV3 338,260 18.5
2 $#*! My Dad Says TV2 311,550 16.9
3 Hancock TV2 301,420 16.6
4 Two and a Half Men TV2 293,090 16.1
5 The Investigator Special TV ONE 293,920 15.9
6 Shortland Street TV2 288,010 15.8
7 Neighbours at War TV2 283,360 15.6
8 Royal Wedding Special TV ONE 288,880 15.5
9 Motorway Patrol TV2 283,770 15.5
10 The Big Bang Theory TV2 280,580 15.3
11 Police Ten 7 TV2 280,210 15.3
12 Just Like Heaven TV2 268,700 14.9
13 Fair Go Ad Awards 2010 TV ONE 267,760 14.6
14 Barnyard TV2 265,350 14.5
15 The Longest Yard TV2 268,440 14.5
16 Rescue 1 TV2 266,050 14.5
17 Superhero Movie TV2 265,990 14.4
18 The Mentalist TV2 261,910 14.4
19 Border Security (R) TV ONE 261,820 14.4
20 Border Security TV ONE 259,610 14.3
19 out of 20 were TVNZ programmes
TV ONE’s royal wedding coverage, live from London with Wendy Petrie and Mark Sainsbury (above) and Petra Bagust (top right)
15TVNZ ANNUAL REPORT FY2011
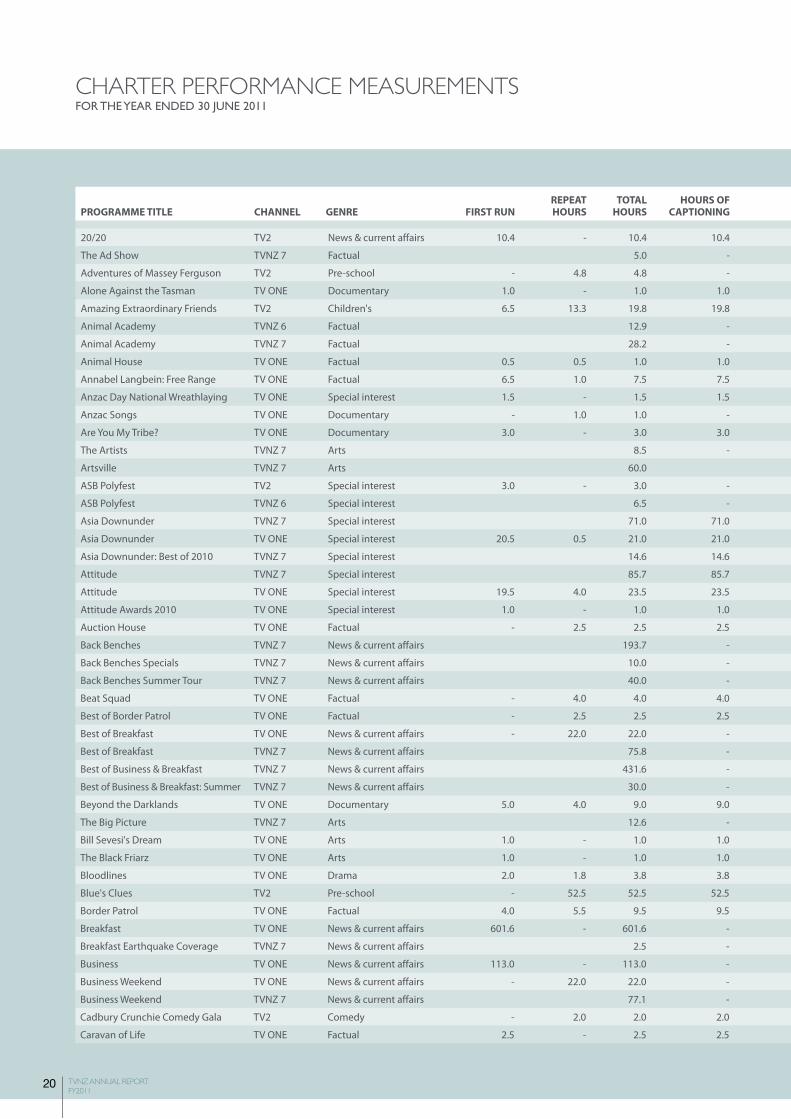
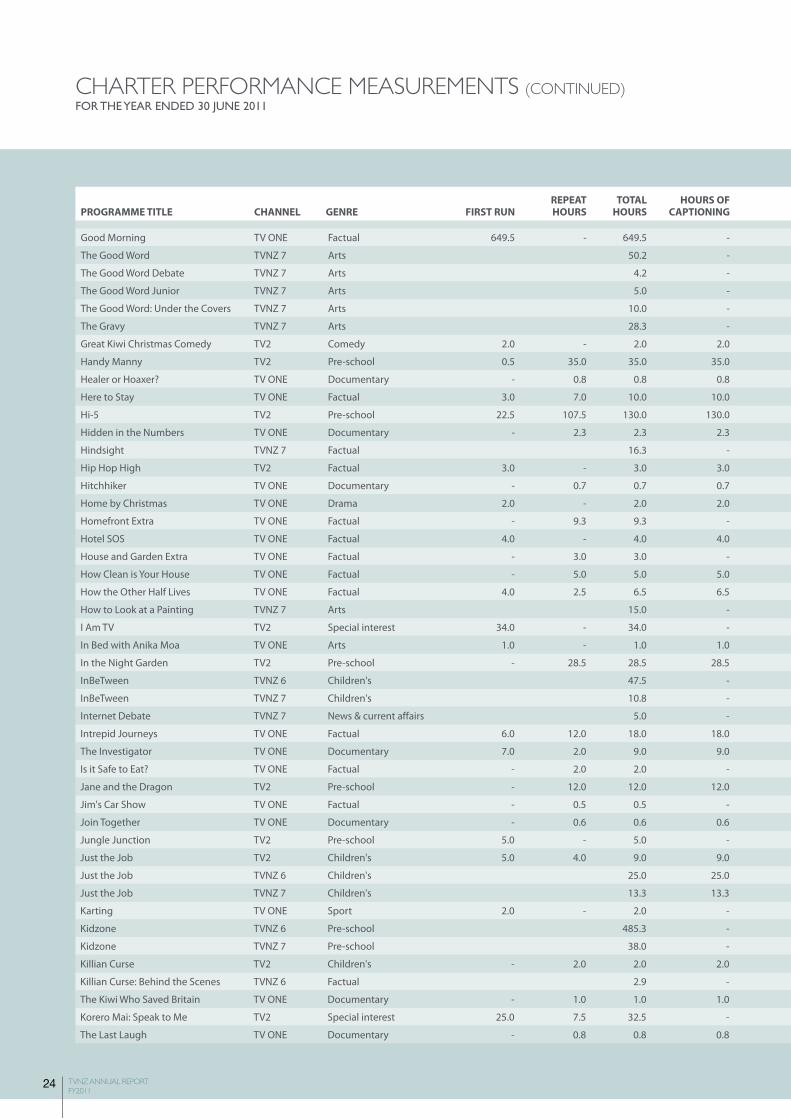
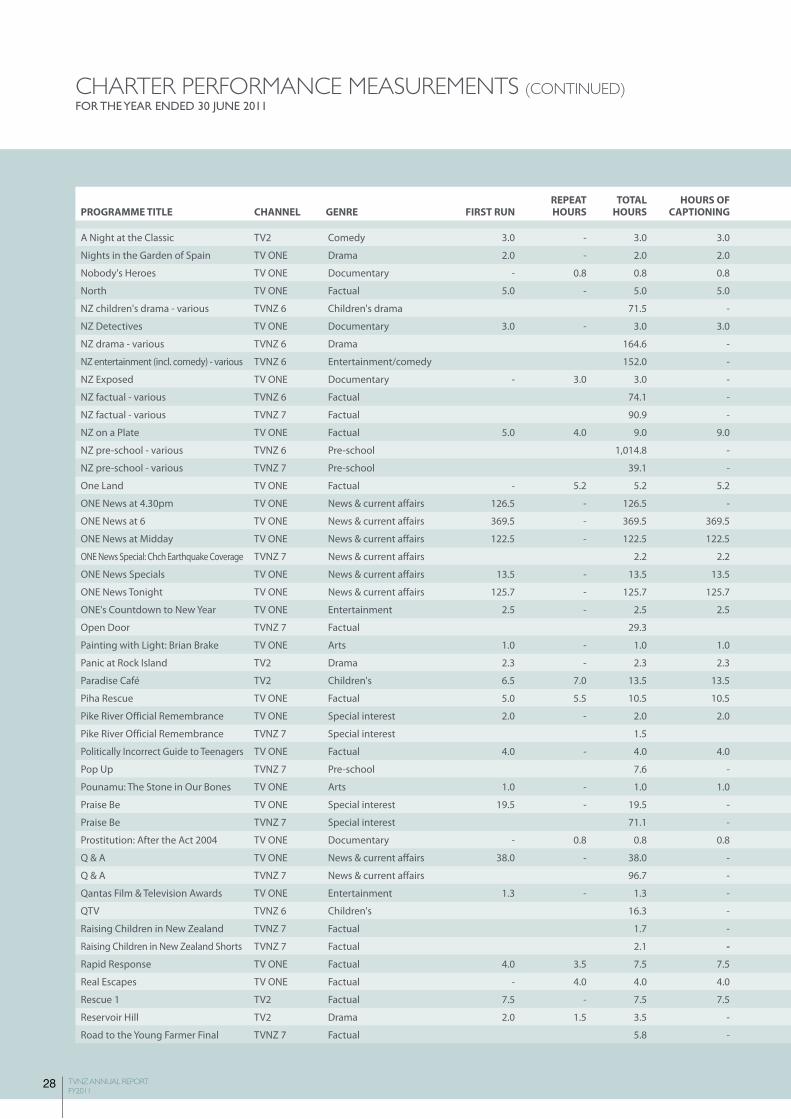
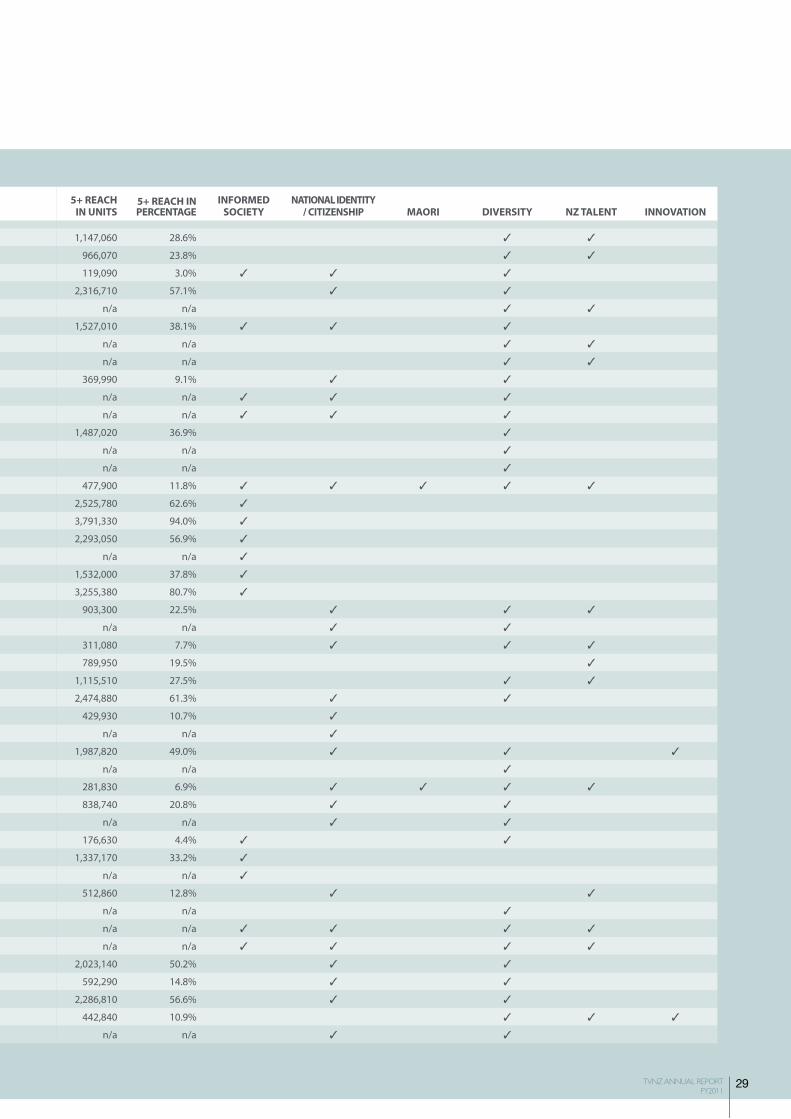
ChARTER PERFORmANCE mEAsUREmENTs
In July 2011 the Government passed legislation that repealed the TVNZ Charter, which has guided TVNZ’s public service broadcasting obligations since 2003. As it was still in existence for the period under review, TVNZ continued to monitor and report its Charter performance against specific, non-commercial measures for the 2011 fiscal year.
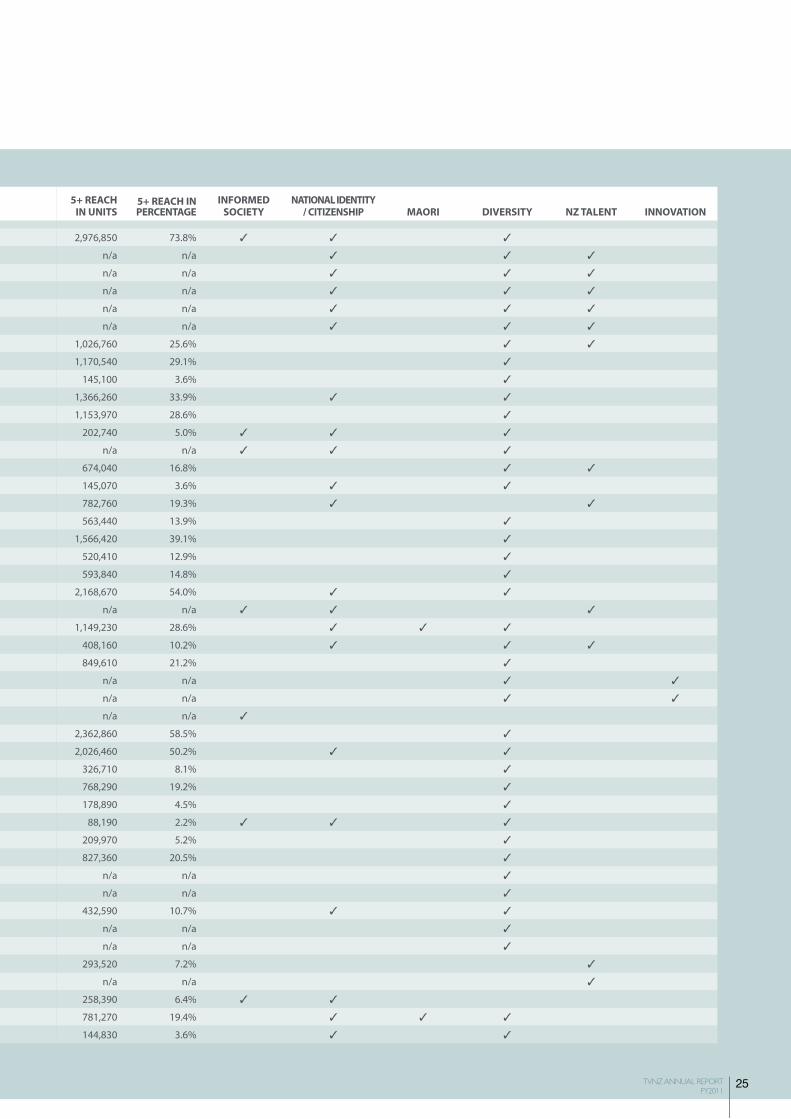
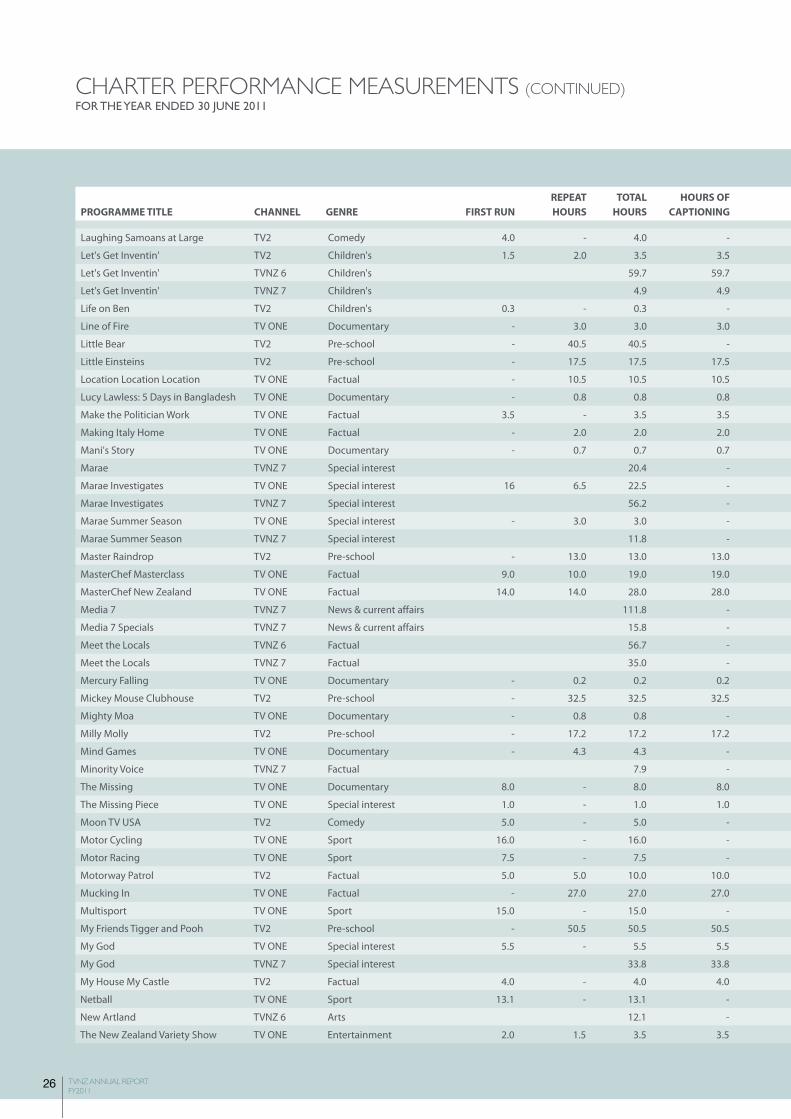
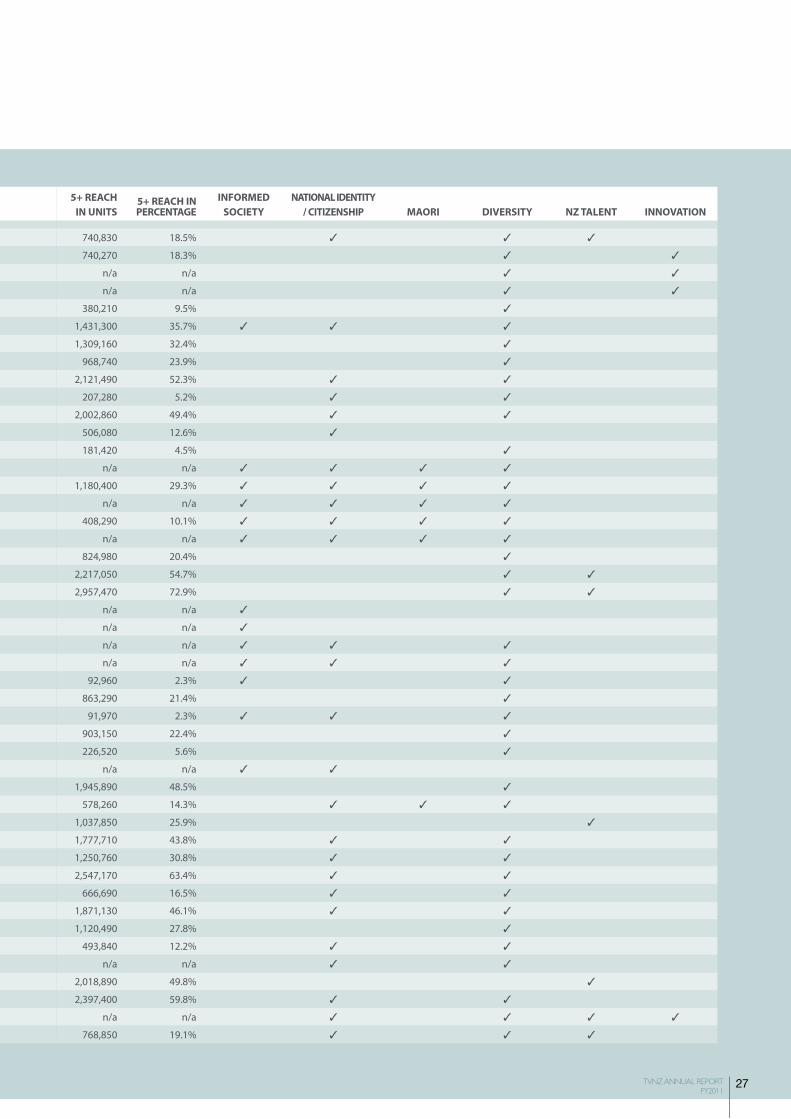
A comprehensive framework measured TVNZ’s performance against the Charter’s seven broad themes: an informed society, national identity/citizenship, Maori, diversity, high standards, innovation and New Zealand talent.
Programmes were assessed against each theme through a combination of quality, reach, impact and output measures. Reach is a measure of usage. Impact is a measure of external effects such as awards and industry or peer recognition of achievement. Output is the number of hours of content delivered.
QuAliTYAppreciation/importance surveyA unique ‘appreciation/importance survey’ was conducted as a way of gauging quality. This asked respondents to rank programmes from the point of view of both a viewer and a citizen. An individual may not like a particular programme personally, but as a citizen they may appreciate the fact that the national television broadcaster makes it available for those who do.
This survey demonstrates the commercial and public value of TVNZ programmes and identifies areas where the Company needs to improve its performance.
An independent research company conducted online quantitative research using a representative sample of 1000 people aged 18 and over in June 2011. This is the fourth year the survey has been carried out.
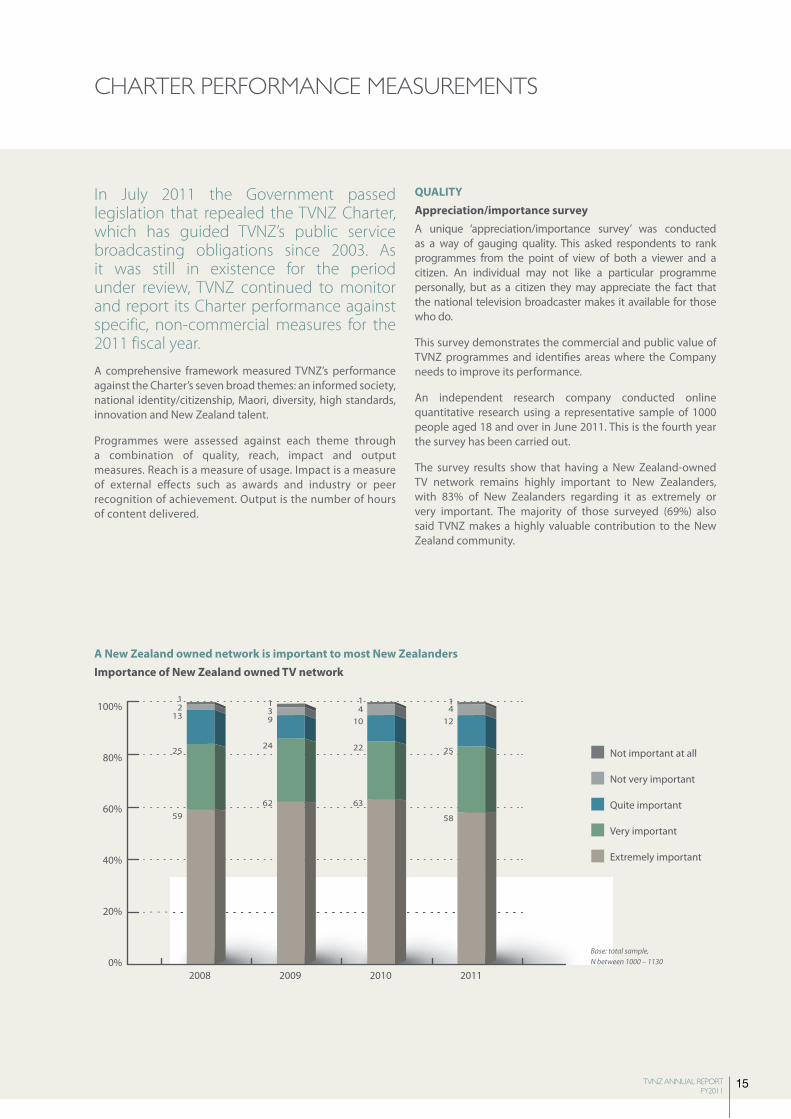
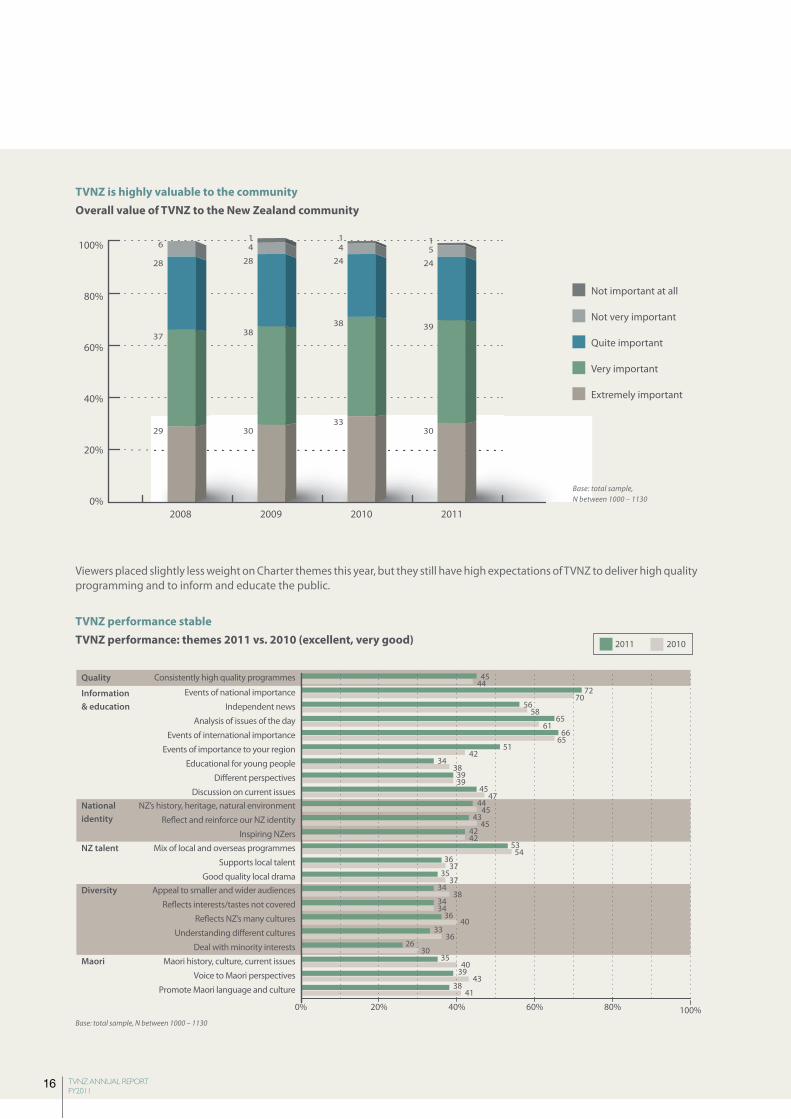
The survey results show that having a New Zealand-owned TV network remains highly important to New Zealanders, with 83% of New Zealanders regarding it as extremely or very important. The majority of those surveyed (69%) also said TVNZ makes a highly valuable contribution to the New Zealand community.
A New Zealand owned network is important to most New Zealandersimportance of New Zealand owned TV network
59
25
1321
62
24
931
63
22
1041
58
25
1241
2008 2009 2010 2011
100%
80%
60%
40%
20%
0%
Not important at all
Not very important
Quite important
Very important
Extremely important
Base: total sample, N between 1000 – 1130
16 TVNZ ANNUAL REPORT FY2011
Viewers placed slightly less weight on Charter themes this year, but they still have high expectations of TVNZ to deliver high quality programming and to inform and educate the public.
TVNZ is highly valuable to the communityOverall value of TVNZ to the New Zealand community
29
37
28
6
30
38
28
41
33
38
24
41
30
39
24
51100%
80%
60%
40%
20%
0%2008 2009 2010 2011
Not important at all
Not very important
Quite important
Very important
Extremely important
Base: total sample, N between 1000 – 1130
TVNZ performance stableTVNZ performance: themes 2011 vs. 2010 (excellent, very good)
4472
7056
5865
6166
6551
4234
383939
4547
4445
4345
4242
5354
3637
3537
3438
3434
3640
3336
2630
3540
3943
3841
45
0% 20% 60% 80%40% 100%
Consistently high quality programmes
Events of national importance
Independent news
Analysis of issues of the day
Events of international importance
Events of importance to your region
Educational for young people
Di�erent perspectives
Discussion on current issuesNZ’s history, heritage, natural environment
Re�ect and reinforce our NZ identity
Inspiring NZers
Mix of local and overseas programmes
Supports local talent
Good quality local dramaAppeal to smaller and wider audiences
Re�ects interests/tastes not covered
Re�ects NZ’s many cultures
Understanding di�erent cultures
Deal with minority interests
Maori history, culture, current issues
Voice to Maori perspectives
Promote Maori language and culture
Quality
Information
& education
National
identity
NZ talent
Diversity
Maori
Base: total sample, N between 1000 – 1130
20102011
17TVNZ ANNUAL REPORT FY2011
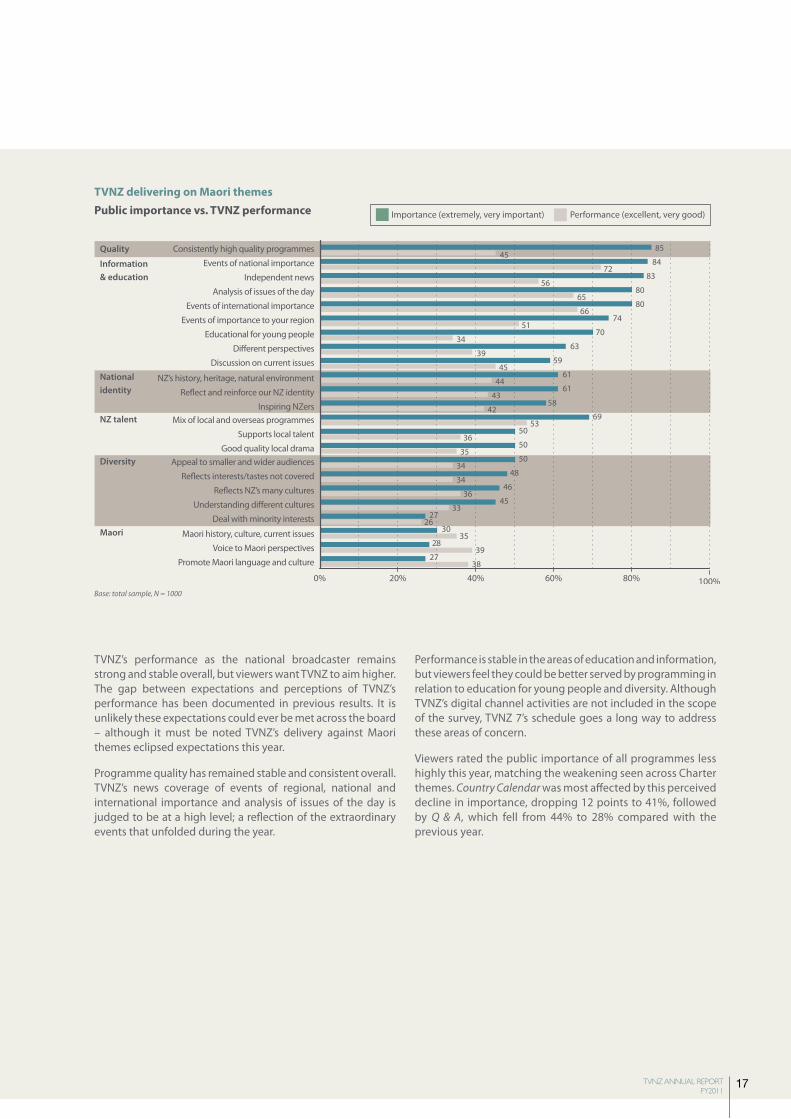
TVNZ delivering on maori themesPublic importance vs. TVNZ performance
0% 20% 60% 80%40% 100%
4584
7283
5680
6580
6674
5170
3463
3959
4561
4461
4358
4269
5350
3650
3550
3448
3446
3645
3327
2630
3528
3927
38
85Consistently high quality programmes
Events of national importance
Independent news
Analysis of issues of the day
Events of international importance
Events of importance to your region
Educational for young people
Di�erent perspectives
Discussion on current issues
NZ’s history, heritage, natural environment
Re�ect and reinforce our NZ identity
Inspiring NZersMix of local and overseas programmes
Supports local talent
Good quality local dramaAppeal to smaller and wider audiences
Re�ects interests/tastes not covered
Re�ects NZ’s many cultures
Understanding di�erent cultures
Deal with minority interests
Maori history, culture, current issues
Voice to Maori perspectives
Promote Maori language and culture
Quality
Information
& education
National
identity
NZ talent
Diversity
Maori
Base: total sample, N = 1000
Performance (excellent, very good)Importance (extremely, very important)
TVNZ’s performance as the national broadcaster remains strong and stable overall, but viewers want TVNZ to aim higher. The gap between expectations and perceptions of TVNZ’s performance has been documented in previous results. It is unlikely these expectations could ever be met across the board – although it must be noted TVNZ’s delivery against Maori themes eclipsed expectations this year.
Programme quality has remained stable and consistent overall. TVNZ’s news coverage of events of regional, national and international importance and analysis of issues of the day is judged to be at a high level; a reflection of the extraordinary events that unfolded during the year.
Performance is stable in the areas of education and information, but viewers feel they could be better served by programming in relation to education for young people and diversity. Although TVNZ’s digital channel activities are not included in the scope of the survey, TVNZ 7’s schedule goes a long way to address these areas of concern.
Viewers rated the public importance of all programmes less highly this year, matching the weakening seen across Charter themes. Country Calendar was most affected by this perceived decline in importance, dropping 12 points to 41%, followed by Q & A, which fell from 44% to 28% compared with the previous year.
18 TVNZ ANNUAL REPORT FY2011
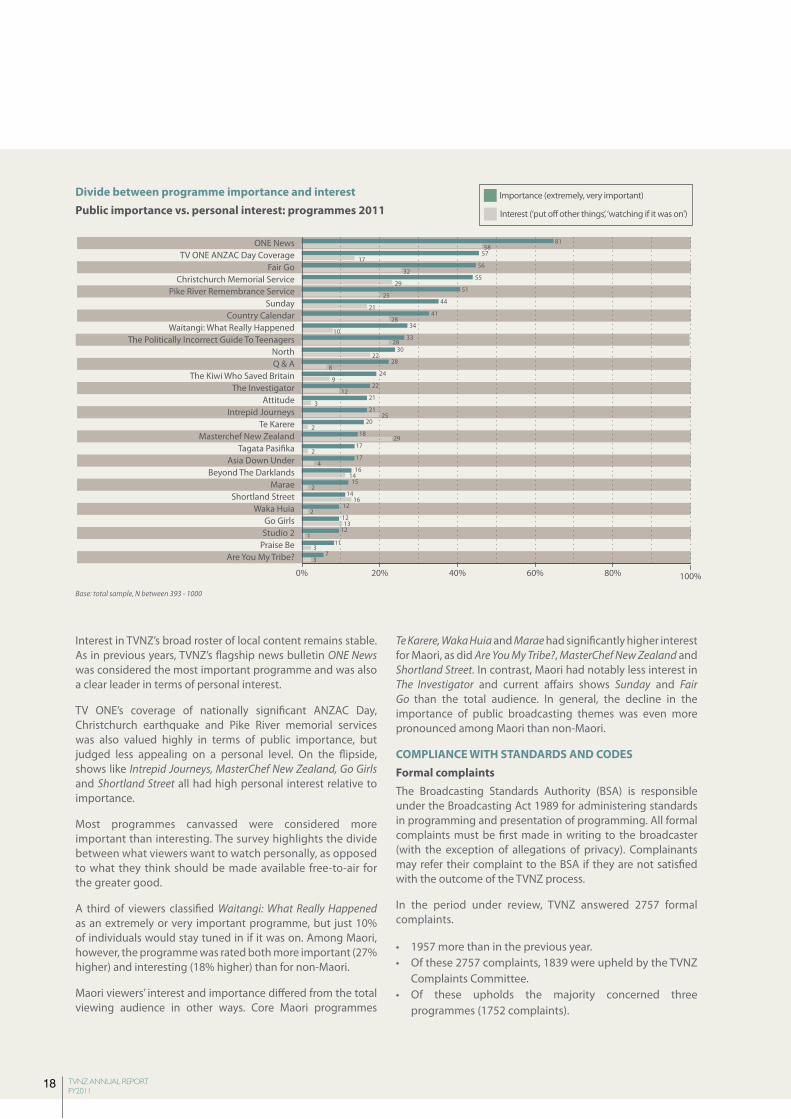
Divide between programme importance and interestPublic importance vs. personal interest: programmes 2011
0% 20% 60% 80%40% 100%
5857
1756
3255
2951
2544
2141
2834
1033
2830
2228
824
922
1221
321
2520
218
2917
217
416
1415
214
1612
1213
12
2
1
3
3
11
7
81ONE NewsTV ONE ANZAC Day Coverage
Fair GoChristchurch Memorial Service
Pike River Remembrance ServiceSunday
Country CalendarWaitangi: What Really Happened
The Politically Incorrect Guide To TeenagersNorthQ & A
The Kiwi Who Saved BritainThe Investigator
AttitudeIntrepid Journeys
Te KarereMasterchef New Zealand
Tagata Pasi�kaAsia Down Under
Beyond The DarklandsMarae
Shortland StreetWaka Huia
Go GirlsStudio 2
Praise BeAre You My Tribe?
Base: total sample, N between 393 - 1000
Interest (‘put off other things’, ‘watching if it was on')
Importance (extremely, very important)
Interest in TVNZ’s broad roster of local content remains stable. As in previous years, TVNZ’s flagship news bulletin ONE News was considered the most important programme and was also a clear leader in terms of personal interest.
TV ONE’s coverage of nationally significant ANZAC Day, Christchurch earthquake and Pike River memorial services was also valued highly in terms of public importance, but judged less appealing on a personal level. On the flipside, shows like Intrepid Journeys, MasterChef New Zealand, Go Girls and Shortland Street all had high personal interest relative to importance.
Most programmes canvassed were considered more important than interesting. The survey highlights the divide between what viewers want to watch personally, as opposed to what they think should be made available free-to-air for the greater good.
A third of viewers classified Waitangi: What Really Happened as an extremely or very important programme, but just 10% of individuals would stay tuned in if it was on. Among Maori, however, the programme was rated both more important (27% higher) and interesting (18% higher) than for non-Maori.
Maori viewers’ interest and importance differed from the total viewing audience in other ways. Core Maori programmes
Te Karere, Waka Huia and Marae had significantly higher interest for Maori, as did Are You My Tribe?, MasterChef New Zealand and Shortland Street. In contrast, Maori had notably less interest in The Investigator and current affairs shows Sunday and Fair Go than the total audience. In general, the decline in the importance of public broadcasting themes was even more pronounced among Maori than non-Maori.
COmPliANCE WiTH STANDARDS AND CODESFormal complaintsThe Broadcasting Standards Authority (BSA) is responsible under the Broadcasting Act 1989 for administering standards in programming and presentation of programming. All formal complaints must be first made in writing to the broadcaster (with the exception of allegations of privacy). Complainants may refer their complaint to the BSA if they are not satisfied with the outcome of the TVNZ process.
In the period under review, TVNZ answered 2757 formal complaints.
• 1957 more than in the previous year.• Of these 2757 complaints, 1839 were upheld by the TVNZ
Complaints Committee.• Of these upholds the majority concerned three
programmes (1752 complaints).
19TVNZ ANNUAL REPORT FY2011
2009 2010 2011
584 complaints 800 complaints 2757 complaints
78 upheld 211 upheld (182 for 2 programmes)
1839 upheld (1752 for 3 programmes)
In FY2011 the BSA handled 85 referrals about TVNZ programming – an increase of eight referrals on the previous year (referrals are counted per programme). Of these nine were upheld by the BSA*.
2009 2010 201169 referred 75 referred 83 referred18 upheld 12 upheld 9 upheld*
*16 referrals had yet to be decided by the BSA.
AWARDS AND RECOGNiTiONQantas Television Awards TVNZ’s ONE News won the Qantas Television Award for Best News for an unprecedented third year in a row at the 2010 Qantas Television Awards.
In all, TVNZ took home 8 of the 11 News and Current Affairs awards, including Best News Reporting and Journalist of the Year for ONE News’ Paul Hobbs, while Sunday’s Janet McIntyre and Joanne Mitchell won Best Current Affairs Reporting (Weekly Programme) and Sunday won Best Current Affairs Series.
In the General Television category, TVNZ programmes and people scooped a further 15 awards.
People’s choice awardsTVNZ is also a fan favourite: public votes secured 13 wins at the 2011 TV Guide Best on the Box Awards and saw tvnz.co.nz named Best Media Site at the 2010 Netguide Awards. Public support also earned the Company the distinction of being named one of New Zealand’s top three most attractive employers at the 2011 Randstad Awards.
Creative industry awardsKeeping innovation at the heart of its business earned TVNZ the prestigious Media Brand of the Year title at the 2011 CAANZ Media Awards.
The marketing campaign for TV ONE series The Pacific won a slew of awards, including the Creative Effectiveness Award at the 2011 Cannes Lions Festival of Creativity, a Silver at the 2011 CAANZ Media Awards, a Gold, two Silvers and two Bronzes at the 2011 Axis Awards, the Grand Prix and a Silver at Spikes Asia 2010, and Best Creative and a Gold at the RSVPs 2010.
The Promax Awards honoured TVNZ’s creative services with Golds in the Best Drama and Best Poster/Outdoor Ad categories. In addition, TVNZ won two Silvers and three Bronzes in the Best Drama Campaign, Something for Nothing and Best Leisure and Lifestyle Promos categories.
TVNZ also collected a Gold at the Best Design Awards 2010, Bronze at the Young Guns 2010 Awards and Bronze at the Asian Digital Media Awards 2010.
OuTPuT AND REACH
Charter themes
The assessment of which Charter themes were reflected in each programme broadcast in the 12 months under review was carried out using two guiding principles:
• Preference would be given to selection of New Zealand programming, on the assumption that it would have an impact intrinsically greater than that of overseas programming.
• International programmes such as the large number of natural history, lifestyle or wildlife documentaries where the emphasis was judged to be as much on entertainment as on information, would not be included.
Definitions
An informed society
Providing impartial and comprehensive information and national and international programming that is essential to having an informed and educated society.
National identity/citizenship
Providing entertaining and informative programming that reflects the diverse range of cultures and interests that contribute to an overall sense of who we are as New Zealanders.
Maori
Providing entertaining and informative programming that reflects Maori interests, culture, and language and conveys these interests to a wider New Zealand audience.
Diversity
Providing entertaining national and international programmes that service the interests and needs of different audiences, including cultures, lifestyles, age and regions, and particularly those that may not be provided for in a purely commercial broadcasting environment.
Innovation
Promoting innovation, risk-taking and creativity.
New Zealand talent
Supporting and promoting the talents and the creative resources of New Zealanders.
High standards
Promoting high programming standards and editorial integrity.
Note: The description of the output measure for programmes exhibiting high standards is hours of local shows/films TVNZ has funded/co-funded or commissioned. Because the category includes titles that are yet to be screened, and are therefore still commercially sensitive, only the total for the period is given. The total count for the full financial year across all channels is 1832.2 hours.
20 TVNZ ANNUAL REPORT FY2011
ChARTER PERFORmANCE mEAsUREmENTsFOR THE YEAR ENDED 30 JUNE 2011
PROGRAmmE TiTlE CHANNEl GENRE FiRST RuNREPEAT HOuRS
TOTAl HOuRS
HOuRS OF CAPTiONiNG
20/20 TV2 News & current affairs 10.4 - 10.4 10.4
The Ad Show TVNZ 7 Factual 5.0 -
Adventures of Massey Ferguson TV2 Pre-school - 4.8 4.8 -
Alone Against the Tasman TV ONE Documentary 1.0 - 1.0 1.0
Amazing Extraordinary Friends TV2 Children's 6.5 13.3 19.8 19.8
Animal Academy TVNZ 6 Factual 12.9 -
Animal Academy TVNZ 7 Factual 28.2 -
Animal House TV ONE Factual 0.5 0.5 1.0 1.0
Annabel Langbein: Free Range TV ONE Factual 6.5 1.0 7.5 7.5
Anzac Day National Wreathlaying TV ONE Special interest 1.5 - 1.5 1.5
Anzac Songs TV ONE Documentary - 1.0 1.0 -
Are You My Tribe? TV ONE Documentary 3.0 - 3.0 3.0
The Artists TVNZ 7 Arts 8.5 -
Artsville TVNZ 7 Arts 60.0
ASB Polyfest TV2 Special interest 3.0 - 3.0 -
ASB Polyfest TVNZ 6 Special interest 6.5 -
Asia Downunder TVNZ 7 Special interest 71.0 71.0
Asia Downunder TV ONE Special interest 20.5 0.5 21.0 21.0
Asia Downunder: Best of 2010 TVNZ 7 Special interest 14.6 14.6
Attitude TVNZ 7 Special interest 85.7 85.7
Attitude TV ONE Special interest 19.5 4.0 23.5 23.5
Attitude Awards 2010 TV ONE Special interest 1.0 - 1.0 1.0
Auction House TV ONE Factual - 2.5 2.5 2.5
Back Benches TVNZ 7 News & current affairs 193.7 -
Back Benches Specials TVNZ 7 News & current affairs 10.0 -
Back Benches Summer Tour TVNZ 7 News & current affairs 40.0 -
Beat Squad TV ONE Factual - 4.0 4.0 4.0
Best of Border Patrol TV ONE Factual - 2.5 2.5 2.5
Best of Breakfast TV ONE News & current affairs - 22.0 22.0 -
Best of Breakfast TVNZ 7 News & current affairs 75.8 -
Best of Business & Breakfast TVNZ 7 News & current affairs 431.6 -
Best of Business & Breakfast: Summer TVNZ 7 News & current affairs 30.0 -
Beyond the Darklands TV ONE Documentary 5.0 4.0 9.0 9.0
The Big Picture TVNZ 7 Arts 12.6 -
Bill Sevesi's Dream TV ONE Arts 1.0 - 1.0 1.0
The Black Friarz TV ONE Arts 1.0 - 1.0 1.0
Bloodlines TV ONE Drama 2.0 1.8 3.8 3.8
Blue's Clues TV2 Pre-school - 52.5 52.5 52.5
Border Patrol TV ONE Factual 4.0 5.5 9.5 9.5
Breakfast TV ONE News & current affairs 601.6 - 601.6 -
Breakfast Earthquake Coverage TVNZ 7 News & current affairs 2.5 -
Business TV ONE News & current affairs 113.0 - 113.0 -
Business Weekend TV ONE News & current affairs - 22.0 22.0 -
Business Weekend TVNZ 7 News & current affairs 77.1 -
Cadbury Crunchie Comedy Gala TV2 Comedy - 2.0 2.0 2.0
Caravan of Life TV ONE Factual 2.5 - 2.5 2.5
21TVNZ ANNUAL REPORT FY2011
PROGRAmmE TiTlE CHANNEl GENRE FiRST RuNREPEAT HOuRS
TOTAl HOuRS
HOuRS OF CAPTiONiNG
20/20 TV2 News & current affairs 10.4 - 10.4 10.4
The Ad Show TVNZ 7 Factual 5.0 -
Adventures of Massey Ferguson TV2 Pre-school - 4.8 4.8 -
Alone Against the Tasman TV ONE Documentary 1.0 - 1.0 1.0
Amazing Extraordinary Friends TV2 Children's 6.5 13.3 19.8 19.8
Animal Academy TVNZ 6 Factual 12.9 -
Animal Academy TVNZ 7 Factual 28.2 -
Animal House TV ONE Factual 0.5 0.5 1.0 1.0
Annabel Langbein: Free Range TV ONE Factual 6.5 1.0 7.5 7.5
Anzac Day National Wreathlaying TV ONE Special interest 1.5 - 1.5 1.5
Anzac Songs TV ONE Documentary - 1.0 1.0 -
Are You My Tribe? TV ONE Documentary 3.0 - 3.0 3.0
The Artists TVNZ 7 Arts 8.5 -
Artsville TVNZ 7 Arts 60.0
ASB Polyfest TV2 Special interest 3.0 - 3.0 -
ASB Polyfest TVNZ 6 Special interest 6.5 -
Asia Downunder TVNZ 7 Special interest 71.0 71.0
Asia Downunder TV ONE Special interest 20.5 0.5 21.0 21.0
Asia Downunder: Best of 2010 TVNZ 7 Special interest 14.6 14.6
Attitude TVNZ 7 Special interest 85.7 85.7
Attitude TV ONE Special interest 19.5 4.0 23.5 23.5
Attitude Awards 2010 TV ONE Special interest 1.0 - 1.0 1.0
Auction House TV ONE Factual - 2.5 2.5 2.5
Back Benches TVNZ 7 News & current affairs 193.7 -
Back Benches Specials TVNZ 7 News & current affairs 10.0 -
Back Benches Summer Tour TVNZ 7 News & current affairs 40.0 -
Beat Squad TV ONE Factual - 4.0 4.0 4.0
Best of Border Patrol TV ONE Factual - 2.5 2.5 2.5
Best of Breakfast TV ONE News & current affairs - 22.0 22.0 -
Best of Breakfast TVNZ 7 News & current affairs 75.8 -
Best of Business & Breakfast TVNZ 7 News & current affairs 431.6 -
Best of Business & Breakfast: Summer TVNZ 7 News & current affairs 30.0 -
Beyond the Darklands TV ONE Documentary 5.0 4.0 9.0 9.0
The Big Picture TVNZ 7 Arts 12.6 -
Bill Sevesi's Dream TV ONE Arts 1.0 - 1.0 1.0
The Black Friarz TV ONE Arts 1.0 - 1.0 1.0
Bloodlines TV ONE Drama 2.0 1.8 3.8 3.8
Blue's Clues TV2 Pre-school - 52.5 52.5 52.5
Border Patrol TV ONE Factual 4.0 5.5 9.5 9.5
Breakfast TV ONE News & current affairs 601.6 - 601.6 -
Breakfast Earthquake Coverage TVNZ 7 News & current affairs 2.5 -
Business TV ONE News & current affairs 113.0 - 113.0 -
Business Weekend TV ONE News & current affairs - 22.0 22.0 -
Business Weekend TVNZ 7 News & current affairs 77.1 -
Cadbury Crunchie Comedy Gala TV2 Comedy - 2.0 2.0 2.0
Caravan of Life TV ONE Factual 2.5 - 2.5 2.5
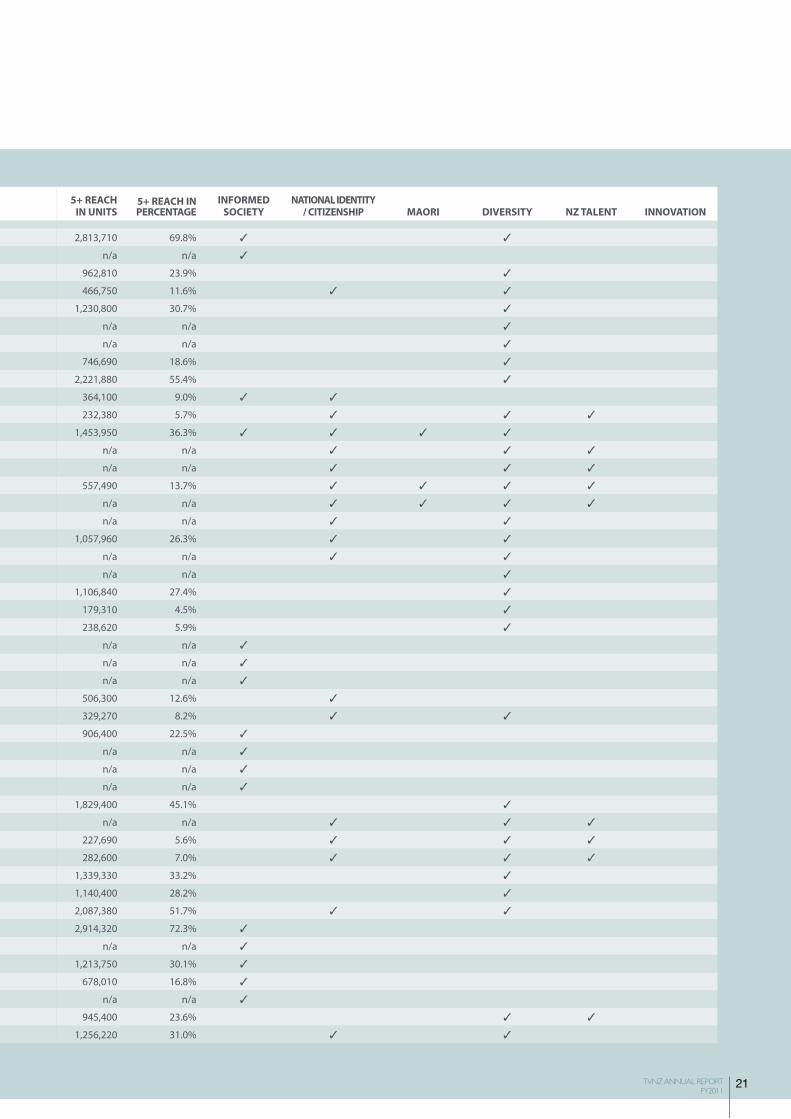
5+ REACH iN uNiTS
5+ REACH iN PERCENTAGE
iNFORmED SOCiETY
NATiONAl iDENTiTY / CiTiZENSHiP mAORi DiVERSiTY NZ TAlENT iNNOVATiON
2,813,710 69.8% ✓ ✓
n/a n/a ✓
962,810 23.9% ✓
466,750 11.6% ✓ ✓
1,230,800 30.7% ✓
n/a n/a ✓
n/a n/a ✓
746,690 18.6% ✓
2,221,880 55.4% ✓
364,100 9.0% ✓ ✓
232,380 5.7% ✓ ✓ ✓
1,453,950 36.3% ✓ ✓ ✓ ✓
n/a n/a ✓ ✓ ✓
n/a n/a ✓ ✓ ✓
557,490 13.7% ✓ ✓ ✓ ✓
n/a n/a ✓ ✓ ✓ ✓
n/a n/a ✓ ✓
1,057,960 26.3% ✓ ✓
n/a n/a ✓ ✓
n/a n/a ✓
1,106,840 27.4% ✓
179,310 4.5% ✓
238,620 5.9% ✓
n/a n/a ✓
n/a n/a ✓
n/a n/a ✓
506,300 12.6% ✓
329,270 8.2% ✓ ✓
906,400 22.5% ✓
n/a n/a ✓
n/a n/a ✓
n/a n/a ✓
1,829,400 45.1% ✓
n/a n/a ✓ ✓ ✓
227,690 5.6% ✓ ✓ ✓
282,600 7.0% ✓ ✓ ✓
1,339,330 33.2% ✓
1,140,400 28.2% ✓
2,087,380 51.7% ✓ ✓
2,914,320 72.3% ✓
n/a n/a ✓
1,213,750 30.1% ✓
678,010 16.8% ✓
n/a n/a ✓
945,400 23.6% ✓ ✓
1,256,220 31.0% ✓ ✓
22 TVNZ ANNUAL REPORT FY2011
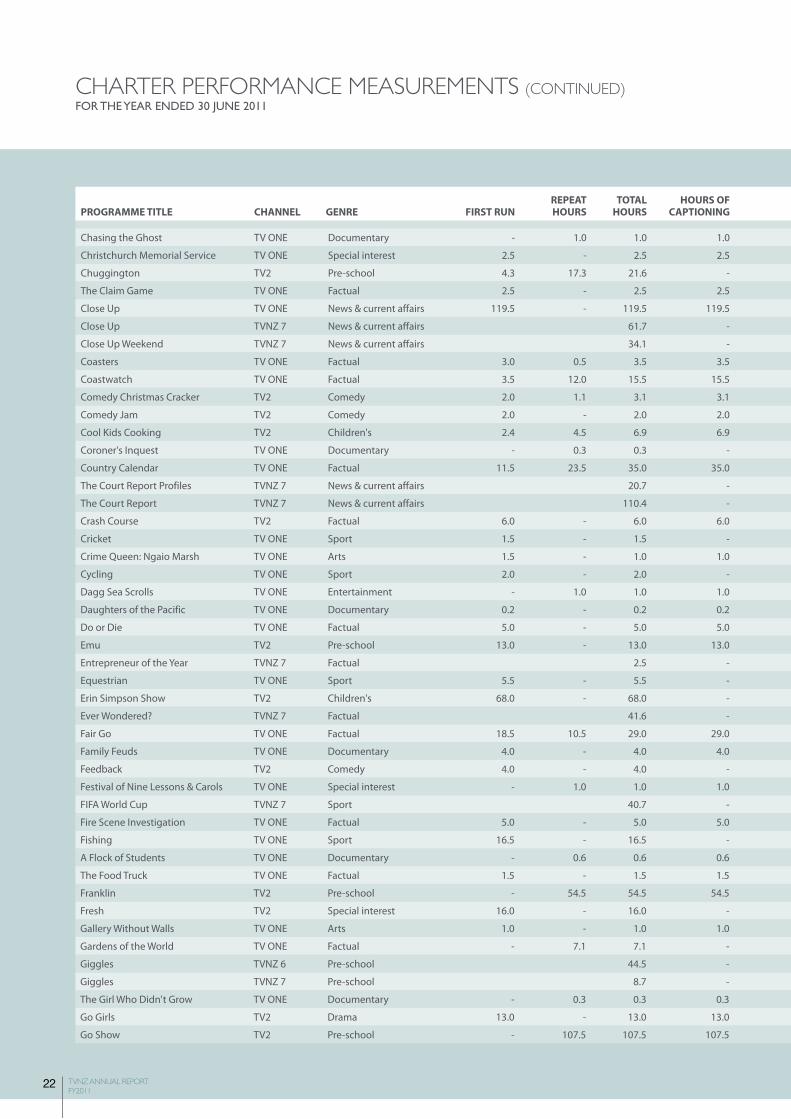
ChARTER PERFORmANCE mEAsUREmENTs (CONTiNUEd)FOR THE YEAR ENDED 30 JUNE 2011
PROGRAmmE TiTlE CHANNEl GENRE FiRST RuNREPEAT HOuRS
TOTAl HOuRS
HOuRS OF CAPTiONiNG
Chasing the Ghost TV ONE Documentary - 1.0 1.0 1.0
Christchurch Memorial Service TV ONE Special interest 2.5 - 2.5 2.5
Chuggington TV2 Pre-school 4.3 17.3 21.6 -
The Claim Game TV ONE Factual 2.5 - 2.5 2.5
Close Up TV ONE News & current affairs 119.5 - 119.5 119.5
Close Up TVNZ 7 News & current affairs 61.7 -
Close Up Weekend TVNZ 7 News & current affairs 34.1 -
Coasters TV ONE Factual 3.0 0.5 3.5 3.5
Coastwatch TV ONE Factual 3.5 12.0 15.5 15.5
Comedy Christmas Cracker TV2 Comedy 2.0 1.1 3.1 3.1
Comedy Jam TV2 Comedy 2.0 - 2.0 2.0
Cool Kids Cooking TV2 Children's 2.4 4.5 6.9 6.9
Coroner's Inquest TV ONE Documentary - 0.3 0.3 -
Country Calendar TV ONE Factual 11.5 23.5 35.0 35.0
The Court Report Profiles TVNZ 7 News & current affairs 20.7 -
The Court Report TVNZ 7 News & current affairs 110.4 -
Crash Course TV2 Factual 6.0 - 6.0 6.0
Cricket TV ONE Sport 1.5 - 1.5 -
Crime Queen: Ngaio Marsh TV ONE Arts 1.5 - 1.0 1.0
Cycling TV ONE Sport 2.0 - 2.0 -
Dagg Sea Scrolls TV ONE Entertainment - 1.0 1.0 1.0
Daughters of the Pacific TV ONE Documentary 0.2 - 0.2 0.2
Do or Die TV ONE Factual 5.0 - 5.0 5.0
Emu TV2 Pre-school 13.0 - 13.0 13.0
Entrepreneur of the Year TVNZ 7 Factual 2.5 -
Equestrian TV ONE Sport 5.5 - 5.5 -
Erin Simpson Show TV2 Children's 68.0 - 68.0 -
Ever Wondered? TVNZ 7 Factual 41.6 -
Fair Go TV ONE Factual 18.5 10.5 29.0 29.0
Family Feuds TV ONE Documentary 4.0 - 4.0 4.0
Feedback TV2 Comedy 4.0 - 4.0 -
Festival of Nine Lessons & Carols TV ONE Special interest - 1.0 1.0 1.0
FIFA World Cup TVNZ 7 Sport 40.7 -
Fire Scene Investigation TV ONE Factual 5.0 - 5.0 5.0
Fishing TV ONE Sport 16.5 - 16.5 -
A Flock of Students TV ONE Documentary - 0.6 0.6 0.6
The Food Truck TV ONE Factual 1.5 - 1.5 1.5
Franklin TV2 Pre-school - 54.5 54.5 54.5
Fresh TV2 Special interest 16.0 - 16.0 -
Gallery Without Walls TV ONE Arts 1.0 - 1.0 1.0
Gardens of the World TV ONE Factual - 7.1 7.1 -
Giggles TVNZ 6 Pre-school 44.5 -
Giggles TVNZ 7 Pre-school 8.7 -
The Girl Who Didn't Grow TV ONE Documentary - 0.3 0.3 0.3
Go Girls TV2 Drama 13.0 - 13.0 13.0
Go Show TV2 Pre-school - 107.5 107.5 107.5
23TVNZ ANNUAL REPORT FY2011
PROGRAmmE TiTlE CHANNEl GENRE FiRST RuNREPEAT HOuRS
TOTAl HOuRS
HOuRS OF CAPTiONiNG
Chasing the Ghost TV ONE Documentary - 1.0 1.0 1.0
Christchurch Memorial Service TV ONE Special interest 2.5 - 2.5 2.5
Chuggington TV2 Pre-school 4.3 17.3 21.6 -
The Claim Game TV ONE Factual 2.5 - 2.5 2.5
Close Up TV ONE News & current affairs 119.5 - 119.5 119.5
Close Up TVNZ 7 News & current affairs 61.7 -
Close Up Weekend TVNZ 7 News & current affairs 34.1 -
Coasters TV ONE Factual 3.0 0.5 3.5 3.5
Coastwatch TV ONE Factual 3.5 12.0 15.5 15.5
Comedy Christmas Cracker TV2 Comedy 2.0 1.1 3.1 3.1
Comedy Jam TV2 Comedy 2.0 - 2.0 2.0
Cool Kids Cooking TV2 Children's 2.4 4.5 6.9 6.9
Coroner's Inquest TV ONE Documentary - 0.3 0.3 -
Country Calendar TV ONE Factual 11.5 23.5 35.0 35.0
The Court Report Profiles TVNZ 7 News & current affairs 20.7 -
The Court Report TVNZ 7 News & current affairs 110.4 -
Crash Course TV2 Factual 6.0 - 6.0 6.0
Cricket TV ONE Sport 1.5 - 1.5 -
Crime Queen: Ngaio Marsh TV ONE Arts 1.5 - 1.0 1.0
Cycling TV ONE Sport 2.0 - 2.0 -
Dagg Sea Scrolls TV ONE Entertainment - 1.0 1.0 1.0
Daughters of the Pacific TV ONE Documentary 0.2 - 0.2 0.2
Do or Die TV ONE Factual 5.0 - 5.0 5.0
Emu TV2 Pre-school 13.0 - 13.0 13.0
Entrepreneur of the Year TVNZ 7 Factual 2.5 -
Equestrian TV ONE Sport 5.5 - 5.5 -
Erin Simpson Show TV2 Children's 68.0 - 68.0 -
Ever Wondered? TVNZ 7 Factual 41.6 -
Fair Go TV ONE Factual 18.5 10.5 29.0 29.0
Family Feuds TV ONE Documentary 4.0 - 4.0 4.0
Feedback TV2 Comedy 4.0 - 4.0 -
Festival of Nine Lessons & Carols TV ONE Special interest - 1.0 1.0 1.0
FIFA World Cup TVNZ 7 Sport 40.7 -
Fire Scene Investigation TV ONE Factual 5.0 - 5.0 5.0
Fishing TV ONE Sport 16.5 - 16.5 -
A Flock of Students TV ONE Documentary - 0.6 0.6 0.6
The Food Truck TV ONE Factual 1.5 - 1.5 1.5
Franklin TV2 Pre-school - 54.5 54.5 54.5
Fresh TV2 Special interest 16.0 - 16.0 -
Gallery Without Walls TV ONE Arts 1.0 - 1.0 1.0
Gardens of the World TV ONE Factual - 7.1 7.1 -
Giggles TVNZ 6 Pre-school 44.5 -
Giggles TVNZ 7 Pre-school 8.7 -
The Girl Who Didn't Grow TV ONE Documentary - 0.3 0.3 0.3
Go Girls TV2 Drama 13.0 - 13.0 13.0
Go Show TV2 Pre-school - 107.5 107.5 107.5
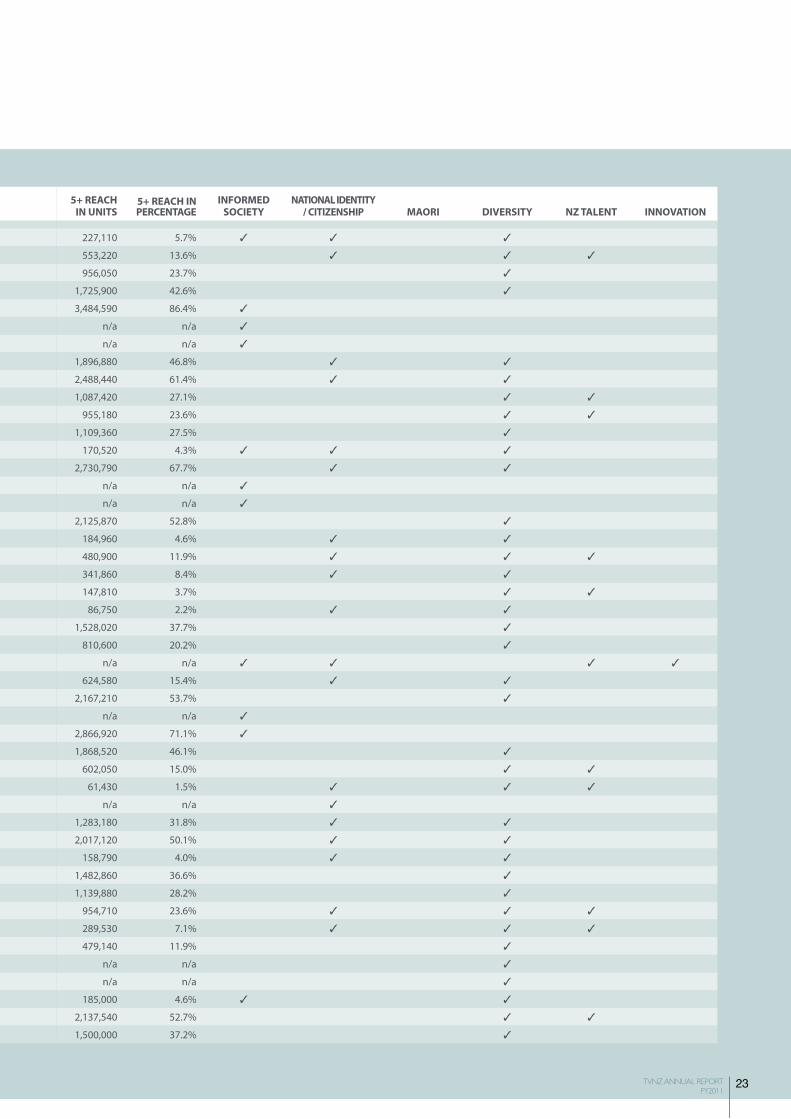
5+ REACH iN uNiTS
5+ REACH iN PERCENTAGE
iNFORmED SOCiETY
NATiONAl iDENTiTY / CiTiZENSHiP mAORi DiVERSiTY NZ TAlENT iNNOVATiON
227,110 5.7% ✓ ✓ ✓
553,220 13.6% ✓ ✓ ✓
956,050 23.7% ✓
1,725,900 42.6% ✓
3,484,590 86.4% ✓
n/a n/a ✓
n/a n/a ✓
1,896,880 46.8% ✓ ✓
2,488,440 61.4% ✓ ✓
1,087,420 27.1% ✓ ✓
955,180 23.6% ✓ ✓
1,109,360 27.5% ✓
170,520 4.3% ✓ ✓ ✓
2,730,790 67.7% ✓ ✓
n/a n/a ✓
n/a n/a ✓
2,125,870 52.8% ✓
184,960 4.6% ✓ ✓
480,900 11.9% ✓ ✓ ✓
341,860 8.4% ✓ ✓
147,810 3.7% ✓ ✓
86,750 2.2% ✓ ✓
1,528,020 37.7% ✓
810,600 20.2% ✓
n/a n/a ✓ ✓ ✓ ✓
624,580 15.4% ✓ ✓
2,167,210 53.7% ✓
n/a n/a ✓
2,866,920 71.1% ✓
1,868,520 46.1% ✓
602,050 15.0% ✓ ✓
61,430 1.5% ✓ ✓ ✓
n/a n/a ✓
1,283,180 31.8% ✓ ✓
2,017,120 50.1% ✓ ✓
158,790 4.0% ✓ ✓
1,482,860 36.6% ✓
1,139,880 28.2% ✓
954,710 23.6% ✓ ✓ ✓
289,530 7.1% ✓ ✓ ✓
479,140 11.9% ✓
n/a n/a ✓
n/a n/a ✓
185,000 4.6% ✓ ✓
2,137,540 52.7% ✓ ✓
1,500,000 37.2% ✓
24 TVNZ ANNUAL REPORT FY2011
ChARTER PERFORmANCE mEAsUREmENTs (CONTiNUEd)FOR THE YEAR ENDED 30 JUNE 2011
PROGRAmmE TiTlE CHANNEl GENRE FiRST RuNREPEAT HOuRS
TOTAl HOuRS
HOuRS OF CAPTiONiNG
Good Morning TV ONE Factual 649.5 - 649.5 -
The Good Word TVNZ 7 Arts 50.2 -
The Good Word Debate TVNZ 7 Arts 4.2 -
The Good Word Junior TVNZ 7 Arts 5.0 -
The Good Word: Under the Covers TVNZ 7 Arts 10.0 -
The Gravy TVNZ 7 Arts 28.3 -
Great Kiwi Christmas Comedy TV2 Comedy 2.0 - 2.0 2.0
Handy Manny TV2 Pre-school 0.5 35.0 35.0 35.0
Healer or Hoaxer? TV ONE Documentary - 0.8 0.8 0.8
Here to Stay TV ONE Factual 3.0 7.0 10.0 10.0
Hi-5 TV2 Pre-school 22.5 107.5 130.0 130.0
Hidden in the Numbers TV ONE Documentary - 2.3 2.3 2.3
Hindsight TVNZ 7 Factual 16.3 -
Hip Hop High TV2 Factual 3.0 - 3.0 3.0
Hitchhiker TV ONE Documentary - 0.7 0.7 0.7
Home by Christmas TV ONE Drama 2.0 - 2.0 2.0
Homefront Extra TV ONE Factual - 9.3 9.3 -
Hotel SOS TV ONE Factual 4.0 - 4.0 4.0
House and Garden Extra TV ONE Factual - 3.0 3.0 -
How Clean is Your House TV ONE Factual - 5.0 5.0 5.0
How the Other Half Lives TV ONE Factual 4.0 2.5 6.5 6.5
How to Look at a Painting TVNZ 7 Arts 15.0 -
I Am TV TV2 Special interest 34.0 - 34.0 -
In Bed with Anika Moa TV ONE Arts 1.0 - 1.0 1.0
In the Night Garden TV2 Pre-school - 28.5 28.5 28.5
InBeTween TVNZ 6 Children's 47.5 -
InBeTween TVNZ 7 Children's 10.8 -
Internet Debate TVNZ 7 News & current affairs 5.0 -
Intrepid Journeys TV ONE Factual 6.0 12.0 18.0 18.0
The Investigator TV ONE Documentary 7.0 2.0 9.0 9.0
Is it Safe to Eat? TV ONE Factual - 2.0 2.0 -
Jane and the Dragon TV2 Pre-school - 12.0 12.0 12.0
Jim's Car Show TV ONE Factual - 0.5 0.5 -
Join Together TV ONE Documentary - 0.6 0.6 0.6
Jungle Junction TV2 Pre-school 5.0 - 5.0 -
Just the Job TV2 Children's 5.0 4.0 9.0 9.0
Just the Job TVNZ 6 Children's 25.0 25.0
Just the Job TVNZ 7 Children's 13.3 13.3
Karting TV ONE Sport 2.0 - 2.0 -
Kidzone TVNZ 6 Pre-school 485.3 -
Kidzone TVNZ 7 Pre-school 38.0 -
Killian Curse TV2 Children's - 2.0 2.0 2.0
Killian Curse: Behind the Scenes TVNZ 6 Factual 2.9 -
The Kiwi Who Saved Britain TV ONE Documentary - 1.0 1.0 1.0
Korero Mai: Speak to Me TV2 Special interest 25.0 7.5 32.5 -
The Last Laugh TV ONE Documentary - 0.8 0.8 0.8
25TVNZ ANNUAL REPORT FY2011
PROGRAmmE TiTlE CHANNEl GENRE FiRST RuNREPEAT HOuRS
TOTAl HOuRS
HOuRS OF CAPTiONiNG
Good Morning TV ONE Factual 649.5 - 649.5 -
The Good Word TVNZ 7 Arts 50.2 -
The Good Word Debate TVNZ 7 Arts 4.2 -
The Good Word Junior TVNZ 7 Arts 5.0 -
The Good Word: Under the Covers TVNZ 7 Arts 10.0 -
The Gravy TVNZ 7 Arts 28.3 -
Great Kiwi Christmas Comedy TV2 Comedy 2.0 - 2.0 2.0
Handy Manny TV2 Pre-school 0.5 35.0 35.0 35.0
Healer or Hoaxer? TV ONE Documentary - 0.8 0.8 0.8
Here to Stay TV ONE Factual 3.0 7.0 10.0 10.0
Hi-5 TV2 Pre-school 22.5 107.5 130.0 130.0
Hidden in the Numbers TV ONE Documentary - 2.3 2.3 2.3
Hindsight TVNZ 7 Factual 16.3 -
Hip Hop High TV2 Factual 3.0 - 3.0 3.0
Hitchhiker TV ONE Documentary - 0.7 0.7 0.7
Home by Christmas TV ONE Drama 2.0 - 2.0 2.0
Homefront Extra TV ONE Factual - 9.3 9.3 -
Hotel SOS TV ONE Factual 4.0 - 4.0 4.0
House and Garden Extra TV ONE Factual - 3.0 3.0 -
How Clean is Your House TV ONE Factual - 5.0 5.0 5.0
How the Other Half Lives TV ONE Factual 4.0 2.5 6.5 6.5
How to Look at a Painting TVNZ 7 Arts 15.0 -
I Am TV TV2 Special interest 34.0 - 34.0 -
In Bed with Anika Moa TV ONE Arts 1.0 - 1.0 1.0
In the Night Garden TV2 Pre-school - 28.5 28.5 28.5
InBeTween TVNZ 6 Children's 47.5 -
InBeTween TVNZ 7 Children's 10.8 -
Internet Debate TVNZ 7 News & current affairs 5.0 -
Intrepid Journeys TV ONE Factual 6.0 12.0 18.0 18.0
The Investigator TV ONE Documentary 7.0 2.0 9.0 9.0
Is it Safe to Eat? TV ONE Factual - 2.0 2.0 -
Jane and the Dragon TV2 Pre-school - 12.0 12.0 12.0
Jim's Car Show TV ONE Factual - 0.5 0.5 -
Join Together TV ONE Documentary - 0.6 0.6 0.6
Jungle Junction TV2 Pre-school 5.0 - 5.0 -
Just the Job TV2 Children's 5.0 4.0 9.0 9.0
Just the Job TVNZ 6 Children's 25.0 25.0
Just the Job TVNZ 7 Children's 13.3 13.3
Karting TV ONE Sport 2.0 - 2.0 -
Kidzone TVNZ 6 Pre-school 485.3 -
Kidzone TVNZ 7 Pre-school 38.0 -
Killian Curse TV2 Children's - 2.0 2.0 2.0
Killian Curse: Behind the Scenes TVNZ 6 Factual 2.9 -
The Kiwi Who Saved Britain TV ONE Documentary - 1.0 1.0 1.0
Korero Mai: Speak to Me TV2 Special interest 25.0 7.5 32.5 -
The Last Laugh TV ONE Documentary - 0.8 0.8 0.8
5+ REACH iN uNiTS
5+ REACH iN PERCENTAGE
iNFORmED SOCiETY
NATiONAl iDENTiTY / CiTiZENSHiP mAORi DiVERSiTY NZ TAlENT iNNOVATiON
2,976,850 73.8% ✓ ✓ ✓
n/a n/a ✓ ✓ ✓
n/a n/a ✓ ✓ ✓
n/a n/a ✓ ✓ ✓
n/a n/a ✓ ✓ ✓
n/a n/a ✓ ✓ ✓
1,026,760 25.6% ✓ ✓
1,170,540 29.1% ✓
145,100 3.6% ✓
1,366,260 33.9% ✓ ✓
1,153,970 28.6% ✓
202,740 5.0% ✓ ✓ ✓
n/a n/a ✓ ✓ ✓
674,040 16.8% ✓ ✓
145,070 3.6% ✓ ✓
782,760 19.3% ✓ ✓
563,440 13.9% ✓
1,566,420 39.1% ✓
520,410 12.9% ✓
593,840 14.8% ✓
2,168,670 54.0% ✓ ✓
n/a n/a ✓ ✓ ✓
1,149,230 28.6% ✓ ✓ ✓
408,160 10.2% ✓ ✓ ✓
849,610 21.2% ✓
n/a n/a ✓ ✓
n/a n/a ✓ ✓
n/a n/a ✓
2,362,860 58.5% ✓
2,026,460 50.2% ✓ ✓
326,710 8.1% ✓
768,290 19.2% ✓
178,890 4.5% ✓
88,190 2.2% ✓ ✓ ✓
209,970 5.2% ✓
827,360 20.5% ✓
n/a n/a ✓
n/a n/a ✓
432,590 10.7% ✓ ✓
n/a n/a ✓
n/a n/a ✓
293,520 7.2% ✓
n/a n/a ✓
258,390 6.4% ✓ ✓
781,270 19.4% ✓ ✓ ✓
144,830 3.6% ✓ ✓
26 TVNZ ANNUAL REPORT FY2011
ChARTER PERFORmANCE mEAsUREmENTs (CONTiNUEd)FOR THE YEAR ENDED 30 JUNE 2011
PROGRAmmE TiTlE CHANNEl GENRE FiRST RuNREPEAT HOuRS
TOTAl HOuRS
HOuRS OF CAPTiONiNG
Laughing Samoans at Large TV2 Comedy 4.0 - 4.0 -
Let's Get Inventin' TV2 Children's 1.5 2.0 3.5 3.5
Let's Get Inventin' TVNZ 6 Children's 59.7 59.7
Let's Get Inventin' TVNZ 7 Children's 4.9 4.9
Life on Ben TV2 Children's 0.3 - 0.3 -
Line of Fire TV ONE Documentary - 3.0 3.0 3.0
Little Bear TV2 Pre-school - 40.5 40.5 -
Little Einsteins TV2 Pre-school - 17.5 17.5 17.5
Location Location Location TV ONE Factual - 10.5 10.5 10.5
Lucy Lawless: 5 Days in Bangladesh TV ONE Documentary - 0.8 0.8 0.8
Make the Politician Work TV ONE Factual 3.5 - 3.5 3.5
Making Italy Home TV ONE Factual - 2.0 2.0 2.0
Mani's Story TV ONE Documentary - 0.7 0.7 0.7
Marae TVNZ 7 Special interest 20.4 -
Marae Investigates TV ONE Special interest 16 6.5 22.5 -
Marae Investigates TVNZ 7 Special interest 56.2 -
Marae Summer Season TV ONE Special interest - 3.0 3.0 -
Marae Summer Season TVNZ 7 Special interest 11.8 -
Master Raindrop TV2 Pre-school - 13.0 13.0 13.0
MasterChef Masterclass TV ONE Factual 9.0 10.0 19.0 19.0
MasterChef New Zealand TV ONE Factual 14.0 14.0 28.0 28.0
Media 7 TVNZ 7 News & current affairs 111.8 -
Media 7 Specials TVNZ 7 News & current affairs 15.8 -
Meet the Locals TVNZ 6 Factual 56.7 -
Meet the Locals TVNZ 7 Factual 35.0 -
Mercury Falling TV ONE Documentary - 0.2 0.2 0.2
Mickey Mouse Clubhouse TV2 Pre-school - 32.5 32.5 32.5
Mighty Moa TV ONE Documentary - 0.8 0.8 -
Milly Molly TV2 Pre-school - 17.2 17.2 17.2
Mind Games TV ONE Documentary - 4.3 4.3 -
Minority Voice TVNZ 7 Factual 7.9 -
The Missing TV ONE Documentary 8.0 - 8.0 8.0
The Missing Piece TV ONE Special interest 1.0 - 1.0 1.0
Moon TV USA TV2 Comedy 5.0 - 5.0 -
Motor Cycling TV ONE Sport 16.0 - 16.0 -
Motor Racing TV ONE Sport 7.5 - 7.5 -
Motorway Patrol TV2 Factual 5.0 5.0 10.0 10.0
Mucking In TV ONE Factual - 27.0 27.0 27.0
Multisport TV ONE Sport 15.0 - 15.0 -
My Friends Tigger and Pooh TV2 Pre-school - 50.5 50.5 50.5
My God TV ONE Special interest 5.5 - 5.5 5.5
My God TVNZ 7 Special interest 33.8 33.8
My House My Castle TV2 Factual 4.0 - 4.0 4.0
Netball TV ONE Sport 13.1 - 13.1 -
New Artland TVNZ 6 Arts 12.1 -
The New Zealand Variety Show TV ONE Entertainment 2.0 1.5 3.5 3.5
27TVNZ ANNUAL REPORT FY2011
PROGRAmmE TiTlE CHANNEl GENRE FiRST RuNREPEAT HOuRS
TOTAl HOuRS
HOuRS OF CAPTiONiNG
Laughing Samoans at Large TV2 Comedy 4.0 - 4.0 -
Let's Get Inventin' TV2 Children's 1.5 2.0 3.5 3.5
Let's Get Inventin' TVNZ 6 Children's 59.7 59.7
Let's Get Inventin' TVNZ 7 Children's 4.9 4.9
Life on Ben TV2 Children's 0.3 - 0.3 -
Line of Fire TV ONE Documentary - 3.0 3.0 3.0
Little Bear TV2 Pre-school - 40.5 40.5 -
Little Einsteins TV2 Pre-school - 17.5 17.5 17.5
Location Location Location TV ONE Factual - 10.5 10.5 10.5
Lucy Lawless: 5 Days in Bangladesh TV ONE Documentary - 0.8 0.8 0.8
Make the Politician Work TV ONE Factual 3.5 - 3.5 3.5
Making Italy Home TV ONE Factual - 2.0 2.0 2.0
Mani's Story TV ONE Documentary - 0.7 0.7 0.7
Marae TVNZ 7 Special interest 20.4 -
Marae Investigates TV ONE Special interest 16 6.5 22.5 -
Marae Investigates TVNZ 7 Special interest 56.2 -
Marae Summer Season TV ONE Special interest - 3.0 3.0 -
Marae Summer Season TVNZ 7 Special interest 11.8 -
Master Raindrop TV2 Pre-school - 13.0 13.0 13.0
MasterChef Masterclass TV ONE Factual 9.0 10.0 19.0 19.0
MasterChef New Zealand TV ONE Factual 14.0 14.0 28.0 28.0
Media 7 TVNZ 7 News & current affairs 111.8 -
Media 7 Specials TVNZ 7 News & current affairs 15.8 -
Meet the Locals TVNZ 6 Factual 56.7 -
Meet the Locals TVNZ 7 Factual 35.0 -
Mercury Falling TV ONE Documentary - 0.2 0.2 0.2
Mickey Mouse Clubhouse TV2 Pre-school - 32.5 32.5 32.5
Mighty Moa TV ONE Documentary - 0.8 0.8 -
Milly Molly TV2 Pre-school - 17.2 17.2 17.2
Mind Games TV ONE Documentary - 4.3 4.3 -
Minority Voice TVNZ 7 Factual 7.9 -
The Missing TV ONE Documentary 8.0 - 8.0 8.0
The Missing Piece TV ONE Special interest 1.0 - 1.0 1.0
Moon TV USA TV2 Comedy 5.0 - 5.0 -
Motor Cycling TV ONE Sport 16.0 - 16.0 -
Motor Racing TV ONE Sport 7.5 - 7.5 -
Motorway Patrol TV2 Factual 5.0 5.0 10.0 10.0
Mucking In TV ONE Factual - 27.0 27.0 27.0
Multisport TV ONE Sport 15.0 - 15.0 -
My Friends Tigger and Pooh TV2 Pre-school - 50.5 50.5 50.5
My God TV ONE Special interest 5.5 - 5.5 5.5
My God TVNZ 7 Special interest 33.8 33.8
My House My Castle TV2 Factual 4.0 - 4.0 4.0
Netball TV ONE Sport 13.1 - 13.1 -
New Artland TVNZ 6 Arts 12.1 -
The New Zealand Variety Show TV ONE Entertainment 2.0 1.5 3.5 3.5
5+ REACH iN uNiTS
5+ REACH iN PERCENTAGE
iNFORmED SOCiETY
NATiONAl iDENTiTY / CiTiZENSHiP mAORi DiVERSiTY NZ TAlENT iNNOVATiON
740,830 18.5% ✓ ✓ ✓
740,270 18.3% ✓ ✓
n/a n/a ✓ ✓
n/a n/a ✓ ✓
380,210 9.5% ✓
1,431,300 35.7% ✓ ✓ ✓
1,309,160 32.4% ✓
968,740 23.9% ✓
2,121,490 52.3% ✓ ✓
207,280 5.2% ✓ ✓
2,002,860 49.4% ✓ ✓
506,080 12.6% ✓
181,420 4.5% ✓
n/a n/a ✓ ✓ ✓ ✓
1,180,400 29.3% ✓ ✓ ✓ ✓
n/a n/a ✓ ✓ ✓ ✓
408,290 10.1% ✓ ✓ ✓ ✓
n/a n/a ✓ ✓ ✓ ✓
824,980 20.4% ✓
2,217,050 54.7% ✓ ✓
2,957,470 72.9% ✓ ✓
n/a n/a ✓
n/a n/a ✓
n/a n/a ✓ ✓ ✓
n/a n/a ✓ ✓ ✓
92,960 2.3% ✓ ✓
863,290 21.4% ✓
91,970 2.3% ✓ ✓ ✓
903,150 22.4% ✓
226,520 5.6% ✓
n/a n/a ✓ ✓
1,945,890 48.5% ✓
578,260 14.3% ✓ ✓ ✓
1,037,850 25.9% ✓
1,777,710 43.8% ✓ ✓
1,250,760 30.8% ✓ ✓
2,547,170 63.4% ✓ ✓
666,690 16.5% ✓ ✓
1,871,130 46.1% ✓ ✓
1,120,490 27.8% ✓
493,840 12.2% ✓ ✓
n/a n/a ✓ ✓
2,018,890 49.8% ✓
2,397,400 59.8% ✓ ✓
n/a n/a ✓ ✓ ✓ ✓
768,850 19.1% ✓ ✓ ✓
28 TVNZ ANNUAL REPORT FY2011
ChARTER PERFORmANCE mEAsUREmENTs (CONTiNUEd)FOR THE YEAR ENDED 30 JUNE 2011
PROGRAmmE TiTlE CHANNEl GENRE FiRST RuNREPEAT HOuRS
TOTAl HOuRS
HOuRS OF CAPTiONiNG
A Night at the Classic TV2 Comedy 3.0 - 3.0 3.0
Nights in the Garden of Spain TV ONE Drama 2.0 - 2.0 2.0
Nobody's Heroes TV ONE Documentary - 0.8 0.8 0.8
North TV ONE Factual 5.0 - 5.0 5.0
NZ children's drama - various TVNZ 6 Children's drama 71.5 -
NZ Detectives TV ONE Documentary 3.0 - 3.0 3.0
NZ drama - various TVNZ 6 Drama 164.6 -
NZ entertainment (incl. comedy) - various TVNZ 6 Entertainment/comedy 152.0 -
NZ Exposed TV ONE Documentary - 3.0 3.0 -
NZ factual - various TVNZ 6 Factual 74.1 -
NZ factual - various TVNZ 7 Factual 90.9 -
NZ on a Plate TV ONE Factual 5.0 4.0 9.0 9.0
NZ pre-school - various TVNZ 6 Pre-school 1,014.8 -
NZ pre-school - various TVNZ 7 Pre-school 39.1 -
One Land TV ONE Factual - 5.2 5.2 5.2
ONE News at 4.30pm TV ONE News & current affairs 126.5 - 126.5 -
ONE News at 6 TV ONE News & current affairs 369.5 - 369.5 369.5
ONE News at Midday TV ONE News & current affairs 122.5 - 122.5 122.5
ONE News Special: Chch Earthquake Coverage TVNZ 7 News & current affairs 2.2 2.2
ONE News Specials TV ONE News & current affairs 13.5 - 13.5 13.5
ONE News Tonight TV ONE News & current affairs 125.7 - 125.7 125.7
ONE's Countdown to New Year TV ONE Entertainment 2.5 - 2.5 2.5
Open Door TVNZ 7 Factual 29.3
Painting with Light: Brian Brake TV ONE Arts 1.0 - 1.0 1.0
Panic at Rock Island TV2 Drama 2.3 - 2.3 2.3
Paradise Café TV2 Children's 6.5 7.0 13.5 13.5
Piha Rescue TV ONE Factual 5.0 5.5 10.5 10.5
Pike River Official Remembrance TV ONE Special interest 2.0 - 2.0 2.0
Pike River Official Remembrance TVNZ 7 Special interest 1.5
Politically Incorrect Guide to Teenagers TV ONE Factual 4.0 - 4.0 4.0
Pop Up TVNZ 7 Pre-school 7.6 -
Pounamu: The Stone in Our Bones TV ONE Arts 1.0 - 1.0 1.0
Praise Be TV ONE Special interest 19.5 - 19.5 -
Praise Be TVNZ 7 Special interest 71.1 -
Prostitution: After the Act 2004 TV ONE Documentary - 0.8 0.8 0.8
Q & A TV ONE News & current affairs 38.0 - 38.0 -
Q & A TVNZ 7 News & current affairs 96.7 -
Qantas Film & Television Awards TV ONE Entertainment 1.3 - 1.3 -
QTV TVNZ 6 Children's 16.3 -
Raising Children in New Zealand TVNZ 7 Factual 1.7 -
Raising Children in New Zealand Shorts TVNZ 7 Factual 2.1 -
Rapid Response TV ONE Factual 4.0 3.5 7.5 7.5
Real Escapes TV ONE Factual - 4.0 4.0 4.0
Rescue 1 TV2 Factual 7.5 - 7.5 7.5
Reservoir Hill TV2 Drama 2.0 1.5 3.5 -
Road to the Young Farmer Final TVNZ 7 Factual 5.8 -
29TVNZ ANNUAL REPORT FY2011
PROGRAmmE TiTlE CHANNEl GENRE FiRST RuNREPEAT HOuRS
TOTAl HOuRS
HOuRS OF CAPTiONiNG
A Night at the Classic TV2 Comedy 3.0 - 3.0 3.0
Nights in the Garden of Spain TV ONE Drama 2.0 - 2.0 2.0
Nobody's Heroes TV ONE Documentary - 0.8 0.8 0.8
North TV ONE Factual 5.0 - 5.0 5.0
NZ children's drama - various TVNZ 6 Children's drama 71.5 -
NZ Detectives TV ONE Documentary 3.0 - 3.0 3.0
NZ drama - various TVNZ 6 Drama 164.6 -
NZ entertainment (incl. comedy) - various TVNZ 6 Entertainment/comedy 152.0 -
NZ Exposed TV ONE Documentary - 3.0 3.0 -
NZ factual - various TVNZ 6 Factual 74.1 -
NZ factual - various TVNZ 7 Factual 90.9 -
NZ on a Plate TV ONE Factual 5.0 4.0 9.0 9.0
NZ pre-school - various TVNZ 6 Pre-school 1,014.8 -
NZ pre-school - various TVNZ 7 Pre-school 39.1 -
One Land TV ONE Factual - 5.2 5.2 5.2
ONE News at 4.30pm TV ONE News & current affairs 126.5 - 126.5 -
ONE News at 6 TV ONE News & current affairs 369.5 - 369.5 369.5
ONE News at Midday TV ONE News & current affairs 122.5 - 122.5 122.5
ONE News Special: Chch Earthquake Coverage TVNZ 7 News & current affairs 2.2 2.2
ONE News Specials TV ONE News & current affairs 13.5 - 13.5 13.5
ONE News Tonight TV ONE News & current affairs 125.7 - 125.7 125.7
ONE's Countdown to New Year TV ONE Entertainment 2.5 - 2.5 2.5
Open Door TVNZ 7 Factual 29.3
Painting with Light: Brian Brake TV ONE Arts 1.0 - 1.0 1.0
Panic at Rock Island TV2 Drama 2.3 - 2.3 2.3
Paradise Café TV2 Children's 6.5 7.0 13.5 13.5
Piha Rescue TV ONE Factual 5.0 5.5 10.5 10.5
Pike River Official Remembrance TV ONE Special interest 2.0 - 2.0 2.0
Pike River Official Remembrance TVNZ 7 Special interest 1.5
Politically Incorrect Guide to Teenagers TV ONE Factual 4.0 - 4.0 4.0
Pop Up TVNZ 7 Pre-school 7.6 -
Pounamu: The Stone in Our Bones TV ONE Arts 1.0 - 1.0 1.0
Praise Be TV ONE Special interest 19.5 - 19.5 -
Praise Be TVNZ 7 Special interest 71.1 -
Prostitution: After the Act 2004 TV ONE Documentary - 0.8 0.8 0.8
Q & A TV ONE News & current affairs 38.0 - 38.0 -
Q & A TVNZ 7 News & current affairs 96.7 -
Qantas Film & Television Awards TV ONE Entertainment 1.3 - 1.3 -
QTV TVNZ 6 Children's 16.3 -
Raising Children in New Zealand TVNZ 7 Factual 1.7 -
Raising Children in New Zealand Shorts TVNZ 7 Factual 2.1 -
Rapid Response TV ONE Factual 4.0 3.5 7.5 7.5
Real Escapes TV ONE Factual - 4.0 4.0 4.0
Rescue 1 TV2 Factual 7.5 - 7.5 7.5
Reservoir Hill TV2 Drama 2.0 1.5 3.5 -
Road to the Young Farmer Final TVNZ 7 Factual 5.8 -
5+ REACH iN uNiTS
5+ REACH iN PERCENTAGE
iNFORmED SOCiETY
NATiONAl iDENTiTY / CiTiZENSHiP mAORi DiVERSiTY NZ TAlENT iNNOVATiON
1,147,060 28.6% ✓ ✓
966,070 23.8% ✓ ✓
119,090 3.0% ✓ ✓ ✓
2,316,710 57.1% ✓ ✓
n/a n/a ✓ ✓
1,527,010 38.1% ✓ ✓ ✓
n/a n/a ✓ ✓
n/a n/a ✓ ✓
369,990 9.1% ✓ ✓
n/a n/a ✓ ✓ ✓
n/a n/a ✓ ✓ ✓
1,487,020 36.9% ✓
n/a n/a ✓
n/a n/a ✓
477,900 11.8% ✓ ✓ ✓ ✓ ✓
2,525,780 62.6% ✓
3,791,330 94.0% ✓
2,293,050 56.9% ✓
n/a n/a ✓
1,532,000 37.8% ✓
3,255,380 80.7% ✓
903,300 22.5% ✓ ✓ ✓
n/a n/a ✓ ✓
311,080 7.7% ✓ ✓ ✓
789,950 19.5% ✓
1,115,510 27.5% ✓ ✓
2,474,880 61.3% ✓ ✓
429,930 10.7% ✓
n/a n/a ✓
1,987,820 49.0% ✓ ✓ ✓
n/a n/a ✓
281,830 6.9% ✓ ✓ ✓ ✓
838,740 20.8% ✓ ✓
n/a n/a ✓ ✓
176,630 4.4% ✓ ✓
1,337,170 33.2% ✓
n/a n/a ✓
512,860 12.8% ✓ ✓
n/a n/a ✓
n/a n/a ✓ ✓ ✓ ✓
n/a n/a ✓ ✓ ✓ ✓
2,023,140 50.2% ✓ ✓
592,290 14.8% ✓ ✓
2,286,810 56.6% ✓ ✓
442,840 10.9% ✓ ✓ ✓
n/a n/a ✓ ✓
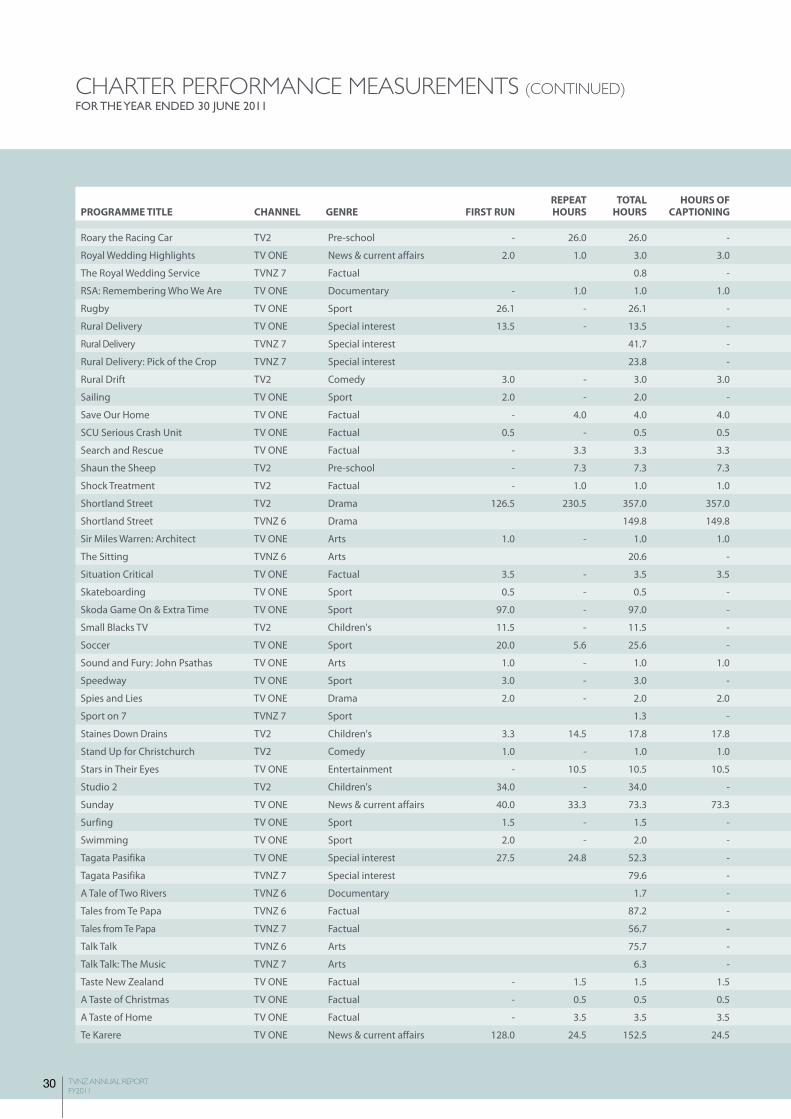
30 TVNZ ANNUAL REPORT FY2011
ChARTER PERFORmANCE mEAsUREmENTs (CONTiNUEd)FOR THE YEAR ENDED 30 JUNE 2011
PROGRAmmE TiTlE CHANNEl GENRE FiRST RuNREPEAT HOuRS
TOTAl HOuRS
HOuRS OF CAPTiONiNG
Roary the Racing Car TV2 Pre-school - 26.0 26.0 -
Royal Wedding Highlights TV ONE News & current affairs 2.0 1.0 3.0 3.0
The Royal Wedding Service TVNZ 7 Factual 0.8 -
RSA: Remembering Who We Are TV ONE Documentary - 1.0 1.0 1.0
Rugby TV ONE Sport 26.1 - 26.1 -
Rural Delivery TV ONE Special interest 13.5 - 13.5 -
Rural Delivery TVNZ 7 Special interest 41.7 -
Rural Delivery: Pick of the Crop TVNZ 7 Special interest 23.8 -
Rural Drift TV2 Comedy 3.0 - 3.0 3.0
Sailing TV ONE Sport 2.0 - 2.0 -
Save Our Home TV ONE Factual - 4.0 4.0 4.0
SCU Serious Crash Unit TV ONE Factual 0.5 - 0.5 0.5
Search and Rescue TV ONE Factual - 3.3 3.3 3.3
Shaun the Sheep TV2 Pre-school - 7.3 7.3 7.3
Shock Treatment TV2 Factual - 1.0 1.0 1.0
Shortland Street TV2 Drama 126.5 230.5 357.0 357.0
Shortland Street TVNZ 6 Drama 149.8 149.8
Sir Miles Warren: Architect TV ONE Arts 1.0 - 1.0 1.0
The Sitting TVNZ 6 Arts 20.6 -
Situation Critical TV ONE Factual 3.5 - 3.5 3.5
Skateboarding TV ONE Sport 0.5 - 0.5 -
Skoda Game On & Extra Time TV ONE Sport 97.0 - 97.0 -
Small Blacks TV TV2 Children's 11.5 - 11.5 -
Soccer TV ONE Sport 20.0 5.6 25.6 -
Sound and Fury: John Psathas TV ONE Arts 1.0 - 1.0 1.0
Speedway TV ONE Sport 3.0 - 3.0 -
Spies and Lies TV ONE Drama 2.0 - 2.0 2.0
Sport on 7 TVNZ 7 Sport 1.3 -
Staines Down Drains TV2 Children's 3.3 14.5 17.8 17.8
Stand Up for Christchurch TV2 Comedy 1.0 - 1.0 1.0
Stars in Their Eyes TV ONE Entertainment - 10.5 10.5 10.5
Studio 2 TV2 Children's 34.0 - 34.0 -
Sunday TV ONE News & current affairs 40.0 33.3 73.3 73.3
Surfing TV ONE Sport 1.5 - 1.5 -
Swimming TV ONE Sport 2.0 - 2.0 -
Tagata Pasifika TV ONE Special interest 27.5 24.8 52.3 -
Tagata Pasifika TVNZ 7 Special interest 79.6 -
A Tale of Two Rivers TVNZ 6 Documentary 1.7 -
Tales from Te Papa TVNZ 6 Factual 87.2 -
Tales from Te Papa TVNZ 7 Factual 56.7 -
Talk Talk TVNZ 6 Arts 75.7 -
Talk Talk: The Music TVNZ 7 Arts 6.3 -
Taste New Zealand TV ONE Factual - 1.5 1.5 1.5
A Taste of Christmas TV ONE Factual - 0.5 0.5 0.5
A Taste of Home TV ONE Factual - 3.5 3.5 3.5
Te Karere TV ONE News & current affairs 128.0 24.5 152.5 24.5
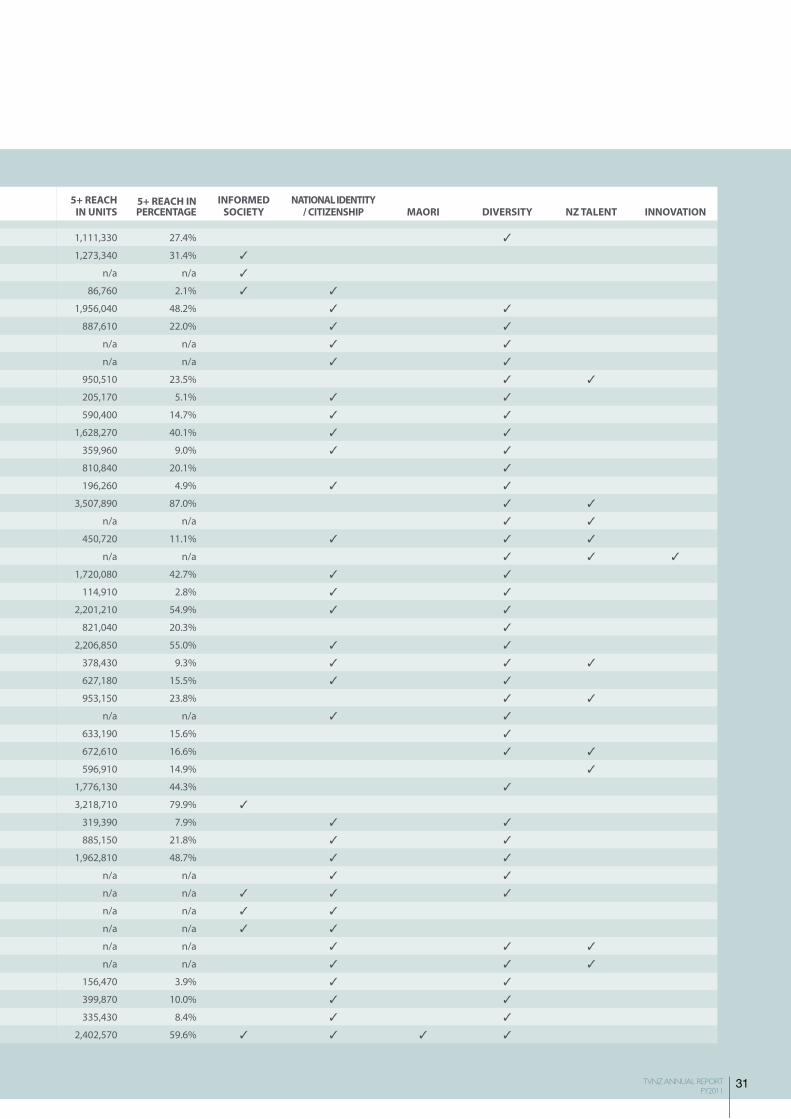
31TVNZ ANNUAL REPORT FY2011
PROGRAmmE TiTlE CHANNEl GENRE FiRST RuNREPEAT HOuRS
TOTAl HOuRS
HOuRS OF CAPTiONiNG
Roary the Racing Car TV2 Pre-school - 26.0 26.0 -
Royal Wedding Highlights TV ONE News & current affairs 2.0 1.0 3.0 3.0
The Royal Wedding Service TVNZ 7 Factual 0.8 -
RSA: Remembering Who We Are TV ONE Documentary - 1.0 1.0 1.0
Rugby TV ONE Sport 26.1 - 26.1 -
Rural Delivery TV ONE Special interest 13.5 - 13.5 -
Rural Delivery TVNZ 7 Special interest 41.7 -
Rural Delivery: Pick of the Crop TVNZ 7 Special interest 23.8 -
Rural Drift TV2 Comedy 3.0 - 3.0 3.0
Sailing TV ONE Sport 2.0 - 2.0 -
Save Our Home TV ONE Factual - 4.0 4.0 4.0
SCU Serious Crash Unit TV ONE Factual 0.5 - 0.5 0.5
Search and Rescue TV ONE Factual - 3.3 3.3 3.3
Shaun the Sheep TV2 Pre-school - 7.3 7.3 7.3
Shock Treatment TV2 Factual - 1.0 1.0 1.0
Shortland Street TV2 Drama 126.5 230.5 357.0 357.0
Shortland Street TVNZ 6 Drama 149.8 149.8
Sir Miles Warren: Architect TV ONE Arts 1.0 - 1.0 1.0
The Sitting TVNZ 6 Arts 20.6 -
Situation Critical TV ONE Factual 3.5 - 3.5 3.5
Skateboarding TV ONE Sport 0.5 - 0.5 -
Skoda Game On & Extra Time TV ONE Sport 97.0 - 97.0 -
Small Blacks TV TV2 Children's 11.5 - 11.5 -
Soccer TV ONE Sport 20.0 5.6 25.6 -
Sound and Fury: John Psathas TV ONE Arts 1.0 - 1.0 1.0
Speedway TV ONE Sport 3.0 - 3.0 -
Spies and Lies TV ONE Drama 2.0 - 2.0 2.0
Sport on 7 TVNZ 7 Sport 1.3 -
Staines Down Drains TV2 Children's 3.3 14.5 17.8 17.8
Stand Up for Christchurch TV2 Comedy 1.0 - 1.0 1.0
Stars in Their Eyes TV ONE Entertainment - 10.5 10.5 10.5
Studio 2 TV2 Children's 34.0 - 34.0 -
Sunday TV ONE News & current affairs 40.0 33.3 73.3 73.3
Surfing TV ONE Sport 1.5 - 1.5 -
Swimming TV ONE Sport 2.0 - 2.0 -
Tagata Pasifika TV ONE Special interest 27.5 24.8 52.3 -
Tagata Pasifika TVNZ 7 Special interest 79.6 -
A Tale of Two Rivers TVNZ 6 Documentary 1.7 -
Tales from Te Papa TVNZ 6 Factual 87.2 -
Tales from Te Papa TVNZ 7 Factual 56.7 -
Talk Talk TVNZ 6 Arts 75.7 -
Talk Talk: The Music TVNZ 7 Arts 6.3 -
Taste New Zealand TV ONE Factual - 1.5 1.5 1.5
A Taste of Christmas TV ONE Factual - 0.5 0.5 0.5
A Taste of Home TV ONE Factual - 3.5 3.5 3.5
Te Karere TV ONE News & current affairs 128.0 24.5 152.5 24.5
5+ REACH iN uNiTS
5+ REACH iN PERCENTAGE
iNFORmED SOCiETY
NATiONAl iDENTiTY / CiTiZENSHiP mAORi DiVERSiTY NZ TAlENT iNNOVATiON
1,111,330 27.4% ✓
1,273,340 31.4% ✓
n/a n/a ✓
86,760 2.1% ✓ ✓
1,956,040 48.2% ✓ ✓
887,610 22.0% ✓ ✓
n/a n/a ✓ ✓
n/a n/a ✓ ✓
950,510 23.5% ✓ ✓
205,170 5.1% ✓ ✓
590,400 14.7% ✓ ✓
1,628,270 40.1% ✓ ✓
359,960 9.0% ✓ ✓
810,840 20.1% ✓
196,260 4.9% ✓ ✓
3,507,890 87.0% ✓ ✓
n/a n/a ✓ ✓
450,720 11.1% ✓ ✓ ✓
n/a n/a ✓ ✓ ✓
1,720,080 42.7% ✓ ✓
114,910 2.8% ✓ ✓
2,201,210 54.9% ✓ ✓
821,040 20.3% ✓
2,206,850 55.0% ✓ ✓
378,430 9.3% ✓ ✓ ✓
627,180 15.5% ✓ ✓
953,150 23.8% ✓ ✓
n/a n/a ✓ ✓
633,190 15.6% ✓
672,610 16.6% ✓ ✓
596,910 14.9% ✓
1,776,130 44.3% ✓
3,218,710 79.9% ✓
319,390 7.9% ✓ ✓
885,150 21.8% ✓ ✓
1,962,810 48.7% ✓ ✓
n/a n/a ✓ ✓
n/a n/a ✓ ✓ ✓
n/a n/a ✓ ✓
n/a n/a ✓ ✓
n/a n/a ✓ ✓ ✓
n/a n/a ✓ ✓ ✓
156,470 3.9% ✓ ✓
399,870 10.0% ✓ ✓
335,430 8.4% ✓ ✓
2,402,570 59.6% ✓ ✓ ✓ ✓
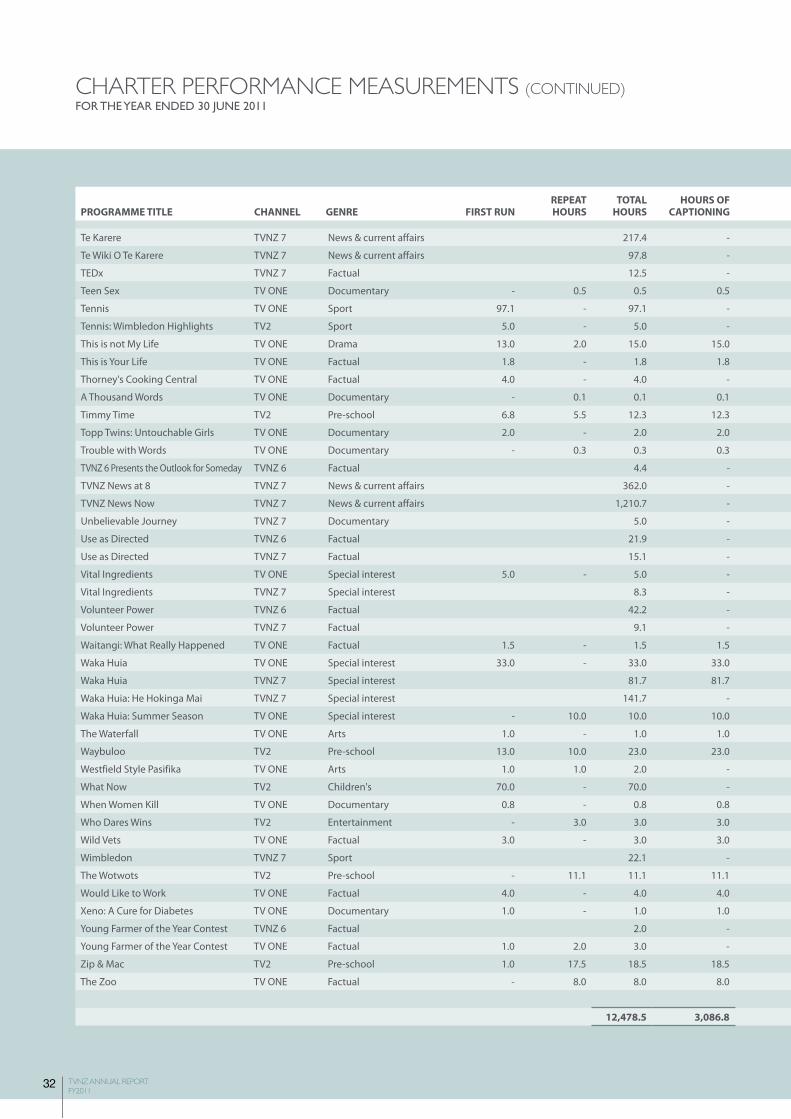
32 TVNZ ANNUAL REPORT FY2011
ChARTER PERFORmANCE mEAsUREmENTs (CONTiNUEd)FOR THE YEAR ENDED 30 JUNE 2011
PROGRAmmE TiTlE CHANNEl GENRE FiRST RuNREPEAT HOuRS
TOTAl HOuRS
HOuRS OF CAPTiONiNG
Te Karere TVNZ 7 News & current affairs 217.4 -
Te Wiki O Te Karere TVNZ 7 News & current affairs 97.8 -
TEDx TVNZ 7 Factual 12.5 -
Teen Sex TV ONE Documentary - 0.5 0.5 0.5
Tennis TV ONE Sport 97.1 - 97.1 -
Tennis: Wimbledon Highlights TV2 Sport 5.0 - 5.0 -
This is not My Life TV ONE Drama 13.0 2.0 15.0 15.0
This is Your Life TV ONE Factual 1.8 - 1.8 1.8
Thorney's Cooking Central TV ONE Factual 4.0 - 4.0 -
A Thousand Words TV ONE Documentary - 0.1 0.1 0.1
Timmy Time TV2 Pre-school 6.8 5.5 12.3 12.3
Topp Twins: Untouchable Girls TV ONE Documentary 2.0 - 2.0 2.0
Trouble with Words TV ONE Documentary - 0.3 0.3 0.3
TVNZ 6 Presents the Outlook for Someday TVNZ 6 Factual 4.4 -
TVNZ News at 8 TVNZ 7 News & current affairs 362.0 -
TVNZ News Now TVNZ 7 News & current affairs 1,210.7 -
Unbelievable Journey TVNZ 7 Documentary 5.0 -
Use as Directed TVNZ 6 Factual 21.9 -
Use as Directed TVNZ 7 Factual 15.1 -
Vital Ingredients TV ONE Special interest 5.0 - 5.0 -
Vital Ingredients TVNZ 7 Special interest 8.3 -
Volunteer Power TVNZ 6 Factual 42.2 -
Volunteer Power TVNZ 7 Factual 9.1 -
Waitangi: What Really Happened TV ONE Factual 1.5 - 1.5 1.5
Waka Huia TV ONE Special interest 33.0 - 33.0 33.0
Waka Huia TVNZ 7 Special interest 81.7 81.7
Waka Huia: He Hokinga Mai TVNZ 7 Special interest 141.7 -
Waka Huia: Summer Season TV ONE Special interest - 10.0 10.0 10.0
The Waterfall TV ONE Arts 1.0 - 1.0 1.0
Waybuloo TV2 Pre-school 13.0 10.0 23.0 23.0
Westfield Style Pasifika TV ONE Arts 1.0 1.0 2.0 -
What Now TV2 Children's 70.0 - 70.0 -
When Women Kill TV ONE Documentary 0.8 - 0.8 0.8
Who Dares Wins TV2 Entertainment - 3.0 3.0 3.0
Wild Vets TV ONE Factual 3.0 - 3.0 3.0
Wimbledon TVNZ 7 Sport 22.1 -
The Wotwots TV2 Pre-school - 11.1 11.1 11.1
Would Like to Work TV ONE Factual 4.0 - 4.0 4.0
Xeno: A Cure for Diabetes TV ONE Documentary 1.0 - 1.0 1.0
Young Farmer of the Year Contest TVNZ 6 Factual 2.0 -
Young Farmer of the Year Contest TV ONE Factual 1.0 2.0 3.0 -
Zip & Mac TV2 Pre-school 1.0 17.5 18.5 18.5
The Zoo TV ONE Factual - 8.0 8.0 8.0
12,478.5 3,086.8
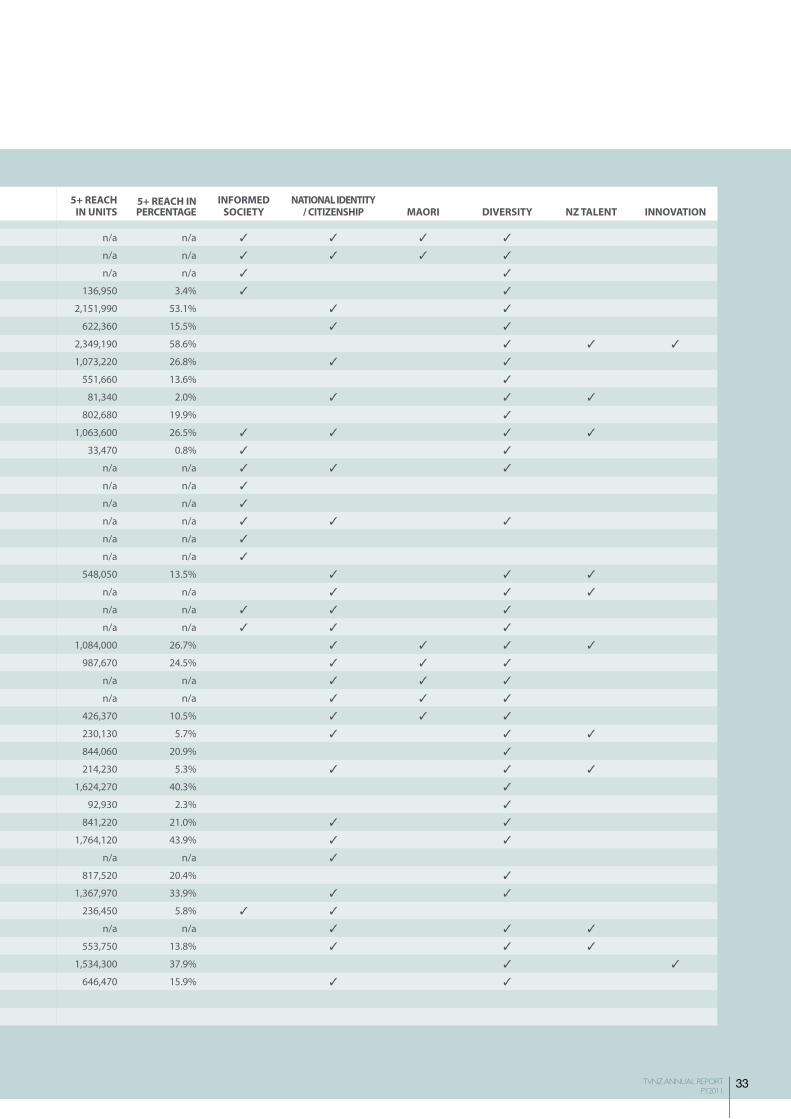
33TVNZ ANNUAL REPORT FY2011
PROGRAmmE TiTlE CHANNEl GENRE FiRST RuNREPEAT HOuRS
TOTAl HOuRS
HOuRS OF CAPTiONiNG
Te Karere TVNZ 7 News & current affairs 217.4 -
Te Wiki O Te Karere TVNZ 7 News & current affairs 97.8 -
TEDx TVNZ 7 Factual 12.5 -
Teen Sex TV ONE Documentary - 0.5 0.5 0.5
Tennis TV ONE Sport 97.1 - 97.1 -
Tennis: Wimbledon Highlights TV2 Sport 5.0 - 5.0 -
This is not My Life TV ONE Drama 13.0 2.0 15.0 15.0
This is Your Life TV ONE Factual 1.8 - 1.8 1.8
Thorney's Cooking Central TV ONE Factual 4.0 - 4.0 -
A Thousand Words TV ONE Documentary - 0.1 0.1 0.1
Timmy Time TV2 Pre-school 6.8 5.5 12.3 12.3
Topp Twins: Untouchable Girls TV ONE Documentary 2.0 - 2.0 2.0
Trouble with Words TV ONE Documentary - 0.3 0.3 0.3
TVNZ 6 Presents the Outlook for Someday TVNZ 6 Factual 4.4 -
TVNZ News at 8 TVNZ 7 News & current affairs 362.0 -
TVNZ News Now TVNZ 7 News & current affairs 1,210.7 -
Unbelievable Journey TVNZ 7 Documentary 5.0 -
Use as Directed TVNZ 6 Factual 21.9 -
Use as Directed TVNZ 7 Factual 15.1 -
Vital Ingredients TV ONE Special interest 5.0 - 5.0 -
Vital Ingredients TVNZ 7 Special interest 8.3 -
Volunteer Power TVNZ 6 Factual 42.2 -
Volunteer Power TVNZ 7 Factual 9.1 -
Waitangi: What Really Happened TV ONE Factual 1.5 - 1.5 1.5
Waka Huia TV ONE Special interest 33.0 - 33.0 33.0
Waka Huia TVNZ 7 Special interest 81.7 81.7
Waka Huia: He Hokinga Mai TVNZ 7 Special interest 141.7 -
Waka Huia: Summer Season TV ONE Special interest - 10.0 10.0 10.0
The Waterfall TV ONE Arts 1.0 - 1.0 1.0
Waybuloo TV2 Pre-school 13.0 10.0 23.0 23.0
Westfield Style Pasifika TV ONE Arts 1.0 1.0 2.0 -
What Now TV2 Children's 70.0 - 70.0 -
When Women Kill TV ONE Documentary 0.8 - 0.8 0.8
Who Dares Wins TV2 Entertainment - 3.0 3.0 3.0
Wild Vets TV ONE Factual 3.0 - 3.0 3.0
Wimbledon TVNZ 7 Sport 22.1 -
The Wotwots TV2 Pre-school - 11.1 11.1 11.1
Would Like to Work TV ONE Factual 4.0 - 4.0 4.0
Xeno: A Cure for Diabetes TV ONE Documentary 1.0 - 1.0 1.0
Young Farmer of the Year Contest TVNZ 6 Factual 2.0 -
Young Farmer of the Year Contest TV ONE Factual 1.0 2.0 3.0 -
Zip & Mac TV2 Pre-school 1.0 17.5 18.5 18.5
The Zoo TV ONE Factual - 8.0 8.0 8.0
12,478.5 3,086.8
5+ REACH iN uNiTS
5+ REACH iN PERCENTAGE
iNFORmED SOCiETY
NATiONAl iDENTiTY / CiTiZENSHiP mAORi DiVERSiTY NZ TAlENT iNNOVATiON
n/a n/a ✓ ✓ ✓ ✓
n/a n/a ✓ ✓ ✓ ✓
n/a n/a ✓ ✓
136,950 3.4% ✓ ✓
2,151,990 53.1% ✓ ✓
622,360 15.5% ✓ ✓
2,349,190 58.6% ✓ ✓ ✓
1,073,220 26.8% ✓ ✓
551,660 13.6% ✓
81,340 2.0% ✓ ✓ ✓
802,680 19.9% ✓
1,063,600 26.5% ✓ ✓ ✓ ✓
33,470 0.8% ✓ ✓
n/a n/a ✓ ✓ ✓
n/a n/a ✓
n/a n/a ✓
n/a n/a ✓ ✓ ✓
n/a n/a ✓
n/a n/a ✓
548,050 13.5% ✓ ✓ ✓
n/a n/a ✓ ✓ ✓
n/a n/a ✓ ✓ ✓
n/a n/a ✓ ✓ ✓
1,084,000 26.7% ✓ ✓ ✓ ✓
987,670 24.5% ✓ ✓ ✓
n/a n/a ✓ ✓ ✓
n/a n/a ✓ ✓ ✓
426,370 10.5% ✓ ✓ ✓
230,130 5.7% ✓ ✓ ✓
844,060 20.9% ✓
214,230 5.3% ✓ ✓ ✓
1,624,270 40.3% ✓
92,930 2.3% ✓
841,220 21.0% ✓ ✓
1,764,120 43.9% ✓ ✓
n/a n/a ✓
817,520 20.4% ✓
1,367,970 33.9% ✓ ✓
236,450 5.8% ✓ ✓
n/a n/a ✓ ✓ ✓
553,750 13.8% ✓ ✓ ✓
1,534,300 37.9% ✓ ✓
646,470 15.9% ✓ ✓
34 TVNZ ANNUAL REPORT FY2011
Statement of Responsibility 35
Income Statement 36
Statement of Comprehensive Income 37
Statement of Changes in Equity 38
Statement of Financial Position 39
Statement of Cash Flows 40
Notes to the Financial Statements 41
Statement of Service Performance 69
Report of the Auditor-General 79
Five Year Trend Statement 81
Additional Information 82
FiNANCiAL sTATEmENTs
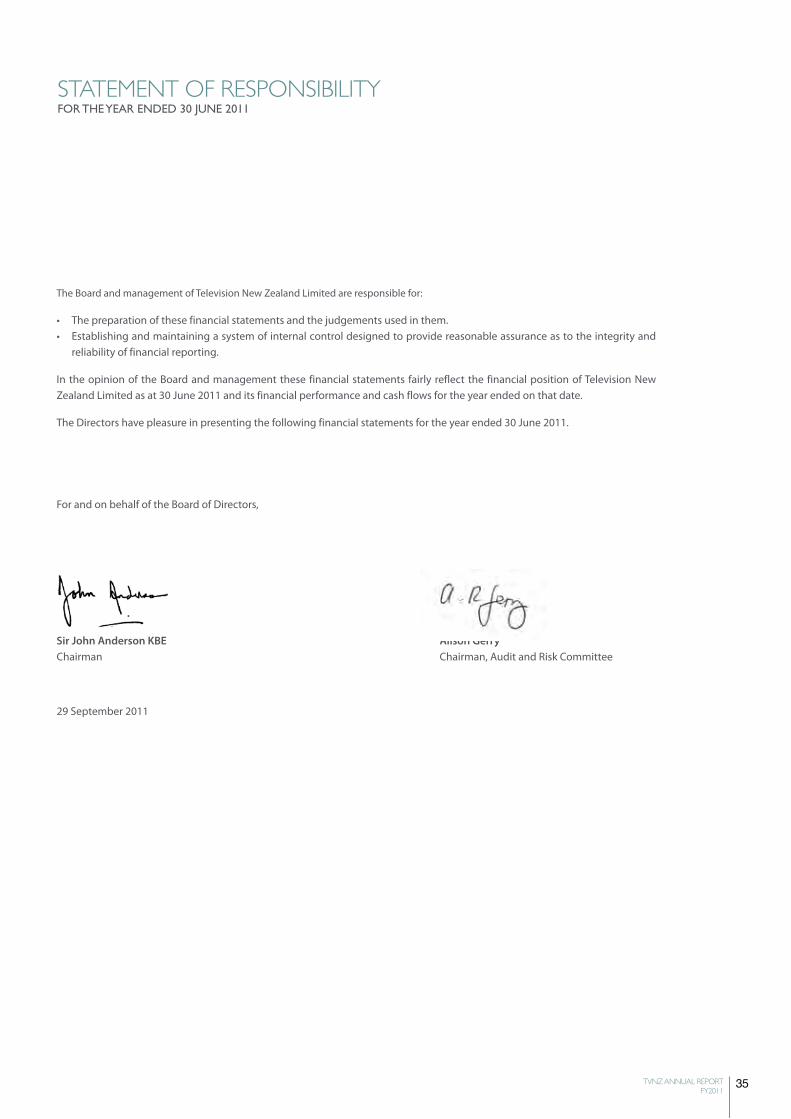
35TVNZ ANNUAL REPORT FY2011
sTATEmENT OF REsPONsibiLiTYFOR THE YEAR ENDED 30 JUNE 2011
The Board and management of Television New Zealand Limited are responsible for:
• The preparation of these financial statements and the judgements used in them.• Establishing and maintaining a system of internal control designed to provide reasonable assurance as to the integrity and
reliability of financial reporting.
In the opinion of the Board and management these financial statements fairly reflect the financial position of Television New Zealand Limited as at 30 June 2011 and its financial performance and cash flows for the year ended on that date.
The Directors have pleasure in presenting the following financial statements for the year ended 30 June 2011.
For and on behalf of the Board of Directors,
Sir John Anderson KBE Alison Gerry Chairman Chairman, Audit and Risk Committee
29 September 2011
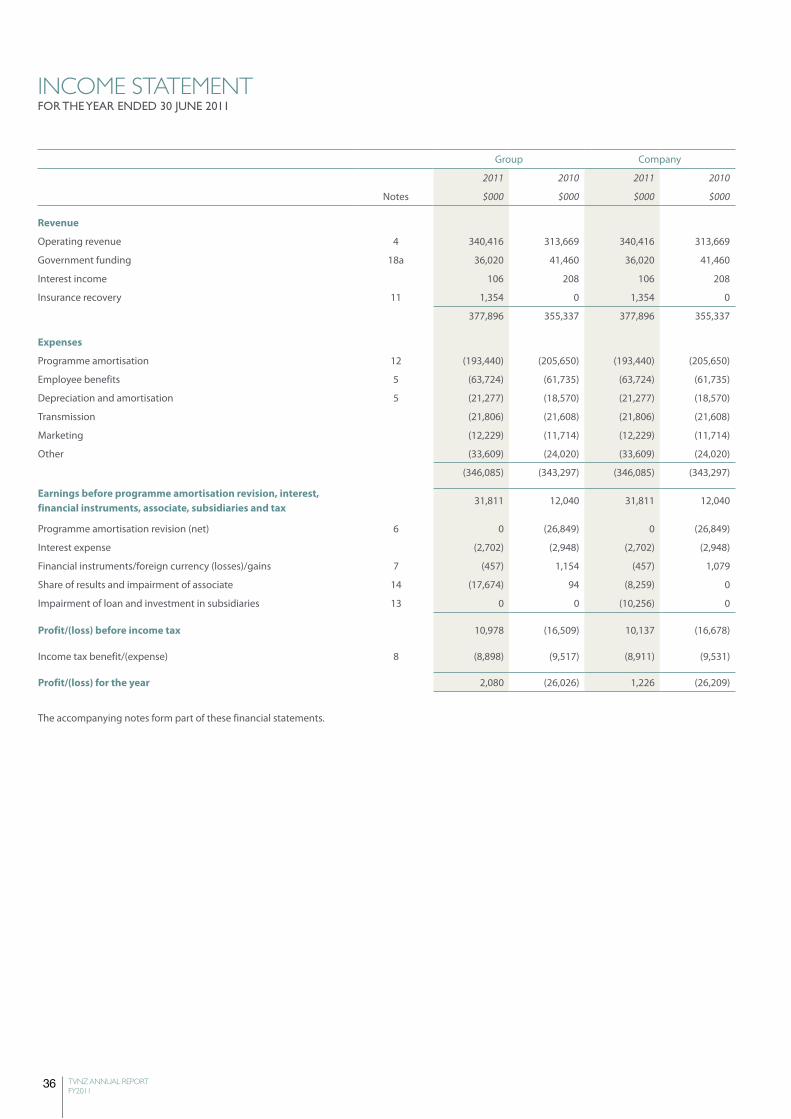
36 TVNZ ANNUAL REPORT FY2011
iNCOmE sTATEmENTFOR THE YEAR ENDED 30 JUNE 2011
Group Company
2011 2010 2011 2010
Notes $000 $000 $000 $000
Revenue
Operating revenue 4 340,416 313,669 340,416 313,669
Government funding 18a 36,020 41,460 36,020 41,460
Interest income 106 208 106 208
Insurance recovery 11 1,354 0 1,354 0
377,896 355,337 377,896 355,337
Expenses
Programme amortisation 12 (193,440) (205,650) (193,440) (205,650)
Employee benefits 5 (63,724) (61,735) (63,724) (61,735)
Depreciation and amortisation 5 (21,277) (18,570) (21,277) (18,570)
Transmission (21,806) (21,608) (21,806) (21,608)
Marketing (12,229) (11,714) (12,229) (11,714)
Other (33,609) (24,020) (33,609) (24,020)
(346,085) (343,297) (346,085) (343,297)
Earnings before programme amortisation revision, interest, financial instruments, associate, subsidiaries and tax
31,811 12,040 31,811 12,040
Programme amortisation revision (net) 6 0 (26,849) 0 (26,849)
Interest expense (2,702) (2,948) (2,702) (2,948)
Financial instruments/foreign currency (losses)/gains 7 (457) 1,154 (457) 1,079
Share of results and impairment of associate 14 (17,674) 94 (8,259) 0
Impairment of loan and investment in subsidiaries 13 0 0 (10,256) 0
Profit/(loss) before income tax 10,978 (16,509) 10,137 (16,678)
Income tax benefit/(expense) 8 (8,898) (9,517) (8,911) (9,531)
Profit/(loss) for the year 2,080 (26,026) 1,226 (26,209)
The accompanying notes form part of these financial statements.
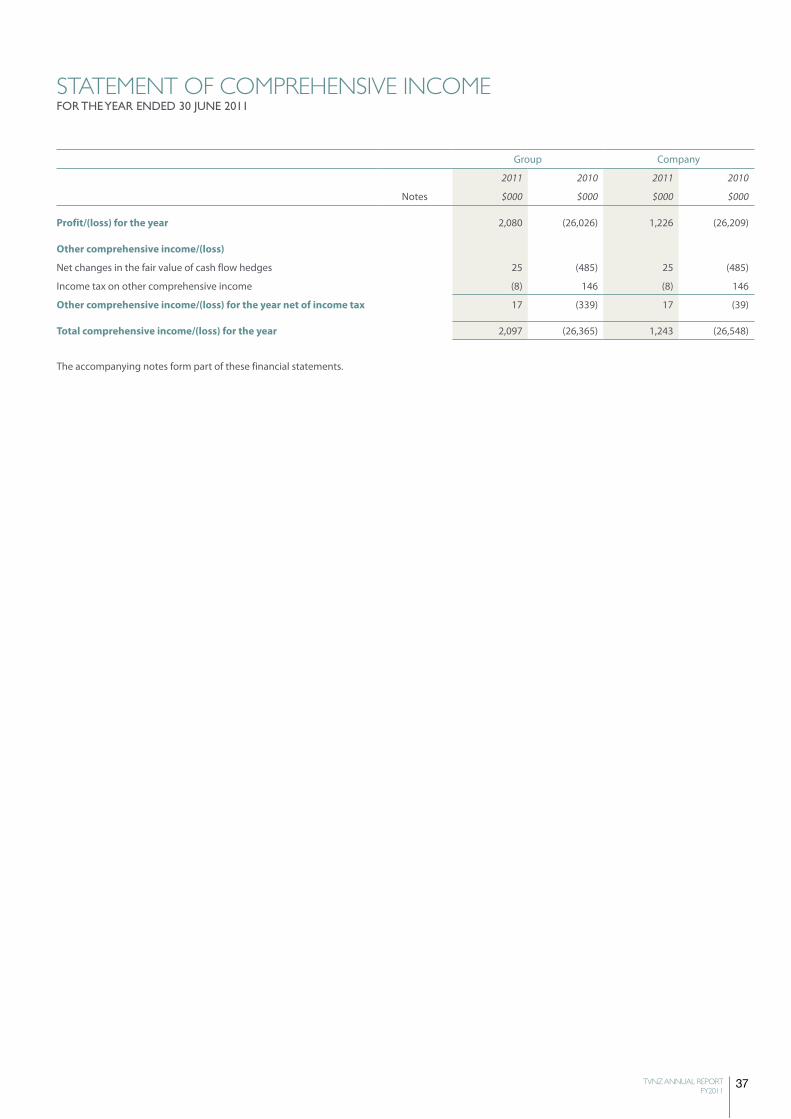
37TVNZ ANNUAL REPORT FY2011
sTATEmENT OF COmPREhENsiVE iNCOmEFOR THE YEAR ENDED 30 JUNE 2011
Group Company
2011 2010 2011 2010
Notes $000 $000 $000 $000
Profit/(loss) for the year 2,080 (26,026) 1,226 (26,209)
Other comprehensive income/(loss)
Net changes in the fair value of cash flow hedges 25 (485) 25 (485)
Income tax on other comprehensive income (8) 146 (8) 146
Other comprehensive income/(loss) for the year net of income tax 17 (339) 17 (39)
Total comprehensive income/(loss) for the year 2,097 (26,365) 1,243 (26,548)
The accompanying notes form part of these financial statements.
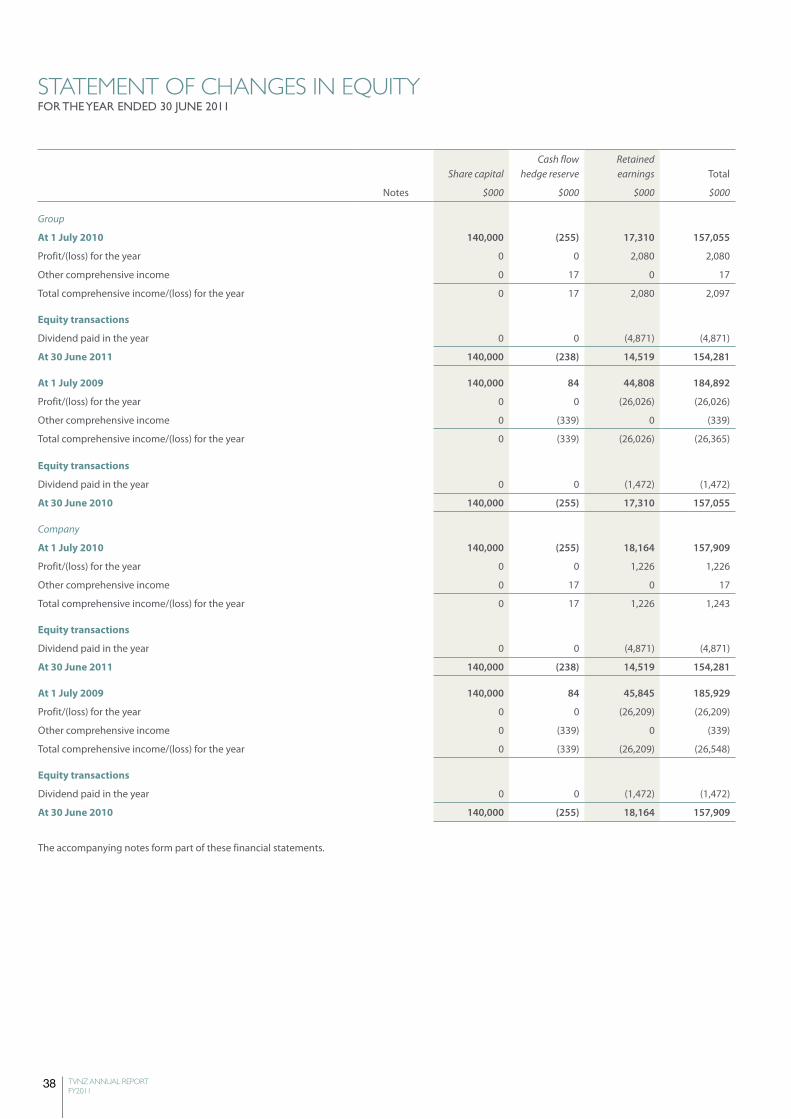
38 TVNZ ANNUAL REPORT FY2011
sTATEmENT OF ChANgEs iN EqUiTYFOR THE YEAR ENDED 30 JUNE 2011
Share capitalCash flow
hedge reserveRetained earnings Total
Notes $000 $000 $000 $000
Group
At 1 July 2010 140,000 (255) 17,310 157,055
Profit/(loss) for the year 0 0 2,080 2,080
Other comprehensive income 0 17 0 17
Total comprehensive income/(loss) for the year 0 17 2,080 2,097
Equity transactions
Dividend paid in the year 0 0 (4,871) (4,871)
At 30 June 2011 140,000 (238) 14,519 154,281
At 1 July 2009 140,000 84 44,808 184,892
Profit/(loss) for the year 0 0 (26,026) (26,026)
Other comprehensive income 0 (339) 0 (339)
Total comprehensive income/(loss) for the year 0 (339) (26,026) (26,365)
Equity transactions
Dividend paid in the year 0 0 (1,472) (1,472)
At 30 June 2010 140,000 (255) 17,310 157,055
Company
At 1 July 2010 140,000 (255) 18,164 157,909
Profit/(loss) for the year 0 0 1,226 1,226
Other comprehensive income 0 17 0 17
Total comprehensive income/(loss) for the year 0 17 1,226 1,243
Equity transactions
Dividend paid in the year 0 0 (4,871) (4,871)
At 30 June 2011 140,000 (238) 14,519 154,281
At 1 July 2009 140,000 84 45,845 185,929
Profit/(loss) for the year 0 0 (26,209) (26,209)
Other comprehensive income 0 (339) 0 (339)
Total comprehensive income/(loss) for the year 0 (339) (26,209) (26,548)
Equity transactions
Dividend paid in the year 0 0 (1,472) (1,472)
At 30 June 2010 140,000 (255) 18,164 157,909
The accompanying notes form part of these financial statements.
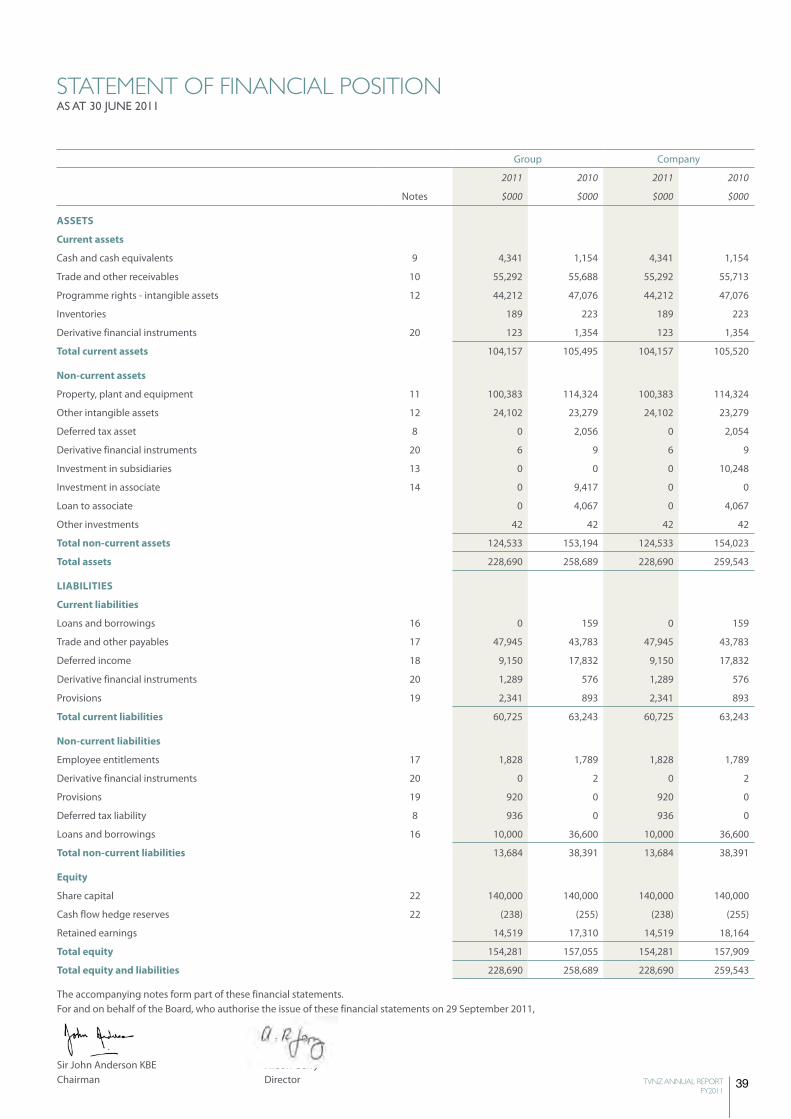
39TVNZ ANNUAL REPORT FY2011
sTATEmENT OF FiNANCiAL POsiTiONAs AT 30 JUNE 2011
Group Company
2011 2010 2011 2010
Notes $000 $000 $000 $000
ASSETS
Current assets
Cash and cash equivalents 9 4,341 1,154 4,341 1,154
Trade and other receivables 10 55,292 55,688 55,292 55,713
Programme rights - intangible assets 12 44,212 47,076 44,212 47,076
Inventories 189 223 189 223
Derivative financial instruments 20 123 1,354 123 1,354
Total current assets 104,157 105,495 104,157 105,520
Non-current assets
Property, plant and equipment 11 100,383 114,324 100,383 114,324
Other intangible assets 12 24,102 23,279 24,102 23,279
Deferred tax asset 8 0 2,056 0 2,054
Derivative financial instruments 20 6 9 6 9
Investment in subsidiaries 13 0 0 0 10,248
Investment in associate 14 0 9,417 0 0
Loan to associate 0 4,067 0 4,067
Other investments 42 42 42 42
Total non-current assets 124,533 153,194 124,533 154,023
Total assets 228,690 258,689 228,690 259,543
liABiliTiES
Current liabilities
Loans and borrowings 16 0 159 0 159
Trade and other payables 17 47,945 43,783 47,945 43,783
Deferred income 18 9,150 17,832 9,150 17,832
Derivative financial instruments 20 1,289 576 1,289 576
Provisions 19 2,341 893 2,341 893
Total current liabilities 60,725 63,243 60,725 63,243
Non-current liabilities
Employee entitlements 17 1,828 1,789 1,828 1,789
Derivative financial instruments 20 0 2 0 2
Provisions 19 920 0 920 0
Deferred tax liability 8 936 0 936 0
Loans and borrowings 16 10,000 36,600 10,000 36,600
Total non-current liabilities 13,684 38,391 13,684 38,391
Equity
Share capital 22 140,000 140,000 140,000 140,000
Cash flow hedge reserves 22 (238) (255) (238) (255)
Retained earnings 14,519 17,310 14,519 18,164
Total equity 154,281 157,055 154,281 157,909
Total equity and liabilities 228,690 258,689 228,690 259,543
The accompanying notes form part of these financial statements. For and on behalf of the Board, who authorise the issue of these financial statements on 29 September 2011,
Sir John Anderson KBE Alison Gerry Chairman Director
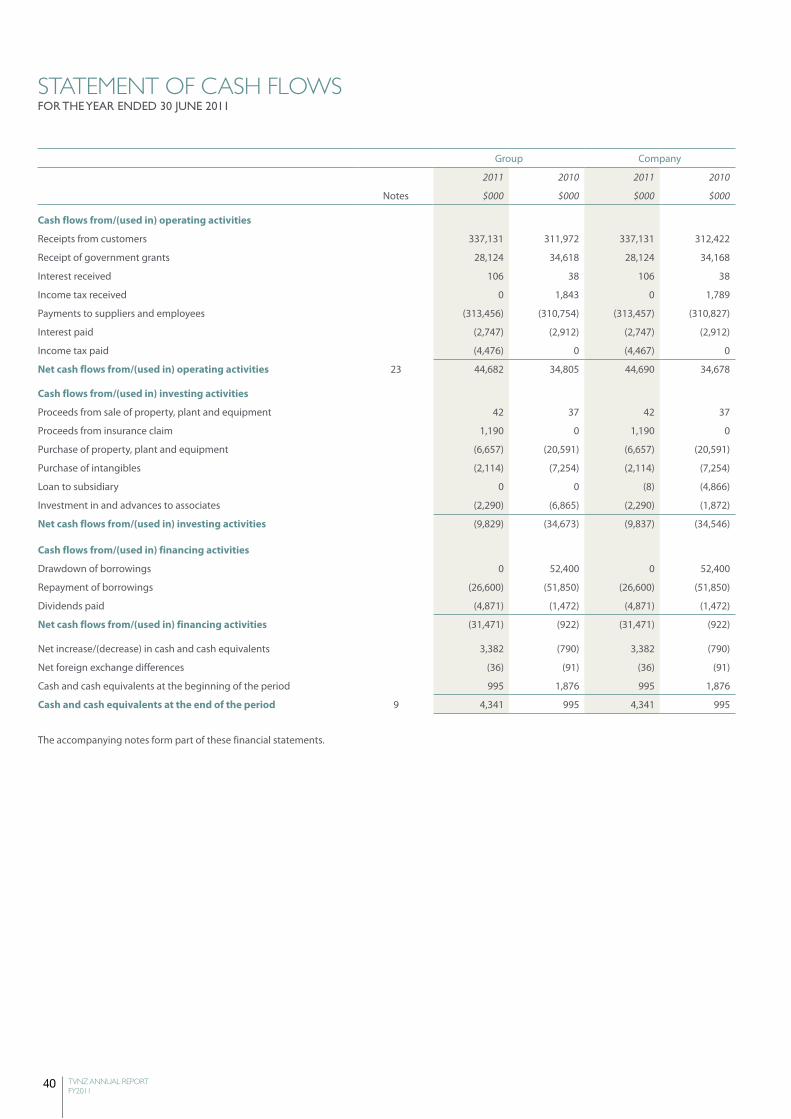
40 TVNZ ANNUAL REPORT FY2011
sTATEmENT OF CAsh FLOwsFOR THE YEAR ENDED 30 JUNE 2011
Group Company
2011 2010 2011 2010
Notes $000 $000 $000 $000
Cash flows from/(used in) operating activities
Receipts from customers 337,131 311,972 337,131 312,422
Receipt of government grants 28,124 34,618 28,124 34,168
Interest received 106 38 106 38
Income tax received 0 1,843 0 1,789
Payments to suppliers and employees (313,456) (310,754) (313,457) (310,827)
Interest paid (2,747) (2,912) (2,747) (2,912)
Income tax paid (4,476) 0 (4,467) 0
Net cash flows from/(used in) operating activities 23 44,682 34,805 44,690 34,678
Cash flows from/(used in) investing activities
Proceeds from sale of property, plant and equipment 42 37 42 37
Proceeds from insurance claim 1,190 0 1,190 0
Purchase of property, plant and equipment (6,657) (20,591) (6,657) (20,591)
Purchase of intangibles (2,114) (7,254) (2,114) (7,254)
Loan to subsidiary 0 0 (8) (4,866)
Investment in and advances to associates (2,290) (6,865) (2,290) (1,872)
Net cash flows from/(used in) investing activities (9,829) (34,673) (9,837) (34,546)
Cash flows from/(used in) financing activities
Drawdown of borrowings 0 52,400 0 52,400
Repayment of borrowings (26,600) (51,850) (26,600) (51,850)
Dividends paid (4,871) (1,472) (4,871) (1,472)
Net cash flows from/(used in) financing activities (31,471) (922) (31,471) (922)
Net increase/(decrease) in cash and cash equivalents 3,382 (790) 3,382 (790)
Net foreign exchange differences (36) (91) (36) (91)
Cash and cash equivalents at the beginning of the period 995 1,876 995 1,876
Cash and cash equivalents at the end of the period 9 4,341 995 4,341 995
The accompanying notes form part of these financial statements.
41TVNZ ANNUAL REPORT FY2011
NOTEs TO ThE FiNANCiAL sTATEmENTsFOR THE YEAR ENDED 30 JUNE 2011
1. Corporate informationTelevision New Zealand Limited (the “Company”) and its subsidiaries (the “Group’) operate as a multi-channel television and digital media broadcasting and production company in New Zealand.
The Company is a limited liability company incorporated in New Zealand under the Companies Act 1993 and is wholly owned by the Crown. The Company is bound by the requirements of the Television New Zealand Act 2003. The Crown does not guarantee the liabilities of Television New Zealand Limited in any way.
These consolidated financial statements were approved for issue by the Board of Directors on 29 September 2011.
2. Summary of significant accounting policiesThe principal accounting policies adopted in the preparation of the financial statements are set out below. These policies have been consistently applied to all periods presented, unless otherwise stated.
a) Basis of preparationThe financial statements have been prepared in accordance with generally accepted accounting practice in New Zealand (NZ GAAP) and the requirements of the Television New Zealand Act 2003, Financial Reporting Act 1993 and the Companies Act 1993. The financial statements have been prepared on a historical cost basis except for derivative financial instruments that have been measured at fair value.
The carrying values of recognised assets and liabilities that are hedged are adjusted to record changes in the fair values attributable to the risks that are being hedged.
The financial statements are presented in New Zealand dollars ($), which is the Company’s functional currency. All financial information presented in New Zealand dollars has been rounded to the nearest thousand unless otherwise stated.
b) Statement of complianceThe financial statements have been prepared in accordance with NZ GAAP. They comply with New Zealand equivalents to International Financial Reporting Standards (NZ IFRS), and other applicable Financial Reporting Standards, as appropriate for profit orientated entities. The financial statements comply with International Financial Reporting Standards (IFRS).
The accounting policies set out below have been applied consistently to all periods presented in these financial statements, unless otherwise stated.
c) Changes in accounting policies and disclosuresi) New and amended standards adopted by the GroupThere were no new or amended standards adopted during FY2011 that had a material impact on the financial statements.
ii) Accounting standards and interpretations issued but not yet effectiveStandards and Interpretations that have recently been issued or amended but are not yet effective have not been adopted by the Group for the annual reporting period ending 30 June 2011. These are noted below.
NZ IFRS 9 – Financial InstrumentsThis standard is part of a wider project to replace NZ IAS 39 Financial Instruments: Recognition and Measurement. The standard establishes two primary measurement categories for financial assets: amortised cost and fair value. The basis of classification will depend on the Group’s business model for managing the financial asset and contractual cash flow characteristics of the financial asset. The Group has not yet assessed the impact of this standard. The application date for this standard is for accounting periods beginning on or after 1 January 2013, the application date for the Group is 1 July 2013.
NZ IFRS 11 – Joint ArrangementsNZ IFRS 11 replaces NZ IAS 31 Interests in Joint Ventures and SIC-13 Jointly Controlled Entities – Non Monetary Contributions by Venturers. NZ IFRS 11 uses the principle of control in NZ IFRS 10 to define joint control, and therefore the determination of whether joint control exists may change. NZ IFRS 11 distinguishes joint arrangements between joint operations and joint ventures. NZ IFRS 11 removes the option to account for jointly controlled entities (JCEs) using the equity method or the proportionate consolidation method. JCEs that are joint operations are required to be accounted for by recognising the share of those assets and obligations. JCEs that are joint ventures are required to use the equity method. This change should have no impact on the Group’s financial statements. The application date for this standard is for accounting periods beginning on or after 1 January 2013, the application date for the Group is 1 July 2013.
42 TVNZ ANNUAL REPORT FY2011
NOTEs TO ThE FiNANCiAL sTATEmENTs (CONTiNUEd)FOR THE YEAR ENDED 30 JUNE 2011
c) Changes in accounting policies and disclosures (continued)ii) Accounting standards and interpretations issued but not yet effectiveNZ IFRS 12 – Disclosure of Interests in Other EntitiesNZ IFRS 12 includes all disclosures relating to an entity’s interests in subsidiaries, joint arrangements (joint operations or joint ventures), associates and structured entities. New disclosures have been introduced about the judgements made by management to determine whether control exists, and to require summarised information about joint arrangements, associates, subsidiaries and structured entities with non controlling interests. NZ IFRS 12 is a disclosure standard so will have not have a direct impact on the Group’s financial statements. The application date for this standard is for accounting periods beginning on or after 1 January 2013, the application date for the Group is 1 July 2013.
d) Basis of consolidationThe consolidated financial statements comprise the financial statements of Television New Zealand Limited and its subsidiaries at 30 June.
Subsidiaries are those entities controlled, directly or indirectly, by the Group. The financial statements of subsidiaries are prepared for the same reporting period as the parent company, using consistent accounting policies. All intercompany transactions, balances and unrealised surpluses and deficits on transactions between Group companies are eliminated on consolidation.
Subsidiaries are fully consolidated from the date on which control is obtained by the Group and cease to be consolidated from the date on which control is transferred out of the Group.
The acquisition of subsidiaries is accounted for using the acquisition method of accounting.
Investments in subsidiaries are accounted for at cost, less allowance for impairment, in the separate financial statements of the Company.
e) Foreign currencyThe functional and presentational currency of Television New Zealand Limited and its subsidiaries is the New Zealand dollar ($).
Transactions in foreign currencies are translated to the functional currency at the exchange rates ruling at the date of the transaction. Monetary assets and liabilities denominated in foreign currencies are retranslated at the exchange rates ruling at balance date.
Foreign currency differences arising on the translation of monetary assets and liabilities in foreign currencies are recognised in the income statement.
Non-monetary items that are measured in terms of historical cost in a foreign currency are translated using the exchange rate as at the date of the initial transaction.
f) Revenue recognitionRevenue is stated exclusive of goods and services tax (GST) and consists of sales of goods and services to third parties. Revenue from the sale of goods and services is recognised to the extent that it is probable that the economic benefits will flow to the Group and the revenue can be reliably measured. Key classes of revenue are recognised on the following basis:
i) Rendering of servicesRevenue from advertising and sponsorship is recognised as income at the time of transmission.
ii) Government grantsGovernment grants are recognised initially as deferred income when there is reasonable assurance that they will be received and that the Group will comply with the conditions associated with the grant. Grants that compensate the Group for expenses incurred are recognised as income on a systematic basis in the same periods in which the expenses are recognised. Grants that compensate the Group for the cost of an asset are recognised as income in the income statement on a systematic basis over the useful life of the asset.
iii) Other revenueOther revenue is recognised when the product has been delivered or in the accounting period in which the actual service has been provided.
iv) InterestRevenue is recognised as interest accrues using the effective interest method.
43TVNZ ANNUAL REPORT FY2011
NOTEs TO ThE FiNANCiAL sTATEmENTs (CONTiNUEd)FOR THE YEAR ENDED 30 JUNE 2011
g) income tax expenseIncome tax expense comprises current and deferred tax. Income tax expense is recognised in the income statement except to the extent that it relates to items recognised directly in equity, in which case it is recognised in equity.
Deferred tax is recognised using the balance sheet method, providing for temporary differences between the carrying amounts of assets and liabilities for financial reporting purposes, and the amounts used for taxation purposes.
Deferred tax assets are recognised where realisation of the asset is probable.
Deferred tax is measured at the tax rates that are expected to apply when the temporary differences reverse, based on tax rates (and tax law) that have been enacted or substantively enacted at the balance sheet date.
Deferred tax assets and deferred tax liabilities are offset only if a legally enforceable right exists to set off current tax assets against current tax liabilities and the deferred tax assets and liabilities relate to the same taxable entity and the same taxation authority.
h) leasesOperating lease payments, where the lessors substantially retain all the risks and benefits of ownership of the leased items, are recognised as an expense in the income statement on a straight-line basis over the lease term.
i) DividendsProvision is made for the amount of dividend declared on or before balance date but not distributed at balance date.
j) Property, plant and equipmentItems of property, plant and equipment are stated at cost less accumulated depreciation and impairment losses. Cost includes the cost to acquire the asset and other directly attributable costs incurred to bring the asset to the location and condition for its intended use. Purchased software that is integral to the functionality of the related equipment is capitalised as part of that equipment. Items of work in progress are transferred to the appropriate class of property, plant and equipment on completion. Where parts of an item of property, plant and equipment have different useful lives, they are accounted for as separate items of property, plant and equipment.
Depreciation is calculated on a straight-line basis to allocate the cost of assets over their estimated useful lives. Land and work in progress is not depreciated.
The estimated useful lives for the current and comparable period are:
Buildings 40 years Plant and equipment 3 to 10 years Motor vehicles 5 to 10 years
ImpairmentThe carrying values of plant and equipment are reviewed for impairment when events or changes in circumstances indicate the carrying value may not be recoverable. For an asset that does not generate largely independent cash flows, the recoverable amount is determined for the cash-generating unit the asset belongs to. If any such indication exists and where the carrying values exceed the estimated recoverable amount, the assets or cash generating units are written down to their recoverable amount.
An item of property, plant and equipment is derecognised upon disposal or when no future economic benefits are expected to arise from the continued use of the asset.
Where an item of property, plant and equipment is derecognised, the gain or loss (calculated as the difference between the net proceeds and the carrying value of the item) is included in the income statement in the period the item is derecognised.
44 TVNZ ANNUAL REPORT FY2011
NOTEs TO ThE FiNANCiAL sTATEmENTs (CONTiNUEd)FOR THE YEAR ENDED 30 JUNE 2011
k) intangible assetsProgramme rightsTelevision programmes which are available for use, including those acquired overseas, are recorded at cost less amounts charged to the income statement based on management’s assessment of the useful life, which is regularly reviewed and additional write downs are made as considered necessary. Programmes produced internally for the purpose of broadcast are initially recognised as intangible assets at production cost. Production costs only include direct costs associated with the programme.
Programme rights are amortised on the following basis:
(i) Certain programme rights including news and current affairs, sports and locally commissioned programmes are amortised on transmission.
(ii) All other programme rights (movie and non movie programme rights) are amortised on a straight line basis such that all rights are amortised within a period not exceeding one year from the broadcast licence period start date.
Frequency licencesFrequency licences are recorded at cost less amortisation and impairment losses. Amortisation is calculated on a diminishing value methodology using the sum of digits over the remaining life of the licence, between one and three years.
Other intangible assetsAcquired software licences are capitalised on the basis of the costs incurred to acquire and bring to use the specific asset. These costs are amortised on a straight line basis over their estimated useful economic lives of two to ten years.
Development costsDevelopment costs on internal projects are only capitalised by the Group when it can be demonstrated that the technical feasibility of completing the intangible asset is valid so that the asset will be available for use or sale, its intention to complete and its ability to use or sell the asset, how the asset will generate future economic benefits, the availability of resources to complete the development and the ability to measure reliably the expenditure attributable to the intangible asset during its development. Any development costs capitalised are amortised over the period of the estimated economic life of the asset to which they relate.
Where an intangible asset is derecognised, the gain or loss (calculated as the difference between the net proceeds and the carrying value of the item) is included in the income statement in the period the item is derecognised.
l) Cash and cash equivalentsCash and short term deposits in the statement of financial position comprise cash at the bank and in hand and short term deposits with an original maturity of three months or less.
For the purposes of the cash flow statement, cash and cash equivalents comprise cash and cash equivalents as defined above, net of outstanding overdrafts.
m) Trade and other receivablesTrade receivables are recognised and carried at original invoice amount and subsequently measured at amortised cost, less an allowance for impairment.
Collectability of trade receivables is reviewed on an ongoing basis and debts that are known to be uncollectible are written off immediately. An allowance for impairment is recognised when there is objective evidence that the Group will not be able to collect the receivable. Financial difficulties of the debtor, default payments or debts more than 90 days overdue are considered objective evidence of impairment.
n) inventoriesInventories comprise technical stores and videotape. All inventories are recorded at the lower of cost or net realisable value.
45TVNZ ANNUAL REPORT FY2011
NOTEs TO ThE FiNANCiAL sTATEmENTs (CONTiNUEd)FOR THE YEAR ENDED 30 JUNE 2011
o) Derivative financial instrumentsThe Group uses derivative financial instruments, within predetermined policies and limits, to manage its exposure to foreign currency exchange rate risk and interest rate risk. The Group also enters into programme supply contracts that contain a foreign currency embedded derivative.
Such derivative financial instruments are initially recognised at fair value on the date a derivative contract is entered into and are subsequently remeasured at their fair value. The method of recognising the resulting gain or loss depends on whether the derivative contract is designed to hedge a specific risk and qualifies for hedge accounting.
Each derivative that is designated as a hedge is classified as either: i) a fair value hedge when they hedge the exposure to changes in the fair value of a recognised asset or liability or a firm commitment; or ii) a cash flow hedge where they hedge exposure to variability in cash flows that is either attributable to a particular risk associated with a recognised asset or liability or a forecasted transaction.
i) Fair value hedgeChanges in the fair value of derivatives that are designated and qualify as fair value hedges are recorded in the income statement, together with any changes in the fair value of the hedged asset or liability that are attributable to the hedged risk.
ii) Cash flow hedgeThe effective portion of changes in the fair value of derivatives that are designated and qualify as cash flow hedges are recognised in other comprehensive income. The gain or loss relating to the ineffective portion is recognised in the income statement. Amounts accumulated are recycled in the income statement in the period when the hedged item affects profit or loss. When the hedged firm commitment results in the recognition of an asset or a liability, then, at the time the asset or liability is recognised, the associated gains or losses that had previously been recognised in equity are included in the initial measurement of the acquisition cost or other carrying amount of the asset or liability.
Hedge accounting is discontinued when the hedging instrument expires or is sold, or when the hedge no longer meets the criteria for hedge accounting. At that point any cumulative gain or loss existing in equity remains in equity until the forecast transaction occurs. When a forecasted transaction is no longer expected to occur, the cumulative gain or loss is immediately transferred to the income statement.
For derivatives that do not qualify for hedge accounting, any gains or losses arising from changes in fair value are recognised immediately in the income statement. The fair value of forward exchange contracts and embedded derivatives are calculated by reference to current forward exchange rates for contracts with similar maturity profiles. The fair value of interest rate swap contracts is determined by reference to the current market values of similar instruments.
In accordance with its treasury policy, the Group does not engage in speculative transactions or hold derivative financial instruments for trading purposes.
p) Borrowings and borrowing costsBorrowings are initially recognised at fair value, net of transaction costs incurred. Borrowings are subsequently measured at amortised cost using the effective interest method. Borrowing costs directly attributable to the acquisition, construction or production of a qualifying asset are capitalised as part of the cost of that asset. All other borrowing costs are expensed in the period they occur.
q) Trade and other payablesTrade and other payables are carried at amortised cost and due to their short term nature they are not discounted. Trade and other payables are recognised when the Group becomes obliged to make future payments resulting from the purchases of goods and services.
r) investment in associateThe Group’s investment in its associates is accounted for using the equity method of accounting in the consolidated financial statements. Associates are entities over which the Group has significant influence, but not control, over the financial and operating policies. The consolidated financial statements include the Group’s share of the income and expenses of the associate from the date that significant influence commenced until the date that significant influence ceases. The Group’s share of its associate post acquisition profits or losses is recognised in the income statement and its share of post acquisition movements in other comprehensive income is recognised in other comprehensive income. The cumulative post acquisition movements are adjusted against the carrying amount of the investment. When the Group’s share of losses in an associate exceeds its interest in the associate, including any unsecured long-term receivables and loans, the Group does not recognise any further losses, unless it has incurred obligations or made payments on behalf of the associate.
46 TVNZ ANNUAL REPORT FY2011
NOTEs TO ThE FiNANCiAL sTATEmENTs (CONTiNUEd)FOR THE YEAR ENDED 30 JUNE 2011
s) interest in a jointly controlled entityThe interest in a joint venture entity is accounted for in the consolidated financial statements using the equity method of accounting and is carried at cost by the parent entity. Under the equity method, the Group’s share of the results of the joint venture is recognised in the income statement, and the share of movements in reserves is recognised in the statement of financial position.
t) Employee benefitsProvision is made for employee benefits accumulated as a result of employees rendering services up to balance date. The benefits include wages and salaries, incentives, compensated absences and retirement leave which are expensed in the income statement when services are provided or benefits vest with the employee. The provision for employee benefits is stated at the present value of the estimated future cash outflows to be incurred resulting from employees’ services provided up to balance date.
u) ProvisionsProvisions are recognised when the Group has present legal or constructive obligation as a result of a past event that can be estimated reliably, and it is probable that an outflow of economic benefits will be required to settle the obligation.
If the effect of time value of money is material, provisions are determined by discounting the expected future cash flows at a pre-tax rate that reflects current market assessments of the time value of money and the risks specific to the liability.
v) ComparativesThe classifications of certain balances have been revised and the comparatives have been restated accordingly.
3). Significant accounting judgements, estimates and assumptionsThe preparation of the financial statements requires management to make judgements, estimates and assumptions that affect the reported amounts in the financial statements. Estimates and assumptions are reviewed by management on an ongoing basis. Actual results may differ from these estimates.
Management has identified the following accounting policies for which significant judgements, estimates and assumptions are made:
Estimation of useful lives of property, plant and equipment and finite-lived intangible assetsThe estimated useful life of a particular asset is based on historical experience, the expected service potential of the assets and technological advances. Adjustments to useful lives are made when considered necessary.
Property, plant and equipment - impairmentThe Christchurch earthquakes of 4 September 2010 and 22 February 2011 resulted in the destruction of the buildings and plant and equipment located at the Company’s Christchurch premises on Gloucester Street. The buildings, plant and equipment destroyed in the earthquake have been disposed in the current year.
Due to the nature of the earthquake and the continuing aftershocks the assessment of the future usage of the land at Gloucester Street, and therefore value, has yet to be determined. Until the future usage of the land is determined a fair valuation of the land cannot be assessed. (Refer to note 11 for valuation details).
Income taxes and deferred taxThe Group’s accounting policy for taxation requires management to make estimates as to, amongst other things, the amount of tax that will be payable, the availability of losses to be carried forward and the recovery of deferred tax assets.
Deferred tax assets are recognised for deductible temporary differences as management considers that it is probable that future taxable profits will be available to utilise those temporary differences.
Capitalised development costsDevelopment costs are only capitalised by the Group when it can be demonstrated that the technical feasibility of completing the intangible asset is valid so that the asset will be available for use.
Actual results may differ from these estimates as a result of reassessment by management or taxation authorities.
47TVNZ ANNUAL REPORT FY2011
NOTEs TO ThE FiNANCiAL sTATEmENTs (CONTiNUEd)FOR THE YEAR ENDED 30 JUNE 2011
Group Company
2011 2010 2011 2010
$000 $000 $000 $000
4) Operating revenue
Television advertising revenue 302,723 284,275 302,723 284,275
Commercial production funding 4,748 3,939 4,748 3,939
Satellite sub lease revenue 397 400 397 400
Other trading revenue 32,548 25,055 32,548 25,055
340,416 313,669 340,416 313,669
5) ExpensesExpenses include:
Employee benefits expense
Wages and salaries and other short term benefits 91,801 90,260 91,801 90,260
Defined contribution superannuation expense 2,533 2,578 2,533 2,578
Less employee benefits charged to programmes/capitalised (30,610) (31,103) (30,610) (31,103)
63,724 61,735 63,724 61,735
Depreciation and amortisation
Depreciation 15,113 13,612 15,113 13,612
Amortisation - software 5,493 4,143 5,493 4,143
Amortisation - licences 671 815 671 815
21,277 18,570 21,277 18,570
Auditor's remuneration
Audit of financial statements 264 270 264 270
Other assurance related services 0 29 0 29
264 299 264 299
Other assurance related services in the prior year primarily relate to technology assurance activities.
Reorganisation costs
Reorganisation costs 4,719 944 4,719 944
Costs associated with the reorganisation of parts of the Company have been fully recognised in the current financial year. These costs include redundancy, outplacement, consultancy and sundry other costs associated with the reorganisation.
Rental and operating lease costs
Rental and operating lease costs 3,527 4,120 3,527 4,120
6) Programme amortisation revision
Additional programme amortisation (note 12) 0 (28,965) 0 (28,965)
Additional funding revenue - government (note 18a) 0 1,773 0 1,773
Additional funding revenue 0 343 0 343
0 (26,849) 0 (26,849)
In FY2010 the amortisation rates of programme rights were revised. Programme costs are amortised over the programme’s estimated commercial useful life. From a commercial perspective, the useful life of programmes has reduced as repeat screenings of programmes in primetime have significantly reduced, those repeat screenings are now closer to the original transmission date and there are now many alternate viewing opportunities for programmes prior and subsequent to the transmission by TVNZ.
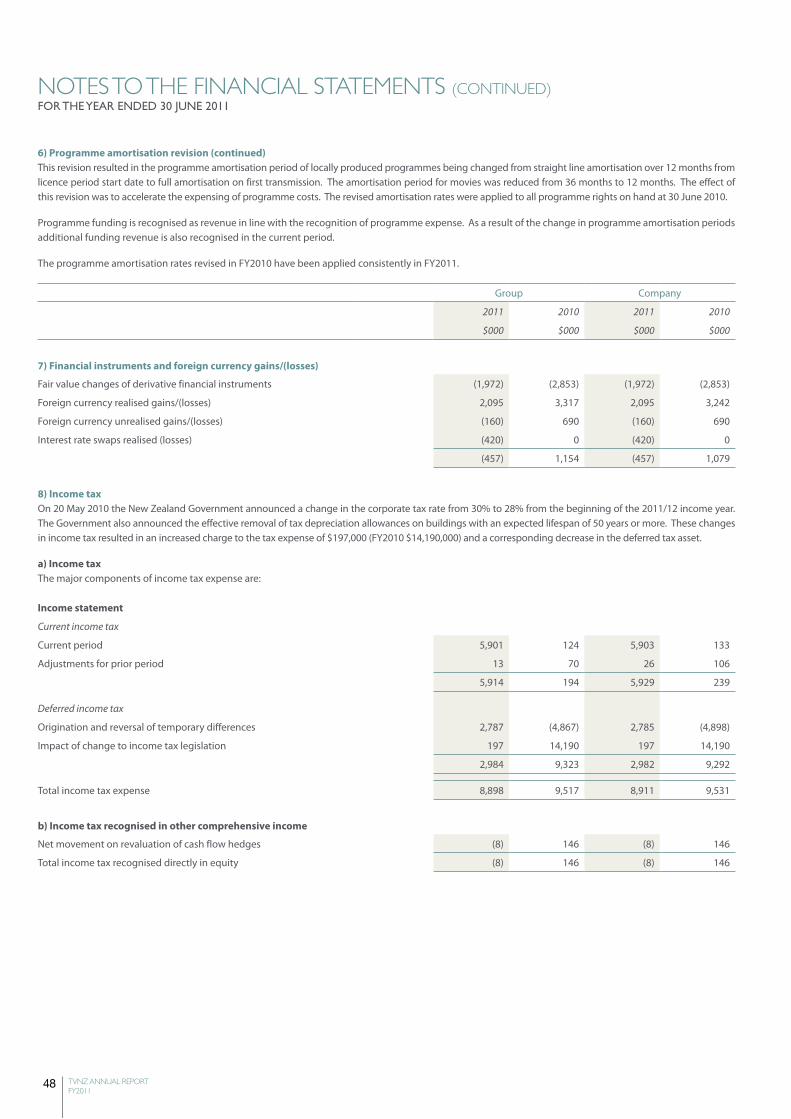
48 TVNZ ANNUAL REPORT FY2011
NOTEs TO ThE FiNANCiAL sTATEmENTs (CONTiNUEd)FOR THE YEAR ENDED 30 JUNE 2011
6) Programme amortisation revision (continued)This revision resulted in the programme amortisation period of locally produced programmes being changed from straight line amortisation over 12 months from licence period start date to full amortisation on first transmission. The amortisation period for movies was reduced from 36 months to 12 months. The effect of this revision was to accelerate the expensing of programme costs. The revised amortisation rates were applied to all programme rights on hand at 30 June 2010.
Programme funding is recognised as revenue in line with the recognition of programme expense. As a result of the change in programme amortisation periods additional funding revenue is also recognised in the current period.
The programme amortisation rates revised in FY2010 have been applied consistently in FY2011.
Group Company
2011 2010 2011 2010
$000 $000 $000 $000
7) Financial instruments and foreign currency gains/(losses)
Fair value changes of derivative financial instruments (1,972) (2,853) (1,972) (2,853)
Foreign currency realised gains/(losses) 2,095 3,317 2,095 3,242
Foreign currency unrealised gains/(losses) (160) 690 (160) 690
Interest rate swaps realised (losses) (420) 0 (420) 0
(457) 1,154 (457) 1,079
8) income taxOn 20 May 2010 the New Zealand Government announced a change in the corporate tax rate from 30% to 28% from the beginning of the 2011/12 income year. The Government also announced the effective removal of tax depreciation allowances on buildings with an expected lifespan of 50 years or more. These changes in income tax resulted in an increased charge to the tax expense of $197,000 (FY2010 $14,190,000) and a corresponding decrease in the deferred tax asset.
a) income taxThe major components of income tax expense are:
income statement
Current income tax
Current period 5,901 124 5,903 133
Adjustments for prior period 13 70 26 106
5,914 194 5,929 239
Deferred income tax
Origination and reversal of temporary differences 2,787 (4,867) 2,785 (4,898)
Impact of change to income tax legislation 197 14,190 197 14,190
2,984 9,323 2,982 9,292
Total income tax expense 8,898 9,517 8,911 9,531
b) income tax recognised in other comprehensive income
Net movement on revaluation of cash flow hedges (8) 146 (8) 146
Total income tax recognised directly in equity (8) 146 (8) 146
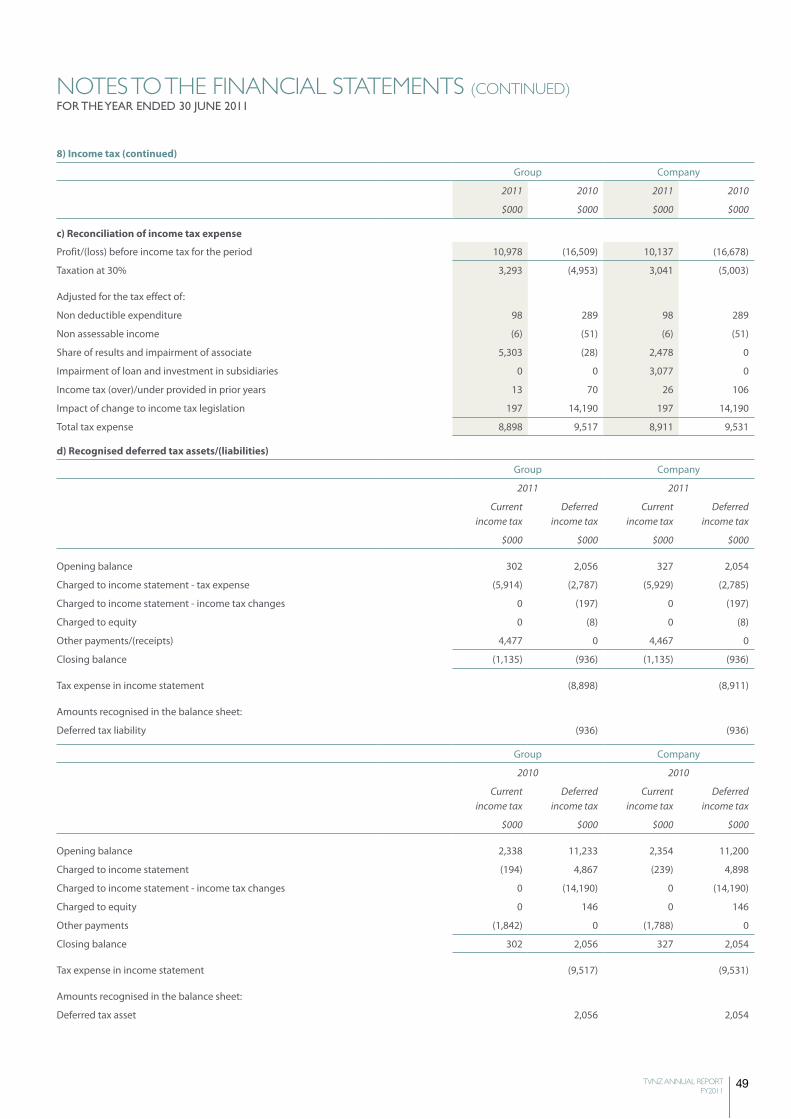
49TVNZ ANNUAL REPORT FY2011
NOTEs TO ThE FiNANCiAL sTATEmENTs (CONTiNUEd)FOR THE YEAR ENDED 30 JUNE 2011
8) income tax (continued)
Group Company
2011 2010 2011 2010
$000 $000 $000 $000
c) Reconciliation of income tax expense
Profit/(loss) before income tax for the period 10,978 (16,509) 10,137 (16,678)
Taxation at 30% 3,293 (4,953) 3,041 (5,003)
Adjusted for the tax effect of:
Non deductible expenditure 98 289 98 289
Non assessable income (6) (51) (6) (51)
Share of results and impairment of associate 5,303 (28) 2,478 0
Impairment of loan and investment in subsidiaries 0 0 3,077 0
Income tax (over)/under provided in prior years 13 70 26 106
Impact of change to income tax legislation 197 14,190 197 14,190
Total tax expense 8,898 9,517 8,911 9,531
d) Recognised deferred tax assets/(liabilities)
Group Company
2011 2011
Current income tax
Deferred income tax
Current income tax
Deferred income tax
$000 $000 $000 $000
Opening balance 302 2,056 327 2,054
Charged to income statement - tax expense (5,914) (2,787) (5,929) (2,785)
Charged to income statement - income tax changes 0 (197) 0 (197)
Charged to equity 0 (8) 0 (8)
Other payments/(receipts) 4,477 0 4,467 0
Closing balance (1,135) (936) (1,135) (936)
Tax expense in income statement (8,898) (8,911)
Amounts recognised in the balance sheet:
Deferred tax liability (936) (936)
Group Company
2010 2010
Current income tax
Deferred income tax
Current income tax
Deferred income tax
$000 $000 $000 $000
Opening balance 2,338 11,233 2,354 11,200
Charged to income statement (194) 4,867 (239) 4,898
Charged to income statement - income tax changes 0 (14,190) 0 (14,190)
Charged to equity 0 146 0 146
Other payments (1,842) 0 (1,788) 0
Closing balance 302 2,056 327 2,054
Tax expense in income statement (9,517) (9,531)
Amounts recognised in the balance sheet:
Deferred tax asset 2,056 2,054
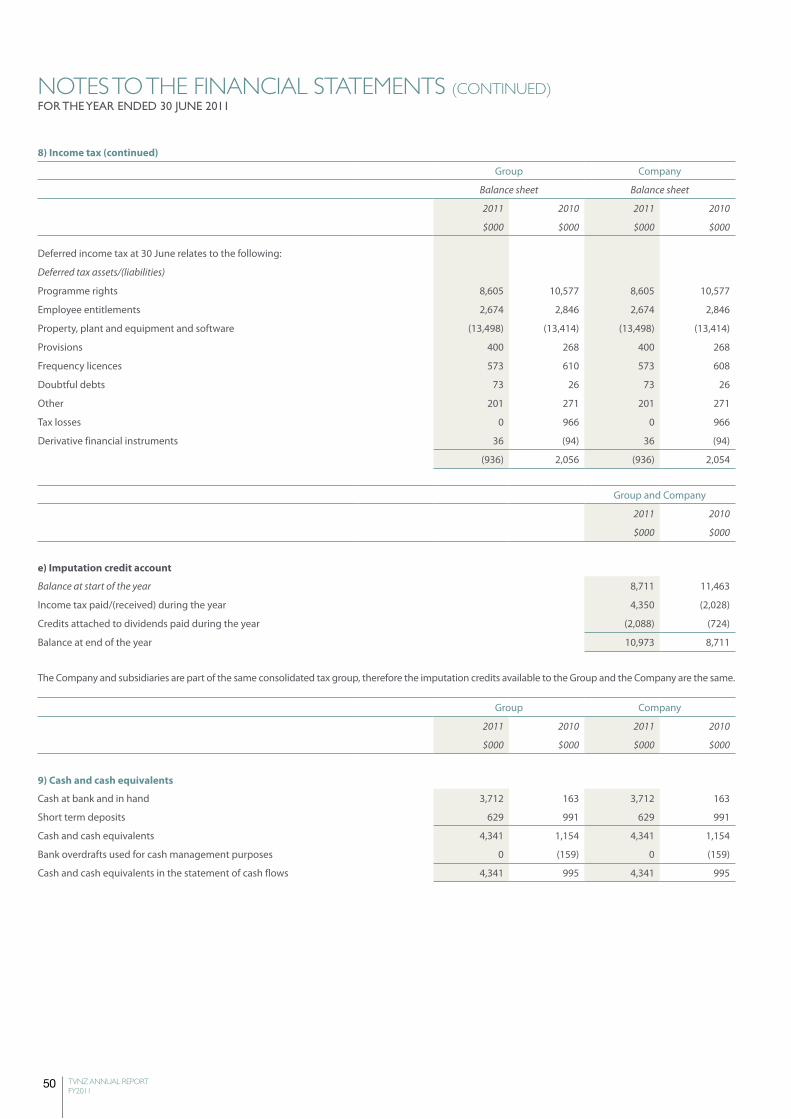
50 TVNZ ANNUAL REPORT FY2011
NOTEs TO ThE FiNANCiAL sTATEmENTs (CONTiNUEd)FOR THE YEAR ENDED 30 JUNE 2011
8) income tax (continued)
Group Company
Balance sheet Balance sheet
2011 2010 2011 2010
$000 $000 $000 $000
Deferred income tax at 30 June relates to the following:
Deferred tax assets/(liabilities)
Programme rights 8,605 10,577 8,605 10,577
Employee entitlements 2,674 2,846 2,674 2,846
Property, plant and equipment and software (13,498) (13,414) (13,498) (13,414)
Provisions 400 268 400 268
Frequency licences 573 610 573 608
Doubtful debts 73 26 73 26
Other 201 271 201 271
Tax losses 0 966 0 966
Derivative financial instruments 36 (94) 36 (94)
(936) 2,056 (936) 2,054
Group and Company
2011 2010
$000 $000
e) imputation credit account
Balance at start of the year 8,711 11,463
Income tax paid/(received) during the year 4,350 (2,028)
Credits attached to dividends paid during the year (2,088) (724)
Balance at end of the year 10,973 8,711
The Company and subsidiaries are part of the same consolidated tax group, therefore the imputation credits available to the Group and the Company are the same.
Group Company
2011 2010 2011 2010
$000 $000 $000 $000
9) Cash and cash equivalents
Cash at bank and in hand 3,712 163 3,712 163
Short term deposits 629 991 629 991
Cash and cash equivalents 4,341 1,154 4,341 1,154
Bank overdrafts used for cash management purposes 0 (159) 0 (159)
Cash and cash equivalents in the statement of cash flows 4,341 995 4,341 995
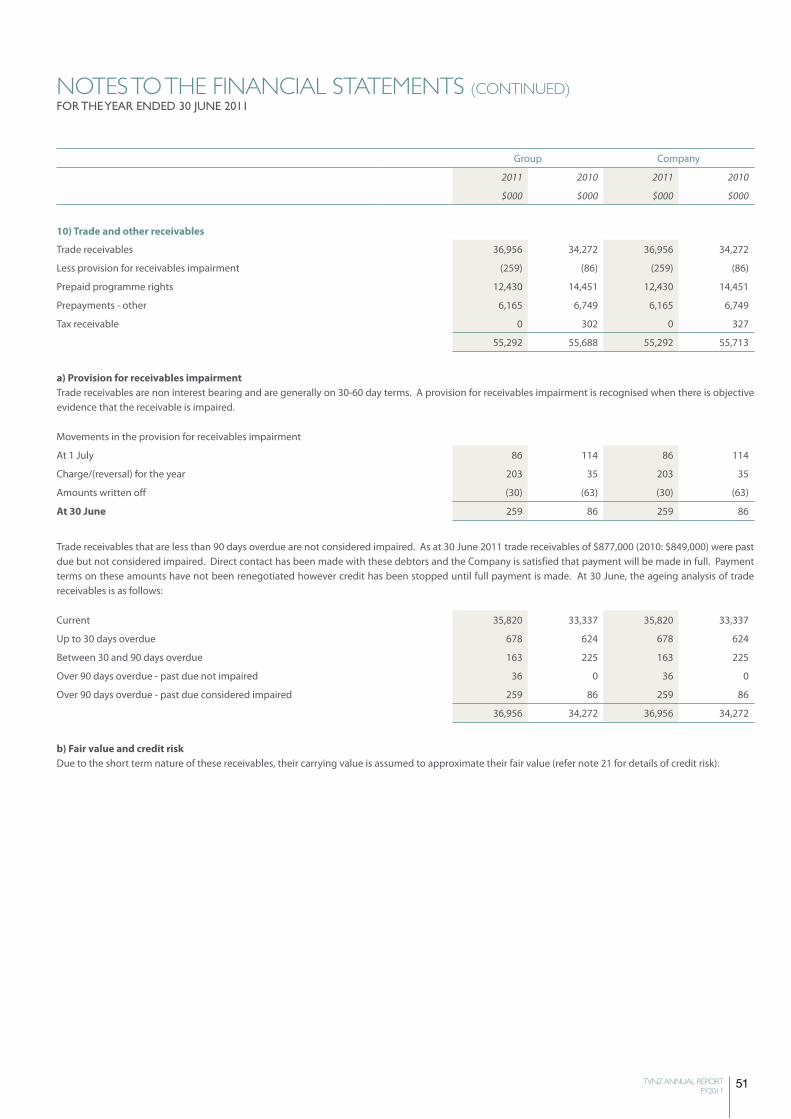
51TVNZ ANNUAL REPORT FY2011
NOTEs TO ThE FiNANCiAL sTATEmENTs (CONTiNUEd)FOR THE YEAR ENDED 30 JUNE 2011
Group Company
2011 2010 2011 2010
$000 $000 $000 $000
10) Trade and other receivables
Trade receivables 36,956 34,272 36,956 34,272
Less provision for receivables impairment (259) (86) (259) (86)
Prepaid programme rights 12,430 14,451 12,430 14,451
Prepayments - other 6,165 6,749 6,165 6,749
Tax receivable 0 302 0 327
55,292 55,688 55,292 55,713
a) Provision for receivables impairmentTrade receivables are non interest bearing and are generally on 30-60 day terms. A provision for receivables impairment is recognised when there is objective evidence that the receivable is impaired.
Movements in the provision for receivables impairment
At 1 July 86 114 86 114
Charge/(reversal) for the year 203 35 203 35
Amounts written off (30) (63) (30) (63)
At 30 June 259 86 259 86
Trade receivables that are less than 90 days overdue are not considered impaired. As at 30 June 2011 trade receivables of $877,000 (2010: $849,000) were past due but not considered impaired. Direct contact has been made with these debtors and the Company is satisfied that payment will be made in full. Payment terms on these amounts have not been renegotiated however credit has been stopped until full payment is made. At 30 June, the ageing analysis of trade receivables is as follows:
Current 35,820 33,337 35,820 33,337
Up to 30 days overdue 678 624 678 624
Between 30 and 90 days overdue 163 225 163 225
Over 90 days overdue - past due not impaired 36 0 36 0
Over 90 days overdue - past due considered impaired 259 86 259 86
36,956 34,272 36,956 34,272
b) Fair value and credit riskDue to the short term nature of these receivables, their carrying value is assumed to approximate their fair value (refer note 21 for details of credit risk).
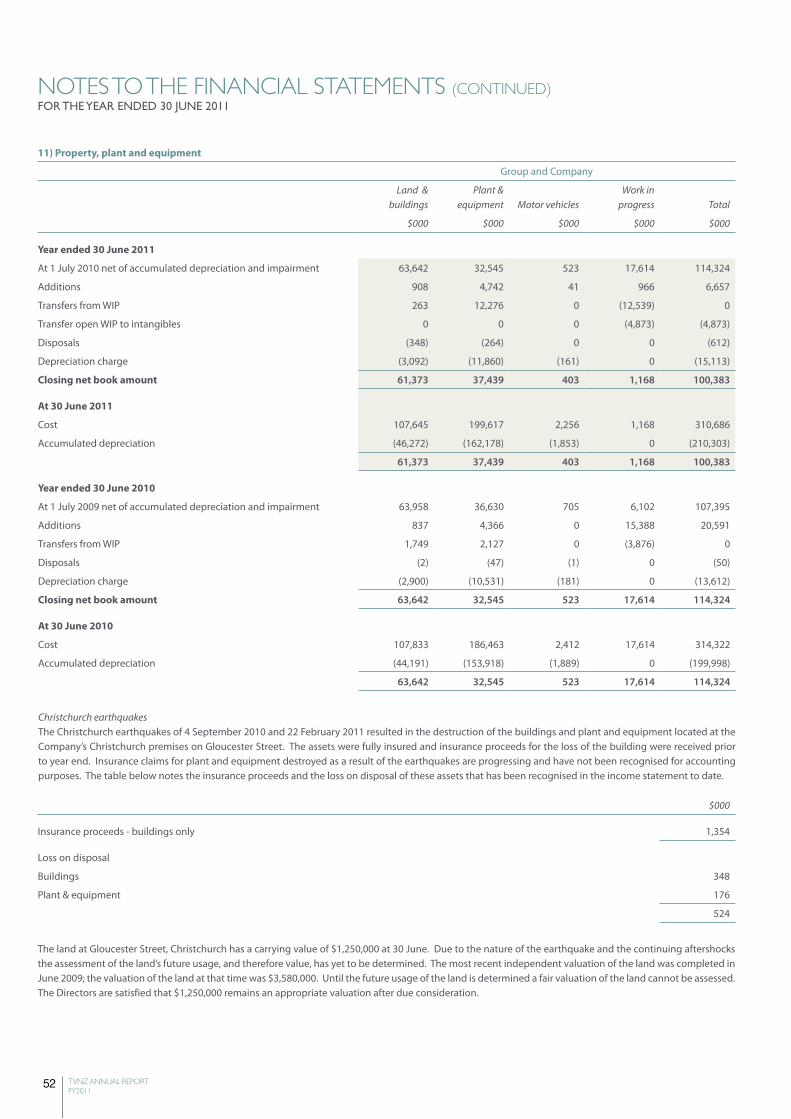
52 TVNZ ANNUAL REPORT FY2011
NOTEs TO ThE FiNANCiAL sTATEmENTs (CONTiNUEd)FOR THE YEAR ENDED 30 JUNE 2011
11) Property, plant and equipment
Group and Company
Land & buildings
Plant & equipment Motor vehicles
Work in progress Total
$000 $000 $000 $000 $000
Year ended 30 June 2011
At 1 July 2010 net of accumulated depreciation and impairment 63,642 32,545 523 17,614 114,324
Additions 908 4,742 41 966 6,657
Transfers from WIP 263 12,276 0 (12,539) 0
Transfer open WIP to intangibles 0 0 0 (4,873) (4,873)
Disposals (348) (264) 0 0 (612)
Depreciation charge (3,092) (11,860) (161) 0 (15,113)
Closing net book amount 61,373 37,439 403 1,168 100,383
At 30 June 2011
Cost 107,645 199,617 2,256 1,168 310,686
Accumulated depreciation (46,272) (162,178) (1,853) 0 (210,303)
61,373 37,439 403 1,168 100,383
Year ended 30 June 2010
At 1 July 2009 net of accumulated depreciation and impairment 63,958 36,630 705 6,102 107,395
Additions 837 4,366 0 15,388 20,591
Transfers from WIP 1,749 2,127 0 (3,876) 0
Disposals (2) (47) (1) 0 (50)
Depreciation charge (2,900) (10,531) (181) 0 (13,612)
Closing net book amount 63,642 32,545 523 17,614 114,324
At 30 June 2010
Cost 107,833 186,463 2,412 17,614 314,322
Accumulated depreciation (44,191) (153,918) (1,889) 0 (199,998)
63,642 32,545 523 17,614 114,324
Christchurch earthquakesThe Christchurch earthquakes of 4 September 2010 and 22 February 2011 resulted in the destruction of the buildings and plant and equipment located at the Company’s Christchurch premises on Gloucester Street. The assets were fully insured and insurance proceeds for the loss of the building were received prior to year end. Insurance claims for plant and equipment destroyed as a result of the earthquakes are progressing and have not been recognised for accounting purposes. The table below notes the insurance proceeds and the loss on disposal of these assets that has been recognised in the income statement to date.
$000
Insurance proceeds - buildings only 1,354
Loss on disposal
Buildings 348
Plant & equipment 176
524
The land at Gloucester Street, Christchurch has a carrying value of $1,250,000 at 30 June. Due to the nature of the earthquake and the continuing aftershocks the assessment of the land’s future usage, and therefore value, has yet to be determined. The most recent independent valuation of the land was completed in June 2009; the valuation of the land at that time was $3,580,000. Until the future usage of the land is determined a fair valuation of the land cannot be assessed. The Directors are satisfied that $1,250,000 remains an appropriate valuation after due consideration.
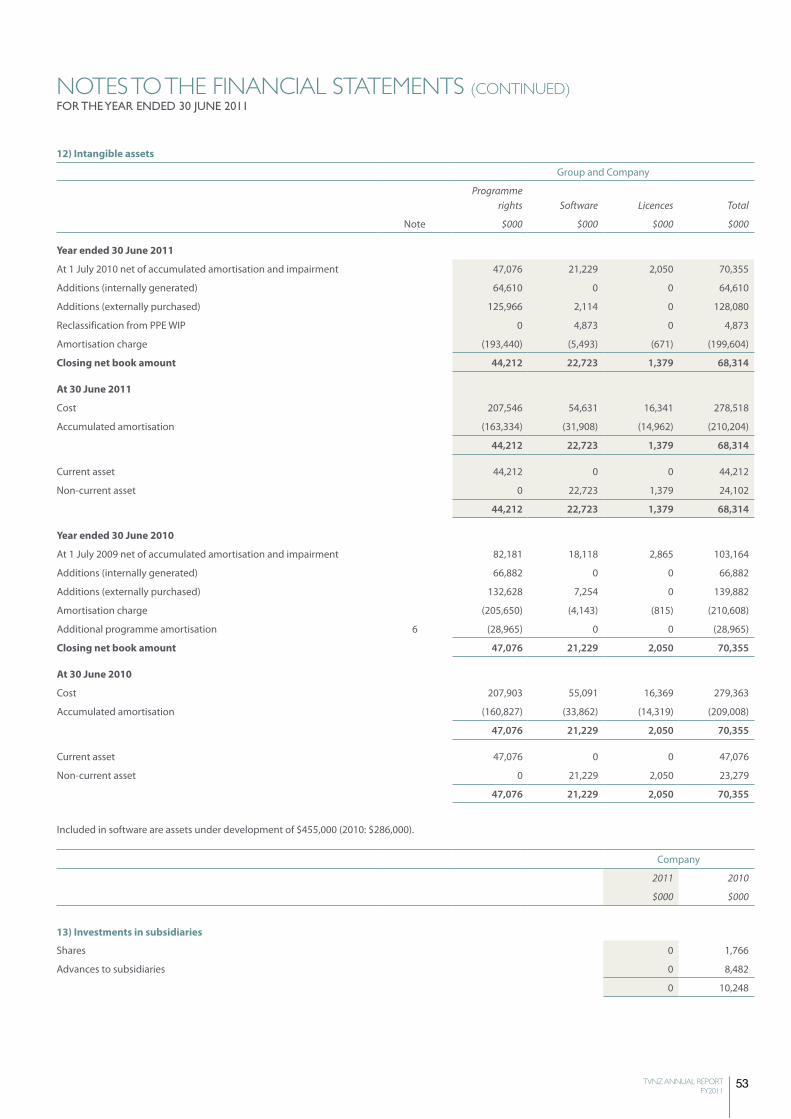
53TVNZ ANNUAL REPORT FY2011
NOTEs TO ThE FiNANCiAL sTATEmENTs (CONTiNUEd)FOR THE YEAR ENDED 30 JUNE 2011
12) intangible assets
Group and Company
Programme rights Software Licences Total
Note $000 $000 $000 $000
Year ended 30 June 2011
At 1 July 2010 net of accumulated amortisation and impairment 47,076 21,229 2,050 70,355
Additions (internally generated) 64,610 0 0 64,610
Additions (externally purchased) 125,966 2,114 0 128,080
Reclassification from PPE WIP 0 4,873 0 4,873
Amortisation charge (193,440) (5,493) (671) (199,604)
Closing net book amount 44,212 22,723 1,379 68,314
At 30 June 2011
Cost 207,546 54,631 16,341 278,518
Accumulated amortisation (163,334) (31,908) (14,962) (210,204)
44,212 22,723 1,379 68,314
Current asset 44,212 0 0 44,212
Non-current asset 0 22,723 1,379 24,102
44,212 22,723 1,379 68,314
Year ended 30 June 2010
At 1 July 2009 net of accumulated amortisation and impairment 82,181 18,118 2,865 103,164
Additions (internally generated) 66,882 0 0 66,882
Additions (externally purchased) 132,628 7,254 0 139,882
Amortisation charge (205,650) (4,143) (815) (210,608)
Additional programme amortisation 6 (28,965) 0 0 (28,965)
Closing net book amount 47,076 21,229 2,050 70,355
At 30 June 2010
Cost 207,903 55,091 16,369 279,363
Accumulated amortisation (160,827) (33,862) (14,319) (209,008)
47,076 21,229 2,050 70,355
Current asset 47,076 0 0 47,076
Non-current asset 0 21,229 2,050 23,279
47,076 21,229 2,050 70,355
Included in software are assets under development of $455,000 (2010: $286,000).
Company
2011 2010
$000 $000
13) investments in subsidiaries
Shares 0 1,766
Advances to subsidiaries 0 8,482
0 10,248
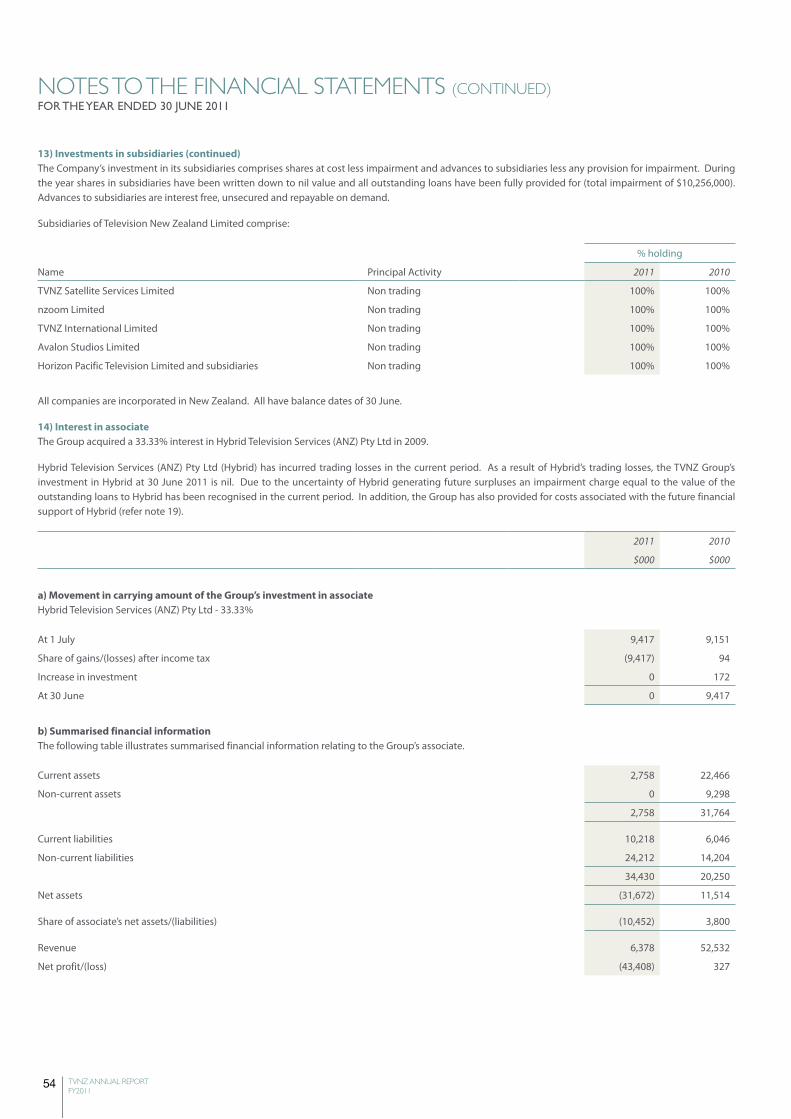
54 TVNZ ANNUAL REPORT FY2011
NOTEs TO ThE FiNANCiAL sTATEmENTs (CONTiNUEd)FOR THE YEAR ENDED 30 JUNE 2011
13) investments in subsidiaries (continued)The Company’s investment in its subsidiaries comprises shares at cost less impairment and advances to subsidiaries less any provision for impairment. During the year shares in subsidiaries have been written down to nil value and all outstanding loans have been fully provided for (total impairment of $10,256,000). Advances to subsidiaries are interest free, unsecured and repayable on demand.
Subsidiaries of Television New Zealand Limited comprise:
% holding
Name Principal Activity 2011 2010
TVNZ Satellite Services Limited Non trading 100% 100%
nzoom Limited Non trading 100% 100%
TVNZ International Limited Non trading 100% 100%
Avalon Studios Limited Non trading 100% 100%
Horizon Pacific Television Limited and subsidiaries Non trading 100% 100%
All companies are incorporated in New Zealand. All have balance dates of 30 June.
14) interest in associateThe Group acquired a 33.33% interest in Hybrid Television Services (ANZ) Pty Ltd in 2009.
Hybrid Television Services (ANZ) Pty Ltd (Hybrid) has incurred trading losses in the current period. As a result of Hybrid’s trading losses, the TVNZ Group’s investment in Hybrid at 30 June 2011 is nil. Due to the uncertainty of Hybrid generating future surpluses an impairment charge equal to the value of the outstanding loans to Hybrid has been recognised in the current period. In addition, the Group has also provided for costs associated with the future financial support of Hybrid (refer note 19).
2011 2010
$000 $000
a) movement in carrying amount of the Group’s investment in associateHybrid Television Services (ANZ) Pty Ltd - 33.33%
At 1 July 9,417 9,151
Share of gains/(losses) after income tax (9,417) 94
Increase in investment 0 172
At 30 June 0 9,417
b) Summarised financial informationThe following table illustrates summarised financial information relating to the Group’s associate.
Current assets 2,758 22,466
Non-current assets 0 9,298
2,758 31,764
Current liabilities 10,218 6,046
Non-current liabilities 24,212 14,204
34,430 20,250
Net assets (31,672) 11,514
Share of associate’s net assets/(liabilities) (10,452) 3,800
Revenue 6,378 52,532
Net profit/(loss) (43,408) 327
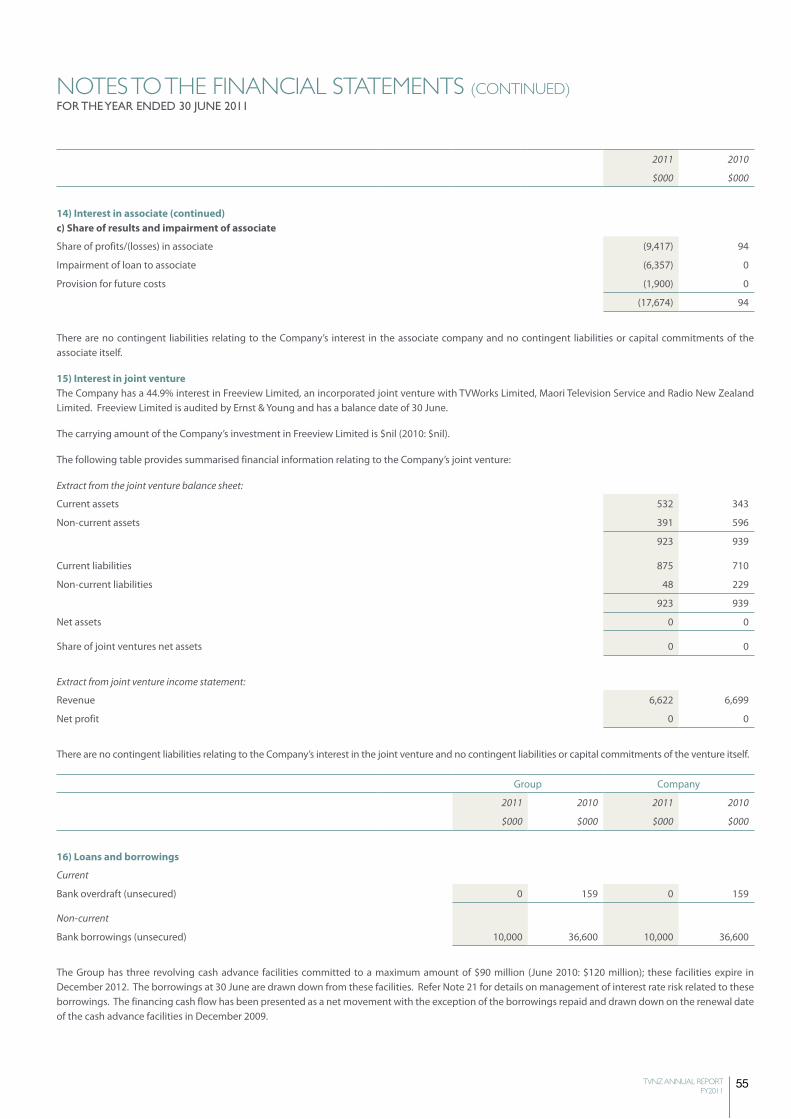
55TVNZ ANNUAL REPORT FY2011
NOTEs TO ThE FiNANCiAL sTATEmENTs (CONTiNUEd)FOR THE YEAR ENDED 30 JUNE 2011
2011 2010
$000 $000
14) interest in associate (continued) c) Share of results and impairment of associate
Share of profits/(losses) in associate (9,417) 94
Impairment of loan to associate (6,357) 0
Provision for future costs (1,900) 0
(17,674) 94
There are no contingent liabilities relating to the Company’s interest in the associate company and no contingent liabilities or capital commitments of the associate itself.
15) interest in joint ventureThe Company has a 44.9% interest in Freeview Limited, an incorporated joint venture with TVWorks Limited, Maori Television Service and Radio New Zealand Limited. Freeview Limited is audited by Ernst & Young and has a balance date of 30 June.
The carrying amount of the Company’s investment in Freeview Limited is $nil (2010: $nil).
The following table provides summarised financial information relating to the Company’s joint venture:
Extract from the joint venture balance sheet:
Current assets 532 343
Non-current assets 391 596
923 939
Current liabilities 875 710
Non-current liabilities 48 229
923 939
Net assets 0 0
Share of joint ventures net assets 0 0
Extract from joint venture income statement:
Revenue 6,622 6,699
Net profit 0 0
There are no contingent liabilities relating to the Company’s interest in the joint venture and no contingent liabilities or capital commitments of the venture itself.
Group Company
2011 2010 2011 2010
$000 $000 $000 $000
16) loans and borrowings
Current
Bank overdraft (unsecured) 0 159 0 159
Non-current
Bank borrowings (unsecured) 10,000 36,600 10,000 36,600
The Group has three revolving cash advance facilities committed to a maximum amount of $90 million (June 2010: $120 million); these facilities expire in December 2012. The borrowings at 30 June are drawn down from these facilities. Refer Note 21 for details on management of interest rate risk related to these borrowings. The financing cash flow has been presented as a net movement with the exception of the borrowings repaid and drawn down on the renewal date of the cash advance facilities in December 2009.

56 TVNZ ANNUAL REPORT FY2011
NOTEs TO ThE FiNANCiAL sTATEmENTs (CONTiNUEd)FOR THE YEAR ENDED 30 JUNE 2011
16) loans and borrowings (continued)a) Fair valuesThe carrying amounts of the Group’s current and non current borrowings approximate their fair value.
b) Defaults and breachesDuring the current and prior years, there were no defaults or breaches of any loan covenants.
Group Company
2011 2010 2011 2010
$000 $000 $000 $000
17) Trade and other payables
Current
Trade payables and accruals 39,471 36,373 39,471 36,373
Employee entitlements 7,339 7,410 7,339 7,410
Tax payable 1,135 0 1,135 0
47,945 43,783 47,945 43,783
Fair valueDue to the short term nature of these payables, their carrying value is assumed to approximate their fair value.
Non-current
Employee entitlements 1,828 1,789 1,828 1,789
18) Deferred income
Government funding 8,740 16,426 8,740 16,426
Other 410 1,406 410 1,406
9,150 17,832 9,150 17,832
a) Government funding
Group and Company
MCH NZOA TMP Total
$000 $000 $000 $000
Year ended 30 June 2011
At 1 July 2010 13,568 2,858 0 16,426
Received/invoiced during the year 14,257 8,561 5,516 28,334
Released to the income statement (20,669) (10,090) (5,261) (36,020)
Closing net book amount 7,156 1,329 255 8,740
Year ended 30 June 2010
At 1 July 2009 19,366 7,116 0 26,482
Received/invoiced during the year 19,757 8,129 5,291 33,177
Released to the income statement (25,135) (11,034) (5,291) (41,460)
Programme utilisation change additional release (note 6) (420) (1,353) 0 (1,773)
Closing net book amount 13,568 2,858 0 16,426
Government funding received during the year was in the form of cash, and has been recorded at fair value. The Ministry for Culture and Heritage (MCH) provides funding to TVNZ to provide transmission of TVNZ programmes to Pacific nations, maintain non commercial transmission sites and fund TVNZ 6 (to 28 February 2011) and TVNZ 7 digital channels broadcast on the Freeview platform. New Zealand On Air (NZOA) funds TVNZ for specific programmes, programme captioning and audio description. Te Mangai Paho provides funding for the production and broadcast of specific programmes. The funding will be recognised in the income statement to match the expenditure associated with this funding. For further details of government funding please refer to the Statement of Service Performance.
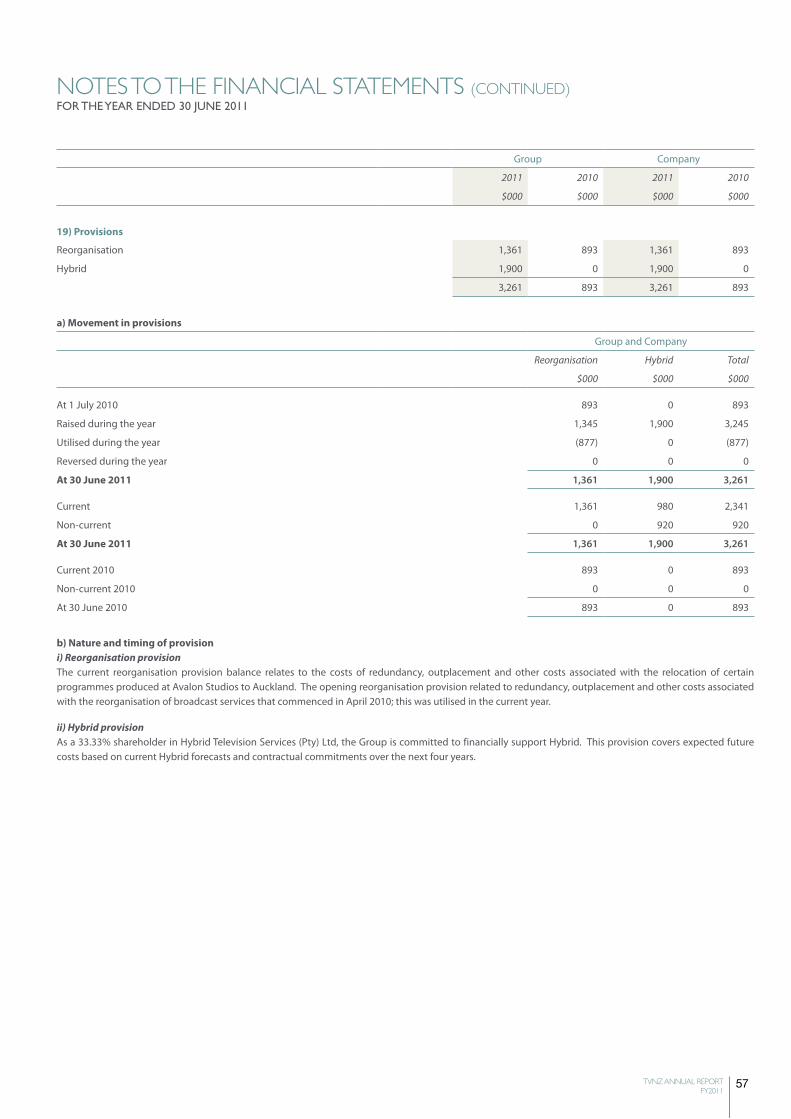
57TVNZ ANNUAL REPORT FY2011
NOTEs TO ThE FiNANCiAL sTATEmENTs (CONTiNUEd)FOR THE YEAR ENDED 30 JUNE 2011
Group Company
2011 2010 2011 2010
$000 $000 $000 $000
19) Provisions
Reorganisation 1,361 893 1,361 893
Hybrid 1,900 0 1,900 0
3,261 893 3,261 893
a) movement in provisions
Group and Company
Reorganisation Hybrid Total
$000 $000 $000
At 1 July 2010 893 0 893
Raised during the year 1,345 1,900 3,245
Utilised during the year (877) 0 (877)
Reversed during the year 0 0 0
At 30 June 2011 1,361 1,900 3,261
Current 1,361 980 2,341
Non-current 0 920 920
At 30 June 2011 1,361 1,900 3,261
Current 2010 893 0 893
Non-current 2010 0 0 0
At 30 June 2010 893 0 893
b) Nature and timing of provisioni) Reorganisation provisionThe current reorganisation provision balance relates to the costs of redundancy, outplacement and other costs associated with the relocation of certain programmes produced at Avalon Studios to Auckland. The opening reorganisation provision related to redundancy, outplacement and other costs associated with the reorganisation of broadcast services that commenced in April 2010; this was utilised in the current year.
ii) Hybrid provisionAs a 33.33% shareholder in Hybrid Television Services (Pty) Ltd, the Group is committed to financially support Hybrid. This provision covers expected future costs based on current Hybrid forecasts and contractual commitments over the next four years.
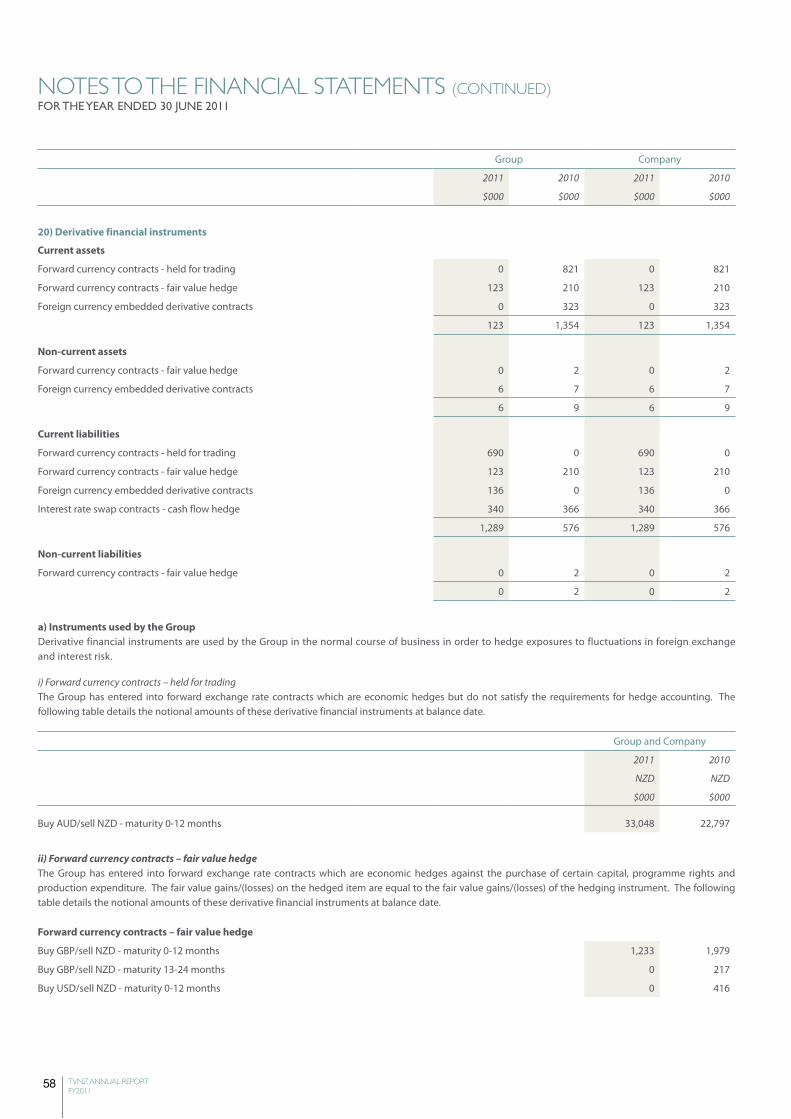
58 TVNZ ANNUAL REPORT FY2011
NOTEs TO ThE FiNANCiAL sTATEmENTs (CONTiNUEd)FOR THE YEAR ENDED 30 JUNE 2011
Group Company
2011 2010 2011 2010
$000 $000 $000 $000
20) Derivative financial instruments
Current assets
Forward currency contracts - held for trading 0 821 0 821
Forward currency contracts - fair value hedge 123 210 123 210
Foreign currency embedded derivative contracts 0 323 0 323
123 1,354 123 1,354
Non-current assets
Forward currency contracts - fair value hedge 0 2 0 2
Foreign currency embedded derivative contracts 6 7 6 7
6 9 6 9
Current liabilities
Forward currency contracts - held for trading 690 0 690 0
Forward currency contracts - fair value hedge 123 210 123 210
Foreign currency embedded derivative contracts 136 0 136 0
Interest rate swap contracts - cash flow hedge 340 366 340 366
1,289 576 1,289 576
Non-current liabilities
Forward currency contracts - fair value hedge 0 2 0 2
0 2 0 2
a) instruments used by the GroupDerivative financial instruments are used by the Group in the normal course of business in order to hedge exposures to fluctuations in foreign exchange and interest risk.
i) Forward currency contracts – held for tradingThe Group has entered into forward exchange rate contracts which are economic hedges but do not satisfy the requirements for hedge accounting. The following table details the notional amounts of these derivative financial instruments at balance date.
Group and Company
2011 2010
NZD NZD
$000 $000
Buy AUD/sell NZD - maturity 0-12 months 33,048 22,797
ii) Forward currency contracts – fair value hedgeThe Group has entered into forward exchange rate contracts which are economic hedges against the purchase of certain capital, programme rights and production expenditure. The fair value gains/(losses) on the hedged item are equal to the fair value gains/(losses) of the hedging instrument. The following table details the notional amounts of these derivative financial instruments at balance date.
Forward currency contracts – fair value hedge
Buy GBP/sell NZD - maturity 0-12 months 1,233 1,979
Buy GBP/sell NZD - maturity 13-24 months 0 217
Buy USD/sell NZD - maturity 0-12 months 0 416
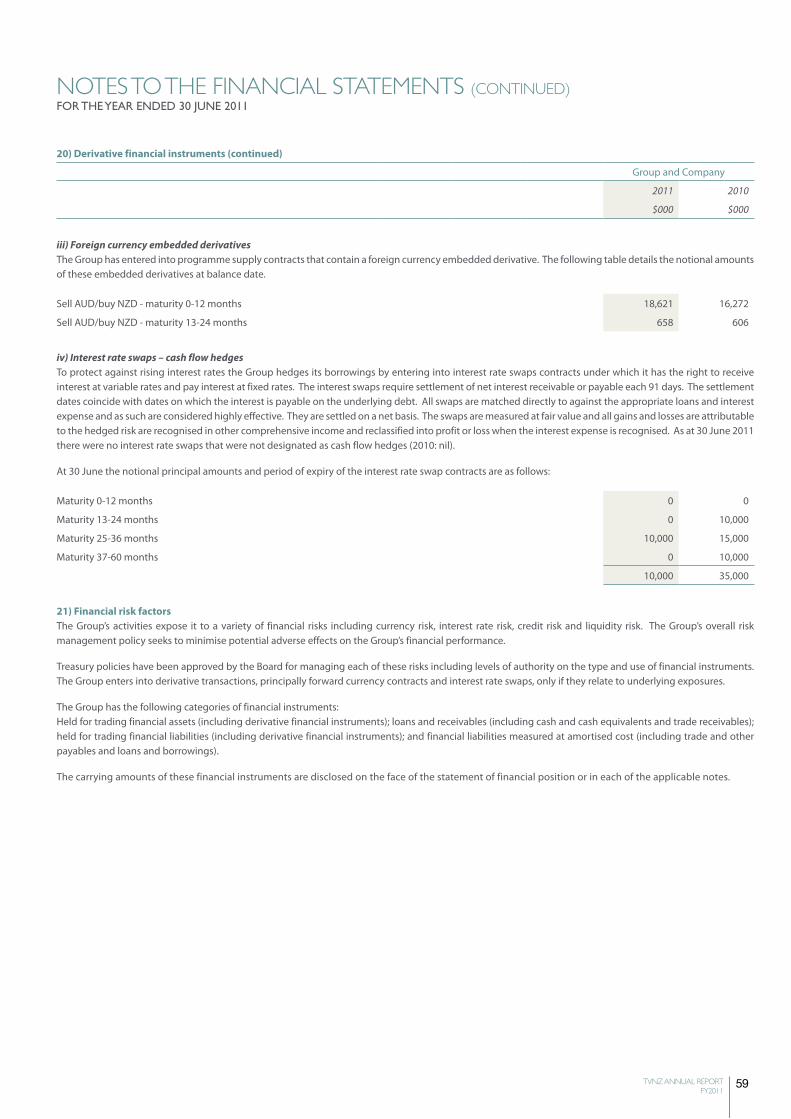
59TVNZ ANNUAL REPORT FY2011
NOTEs TO ThE FiNANCiAL sTATEmENTs (CONTiNUEd)FOR THE YEAR ENDED 30 JUNE 2011
20) Derivative financial instruments (continued)
Group and Company
2011 2010
$000 $000
iii) Foreign currency embedded derivativesThe Group has entered into programme supply contracts that contain a foreign currency embedded derivative. The following table details the notional amounts of these embedded derivatives at balance date.
Sell AUD/buy NZD - maturity 0-12 months 18,621 16,272
Sell AUD/buy NZD - maturity 13-24 months 658 606
iv) Interest rate swaps – cash flow hedgesTo protect against rising interest rates the Group hedges its borrowings by entering into interest rate swaps contracts under which it has the right to receive interest at variable rates and pay interest at fixed rates. The interest swaps require settlement of net interest receivable or payable each 91 days. The settlement dates coincide with dates on which the interest is payable on the underlying debt. All swaps are matched directly to against the appropriate loans and interest expense and as such are considered highly effective. They are settled on a net basis. The swaps are measured at fair value and all gains and losses are attributable to the hedged risk are recognised in other comprehensive income and reclassified into profit or loss when the interest expense is recognised. As at 30 June 2011 there were no interest rate swaps that were not designated as cash flow hedges (2010: nil).
At 30 June the notional principal amounts and period of expiry of the interest rate swap contracts are as follows:
Maturity 0-12 months 0 0
Maturity 13-24 months 0 10,000
Maturity 25-36 months 10,000 15,000
Maturity 37-60 months 0 10,000
10,000 35,000
21) Financial risk factorsThe Group’s activities expose it to a variety of financial risks including currency risk, interest rate risk, credit risk and liquidity risk. The Group’s overall risk management policy seeks to minimise potential adverse effects on the Group’s financial performance.
Treasury policies have been approved by the Board for managing each of these risks including levels of authority on the type and use of financial instruments. The Group enters into derivative transactions, principally forward currency contracts and interest rate swaps, only if they relate to underlying exposures.
The Group has the following categories of financial instruments:Held for trading financial assets (including derivative financial instruments); loans and receivables (including cash and cash equivalents and trade receivables); held for trading financial liabilities (including derivative financial instruments); and financial liabilities measured at amortised cost (including trade and other payables and loans and borrowings).
The carrying amounts of these financial instruments are disclosed on the face of the statement of financial position or in each of the applicable notes.
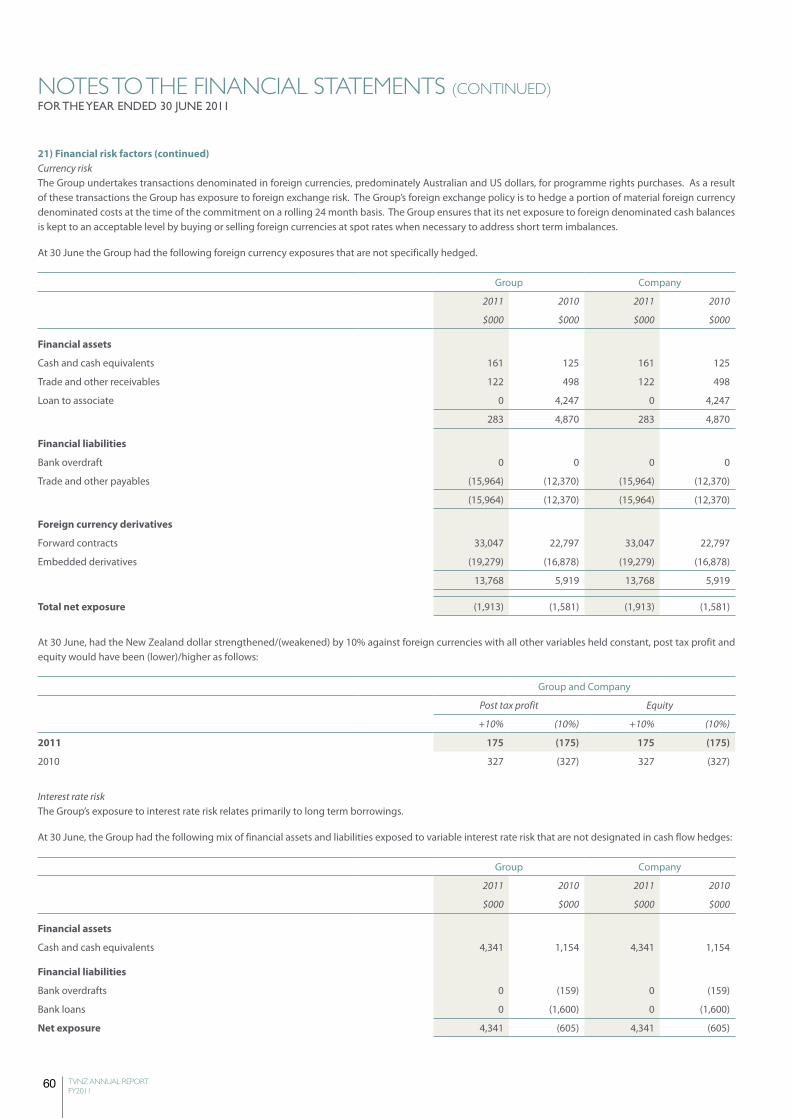
60 TVNZ ANNUAL REPORT FY2011
NOTEs TO ThE FiNANCiAL sTATEmENTs (CONTiNUEd)FOR THE YEAR ENDED 30 JUNE 2011
21) Financial risk factors (continued)Currency riskThe Group undertakes transactions denominated in foreign currencies, predominately Australian and US dollars, for programme rights purchases. As a result of these transactions the Group has exposure to foreign exchange risk. The Group’s foreign exchange policy is to hedge a portion of material foreign currency denominated costs at the time of the commitment on a rolling 24 month basis. The Group ensures that its net exposure to foreign denominated cash balances is kept to an acceptable level by buying or selling foreign currencies at spot rates when necessary to address short term imbalances.
At 30 June the Group had the following foreign currency exposures that are not specifically hedged.
Group Company
2011 2010 2011 2010
$000 $000 $000 $000
Financial assets
Cash and cash equivalents 161 125 161 125
Trade and other receivables 122 498 122 498
Loan to associate 0 4,247 0 4,247
283 4,870 283 4,870
Financial liabilities
Bank overdraft 0 0 0 0
Trade and other payables (15,964) (12,370) (15,964) (12,370)
(15,964) (12,370) (15,964) (12,370)
Foreign currency derivatives
Forward contracts 33,047 22,797 33,047 22,797
Embedded derivatives (19,279) (16,878) (19,279) (16,878)
13,768 5,919 13,768 5,919
Total net exposure (1,913) (1,581) (1,913) (1,581)
At 30 June, had the New Zealand dollar strengthened/(weakened) by 10% against foreign currencies with all other variables held constant, post tax profit and equity would have been (lower)/higher as follows:
Group and Company
Post tax profit Equity
+10% (10%) +10% (10%)
2011 175 (175) 175 (175)
2010 327 (327) 327 (327)
Interest rate riskThe Group’s exposure to interest rate risk relates primarily to long term borrowings.
At 30 June, the Group had the following mix of financial assets and liabilities exposed to variable interest rate risk that are not designated in cash flow hedges:
Group Company
2011 2010 2011 2010
$000 $000 $000 $000
Financial assets
Cash and cash equivalents 4,341 1,154 4,341 1,154
Financial liabilities
Bank overdrafts 0 (159) 0 (159)
Bank loans 0 (1,600) 0 (1,600)
Net exposure 4,341 (605) 4,341 (605)
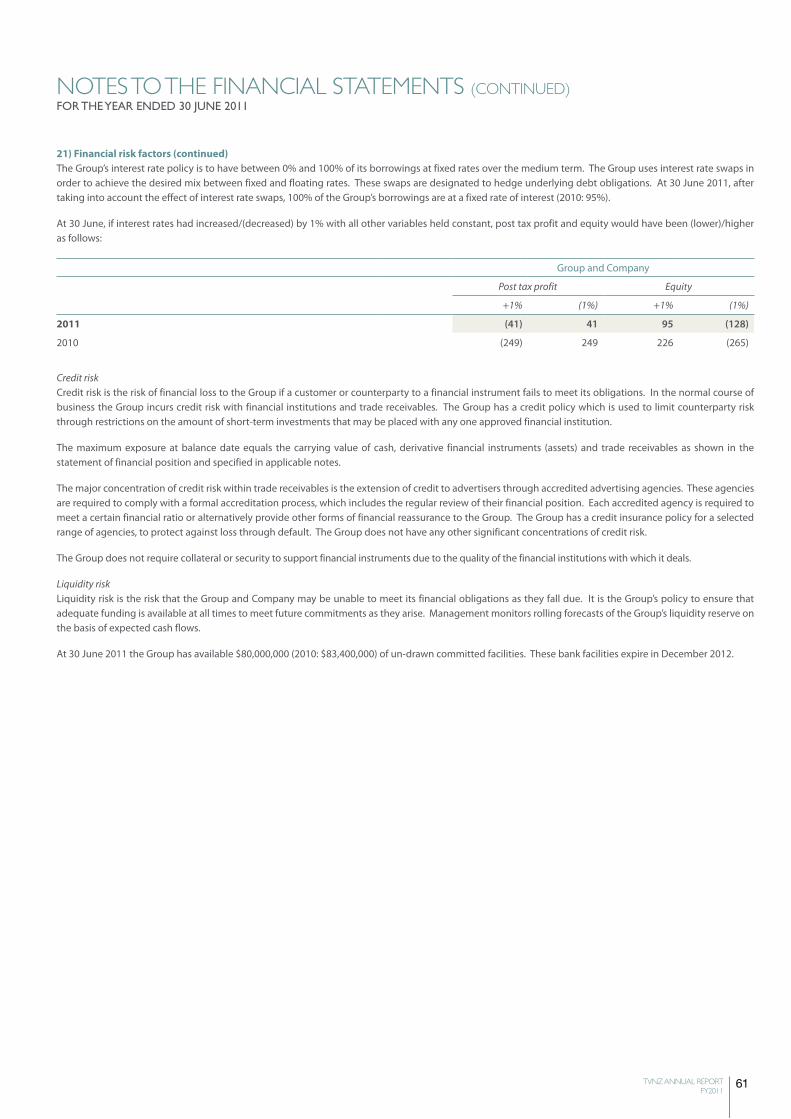
61TVNZ ANNUAL REPORT FY2011
NOTEs TO ThE FiNANCiAL sTATEmENTs (CONTiNUEd)FOR THE YEAR ENDED 30 JUNE 2011
21) Financial risk factors (continued)The Group’s interest rate policy is to have between 0% and 100% of its borrowings at fixed rates over the medium term. The Group uses interest rate swaps in order to achieve the desired mix between fixed and floating rates. These swaps are designated to hedge underlying debt obligations. At 30 June 2011, after taking into account the effect of interest rate swaps, 100% of the Group’s borrowings are at a fixed rate of interest (2010: 95%).
At 30 June, if interest rates had increased/(decreased) by 1% with all other variables held constant, post tax profit and equity would have been (lower)/higher as follows:
Group and Company
Post tax profit Equity
+1% (1%) +1% (1%)
2011 (41) 41 95 (128)
2010 (249) 249 226 (265)
Credit riskCredit risk is the risk of financial loss to the Group if a customer or counterparty to a financial instrument fails to meet its obligations. In the normal course of business the Group incurs credit risk with financial institutions and trade receivables. The Group has a credit policy which is used to limit counterparty risk through restrictions on the amount of short-term investments that may be placed with any one approved financial institution.
The maximum exposure at balance date equals the carrying value of cash, derivative financial instruments (assets) and trade receivables as shown in the statement of financial position and specified in applicable notes.
The major concentration of credit risk within trade receivables is the extension of credit to advertisers through accredited advertising agencies. These agencies are required to comply with a formal accreditation process, which includes the regular review of their financial position. Each accredited agency is required to meet a certain financial ratio or alternatively provide other forms of financial reassurance to the Group. The Group has a credit insurance policy for a selected range of agencies, to protect against loss through default. The Group does not have any other significant concentrations of credit risk.
The Group does not require collateral or security to support financial instruments due to the quality of the financial institutions with which it deals.
Liquidity riskLiquidity risk is the risk that the Group and Company may be unable to meet its financial obligations as they fall due. It is the Group’s policy to ensure that adequate funding is available at all times to meet future commitments as they arise. Management monitors rolling forecasts of the Group’s liquidity reserve on the basis of expected cash flows.
At 30 June 2011 the Group has available $80,000,000 (2010: $83,400,000) of un-drawn committed facilities. These bank facilities expire in December 2012.
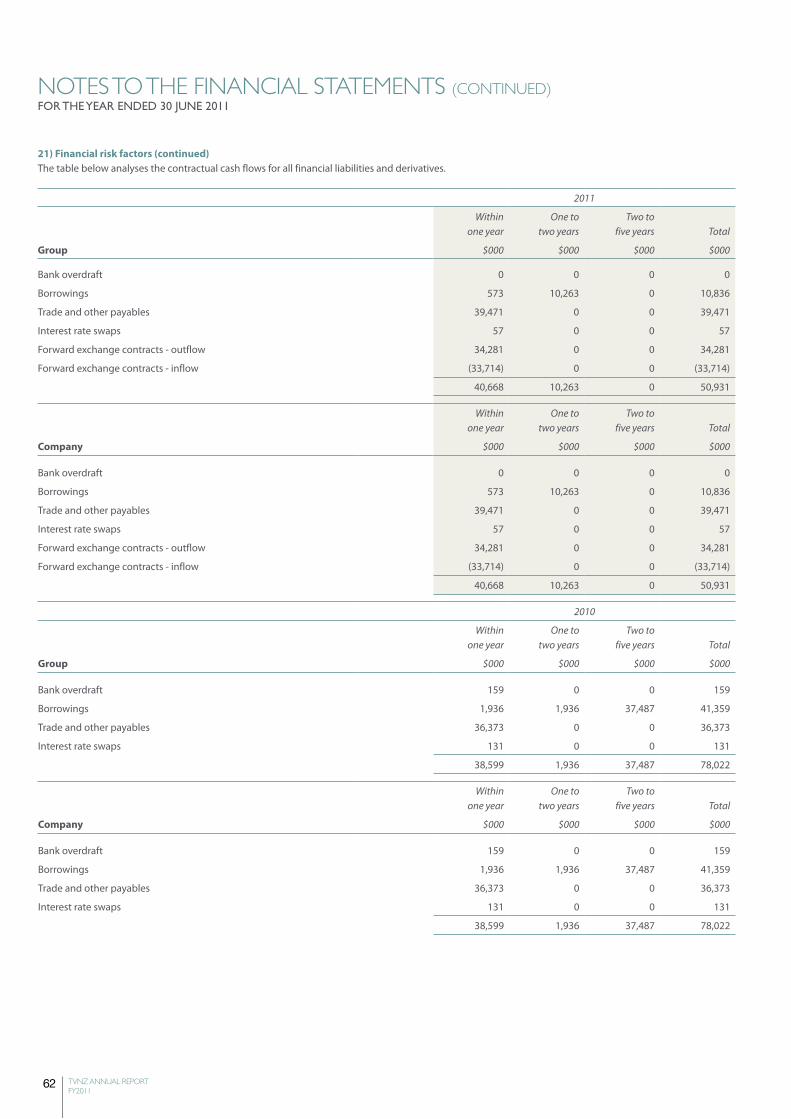
62 TVNZ ANNUAL REPORT FY2011
NOTEs TO ThE FiNANCiAL sTATEmENTs (CONTiNUEd)FOR THE YEAR ENDED 30 JUNE 2011
21) Financial risk factors (continued)The table below analyses the contractual cash flows for all financial liabilities and derivatives.
2011
Within one year
One to two years
Two to five years Total
Group $000 $000 $000 $000
Bank overdraft 0 0 0 0
Borrowings 573 10,263 0 10,836
Trade and other payables 39,471 0 0 39,471
Interest rate swaps 57 0 0 57
Forward exchange contracts - outflow 34,281 0 0 34,281
Forward exchange contracts - inflow (33,714) 0 0 (33,714)
40,668 10,263 0 50,931
Within one year
One to two years
Two to five years Total
Company $000 $000 $000 $000
Bank overdraft 0 0 0 0
Borrowings 573 10,263 0 10,836
Trade and other payables 39,471 0 0 39,471
Interest rate swaps 57 0 0 57
Forward exchange contracts - outflow 34,281 0 0 34,281
Forward exchange contracts - inflow (33,714) 0 0 (33,714)
40,668 10,263 0 50,931
2010
Within one year
One to two years
Two to five years Total
Group $000 $000 $000 $000
Bank overdraft 159 0 0 159
Borrowings 1,936 1,936 37,487 41,359
Trade and other payables 36,373 0 0 36,373
Interest rate swaps 131 0 0 131
38,599 1,936 37,487 78,022
Within one year
One to two years
Two to five years Total
Company $000 $000 $000 $000
Bank overdraft 159 0 0 159
Borrowings 1,936 1,936 37,487 41,359
Trade and other payables 36,373 0 0 36,373
Interest rate swaps 131 0 0 131
38,599 1,936 37,487 78,022
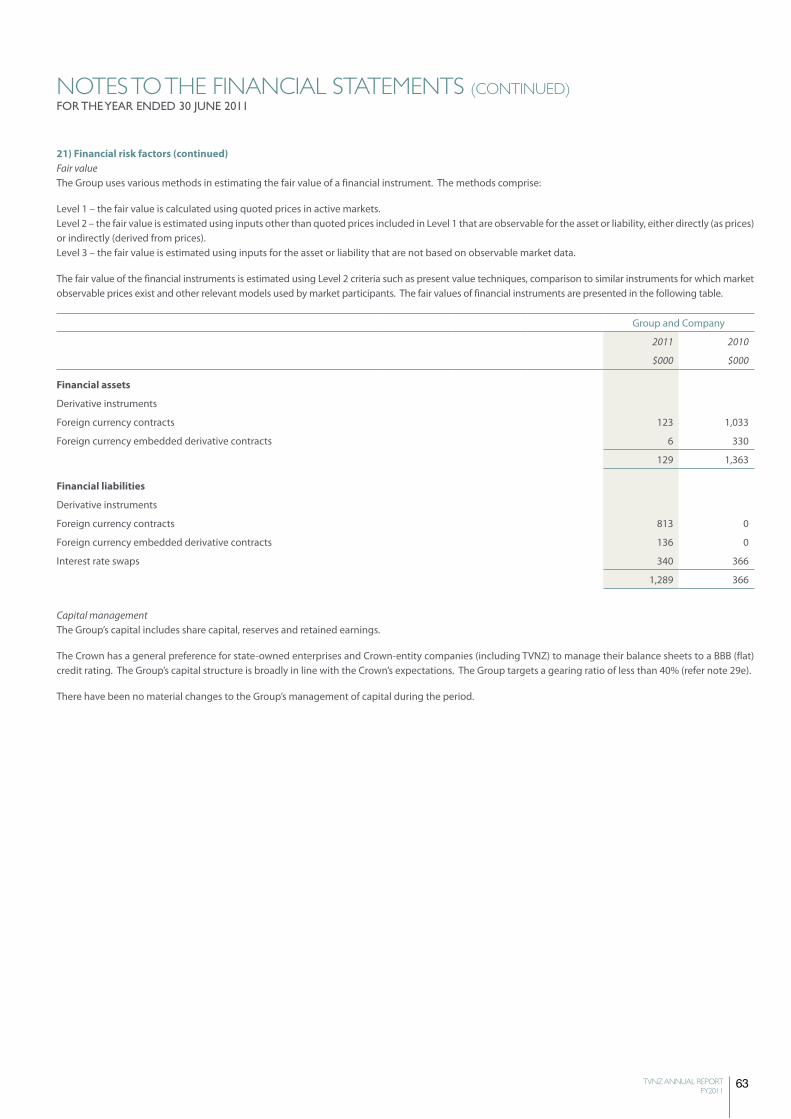
63TVNZ ANNUAL REPORT FY2011
NOTEs TO ThE FiNANCiAL sTATEmENTs (CONTiNUEd)FOR THE YEAR ENDED 30 JUNE 2011
21) Financial risk factors (continued)Fair valueThe Group uses various methods in estimating the fair value of a financial instrument. The methods comprise:
Level 1 – the fair value is calculated using quoted prices in active markets.Level 2 – the fair value is estimated using inputs other than quoted prices included in Level 1 that are observable for the asset or liability, either directly (as prices) or indirectly (derived from prices).Level 3 – the fair value is estimated using inputs for the asset or liability that are not based on observable market data.
The fair value of the financial instruments is estimated using Level 2 criteria such as present value techniques, comparison to similar instruments for which market observable prices exist and other relevant models used by market participants. The fair values of financial instruments are presented in the following table.
Group and Company
2011 2010
$000 $000
Financial assets
Derivative instruments
Foreign currency contracts 123 1,033
Foreign currency embedded derivative contracts 6 330
129 1,363
Financial liabilities
Derivative instruments
Foreign currency contracts 813 0
Foreign currency embedded derivative contracts 136 0
Interest rate swaps 340 366
1,289 366
Capital managementThe Group’s capital includes share capital, reserves and retained earnings.
The Crown has a general preference for state-owned enterprises and Crown-entity companies (including TVNZ) to manage their balance sheets to a BBB (flat) credit rating. The Group’s capital structure is broadly in line with the Crown’s expectations. The Group targets a gearing ratio of less than 40% (refer note 29e).
There have been no material changes to the Group’s management of capital during the period.
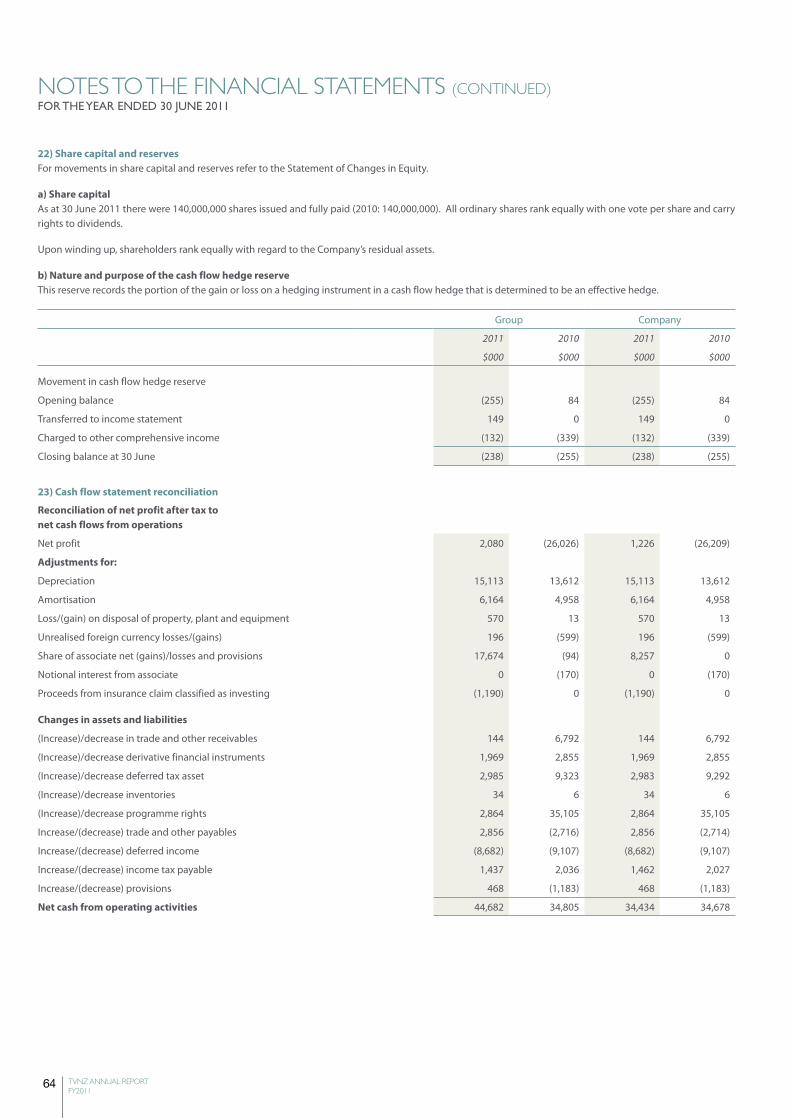
64 TVNZ ANNUAL REPORT FY2011
NOTEs TO ThE FiNANCiAL sTATEmENTs (CONTiNUEd)FOR THE YEAR ENDED 30 JUNE 2011
22) Share capital and reservesFor movements in share capital and reserves refer to the Statement of Changes in Equity.
a) Share capitalAs at 30 June 2011 there were 140,000,000 shares issued and fully paid (2010: 140,000,000). All ordinary shares rank equally with one vote per share and carry rights to dividends.
Upon winding up, shareholders rank equally with regard to the Company’s residual assets.
b) Nature and purpose of the cash flow hedge reserveThis reserve records the portion of the gain or loss on a hedging instrument in a cash flow hedge that is determined to be an effective hedge.
Group Company
2011 2010 2011 2010
$000 $000 $000 $000
Movement in cash flow hedge reserve
Opening balance (255) 84 (255) 84
Transferred to income statement 149 0 149 0
Charged to other comprehensive income (132) (339) (132) (339)
Closing balance at 30 June (238) (255) (238) (255)
23) Cash flow statement reconciliation
Reconciliation of net profit after tax to net cash flows from operations
Net profit 2,080 (26,026) 1,226 (26,209)
Adjustments for:
Depreciation 15,113 13,612 15,113 13,612
Amortisation 6,164 4,958 6,164 4,958
Loss/(gain) on disposal of property, plant and equipment 570 13 570 13
Unrealised foreign currency losses/(gains) 196 (599) 196 (599)
Share of associate net (gains)/losses and provisions 17,674 (94) 8,257 0
Notional interest from associate 0 (170) 0 (170)
Proceeds from insurance claim classified as investing (1,190) 0 (1,190) 0
Changes in assets and liabilities
(Increase)/decrease in trade and other receivables 144 6,792 144 6,792
(Increase)/decrease derivative financial instruments 1,969 2,855 1,969 2,855
(Increase)/decrease deferred tax asset 2,985 9,323 2,983 9,292
(Increase)/decrease inventories 34 6 34 6
(Increase)/decrease programme rights 2,864 35,105 2,864 35,105
Increase/(decrease) trade and other payables 2,856 (2,716) 2,856 (2,714)
Increase/(decrease) deferred income (8,682) (9,107) (8,682) (9,107)
Increase/(decrease) income tax payable 1,437 2,036 1,462 2,027
Increase/(decrease) provisions 468 (1,183) 468 (1,183)
Net cash from operating activities 44,682 34,805 34,434 34,678
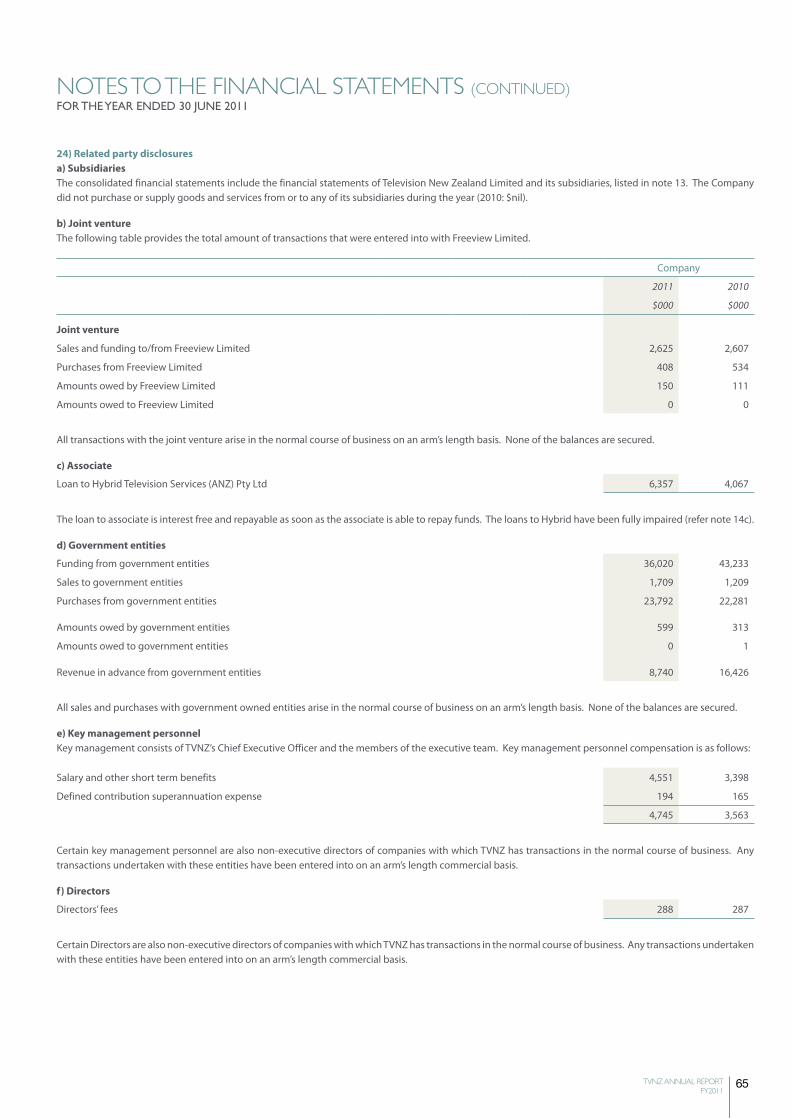
65TVNZ ANNUAL REPORT FY2011
NOTEs TO ThE FiNANCiAL sTATEmENTs (CONTiNUEd)FOR THE YEAR ENDED 30 JUNE 2011
24) Related party disclosuresa) SubsidiariesThe consolidated financial statements include the financial statements of Television New Zealand Limited and its subsidiaries, listed in note 13. The Company did not purchase or supply goods and services from or to any of its subsidiaries during the year (2010: $nil).
b) Joint ventureThe following table provides the total amount of transactions that were entered into with Freeview Limited.
Company
2011 2010
$000 $000
Joint venture
Sales and funding to/from Freeview Limited 2,625 2,607
Purchases from Freeview Limited 408 534
Amounts owed by Freeview Limited 150 111
Amounts owed to Freeview Limited 0 0
All transactions with the joint venture arise in the normal course of business on an arm’s length basis. None of the balances are secured.
c) Associate
Loan to Hybrid Television Services (ANZ) Pty Ltd 6,357 4,067
The loan to associate is interest free and repayable as soon as the associate is able to repay funds. The loans to Hybrid have been fully impaired (refer note 14c).
d) Government entities
Funding from government entities 36,020 43,233
Sales to government entities 1,709 1,209
Purchases from government entities 23,792 22,281
Amounts owed by government entities 599 313
Amounts owed to government entities 0 1
Revenue in advance from government entities 8,740 16,426
All sales and purchases with government owned entities arise in the normal course of business on an arm’s length basis. None of the balances are secured.
e) Key management personnelKey management consists of TVNZ’s Chief Executive Officer and the members of the executive team. Key management personnel compensation is as follows:
Salary and other short term benefits 4,551 3,398
Defined contribution superannuation expense 194 165
4,745 3,563
Certain key management personnel are also non-executive directors of companies with which TVNZ has transactions in the normal course of business. Any transactions undertaken with these entities have been entered into on an arm’s length commercial basis.
f) Directors
Directors’ fees 288 287
Certain Directors are also non-executive directors of companies with which TVNZ has transactions in the normal course of business. Any transactions undertaken with these entities have been entered into on an arm’s length commercial basis.
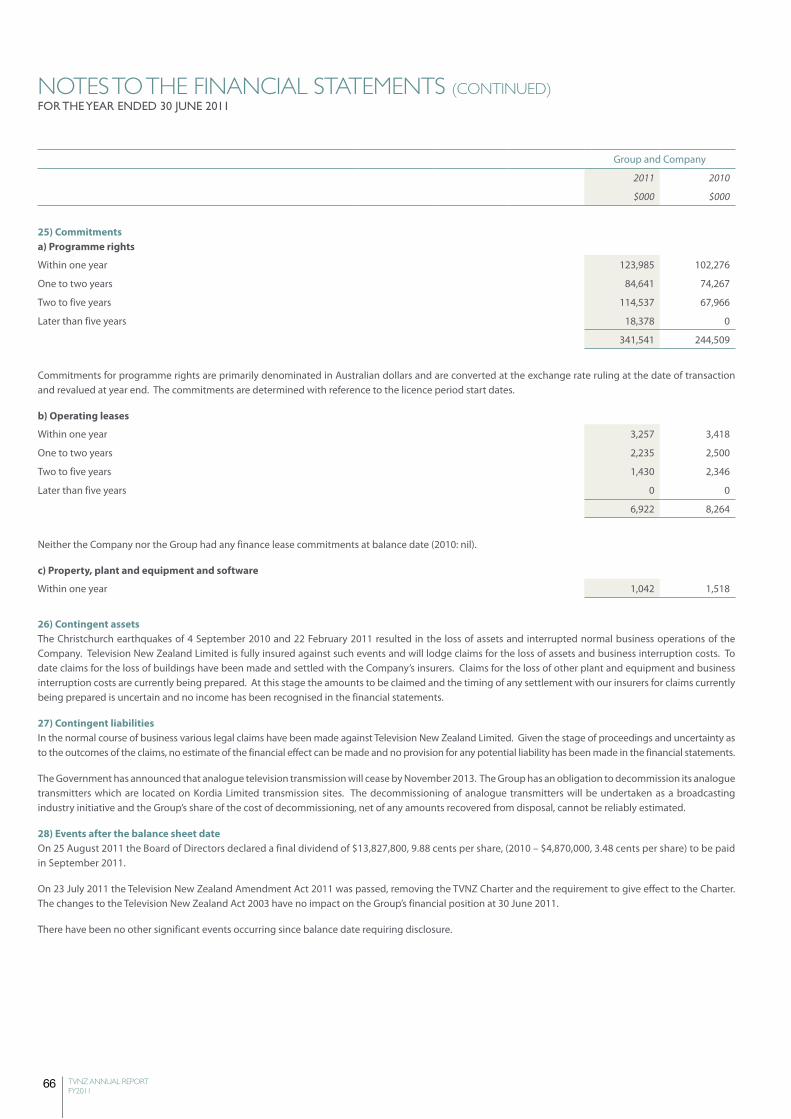
66 TVNZ ANNUAL REPORT FY2011
NOTEs TO ThE FiNANCiAL sTATEmENTs (CONTiNUEd)FOR THE YEAR ENDED 30 JUNE 2011
Group and Company
2011 2010
$000 $000
25) Commitmentsa) Programme rights
Within one year 123,985 102,276
One to two years 84,641 74,267
Two to five years 114,537 67,966
Later than five years 18,378 0
341,541 244,509
Commitments for programme rights are primarily denominated in Australian dollars and are converted at the exchange rate ruling at the date of transaction and revalued at year end. The commitments are determined with reference to the licence period start dates.
b) Operating leases
Within one year 3,257 3,418
One to two years 2,235 2,500
Two to five years 1,430 2,346
Later than five years 0 0
6,922 8,264
Neither the Company nor the Group had any finance lease commitments at balance date (2010: nil).
c) Property, plant and equipment and software
Within one year 1,042 1,518
26) Contingent assetsThe Christchurch earthquakes of 4 September 2010 and 22 February 2011 resulted in the loss of assets and interrupted normal business operations of the Company. Television New Zealand Limited is fully insured against such events and will lodge claims for the loss of assets and business interruption costs. To date claims for the loss of buildings have been made and settled with the Company’s insurers. Claims for the loss of other plant and equipment and business interruption costs are currently being prepared. At this stage the amounts to be claimed and the timing of any settlement with our insurers for claims currently being prepared is uncertain and no income has been recognised in the financial statements.
27) Contingent liabilitiesIn the normal course of business various legal claims have been made against Television New Zealand Limited. Given the stage of proceedings and uncertainty as to the outcomes of the claims, no estimate of the financial effect can be made and no provision for any potential liability has been made in the financial statements.
The Government has announced that analogue television transmission will cease by November 2013. The Group has an obligation to decommission its analogue transmitters which are located on Kordia Limited transmission sites. The decommissioning of analogue transmitters will be undertaken as a broadcasting industry initiative and the Group’s share of the cost of decommissioning, net of any amounts recovered from disposal, cannot be reliably estimated.
28) Events after the balance sheet dateOn 25 August 2011 the Board of Directors declared a final dividend of $13,827,800, 9.88 cents per share, (2010 – $4,870,000, 3.48 cents per share) to be paid in September 2011.
On 23 July 2011 the Television New Zealand Amendment Act 2011 was passed, removing the TVNZ Charter and the requirement to give effect to the Charter. The changes to the Television New Zealand Act 2003 have no impact on the Group’s financial position at 30 June 2011.
There have been no other significant events occurring since balance date requiring disclosure.
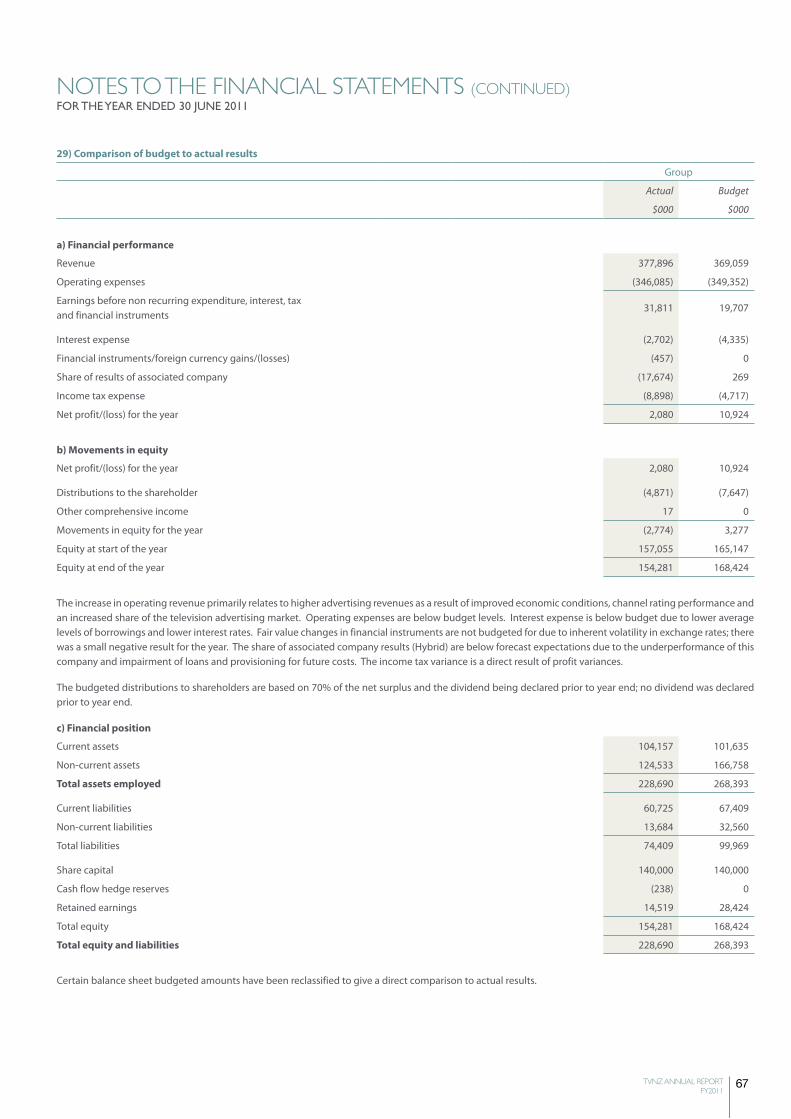
67TVNZ ANNUAL REPORT FY2011
NOTEs TO ThE FiNANCiAL sTATEmENTs (CONTiNUEd)FOR THE YEAR ENDED 30 JUNE 2011
29) Comparison of budget to actual results
Group
Actual Budget
$000 $000
a) Financial performance
Revenue 377,896 369,059
Operating expenses (346,085) (349,352)
Earnings before non recurring expenditure, interest, tax and financial instruments
31,811 19,707
Interest expense (2,702) (4,335)
Financial instruments/foreign currency gains/(losses) (457) 0
Share of results of associated company (17,674) 269
Income tax expense (8,898) (4,717)
Net profit/(loss) for the year 2,080 10,924
b) movements in equity
Net profit/(loss) for the year 2,080 10,924
Distributions to the shareholder (4,871) (7,647)
Other comprehensive income 17 0
Movements in equity for the year (2,774) 3,277
Equity at start of the year 157,055 165,147
Equity at end of the year 154,281 168,424
The increase in operating revenue primarily relates to higher advertising revenues as a result of improved economic conditions, channel rating performance and an increased share of the television advertising market. Operating expenses are below budget levels. Interest expense is below budget due to lower average levels of borrowings and lower interest rates. Fair value changes in financial instruments are not budgeted for due to inherent volatility in exchange rates; there was a small negative result for the year. The share of associated company results (Hybrid) are below forecast expectations due to the underperformance of this company and impairment of loans and provisioning for future costs. The income tax variance is a direct result of profit variances.
The budgeted distributions to shareholders are based on 70% of the net surplus and the dividend being declared prior to year end; no dividend was declared prior to year end.
c) Financial position
Current assets 104,157 101,635
Non-current assets 124,533 166,758
Total assets employed 228,690 268,393
Current liabilities 60,725 67,409
Non-current liabilities 13,684 32,560
Total liabilities 74,409 99,969
Share capital 140,000 140,000
Cash flow hedge reserves (238) 0
Retained earnings 14,519 28,424
Total equity 154,281 168,424
Total equity and liabilities 228,690 268,393
Certain balance sheet budgeted amounts have been reclassified to give a direct comparison to actual results.
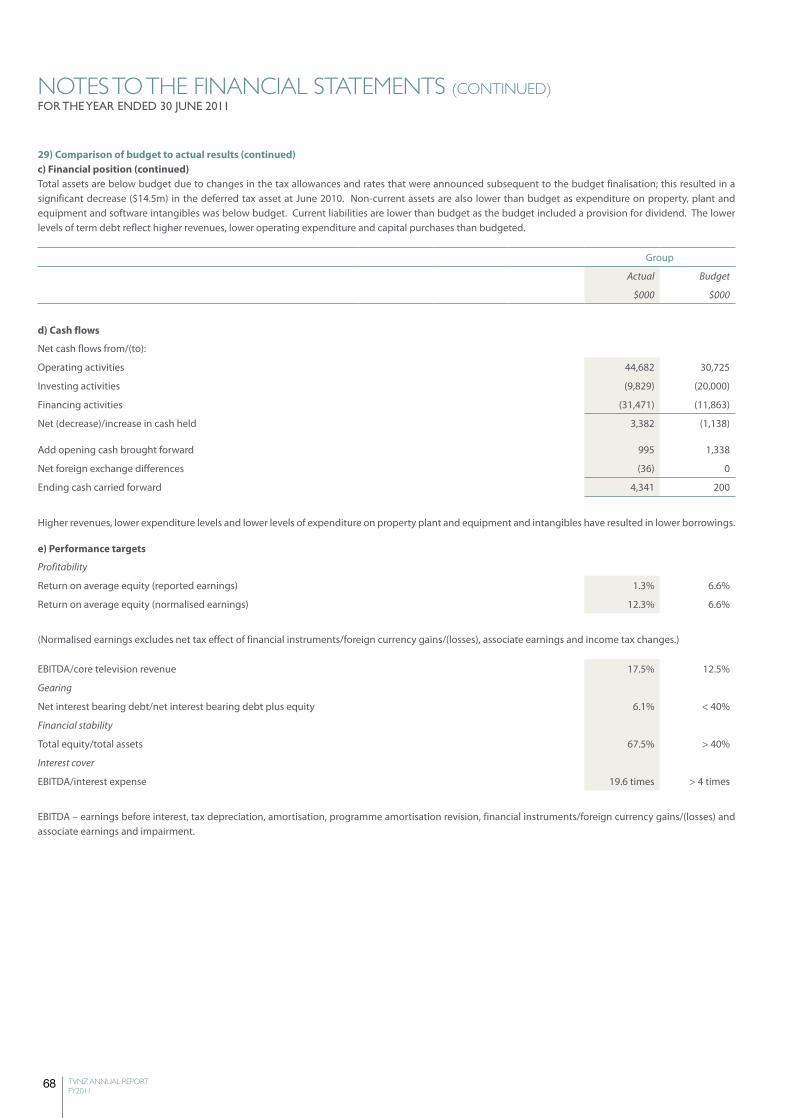
68 TVNZ ANNUAL REPORT FY2011
NOTEs TO ThE FiNANCiAL sTATEmENTs (CONTiNUEd)FOR THE YEAR ENDED 30 JUNE 2011
29) Comparison of budget to actual results (continued)c) Financial position (continued)Total assets are below budget due to changes in the tax allowances and rates that were announced subsequent to the budget finalisation; this resulted in a significant decrease ($14.5m) in the deferred tax asset at June 2010. Non-current assets are also lower than budget as expenditure on property, plant and equipment and software intangibles was below budget. Current liabilities are lower than budget as the budget included a provision for dividend. The lower levels of term debt reflect higher revenues, lower operating expenditure and capital purchases than budgeted.
Group
Actual Budget
$000 $000
d) Cash flows
Net cash flows from/(to):
Operating activities 44,682 30,725
Investing activities (9,829) (20,000)
Financing activities (31,471) (11,863)
Net (decrease)/increase in cash held 3,382 (1,138)
Add opening cash brought forward 995 1,338
Net foreign exchange differences (36) 0
Ending cash carried forward 4,341 200
Higher revenues, lower expenditure levels and lower levels of expenditure on property plant and equipment and intangibles have resulted in lower borrowings.
e) Performance targets
Profitability
Return on average equity (reported earnings) 1.3% 6.6%
Return on average equity (normalised earnings) 12.3% 6.6%
(Normalised earnings excludes net tax effect of financial instruments/foreign currency gains/(losses), associate earnings and income tax changes.)
EBITDA/core television revenue 17.5% 12.5%
Gearing
Net interest bearing debt/net interest bearing debt plus equity 6.1% < 40%
Financial stability
Total equity/total assets 67.5% > 40%
Interest cover
EBITDA/interest expense 19.6 times > 4 times
EBITDA – earnings before interest, tax depreciation, amortisation, programme amortisation revision, financial instruments/foreign currency gains/(losses) and associate earnings and impairment.
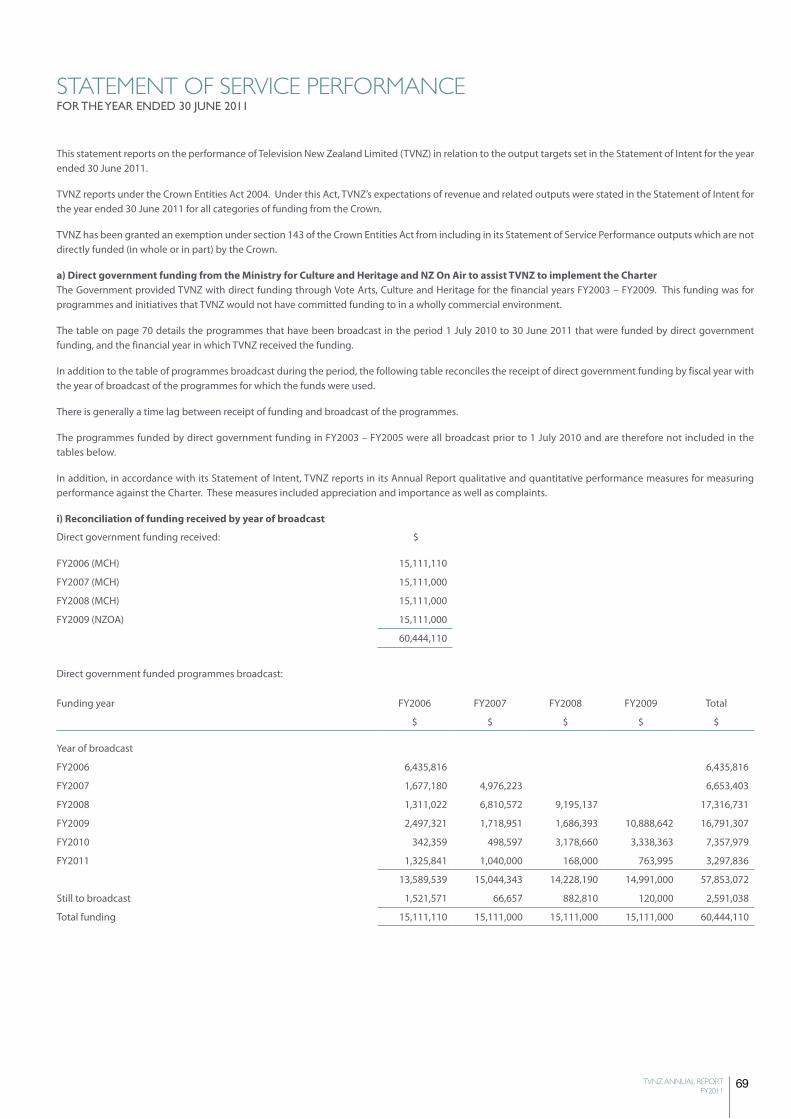
69TVNZ ANNUAL REPORT FY2011
sTATEmENT OF sERViCE PERFORmANCEFOR THE YEAR ENDED 30 JUNE 2011
This statement reports on the performance of Television New Zealand Limited (TVNZ) in relation to the output targets set in the Statement of Intent for the year ended 30 June 2011.
TVNZ reports under the Crown Entities Act 2004. Under this Act, TVNZ’s expectations of revenue and related outputs were stated in the Statement of Intent for the year ended 30 June 2011 for all categories of funding from the Crown.
TVNZ has been granted an exemption under section 143 of the Crown Entities Act from including in its Statement of Service Performance outputs which are not directly funded (in whole or in part) by the Crown.
a) Direct government funding from the ministry for Culture and Heritage and NZ On Air to assist TVNZ to implement the CharterThe Government provided TVNZ with direct funding through Vote Arts, Culture and Heritage for the financial years FY2003 – FY2009. This funding was for programmes and initiatives that TVNZ would not have committed funding to in a wholly commercial environment.
The table on page 70 details the programmes that have been broadcast in the period 1 July 2010 to 30 June 2011 that were funded by direct government funding, and the financial year in which TVNZ received the funding.
In addition to the table of programmes broadcast during the period, the following table reconciles the receipt of direct government funding by fiscal year with the year of broadcast of the programmes for which the funds were used.
There is generally a time lag between receipt of funding and broadcast of the programmes.
The programmes funded by direct government funding in FY2003 – FY2005 were all broadcast prior to 1 July 2010 and are therefore not included in the tables below.
In addition, in accordance with its Statement of Intent, TVNZ reports in its Annual Report qualitative and quantitative performance measures for measuring performance against the Charter. These measures included appreciation and importance as well as complaints.
i) Reconciliation of funding received by year of broadcast
Direct government funding received: $
FY2006 (MCH) 15,111,110
FY2007 (MCH) 15,111,000
FY2008 (MCH) 15,111,000
FY2009 (NZOA) 15,111,000
60,444,110
Direct government funded programmes broadcast:
Funding year FY2006 FY2007 FY2008 FY2009 Total
$ $ $ $ $
Year of broadcast
FY2006 6,435,816 6,435,816
FY2007 1,677,180 4,976,223 6,653,403
FY2008 1,311,022 6,810,572 9,195,137 17,316,731
FY2009 2,497,321 1,718,951 1,686,393 10,888,642 16,791,307
FY2010 342,359 498,597 3,178,660 3,338,363 7,357,979
FY2011 1,325,841 1,040,000 168,000 763,995 3,297,836
13,589,539 15,044,343 14,228,190 14,991,000 57,853,072
Still to broadcast 1,521,571 66,657 882,810 120,000 2,591,038
Total funding 15,111,110 15,111,000 15,111,000 15,111,000 60,444,110
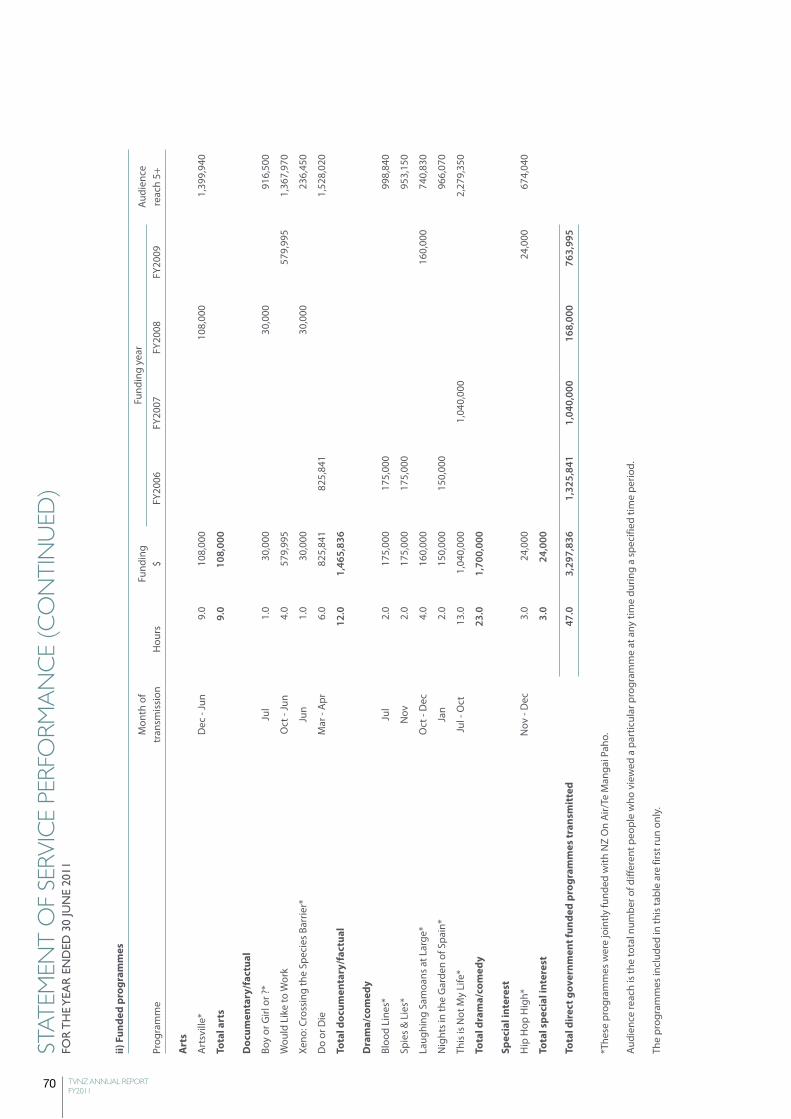
70 TVNZ ANNUAL REPORT FY2011
sTAT
EmEN
T O
F sE
RViC
E PE
RFO
RmA
NC
E (C
ON
TiN
UEd
)FO
R T
HE
YEA
R E
ND
ED 3
0 JU
NE
2011
ii) F
unde
d pr
ogra
mm
es
Prog
ram
me
Mon
th o
f tr
ansm
issi
onH
ours
Fund
ing
$
Fund
ing
year
Audi
ence
re
ach
5+FY
2006
FY20
07FY
2008
FY20
09
Art
s
Art
svill
e*D
ec -
Jun
9.0
108,
000
108,
000
1,39
9,94
0
Tota
l art
s9.
010
8,00
0
Doc
umen
tary
/fac
tual
Boy
or G
irl o
r ?*
Jul
1.0
30,0
0030
,000
916,
500
Wou
ld L
ike
to W
ork
Oct
- Ju
n4.
057
9,99
557
9,99
51,
367,
970
Xeno
: Cro
ssin
g th
e Sp
ecie
s Ba
rrie
r*Ju
n1.
030
,000
30,0
0023
6,45
0
Do
or D
ieM
ar -
Apr
6.0
825,
841
825,
841
1,52
8,02
0
Tota
l doc
umen
tary
/fac
tual
12.0
1,46
5,83
6
Dra
ma/
com
edy
Bloo
d Li
nes*
Jul
2.0
175,
000
175,
000
998,
840
Spie
s &
Lie
s*N
ov2.
017
5,00
017
5,00
095
3,15
0
Laug
hing
Sam
oans
at L
arge
*O
ct -
Dec
4.0
160,
000
160,
000
740,
830
Nig
hts
in th
e G
arde
n of
Spa
in*
Jan
2.0
150,
000
150,
000
966,
070
This
is N
ot M
y Li
fe*
Jul -
Oct
13.0
1,04
0,00
01,
040,
000
2,27
9,35
0
Tota
l dra
ma/
com
edy
23.0
1,70
0,00
0
Spec
ial i
nter
est
Hip
Hop
Hig
h*N
ov -
Dec
3.0
24,0
0024
,000
674,
040
Tota
l spe
cial
inte
rest
3.0
24,0
00
Tota
l dir
ect g
over
nmen
t fun
ded
prog
ram
mes
tran
smit
ted
47.0
3,29
7,83
61,
325,
841
1,04
0,00
016
8,00
076
3,99
5
*The
se p
rogr
amm
es w
ere
join
tly fu
nded
with
NZ
On
Air/
Te M
anga
i Pah
o.
Audi
ence
reac
h is
the
tota
l num
ber o
f diff
eren
t peo
ple
who
vie
wed
a p
artic
ular
pro
gram
me
at a
ny ti
me
durin
g a
spec
ified
tim
e pe
riod.
The
prog
ram
mes
incl
uded
in th
is ta
ble
are
first
run
only
.
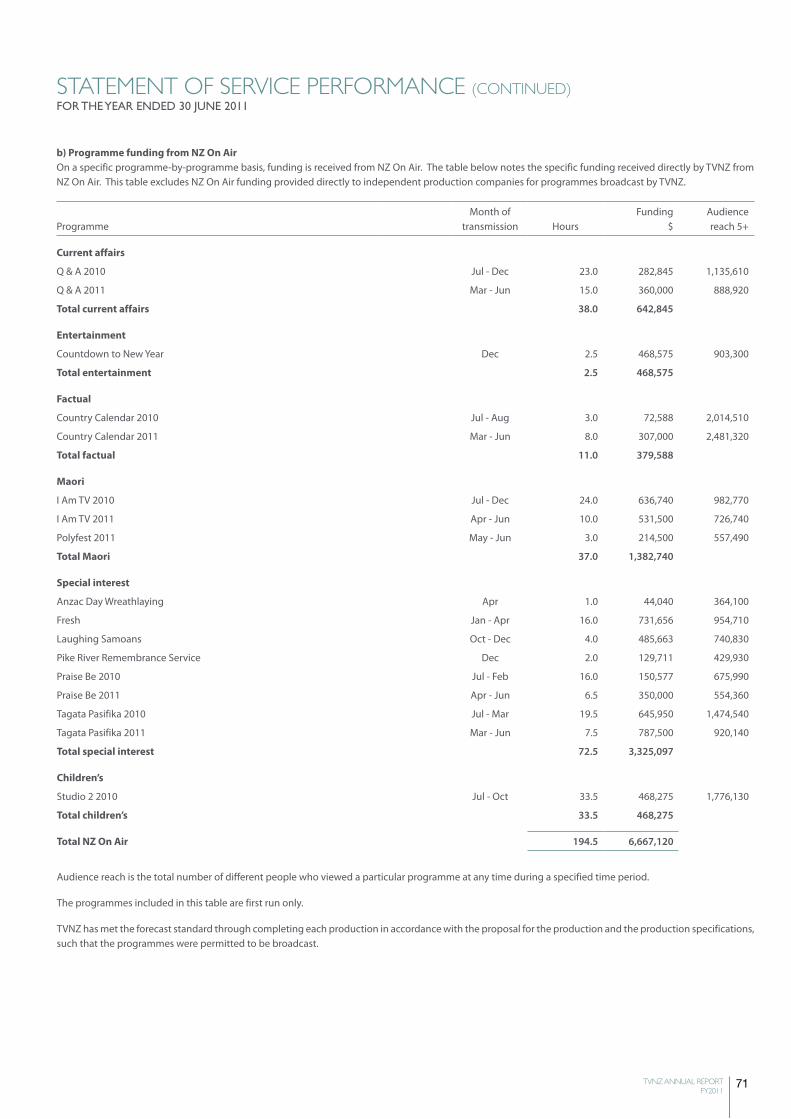
71TVNZ ANNUAL REPORT FY2011
sTATEmENT OF sERViCE PERFORmANCE (CONTiNUEd)FOR THE YEAR ENDED 30 JUNE 2011
b) Programme funding from NZ On AirOn a specific programme-by-programme basis, funding is received from NZ On Air. The table below notes the specific funding received directly by TVNZ from NZ On Air. This table excludes NZ On Air funding provided directly to independent production companies for programmes broadcast by TVNZ.
ProgrammeMonth of
transmission HoursFunding
$Audience reach 5+
Current affairs
Q & A 2010 Jul - Dec 23.0 282,845 1,135,610
Q & A 2011 Mar - Jun 15.0 360,000 888,920
Total current affairs 38.0 642,845
Entertainment
Countdown to New Year Dec 2.5 468,575 903,300
Total entertainment 2.5 468,575
Factual
Country Calendar 2010 Jul - Aug 3.0 72,588 2,014,510
Country Calendar 2011 Mar - Jun 8.0 307,000 2,481,320
Total factual 11.0 379,588
maori
I Am TV 2010 Jul - Dec 24.0 636,740 982,770
I Am TV 2011 Apr - Jun 10.0 531,500 726,740
Polyfest 2011 May - Jun 3.0 214,500 557,490
Total maori 37.0 1,382,740
Special interest
Anzac Day Wreathlaying Apr 1.0 44,040 364,100
Fresh Jan - Apr 16.0 731,656 954,710
Laughing Samoans Oct - Dec 4.0 485,663 740,830
Pike River Remembrance Service Dec 2.0 129,711 429,930
Praise Be 2010 Jul - Feb 16.0 150,577 675,990
Praise Be 2011 Apr - Jun 6.5 350,000 554,360
Tagata Pasifika 2010 Jul - Mar 19.5 645,950 1,474,540
Tagata Pasifika 2011 Mar - Jun 7.5 787,500 920,140
Total special interest 72.5 3,325,097
Children’s
Studio 2 2010 Jul - Oct 33.5 468,275 1,776,130
Total children’s 33.5 468,275
Total NZ On Air 194.5 6,667,120
Audience reach is the total number of different people who viewed a particular programme at any time during a specified time period.
The programmes included in this table are first run only.
TVNZ has met the forecast standard through completing each production in accordance with the proposal for the production and the production specifications, such that the programmes were permitted to be broadcast.
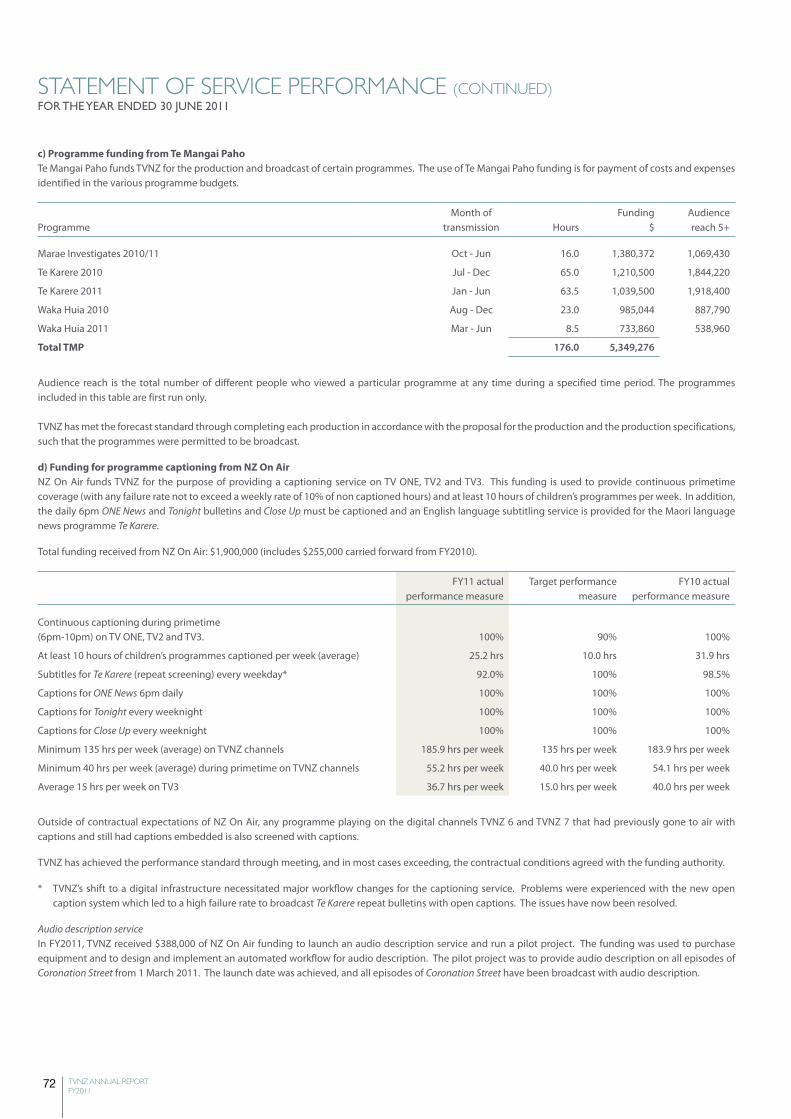
72 TVNZ ANNUAL REPORT FY2011
sTATEmENT OF sERViCE PERFORmANCE (CONTiNUEd)FOR THE YEAR ENDED 30 JUNE 2011
c) Programme funding from Te mangai PahoTe Mangai Paho funds TVNZ for the production and broadcast of certain programmes. The use of Te Mangai Paho funding is for payment of costs and expenses identified in the various programme budgets.
ProgrammeMonth of
transmission HoursFunding
$Audience reach 5+
Marae Investigates 2010/11 Oct - Jun 16.0 1,380,372 1,069,430
Te Karere 2010 Jul - Dec 65.0 1,210,500 1,844,220
Te Karere 2011 Jan - Jun 63.5 1,039,500 1,918,400
Waka Huia 2010 Aug - Dec 23.0 985,044 887,790
Waka Huia 2011 Mar - Jun 8.5 733,860 538,960
Total TmP 176.0 5,349,276
Audience reach is the total number of different people who viewed a particular programme at any time during a specified time period. The programmes included in this table are first run only.
TVNZ has met the forecast standard through completing each production in accordance with the proposal for the production and the production specifications, such that the programmes were permitted to be broadcast.
d) Funding for programme captioning from NZ On AirNZ On Air funds TVNZ for the purpose of providing a captioning service on TV ONE, TV2 and TV3. This funding is used to provide continuous primetime coverage (with any failure rate not to exceed a weekly rate of 10% of non captioned hours) and at least 10 hours of children’s programmes per week. In addition, the daily 6pm ONE News and Tonight bulletins and Close Up must be captioned and an English language subtitling service is provided for the Maori language news programme Te Karere.
Total funding received from NZ On Air: $1,900,000 (includes $255,000 carried forward from FY2010).
FY11 actual performance measure
Target performance measure
FY10 actual performance measure
Continuous captioning during primetime (6pm-10pm) on TV ONE, TV2 and TV3. 100% 90% 100%
At least 10 hours of children’s programmes captioned per week (average) 25.2 hrs 10.0 hrs 31.9 hrs
Subtitles for Te Karere (repeat screening) every weekday* 92.0% 100% 98.5%
Captions for ONE News 6pm daily 100% 100% 100%
Captions for Tonight every weeknight 100% 100% 100%
Captions for Close Up every weeknight 100% 100% 100%
Minimum 135 hrs per week (average) on TVNZ channels 185.9 hrs per week 135 hrs per week 183.9 hrs per week
Minimum 40 hrs per week (average) during primetime on TVNZ channels 55.2 hrs per week 40.0 hrs per week 54.1 hrs per week
Average 15 hrs per week on TV3 36.7 hrs per week 15.0 hrs per week 40.0 hrs per week
Outside of contractual expectations of NZ On Air, any programme playing on the digital channels TVNZ 6 and TVNZ 7 that had previously gone to air with captions and still had captions embedded is also screened with captions.
TVNZ has achieved the performance standard through meeting, and in most cases exceeding, the contractual conditions agreed with the funding authority.
* TVNZ’s shift to a digital infrastructure necessitated major workflow changes for the captioning service. Problems were experienced with the new open caption system which led to a high failure rate to broadcast Te Karere repeat bulletins with open captions. The issues have now been resolved.
Audio description serviceIn FY2011, TVNZ received $388,000 of NZ On Air funding to launch an audio description service and run a pilot project. The funding was used to purchase equipment and to design and implement an automated workflow for audio description. The pilot project was to provide audio description on all episodes of Coronation Street from 1 March 2011. The launch date was achieved, and all episodes of Coronation Street have been broadcast with audio description.
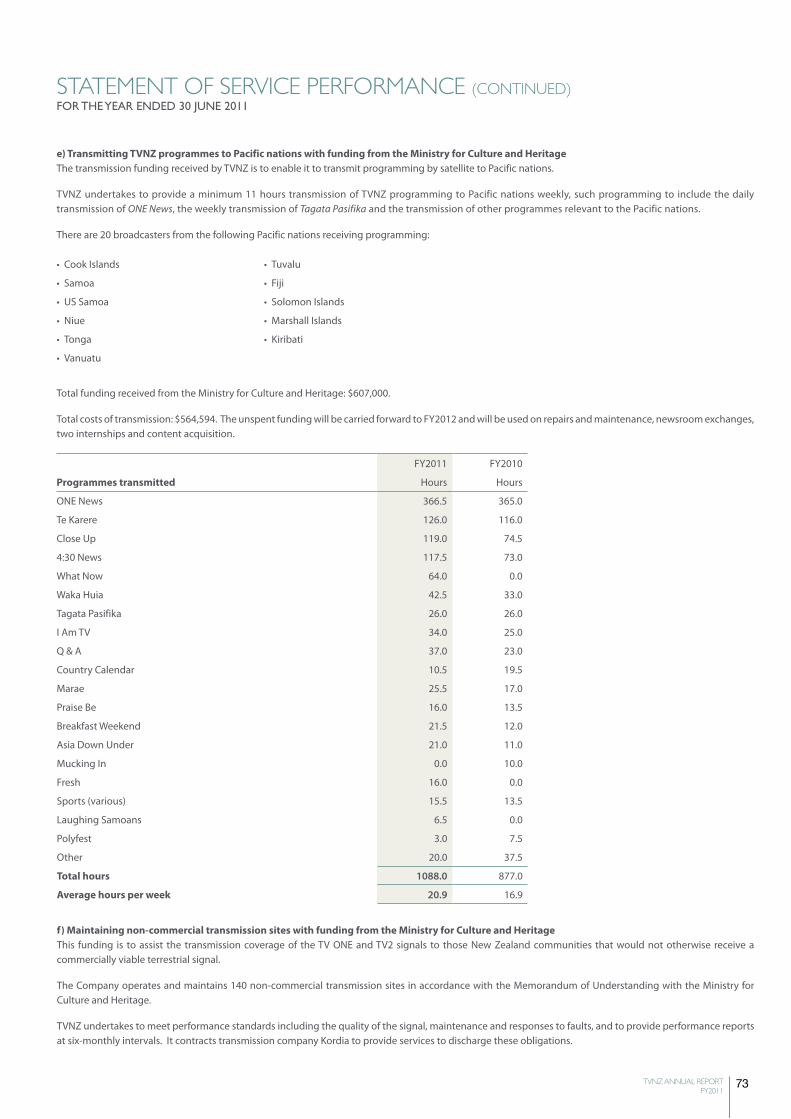
73TVNZ ANNUAL REPORT FY2011
sTATEmENT OF sERViCE PERFORmANCE (CONTiNUEd)FOR THE YEAR ENDED 30 JUNE 2011
e) Transmitting TVNZ programmes to Pacific nations with funding from the ministry for Culture and HeritageThe transmission funding received by TVNZ is to enable it to transmit programming by satellite to Pacific nations.
TVNZ undertakes to provide a minimum 11 hours transmission of TVNZ programming to Pacific nations weekly, such programming to include the daily transmission of ONE News, the weekly transmission of Tagata Pasifika and the transmission of other programmes relevant to the Pacific nations.
There are 20 broadcasters from the following Pacific nations receiving programming:
• Cook Islands • Tuvalu
• Samoa • Fiji
• US Samoa • Solomon Islands
• Niue • Marshall Islands
• Tonga • Kiribati
• Vanuatu
Total funding received from the Ministry for Culture and Heritage: $607,000.
Total costs of transmission: $564,594. The unspent funding will be carried forward to FY2012 and will be used on repairs and maintenance, newsroom exchanges, two internships and content acquisition.
FY2011 FY2010
Programmes transmitted Hours Hours
ONE News 366.5 365.0
Te Karere 126.0 116.0
Close Up 119.0 74.5
4:30 News 117.5 73.0
What Now 64.0 0.0
Waka Huia 42.5 33.0
Tagata Pasifika 26.0 26.0
I Am TV 34.0 25.0
Q & A 37.0 23.0
Country Calendar 10.5 19.5
Marae 25.5 17.0
Praise Be 16.0 13.5
Breakfast Weekend 21.5 12.0
Asia Down Under 21.0 11.0
Mucking In 0.0 10.0
Fresh 16.0 0.0
Sports (various) 15.5 13.5
Laughing Samoans 6.5 0.0
Polyfest 3.0 7.5
Other 20.0 37.5
Total hours 1088.0 877.0
Average hours per week 20.9 16.9
f) maintaining non-commercial transmission sites with funding from the ministry for Culture and HeritageThis funding is to assist the transmission coverage of the TV ONE and TV2 signals to those New Zealand communities that would not otherwise receive a commercially viable terrestrial signal.
The Company operates and maintains 140 non-commercial transmission sites in accordance with the Memorandum of Understanding with the Ministry for Culture and Heritage.
TVNZ undertakes to meet performance standards including the quality of the signal, maintenance and responses to faults, and to provide performance reports at six-monthly intervals. It contracts transmission company Kordia to provide services to discharge these obligations.
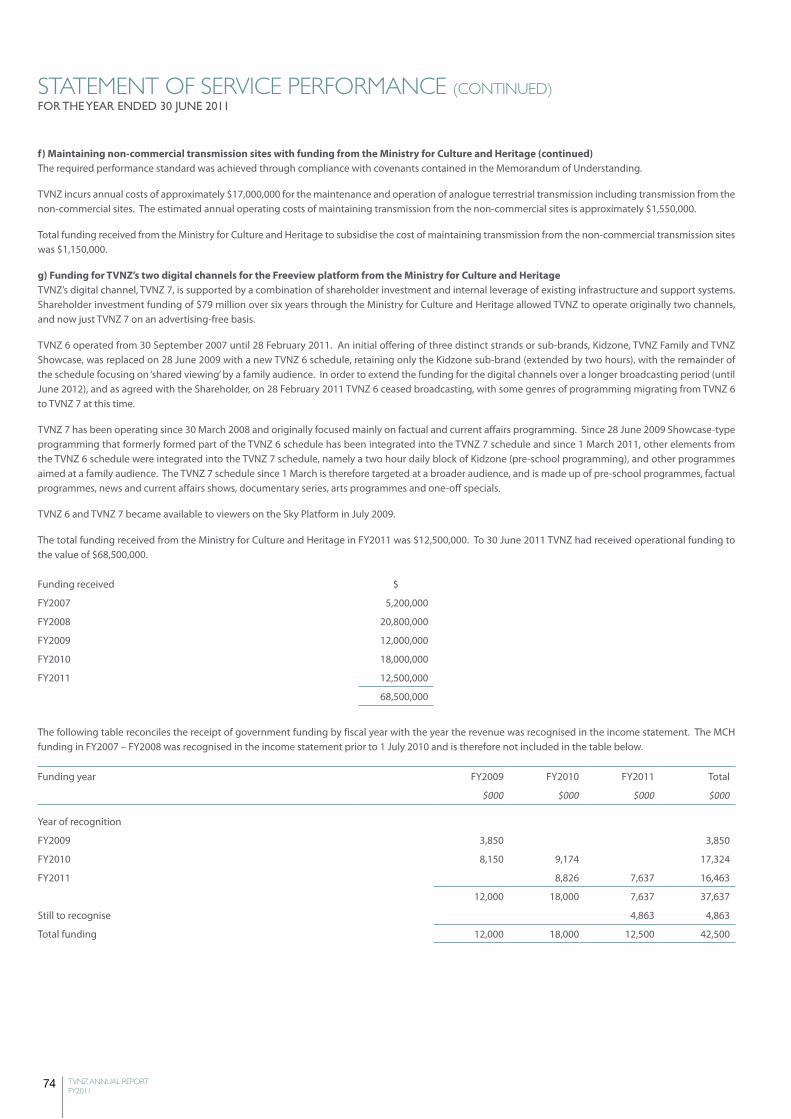
74 TVNZ ANNUAL REPORT FY2011
sTATEmENT OF sERViCE PERFORmANCE (CONTiNUEd)FOR THE YEAR ENDED 30 JUNE 2011
f) maintaining non-commercial transmission sites with funding from the ministry for Culture and Heritage (continued)The required performance standard was achieved through compliance with covenants contained in the Memorandum of Understanding.
TVNZ incurs annual costs of approximately $17,000,000 for the maintenance and operation of analogue terrestrial transmission including transmission from the non-commercial sites. The estimated annual operating costs of maintaining transmission from the non-commercial sites is approximately $1,550,000.
Total funding received from the Ministry for Culture and Heritage to subsidise the cost of maintaining transmission from the non-commercial transmission sites was $1,150,000.
g) Funding for TVNZ’s two digital channels for the Freeview platform from the ministry for Culture and HeritageTVNZ’s digital channel, TVNZ 7, is supported by a combination of shareholder investment and internal leverage of existing infrastructure and support systems. Shareholder investment funding of $79 million over six years through the Ministry for Culture and Heritage allowed TVNZ to operate originally two channels, and now just TVNZ 7 on an advertising-free basis.
TVNZ 6 operated from 30 September 2007 until 28 February 2011. An initial offering of three distinct strands or sub-brands, Kidzone, TVNZ Family and TVNZ Showcase, was replaced on 28 June 2009 with a new TVNZ 6 schedule, retaining only the Kidzone sub-brand (extended by two hours), with the remainder of the schedule focusing on ‘shared viewing’ by a family audience. In order to extend the funding for the digital channels over a longer broadcasting period (until June 2012), and as agreed with the Shareholder, on 28 February 2011 TVNZ 6 ceased broadcasting, with some genres of programming migrating from TVNZ 6 to TVNZ 7 at this time.
TVNZ 7 has been operating since 30 March 2008 and originally focused mainly on factual and current affairs programming. Since 28 June 2009 Showcase-type programming that formerly formed part of the TVNZ 6 schedule has been integrated into the TVNZ 7 schedule and since 1 March 2011, other elements from the TVNZ 6 schedule were integrated into the TVNZ 7 schedule, namely a two hour daily block of Kidzone (pre-school programming), and other programmes aimed at a family audience. The TVNZ 7 schedule since 1 March is therefore targeted at a broader audience, and is made up of pre-school programmes, factual programmes, news and current affairs shows, documentary series, arts programmes and one-off specials.
TVNZ 6 and TVNZ 7 became available to viewers on the Sky Platform in July 2009.
The total funding received from the Ministry for Culture and Heritage in FY2011 was $12,500,000. To 30 June 2011 TVNZ had received operational funding to the value of $68,500,000.
Funding received $
FY2007 5,200,000
FY2008 20,800,000
FY2009 12,000,000
FY2010 18,000,000
FY2011 12,500,000
68,500,000
The following table reconciles the receipt of government funding by fiscal year with the year the revenue was recognised in the income statement. The MCH funding in FY2007 – FY2008 was recognised in the income statement prior to 1 July 2010 and is therefore not included in the table below.
Funding year FY2009 FY2010 FY2011 Total
$000 $000 $000 $000
Year of recognition
FY2009 3,850 3,850
FY2010 8,150 9,174 17,324
FY2011 8,826 7,637 16,463
12,000 18,000 7,637 37,637
Still to recognise 4,863 4,863
Total funding 12,000 18,000 12,500 42,500
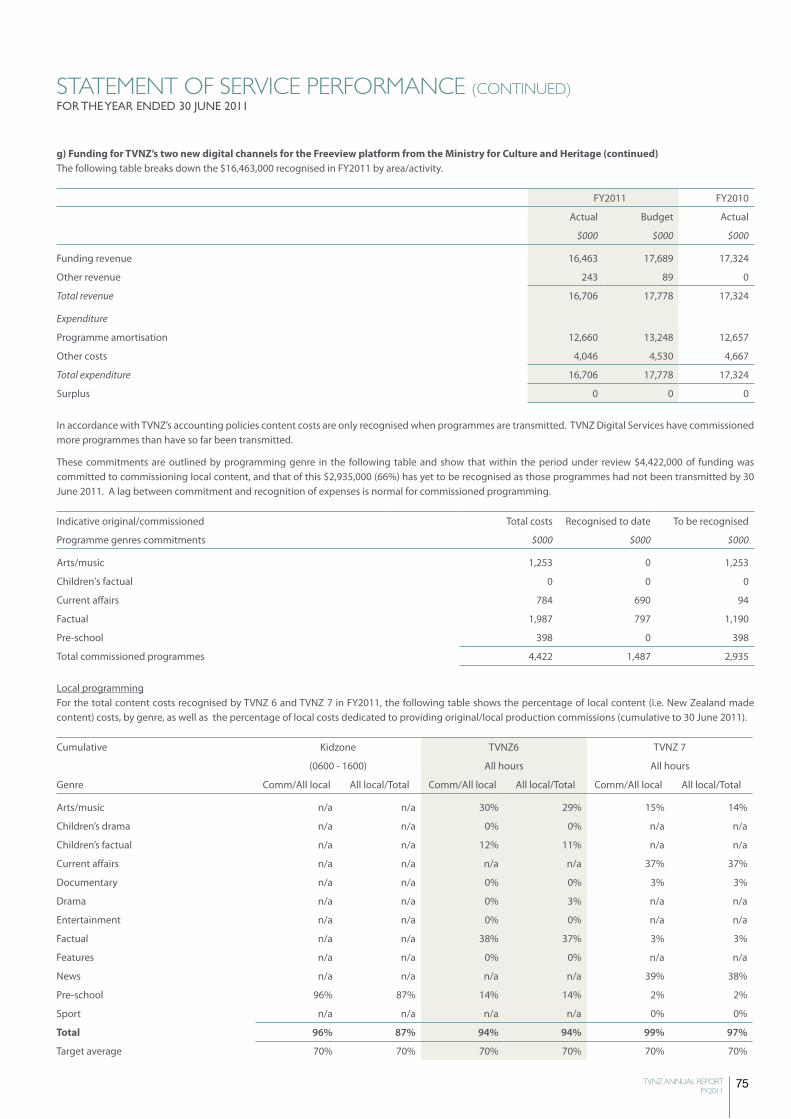
75TVNZ ANNUAL REPORT FY2011
sTATEmENT OF sERViCE PERFORmANCE (CONTiNUEd)FOR THE YEAR ENDED 30 JUNE 2011
g) Funding for TVNZ’s two new digital channels for the Freeview platform from the ministry for Culture and Heritage (continued)The following table breaks down the $16,463,000 recognised in FY2011 by area/activity.
FY2011 FY2010
Actual Budget Actual
$000 $000 $000
Funding revenue 16,463 17,689 17,324
Other revenue 243 89 0
Total revenue 16,706 17,778 17,324
Expenditure
Programme amortisation 12,660 13,248 12,657
Other costs 4,046 4,530 4,667
Total expenditure 16,706 17,778 17,324
Surplus 0 0 0
In accordance with TVNZ’s accounting policies content costs are only recognised when programmes are transmitted. TVNZ Digital Services have commissioned more programmes than have so far been transmitted.
These commitments are outlined by programming genre in the following table and show that within the period under review $4,422,000 of funding was committed to commissioning local content, and that of this $2,935,000 (66%) has yet to be recognised as those programmes had not been transmitted by 30 June 2011. A lag between commitment and recognition of expenses is normal for commissioned programming.
Indicative original/commissioned Total costs Recognised to date To be recognised
Programme genres commitments $000 $000 $000
Arts/music 1,253 0 1,253
Children's factual 0 0 0
Current affairs 784 690 94
Factual 1,987 797 1,190
Pre-school 398 0 398
Total commissioned programmes 4,422 1,487 2,935
Local programmingFor the total content costs recognised by TVNZ 6 and TVNZ 7 in FY2011, the following table shows the percentage of local content (i.e. New Zealand made content) costs, by genre, as well as the percentage of local costs dedicated to providing original/local production commissions (cumulative to 30 June 2011).
Cumulative Kidzone TVNZ6 TVNZ 7
(0600 - 1600) All hours All hours
Genre Comm/All local All local/Total Comm/All local All local/Total Comm/All local All local/Total
Arts/music n/a n/a 30% 29% 15% 14%
Children’s drama n/a n/a 0% 0% n/a n/a
Children’s factual n/a n/a 12% 11% n/a n/a
Current affairs n/a n/a n/a n/a 37% 37%
Documentary n/a n/a 0% 0% 3% 3%
Drama n/a n/a 0% 3% n/a n/a
Entertainment n/a n/a 0% 0% n/a n/a
Factual n/a n/a 38% 37% 3% 3%
Features n/a n/a 0% 0% n/a n/a
News n/a n/a n/a n/a 39% 38%
Pre-school 96% 87% 14% 14% 2% 2%
Sport n/a n/a n/a n/a 0% 0%
Total 96% 87% 94% 94% 99% 97%
Target average 70% 70% 70% 70% 70% 70%
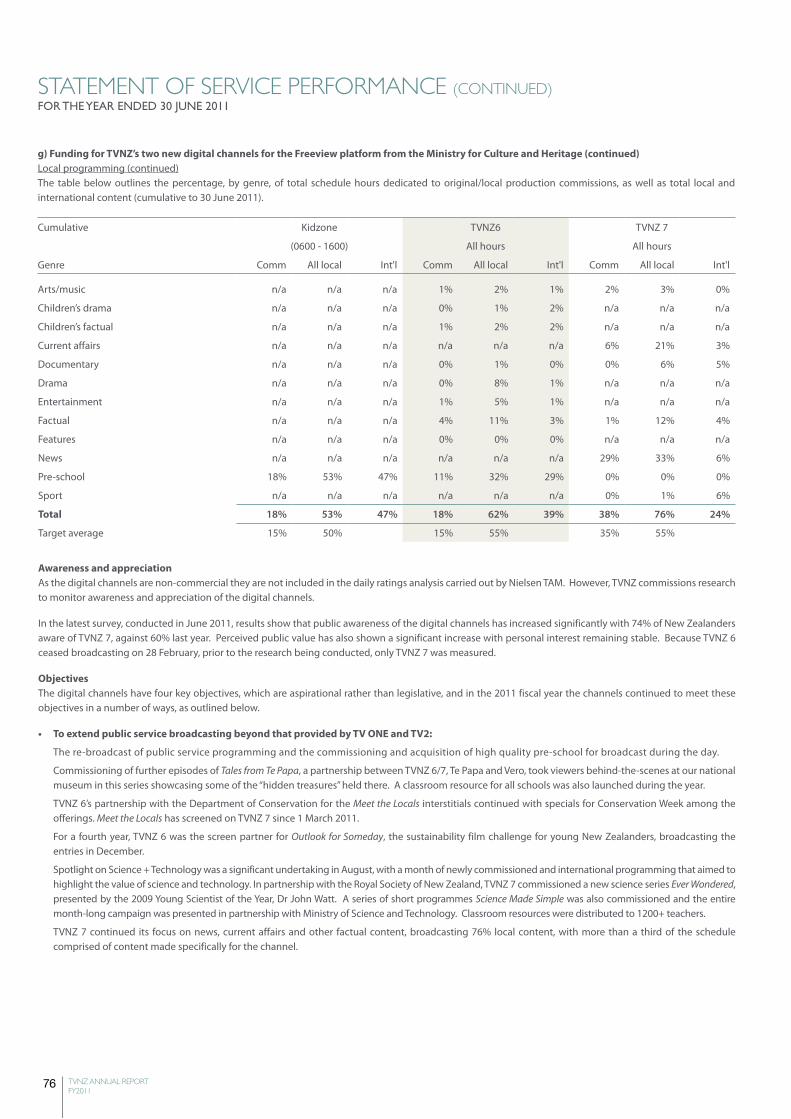
76 TVNZ ANNUAL REPORT FY2011
sTATEmENT OF sERViCE PERFORmANCE (CONTiNUEd)FOR THE YEAR ENDED 30 JUNE 2011
g) Funding for TVNZ’s two new digital channels for the Freeview platform from the ministry for Culture and Heritage (continued)Local programming (continued)The table below outlines the percentage, by genre, of total schedule hours dedicated to original/local production commissions, as well as total local and international content (cumulative to 30 June 2011).
Cumulative Kidzone TVNZ6 TVNZ 7
(0600 - 1600) All hours All hours
Genre Comm All local Int'l Comm All local Int'l Comm All local Int'l
Arts/music n/a n/a n/a 1% 2% 1% 2% 3% 0%
Children’s drama n/a n/a n/a 0% 1% 2% n/a n/a n/a
Children’s factual n/a n/a n/a 1% 2% 2% n/a n/a n/a
Current affairs n/a n/a n/a n/a n/a n/a 6% 21% 3%
Documentary n/a n/a n/a 0% 1% 0% 0% 6% 5%
Drama n/a n/a n/a 0% 8% 1% n/a n/a n/a
Entertainment n/a n/a n/a 1% 5% 1% n/a n/a n/a
Factual n/a n/a n/a 4% 11% 3% 1% 12% 4%
Features n/a n/a n/a 0% 0% 0% n/a n/a n/a
News n/a n/a n/a n/a n/a n/a 29% 33% 6%
Pre-school 18% 53% 47% 11% 32% 29% 0% 0% 0%
Sport n/a n/a n/a n/a n/a n/a 0% 1% 6%
Total 18% 53% 47% 18% 62% 39% 38% 76% 24%
Target average 15% 50% 15% 55% 35% 55%
Awareness and appreciationAs the digital channels are non-commercial they are not included in the daily ratings analysis carried out by Nielsen TAM. However, TVNZ commissions research to monitor awareness and appreciation of the digital channels.
In the latest survey, conducted in June 2011, results show that public awareness of the digital channels has increased significantly with 74% of New Zealanders aware of TVNZ 7, against 60% last year. Perceived public value has also shown a significant increase with personal interest remaining stable. Because TVNZ 6 ceased broadcasting on 28 February, prior to the research being conducted, only TVNZ 7 was measured.
ObjectivesThe digital channels have four key objectives, which are aspirational rather than legislative, and in the 2011 fiscal year the channels continued to meet these objectives in a number of ways, as outlined below.
• To extend public service broadcasting beyond that provided by TV ONE and TV2:
The re-broadcast of public service programming and the commissioning and acquisition of high quality pre-school for broadcast during the day.
Commissioning of further episodes of Tales from Te Papa, a partnership between TVNZ 6/7, Te Papa and Vero, took viewers behind-the-scenes at our national museum in this series showcasing some of the “hidden treasures” held there. A classroom resource for all schools was also launched during the year.
TVNZ 6’s partnership with the Department of Conservation for the Meet the Locals interstitials continued with specials for Conservation Week among the offerings. Meet the Locals has screened on TVNZ 7 since 1 March 2011.
For a fourth year, TVNZ 6 was the screen partner for Outlook for Someday, the sustainability film challenge for young New Zealanders, broadcasting the entries in December.
Spotlight on Science + Technology was a significant undertaking in August, with a month of newly commissioned and international programming that aimed to highlight the value of science and technology. In partnership with the Royal Society of New Zealand, TVNZ 7 commissioned a new science series Ever Wondered, presented by the 2009 Young Scientist of the Year, Dr John Watt. A series of short programmes Science Made Simple was also commissioned and the entire month-long campaign was presented in partnership with Ministry of Science and Technology. Classroom resources were distributed to 1200+ teachers.
TVNZ 7 continued its focus on news, current affairs and other factual content, broadcasting 76% local content, with more than a third of the schedule comprised of content made specifically for the channel.
77TVNZ ANNUAL REPORT FY2011
sTATEmENT OF sERViCE PERFORmANCE (CONTiNUEd)FOR THE YEAR ENDED 30 JUNE 2011
g) Funding for TVNZ’s two new digital channels for the Freeview platform from the ministry for Culture and Heritage (continued)• To extend public service broadcasting beyond that provided by TV ONE and TV2 (continued):
A new arts series, The Artists, was commissioned for TVNZ 7 and launched on air in March. This profiles artists awarded throughout the year by Arts Foundation of New Zealand. Further series of arts programmes, including The Good Word and Talk Talk were commissioned for TVNZ 7, continuing to serve the needs of this niche audience. Programming celebrating New Zealand Book Month also screened during March.
Media 7 and Back Benches continued during the year with a summer season for Back Benches that included a tour of South Island New Zealand pubs to film episodes.
The Court Report, a programme designed to demystify and explain important legal issues and legal current events, launched on TVNZ 7 in July 2010.
Raising Children in New Zealand launched on TVNZ 7 in June. This series, comprised of 10 x ½ hr episodes plus 47 short-form programmes scheduled for daily plays, is a practical parenting resource, combining the knowledge of many child-focussed agencies, including Plunket, Barnados and Ministry of Social Development.
Commissioned for TVNZ 7, Road to Young Farmer series culminated with the final of the National Bank Young Farmer Contest being broadcast live from Masterton in primetime on TVNZ 7 on 2 July, followed by off-peak repeat play on TV ONE.
• To make public service broadcasting content more available through scheduling more of it in primetime:
The time-shifted rebroadcast of programmes across diverse areas of interest, including, among others, Te Karere, Attitude, Praise Be, Rural Delivery, Q & A, Waka Huia and Asia Downunder.
The acquisition and screening of programmes that haven’t recently screened on television, including local drama and children’s drama series and locally produced documentaries and factual programming.
TVNZ 7’s News at 8 continues to offer extended duration and thus more in-depth coverage of the day’s news.
• To strengthen New Zealanders’ sense of national identity by commissioning more original local content:
Highlights of commissioned local content are outlined above. A breakdown of original local content percentages by genre is outlined in the tables on page 76.
• To encourage households to switch from analogue to digital reception by promoting TVNZ channels on Freeview:
As of April 2011, there were 537,345 Freeview enabled households, equating to an estimated 33.1% of New Zealand homes. This compares to 419,945 homes in June 2010. (Source: Digital Tracker Wave 4 results; Statistics New Zealand estimate of 1.62m households).
The abovementioned awareness and appreciation survey showed the awareness of TVNZ 7 amongst Freeview owners is high at 89%, an increase on 83% in 2010. As mentioned previously, because TVNZ 6 ceased broadcasting on 28 February, prior to the research being conducted, only TVNZ 7 was measured.
78 TVNZ ANNUAL REPORT FY2011
sTATEmENT OF sERViCE PERFORmANCE (CONTiNUEd)FOR THE YEAR ENDED 30 JUNE 2011
h) Additional goals for each output in FY2011
Crown funded outputsFY2011 Actual Target
FY2010 Actual
a) Contestable programme funding from NZ On Air
694.0 hrs
Minimum 320 hrs per annum of local programming on TV ONE and TV2 (subject to success of applications for contestable funding)
632.8 hrs
b) Programme funding from Te Mangai Paho 835.5 hrsMinimum 150 hrs per annum of Maori programming on TV ONE and TV2 and replays of Maori programming on TVNZ 6 and TVNZ 7
821.5 hrs
c) Funding for programme captioning from NZ On Air
222.6 hrs per week (average)
Minimum 150 hrs per week of programming captioned on TV ONE, TV2, and TV3
224.2 hrs per week (average)
d) Transmitting TVNZ programmes to Pacific Nations
1088 hrsMinimum 572 hrs per annum of programming transmitted to the Pacific
877 hrs
e) Maintaining non-commercial transmission coverage
100%Minimum 100% response to reported breakdowns in transmission within seven days (subject to winter weather constraints)
100%
f) Funding for TVNZ’s two digital channels 62% Minimum 60% local content on TVNZ 6 62%
76%
Minimum 70% local content on TVNZ 7 (until 28 February 2011).
Minimum 55% local content on TVNZ 7 (from 1 March 2011)
78%
79TVNZ ANNUAL REPORT FY2011
REPORT OF ThE AUdiTOR-gENERAL
To the readers of Television New Zealand Limited and Group’s financial statements and statement of service performance For the year ended 30 June 2011The Auditor-General is the auditor of Television New Zealand Limited (the Company) and Group. The Auditor-General has appointed me, Brent Penrose, using the staff and resources of Ernst & Young, to carry out the audit of the financial statements and statement of service performance of the Company and Group on her behalf.
We have audited:
- the financial statements of the Company and Group on pages 36 to 68, that comprise the statement of financial position as at 30 June 2011, the statement of comprehensive income, statement of changes in equity and statement of cash flows for the year ended on that date and notes to the financial statements that include accounting policies and other explanatory information; and
- the statement of service performance of the Company and Group on pages 69 to 78.
Opinion on the financial statements and statement of service performanceIn our opinion:
- the financial statements of the Company and Group on pages 36 to 68: - comply with generally accepted accounting practice in New Zealand; - comply with International Financial Reporting Standards; and - give a true and fair view of the Company and Group’s: - financial position as at 30 June 2011; and - financial performance and cash flows for the year ended on that date.
- the statement of service performance of the Company and Group on pages 69 to 78: - complies with generally accepted accounting practice in New Zealand; and - gives a true and fair view of, for each class of outputs for the year ended 30 June 2011, the Company and Group’s: - service performance compared with the forecasts in the statement of forecast service performance at the start of the financial year; and - actual revenue and output expenses compared with the forecasts in the statement of forecast service performance at the start of the financial year.
Opinion on other legal requirementsIn accordance with the Financial Reporting Act 1993 we report that, in our opinion, proper accounting records have been kept by the Company and Group as far as appears from an examination of those records.
Our audit was completed on 29 September 2011. This is the date at which our opinion is expressed.
The basis of our opinion is explained below. In addition, we outline the responsibilities of the Board of Directors and our responsibilities, and we explain our independence.
Basis of opinionWe carried out our audit in accordance with the Auditor-General’s Auditing Standards, which incorporate the International Standards on Auditing (New Zealand). Those standards require that we comply with ethical requirements and plan and carry out our audit to obtain reasonable assurance about whether the financial statements and statement of service performance are free from material misstatement.
Material misstatements are differences or omissions of amounts and disclosures that would affect a reader’s overall understanding of the financial statements and statement of service performance. If we had found material misstatements that were not corrected, we would have referred to them in our opinion.
An audit involves carrying out procedures to obtain audit evidence about the amounts and disclosures in the financial statements and statement of service performance. The procedures selected depend on our judgement, including our assessment of risks of material misstatement of the financial statements and statement of service performance, whether due to fraud or error. In making those risk assessments, we consider internal control relevant to the Company and Group’s preparation of the financial statements and statement of service performance that give a true and fair view of the matters to which they relate. We consider internal control in order to design audit procedures that are appropriate in the circumstances but not for the purpose of expressing an opinion on the effectiveness of the Company and Group’s internal control.
An audit also involves evaluating:
- the appropriateness of accounting policies used and whether they have been consistently applied; - the reasonableness of the significant accounting estimates and judgements made by the Board of Directors; - the adequacy of all disclosures in the financial statements and statement of service performance; and - the overall presentation of the financial statements and statement of service performance.
80 TVNZ ANNUAL REPORT FY2011
We did not examine every transaction, nor do we guarantee complete accuracy of the financial statements and statement of service performance. In accordance with the Financial Reporting Act 1993 we report that we have obtained all the information and explanations we have required. We believe we have obtained sufficient and appropriate audit evidence to provide a basis for our audit opinion.
Responsibilities of the Board of DirectorsThe Board of Directors is responsible for preparing financial statements and a statement of service performance that:
- comply with generally accepted accounting practice in New Zealand; - give a true and fair view of the Company and Group’s financial position, financial performance and cash flows; and - give a true and fair view of the Company and Group’s service performance.
The Board of Directors is also responsible for such internal control as is determined necessary to enable the preparation of financial statements and a statement of service performance that are free from material misstatement, whether due to fraud or error.
The Board of Directors’ responsibilities arise from the Crown Entities Act 2004, the Financial Reporting Act 1993 and the Television New Zealand Act 2003.
Responsibilities of the AuditorWe are responsible for expressing an independent opinion on the financial statements and statement of service performance and reporting that opinion to you based on our audit. Our responsibility arises from section 15 of the Public Audit Act 2001 and the Crown Entities Act 2004.
independenceWhen carrying out the audit, we followed the independence requirements of the Auditor-General, which incorporate the independence requirements of the New Zealand Institute of Chartered Accountants.
In addition to the audit, we have carried out other assurance assignments for the Company and the Group, which are compatible with those independence requirements.
Other than the audit and the other assurance assignments, the firm has no other relationships with, or interest in, Television New Zealand Limited or any of its subsidiaries.
matters relating to the electronic presentation of the audited financial statements and non-financial performance information / statement of service performance
This audit report relates to the financial statements and non-financial performance information / statement of service performance of Television New Zealand Limited and Group for the year ended 30 June 2011 included on the Company’s website. The company’s Board of Directors is responsible for the maintenance and integrity of Company’s website. We have not been engaged to report on the integrity of company’s website. We accept no responsibility for any changes that may have occurred to the financial statements and non-financial performance information / statement of service performance since they were initially presented on the website.
The audit report refers only to the financial statements and non-financial performance information / statement of service performance named above. It does not provide an opinion on any other information which may have been hyperlinked to or from the financial statements and non-financial performance information / statement of service performance. If readers of this report are concerned with the inherent risks arising from electronic data communication they should refer to the published hard copy of the audited financial statements and non-financial performance information / statement of service performance as well as the related audit report dated 29 September 2011 to confirm the information included in the audited financial statements and non-financial performance information / statement of service performance presented on this website.
Legislation in New Zealand governing the preparation and dissemination of financial information may differ from legislation in other jurisdictions.
Brent Penrose Ernst & YoungOn behalf of the Auditor-GeneralAuckland, New Zealand
REPORT OF ThE AUdiTOR-gENERAL (CONTiNUEd)
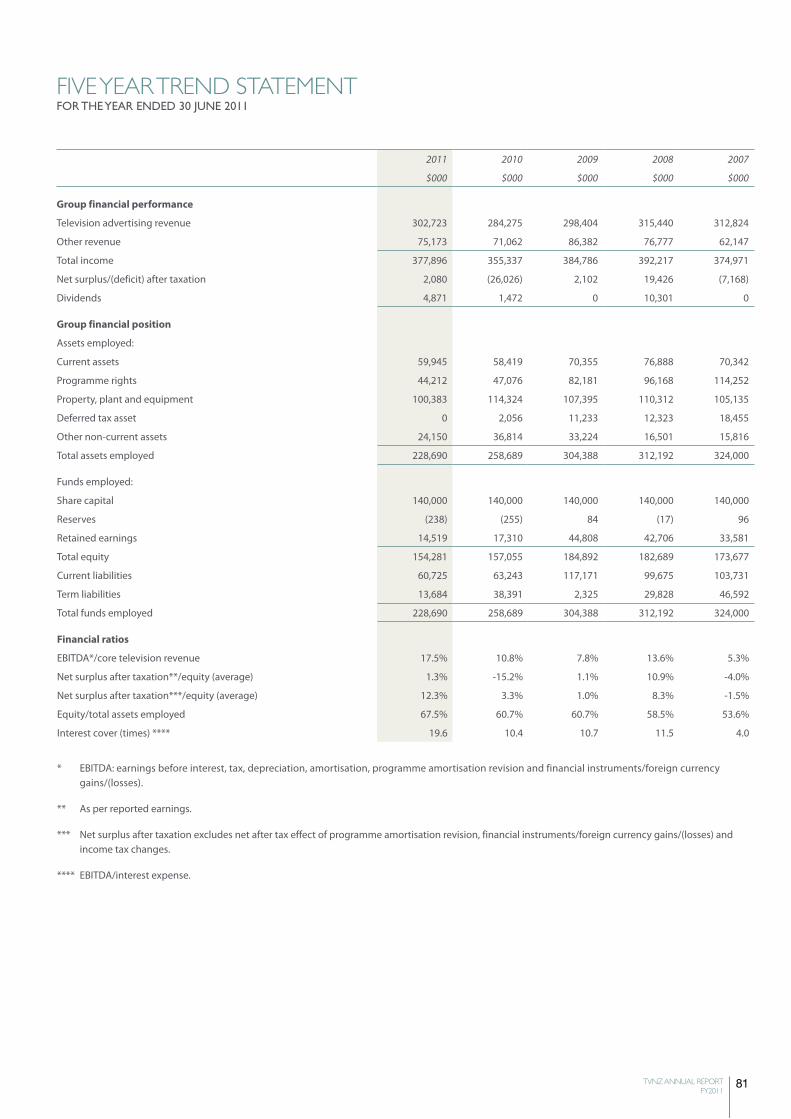
81TVNZ ANNUAL REPORT FY2011
FiVE YEAR TRENd sTATEmENTFOR THE YEAR ENDED 30 JUNE 2011
2011 2010 2009 2008 2007
$000 $000 $000 $000 $000
Group financial performance
Television advertising revenue 302,723 284,275 298,404 315,440 312,824
Other revenue 75,173 71,062 86,382 76,777 62,147
Total income 377,896 355,337 384,786 392,217 374,971
Net surplus/(deficit) after taxation 2,080 (26,026) 2,102 19,426 (7,168)
Dividends 4,871 1,472 0 10,301 0
Group financial position
Assets employed:
Current assets 59,945 58,419 70,355 76,888 70,342
Programme rights 44,212 47,076 82,181 96,168 114,252
Property, plant and equipment 100,383 114,324 107,395 110,312 105,135
Deferred tax asset 0 2,056 11,233 12,323 18,455
Other non-current assets 24,150 36,814 33,224 16,501 15,816
Total assets employed 228,690 258,689 304,388 312,192 324,000
Funds employed:
Share capital 140,000 140,000 140,000 140,000 140,000
Reserves (238) (255) 84 (17) 96
Retained earnings 14,519 17,310 44,808 42,706 33,581
Total equity 154,281 157,055 184,892 182,689 173,677
Current liabilities 60,725 63,243 117,171 99,675 103,731
Term liabilities 13,684 38,391 2,325 29,828 46,592
Total funds employed 228,690 258,689 304,388 312,192 324,000
Financial ratios
EBITDA*/core television revenue 17.5% 10.8% 7.8% 13.6% 5.3%
Net surplus after taxation**/equity (average) 1.3% -15.2% 1.1% 10.9% -4.0%
Net surplus after taxation***/equity (average) 12.3% 3.3% 1.0% 8.3% -1.5%
Equity/total assets employed 67.5% 60.7% 60.7% 58.5% 53.6%
Interest cover (times) **** 19.6 10.4 10.7 11.5 4.0
* EBITDA: earnings before interest, tax, depreciation, amortisation, programme amortisation revision and financial instruments/foreign currency gains/(losses).
** As per reported earnings.
*** Net surplus after taxation excludes net after tax effect of programme amortisation revision, financial instruments/foreign currency gains/(losses) and income tax changes.
**** EBITDA/interest expense.
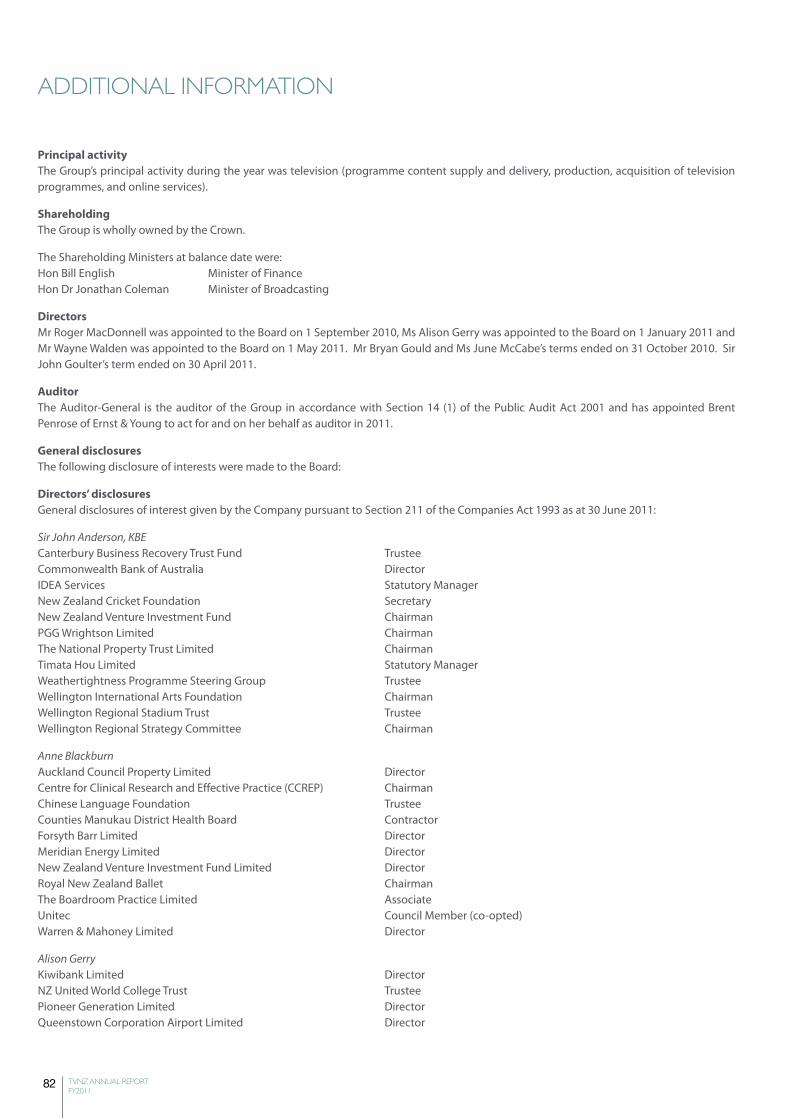
82 TVNZ ANNUAL REPORT FY2011
AddiTiONAL iNFORmATiON
Principal activityThe Group’s principal activity during the year was television (programme content supply and delivery, production, acquisition of television programmes, and online services).
ShareholdingThe Group is wholly owned by the Crown.
The Shareholding Ministers at balance date were:Hon Bill English Minister of FinanceHon Dr Jonathan Coleman Minister of Broadcasting
DirectorsMr Roger MacDonnell was appointed to the Board on 1 September 2010, Ms Alison Gerry was appointed to the Board on 1 January 2011 and Mr Wayne Walden was appointed to the Board on 1 May 2011. Mr Bryan Gould and Ms June McCabe’s terms ended on 31 October 2010. Sir John Goulter’s term ended on 30 April 2011.
AuditorThe Auditor-General is the auditor of the Group in accordance with Section 14 (1) of the Public Audit Act 2001 and has appointed Brent Penrose of Ernst & Young to act for and on her behalf as auditor in 2011.
General disclosuresThe following disclosure of interests were made to the Board:
Directors’ disclosuresGeneral disclosures of interest given by the Company pursuant to Section 211 of the Companies Act 1993 as at 30 June 2011:
Sir John Anderson, KBECanterbury Business Recovery Trust Fund TrusteeCommonwealth Bank of Australia DirectorIDEA Services Statutory ManagerNew Zealand Cricket Foundation SecretaryNew Zealand Venture Investment Fund ChairmanPGG Wrightson Limited ChairmanThe National Property Trust Limited ChairmanTimata Hou Limited Statutory ManagerWeathertightness Programme Steering Group TrusteeWellington International Arts Foundation ChairmanWellington Regional Stadium Trust TrusteeWellington Regional Strategy Committee Chairman
Anne BlackburnAuckland Council Property Limited DirectorCentre for Clinical Research and Effective Practice (CCREP) ChairmanChinese Language Foundation TrusteeCounties Manukau District Health Board ContractorForsyth Barr Limited DirectorMeridian Energy Limited DirectorNew Zealand Venture Investment Fund Limited DirectorRoyal New Zealand Ballet ChairmanThe Boardroom Practice Limited AssociateUnitec Council Member (co-opted)Warren & Mahoney Limited Director
Alison GerryKiwibank Limited DirectorNZ United World College Trust TrusteePioneer Generation Limited DirectorQueenstown Corporation Airport Limited Director
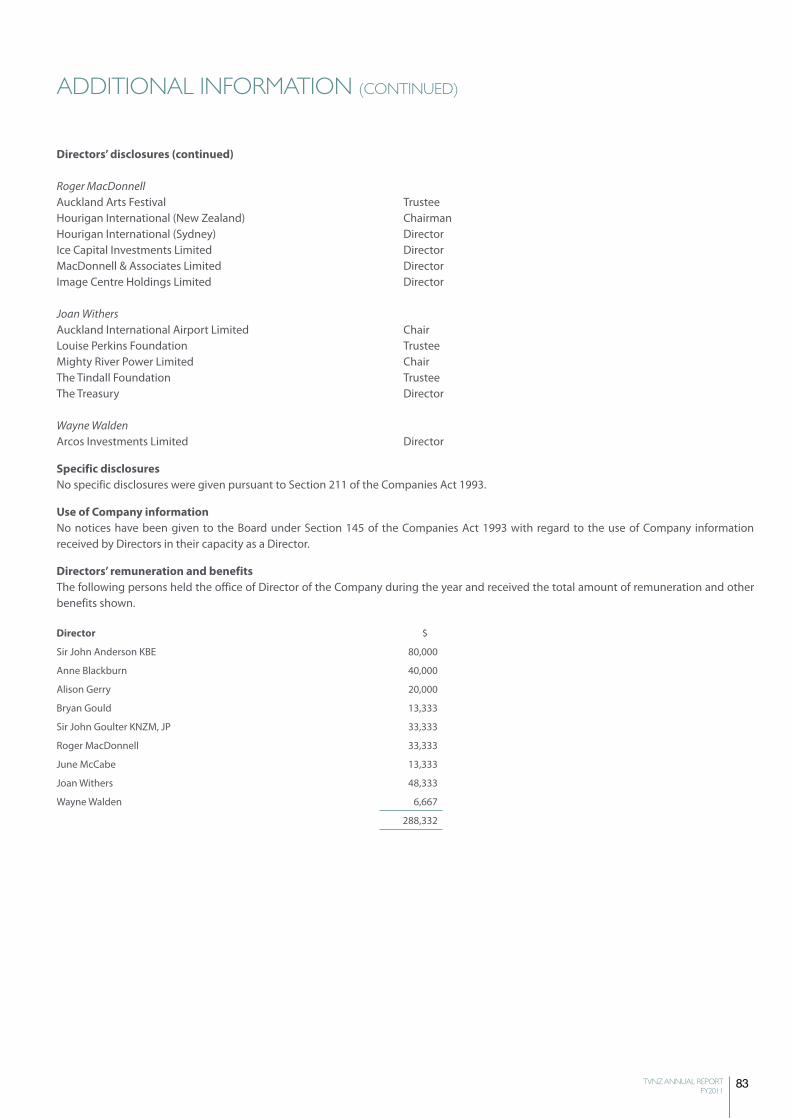
83TVNZ ANNUAL REPORT FY2011
AddiTiONAL iNFORmATiON (CONTiNUEd)
Directors’ disclosures (continued)
Roger MacDonnellAuckland Arts Festival TrusteeHourigan International (New Zealand) ChairmanHourigan International (Sydney) DirectorIce Capital Investments Limited DirectorMacDonnell & Associates Limited DirectorImage Centre Holdings Limited Director
Joan WithersAuckland International Airport Limited ChairLouise Perkins Foundation TrusteeMighty River Power Limited ChairThe Tindall Foundation TrusteeThe Treasury Director
Wayne WaldenArcos Investments Limited Director
Specific disclosuresNo specific disclosures were given pursuant to Section 211 of the Companies Act 1993.
use of Company informationNo notices have been given to the Board under Section 145 of the Companies Act 1993 with regard to the use of Company information received by Directors in their capacity as a Director.
Directors’ remuneration and benefitsThe following persons held the office of Director of the Company during the year and received the total amount of remuneration and other benefits shown.
Director $
Sir John Anderson KBE 80,000
Anne Blackburn 40,000
Alison Gerry 20,000
Bryan Gould 13,333
Sir John Goulter KNZM, JP 33,333
Roger MacDonnell 33,333
June McCabe 13,333
Joan Withers 48,333
Wayne Walden 6,667
288,332
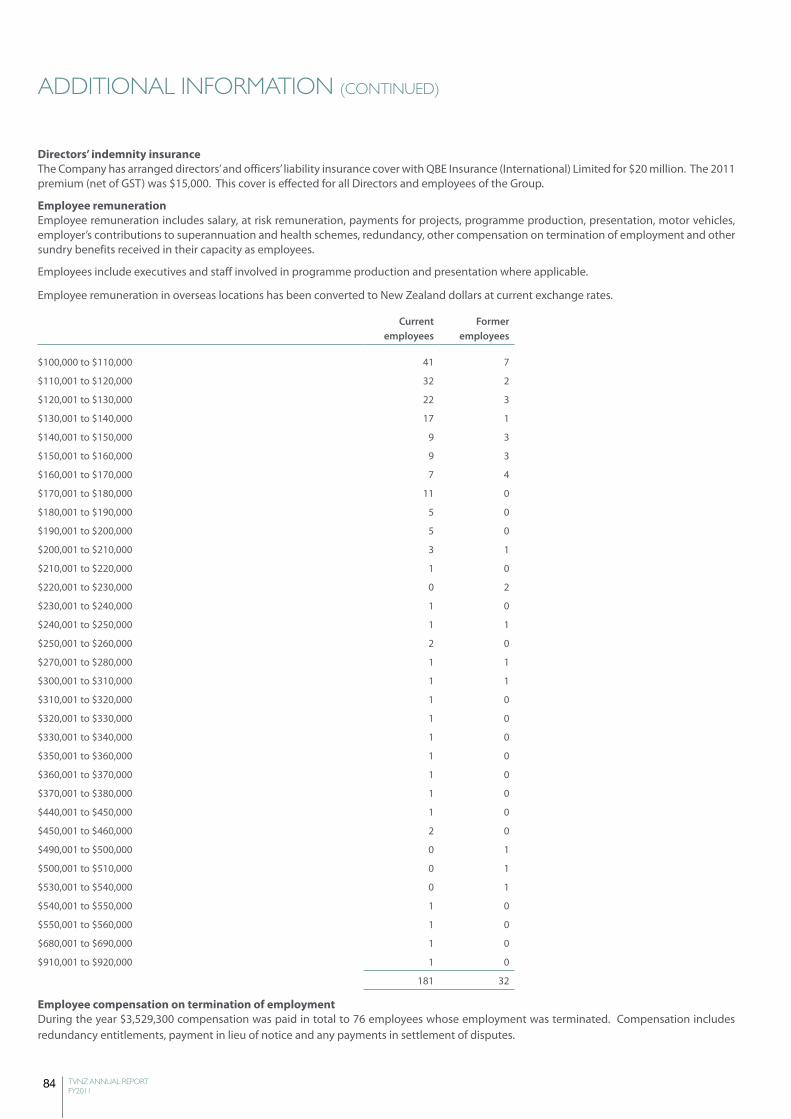
84 TVNZ ANNUAL REPORT FY2011
AddiTiONAL iNFORmATiON (CONTiNUEd)
Directors’ indemnity insuranceThe Company has arranged directors’ and officers’ liability insurance cover with QBE Insurance (International) Limited for $20 million. The 2011 premium (net of GST) was $15,000. This cover is effected for all Directors and employees of the Group.
Employee remunerationEmployee remuneration includes salary, at risk remuneration, payments for projects, programme production, presentation, motor vehicles, employer’s contributions to superannuation and health schemes, redundancy, other compensation on termination of employment and other sundry benefits received in their capacity as employees.
Employees include executives and staff involved in programme production and presentation where applicable.
Employee remuneration in overseas locations has been converted to New Zealand dollars at current exchange rates.
Current employees
Former employees
$100,000 to $110,000 41 7
$110,001 to $120,000 32 2
$120,001 to $130,000 22 3
$130,001 to $140,000 17 1
$140,001 to $150,000 9 3
$150,001 to $160,000 9 3
$160,001 to $170,000 7 4
$170,001 to $180,000 11 0
$180,001 to $190,000 5 0
$190,001 to $200,000 5 0
$200,001 to $210,000 3 1
$210,001 to $220,000 1 0
$220,001 to $230,000 0 2
$230,001 to $240,000 1 0
$240,001 to $250,000 1 1
$250,001 to $260,000 2 0
$270,001 to $280,000 1 1
$300,001 to $310,000 1 1
$310,001 to $320,000 1 0
$320,001 to $330,000 1 0
$330,001 to $340,000 1 0
$350,001 to $360,000 1 0
$360,001 to $370,000 1 0
$370,001 to $380,000 1 0
$440,001 to $450,000 1 0
$450,001 to $460,000 2 0
$490,001 to $500,000 0 1
$500,001 to $510,000 0 1
$530,001 to $540,000 0 1
$540,001 to $550,000 1 0
$550,001 to $560,000 1 0
$680,001 to $690,000 1 0
$910,001 to $920,000 1 0
181 32
Employee compensation on termination of employmentDuring the year $3,529,300 compensation was paid in total to 76 employees whose employment was terminated. Compensation includes redundancy entitlements, payment in lieu of notice and any payments in settlement of disputes.
CORPORATE gOVERNANCE
THE BOARD Role of the Board In addition to its duties under the Companies Act 1993, the Board, under Section 92 of the Crown Entities Act 2004, must ensure that the Company acts in a manner consistent with its current Statement of Intent and current output agreement.
Each year the Board negotiates the Statement of Intent with its shareholding Ministers. It includes the Company’s objectives, nature and scope of the activities to be undertaken and the performance targets and other measures by which its performance may be judged for the current year and following two years. The Board monitors management’s performance relative to these objectives and targets.
TVNZ’s principal output agreement with the Crown relates to the provision of funding for programming broadcast in accordance with the Company’s Charter. The Board monitors compliance with the Company’s obligations under that agreement.
The full Board met formally 10 times during the financial year. The Board has delegated day-to-day management to the Chief Executive Officer. Policies are in place that define the individual and collective responsibilities of the Board and management. In particular, the Board has approved specific delegated authorities to enable management to incur expenditure and create binding obligations.
Appointment of Directors Shareholding Ministers make all appointments to the Board, including that of the Chairman. Appointments are for fixed terms not exceeding three years, which may be renewed.
The Board comprises individuals with a wide range of experiences and skills to ensure that all governance responsibilities are completed in a manner consistent with best possible management practice. Profiles of each of the Directors who served during the year are set out on page 86 of this report.
Board Committees The Board has two standing committees:
Audit and Risk Committee The Audit and Risk Committee met three times during the year.
The Committee assists the Board in fulfilling its responsibilities by providing recommendations, counsel and information concerning its accounting and reporting responsibilities under the Companies Act 1993 and related legislation, and evaluating risk management practices.
At year end, membership of the Committee comprised all the members of the Board. Sir John Goulter was Chair of this Committee until 30 April 2011, and Alison Gerry assumed the role from 1 May 2011.
Remuneration and HR CommitteeThe Remuneration and HR Committee met once during the year. Its work is consistent with TVNZ’s obligations to be a good employer under the Crown Entities Act 2004.
In addition to its role of adding value to TVNZ Human Resources’ plans and practices at a strategic level, the Committee approves any movement to the remuneration of the Company’s senior
executives and presenters. The Committee also approves the level of any ‘at risk’ payments to be awarded to executives, based on the Company’s business performance.
TVNZ operates a remuneration system designed to ensure that employees are rewarded for individual performance, for the responsibilities and skills required in their jobs, benchmarked against both external and internal relativities.
At year end, membership of the Committee comprised all the members of the Board. The Chair of this Committee is Anne Blackburn.
KEY GOVERNANCE STATEmENTS Business continuity, insurance and risk management TVNZ has developed business continuity plans for use in any emergency situation facing the Company.
TVNZ maintains a number of insurance policies designed to support the philosophy that, in the event of a disaster, the Company would not be materially affected.
The Company has in place policies and procedures to identify and manage risks. Exposure to foreign exchange and interest rate risk is managed in accordance with a comprehensive Board-approved treasury policy, which sets limits of management authority. Derivative instruments are used by the Company to manage specific business risk; they are not used for speculative purposes.
Editorial independence TVNZ has in place an editorial protocol that details the duties and responsibilities of TVNZ, its Board and its executives on editorial matters. The principle of editorial independence recognises the importance of isolating control of editorial content from commercial or political influence. This principle is reflected in the Television New Zealand Act 2003 and the Company’s Statement of Intent.
External auditor The Auditor-General is the Company’s auditor pursuant to Section 14 of the Public Audit Act 2001. The Auditor-General has appointed Mr Brent Penrose of Ernst & Young to act as external auditor on her behalf in the current financial year.
legislative compliance The Company has in place a legislative compliance programme to ensure the Company’s compliance with its various statutory obligations. A biannual review is undertaken, the results of which are reported to the Audit and Risk Committee.
Occupational safety and health TVNZ’s health and safety policy is to promote excellence in health, safety and welfare by implementing best practice health and safety systems while seeking continuous improvement.
PROGRAmmE STANDARDS The Broadcasting Act 1989 places an obligation on the Company for the broadcasting of programmes to comply with the requirements of that Act and with programme codes approved by the Broadcasting Standards Authority. TVNZ as a broadcaster is required to receive and consider formal complaints and to have procedures for investigating them.
85TVNZ ANNUAL REPORT FY2011
86 TVNZ ANNUAL REPORT FY2011
diRECTORs’ PROFiLEs
SiR JOHN ANDERSON KBE, CHAiRmAN (WElliNGTON) Sir John is currently Chairman of the New Zealand Venture Investment Fund, the Wellington Regional Strategy Committee, PGG Wrightson Limited and NPT Limited. He serves as a director on the board of the Commonwealth Bank of Australia and is also a trustee on the Wellington Regional Stadium Trust and the Canterbury Business Recovery Trust Fund.
Sir John was formerly Chief Executive of the ANZ National Bank until his retirement in 2005, former Chairman of New Zealand Cricket and New Zealand’s representative director on the ICC, positions he held from 1995 until 2008, and former Chairman of the New Zealand Sports Foundation.
He held advisory and governance roles for successive governments through the 1980s and 1990s and received the 1990 Commemoration Medal for Services to New Zealand and was knighted in 1994. In 1995 Sir John was awarded NBR New Zealander of the Year, in 2003 he received the Deloitte Top 200 Company Award as New Zealand’s Most Visionary Leader, in 2005 he was the inaugural winner of the Blake Medal for leadership contributions to New Zealand and in 2010 he was the recipient of a Halberg Award for Leadership in Excellence in Sport.
JOAN WiTHERS, DEPuTY CHAiRmAN (AuCKlAND)Joan Withers was the Chief Executive Officer of the Radio Network in 1997 when she began her career as a professional company director serving on the boards of a number of New Zealand’s largest companies. In 2005 she was appointed Chief Executive of newspaper publishing company Fairfax Media. She retired from executive life in 2009, but is now Chair of Mighty River Power, Chair of Auckland International Airport and a director on the advisory board of the Treasury. Joan has an MBA from the University of Auckland. In 2009 she received the CAANZ Media Excellence Award. She is a trustee of the Tindall Foundation, the Louise Perkins Trust and Pure Advantage.
ANNE BlACKBuRN (AuCKlAND)Anne Blackburn is a banker by professional background, having had earlier careers in journalism and diplomacy. She is currently a director of a number of businesses in the infrastructure, finance, investment and research sectors. She also holds governance positions in arts and education not-for-profit organisations.
AliSON GERRY (QuEENSTOWN)Alison Gerry has over 20 years experience working in finance and treasury for both corporates and financial institutions. From 1999 to 2005 Alison was Group Treasurer for Lion Nathan, based in Sydney. Prior to that, she worked for various financial institutions in Sydney, Hong Hong, Tokyo and London in trading, finance and risk roles. Alison has been a visiting fellow at Macquarie University for 12 years and is currently a director of Kiwibank and Queenstown Airport. She was appointed to the TVNZ Board in January 2011. Alison has a Masters of Applied Finance from Macquarie University.
BRYAN GOulD CNZm (OPOTiKi)Bryan Gould was born and educated in New Zealand before winning a Rhodes Scholarship to Oxford, where he gained a postgraduate law degree. He was the Vice-Chancellor of Waikato University for 10 years. He previously served in the UK’s Labour Shadow Cabinet, was a law don at Oxford and spent a number of years in the British Foreign Office. He was also a presenter and
reporter on Thames Television’s former current affairs programme TV Eye. Bryan completed his six year term of office with the TVNZ board at the end of October 2010.
SiR JOHN GOulTER KNZm, JP (PAiHiA)Sir John is the former Managing Director of Auckland International Airport Limited. He is a former Chairman of the New Zealand Lotteries Commission and United Carriers Group Limited, as well as being a former director of the Reserve Bank of New Zealand. He is currently Chairman of Ngapuhi Asset Holding Company Limited, Northland Deepwater GP Limited and the New Zealand Business and Parliament Trust. In 2003 he was inducted as a laureate into the New Zealand Business Hall of Fame and was appointed a Distinguished Companion of the New Zealand Order of Merit for services to business and the community. In 2009 his re-designation as a Knight Companion of the New Zealand Order of Merit was approved by Her Majesty the Queen. Sir John completed his six year term of office with the TVNZ Board in April 2011.
ROGER mACDONNEll (AuCKlAND) Roger was a founding partner of Colenso BBDO and retired at the end of 2009 as Chairman and CEO and as a director of the Clemenger group in Australia. He is currently a director of the Image Centre, a director of Hourigan International, Sydney, a trustee of the Auckland Arts Festival and consults on branding and marketing. He has been voted into the AdMedia Hall of Fame and is a member of the Clio Copywriters Hall of Fame in New York. Roger was appointed to the TVNZ Board in November 2010.
JuNE mcCABE (AuCKlAND) June McCabe is an Auckland-based director and was formerly with Westpac Banking Corporation. Her career spans both the public and private sector with extensive experience in policy-making, banking and finance. Her governance roles cover a range of sectors including health, education, finance and investment, plus private and not-for-profit enterprises. June completed her six year term of office with the TVNZ Board in October 2010.
WAYNE WAlDEN ONZm (AuCKlAND) Wayne Walden is a successful businessman with an active interest in youth development and environmental issues. He is affiliated to Ngati Kahu of Tai Tokerau. Wayne is an experienced company director, and was previously Managing Director and shareholder of Farmers/Deka Ltd. He has more than 30 years senior management experience in the liquor, wholesale and retail trades. Past directorships include director of Farmlands Co-Operative Society, Westpac Bank New Zealand Advisory Board, Mighty River Power Limited, Deputy Chairman of Meat New Zealand, Chairman of Tranzrail and Chair of Maori Television. Wayne is the founding Chairman of the Project K Youth Development Programme and founder of the Guardians of the Kaipara. Wayne was made an Officer of the New Zealand Order of Merit for services to business and the community in the 2007 Queen’s Birthday Honours List. He was appointed to the TVNZ Board in May 2011.
87TVNZ ANNUAL REPORT FY2011
AuCKlAND Registered office Television Centre 100 Victoria Street West Auckland 1010 PO Box 3819 Auckland 1140 Tel: 64 9 916 7000 Fax: 64 9 916 7934 tvnz.co.nz
HAmilTON Sales 533 Anglesea Street Hamilton 3204 PO Box 889 Hamilton 3240 Tel: 64 7 957 6300 Fax: 64 7 957 6311
ROTORuA News 5th Floor, Hinemoa Tower 1154 Hinemoa Street Rotorua 3010 PO Box 944 Rotorua 3040 Tel: 64 7 350 2540 Fax: 64 7 350 2543
WElliNGTON Sales Level 6 Prime Property Tower 86-90 Lambton Quay Wellington 6011 PO Box 1752 Wellington 6140 Tel: 64 4 914 5198 Fax: 64 4 914 5140
News & Current Affairs Level 5 Prime Property Tower 86-90 Lambton Quay Wellington 6011 PO Box 1910 Wellington 6140 Tel: 64 4 914 5000 Fax: 64 4 914 5043
Avalon Studios Percy Cameron Street Lower Hutt 5011 PO Box 31444 Lower Hutt 5040 Tel: 64 4 914 5600 Fax: 64 4 914 5888
New Zealand Television Archive Avalon Studios Percy Cameron Street Wellington 5011 PO Box 31444 Lower Hutt 5040 Tel: 64 4 914 5316 Fax: 64 4 914 5319 email: [email protected]
CHRiSTCHuRCH News & SalesLevel 1112 Wrights RoadAddingtonChristchurch 8024P O Box 1945 Christchurch 8140Tel: 64 3 961 8500Fax: 64 3 961 8555
DuNEDiN News 11 Dowling Street Dunedin 9016 PO Box 1070 Dunedin 9054 Tel: 64 3 474 2880 Fax: 64 3 474 2885
SYDNEY News C/- ABC News Level 4, 700 Harris Street Ultimo, NSW 2001AustraliaTel: 61 2 8333 4856 Fax: 61 2 8333 4188
lONDON Europe Bureau54 Portland Place London W1B 1DY United Kingdom Tel: 44 20 7079 3241 Fax: 44 20 7079 3243
TVNZ also has news representatives in:
• Queenstown• New Plymouth• Napier• New York
mAiN LOCATiONs

88 TVNZ ANNUAL REPORT FY2011