understanding market liquidity and funding liquidity...understanding market liquidity and funding...
TRANSCRIPT
Understanding Market Liquidity and Funding Liquidity
CFF-AP2 Conference “Credit Markets in Transition”
Lasse Heje Pedersen
Copenhagen Business School, NYU, CEPR, NBER, and
AQR Capital Management
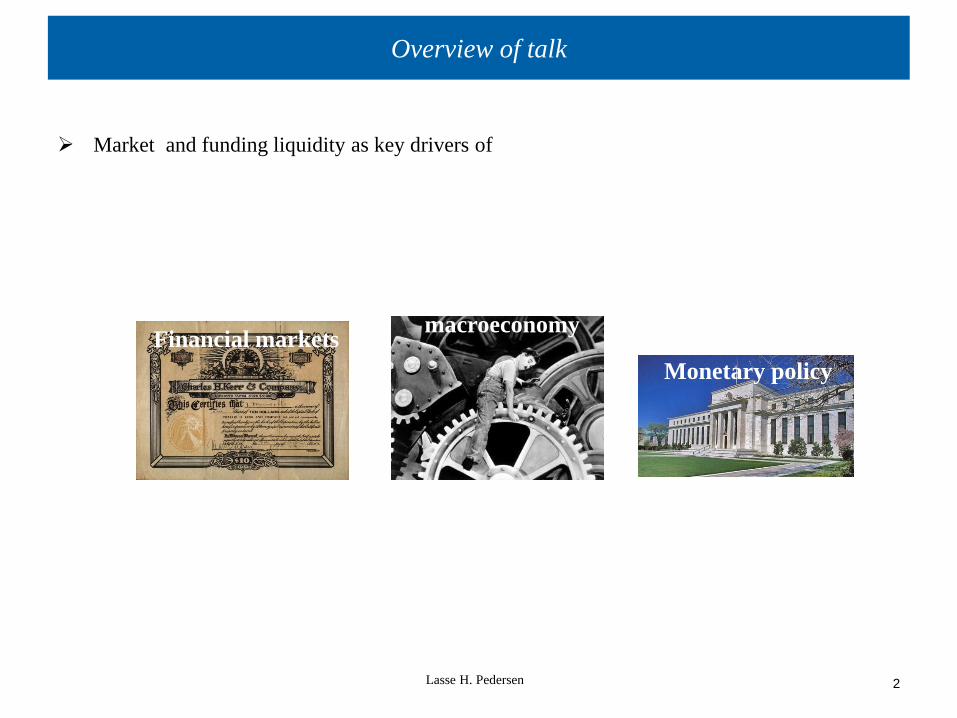
Overview of talk
Market and funding liquidity as key drivers of
Lasse H. Pedersen
2
macroeconomy
Monetary policy
Financial markets

Classic Principles Finance and Economics vs. Liquidity Risk Theories
Lasse H. Pedersen
3
Principles of Classic Finance and Economics
Modigliani-Miller irrelevance of capital structure
Two Fund Separation (portfolios of MKT and Rf)
CAPM: expected return proportional to risk
Law of One Price
Never exercise a call option early (Merton’s Rule)
Macro irrelevance of policy and finance
Monetary focus on interest rates (Taylor Rule)
Implications of Liquidity Risk
Capital structure non-neutrality
Portfolio choice driven by funding constraints
Expected return driven by liquidity risks
Law of One Price breaks down
Early exercise happens
Credit cycles and liquidity spirals
Two monetary tools
4
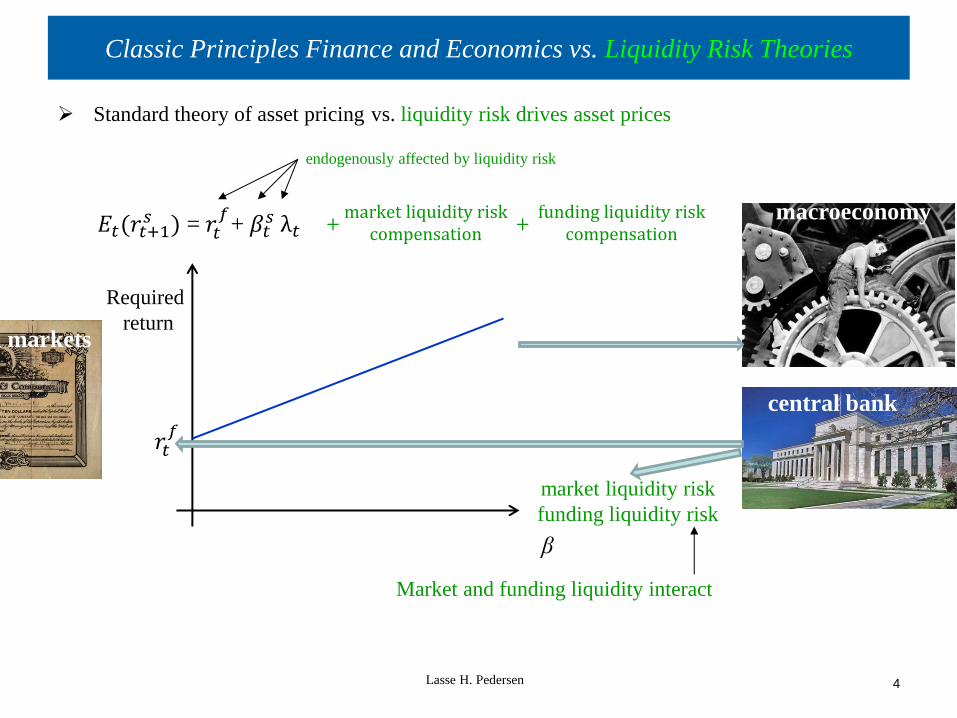
Classic Principles Finance and Economics vs. Liquidity Risk Theories
Standard theory of asset pricing
Required
return
market liquidity risk
funding liquidity risk
endogenously affected by liquidity risk
Lasse H. Pedersen
β
𝐸𝑡(𝑟𝑡+1𝑠 ) = 𝑟𝑡
𝑓+ 𝛽𝑡
𝑠 λ𝑡 + market liquidity risk
compensation +
funding liquidity riskcompensation
vs. liquidity risk drives asset prices
Market and funding liquidity interact
macroeconomy
𝑟𝑡𝑓
central bank
Financial markets

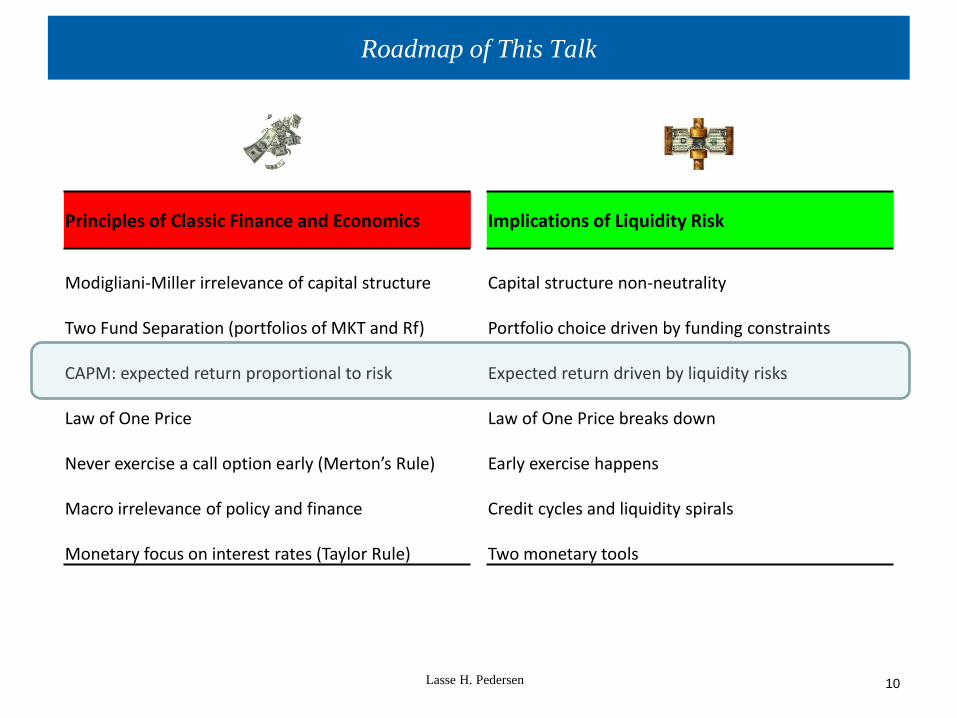
Roadmap of This Talk
Lasse H. Pedersen
5
Principles of Classic Finance and Economics
Modigliani-Miller irrelevance of capital structure
Two Fund Separation (portfolios of MKT and Rf)
CAPM: expected return proportional to risk
Law of One Price
Never exercise a call option early (Merton’s Rule)
Macro irrelevance of policy and finance
Monetary focus on interest rates (Taylor Rule)
Implications of Liquidity Risk
Capital structure non-neutrality
Portfolio choice driven by funding constraints
Expected return driven by liquidity risks
Law of One Price breaks down
Early exercise happens
Credit cycles and liquidity spirals
Two monetary tools
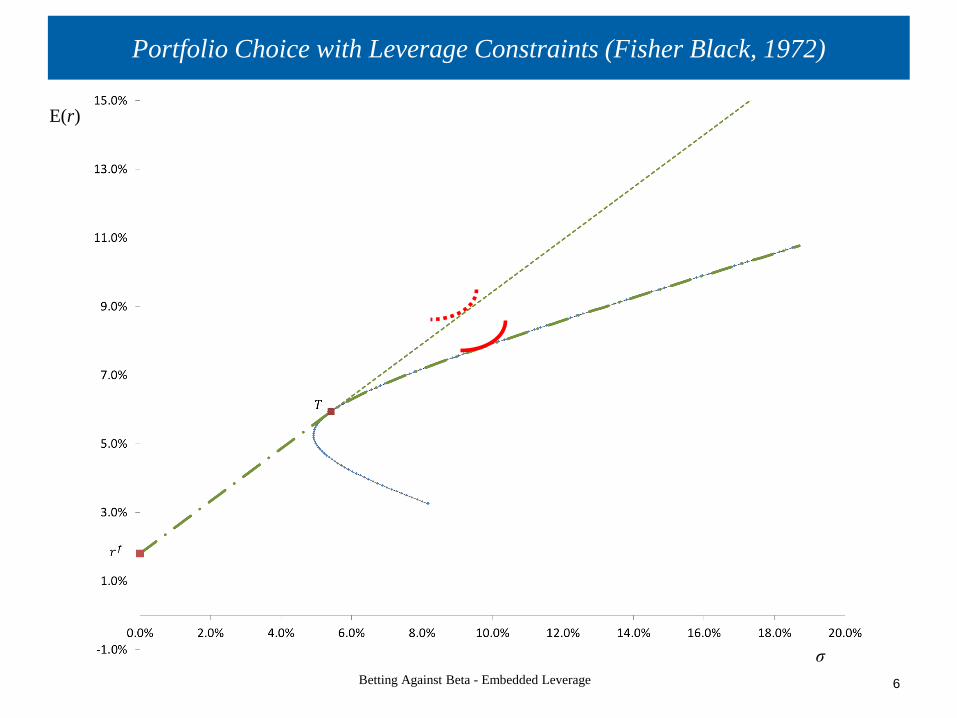
Portfolio Choice with Leverage Constraints (Fisher Black, 1972)
Betting Against Beta - Embedded Leverage
6
E(r)
σ
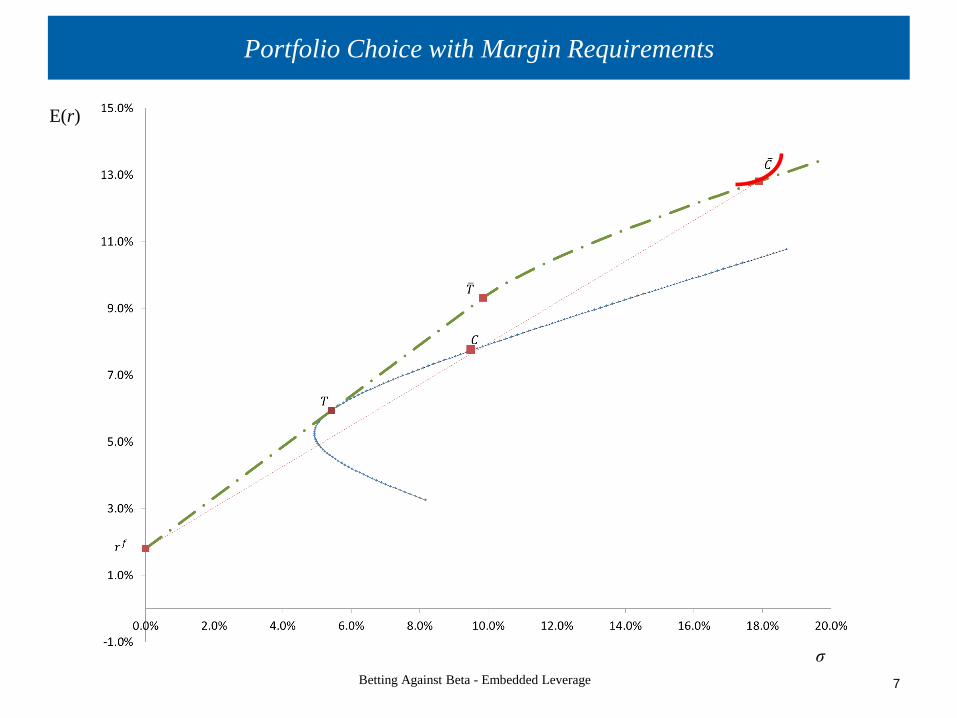
Portfolio Choice with Margin Requirements
Betting Against Beta - Embedded Leverage
7
E(r)
σ
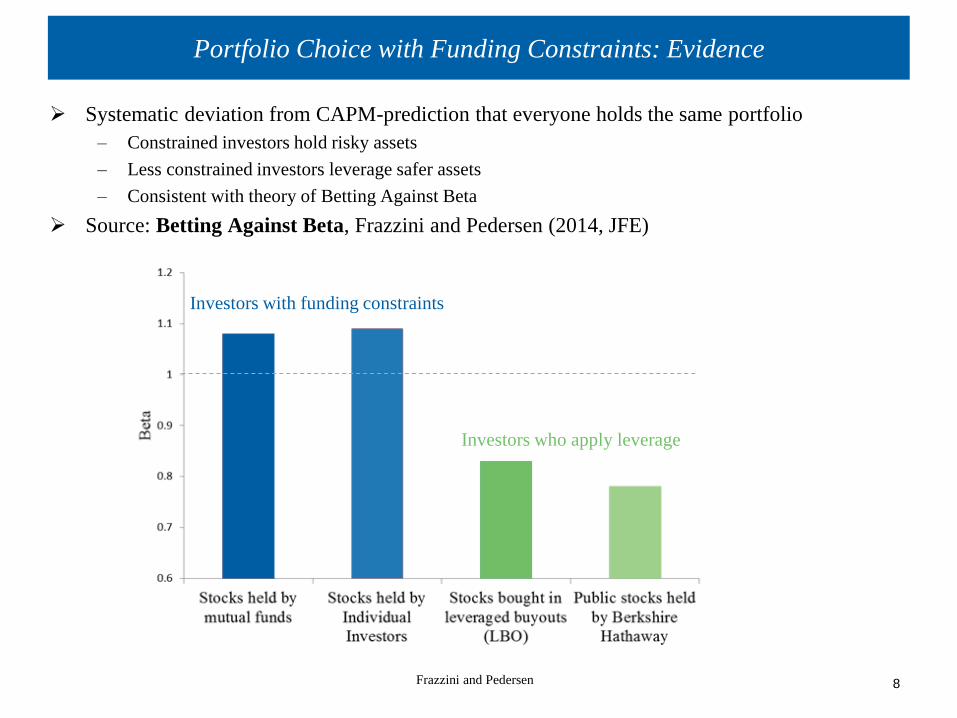
Portfolio Choice with Funding Constraints: Evidence
Systematic deviation from CAPM-prediction that everyone holds the same portfolio
– Constrained investors hold risky assets
– Less constrained investors leverage safer assets
– Consistent with theory of Betting Against Beta
Source: Betting Against Beta, Frazzini and Pedersen (2014, JFE)
Investors with funding constraints
Investors who apply leverage
Frazzini and Pedersen
8
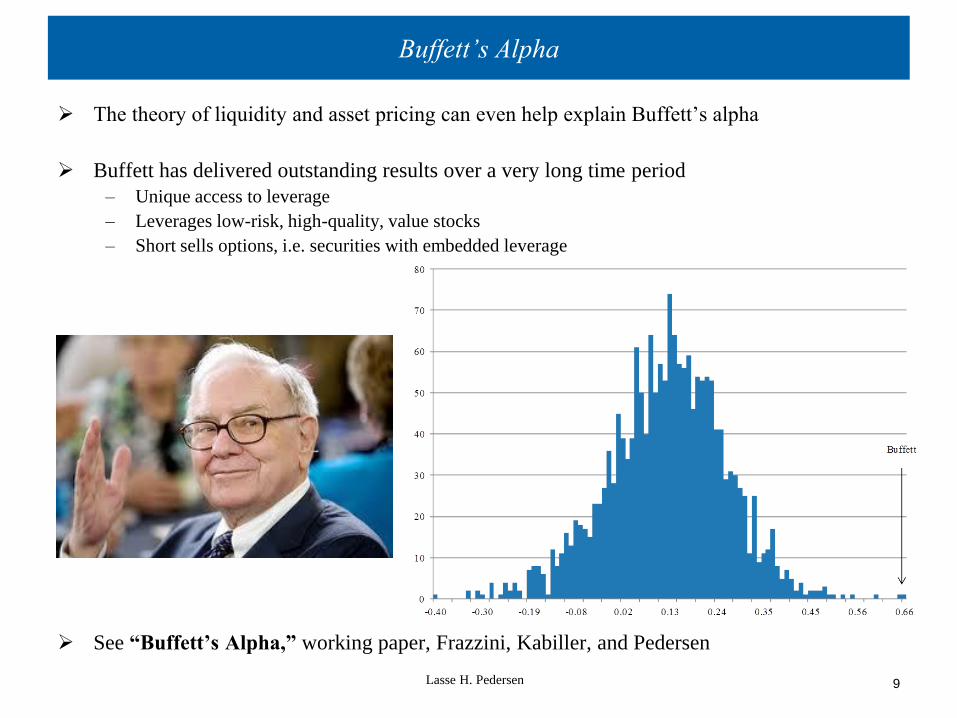
Buffett’s Alpha
The theory of liquidity and asset pricing can even help explain Buffett’s alpha
Buffett has delivered outstanding results over a very long time period
– Unique access to leverage
– Leverages low-risk, high-quality, value stocks
– Short sells options, i.e. securities with embedded leverage
See “Buffett’s Alpha,” working paper, Frazzini, Kabiller, and Pedersen
Lasse H. Pedersen
9
Roadmap of This Talk
Lasse H. Pedersen
10
Principles of Classic Finance and Economics
Modigliani-Miller irrelevance of capital structure
Two Fund Separation (portfolios of MKT and Rf)
CAPM: expected return proportional to risk
Law of One Price
Never exercise a call option early (Merton’s Rule)
Macro irrelevance of policy and finance
Monetary focus on interest rates (Taylor Rule)
Implications of Liquidity Risk
Capital structure non-neutrality
Portfolio choice driven by funding constraints
Expected return driven by liquidity risks
Law of One Price breaks down
Early exercise happens
Credit cycles and liquidity spirals
Two monetary tools

Lasse H. Pedersen
11
Funding Liquidity: Margin CAPM
Proposition. [Garleanu and Pedersen, Prop. 2]
The equilibrium required return for any security s is:
where ψt is the leveraged agents’ Lagrange multiplier, measuring the tightness of funding
constraints, xt is the fraction of constrained agents, mts is the margin requirement of security s,
and λt is the risk premium:
Tests:
1. Find securities with the same fundamental risk β and different margin requirement m.
• Garleanu and Pedersen (2011) “Margin-Based Asset Pricing and Deviations from the Law of One Price”, Ashcraft,
Garleanu, and Pedersen (2010)
2. Find securities with the different fundamental risk β and the same margin requirement m.
• Frazzini and Pedersen (2010, 2011), and Asness, Frazzini, and Pedersen (2011)
1 s f s s
t t t t t t tE r r x m
1
M f
t t t tE r r
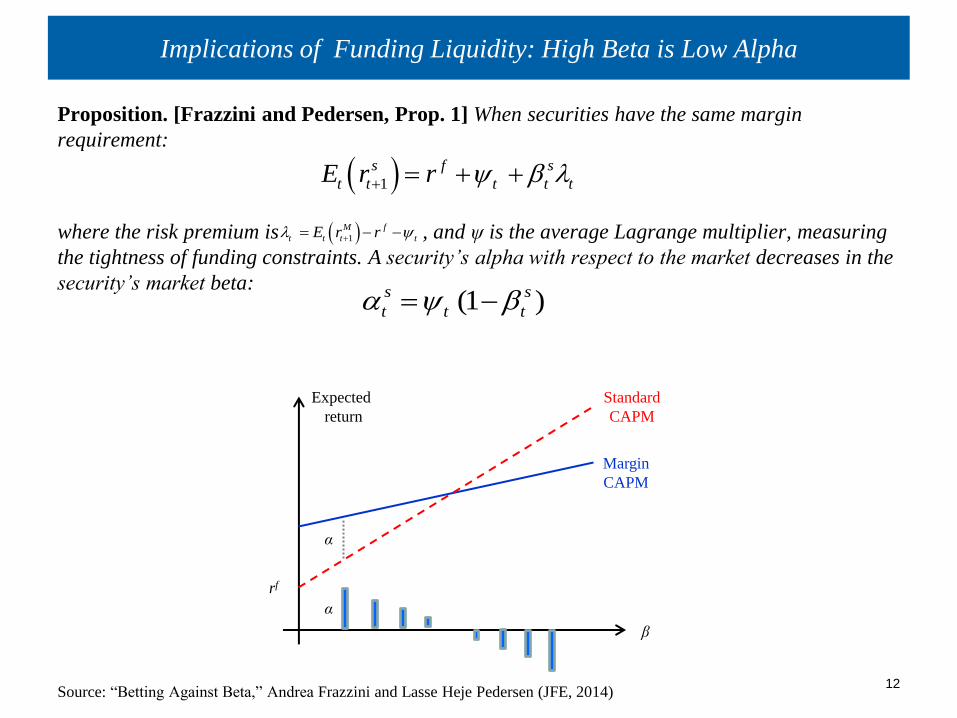
Implications of Funding Liquidity: High Beta is Low Alpha
Proposition. [Frazzini and Pedersen, Prop. 1] When securities have the same margin
requirement:
where the risk premium is , and ψ is the average Lagrange multiplier, measuring
the tightness of funding constraints. A security’s alpha with respect to the market decreases in the
security’s market beta:
Source: “Betting Against Beta,” Andrea Frazzini and Lasse Heje Pedersen (JFE, 2014)
12
1
s f s
t t t t tE r r
1
M f
t t t tE r r
(1 )s s
t t t
Expected
return
β
Standard
CAPM
Margin
CAPM
rf
α
α
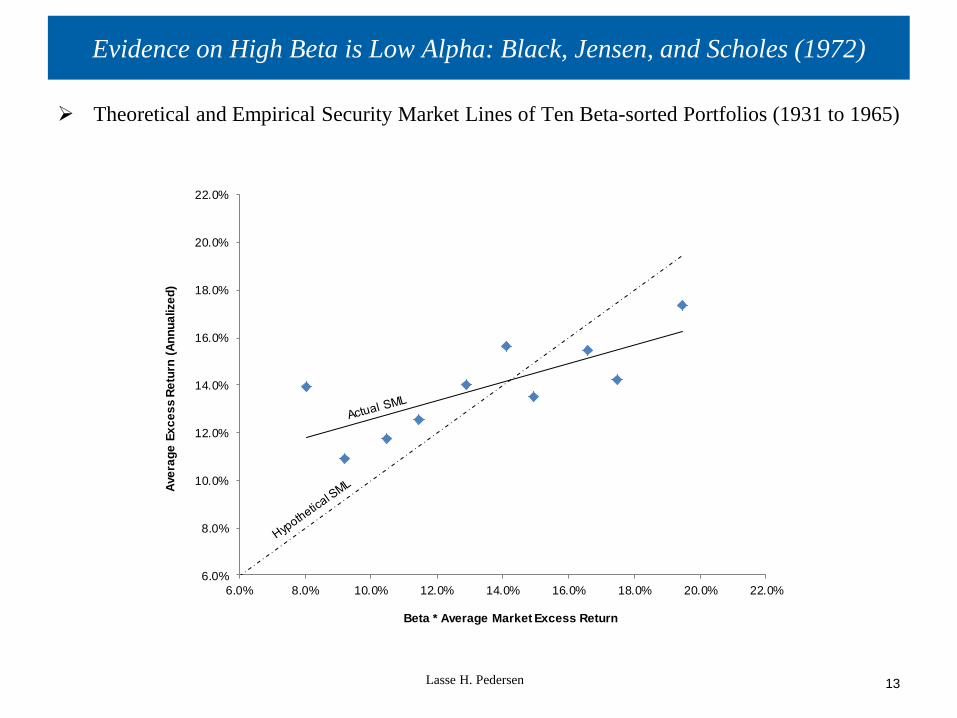
Evidence on High Beta is Low Alpha: Black, Jensen, and Scholes (1972)
Theoretical and Empirical Security Market Lines of Ten Beta-sorted Portfolios (1931 to 1965)
Lasse H. Pedersen
13
6.0%
8.0%
10.0%
12.0%
14.0%
16.0%
18.0%
20.0%
22.0%
6.0% 8.0% 10.0% 12.0% 14.0% 16.0% 18.0% 20.0% 22.0%
Ave
rag
e E
xc
es
s R
etu
rn (
An
nu
alize
d)
Beta * Average Market Excess Return

Evidence on High Beta is Low Alpha: Updated Stock Sample
Theoretical and Empirical Security Market Lines of Ten Beta-sorted Portfolios (1926 to 2010)
Lasse H. Pedersen
14
4.0%
5.0%
6.0%
7.0%
8.0%
9.0%
10.0%
11.0%
12.0%
13.0%
14.0%
4.0% 5.0% 6.0% 7.0% 8.0% 9.0% 10.0% 11.0% 12.0% 13.0% 14.0%
Ave
rag
e E
xc
es
s R
etu
rn (
An
nu
alize
d)
Beta * Average Market Excess Return
Source: “Betting Against Beta,” Andrea Frazzini and Lasse Heje Pedersen (JFE, 2014)
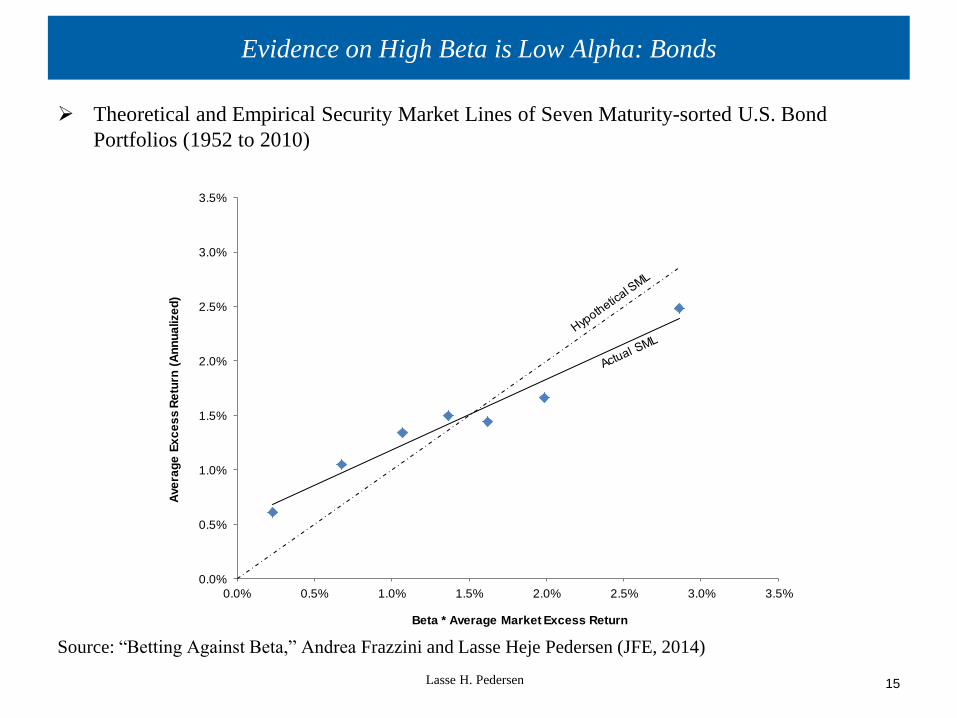
Evidence on High Beta is Low Alpha: Bonds
Theoretical and Empirical Security Market Lines of Seven Maturity-sorted U.S. Bond
Portfolios (1952 to 2010)
Source: “Betting Against Beta,” Andrea Frazzini and Lasse Heje Pedersen (JFE, 2014)
Lasse H. Pedersen
15
0.0%
0.5%
1.0%
1.5%
2.0%
2.5%
3.0%
3.5%
0.0% 0.5% 1.0% 1.5% 2.0% 2.5% 3.0% 3.5%
Ave
rag
e E
xc
es
s R
etu
rn (
An
nu
alize
d)
Beta * Average Market Excess Return
-0.40
-0.30
-0.20
-0.10
0.00
0.10
0.20
0.30
0.40
0.50
P1(low
beta)
P2 P3 P4 P5 P6 P7 P8 P9 P10(high
beta)
Alp
ha
US Stocks
-0.70
-0.60
-0.50
-0.40
-0.30
-0.20
-0.10
0.00
0.10
0.20
0.30
P1(low
beta)
P2 P3 P4 P5 P6 P7 P8 P9 P10(high
beta)
Alp
ha
International Stocks
-0.08
-0.06
-0.04
-0.02
0.00
0.02
0.04
1 to 12months
13 to24
25 to36
37 to48
49 to60
61 to120
> 120
Alp
ha
Treasury
-0.08
-0.06
-0.04
-0.02
0.00
0.02
0.04
0.06
1-3 years 3-5 year 5-10 years 7-10 years
Alp
ha
Credit Indices
-0.05
-0.04
-0.03
-0.02
-0.01
0.00
0.01
0.02
0.03
0.04
1-3 years 3-5 year 5-10 years 7-10 years
Alp
ha
Credit - CDS
-1.20
-1.00
-0.80
-0.60
-0.40
-0.20
0.00
0.20
0.40
Alp
ha
Credit - Corporate
-0.05
0.00
0.05
0.10
0.15
0.20
0.25
0.30
0.35
Low beta High beta
Alp
ha
Equity Indices
-0.05
0.00
0.05
0.10
0.15
0.20
0.25
0.30
0.35
Low beta High beta
Alp
ha
Commodities
0.00
0.02
0.04
0.06
0.08
0.10
0.12
0.14
0.16
0.18
0.20
Low beta High beta
Alp
ha
FX
-0.01
-0.01
0.00
0.01
0.01
0.02
0.02
0.03
0.03
Low beta High beta
Alp
ha
Country Bonds
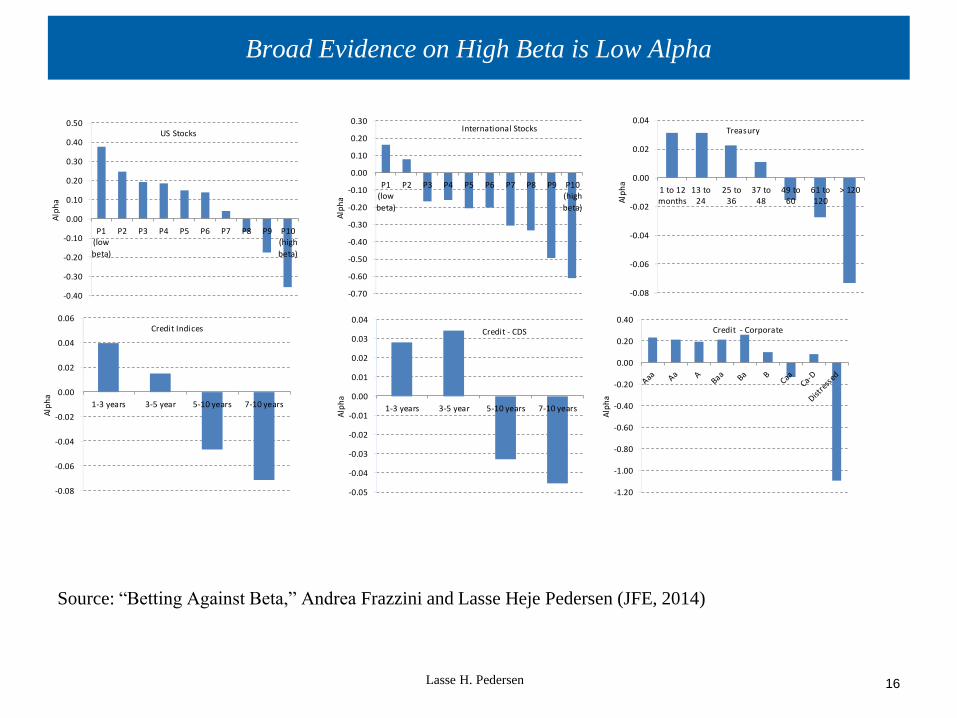
Broad Evidence on High Beta is Low Alpha
Source: “Betting Against Beta,” Andrea Frazzini and Lasse Heje Pedersen (JFE, 2014)
Lasse H. Pedersen
16
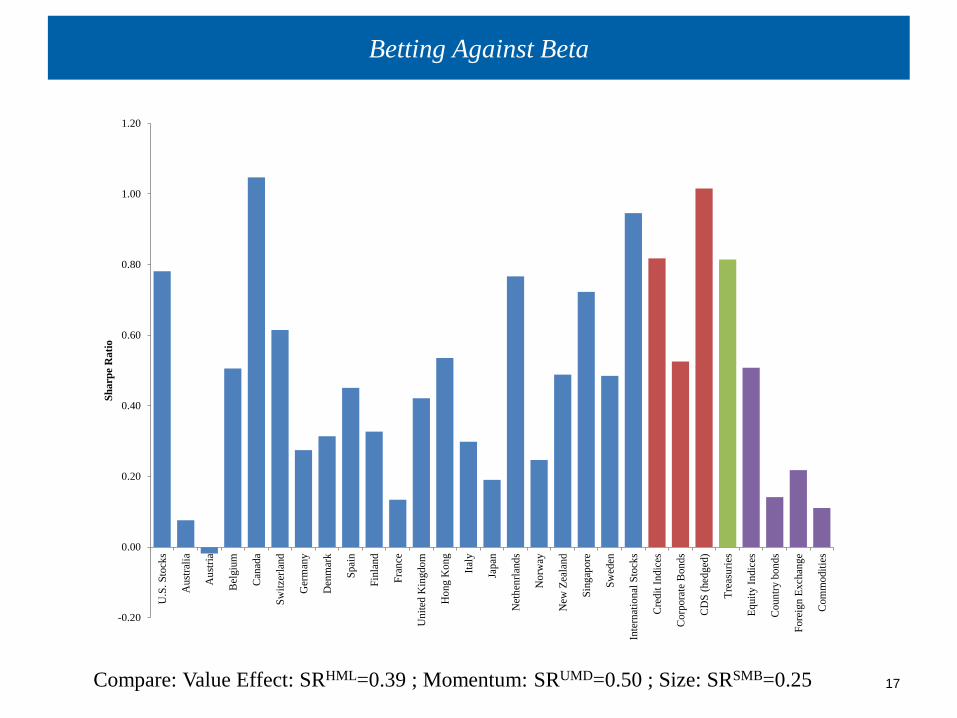
Betting Against Beta
17 Compare: Value Effect: SRHML=0.39 ; Momentum: SRUMD=0.50 ; Size: SRSMB=0.25
-0.20
0.00
0.20
0.40
0.60
0.80
1.00
1.20
U.S
. S
tock
s
Au
stra
lia
Au
stri
a
Bel
giu
m
Can
ada
Sw
itze
rlan
d
Ger
man
y
Den
mar
k
Sp
ain
Fin
lan
d
Fra
nce
Un
ited
Kin
gd
om
Ho
ng K
on
g
Ital
y
Jap
an
Net
hen
rlan
ds
No
rway
New
Zea
lan
d
Sin
gap
ore
Sw
eden
Inte
rnat
ion
al S
tock
s
Cre
dit
In
dic
es
Corp
ora
te B
on
ds
CD
S (
hed
ged
)
Tre
asu
ries
Eq
uit
y I
ndic
es
Cou
ntr
y b
on
ds
Fo
reig
n E
xch
ang
e
Com
mo
dit
ies
Sh
arp
e R
ati
o
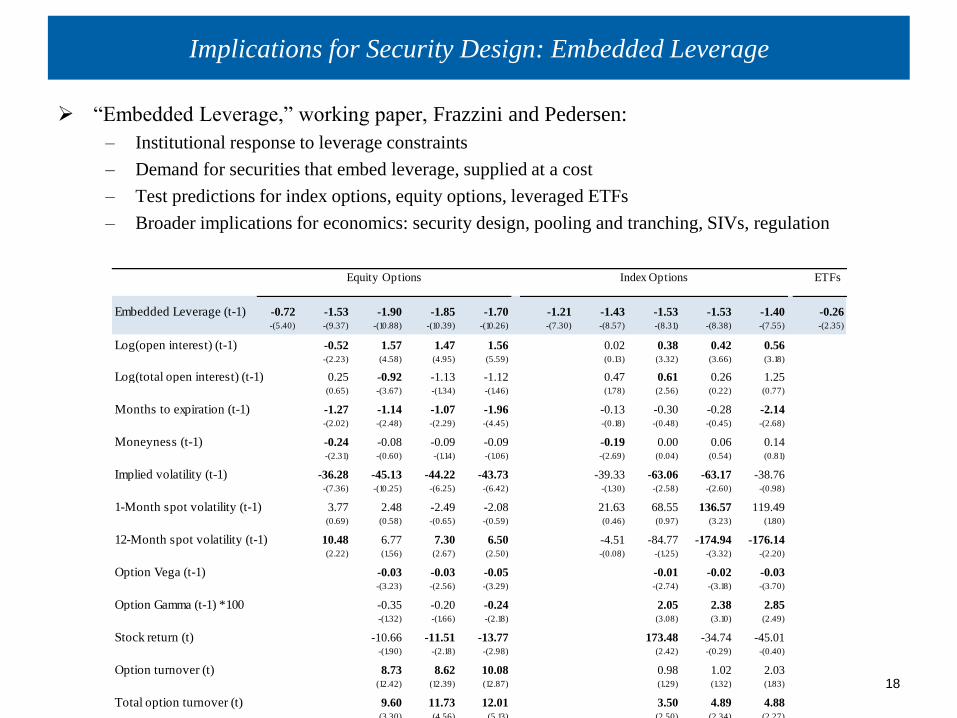
Implications for Security Design: Embedded Leverage
“Embedded Leverage,” working paper, Frazzini and Pedersen:
– Institutional response to leverage constraints
– Demand for securities that embed leverage, supplied at a cost
– Test predictions for index options, equity options, leveraged ETFs
– Broader implications for economics: security design, pooling and tranching, SIVs, regulation
Frazzini and Pedersen
18
ETFs
Embedded Leverage (t-1) -0.72 -1.53 -1.90 -1.85 -1.70 -1.21 -1.43 -1.53 -1.53 -1.40 -0.26-(5.40) -(9.37) -(10.88) -(10.39) -(10.26) -(7.30) -(8.57) -(8.31) -(8.38) -(7.55) -(2.35)
Log(open interest) (t-1) -0.52 1.57 1.47 1.56 0.02 0.38 0.42 0.56-(2.23) (4.58) (4.95) (5.59) (0.13) (3.32) (3.66) (3.18)
Log(total open interest) (t-1) 0.25 -0.92 -1.13 -1.12 0.47 0.61 0.26 1.25(0.65) -(3.67) -(1.34) -(1.46) (1.78) (2.56) (0.22) (0.77)
Months to expiration (t-1) -1.27 -1.14 -1.07 -1.96 -0.13 -0.30 -0.28 -2.14-(2.02) -(2.48) -(2.29) -(4.45) -(0.18) -(0.48) -(0.45) -(2.68)
Moneyness (t-1) -0.24 -0.08 -0.09 -0.09 -0.19 0.00 0.06 0.14-(2.31) -(0.60) -(1.14) -(1.06) -(2.69) (0.04) (0.54) (0.81)
Implied volatility (t-1) -36.28 -45.13 -44.22 -43.73 -39.33 -63.06 -63.17 -38.76-(7.36) -(10.25) -(6.25) -(6.42) -(1.30) -(2.58) -(2.60) -(0.98)
1-Month spot volatility (t-1) 3.77 2.48 -2.49 -2.08 21.63 68.55 136.57 119.49(0.69) (0.58) -(0.65) -(0.59) (0.46) (0.97) (3.23) (1.80)
12-Month spot volatility (t-1) 10.48 6.77 7.30 6.50 -4.51 -84.77 -174.94 -176.14(2.22) (1.56) (2.67) (2.50) -(0.08) -(1.25) -(3.32) -(2.20)
Option Vega (t-1) -0.03 -0.03 -0.05 -0.01 -0.02 -0.03-(3.23) -(2.56) -(3.29) -(2.74) -(3.18) -(3.70)
Option Gamma (t-1) *100 -0.35 -0.20 -0.24 2.05 2.38 2.85-(1.32) -(1.66) -(2.18) (3.08) (3.10) (2.49)
Stock return (t) -10.66 -11.51 -13.77 173.48 -34.74 -45.01-(1.90) -(2.18) -(2.98) (2.42) -(0.29) -(0.40)
Option turnover (t) 8.73 8.62 10.08 0.98 1.02 2.03(12.42) (12.39) (12.87) (1.29) (1.32) (1.83)
Total option turnover (t) 9.60 11.73 12.01 3.50 4.89 4.88(3.30) (4.56) (5.13) (2.50) (2.34) (2.27)
Option B/A Spread (t-1) 14.37 14.62 17.16 4.68 4.39 8.37(4.73) (4.69) (4.54) (0.76) (0.73) (0.92)
Total option B/A Spread (t-1) 4.56 -4.40 -8.33 -11.53 -27.07 -52.79(0.44) -(0.54) -(1.04) -(0.44) -(0.98) -(1.75)
Asset Fixed Effects No No No Yes Yes No No No Yes Yes No
Risk Adjusted (5-factor) No No No No Yes No No No No Yes Yes
Number of observations 11.3M 11.3M 11.3M 11.3M 11.3M 290K 290K 290K 290K 290K290K 13K
Equity Options Index Options
Lasse H. Pedersen
19
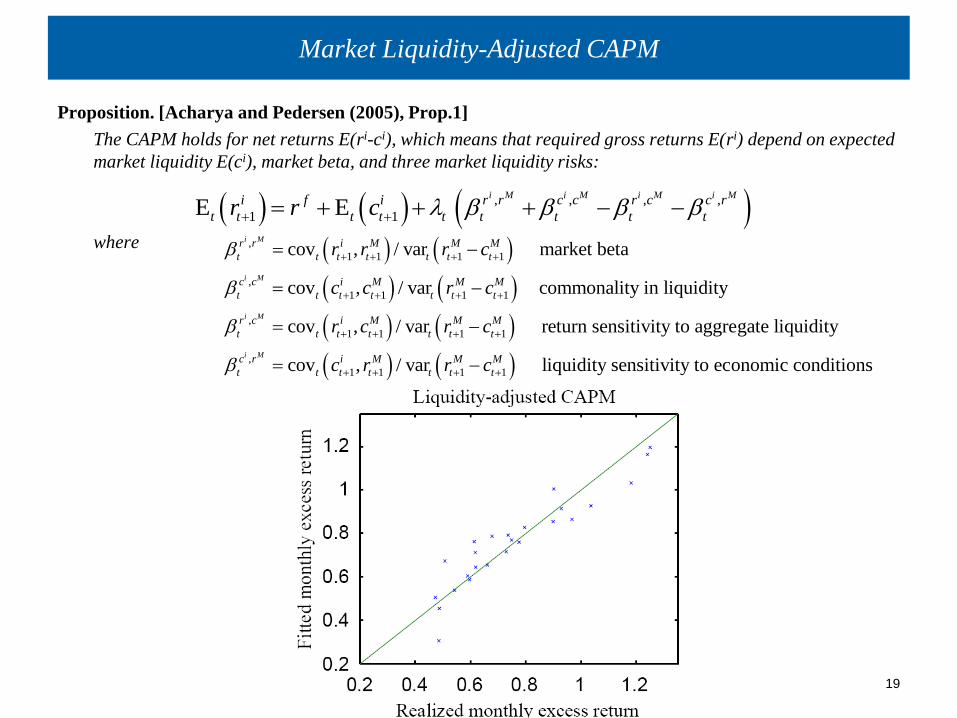
Market Liquidity-Adjusted CAPM
Proposition. [Acharya and Pedersen (2005), Prop.1]
The CAPM holds for net returns E(ri-ci), which means that required gross returns E(ri) depend on expected
market liquidity E(ci), market beta, and three market liquidity risks:
where
, , , ,
1 1E Ei M i M i M i Mi f i r r c c r c c r
t t t t t t t t tr r c
,
1 1 1 1
,
1 1 1 1
,
1 1 1 1
cov , / var market beta
cov , / var commonality in liquidity
cov , / var return sensitivity to aggregate li
i M
i M
i M
r r i M M M
t t t t t t t
c c i M M M
t t t t t t t
r c i M M M
t t t t t t t
r r r c
c c r c
r c r c
,
1 1 1 1
quidity
cov , / var liquidity sensitivity to economic conditionsi Mc r i M M M
t t t t t t tc r r c

Roadmap of This Talk
Lasse H. Pedersen
20
Principles of Classic Finance and Economics
Modigliani-Miller irrelevance of capital structure
Two Fund Separation (portfolios of MKT and Rf)
CAPM: expected return proportional to risk
Law of One Price
Never exercise a call option early (Merton’s Rule)
Macro irrelevance of policy and finance
Monetary focus on interest rates (Taylor Rule)
Implications of Liquidity Risk
Capital structure non-neutrality
Portfolio choice driven by funding constraints
Expected return driven by liquidity risks
Law of One Price breaks down
Early exercise happens
Credit cycles and liquidity spirals
Two monetary tools
21
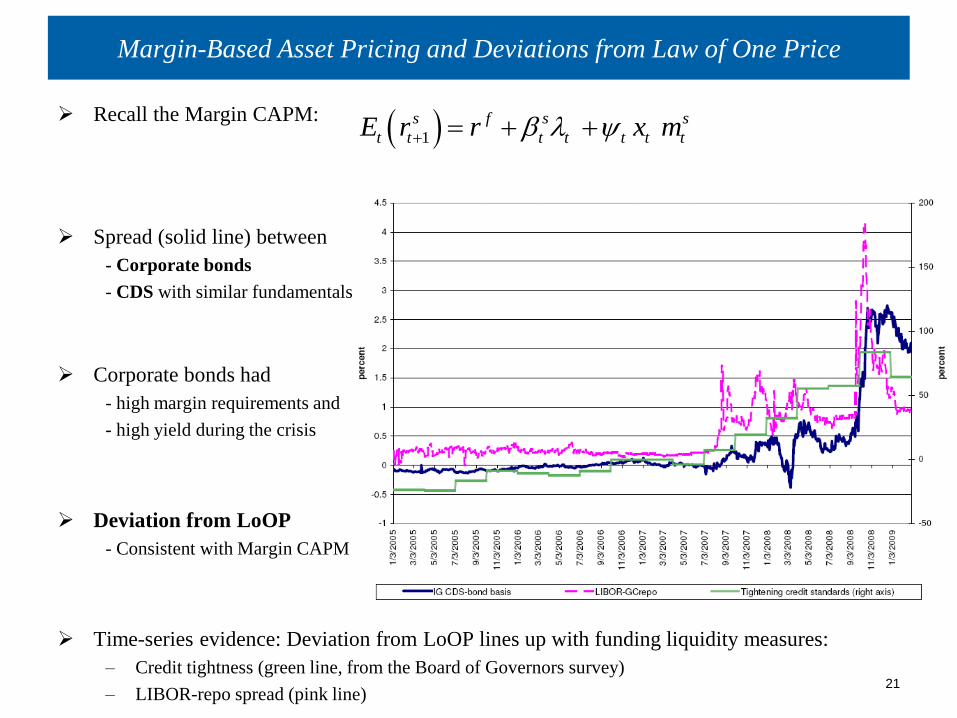
Margin-Based Asset Pricing and Deviations from Law of One Price
Recall the Margin CAPM:
Spread (solid line) between
- Corporate bonds
- CDS with similar fundamentals
Corporate bonds had
- high margin requirements and
- high yield during the crisis
Deviation from LoOP
- Consistent with Margin CAPM
Time-series evidence: Deviation from LoOP lines up with funding liquidity measures:
– Credit tightness (green line, from the Board of Governors survey)
– LIBOR-repo spread (pink line)
1 s f s s
t t t t t t tE r r x m
22
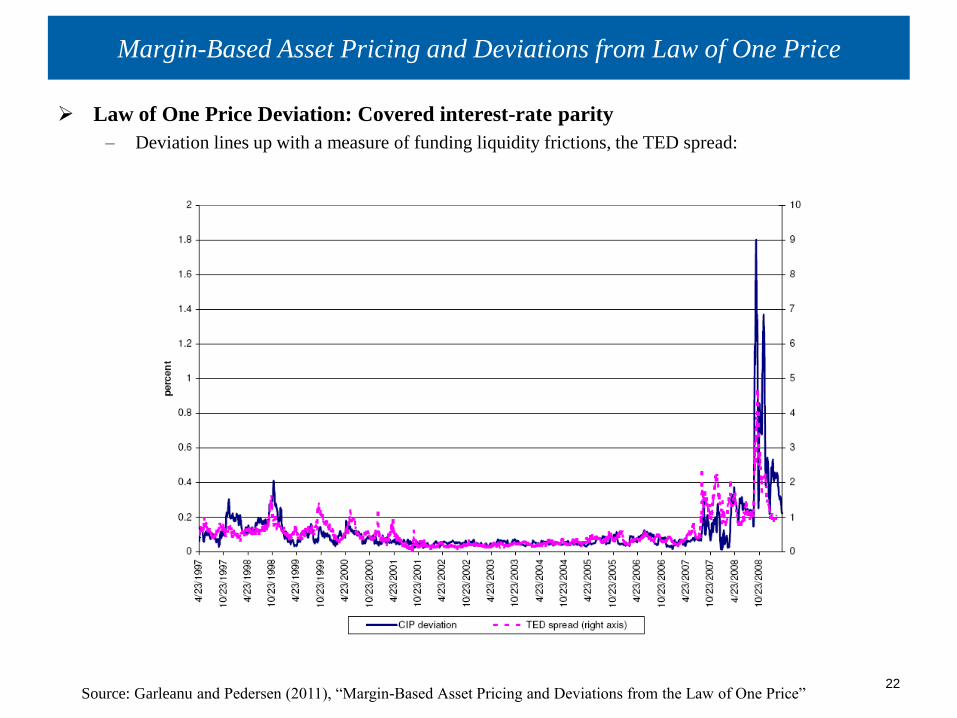
Margin-Based Asset Pricing and Deviations from Law of One Price
Law of One Price Deviation: Covered interest-rate parity
– Deviation lines up with a measure of funding liquidity frictions, the TED spread:
Source: Garleanu and Pedersen (2011), “Margin-Based Asset Pricing and Deviations from the Law of One Price”
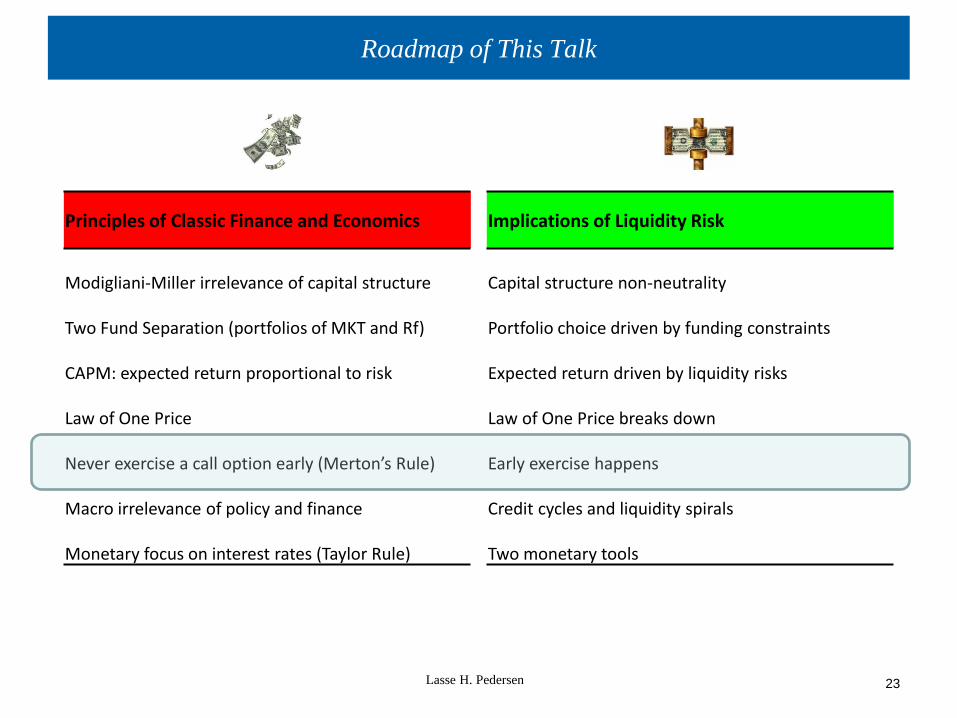
Roadmap of This Talk
Lasse H. Pedersen
23
Principles of Classic Finance and Economics
Modigliani-Miller irrelevance of capital structure
Two Fund Separation (portfolios of MKT and Rf)
CAPM: expected return proportional to risk
Law of One Price
Never exercise a call option early (Merton’s Rule)
Macro irrelevance of policy and finance
Monetary focus on interest rates (Taylor Rule)
Implications of Liquidity Risk
Capital structure non-neutrality
Portfolio choice driven by funding constraints
Expected return driven by liquidity risks
Law of One Price breaks down
Early exercise happens
Credit cycles and liquidity spirals
Two monetary tools
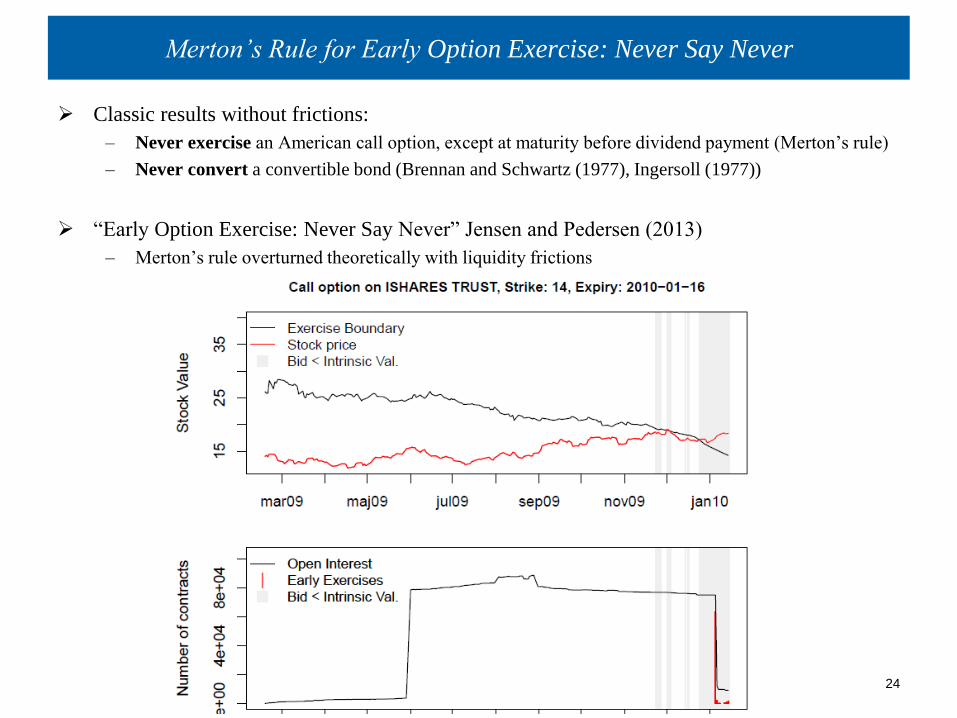
Merton’s Rule for Early Option Exercise: Never Say Never
Classic results without frictions:
– Never exercise an American call option, except at maturity before dividend payment (Merton’s rule)
– Never convert a convertible bond (Brennan and Schwartz (1977), Ingersoll (1977))
“Early Option Exercise: Never Say Never” Jensen and Pedersen (2013)
– Merton’s rule overturned theoretically with liquidity frictions
Lasse H. Pedersen
24

Roadmap of This Talk
Lasse H. Pedersen
25
Principles of Classic Finance and Economics
Modigliani-Miller irrelevance of capital structure
Two Fund Separation (portfolios of MKT and Rf)
CAPM: expected return proportional to risk
Law of One Price
Never exercise a call option early (Merton’s Rule)
Macro irrelevance of policy and finance
Monetary focus on interest rates (Taylor Rule)
Implications of Liquidity Risk
Capital structure non-neutrality
Portfolio choice driven by funding constraints
Expected return driven by liquidity risks
Law of One Price breaks down
Early exercise happens
Credit cycles and liquidity spirals
Two monetary tools

Two Monetary Tools: Interest Rates and Haircuts (Collateral Policy)
required
return
β
market liquidity risk
funding liquidity risk
26

Lasse H. Pedersen
27
Two Monetary Tools: Interest Rates and Haircuts (Collateral Policy)
Haircut cuts through central bank lending facilities alleviate funding liquidity frictions
– by moving the affected securities down the haircut-return line
– by flattening the whole haircut-return line as people’s funding conditions are improved
Source: Ashcraft, Garleanu, and Pedersen (2010), “Two Monetary Tools: Interest Rates and Haircuts”
28
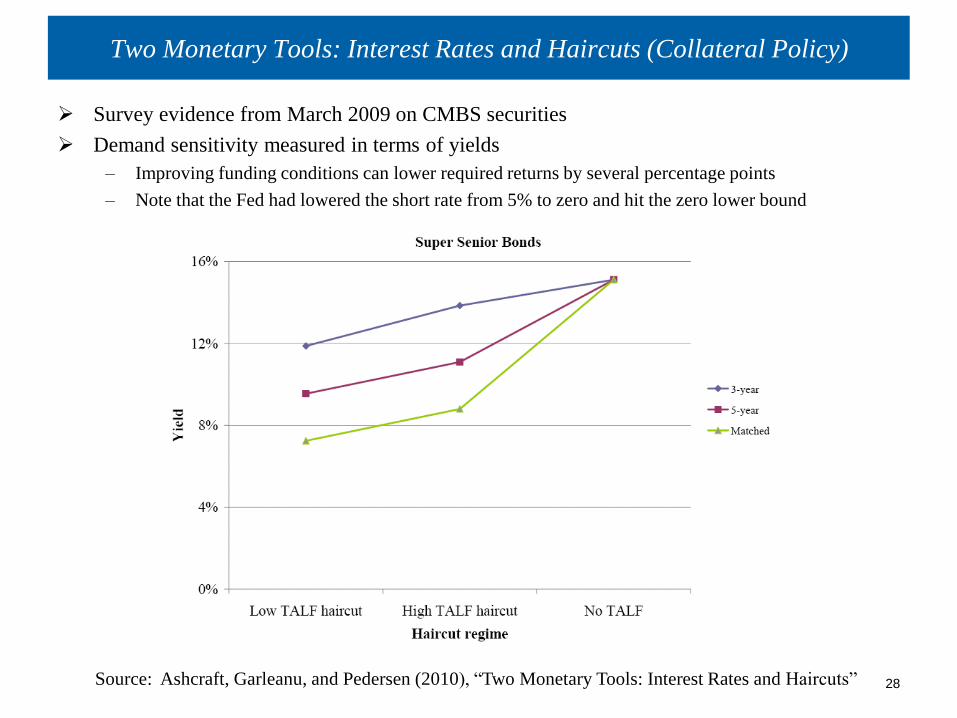
Two Monetary Tools: Interest Rates and Haircuts (Collateral Policy)
Survey evidence from March 2009 on CMBS securities
Demand sensitivity measured in terms of yields
– Improving funding conditions can lower required returns by several percentage points
– Note that the Fed had lowered the short rate from 5% to zero and hit the zero lower bound
Source: Ashcraft, Garleanu, and Pedersen (2010), “Two Monetary Tools: Interest Rates and Haircuts”
29
Two Monetary Tools: Interest Rates and Haircuts (Collateral Policy)
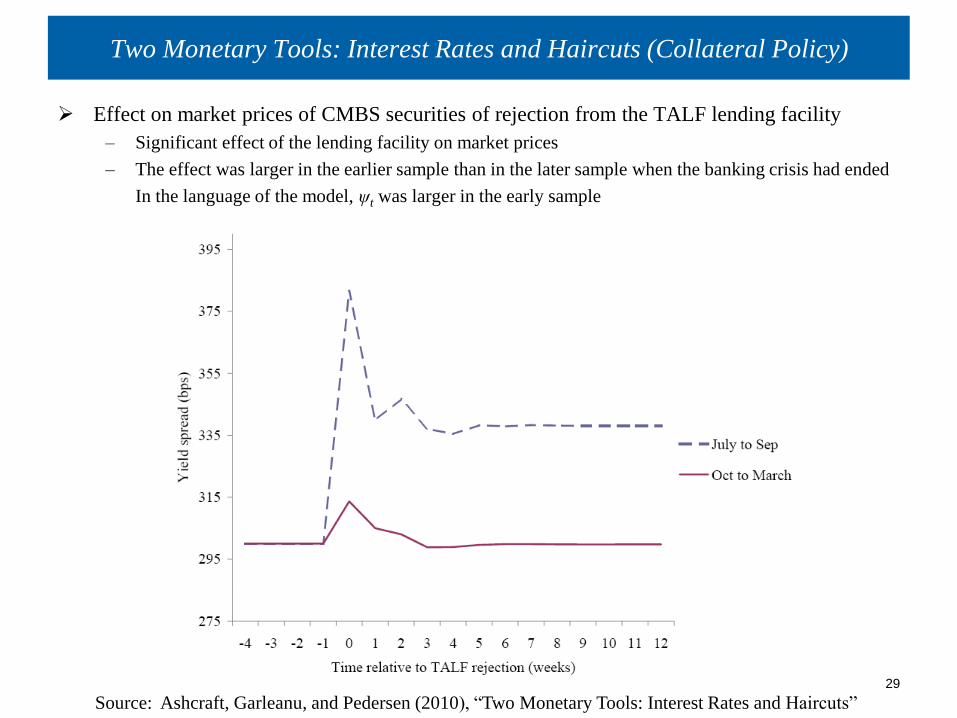
Effect on market prices of CMBS securities of rejection from the TALF lending facility
– Significant effect of the lending facility on market prices
– The effect was larger in the earlier sample than in the later sample when the banking crisis had ended
In the language of the model, ψt was larger in the early sample
Source: Ashcraft, Garleanu, and Pedersen (2010), “Two Monetary Tools: Interest Rates and Haircuts”
Conclusion: Liquidity Risk Drives Finance, Macro, and Monetary
Lasse H. Pedersen
30
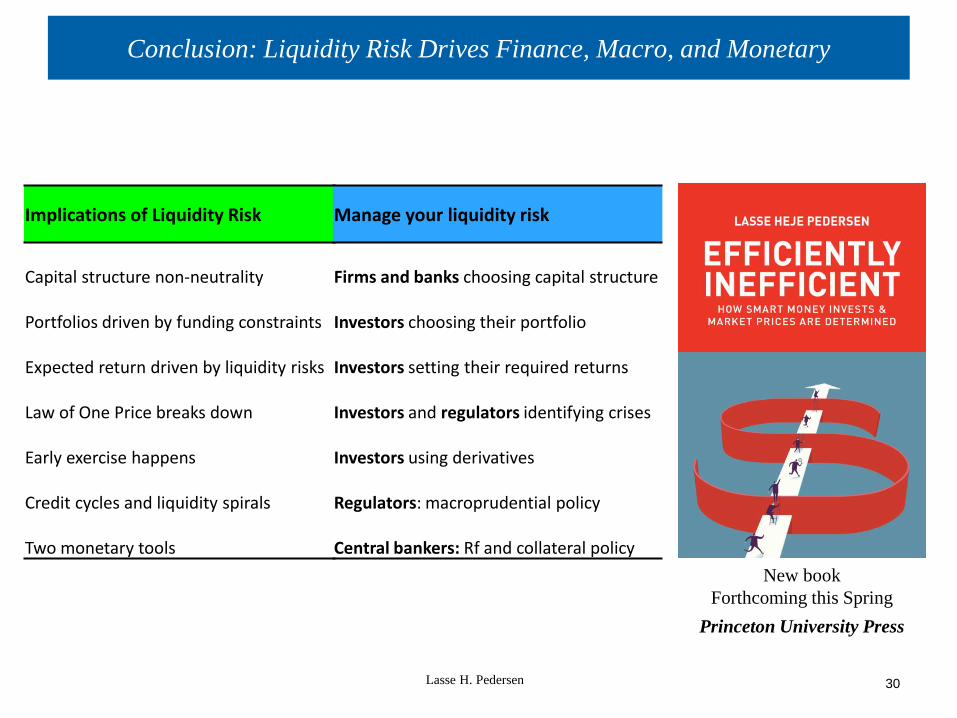
Implications of Liquidity Risk
Capital structure non-neutrality
Portfolios driven by funding constraints
Expected return driven by liquidity risks
Law of One Price breaks down
Early exercise happens
Credit cycles and liquidity spirals
Two monetary tools
Manage your liquidity risk
Firms and banks choosing capital structure
Investors choosing their portfolio
Investors setting their required returns
Investors and regulators identifying crises
Investors using derivatives
Regulators: macroprudential policy
Central bankers: Rf and collateral policy
New book
Forthcoming this Spring
Princeton University Press
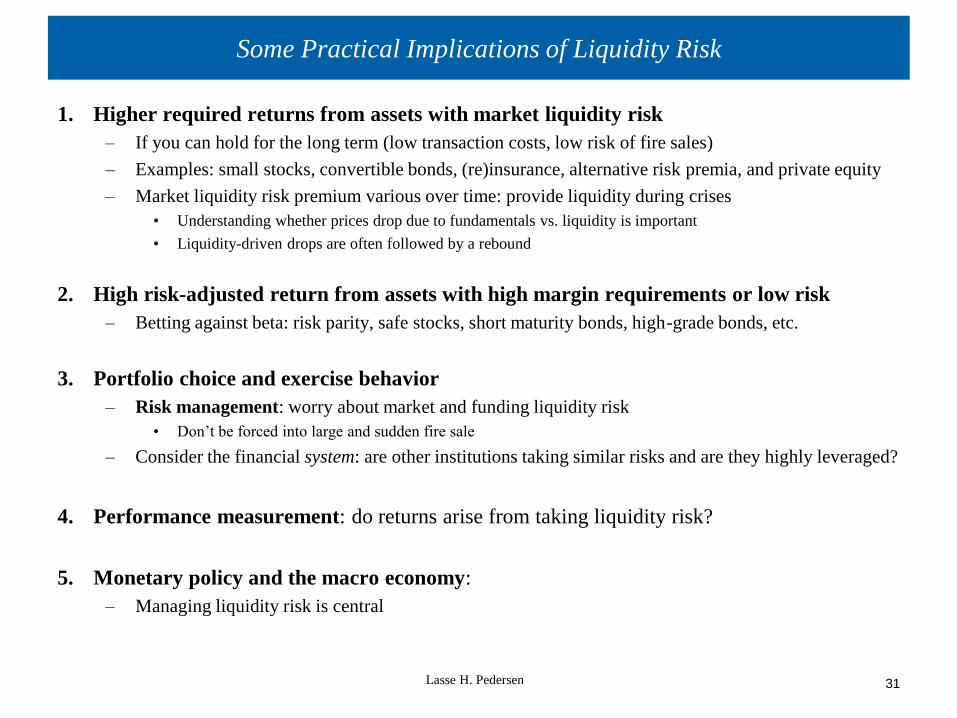
Some Practical Implications of Liquidity Risk
1. Higher required returns from assets with market liquidity risk
– If you can hold for the long term (low transaction costs, low risk of fire sales)
– Examples: small stocks, convertible bonds, (re)insurance, alternative risk premia, and private equity
– Market liquidity risk premium various over time: provide liquidity during crises
• Understanding whether prices drop due to fundamentals vs. liquidity is important
• Liquidity-driven drops are often followed by a rebound
2. High risk-adjusted return from assets with high margin requirements or low risk
– Betting against beta: risk parity, safe stocks, short maturity bonds, high-grade bonds, etc.
3. Portfolio choice and exercise behavior
– Risk management: worry about market and funding liquidity risk
• Don’t be forced into large and sudden fire sale
– Consider the financial system: are other institutions taking similar risks and are they highly leveraged?
4. Performance measurement: do returns arise from taking liquidity risk?
5. Monetary policy and the macro economy:
– Managing liquidity risk is central
Lasse H. Pedersen
31
Lasse H. Pedersen
32
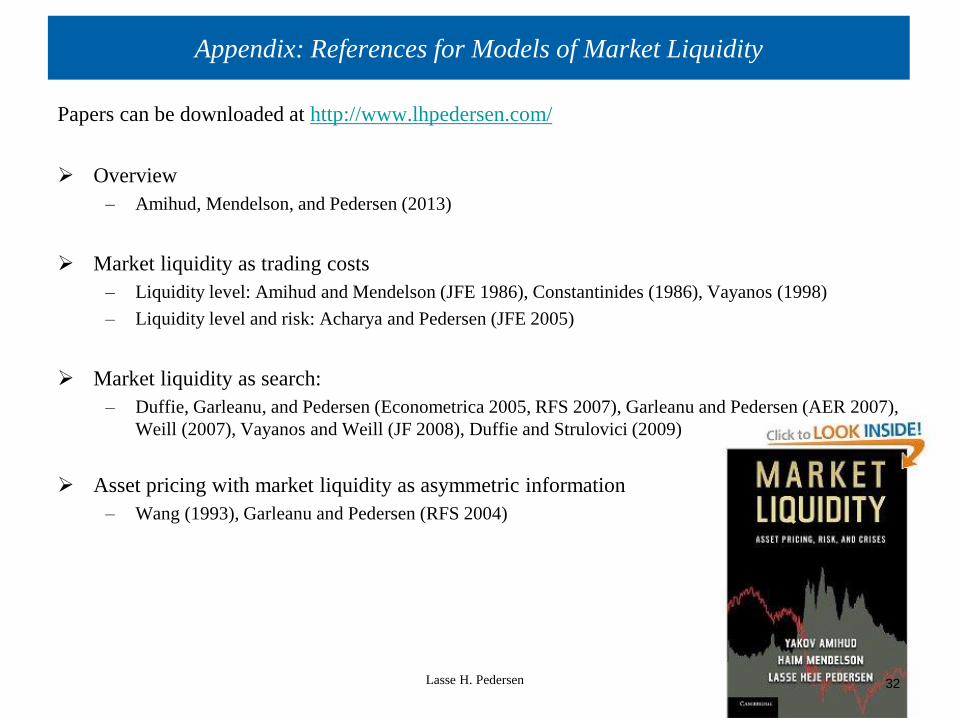
Appendix: References for Models of Market Liquidity
Papers can be downloaded at http://www.lhpedersen.com/
Overview
– Amihud, Mendelson, and Pedersen (2013)
Market liquidity as trading costs
– Liquidity level: Amihud and Mendelson (JFE 1986), Constantinides (1986), Vayanos (1998)
– Liquidity level and risk: Acharya and Pedersen (JFE 2005)
Market liquidity as search:
– Duffie, Garleanu, and Pedersen (Econometrica 2005, RFS 2007), Garleanu and Pedersen (AER 2007),
Weill (2007), Vayanos and Weill (JF 2008), Duffie and Strulovici (2009)
Asset pricing with market liquidity as asymmetric information
– Wang (1993), Garleanu and Pedersen (RFS 2004)
Lasse H. Pedersen
33
Appendix: References for Models of Funding Liquidity
Margin requirements, asset pricing, and deviations from the Law of One Price:
– Garleanu and Pedersen (2011)
Margin requirements and leverage constraints and the returns of stocks, bonds, credit:
– Frazzini and Pedersen (WP 2011, JFE 2014), Asness, Frazzini, and Pedersen (2011, FAJ forthcoming)
Margin requirements, macro economics, and monetary policy:
– Ashcraft, Garleanu, Pedersen (NBER Macroannual 2010)
Funding liquidity and systemic risk
– Acharya, Pedersen, Philippon, and Richardson (WP 2010)
Lasse H. Pedersen
34
Appendix: References for Models of Market and Funding Liquidity Interaction
Liquidity spirals, fragility, and bank balance sheets as drivers of crises:
– Brunnermeier and Pedersen (JF 2005, RFS 2009)
Amplification when everyone tries to manage risk:
– Garleanu and Pedersen (AER 2007)
When everyone runs for the exit:
– Pedersen (IJCB 2009)
Lasse H. Pedersen
35
Appendix: Other Related References (Incomplete List)
Macro and general equilibrium models:
– Bernanke and Gertler (1989), Constantinides and Duffie (1996), Geanakoplos (1997), Kiyotaki and Moore
(1997,2008), Aiyagari and Gertler (1999), Lorenzoni (2008), Brunnermeier and Sannikov (2010), He and
Krishnamurthy (2010)
Monetary models with frictions:
– Curdia and Woodford (2009), Gertler and Karadi (2009)
Asset pricing and constraints:
– Hindy (1995), Cuoco (1997), Detemple and Murthy (1997), Basak and Croitoru (2000), Coen-Pirani (2005), Gorton
and Metrick (2009), Adrian and Shin (2010), Greenwood and Vayanos (2010)
Limits of arbitrage:
– Shleifer and Vishny (1997)
Liquidity and welfare when arbitrageurs have margin constraints
– Gromb and Vayanos (2002)
Limited attention and slow moving capital:
– Duffie (2010, AFA Presidential address)
Corporate finance and banking:
– Diamond and Dybvig (1983), Shleifer and Vishny (1992), Holmstrom and Tirole (1997, 2001), Acharya and
Viswanathan (2010)
Dynamic trading with predictable returns and transaction costs:
– Garleanu and Pedersen (2008)
Informational frictions in asset markets
– Grossman and Stiglitz (1980)
Lasse H. Pedersen
36
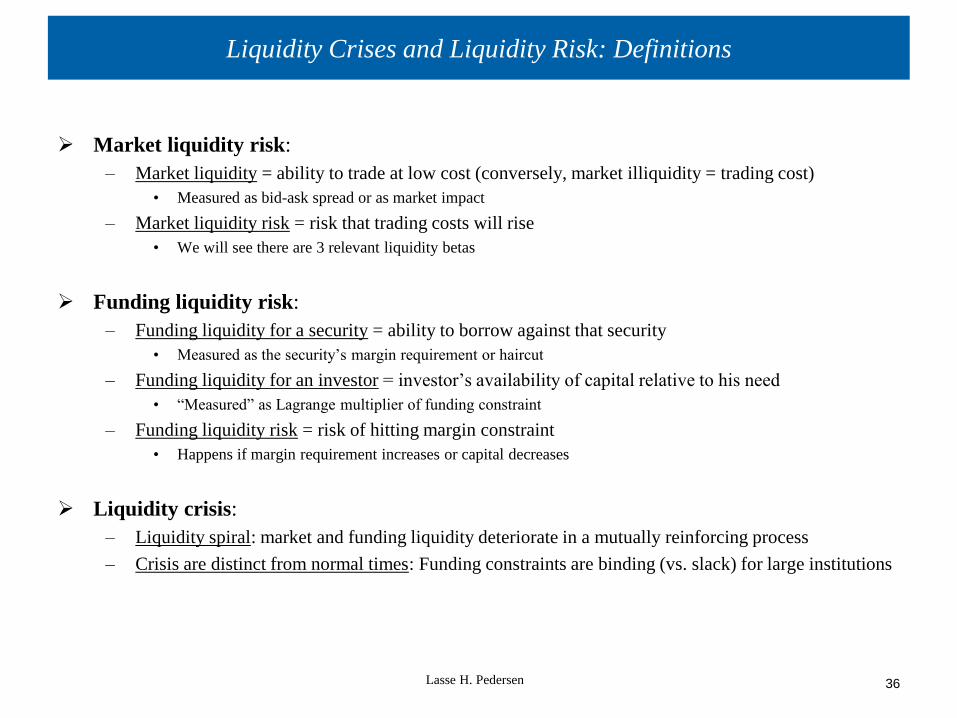
Liquidity Crises and Liquidity Risk: Definitions
Market liquidity risk:
– Market liquidity = ability to trade at low cost (conversely, market illiquidity = trading cost)
• Measured as bid-ask spread or as market impact
– Market liquidity risk = risk that trading costs will rise
• We will see there are 3 relevant liquidity betas
Funding liquidity risk:
– Funding liquidity for a security = ability to borrow against that security
• Measured as the security’s margin requirement or haircut
– Funding liquidity for an investor = investor’s availability of capital relative to his need
• “Measured” as Lagrange multiplier of funding constraint
– Funding liquidity risk = risk of hitting margin constraint
• Happens if margin requirement increases or capital decreases
Liquidity crisis:
– Liquidity spiral: market and funding liquidity deteriorate in a mutually reinforcing process
– Crisis are distinct from normal times: Funding constraints are binding (vs. slack) for large institutions
37
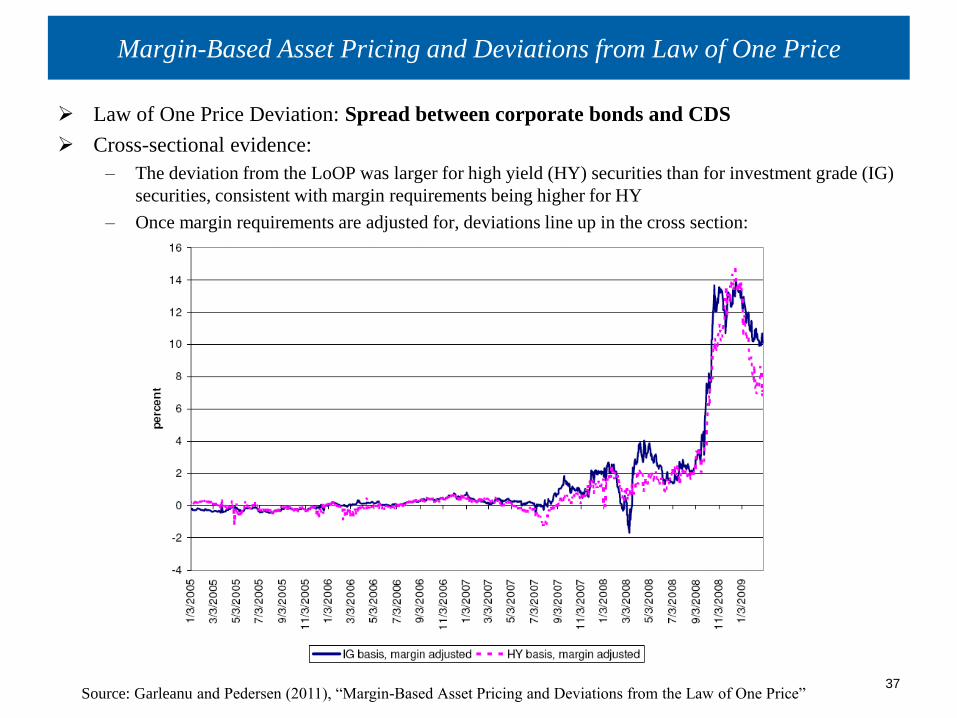
Margin-Based Asset Pricing and Deviations from Law of One Price
Law of One Price Deviation: Spread between corporate bonds and CDS
Cross-sectional evidence:
– The deviation from the LoOP was larger for high yield (HY) securities than for investment grade (IG)
securities, consistent with margin requirements being higher for HY
– Once margin requirements are adjusted for, deviations line up in the cross section:
Source: Garleanu and Pedersen (2011), “Margin-Based Asset Pricing and Deviations from the Law of One Price”
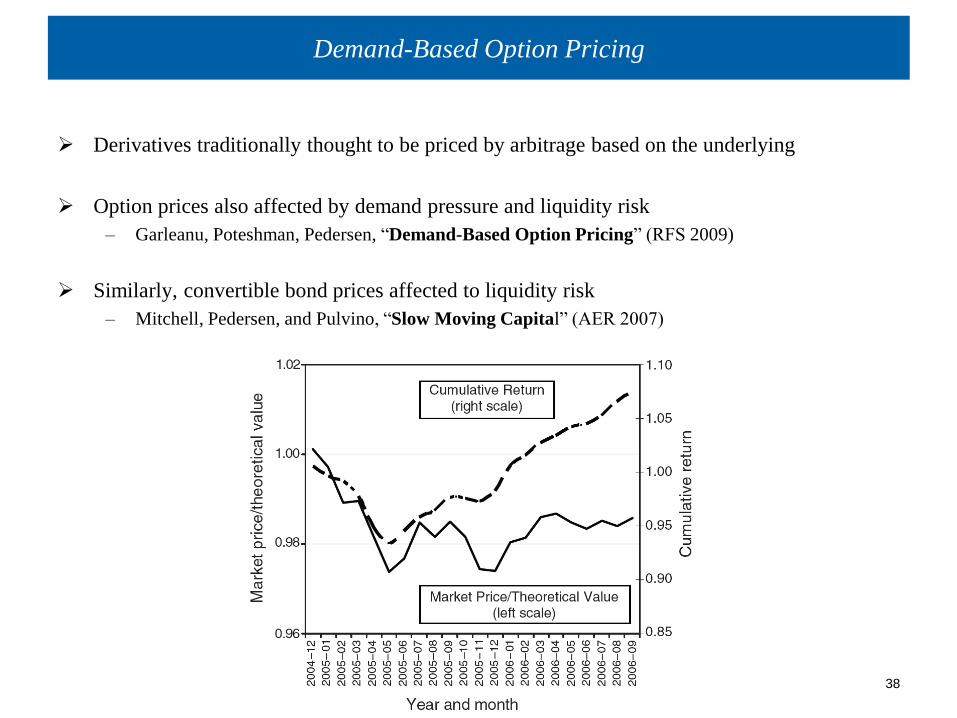
Demand-Based Option Pricing
Derivatives traditionally thought to be priced by arbitrage based on the underlying
Option prices also affected by demand pressure and liquidity risk
– Garleanu, Poteshman, Pedersen, “Demand-Based Option Pricing” (RFS 2009)
Similarly, convertible bond prices affected to liquidity risk
– Mitchell, Pedersen, and Pulvino, “Slow Moving Capital” (AER 2007)
Lasse H. Pedersen
38
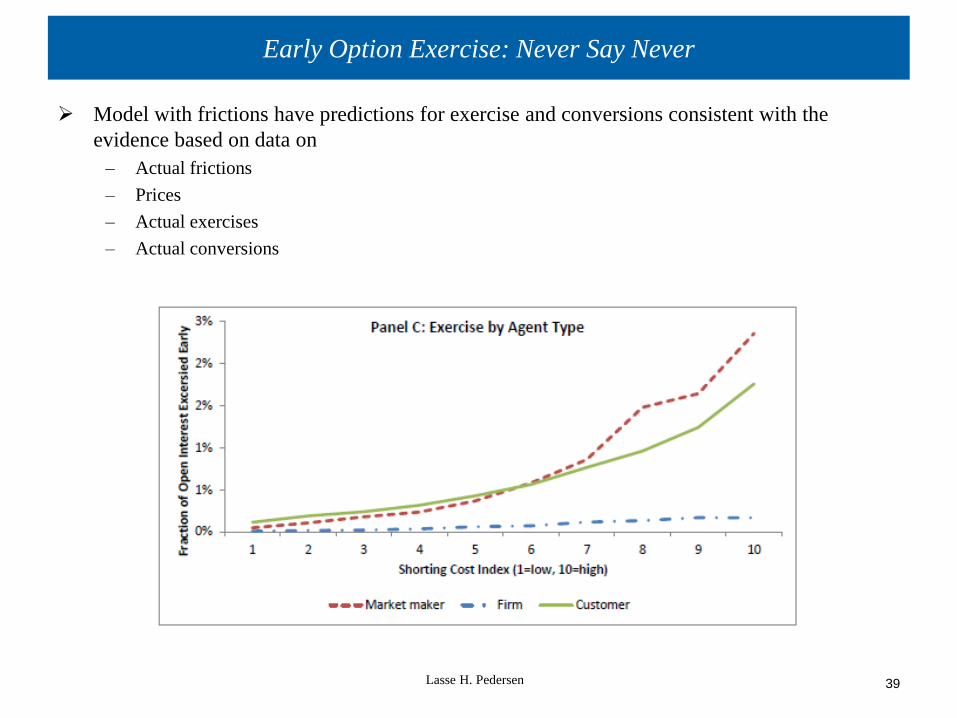
Early Option Exercise: Never Say Never
Model with frictions have predictions for exercise and conversions consistent with the
evidence based on data on
– Actual frictions
– Prices
– Actual exercises
– Actual conversions
Lasse H. Pedersen
39
Lasse H. Pedersen
40
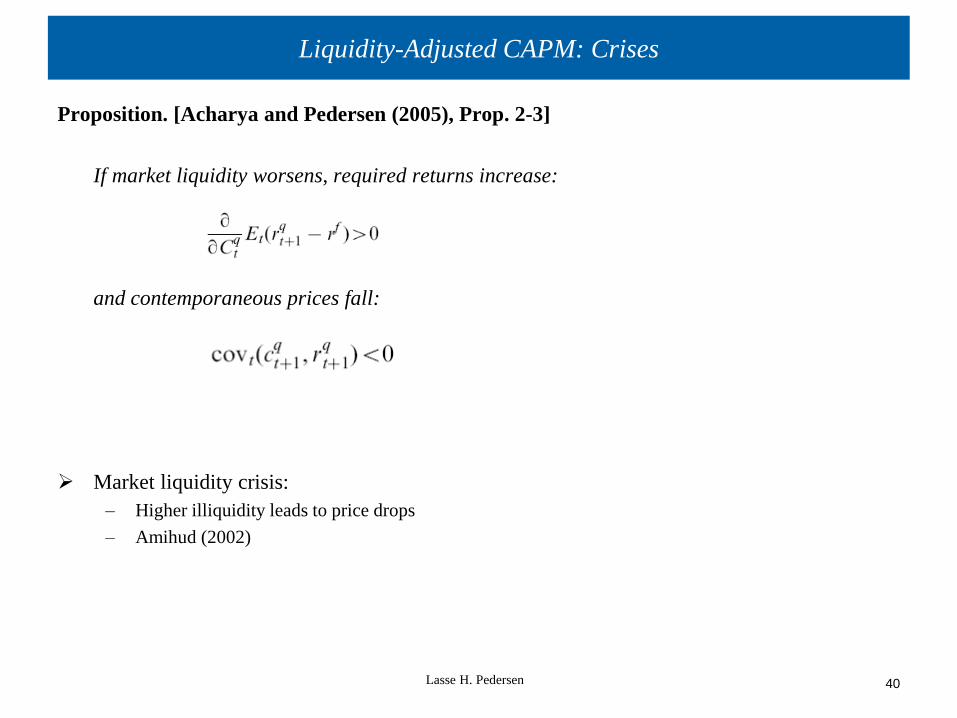
Liquidity-Adjusted CAPM: Crises
Proposition. [Acharya and Pedersen (2005), Prop. 2-3]
If market liquidity worsens, required returns increase:
and contemporaneous prices fall:
Market liquidity crisis:
– Higher illiquidity leads to price drops
– Amihud (2002)
Lasse H. Pedersen
41
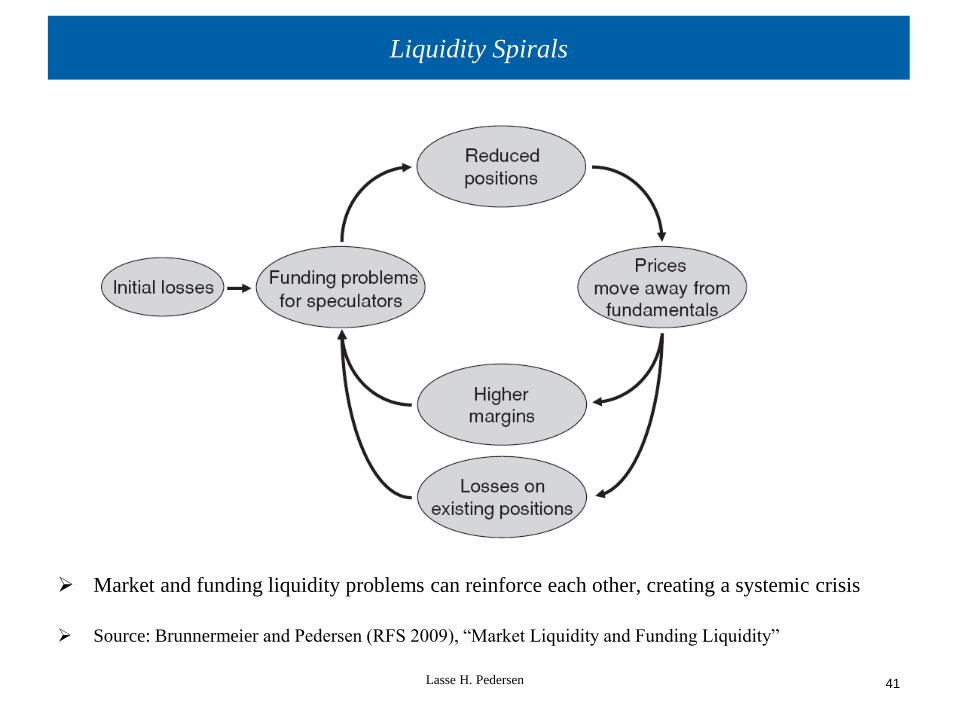
Liquidity Spirals
Market and funding liquidity problems can reinforce each other, creating a systemic crisis
Source: Brunnermeier and Pedersen (RFS 2009), “Market Liquidity and Funding Liquidity”
Lasse H. Pedersen
42
Implications of Liquidity Spirals
Fragility and the risk of a “collateral run”:
– A small shock can lead to large changes in liquidity and prices
– Because of liquidity spirals and discontinuous switch from liquid equilibrium to illiquid equilibrium
Commonality in market liquidity:
– Different securities’ market liquidity co-move since they are driven by common funding shocks
Spillover effects:
– A shock to one market spills over to the markets when it significantly impairs to capital of financial institutions
Market liquidity risk related to market risk
– Because funding terms are
Flight to quality
Negative skewness of assets held by leveraged investors and leveraged investors’ portfolio returns
– Since losses are amplified by liquidity spirals, while gains are not
Source: Brunnermeier and Pedersen (RFS 2009)
Lasse H. Pedersen
43
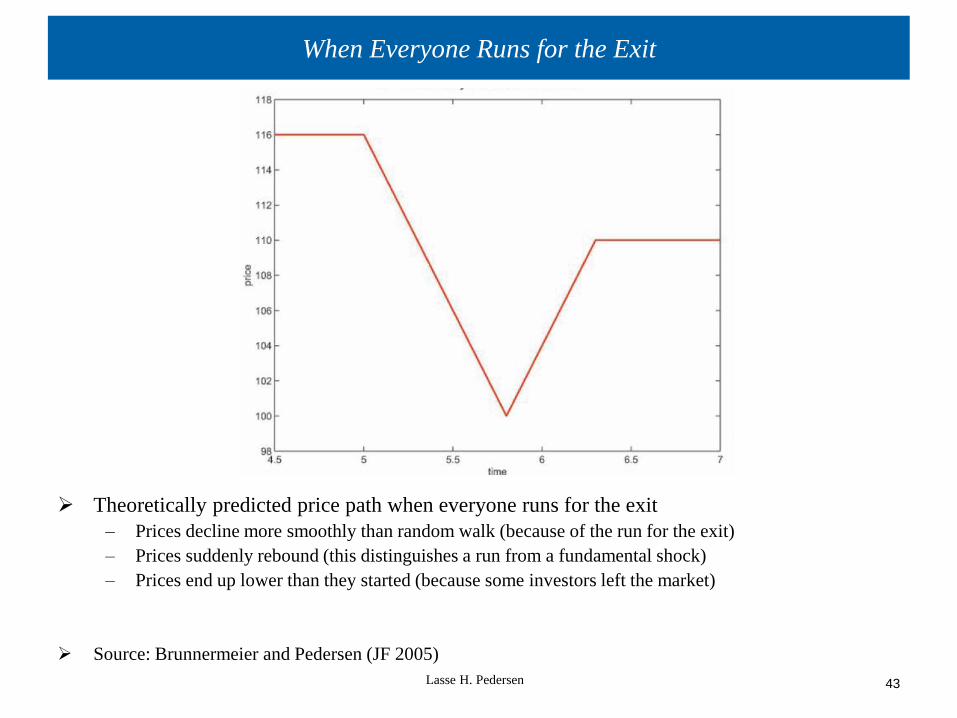
When Everyone Runs for the Exit
Theoretically predicted price path when everyone runs for the exit
– Prices decline more smoothly than random walk (because of the run for the exit)
– Prices suddenly rebound (this distinguishes a run from a fundamental shock)
– Prices end up lower than they started (because some investors left the market)
Source: Brunnermeier and Pedersen (JF 2005)
Lasse H. Pedersen
44
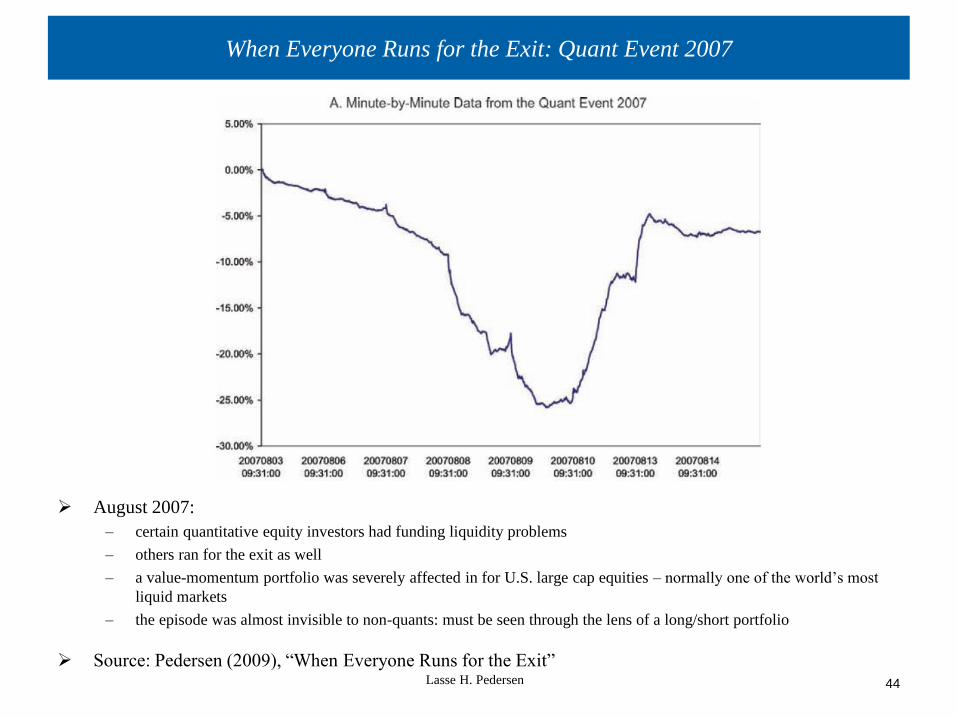
When Everyone Runs for the Exit: Quant Event 2007
August 2007:
– certain quantitative equity investors had funding liquidity problems
– others ran for the exit as well
– a value-momentum portfolio was severely affected in for U.S. large cap equities – normally one of the world’s most
liquid markets
– the episode was almost invisible to non-quants: must be seen through the lens of a long/short portfolio
Source: Pedersen (2009), “When Everyone Runs for the Exit”
Lasse H. Pedersen
45
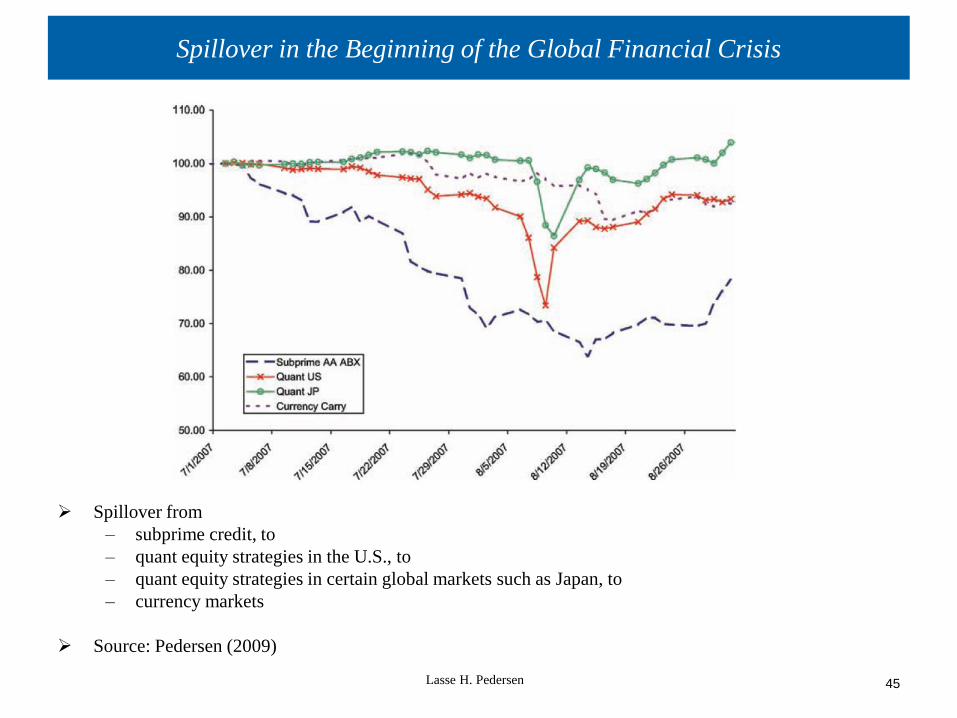
Spillover in the Beginning of the Global Financial Crisis
Spillover from
– subprime credit, to
– quant equity strategies in the U.S., to
– quant equity strategies in certain global markets such as Japan, to
– currency markets
Source: Pedersen (2009)
Lasse H. Pedersen
46
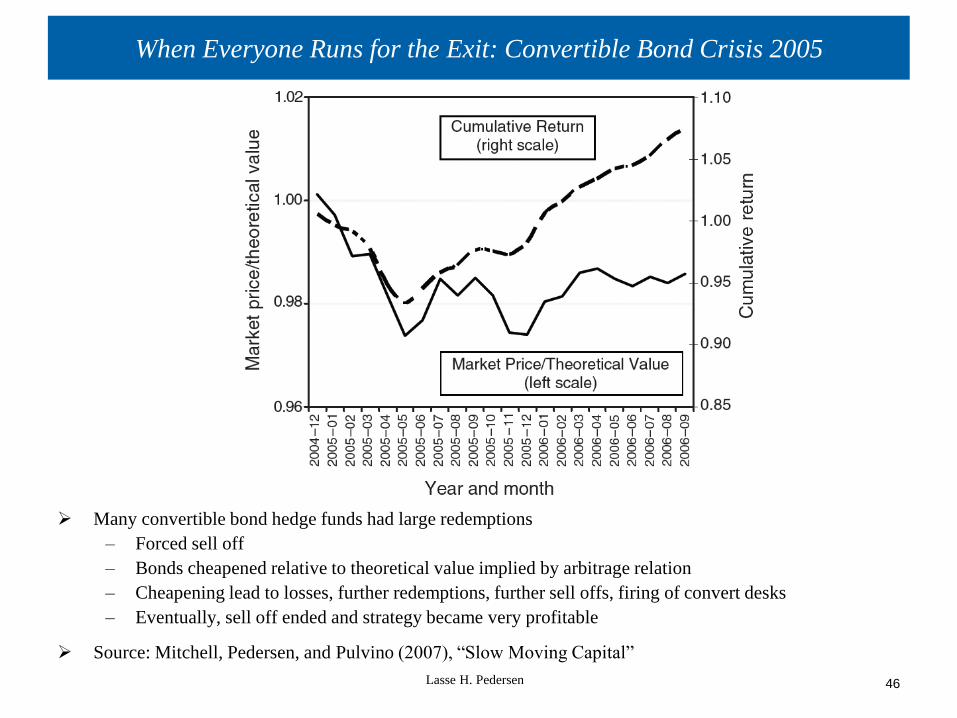
When Everyone Runs for the Exit: Convertible Bond Crisis 2005
Many convertible bond hedge funds had large redemptions
– Forced sell off
– Bonds cheapened relative to theoretical value implied by arbitrage relation
– Cheapening lead to losses, further redemptions, further sell offs, firing of convert desks
– Eventually, sell off ended and strategy became very profitable
Source: Mitchell, Pedersen, and Pulvino (2007), “Slow Moving Capital”
Lasse H. Pedersen
47
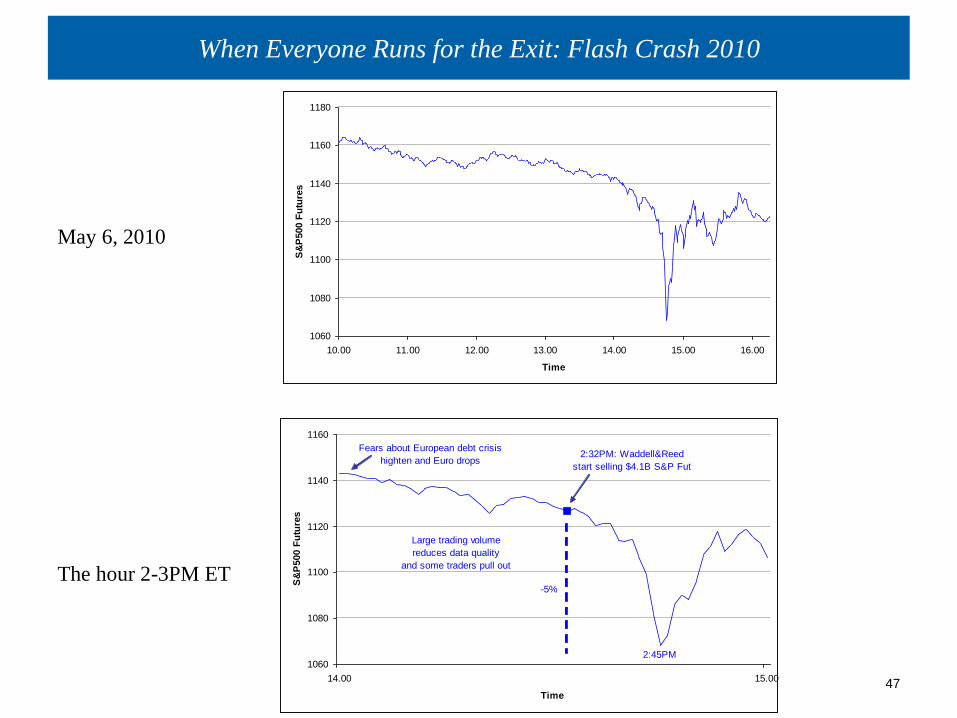
When Everyone Runs for the Exit: Flash Crash 2010
May 6, 2010
The hour 2-3PM ET
1060
1080
1100
1120
1140
1160
1180
10.00 11.00 12.00 13.00 14.00 15.00 16.00
Time
S&
P500 F
utu
res
1060
1080
1100
1120
1140
1160
14.00 15.00
Time
S&
P500 F
utu
res
2:32PM: Waddell&Reed
start selling $4.1B S&P Fut
2:45PM
-5%
Fears about European debt crisis
highten and Euro drops
Large trading volume
reduces data quality
and some traders pull out