vce physics unit 1 & 2 2019 preparation work...vce physics unit 1 & 2 2019 preparation work...
TRANSCRIPT

Name……………………………………………………….
VCE Physics Unit 1 & 2
2019 Preparation Work
Dec 2018

Physics - Unit 1 & 2 Orientation 2019 Welcome to physics! You have made an outstanding choice in taking physics. It is the science of all other sciences. As Rutherford has been quoted: "All science is either physics or stamp collecting" - Ernest Rutherford There are three important expectations in this course. 1. Always do the pre-reading and note taking BEFORE class 2. Ask lots of questions 3. Stay up to date with the problems and corrections There will be a quiz at the start of each lesson that you will be required to do so that we can check your understanding of the reading.
The How to Study Physics document attached gives you some pointers on how to be successful in studying physics. Participation and staying up to date is the key. Year 11 course 2019
Unit 1: What ideas explain the physical world? Area of Study 1: How can thermal effects be explained? (Outcome 1) Area of Study 2: How do electric circuits work? (Outcome 2) Area of Study 3: What is matter and how is it formed? (Outcome 3)
Unit 2: What do experiments reveal about the physical world? Area of Study 1: How can motion be described and explained? Area of Study 2: Options Area of Study 3: Practical investigation Important Materials: Required: Heinemann Physics 11 (4th Ed). Edrolo Scientific calculator. Please note you will not be allowed to use a graphing calculator in any examinations or SACs A4 lined Notebook - you are required to take handwritten notes Microsoft Office 365 - Excel (if have a computer) Java so you can use the PhET simulations (if have a computer) TRACKER (if have a computer) Recommended: 5 cm metal ruler Protractor

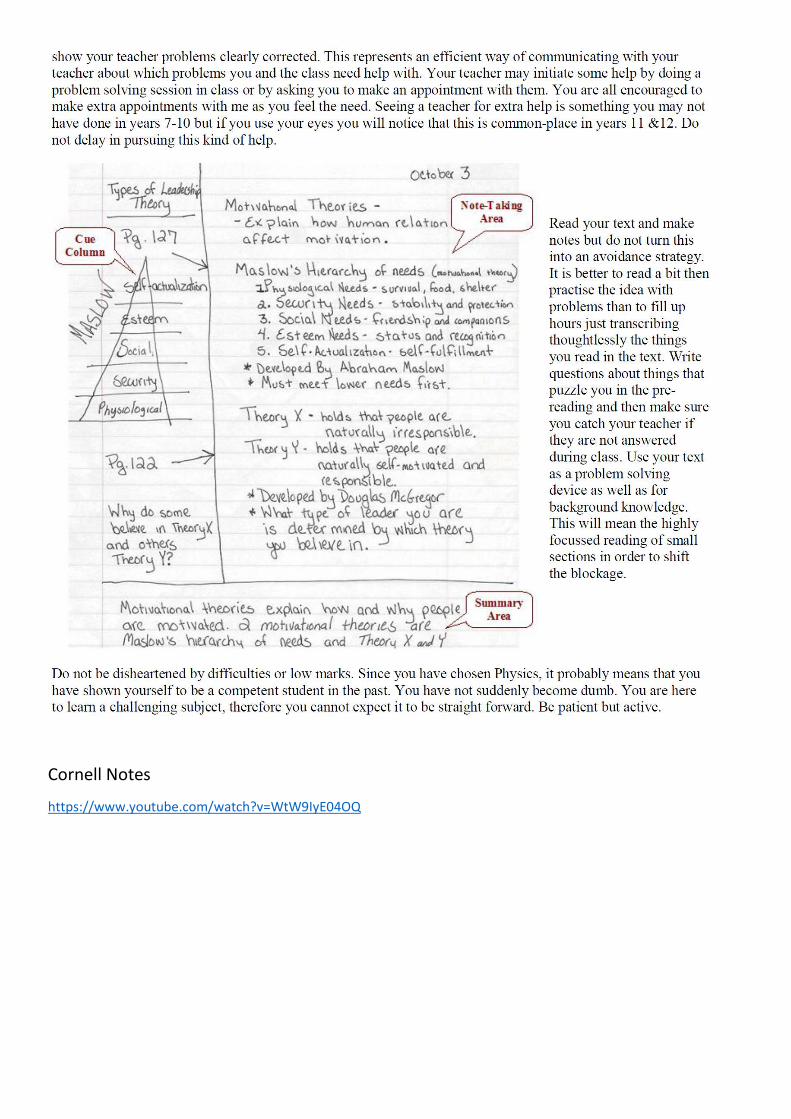
Cornell Notes
https://www.youtube.com/watch?v=WtW9IyE04OQ
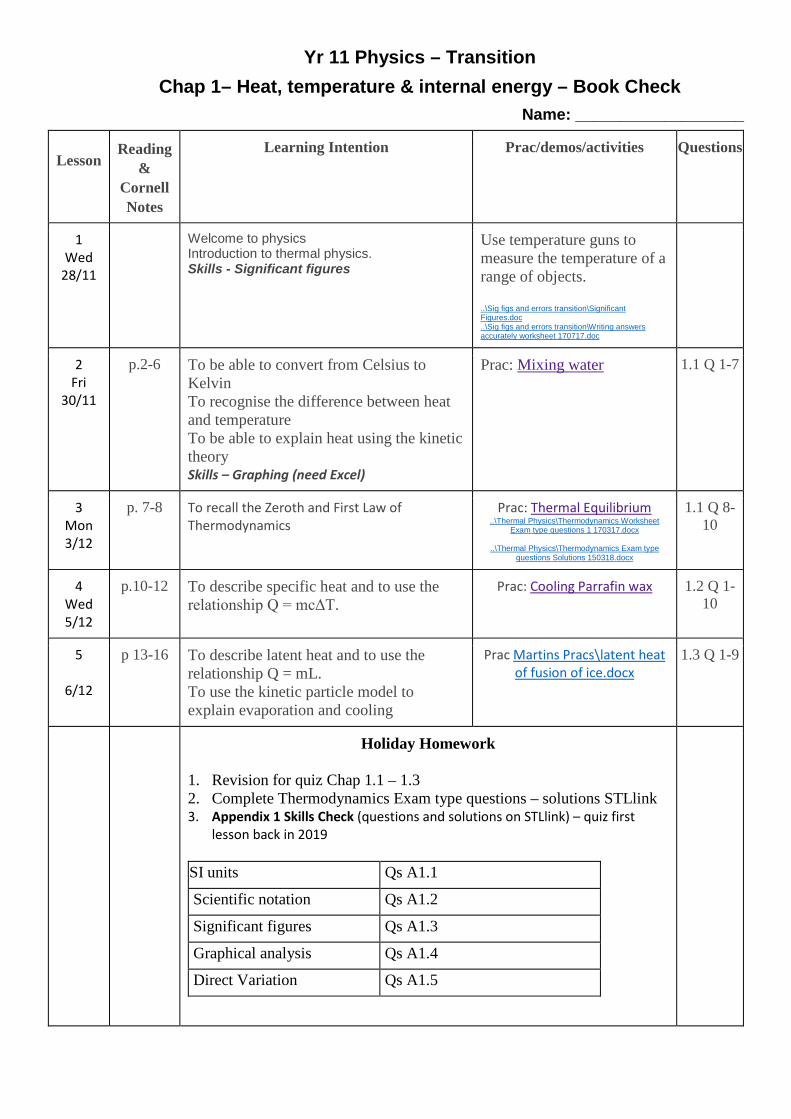
Yr 11 Physics – Transition Chap 1– Heat, temperature & internal energy – Book Check
Name: ___________________
Lesson Reading
& Cornell Notes
Learning Intention Prac/demos/activities Questions
1 Wed
28/11
Welcome to physics Introduction to thermal physics. Skills - Significant figures
Use temperature guns to measure the temperature of a range of objects. ..\Sig figs and errors transition\Significant Figures.doc ..\Sig figs and errors transition\Writing answers accurately worksheet 170717.doc
2 Fri
30/11
p.2-6 To be able to convert from Celsius to Kelvin To recognise the difference between heat and temperature To be able to explain heat using the kinetic theory Skills – Graphing (need Excel)
Prac: Mixing water
1.1 Q 1-7
3 Mon 3/12
p. 7-8 To recall the Zeroth and First Law of Thermodynamics
Prac: Thermal Equilibrium ..\Thermal Physics\Thermodynamics Worksheet
Exam type questions 1 170317.docx
..\Thermal Physics\Thermodynamics Exam type questions Solutions 150318.docx
1.1 Q 8-10
4 Wed 5/12
p.10-12 To describe specific heat and to use the relationship Q = mcΔT.
Prac: Cooling Parrafin wax
1.2 Q 1-10
5
6/12
p 13-16 To describe latent heat and to use the relationship Q = mL. To use the kinetic particle model to explain evaporation and cooling
Prac Martins Pracs\latent heat of fusion of ice.docx
1.3 Q 1-9
Holiday Homework
1. Revision for quiz Chap 1.1 – 1.3 2. Complete Thermodynamics Exam type questions – solutions STLlink 3. Appendix 1 Skills Check (questions and solutions on STLlink) – quiz first
lesson back in 2019 SI units Qs A1.1
Scientific notation Qs A1.2
Significant figures Qs A1.3
Graphical analysis Qs A1.4
Direct Variation Qs A1.5

Lesson 1&2 Outcome By the end of be able to convert temperatures stated in C into Kelvin, state the difference between Heat and Temperature and be able to explain heat using kinetic theory.
Temperature Gun Use a temperature gun to measure the temperature of a number of different objects and surfaces inside and outside the room. What factors will affect your reading? What is the temperature gun actually detecting?
Mixing water To predict and then measure the effects of mixing hot and cold water. Equipment Cups Measuring cylinder beakers Hot water cool water You will run three tests of mixing the same volumes of water. Each test should use water at different temperatures.
Set up the table below: Temp of cup A Temp of Cup B Predicted temp of mix Tempt of mix
Questions 1. What is happening? Can you give a rule to predict the temperature? 2. We controlled the volumes, why? 3. What other factors could effect this test?

Lesson 3 OUTCOME By the end of this lesson you will be able to recall the Zeroth and First Law of thermodynamics and apply it to relevant situations.
Thermal equilibrium 1. Place a small beaker (or conical flask with rubber stopper) of hot water immersed in a beaker of cold water 2. Determine the mass of the water in each beaker (using electronic scales) mass hot water ____________ mass cold water _________________ 3. Open Pasco Capstone on the laptops choose graph plus table 4. Connect two Pasco temperature probes to track the temperature of both beakers over a 20 minute time period
Choose time for the x-axis and choose Probe A and Probe B for y-axis (using ‘add similar measurement’). Press record when ready to start taking measurements.
4. Also note the ambient room temperature
Before the experiment: What do you expect to happen to the temperature of both beakers (estimate any 'final' temperatures of the two)? After the experiment Questions 1. Compare your expected final temperatures with actual final temperatures. Try to account for your results

2. Assuming that the beakers were a closed system, calculate the expected final temperature
3. In this experiment, the mass of the hot water was significantly less than the cold. Do you think this had a bearing on the final outcome? Explain 4. If the experiment was left to run long enough, what do you think the final temperatures would be? Use you data to make this prediction.

Lesson 4 OUTCOME By the end of this lesson you will be able to describe specific and latent heat. You will be able to explain and apply the relationship Q = mcΔT
Cooling Paraffin wax This investigation aims to show that the internal energy of a substance can change without a subsequent change in temperature. It also aims to produce a cooling curve that illustrates the concept of latent heat. You will need the following equipment:
• large test tube containing about 2–3 cm depth of paraffin wax • Water bath on hot plate • Pasco temperature probe connected to Pasco Capstone, choose graph and table
Place some solid paraffin wax into a large test tube. Heat the test tube in a water bath until the temperature of the paraffin wax is about 80 °C.
Remove the test tube from the water bath and start recording the temperature of the paraffin as it falls until the temperature has fallen to about 30 °C. Gently and carefully stir with the thermometer while the liquid paraffin is cooling.
1. Take a photo of the graph on the screen 2. What causes the decrease in temperature of the liquid paraffin?
3. How does the rate of cooling change as the liquid paraffin solidifies?
4. During the process of solidification, what form of internal energy is being lost from the paraffin? Where is it going? 5. What is the meaning of the term ‘latent heat of fusion’ and how does it relate to this investigation?

Lesson 5 OUTCOME By the end of this lesson you will be able to describe latent heat. You will be able to explain and apply the relationship Q = mL and use the particle model to explain evaporation and cooling. Latent heat of fusion or melting of Ice: The latent heat of ice refers to the number of joules of energy needed to melt 1 kg of ice. This is also
the amount of heat that needs to be removed from 1 kg of water when making ice. The temperature of the H2O does not change as it melts or freezes, that is why it is called latent heat – a thermometer does not indicate its presence.
Instructions • Add a quantity of warm/hot water to a beaker. • Determine the mass of the water. Take the temperature of the water. • Measure the temperature of the ice • Add ice to the water and find final temperature. • Find the mass of the mix resulting in order to find the mass of ice added. Results Mass of water (kg)
Initial temperature of ice
Initial temperature of the water
Final temperature of water
Final Mass (kg)
Mass of ice (kg)
1. Calculate the amount of heat needed to cool the original water (using Q1 = mc∆T) c = 4200Jkg-1 K-1
2. Calculate the amount of heat needed to warm the melted ice (using Q2 = mc∆T) 3. Calculate the difference between these values. (Qdiff = Q1 – Q2) This value is the amount of energy
taken from the water in order to melt the ice. If the ice was at approximately 0oC Qdiff can be used to determine the latent heat of fusion of ice.*
*Note: if your ice started at a temperature significantly below 0oC you should first calculate the amount of energy needed to raise the solid ice up to 0oC by using cice = 2100Jkg-1 K-1 . This amount of energy should be added to your Q2 value 4. Calculate the latent heat of ice (using Qdiff = mLf) 5. Compare you answer to, and explain any differences between your answer and, the accepted value.

Yr 11 Physics Thermodynamics – Exam Type Questions Worksheet 1 Name:____________________
Question 33
If the temperature of an object is lowered, what happens to the average kinetic energy of its particles? Question 34
A 220 mL glass full of water is in thermal equilibrium with the table it rests on. Further along the table an alcohol thermometer reads 23 ºC and rests a test tube of hydrochloric acid. The hydrochloric acid is in thermal equilibrium with the table. What is the temperature of the water? Question 36
A pot of water is placed on the stove to heat up. What is happening to the water molecules while they heat up? (select only one answer)
A They are gaining translational kinetic energy
B They are gaining internal energy
C They are losing energy
D They are maintaining a constant level of energy, as energy cannot be created or destroyed. Question 43
A hot brick does 40 kJ of work on the table it is sitting on. The brick also transfers 15 kJ of thermal energy into the air. What is the change in internal energy of the brick? Question 45
A scientist very carefully does mechanical work on a container of liquid sodium. The liquid loses 320 J of energy to the atmosphere, but gains 230 J of energy overall. How much work did the scientist do? Question 47
Calculate the heat (thermal energy) required to raise the temperature of 5 kg of brass from 10ºC to 60ºC. The specific heat capacity of brass is 377 J kg-1 K-1

Question 48
Equal amounts of heat are absorbed by 100 g samples of various solid metals with differing specific heat values. Which of the following statements is true regarding metals and their specific heat values? A The metal with the smallest specific heat will undergo the smallest change in temperature. B The metal with the greatest specific heat will undergo the greatest change in temperature C The metal with the greatest specific heat will undergo the smallest change in temperature. Question 50
A lump of metal was transferred to 1 kg of water and the temperature of the water increased from 20 ºC to 54 ºC. Find (i) the energy lost by the metal (ii) the energy gained by the water. Question 51
A 1.5 kg sample is placed in an oven and heated 5 °C. The energy used to do this was 4560 J. What is the specific heat capacity of this material? Referring to your notes, what material might this sample be? Question 53
How many joules of energy are lost when 865 g of aluminium cools from 120 °C to 55 °C? (specific heat capacity = 8.80 x 10² J kg-1 K-1). Question 54
In an experiment, 1.1 kg of aluminium is heated to 92 ºC. It is then dropped into 0.5 kg of water at 12 ºC. Find the final temperature of the mixture. (cwater = 4 200 J kg-1 K-1, caluminium = 880 J kg-1 K-1), (hint: find the equilibrium temperature of the mixture)

Question 57
If 100 g of water at 95°C is poured into a 500g glass cup (with an initial temperature of 25 °C), what is the final temperature of the water and the cup? (specific heat capacity of glass= 8.42x10² J kg-1K-1), (hint: find the equilibrium temperature of the mixture) For questions 58 - 65 use the following information about water lv = 2.3 × 10⁶ J kg-1, lf = 3.35 × 10⁵ J kg-1, cw = 4 200 J kg-1 K-1, cice = csteam = 2 100 J kg-1 K-1
Question 58
How much energy (in the form of heat) is required to melt 4 kg of ice at its melting point? Question 59
Calculate the energy (in the form of heat) required to boil completely to a gas 0.2 kg of water at 100 ºC. Question 60
Calculate the energy (in the form of heat) required to convert 4.0 kg of water at 10 ºC to steam at 100 C, (hint: need to heat water to boiling and then change state). Question 61
What is the energy (in the form of heat) required to raise the temperature of 1 kg of water from 0ºC to 100ºC, and the energy required to change 1 kg of water at 100 ºC to steam? Therefore, what energy is required to turn 1 kg of water, initially at 0 ºC, into steam?

Question 62
Calculate the energy required to convert 0.4 kg of ice at 0 ºC to steam at 100ºC. (hint: need to melt ice, heat water to boiling and then change state) Question 63
How much energy is required to melt 5.5 kg of ice at 0 ºC? Question 64
How much energy is released when 350 g of steam at 100 ºC condenses to water at 100 ºC? Question 65 - Extension
100 g of ice at 0 ºC is added to an insulated chamber containing 20 g of steam at 100 ºC. What is the final temperature of the 120 g of water? (hint: find equilibrium temp but include energy for changing state)
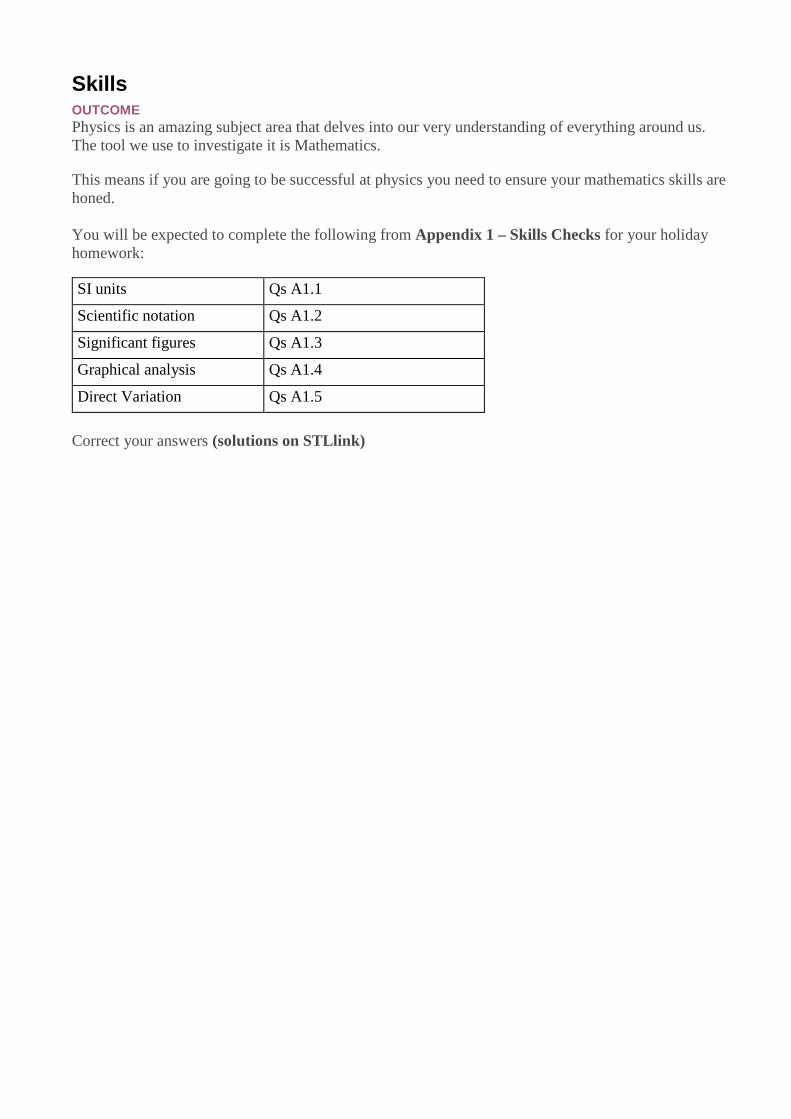
Skills OUTCOME Physics is an amazing subject area that delves into our very understanding of everything around us. The tool we use to investigate it is Mathematics.
This means if you are going to be successful at physics you need to ensure your mathematics skills are honed. You will be expected to complete the following from Appendix 1 – Skills Checks for your holiday homework: SI units Qs A1.1
Scientific notation Qs A1.2
Significant figures Qs A1.3
Graphical analysis Qs A1.4
Direct Variation Qs A1.5 Correct your answers (solutions on STLlink)

Significant Figures
The accuracy of a measurement is expressed by the number of significant figures used in reporting a result. If the length of a sheet of paper is 21.3 cm then we are saying that we are reasonably sure about the 3rd digit but have no idea of the 4th digit. Significant figures are those measurements that are accurately known. Rules for significant figures: 1. In any measurement all non zero figures are significant: eg. 271.3 contains 4 sig. figs. 2. Zeros between non-zero digits are significant: eg. 70203 contains 5 sig. figs. eg. 2.001 contains 4 sig. figs. 3. Zeros ending a number are not significant unless after a decimal point. eg. 1800 contains 2 sig. figs. eg. 180.0 contains 4 sig. figs. eg. 2000 contains 1 sig. figs. eg. 2.00 contains 3 sig. figs. 4. Zeros before the first significant figure are not significant. eg. 0.000031 contains 2 sig. figs. eg. 0.45 contains 2 sig. figs. eg. 0.01 contains 1 sig. figs. Rules for calculations: 1. When adding or subtracting measurements, the measurement in the calculation with the least number of decimal places determines the number of decimal places in the answer. eg. 4.821cm - 1.2 cm = 3.621 = 3.6 cm eg. 9.2 cm - 4.122 cm = 5.078 = 5.1 cm eg. 9.200 cm- 4.122 cm = 5.078 cm 2. When multiplying or dividing one measurement by another, the measurement in the calculation with the least number of significant figures determines the number of significant figures in the answer. eg. 1.2 cm x 1.21 cm = 2.662 = 2.7 cm eg. 4.55 cm x 9.222 cm = 41.9601 = 42.0 cm eg. 4.10 cm x 6.232 cm = 25.5512= 25.6 cm In the following problem: 3 x 2.2222 cm = 6.6666 cm the answer is expressed with 5 significant figures because the only measurement in the calculation has 5 significant figures. You do not include the 3 in determining the number of significant figures because it is an exact number and not a measured quantity. It really has the value of 3.0000000000...........

Name……………….. Uncertainty
1. Write the following measurements as accurately as possible:
a) Two wooden planks are placed end to end. One is 5.4m and the other is 4.65m. What
is their combined length?
b) A 9.63m post has 1.2 m cut from the top. How tall is it now?
c) A rectangular football pitch is measured by two people. Sharon measures the length as 42.8m. Jess measures the width as 19m. What is the area of the pitch?
2. When a voltage V of 12.2 V is applied to a DC motor, the current I in the motor is 0.20 A. Which one of the following is the output power VI of the motor given to the correct appropriate number of significant digits?
A. 2 W
B. 2.4 W
C. 2.40 W
D. 2.44 W
3. A student measures the current in a resistor as 677 mA for a potential difference of 3.6 V. A calculator shows the resistance of the resistor to be 5.3175775 Ω. Which one of the following gives the resistance to an appropriate number of significant figures?
A. 5.3 Ω
B. 5.32 Ω
C. 5.318 Ω
D. 5.31765775 Ω
4. Which one of the following measurements is stated correctly to two significant digits?
A. 0.006 m
B. 0.06 m
C. 600 m
D. 620 m

Answers
1. a) 0.8m
b) 8.4m
c) 810 m^2
2. B
3. A
4. D

Yr 11 Physics Transition – Graphing task using Excel Outcome By the end of these lessons you will be able to use Excel to calculate values in a table and graph results. You will also be able to predict the type of graph expected from a mathematical relationship. Graphing If a variable 'y' is always equal to a constant 'k' multiplied by another variable 'x', ie. y = kx, y is said to be directly proportional to x. This relationship can be represented graphically as a straight line going through the origin.
The variable along the conventional x -axis should always be the independent variable, and the y-axis should be the dependent variable, ie. its value depends on the value on the x-axis. Often in experiments, when we plot the data, we don't get a perfect straight line from our results. It is often appropriate to draw a line of 'best fit', which is a line through as many points as possible with as many above the line as are below the line. General shapes for common relationships
this last graph is often referred to as the inverse square graph.
Using graphs The process of 'interpolation' is when a graph is used to find points between measured values. Continuing the curve beyond either extreme of the given information to locate new points is called 'extrapolation'. These are most accurate when there is initially a large number of values, and extrapolation really only is used when the graph is a straight line. We will often reorganise the axes to create a straight line graph.
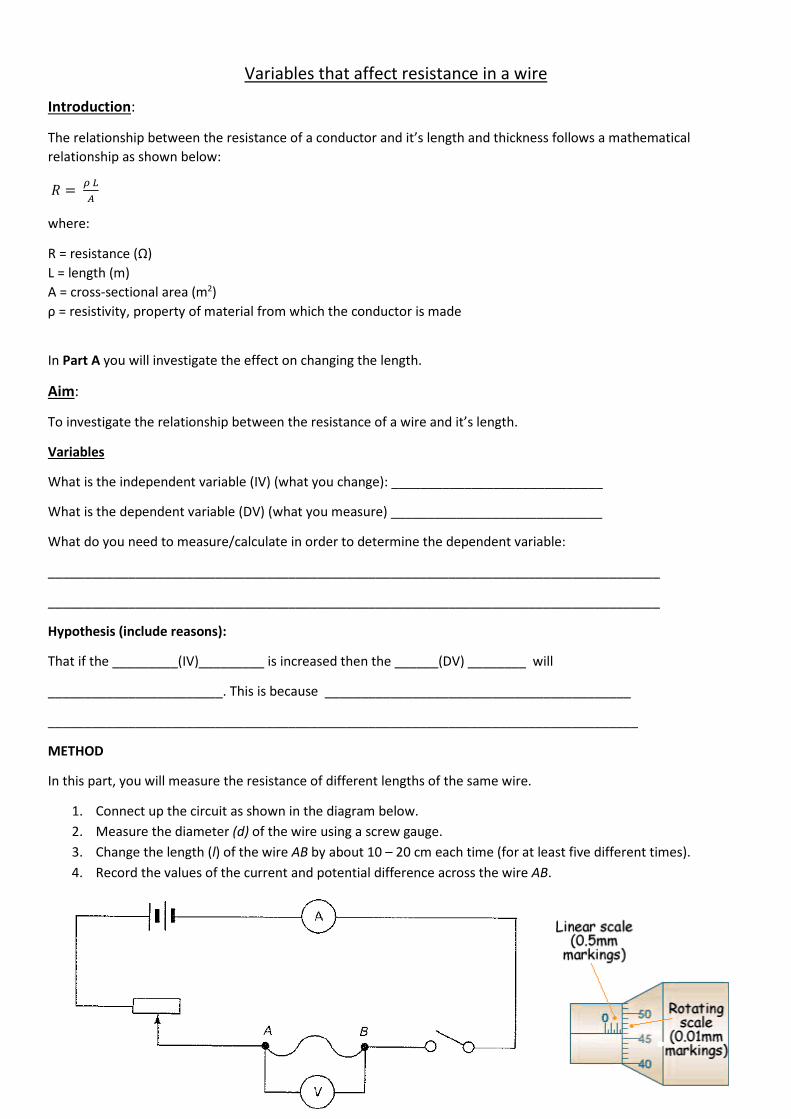
Variables that affect resistance in a wire
Introduction:
The relationship between the resistance of a conductor and it’s length and thickness follows a mathematical relationship as shown below:
𝑅𝑅 = 𝜌𝜌 𝐿𝐿𝐴𝐴
where:
R = resistance (Ω) L = length (m) A = cross-sectional area (m2) ρ = resistivity, property of material from which the conductor is made
In Part A you will investigate the effect on changing the length.
Aim:
To investigate the relationship between the resistance of a wire and it’s length.
Variables
What is the independent variable (IV) (what you change): _____________________________
What is the dependent variable (DV) (what you measure) _____________________________
What do you need to measure/calculate in order to determine the dependent variable:
____________________________________________________________________________________
____________________________________________________________________________________
Hypothesis (include reasons):
That if the _________(IV)_________ is increased then the ______(DV) ________ will
________________________. This is because __________________________________________
_________________________________________________________________________________
METHOD
In this part, you will measure the resistance of different lengths of the same wire.
1. Connect up the circuit as shown in the diagram below. 2. Measure the diameter (d) of the wire using a screw gauge. 3. Change the length (l) of the wire AB by about 10 – 20 cm each time (for at least five different times). 4. Record the values of the current and potential difference across the wire AB.

Results
Raw data (refer Excel spreadsheet): Graphing Task Resistance of wire prac data 191118.xlsx
Processed data:
(what are you going to graph)
(IV) l(m) (DV) Avg R (Ω)
Graph your results
Questions:
1. What is the published resistivity (ρ) of the metal wire _____________________ 2. Describe the graph above. What is the relationship between the resistance R and length l of a wire? What
does the gradient represent? 3. Calculate the cross sectional area of your wire 4. Calculate the measured resistivity (ρ). Compare this to the published value. How close are the two values?
Calculate the percentage (%) error.
Resistance of a wire prac
Length of wire (m) 0.25 Diamter (mm) 0.75Power Supply (v) Voltage drop (v) Current (A) R = V/I Avg R (ohm)
2 0.08 0.244 0.11 0.336 0.16 0.48
Length of wire (m) 0.416 Diamter (mm)Power Supply (v) Voltage drop (v) Current (A) R = V/I Avg R (ohm)
2 0.09 0.184 0.16 0.326 0.24 0.47
Length of wire (m) 0.645 Diamter (m)Power Supply (v) Voltage drop (v) Current (A) R = V/I Avg R (ohm)
2 0.14 0.174 0.26 0.326 0.38 0.46
Length of wire (m) 1.2 Diamter (m)Power Supply (v) Voltage drop (v) Current (A) R = V/I Avg R (ohm)
2 0.2 0.154 0.38 0.36 0.56 0.44

Using Excel
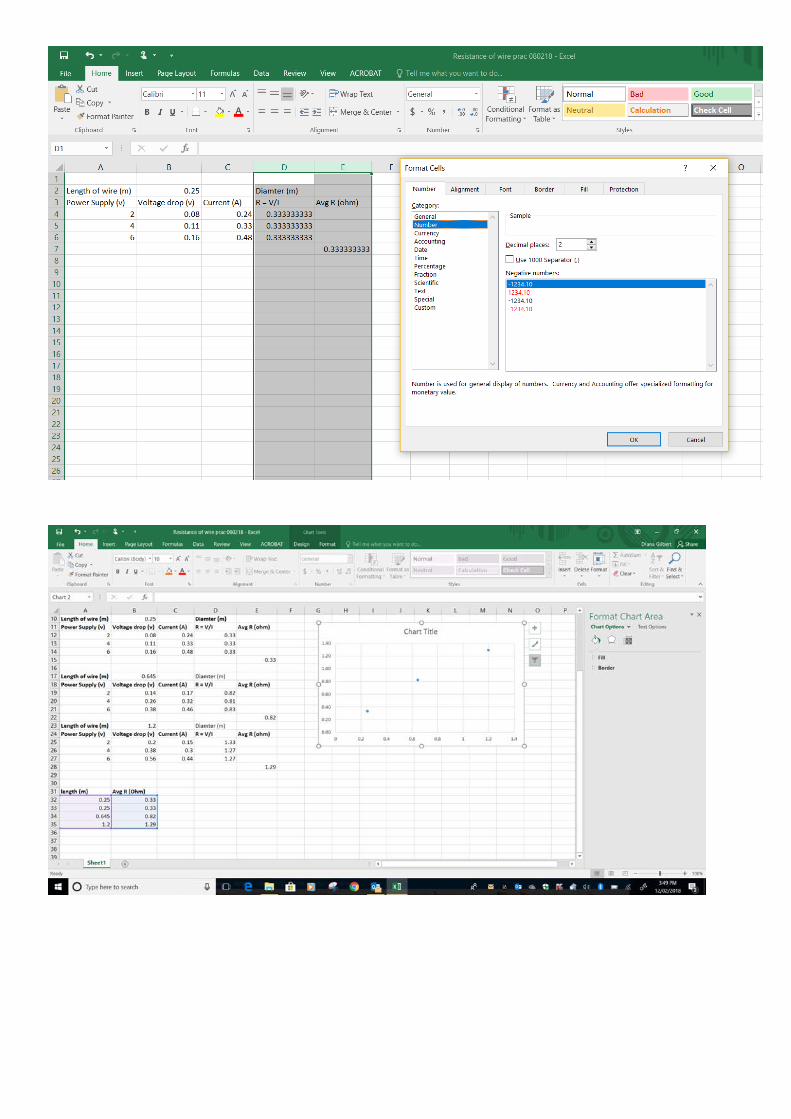

Choose select data