reading poverty needs analysis
TRANSCRIPT
READING POVERTY
NEEDS ANALYSIS
2017
Reading Poverty Needs Analysis 2017
2
CONTENTS Summary of indicators and direction of travel 4
Indicators which have improved 6
Indicators which have declined 8
1. Introduction 9
2. General Deprivation 10 National picture 10
Poverty in Reading 11
Index of Multiple Deprivation 2015 (IMD) 12
Census 2011 deprivation dimensions 14
IMD 2015: Income domain 14
Social Mobility Index 17
3. Child Poverty 18
National picture 18
Children in low income families local measure 19
End Child Poverty local measure 20
IMD 2015: Income deprivation affecting children index 22
Lone parent families 23
Pupil premium 23
Free school meals 25
Educational attainment 25
Youth offending 26
4. Work-related poverty 28 Out of work poverty 28
Claimant count 28
Key out of work benefits 29
IMD 2015: Employment domain 30 In-work poverty 32
Children in households claiming tax credits 32
Median pay 32
Income distribution 33
Living wage 33
Economic activity rate 34 Skills and qualifications 34
Working age qualifications 34
19 year olds gaining level 2 and 3 qualifications 37
Occupation profile 37
Not in education, employment or training (NEETs) 38
IMD 2015: Education, skills and training domain 38
5. Meeting Basic Needs 40 Homelessness 40
IMD 2015: Barriers to housing and services domain 41
Housing conditions 43
IMD 2015: Living environment domain 45

Reading Poverty Needs Analysis 2017
3
Fuel poverty 47
Food poverty 47
IMD 2015: Crime domain 49
6. Poverty and Health 50 Census overview 50
Reading health profile 52
Child health profile 54
Life expectancy and health inequalities 56
7. Poverty and Ethnicity 58 Census overview 58
Ethnicity in schools 58
Ethnicity and attainment 59
Free school meals 60
Health 60
JSA claimant count 61
8. Poverty amongst Older People 62 Census overview 62
Population projections 62
IMD 2105: Income deprivation affecting older people index 63
Excess winter deaths 64
Benefits claimants 64
9. Poverty and Disability 66 Census overview 66
Benefit claimants 68
IMD 2015: Health deprivation and disability domain 69
10. Debt 70 Reading Advice Agencies 71
Reading Poverty Needs Analysis 2017
4
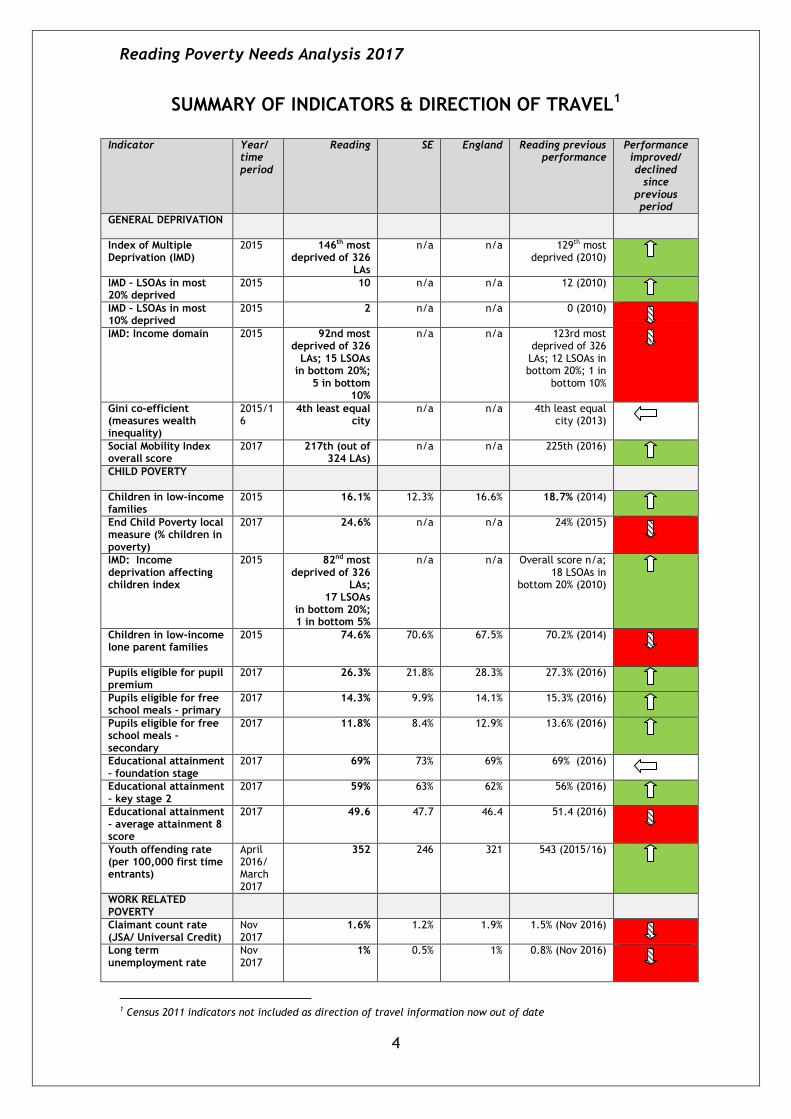
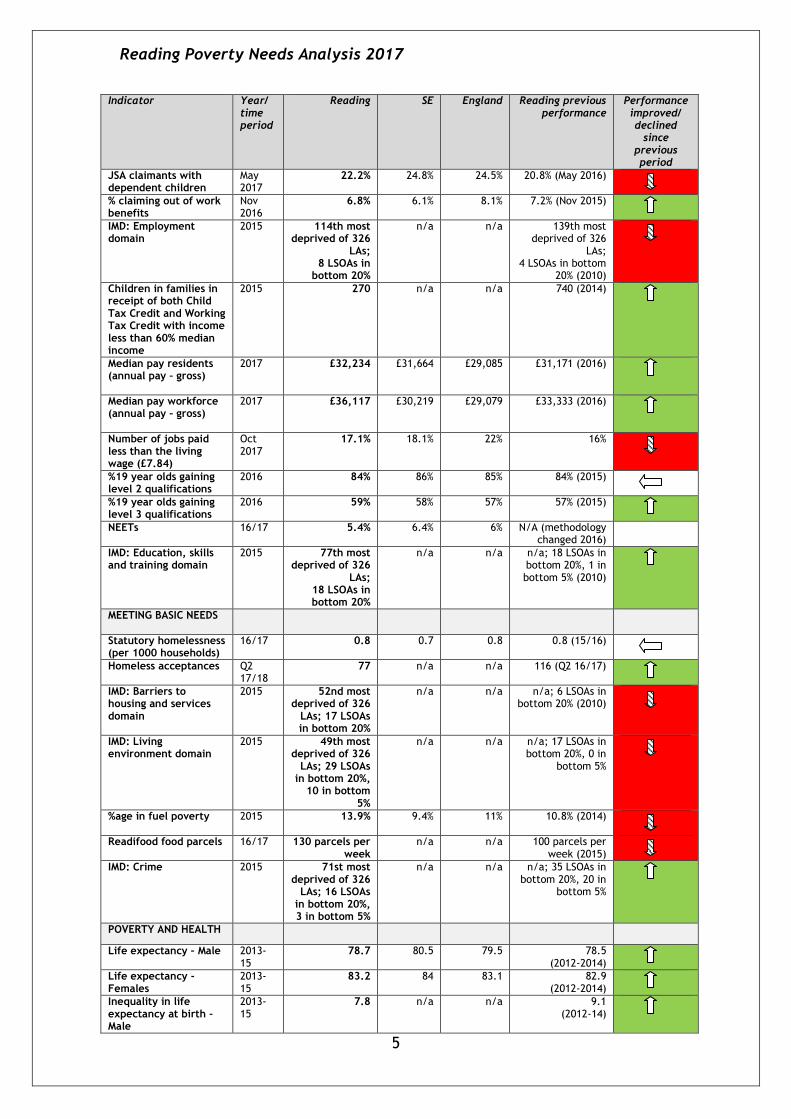
SUMMARY OF INDICATORS & DIRECTION OF TRAVEL1
Indicator Year/
time period
Reading SE England Reading previous performance
Performance improved/ declined
since previous period
GENERAL DEPRIVATION
Index of Multiple Deprivation (IMD)
2015 146th most deprived of 326
LAs
n/a n/a 129th most deprived (2010)
IMD – LSOAs in most 20% deprived
2015 10 n/a n/a 12 (2010)
IMD – LSOAs in most 10% deprived
2015 2 n/a n/a 0 (2010)
IMD: Income domain
2015 92nd most deprived of 326
LAs; 15 LSOAs in bottom 20%;
5 in bottom 10%
n/a n/a 123rd most deprived of 326 LAs; 12 LSOAs in bottom 20%; 1 in
bottom 10%
Gini co-efficient (measures wealth inequality)
2015/16
4th least equal city
n/a n/a 4th least equal city (2013)
Social Mobility Index overall score
2017 217th (out of 324 LAs)
n/a n/a 225th (2016)
CHILD POVERTY
Children in low-income families
2015 16.1% 12.3% 16.6% 18.7% (2014)
End Child Poverty local measure (% children in poverty)
2017 24.6% n/a n/a 24% (2015)
IMD: Income deprivation affecting children index
2015 82nd most deprived of 326
LAs; 17 LSOAs
in bottom 20%; 1 in bottom 5%
n/a n/a Overall score n/a; 18 LSOAs in
bottom 20% (2010)
Children in low-income lone parent families
2015 74.6%
70.6%
67.5% 70.2% (2014)
Pupils eligible for pupil premium
2017 26.3% 21.8% 28.3% 27.3% (2016)
Pupils eligible for free school meals - primary
2017 14.3% 9.9% 14.1% 15.3% (2016)
Pupils eligible for free school meals - secondary
2017 11.8% 8.4% 12.9% 13.6% (2016)
Educational attainment – foundation stage
2017 69%
73%
69% 69% (2016)
Educational attainment – key stage 2
2017 59%
63%
62% 56% (2016)
Educational attainment - average attainment 8 score
2017 49.6 47.7 46.4 51.4 (2016)
Youth offending rate (per 100,000 first time entrants)
April 2016/ March 2017
352 246 321 543 (2015/16)
WORK RELATED POVERTY
Claimant count rate (JSA/ Universal Credit)
Nov 2017
1.6% 1.2% 1.9% 1.5% (Nov 2016)
Long term unemployment rate
Nov 2017
1% 0.5% 1% 0.8% (Nov 2016)
1 Census 2011 indicators not included as direction of travel information now out of date
Reading Poverty Needs Analysis 2017
5
Indicator Year/ time period
Reading SE England Reading previous performance
Performance improved/ declined
since previous period
JSA claimants with dependent children
May 2017
22.2% 24.8% 24.5% 20.8% (May 2016)
% claiming out of work benefits
Nov 2016
6.8% 6.1% 8.1% 7.2% (Nov 2015)
IMD: Employment domain
2015 114th most deprived of 326
LAs; 8 LSOAs in
bottom 20%
n/a n/a 139th most deprived of 326
LAs; 4 LSOAs in bottom
20% (2010)
Children in families in receipt of both Child Tax Credit and Working Tax Credit with income less than 60% median income
2015 270 n/a n/a 740 (2014)
Median pay residents (annual pay – gross)
2017 £32,234 £31,664 £29,085 £31,171 (2016)
Median pay workforce (annual pay – gross)
2017 £36,117 £30,219
£29,079
£33,333 (2016)
Number of jobs paid less than the living wage (£7.84)
Oct 2017
17.1% 18.1% 22% 16%
%19 year olds gaining level 2 qualifications
2016 84% 86% 85% 84% (2015)
%19 year olds gaining level 3 qualifications
2016 59% 58% 57% 57% (2015)
NEETs
16/17 5.4% 6.4% 6% N/A (methodology changed 2016)
IMD: Education, skills and training domain
2015 77th most deprived of 326
LAs; 18 LSOAs in bottom 20%
n/a n/a n/a; 18 LSOAs in bottom 20%, 1 in bottom 5% (2010)
MEETING BASIC NEEDS
Statutory homelessness (per 1000 households)
16/17 0.8 0.7 0.8 0.8 (15/16)
Homeless acceptances Q2 17/18
77 n/a n/a 116 (Q2 16/17)
IMD: Barriers to housing and services domain
2015 52nd most deprived of 326
LAs; 17 LSOAs in bottom 20%
n/a n/a n/a; 6 LSOAs in bottom 20% (2010)
IMD: Living environment domain
2015 49th most deprived of 326
LAs; 29 LSOAs in bottom 20%,
10 in bottom 5%
n/a n/a n/a; 17 LSOAs in bottom 20%, 0 in
bottom 5%
%age in fuel poverty 2015 13.9%
9.4% 11% 10.8% (2014)
Readifood food parcels 16/17 130 parcels per week
n/a n/a 100 parcels per week (2015)
IMD: Crime 2015
71st most deprived of 326
LAs; 16 LSOAs in bottom 20%, 3 in bottom 5%
n/a n/a n/a; 35 LSOAs in bottom 20%, 20 in
bottom 5%
POVERTY AND HEALTH
Life expectancy – Male 2013-15
78.7 80.5 79.5 78.5 (2012-2014)
Life expectancy - Females
2013-15
83.2 84 83.1 82.9 (2012-2014)
Inequality in life expectancy at birth - Male
2013-15
7.8 n/a n/a
9.1 (2012-14)

Reading Poverty Needs Analysis 2017
6
Indicator Year/ time period
Reading SE England Reading previous performance
Performance improved/ declined
since previous period
Inequality in life expectancy at birth - Female
2013-15
6.5 n/a n/a 6.6 (2012-14)
Healthy life expectancy at birth - Male
2013-15
66.4 66 63.4 66.6 (2012-14)
Healthy life expectancy at birth - Female
2013-15
65.6 66.7 64.1 64.1 (2012-14)
See also separate health profile and child health profile tables
POVERTY AND ETHNICITY
% BME in primary schools
2017 56% n/a 32.4% 54% (2016) n/a
% BME in secondary schools
2017 53% n/a 29.1% 49% (2016) n/a
JSA – BME claimants
Nov 2017
28%
12.3% 25.3%
27.1% (Nov 2016) n/a
POVERTY AMONGST OLDER PEOPLE
IMD: Income deprivation affecting older people index
2015 81st most deprived out of
326 LAs; 6 LSOAs in bottom 5%
n/a n/a n/a; 1 LSOA in bottom 5% (IMD
2010)
Excess winter deaths 2013-16
17.7 n/a 17.9 25.7 (2012-14)
Pension Credit claimants over 60
May 2017
13.9% 8.8% 12% 15% (May 2016)
JSA claimants over 50 Dec 2017
0.5% 0.3%
0.5%
0.4% (Dec 2016)
POVERTY AND DISABILITY
Disability Living Allowance claimants
May 2017
3.8% 4.6% 5.5% 4.7% (May 2016)
IMD: Health deprivation and disability domain
2015 109th most deprived out of
326 LAs; 3 LSOAs in
bottom 20%
n/a n/a n/a; 16 LSOAs in bottom 20% (IMD
2010)
INDICATORS WHICH HAVE IMPROVED
Indicator Year/
time period
Reading SE England Reading previous
performance
GENERAL DEPRIVATION
Index of Multiple Deprivation (IMD)
2015 146th most deprived of 326 LAs
n/a n/a 129th most deprived (2010)
IMD – LSOAs in most 20% deprived
2015 10 n/a n/a 12 (2010)
Social Mobility Index overall score
2017 217th (out of 324 LAs) n/a n/a 225th (2016)
CHILD POVERTY
Children in low-income families
2015 16.1% 12.3% 16.6% 18.7% (2014)
IMD: Income deprivation affecting children index
2015 82nd most deprived of 326 LAs; 17 LSOAs
in bottom 20%; 1 in bottom 5%
n/a n/a Overall score n/a; 18 LSOAs in
bottom 20% (2010)
Pupils eligible for pupil 2017 26.3% 21.8% 28.3% 27.3% (2016)

Reading Poverty Needs Analysis 2017
7
Indicator Year/ time period
Reading SE England Reading previous
performance
premium
Pupils eligible for free school meals - primary
2017 14.3% 9.9% 14.1% 15.3% (2016)
Pupils eligible for free school meals - secondary
2017 11.8% 8.4% 12.9% 13.6% (2016)
Educational attainment – key stage 2
2017 59%
63%
62% 56% (2016)
Youth offending rate (per 100,000 first time entrants)
April 2016/ March 2017
352 246 321 543 (2015/16)
WORK RELATED POVERTY % claiming out of work benefits
Nov 2016
6.8% 6.1% 8.1% 7.2% (Nov 2015)
Children in families in receipt of both Child Tax Credit and Working Tax Credit with income less than 60% median income
2015 270 n/a n/a 740 (2014)
Median pay residents (annual pay – gross)
2017 £32,234 £31,664 £29,085 £31,171 (2016)
Median pay workforce (annual pay – gross)
2017 £36,117 £30,219
£29,079
£33,333 (2016)
%19 year olds gaining level 3 qualifications
2016 59% 58% 57% 57% (2015)
IMD: Education, skills and training domain
2015 77th most deprived of 326 LAs;
18 LSOAs in bottom 20%
n/a n/a n/a; 18 LSOAs in bottom 20%, 1 in bottom 5% (2010)
MEETING BASIC NEEDS
Homeless acceptances Q2 17/18
77 n/a n/a 116 (Q2 16/17)
IMD: Crime 2015
71st most deprived of 326 LAs; 16 LSOAs in
bottom 20%, 3 in bottom 5%
n/a n/a n/a; 35 LSOAs in bottom 20%, 20 in
bottom 5%
POVERTY AND HEALTH
Life expectancy – Male 2013-15
78.7 80.5 79.5 78.5 (2012-2014)
Life expectancy - Females 2013-15
83.2 84 83.1 82.9 (2012-2014)
Inequality in life expectancy at birth - Male
2013-15
7.8 n/a n/a
9.1 (2012-14)
Inequality in life expectancy at birth - Female
2013-15
6.5 n/a n/a 6.6 (2012-14)
Healthy life expectancy at birth - Female
2013-15
65.6 66.7 64.1 64.1 (2012-14)
POVERTY AMONGST OLDER PEOPLE
Excess winter deaths 2013-16
17.7 n/a 17.9 25.7 (2012-14)
Pension Credit claimants over 60
May 2017
13.9% 8.8% 12% 15% (May 2016)
POVERTY AND DISABILITY
Disability Living Allowance claimants
May 2017
3.8% 4.6% 5.5% 4.7% (May 2016)
IMD: Health deprivation and disability domain
2015 109th most deprived out of 326 LAs;
3 LSOAs in bottom 20%
n/a n/a n/a; 16 LSOAs in bottom 20% (IMD
2010)

Reading Poverty Needs Analysis 2017
8
INDICATORS WHICH HAVE DECLINED
Indicator Year/ time period
Reading SE England Reading previous
performance
GENERAL DEPRIVATION
IMD – LSOAs in most 10% deprived
2015 2 n/a n/a 0 (2010)
IMD: Income domain
2015 92nd most deprived of 326 LAs; 15 LSOAs
in bottom 20%; 5 in bottom 10%
n/a n/a 123rd most deprived of 326 LAs; 12 LSOAs in bottom 20%; 1 in
bottom 10%
CHILD POVERTY
End Child Poverty local measure (% children in poverty)
2017 24.6% n/a n/a 24% (2015)
Children in low-income lone parent families
2015 74.6%
70.6%
67.5% 70.2% (2014)
Educational attainment - average attainment 8 score
2017 49.6 47.7 46.4 51.4 (2016)
WORK RELATED POVERTY Claimant count rate (JSA/ Universal Credit)
Nov 2017
1.6% 1.2% 1.9% 1.5% (Nov 2016)
Long term unemployment rate Nov 2017
1% 0.5% 1% 0.8% (Nov 2016)
JSA claimants with dependent children
May 2017
22.2% 24.8% 24.5% 20.8% (May 2016)
IMD: Employment domain 2015 114th most deprived of 326 LAs;
8 LSOAs in bottom 20%
n/a n/a 139th most deprived of 326
LAs; 4 LSOAs in bottom
20% (2010)
Number of jobs paid less than the living wage (£7.84)
Oct 2017 17.1% 18.1% 22% 16%
MEETING BASIC NEEDS
IMD: Barriers to housing and services domain
2015 52nd most deprived of 326 LAs; 17 LSOAs
in bottom 20%
n/a n/a n/a; 6 LSOAs in bottom 20% (2010)
IMD: Living environment domain
2015 49th most deprived of 326 LAs; 29 LSOAs in bottom 20%, 10 in
bottom 5%
n/a n/a n/a; 17 LSOAs in bottom 20%, 0 in
bottom 5%
%age in fuel poverty 2015 13.9%
9.4% 11% 10.8% (2014)
Readifood food parcels 16/17 130 parcels per week n/a n/a 100 parcels per week (2015)
POVERTY AND HEALTH
Healthy life expectancy at birth - Male
2013-15 66.4 66 63.4 66.6 (2012-14)
POVERTY AMONGST OLDER PEOPLE
IMD: Income deprivation affecting older people index
2015 81st most deprived out of 326 LAs;
6 LSOAs in bottom 5%
n/a n/a n/a; 1 LSOA in bottom 5% (IMD
2010)
JSA claimants over 50 Dec 2017
0.5% 0.3%
0.5%
0.4% (Dec 2016)
Reading Poverty Needs Analysis 2017
9
1. INTRODUCTION
Millions of people today are struggling to meet their needs, many from working families. Poverty is damaging, with a particular impact on the quality of family life, and can affect parenting, child development, mental health, education and learning, and the economy as a whole. There is therefore a financial as well as a moral imperative for tackling poverty. Failing to prevent children growing up in poor families is expensive for society, both in terms of direct costs to services during and after childhood, and in costs to the economy when children grow up. The Poverty Needs Analysis was first published in 2014 to support the development of the Council’s Tackling Poverty Strategy and action plan2, and has been revised annually since then, to help inform the development of the Council’s Corporate Plan and to provide context for the Council’s work to help tackle poverty in Reading.
This document provides an overview of the key poverty-related data for Reading and is structured broadly according to the themes of the original Tackling Poverty Strategy:
• General deprivation • Child poverty • Work-related poverty • Meeting basic needs • Poverty and health • Poverty and ethnicity • Poverty amongst older people • Poverty and disability • Debt
The ‘summary of indicators and direction of travel’ at the start of this document lists the indictors and shows whether they have improved or declined since the previous period (depending on the timescale for the data). However, this document also includes a number of older indicators and datasets, e.g. 2011 Census data, which are not included in the summary. In addition to the full document, there is also a series of summary factsheets, presenting the key data for each theme. These are available, along with this document, at http://www.reading.gov.uk/borough-profile.
This document forms the ‘poverty’ chapter of the Joint Strategic Needs Assessment (JSNA) for Reading, which describes the health, social care and wellbeing needs of Reading residents (http://www.reading.gov.uk/jsna). The JSNA looks at a wider range of factors that help shape the health and wellbeing of individuals, families and local communities, such as education, employment and the environment, and is a key source of information which
2 for further information, see report to Policy Committee at www.reading.gov.uk/article/8872/Policy-Committee-02-NOV-2015

Reading Poverty Needs Analysis 2017
10
is used by the Health and Wellbeing Board to agree the priorities that will inform the Health and Wellbeing Strategy3.
2. GENERAL DEPRIVATION
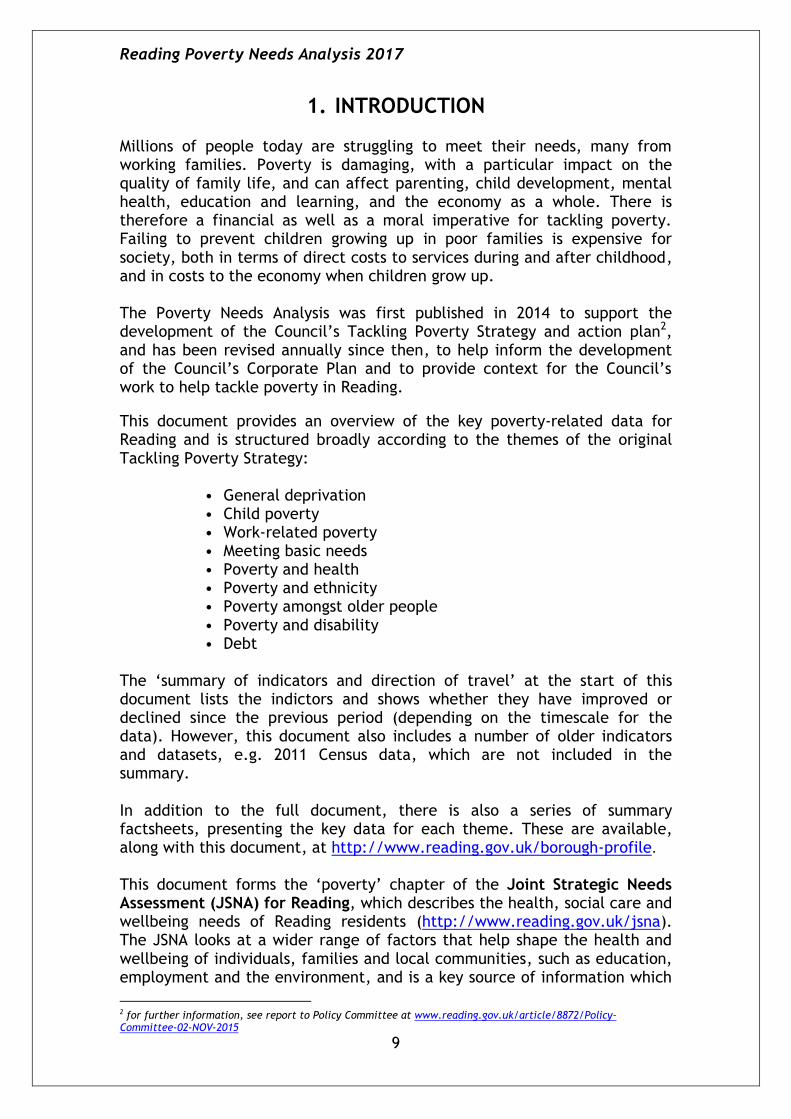
Poverty – the national picture Poverty is a very real phenomenon in the UK. The recent economic climate and significant reform of our national welfare system have meant that many households are increasingly struggling to make ends meet. On a European level, in 2014 the UK was firmly in the middle of the European league table on material deprivation, with higher levels of deprivation than Spain, the Czech Republic, France and Germany, among others.4 In the UK, nearly a quarter (24%) of the population lived in poverty 20 years ago. By 2004, this had fallen to one in five (20%). By 2016/17, the proportion has risen slightly to 22% - 14.3 million people, over one in five of the population5. On an alternative measure, the number of individuals below the Minimum Income Standard (MIS) rose from 15 million to 19 million (from 25% to 30% of the population) between 2008/9 and 2014/5, with 11 million people with incomes below 75% of the standard and at high risk of being in poverty.6 The Joseph Rowntree Foundation also forecast a 10% rise in living costs by 2020, which coupled with the increase in inflation means that millions more families are at risk of falling into poverty.
However, the overall trend masks large variations in the fortunes of different groups, particularly pensioners and certain types of families with children who have traditionally been most at risk, although poverty rates for both groups have started to rise again. Poverty amongst pensioners has increased again, from 13% in 2011/12 to 16% in 2015/16. However, poverty rates are consistently highest among children and their parents, with the child poverty rate rising again in recent years to 30% in 2015/16. This is largely due to reductions in the support offered by benefits and tax credits and exacerbated by increases in the cost of essential goods and services7.
3 http://www.reading.gov.uk/health-and-wellbeing-in-reading 4 UK Poverty: Causes, Costs and Solutions, Joseph Rowntree Foundation, 2016 5 Households Below Average Income 2016/17, DWP; after housing costs 6 The Minimum Income Standard (MIS) is a benchmark of adequate income based on what the public think people need for a minimum acceptable living standard in the UK. 7 UK Poverty 2017, Joseph Rowntree Foundation
Reading Poverty Needs Analysis 2017
11
Trends in UK poverty since 1994/5
Source: UK Poverty 2017, Joseph Rowntree Foundation
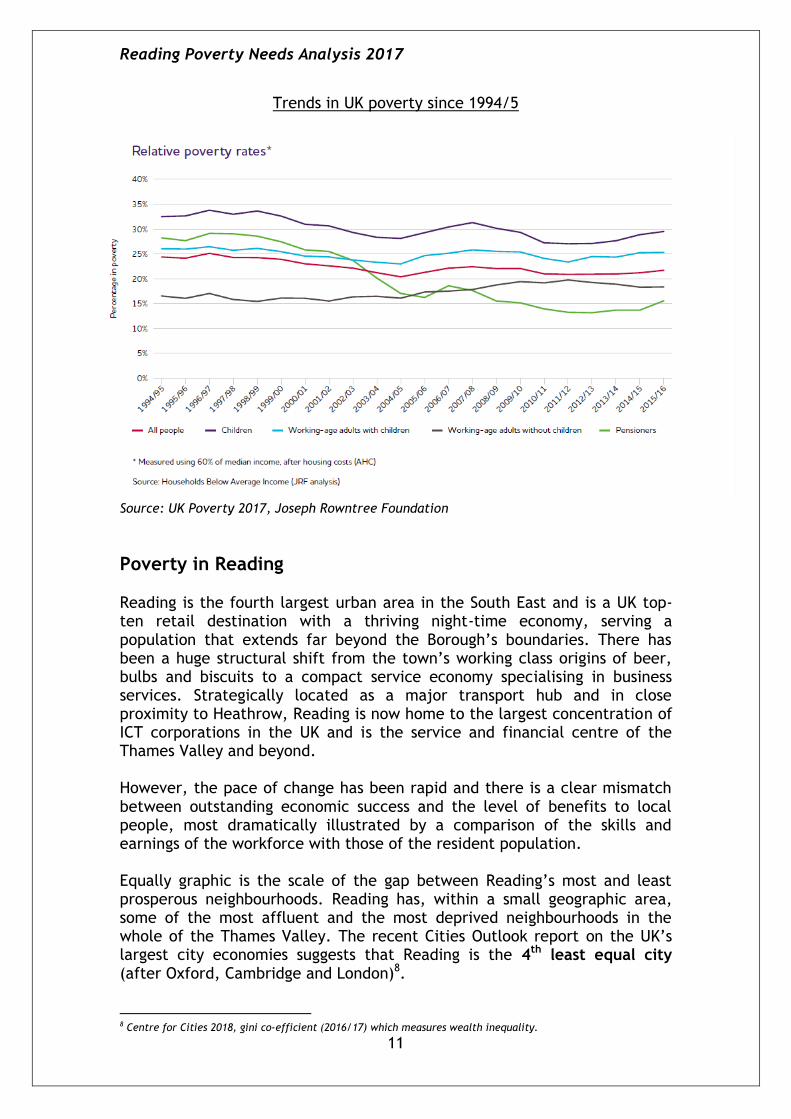
Poverty in Reading Reading is the fourth largest urban area in the South East and is a UK top-ten retail destination with a thriving night-time economy, serving a population that extends far beyond the Borough’s boundaries. There has been a huge structural shift from the town’s working class origins of beer, bulbs and biscuits to a compact service economy specialising in business services. Strategically located as a major transport hub and in close proximity to Heathrow, Reading is now home to the largest concentration of ICT corporations in the UK and is the service and financial centre of the Thames Valley and beyond. However, the pace of change has been rapid and there is a clear mismatch between outstanding economic success and the level of benefits to local people, most dramatically illustrated by a comparison of the skills and earnings of the workforce with those of the resident population. Equally graphic is the scale of the gap between Reading’s most and least prosperous neighbourhoods. Reading has, within a small geographic area, some of the most affluent and the most deprived neighbourhoods in the whole of the Thames Valley. The recent Cities Outlook report on the UK’s largest city economies suggests that Reading is the 4th least equal city (after Oxford, Cambridge and London)8.
8 Centre for Cities 2018, gini co-efficient (2016/17) which measures wealth inequality.
Reading Poverty Needs Analysis 2017
12
Reading has a diverse population across all income groups and a very wide cultural mix, with extremes of both wealth and poverty in very small areas. Poverty can therefore be masked by statistics at borough and even ward levels.
Index of Multiple Deprivation 2015
The most comprehensive and widely adopted overall measure of deprivation is the Index of Multiple Deprivation (IMD), which was updated in 2015 and replaces the previous 2010 index. The overall IMD combines indicators across 7 domains: income, employment, health, education skills and training, barriers to housing and services, living environment, and crime; and 2 supplementary indices – the index of income deprivation affecting children and the index of income deprivation affecting older people. For each of these there are separate scores.
According to the overall IMD, Reading as a whole is ranked the 146th9 most deprived out of 326 local authorities in the country, an improvement on 129th most deprived in 2010.
However, there are 10 Lower Super Output Areas (LSOAs)10 in Reading within the worst 20% nationally, with 2 LSOAs within the most deprived 10% (see map). This compares with 12 LSOAs in the most deprived 20% in 2010, but with none in the most deprived 10%. This suggests that while overall relative deprivation has decreased, it has actually increased in certain small areas within Reading.
This demonstrates how Reading exhibits marked extremes at a more refined locality level and, in this respect, is very different from any other local authority in the South East region. The following map shows the areas within Reading that have the highest levels of deprivation according to the IMD, predominantly in the south of the Borough but also in the west. In 2011 9.3% of Reading’s overall population and 13% of children and young people aged 0-17 years11 lived in the 20% most deprived LSOAs.
9 Rank of average score 10 Super Output Areas (SOAs) are a set of geographical areas developed following the 2001 census. Lower Layer
Super Output Areas (LSOAs) typically contain 4 to 6 OAs with a population of around 1500. 11 2011 Census data, Office for National Statistics

Reading Poverty Needs Analysis 2017
13
Index of Multiple Deprivation 2015 (most deprived LSOAs)
Source: Department for Communities and Local Government 2015
Reading Poverty Needs Analysis 2017
14
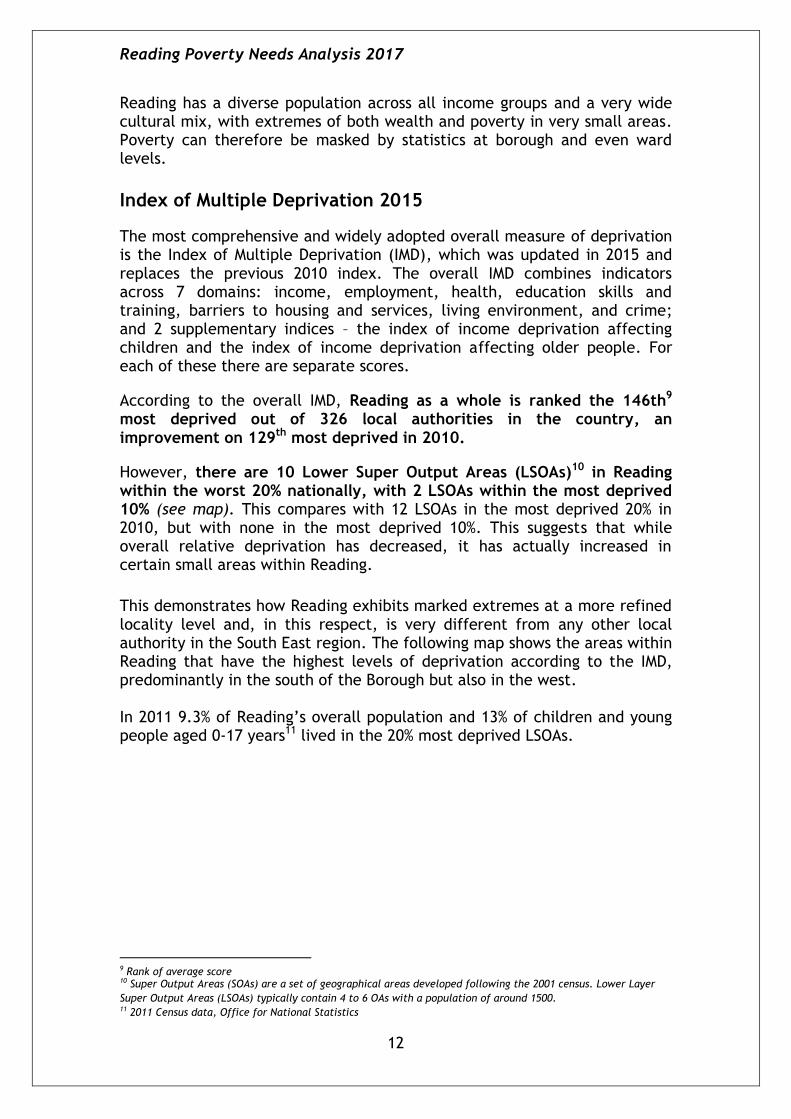
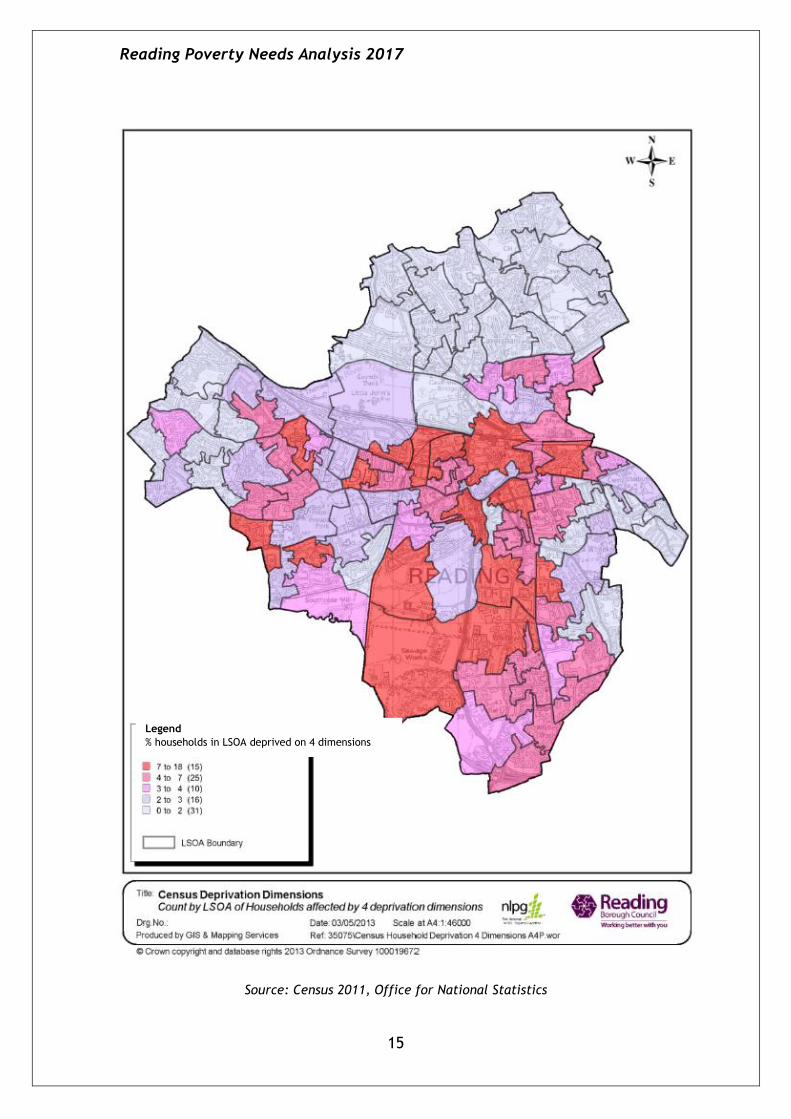
2011 Census deprivation dimensions This dataset classifies households in England and Wales by four dimensions of deprivation:
Employment
Education
Health and disability
Household overcrowding Deprivation dimensions All
households (count)
No households not deprived
in any dimension
No households
deprived in 1 dimension
No households
deprived in 2 dimensions
No households
deprived in 3 dimensions
No households
deprived in 4 dimensions
Abbey 6,331 2,657 2,308 1,013 299 54
Battle 4,480 1,922 1,480 769 276 33
Caversham 4,225 2,274 1,161 612 162 16
Church 3,287 1,187 1,160 722 200 18
Katesgrove 4,230 1,924 1,431 622 217 36
Kentwood 3,746 1,829 1,196 580 132 9
Mapledurham 1,179 704 374 95 6 0
Minster 4,532 2,105 1,496 700 203 28
Norcot 4,260 1,589 1,462 901 279 29
Park 3,842 1,985 1,234 473 137 13
Peppard 3,843 2,110 1,181 495 54 3
Redlands 3,567 1,804 1,102 494 144 23
Southcote 3,582 1,323 1,201 798 236 24
Thames 3,647 2,335 958 309 43 2
Tilehurst 3,715 1,613 1,228 731 134 9
Whitley 4,403 1,515 1,471 1,012 361 44
Source: Census 2011, Office for National Statistics
In comparison with the IMD, the Census deprivation dimensions data for Reading suggests that a number of additional areas are deprived, particularly Abbey and (part of) Caversham wards, New Town area and parts of Tilehurst, Whitley and Southcote (see map). This is likely to be due to the fact that the IMD includes a higher weighting for social housing, which tends to hide those who are poor but not in social housing.
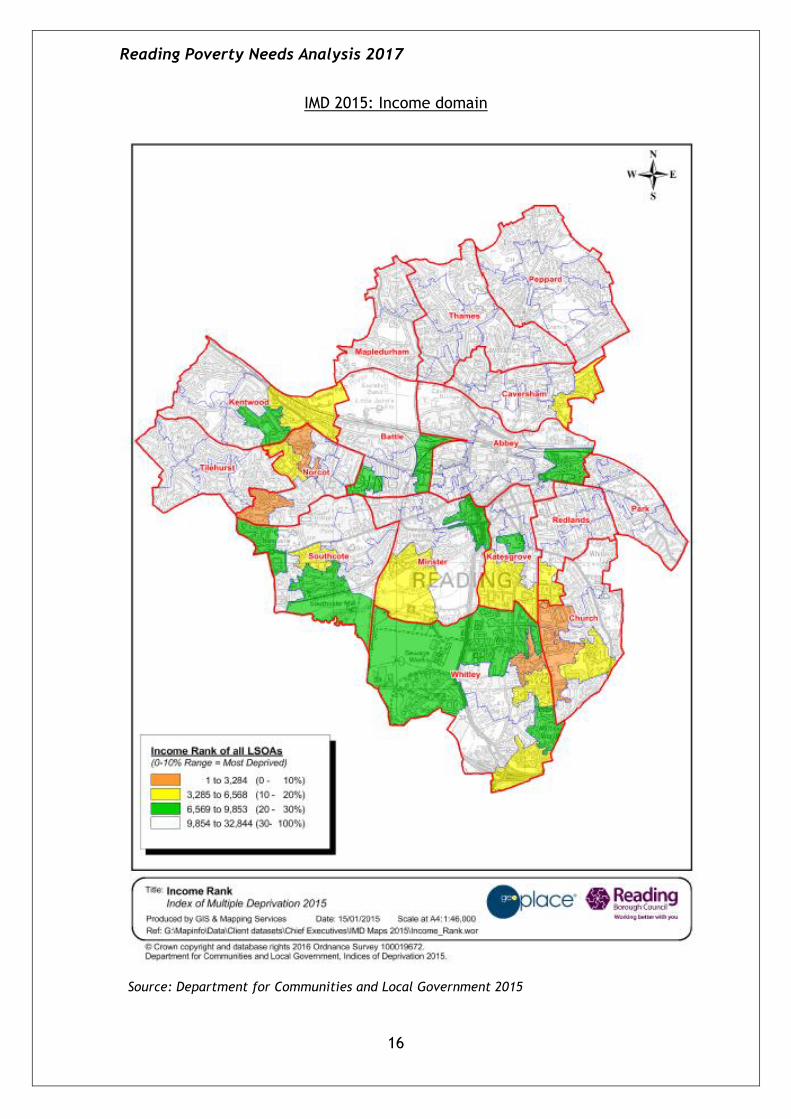
Index of Multiple Deprivation 2015: Income domain The IMD income domain measures the proportion of the population experiencing deprivation relating to low income. The definition of low income used includes both those people that are out-of-work, and those that are in work but who have low earnings (and who satisfy the respective means tests). Reading ranks 92nd out of 326 local authorities nationally on the IMD income domain, compared with 123rd in 2010, indicating that deprivation has increased. 15 LSOAs fall within the most 20% deprived nationally (12 in 2010) and 5 in the most 10% deprived (1 in 2010). Census 2011 deprivation dimensions - households deprived on 4 dimensions
Reading Poverty Needs Analysis 2017
15
Source: Census 2011, Office for National Statistics
Legend
% households in LSOA deprived on 4 dimensions
Reading Poverty Needs Analysis 2017
16
IMD 2015: Income domain
Source: Department for Communities and Local Government 2015
Reading Poverty Needs Analysis 2017
17
Social Mobility Index
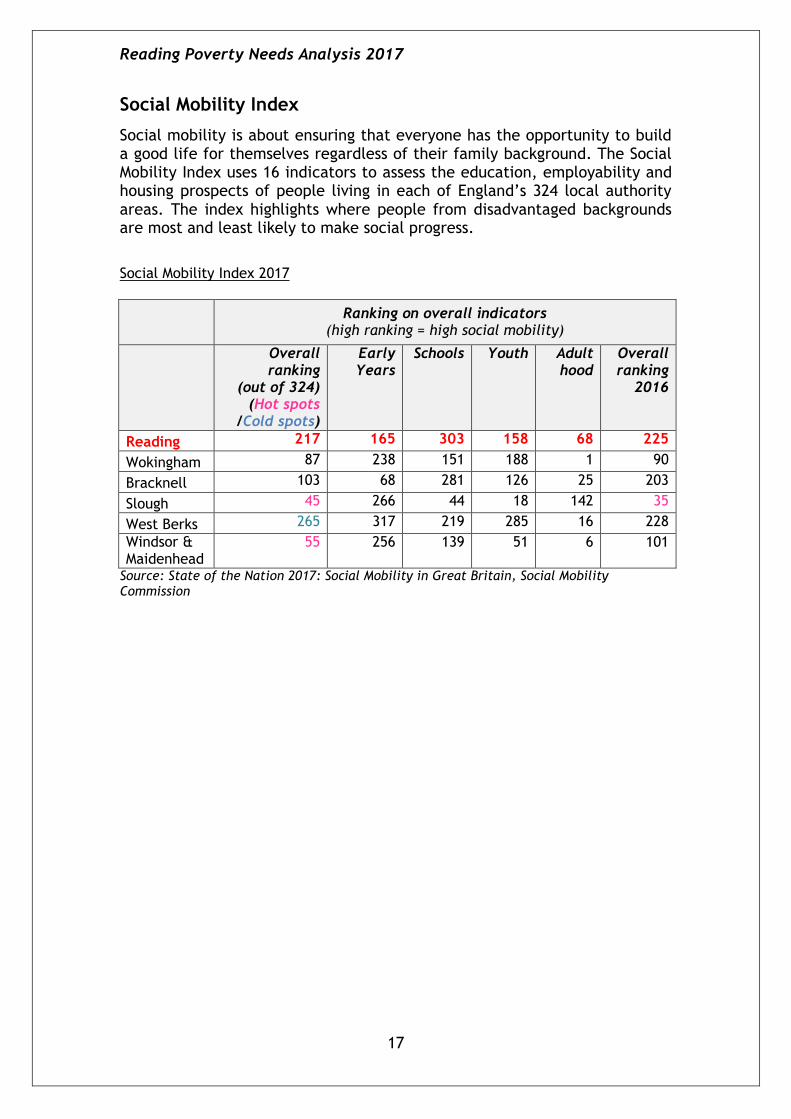
Social mobility is about ensuring that everyone has the opportunity to build a good life for themselves regardless of their family background. The Social Mobility Index uses 16 indicators to assess the education, employability and housing prospects of people living in each of England’s 324 local authority areas. The index highlights where people from disadvantaged backgrounds are most and least likely to make social progress.
Social Mobility Index 2017
Ranking on overall indicators (high ranking = high social mobility)
Overall ranking
(out of 324) (Hot spots
/Cold spots)
Early Years
Schools Youth Adult hood
Overall ranking
2016
Reading 217 165 303 158 68 225
Wokingham 87 238 151 188 1 90
Bracknell 103 68 281 126 25 203
Slough 45 266 44 18 142 35
West Berks 265 317 219 285 16 228
Windsor & Maidenhead
55 256 139 51 6 101
Source: State of the Nation 2017: Social Mobility in Great Britain, Social Mobility Commission
Reading Poverty Needs Analysis 2017
18
CHILD POVERTY National picture Child poverty in the UK reduced dramatically between 1998/9 and 2011/12, when 1.1 million children were lifted out of poverty. However, since then child poverty figures have more or less flat-lined. In 2016/17, over one in four children (around 4 million) or 30% of children are living in poverty (after housing costs)12, up from 27% in 2012/13. The Institute for Fiscal Studies project that the number of children in both relative and absolute poverty will have risen significantly by 202013, as a direct result of tax and benefit decisions made since 2010. Work no longer provides a guaranteed route out of poverty in the UK. Since 2010 there has been a dramatic decline in the number of children in workless households but a big rise in the proportion of poor children who are in working families. 24% of children growing up in poverty live in a family where at least one member works14.
However, over the last 20 years there have been very significant reductions in poverty among working-age families who were particularly at risk. Lone-parent families and families with three or more children have always had high rates of poverty but these have recently fallen markedly15. Child poverty has long-lasting effects. In terms of the number achieving at least 5 A*-C GCSE grades, there is a 28% gap between children receiving free school meals and their wealthier peers16. Infant mortality is 10% higher for infants in the lower social group than the average17. We also know from research carried out by Save the Children in 201118 that:
well over half of parents in poverty (61%) say they have cut back on food and over a quarter (26%) say they have skipped meals in the past year.
around 1 in 5 parents in poverty (19%) say their children have to go without new shoes when they need them.
a large number of children in poverty say they are missing out on things that many other children take for granted, such as going on school trips (19%) and having a warm coat in winter (14%).
only 1 in 5 parents in poverty (20%) say they have not had to borrow money to pay for essentials, such as food and clothes, in the past year.
12 Households Below Average Income, DWP 13 UK Poverty: Causes, Costs and Solutions, Joseph Rowntree Foundation, 2016 14 Households Below Average Income 2016/17; DWP 15 Poverty in the UK 2017; Joseph Rowntree Foundation 16 www.endchildpoverty.org.uk 17 www.barnardos.org.uk 18 End Child Poverty, Child Poverty map of UK, Feb 2013

Reading Poverty Needs Analysis 2017
19
In terms of government policy on child poverty, the Welfare Reform and Work Act 2016 repealed elements of the Child Poverty Act 2010, including the target of eradicating child poverty by 2020, as well as removing the previous duty on both national and local government to produce a child poverty strategy. The act also holds significant implications for how child poverty is defined and measured, with a move away from income-based measures of poverty and the introduction of broader measures of life chances, including educational attainment and worklessness.
Children in low-income families local measure Although the definitive national measure of relative child poverty is based on the Households Below Average Income (HBAI) data set, at the local level the ‘children in low-income families’ measure provides a broad proxy for relative low-income child poverty. This measures children living in families in receipt of out of work benefits or in receipt of in-work tax credits where their reported income is less than 60 per cent of median income. This measure is not directly comparable with the national HBAI measure due to methodological differences. On the children in low income families measure, Reading still broadly reflects the national picture with just over 1 in 6 children, or 16.1%, in poverty, down from 18.7% in 2014, reflecting the national trend. Child poverty in Reading year No children19 in families
in receipt of CTC (<60% median income) or
IS/JSA20
% of children in low-income
families
South East England
2015 5,685 16.1% 12.3% 16.6%
2014 6,585 18.7% 14.4% 19.9%
2013 6,230 17.8% 13.2% 18.0%
2012 6,470 18.8% 13.5% 18.6%
2011 6,945 20.8% 14.6% 20.1%
2010 7,110 21.7% 15.0% 20.6%
2009 7,020 22.1% 15.4% 21.3%
2008 6,640 21.5% 14.5% 20.9%
2007 6,760 22.3% 14.9% 21.6%
2006 6,420 21.2% 14.4% 20.8%
Source: HM Revenues and Customs
19 All dependent children under 20 20 CTC = Child Tax Credit; IS/JSA = Income Support/ Jobseekers Allowance

Reading Poverty Needs Analysis 2017
20
Child poverty by ward 2015 2014
Ward No children in families in receipt of CTC (<60%
median income) or IS/JSA
% of Children in low-income
families
No children in families in receipt of CTC (<60%
median income) or IS/JSA
% of Children in low-income
families
Abbey 310 16.7% 365 20.2%
Battle 475 15.7% 555 18.3%
Caversham 350 15.8% 405 18.2%
Church 525 22.3% 635 26.9%
Katesgrove 330 17.8% 375 20.9%
Kentwood 400 16.1% 440 17.9%
Mapledurham 10 1.6% 10 1.8%
Minster 345 16.1% 405 19.1%
Norcot 575 20.4% 645 23.3%
Park 300 12.9% 385 16.4%
Peppard 120 5.9% 165 8.1%
Redlands 220 15.8% 275 20.0%
Southcote 420 20.0% 465 22.4%
Thames 70 2.9% 80 3.2%
Tilehurst 320 14.7% 375 17.0%
Whitley 915 25.6% 1,000 28.2% Source: HM Revenues and Customs
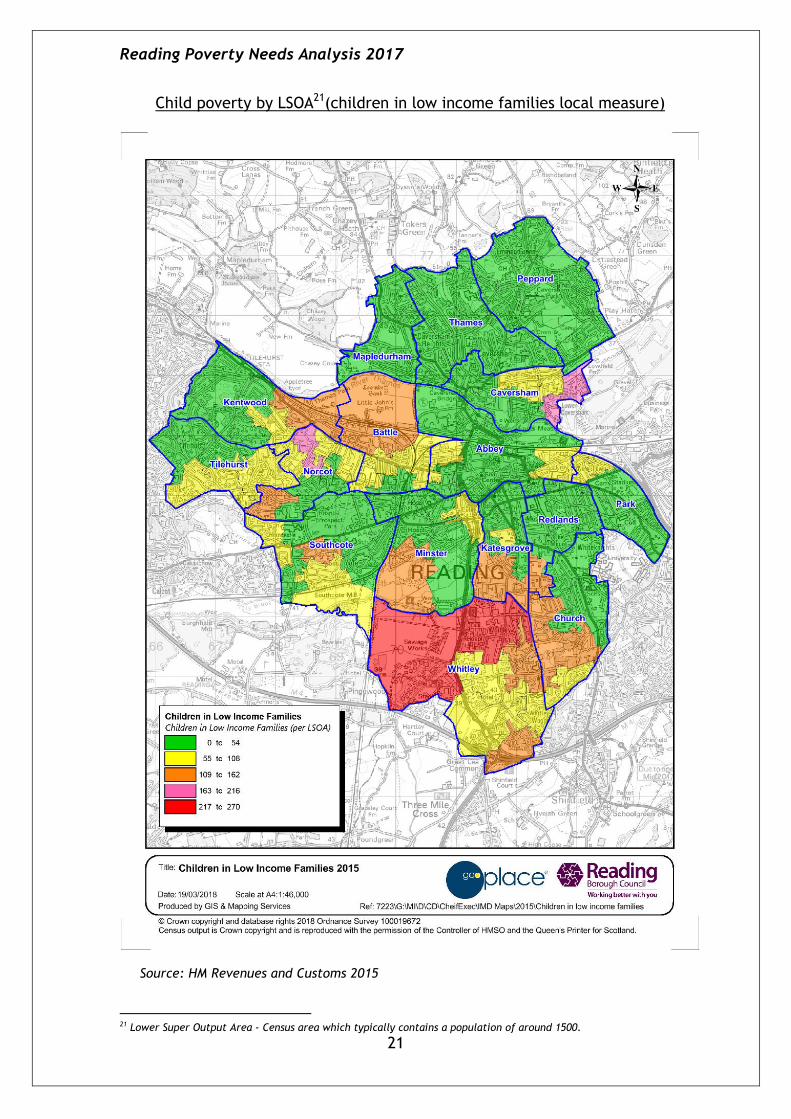
The table above shows that child poverty on this measure has decreased in all wards. The map of child poverty at LSOA level shows the highest numbers of children in relative poverty in areas of Whitley and Amersham Road, with a number also around the Oxford Road area.
End Child Poverty local measure According to the End Child Poverty coalition, the ‘children in low income families’ measure on its own provides an inaccurate picture of actual child poverty, overstating the numbers in out-of-work poverty and understating the numbers in working poverty. The End Child Poverty figures take the ‘children in low income families measure’ as a starting point and then they are adjusted to estimate what these actual levels would be if they could be measured on the same basis as the national household income survey. On this measure, 24.6% of children are in poverty in Reading (after housing costs), slightly higher than the previous figure in 2015.
Percentage of children in poverty
Before housing costs
After housing costs
Number of children
% Number of children
%
2017 5,477 15.5% 8,679 24.6%
2015 n/a 14.2% n/a 24.2%
Source: End Child Poverty, July-Sept 2017, Oct–Dec 2015
Reading Poverty Needs Analysis 2017
21
Child poverty by LSOA21(children in low income families local measure)
Source: HM Revenues and Customs 2015
21 Lower Super Output Area - Census area which typically contains a population of around 1500.

Reading Poverty Needs Analysis 2017
22
Index of Multiple Deprivation 2015: Index of income
deprivation affecting children The index of income deprivation affecting children is one of the domains forming the Index of Multiple Deprivation, with Reading ranking 82nd out of 326 local authorities. 17 Lower Super Output Areas (LSOAs) fall within the 20% most deprived nationally (down slightly from 18 in 2010), and these are home to 15.5%22 of children and young people in Reading. One LSOA falls within the 5% most deprived (a different area to the LSOA in the most deprived 5% in 2010). The 17 LSOAs in Reading which fall within the 20% most deprived on this index, mainly fall in south and west Reading.
IMD 2015: Index of income deprivation affecting children
Source: Department for Communities and Local Government 2015
22 Census 2011, Office for National Statistics

Reading Poverty Needs Analysis 2017
23
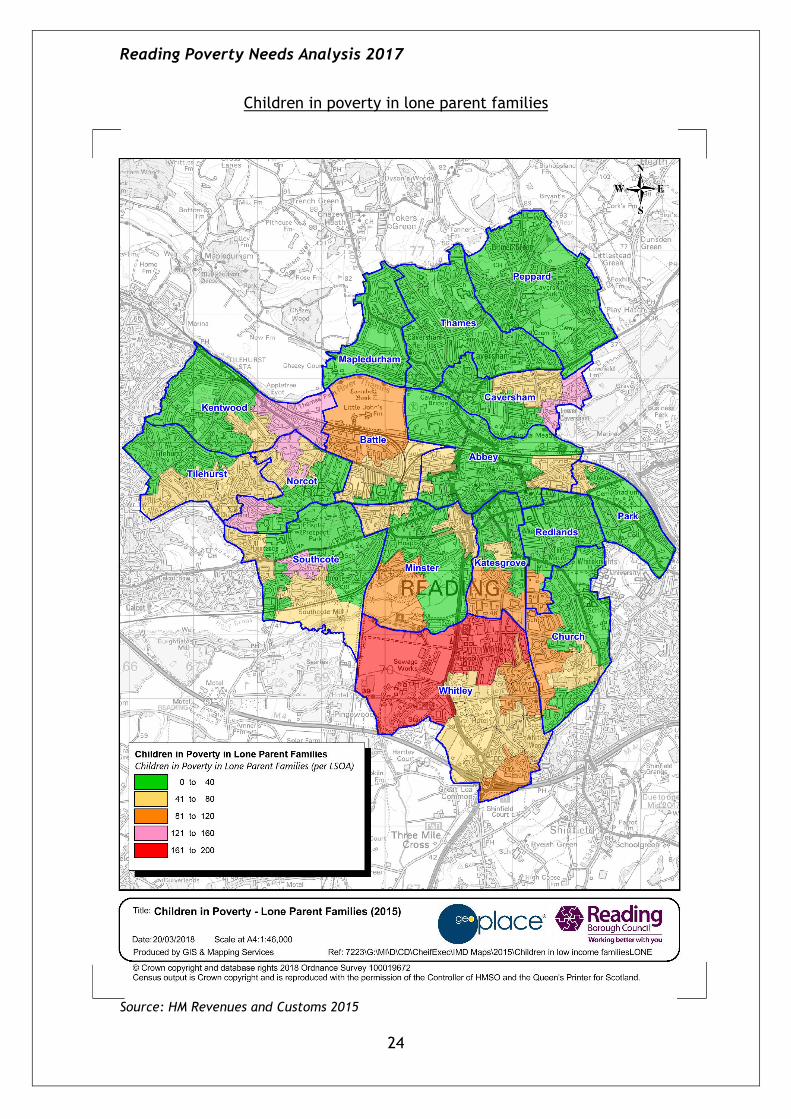
Lone parent families
Almost three quarters (74.6%) of children in poverty now live in lone parent families, higher than both the national and regional figures, and a higher proportion than in 2014 (70.2%). Not surprisingly, the map shows that lone parents claiming key benefits tend to be in areas with higher levels of child poverty. Children in lone parent families
No children in families in receipt of CTC (<60% median
income) or IS/JSA
% children in families in receipt of CTC (<60%
median income) or IS/JSA
% of Children23
in "poverty"
Couple
Lone
parent All Couple Lone
parent All families
Reading 1,450 4,240 5,685 25.5% 74.6% 16.1%
South East 66,535 159,980 226,515 29.4% 70.6% 12.3%
England 627,585 1,301,700 1,929,285 32.5% 67.5% 16.6%
Source: HM Revenues and Customs 2015
Pupil premium
The pupil premium is additional funding given to schools so that they can support their disadvantaged pupils and close the attainment gap between these pupils and their peers. It is allocated to schools to work with pupils who have been registered for free school meals at any point in the last six years24. 26.3% of Reading pupils are eligible for pupil premium (5,053 pupils), the highest percentage in Berkshire, compared with 21.8% for the South East and 28.3% for England. This has decreased since the previous year, when 27.3% were eligible in 2016/17.
0 10 20 30
England
South-East
Reading
Wokingham
Windsor and…
West Berkshire
Slough
Bracknell Forest
% of pupils eligible for Pupil Premium 2017/18
% of pupils eligible forPupil Premium
Source: Department for Education
23 All dependent children under 20 24 including children adopted from care, looked after children and service children
Reading Poverty Needs Analysis 2017
24
Children in poverty in lone parent families
Source: HM Revenues and Customs 2015

Reading Poverty Needs Analysis 2017
25
Free school meals
Reading has a higher proportion of pupils eligible for free school meals than the South East and the other Berkshire authorities. The proportion of eligible pupils in primary schools has decreased from 15.3% in 2016 to 14.3% in 2015, but is higher than the national average. The number eligible in secondary schools has also decreased from 13.6% in 2016 to 11.8% in 2015, and is lower than the national average. Those in receipt of free school meals tend to do less well in terms of educational attainment. Percentage of pupils eligible for and claiming free school meals
state-funded nursery and primary schools in 2017
state-funded secondary schools in 2017
Reading 14.3% 11.8%
Slough 10.0% 9.0%
Bracknell 7.7% 7.0%
West Berks 6.5% 5.9%
Windsor & Maidenhead 6.0% 5.9%
Wokingham 5.3% 5.3%
South East 9.9% 8.4%
England 14.1% 12.9%
Source: Dept for Education 2017
Educational attainment The link between poverty and poor educational outcomes is well documented. Children who grow up in poverty face serious disadvantage and consequently struggle to thrive and achieve, often resulting in their own children also living in poverty and facing similar barriers, creating a cycle of intergenerational poverty. Low educational achievement, amongst other factors, can increase the risk that families will not have the resources for a decent standard of living, negatively impacting on their own children’s life chances. In terms of the number achieving at least 5 A*-C GCSE grades, there is a 28% gap between children receiving free school meals and their wealthier peers25. In 2016, the new more challenging national curriculum at Key Stage 2 was assessed by new tests and at Key Stage 4 (GCSE level) a new secondary school accountability system was implemented, with new key measures. This means that comparison with previous years is difficult. In Reading, performance at Foundation Stage in 2017 is similar to 2016 and in line with the national average. Educational attainment at Key Stage 2 has increased since 2016 but is lower than the national average. GCSE results are above the national averages on all of the measures, and above the regional on most, though the average attainment 8 score has decreased since 2016. The attainment gap between those claiming free school meals
25 www.endchildpoverty.org.uk

Reading Poverty Needs Analysis 2017
26
and all students at GCSE level is greater than that at the regional and national level. Attainment and free school meals
Foundation Stage - good level of
development (% children achieving
at least the expected level)
Key Stage 2 – % achieving
expected level in Reading, Writing
and Maths
GCSEs – Average Attainment
8 score
All Eligible for free
school meals
All Eligible for free
school meals
All Eligible for free
school meals
2017
Reading 69 54 59 35 49.6 31.1
South East 73 55 63 39 47.4 32.0
England 69 54 62 43 46.4 35.1
2016
Reading 69 55 56 35 51.4 -
South East 72 54 55 32 51.0 -
England 67 52 54 36 50.1 -
Source: Department for Education
GSCE attainment
Average Attainment
8 scores
Progress 8 scores
% achieving a strong grade
9-5 pass in Eng & maths
% achieving a strong grade
9-4 pass in Eng & maths
% achieving English
Baccalaureate (inc a strong
grade 9-5 pass in Eng &
maths)
% achieving English
Baccalaureate (inc a strong
grade 9-4 pass in Eng &
maths)
2017
Reading 49.6 0.02 49.8 65.3 27.7 28.4
South East 47.4 -0.02 45.8 66.5 23.8 25.9
England (state funded)
46.4 -0.03 42.9 64.2 21.4 23.9
2016
Reading 51.4 -0.11 - 64.126 - 29.5
South East 51.0 0.02 - 65.8 - 27.3
England (state funded)
50.1 -0.03 - 63.3 - 24.8
Source: Department for Education 2017
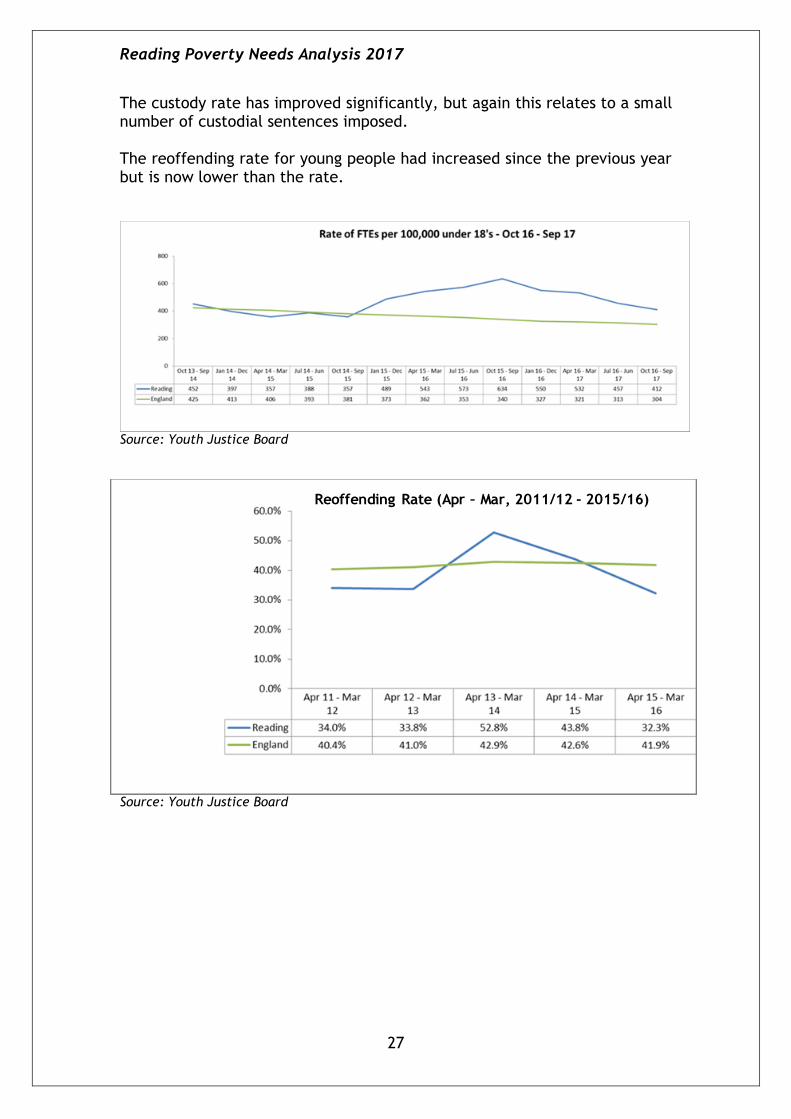
Youth offending Reading’s youth offending rate has declined significantly from 2011/12, reflecting the national picture. However there was an increase from Oct 2014 in both the actual number and the rate of First Time Entrants to the Youth Justice System (though the numbers are low and subject to fluctuations), though these have been falling again more recently.
26
% achieving Eng & maths (A*-C)
Reading Poverty Needs Analysis 2017
27
The custody rate has improved significantly, but again this relates to a small number of custodial sentences imposed. The reoffending rate for young people had increased since the previous year but is now lower than the rate.
Source: Youth Justice Board
Source: Youth Justice Board
Reoffending Rate (Apr – Mar, 2011/12 - 2015/16)
Reading Poverty Needs Analysis 2017
28
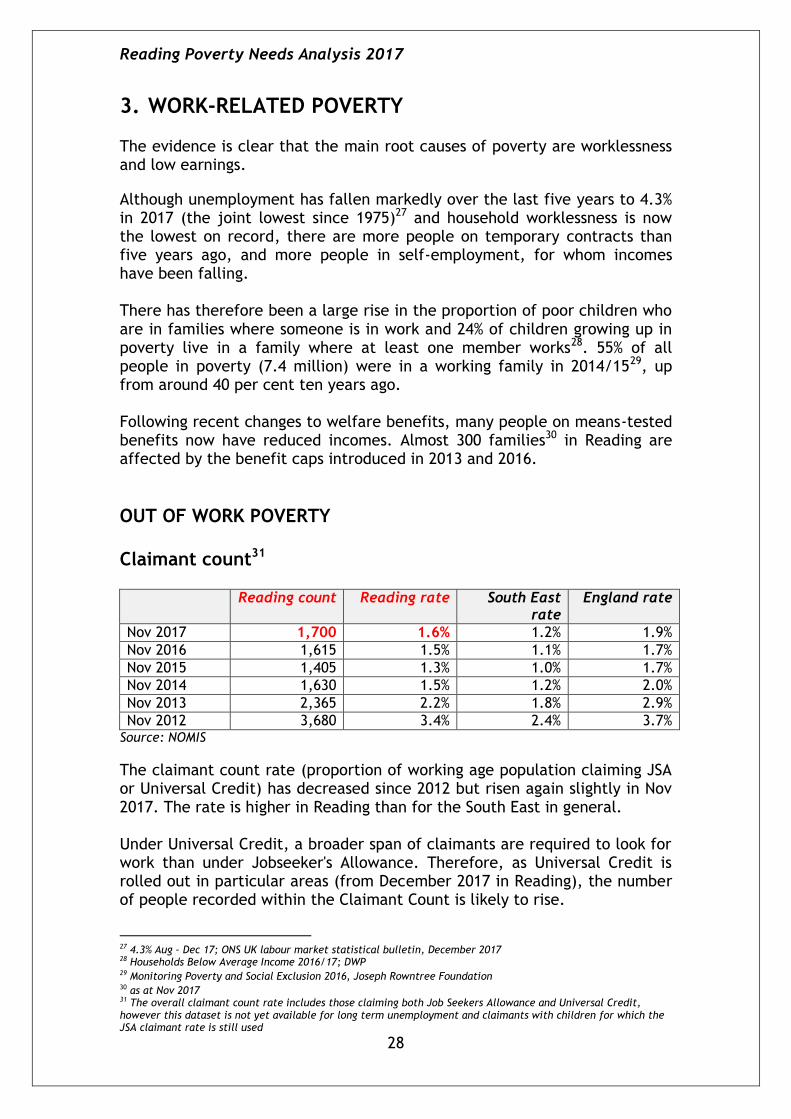
3. WORK-RELATED POVERTY The evidence is clear that the main root causes of poverty are worklessness and low earnings.
Although unemployment has fallen markedly over the last five years to 4.3% in 2017 (the joint lowest since 1975)27 and household worklessness is now the lowest on record, there are more people on temporary contracts than five years ago, and more people in self-employment, for whom incomes have been falling. There has therefore been a large rise in the proportion of poor children who are in families where someone is in work and 24% of children growing up in poverty live in a family where at least one member works28. 55% of all people in poverty (7.4 million) were in a working family in 2014/1529, up from around 40 per cent ten years ago. Following recent changes to welfare benefits, many people on means-tested benefits now have reduced incomes. Almost 300 families30 in Reading are affected by the benefit caps introduced in 2013 and 2016.
OUT OF WORK POVERTY Claimant count31
Reading count Reading rate South East rate
England rate
Nov 2017 1,700 1.6% 1.2% 1.9%
Nov 2016 1,615 1.5% 1.1% 1.7%
Nov 2015 1,405 1.3% 1.0% 1.7%
Nov 2014 1,630 1.5% 1.2% 2.0%
Nov 2013 2,365 2.2% 1.8% 2.9%
Nov 2012 3,680 3.4% 2.4% 3.7% Source: NOMIS
The claimant count rate (proportion of working age population claiming JSA or Universal Credit) has decreased since 2012 but risen again slightly in Nov 2017. The rate is higher in Reading than for the South East in general. Under Universal Credit, a broader span of claimants are required to look for work than under Jobseeker's Allowance. Therefore, as Universal Credit is rolled out in particular areas (from December 2017 in Reading), the number of people recorded within the Claimant Count is likely to rise.
27 4.3% Aug – Dec 17; ONS UK labour market statistical bulletin, December 2017 28 Households Below Average Income 2016/17; DWP 29 Monitoring Poverty and Social Exclusion 2016, Joseph Rowntree Foundation 30 as at Nov 2017 31 The overall claimant count rate includes those claiming both Job Seekers Allowance and Universal Credit, however this dataset is not yet available for long term unemployment and claimants with children for which the JSA claimant rate is still used

Reading Poverty Needs Analysis 2017
29
Long term unemployment by age
JSA claimant rate (over a year)
Nov 2017 Nov 2016
Reading South East
England Reading South East
England
Age 16-24 0.0 0.1 0.1 0.1 0.1 0.2
Age 25-49 0.3 0.2 0.4 0.3 0.2 0.4
Age 50-64 0.7 0.3 0.5 0.5 0.2 0.4
Total 1.0 0.5 1.0 0.8 0.5 1.0
Source: NOMIS; JSA by age and duration with proportions
The long term unemployment rate has increased slightly overall and for 50-64 group from Nov 2016, but reduced slightly for 16-24 age group. The overall rate is similar to the national rate, however the 50-64 rate is higher than both the national and regional figures. JSA claimants with dependent children
% claimants with children
May 2017 May 2016
Reading 22.2% 20.8%
South East 24.8% 23.2%
England 24.5% 22.9% Source: NOMIS; JSA claimants
The percentage of JSA claimants in Reading with dependent children has increased since May 2016, but is lower than the national and regional averages.
Key out of work benefits claimants
Nov 2016
Nov 2015
Claimant group Reading number
Reading rate32
South East rate
England rate
Reading number
Reading rate
South East rate
England rate
Job seekers 1,190 1.1 0.7 1.1 1,270 1.2 0.9 1.4
ESA and incapacity benefits claimants
4,970 4.5 4.4 5.8 5,090 4.7 4.4 5.9
Lone parents 1,200 1.1 0.8 1.0 1,280 1.2 0.8 1.1
Carer 1,220 1.1 1.3 1.7 1,130 1.0 1.2 1.6
Others on income related benefit
140 0.1 0.1 0.2 190 0.2 0.2 0.2
Total out-of-work benefits claimants
7,500 6.8 6.1 8.1 7,830 7.2 6.4 8.6
Source: NOMIS; benefit claimants, working age client group
32 Proportion of resident population aged 16-64 estimate

Reading Poverty Needs Analysis 2017
30
Just under 7% of the resident working age population is claiming a key out of work benefit (see table), compared with 7.2% in Nov 2015. 13% of children under 16 are in families claiming out of work benefits33 (down from 14% in 2015).
Out of work benefits claimants by LSOA
Legend = number of claimants at Lower Super Output Area level Source: NOMIS Nov 2016
Index of Multiple Deprivation 2015: Employment domain Reading ranks 114th out of 326 local authorities nationally on the IMD employment domain, which measures the proportion of the working-age population in an area involuntarily excluded from the labour market. This compares with 139th in 2010, indicating that relative deprivation has increased. 8 Lower Super Output Areas fall within the most 20% deprived nationally (4 in 2010), and 2 in the most 10% deprived (none in 2010).
33 DWP May 2016 (Children in out of work benefit claimant households) & ONS mid year estimates 2016

Reading Poverty Needs Analysis 2017
31
IMD 2015: Employment domain
Source: Department for Communities and Local Government 2015

Reading Poverty Needs Analysis 2017
32
IN-WORK POVERTY Although since 2010 there has been a dramatic decline in the number of children in workless households, there has been a large rise in the proportion of poor children who are in families where someone is in work. 18% (8 million) of working-age adults and children in poverty are in working households34; 24% of children in poverty are in working households35. 12% of workers are in poverty, and 20% of part-time workers36.
Children in households claiming tax credits In 2015, 270 children in Reading were living in families in receipt of both Child Tax Credit and Working Tax Credit with income less than 60% median income, significantly less than in the previous year and reflecting the national trend, but higher than the preceding two years. Children in families in receipt of Child Tax Credit and Working Tax Credit and income less than 60% of median income No of children
2015 270
2014 740
2013 165
2012 135
2011 365
2010 415
2009 395
2008 510
2007 725
2006 495
Source: HM Revenues and Customs 2015
Median pay
Weekly pay - gross
Weekly pay - basic
Hourly pay - gross
Annual pay - gross
Reading 2017 Residents £604.7 £565.5 £15.47 £32,234
Workforce £641.3 £612.8 £16.99 £36,117
South East 2017 Residents £596.8 £573.7 £15.36 £31,664
Workforce £574.9 £546.6 £14.66 £30,219
England 2017 Residents £555.8 £524.4 £14.17 £29,085
Workforce £555.8 £524.4 £14.17 £29,079
Reading 2016 Residents £557.20 £538.40 £14.77 £31,171
Workforce £621.60 £582.60 £16.36 £33,333
Source: NOMIS; Annual survey of hours and earnings (full time workers)
34 Poverty in the UK 2017; Joseph Rowntree Foundation; Households Below Average Income 2015/16 35 Households Below Average Income 2016/17; DWP 36 Poverty in the UK 2017; Joseph Rowntree Foundation; Households Below Average Income 2015/16
Reading Poverty Needs Analysis 2017
33
Median earnings for residents in Reading are generally higher than both the national and regional averages (regional earnings were higher in 2016). However, median earnings for the Reading workforce are significantly higher than for residents. This demonstrates well the mismatch between outstanding economic success and the level of benefits to local people in Reading.
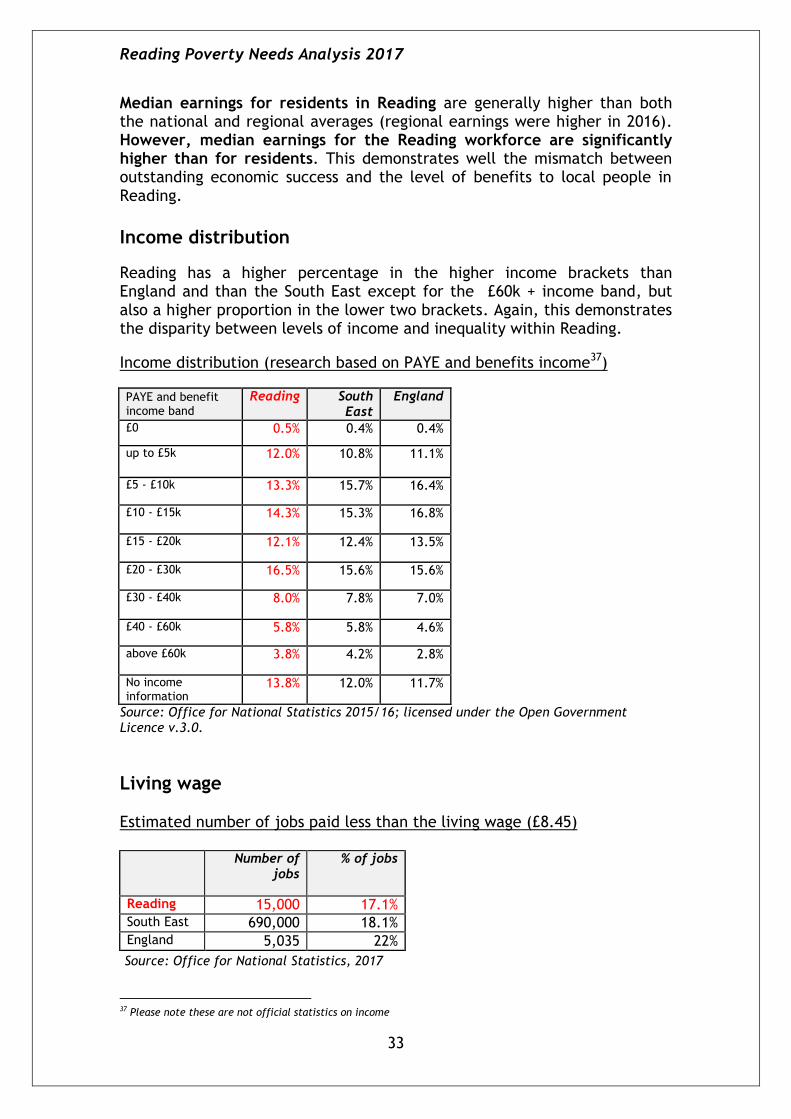
Income distribution
Reading has a higher percentage in the higher income brackets than England and than the South East except for the £60k + income band, but also a higher proportion in the lower two brackets. Again, this demonstrates the disparity between levels of income and inequality within Reading.
Income distribution (research based on PAYE and benefits income37)
PAYE and benefit income band
Reading South East
England
£0 0.5% 0.4% 0.4%
up to £5k 12.0% 10.8% 11.1%
£5 - £10k 13.3% 15.7% 16.4%
£10 - £15k 14.3% 15.3% 16.8%
£15 - £20k 12.1% 12.4% 13.5%
£20 - £30k 16.5% 15.6% 15.6%
£30 - £40k 8.0% 7.8% 7.0%
£40 - £60k 5.8% 5.8% 4.6%
above £60k 3.8% 4.2% 2.8%
No income information
13.8% 12.0% 11.7%
Source: Office for National Statistics 2015/16; licensed under the Open Government Licence v.3.0.
Living wage Estimated number of jobs paid less than the living wage (£8.45) Number of
jobs % of jobs
Reading 15,000 17.1% South East 690,000 18.1% England 5,035 22%
Source: Office for National Statistics, 2017
37 Please note these are not official statistics on income

Reading Poverty Needs Analysis 2017
34
Economic activity rate According to the 2011 Census, part time employment increased and full time employment decreased since the 2001 Census. The most significant increase was for those who are economically active but unemployed from 2.5% to 4.6%, although since then the claimant count has decreased. The proportion self-employed also increased.
Percentage of people aged 16 -74 economically active and inactive
Reading South East England
2011 2001 2011 2001 2011 2001
Economically active:
Employee: Part-time 11.9 10.2 13.8 12.2 13.7 11.8
Employee: Full-time 44.6 48.1 40.4 43.2 38.6 40.8
Self-employed 7.9 6.9 11.0 9.6 9.8 8.3
Unemployed 4.6 2.5 3.4 2.3 4.4 3.3
Full-time student 5.0 4.1 3.3 2.7 3.4 2.6
Economically inactive:
Retired 8.6 9.8 13.7 13.4 13.7 13.5
Student (including full-time students)
8.0 7.0 5.2 4.2 5.8 4.7
Looking after home or family
4.6 5.6 4.4 6.5 4.4 6.5
Long-term sick or disabled
2.8 3.0 2.9 4.4 4.0 5.3
Other 2.2 2.8 1.8 2.4 2.2 3.1
Source: 2011 Census, Office for National Statistics
SKILLS AND QUALIFICATIONS
A primary cause of poverty is the lack of opportunities for those with low skills and low qualifications. Low levels of skill also act as a significant brake on the ability of Reading to fulfil its economic potential. Despite an unemployment rate well below the national average, Reading continues to have pockets of structural unemployment in a predominantly high growth economy. The high employment rate also masks a far more serious and widespread issue of low income amongst the employed. In general, the quality of educational provision in Reading is considered in line with the England average (see child poverty chapter).
Working age qualifications According to the Census, the percentage of residents with no qualifications decreased from 22.8% to 17.4% between 2001 and 2011 (see map). This mirrors the national picture. The number of residents achieving level 3 and level 4 qualifications increased, with the most significant increase for those achieving level 4 and above, with a 6.5% increase from

Reading Poverty Needs Analysis 2017
35
2001 to 34.8% in 2011. This is above the level achieved for the South East (29.9%) and England (27.4%). Percentage of people aged 16 - 74 achieving qualifications
Highest level of qualification Reading South East England
2011 2001 2011 2001 2011 2001
No qualifications 17.4 22.8 19.1 23.9 22.5 28.9
Highest level of qualification: Level 1 qualifications
12.2 15.0 13.5 17.1 13.3 16.6
Highest level of qualification: Level 2 qualifications
12.3 17.4 15.9 21.2 15.2 19.4
Highest level of qualification: Apprenticeship
2.5 N/A 3.6 N/A 3.6 N/A
Highest level of qualification: Level 3 qualifications
13.4 11.5 12.8 9.2 12.4 8.3
Highest level of qualification: Level 4 qualifications and above
34.8 28.3 29.9 21.7 27.4 19.9
Highest level of qualification: Other qualifications
7.4 5.0 5.2 6.8 5.7 6.9
Source 2011 Census, Office for National Statistics
Percentage of residents aged 16+ with no qualifications
% residents aged 16+ with no qualifications
Reading 17.4
Bracknell Forest 16.3
Slough 20.1
West Berkshire 17.2
Windsor and Maidenhead 15.6
Wokingham 13.2
SE 19.1
England 22.5
Source: 2011 Census, Office for National Statistics

Reading Poverty Needs Analysis 2017
36
Percentage of residents aged 16+ with no qualifications
Legend = No of claimants at Lower Super Output Area level
Source: 2011 Census, Office for National Statistics

Reading Poverty Needs Analysis 2017
37
19 year olds gaining level 2 and 3 qualifications
84% of young people aged 19 have gained a level 2 qualification; this is lower than both the national and regional averages, though higher than the South East for those on free school meals. At level 3, Reading’s performance is higher than that at the national and regional levels, but lower than the national average for free school meals. Fewer of those eligible for free school meals achieve level 2 or 3 qualifications at age 19. Percentage of 19 year olds gaining level 2 and 3 qualifications
Level 2 Level 3
All Eligible for free school
meals
All Eligible for free school
meals
2016 Reading 84% 66% 59% 29%
SE 86% 65% 58% 29%
England 85% 70% 57% 36%
2015 Reading 84% 68% 57% 31%
SE 87% 68% 57% 30%
England 86% 72% 57% 36%
Source: Department for Education
Occupation profile Percentage of working population aged 16 -74 by occupation type
Occupation type Reading South East England
2011 2001 2011 2011 2011 2001
1. Managers, directors and senior officials
9 15 12 17 11 15
2. Professional occupations 25 16 19 12 18 11
3. Associate professional and technical occupations
14 15 14 15 13 14
4. Administrative and secretarial occupations
10 14 12 14 12 13
5. Skilled trades occupations 9 9 11 11 11 12
6. Caring, leisure and other service occupations
9 5 9 7 9 7
7. Sales and customer service occupations
9 9 8 7 8 8
8. Process, plant and machine operatives
5 6 6 6 7 8
9. Elementary occupations 11 11 10 10 11 12
Source: 2011 Census, Office for National Statistics
Reading’s occupation profile changed between the 2001 and 2011 Census, with professional occupation types showing the most significant increase with 24.5% of the Reading population employed in this sector in 2011, well above the regional and England percentages of 18.7% and 17.5% respectively. Service occupations have increased and administrative occupations decreased.

Reading Poverty Needs Analysis 2017
38
NEETS (Not in Education, Employment or Training)
After struggling for a few years with a consistently high comparative NEET percentage, which resulted in DCLG monitoring, a renewed focus and a shift of reporting requirements from DfE resulted in a significant improvement in Reading’s position against the national and regional backdrop. The Reading NEET figure was 5.4% at the end of 201638; the monthly figure has now fallen to 3.85% in February 2018.
% combined NEET/not known
2016/17
Reading 5.4%
Bracknell Forest 5.2%
Slough 3.7%
West Berkshire 2.4%
Windsor & Maidenhead 44.8%
Wokingham 4.4%
South East 6.4%
England 6%
Source: Dept for Education, combined NEET/Not Known, Dec 16 - Feb 17
Index of Multiple Deprivation 2015: Education, skills and training domain Reading ranks 77th out of 326 local authorities nationally on the IMD Education, Skills and Training domain, which relates to both children and young people, and adult skills. 18 LSOAs fall within the 20% most deprived nationally (similar in 2010), 9 in the 10% most deprived (8 in 2010), and 3 in the most deprived 5% (1 in 2010), in South Reading. Overall, Reading ranks 239th on the adult skills sub-domain and 103rd on the children and young people’s sub-domain.
38 The NEET only figure at the end of 2015 was 6%. However, the DfE changed the definition of NEET at the end of
2016 figures to include those young people whose activity is not known and shifted the period for which the
average is made from November to January to December to February. As such these figures cannot be compared
with NEET publications for previous years.

Reading Poverty Needs Analysis 2017
39
IMD 2015: Education, skills and training domain
Source: Department for Communities and Local Government 2015
Reading Poverty Needs Analysis 2017
40
MEETING BASIC NEEDS
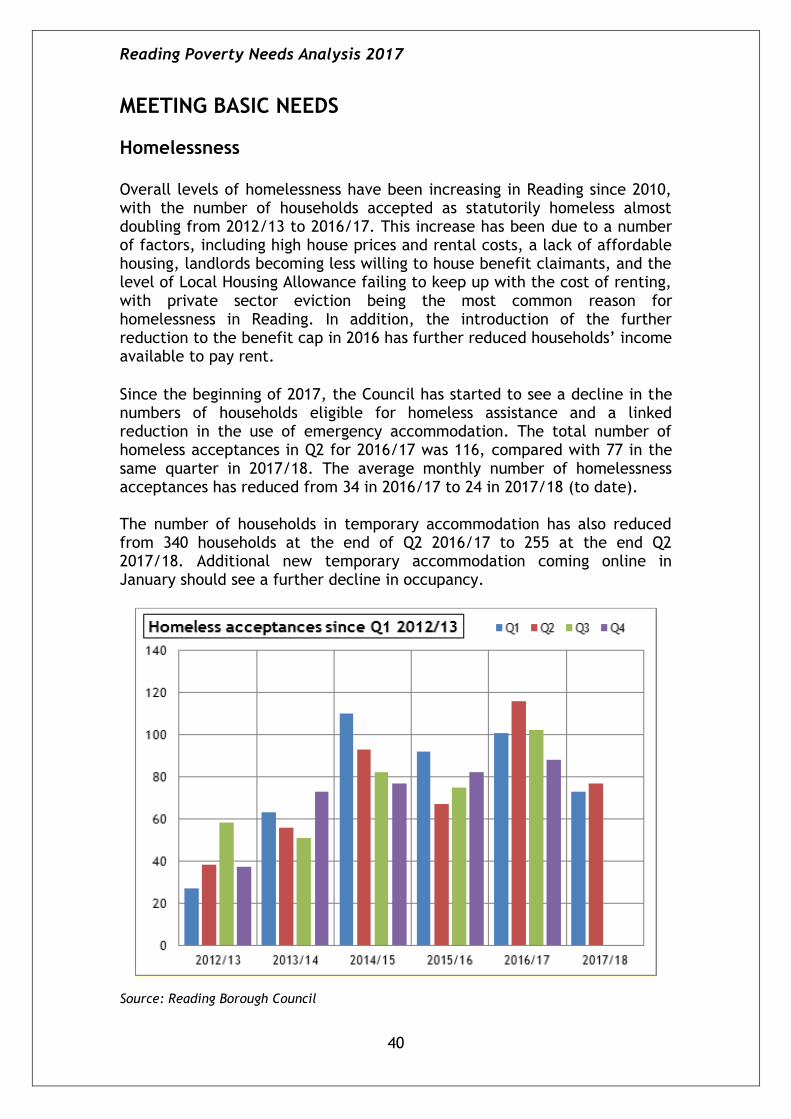
Homelessness Overall levels of homelessness have been increasing in Reading since 2010, with the number of households accepted as statutorily homeless almost doubling from 2012/13 to 2016/17. This increase has been due to a number of factors, including high house prices and rental costs, a lack of affordable housing, landlords becoming less willing to house benefit claimants, and the level of Local Housing Allowance failing to keep up with the cost of renting, with private sector eviction being the most common reason for homelessness in Reading. In addition, the introduction of the further reduction to the benefit cap in 2016 has further reduced households’ income available to pay rent.
Since the beginning of 2017, the Council has started to see a decline in the numbers of households eligible for homeless assistance and a linked reduction in the use of emergency accommodation. The total number of homeless acceptances in Q2 for 2016/17 was 116, compared with 77 in the same quarter in 2017/18. The average monthly number of homelessness acceptances has reduced from 34 in 2016/17 to 24 in 2017/18 (to date). The number of households in temporary accommodation has also reduced from 340 households at the end of Q2 2016/17 to 255 at the end Q2 2017/18. Additional new temporary accommodation coming online in January should see a further decline in occupancy.
Source: Reading Borough Council

Reading Poverty Needs Analysis 2017
41
Source: Reading Borough Council
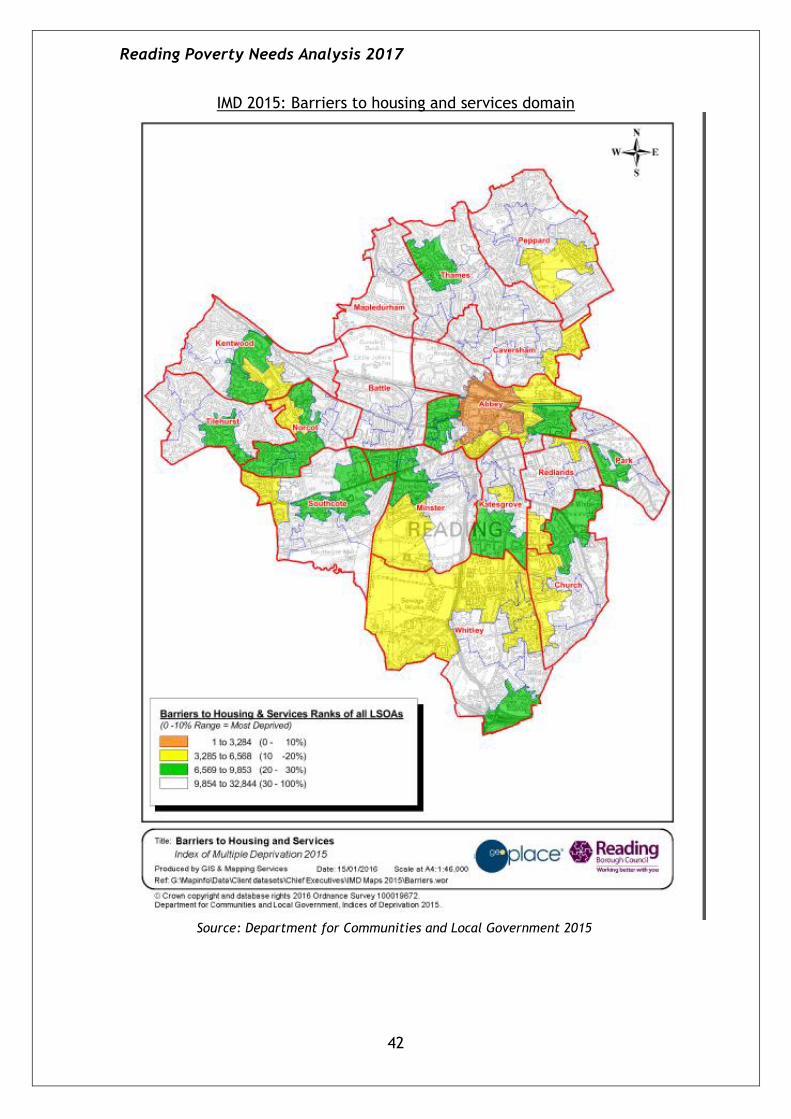
Index of Multiple Deprivation 2015: Barriers to housing and services domain Reading ranks 52nd out of 326 local authorities nationally on the IMD barriers to housing and services domain, which measures the physical and financial accessibility of housing and local services. A total of 17 LSOAs fall within the 20% most deprived nationally (6 in 2010) and 1 in the 10% most deprived (1 also in 2010). Reading ranks 44th on the ‘wider barriers’ sub-domain (which looks at issues relating to access to housing such as affordability), though there are no LSOAs in the most deprived 5%. In terms of the ‘geographical barriers’ sub-domain, Reading is relatively un-deprived, ranking 248th nationally.
Reading Poverty Needs Analysis 2017
42
IMD 2015: Barriers to housing and services domain
Source: Department for Communities and Local Government 2015
Reading Poverty Needs Analysis 2017
43
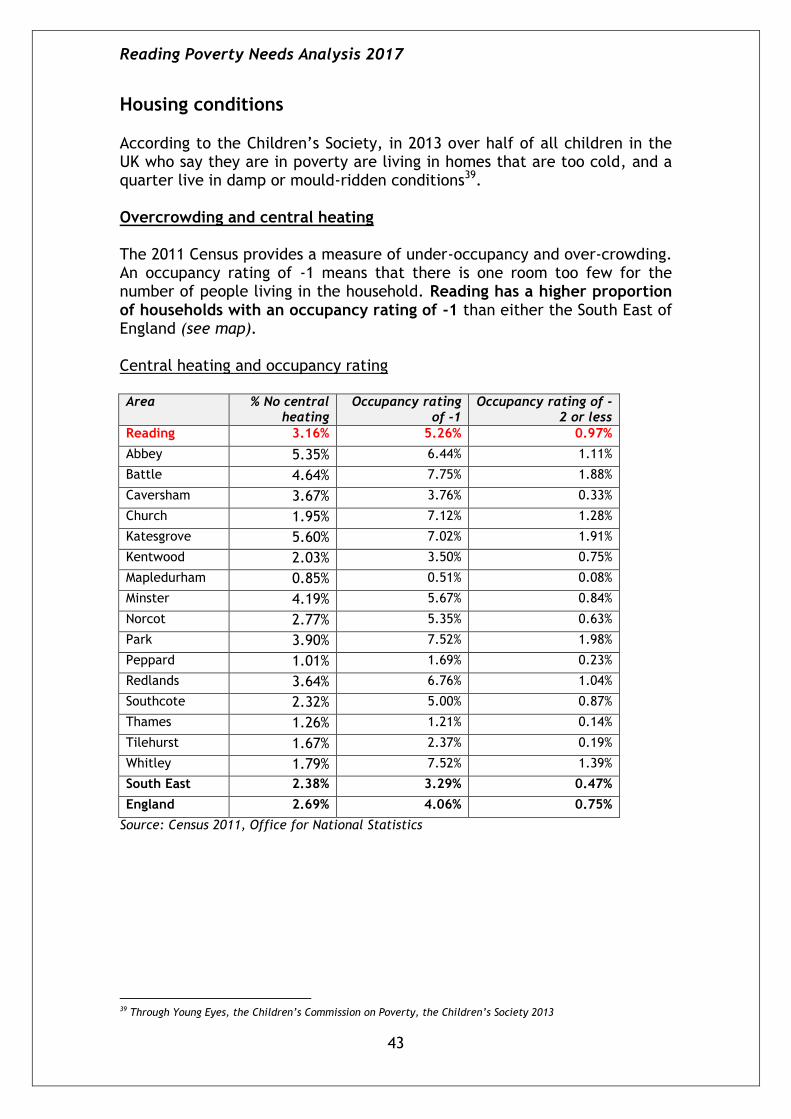
Housing conditions According to the Children’s Society, in 2013 over half of all children in the UK who say they are in poverty are living in homes that are too cold, and a quarter live in damp or mould-ridden conditions39. Overcrowding and central heating The 2011 Census provides a measure of under-occupancy and over-crowding. An occupancy rating of -1 means that there is one room too few for the number of people living in the household. Reading has a higher proportion of households with an occupancy rating of -1 than either the South East of England (see map). Central heating and occupancy rating Area % No central
heating Occupancy rating
of -1 Occupancy rating of -
2 or less
Reading 3.16% 5.26% 0.97%
Abbey 5.35% 6.44% 1.11%
Battle 4.64% 7.75% 1.88%
Caversham 3.67% 3.76% 0.33%
Church 1.95% 7.12% 1.28%
Katesgrove 5.60% 7.02% 1.91%
Kentwood 2.03% 3.50% 0.75%
Mapledurham 0.85% 0.51% 0.08%
Minster 4.19% 5.67% 0.84%
Norcot 2.77% 5.35% 0.63%
Park 3.90% 7.52% 1.98%
Peppard 1.01% 1.69% 0.23%
Redlands 3.64% 6.76% 1.04%
Southcote 2.32% 5.00% 0.87%
Thames 1.26% 1.21% 0.14%
Tilehurst 1.67% 2.37% 0.19%
Whitley 1.79% 7.52% 1.39%
South East 2.38% 3.29% 0.47%
England 2.69% 4.06% 0.75%
Source: Census 2011, Office for National Statistics
39 Through Young Eyes, the Children’s Commission on Poverty, the Children’s Society 2013

Reading Poverty Needs Analysis 2017
44
Percentage of households with an occupancy rating of -140
Source: Census 2011, Office for National Statistics
40 An occupancy rating of -1 means there is one room too few for the number of people living in the household

Reading Poverty Needs Analysis 2017
45
Private sector house condition survey 2013 A sample of a thousand private sector properties in Reading were surveyed over a 3 month period in 2013. The results showed that the number of non-decent41 homes has reduced by 40% since the previous stock condition survey in 2006. However, 12,200 dwellings (23.4% of total private sector housing) still fail to meet the requirements of the decent homes standard. This compares with 25% for England (2011/12). Other results indicate:
5,265 dwellings (10.1%) exhibit Category 1 hazards within the Housing Health and Safety Rating System
6,164 dwellings (11.8%) are in disrepair
596 dwellings (1.1%) lack modern facilities and services
4,531 dwellings (8.7%) fail to provide a reasonable degree of thermal comfort
31.5% of vulnerable households live in non-decent homes
7.4% households have insufficient bedrooms to meet family needs and are therefore overcrowded
the estimated cost to meet the decency standard in the private sector in Reading is £85 million.
Rates of non-decency in the private rented sector are around the national average at 34.8% (national average 35%), but significantly higher than the private sector owner occupied average of 21.9%. The highest rates of decent homes failure are recorded for the wards of Battle, Park, Caversham and Redlands. Failure rates in these wards exceed one third of ward housing stock.
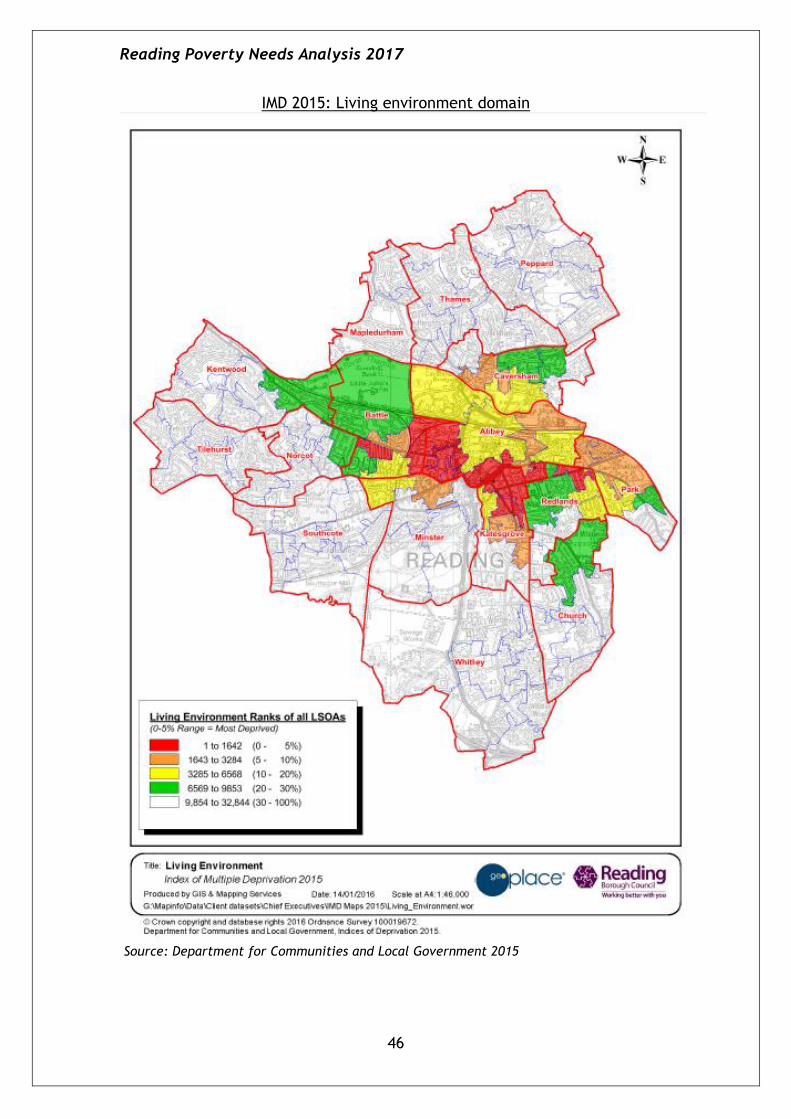
Index of Multiple Deprivation 2015: Living environment domain
Reading ranks 49th out of 326 local authorities nationally on the IMD living environment domain, which measures the quality of the local environment, including the quality of housing, air quality and road traffic accidents. A total of 29 Lower Super Output Areas fall within the 20% most deprived nationally (17 in 2010) and 10 in the 5% most deprived (none in 2010). The ‘living environment’ domain is made up of ‘outdoor’ (quality of housing) and ‘indoor’ (air quality and road traffic accidents) sub-domains. Reading ranks 40th on the outdoor sub-domain, with 9 LSOAs in the most deprived 5%, and 128th on the indoor sub-domain, with 2 LSOAs in the most deprived 5%.
41 A decent home is one that satisfies all of the following four criteria: it meets the current statutory minimum standard for housing; it is in a reasonable state of repair; it has reasonably modern facilities and services; it provides a reasonable degree of thermal comfort.
Reading Poverty Needs Analysis 2017
46
IMD 2015: Living environment domain
Source: Department for Communities and Local Government 2015
Reading Poverty Needs Analysis 2017
47
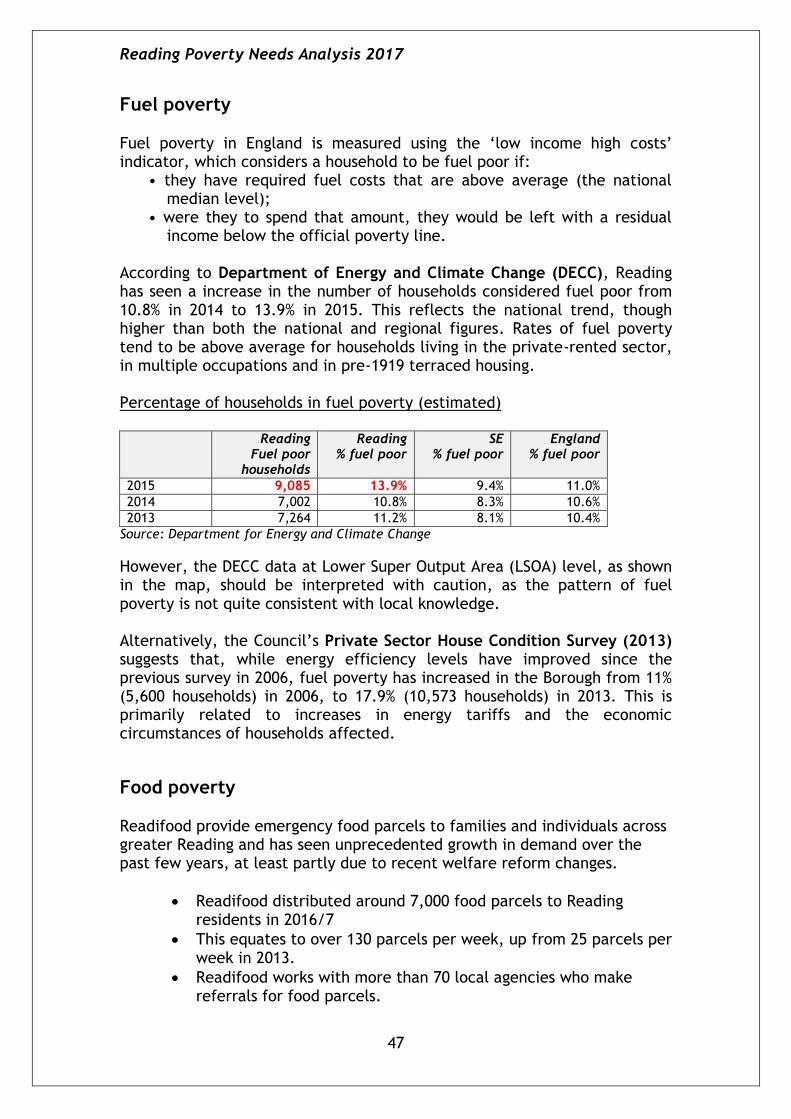
Fuel poverty Fuel poverty in England is measured using the ‘low income high costs’ indicator, which considers a household to be fuel poor if:
• they have required fuel costs that are above average (the national median level);
• were they to spend that amount, they would be left with a residual income below the official poverty line.
According to Department of Energy and Climate Change (DECC), Reading has seen a increase in the number of households considered fuel poor from 10.8% in 2014 to 13.9% in 2015. This reflects the national trend, though higher than both the national and regional figures. Rates of fuel poverty tend to be above average for households living in the private-rented sector, in multiple occupations and in pre-1919 terraced housing. Percentage of households in fuel poverty (estimated)
Reading Fuel poor
households
Reading % fuel poor
SE % fuel poor
England % fuel poor
2015 9,085 13.9% 9.4% 11.0%
2014 7,002 10.8% 8.3% 10.6%
2013 7,264 11.2% 8.1% 10.4%
Source: Department for Energy and Climate Change
However, the DECC data at Lower Super Output Area (LSOA) level, as shown in the map, should be interpreted with caution, as the pattern of fuel poverty is not quite consistent with local knowledge. Alternatively, the Council’s Private Sector House Condition Survey (2013) suggests that, while energy efficiency levels have improved since the previous survey in 2006, fuel poverty has increased in the Borough from 11% (5,600 households) in 2006, to 17.9% (10,573 households) in 2013. This is primarily related to increases in energy tariffs and the economic circumstances of households affected.
Food poverty Readifood provide emergency food parcels to families and individuals across greater Reading and has seen unprecedented growth in demand over the past few years, at least partly due to recent welfare reform changes.
Readifood distributed around 7,000 food parcels to Reading residents in 2016/7
This equates to over 130 parcels per week, up from 25 parcels per week in 2013.
Readifood works with more than 70 local agencies who make referrals for food parcels.
Reading Poverty Needs Analysis 2017
48
Households in fuel poverty
Source: Department for Energy and Climate Change 2015

Reading Poverty Needs Analysis 2017
49
Index of Multiple Deprivation 2015: Crime domain Reading ranks 71st out of 326 local authorities nationally on the IMD crime domain. A total of 16 Lower Super Output Areas fall within the 20% most deprived nationally (35 in 2010) and 3 in the 5% most deprived (20 in 2010), indicating that deprivation in terms of crime has improved.
IMD 2015: Crime domain
Source: Department for Communities and Local Government 2015
Reading Poverty Needs Analysis 2017
50
POVERTY AND HEALTH Children living in income-deprived families are prone to significantly worse health outcomes, both during childhood and later in life. The adverse impact of unemployment, for example, on the physical and mental health of individuals in terms of higher risk of depression and increased morbidity is well documented. Poor parental health combined with financial hardship has an inevitable effect on the wellbeing of children. Deprivation can influence behavioural choices that are known to impact on the health of adults and children such as breastfeeding, eating habits and participation in sports and exercise.
Census overview
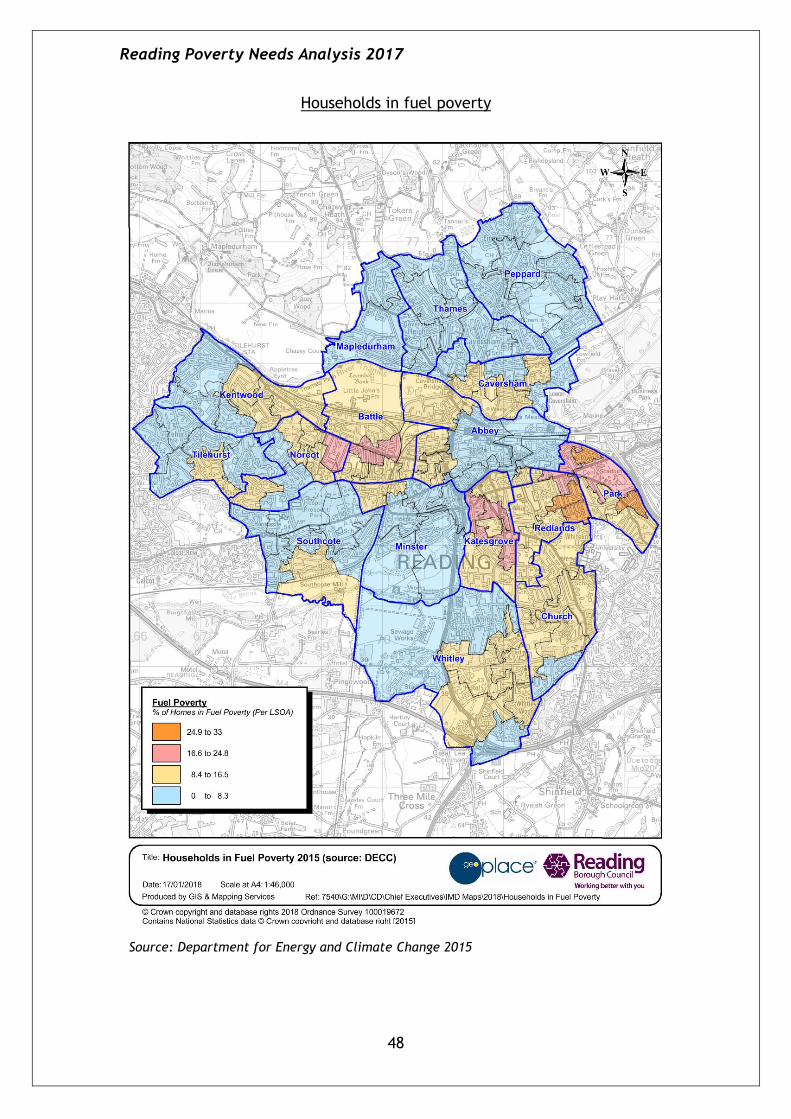
Proportion of population reporting good or very good health The 2011 Census shows that, on average, a higher percentage of residents report good or very good health than in either the South East or nationally. % reporting good or
very good health
Reading 86%
South East 84%
England 81%
Source: 2011 Census, Office for National Statistics
However, there are significant geographical differences within Reading (see chart and map by ward). The areas reporting the highest percentage of residents reporting good or very good health are Park, Redlands and Thames. In Park and Redlands this may be due to the higher number of younger people, particularly students, in these areas.
Proportion reporting good or very good health by ward
Source: 2011 Census, Office for National Statistics

Reading Poverty Needs Analysis 2017
51
Proportion reporting good or very good health by ward
Source: 2011 Census, Office for National Statistics
Reading Poverty Needs Analysis 2017
52
Reading health profile
According to Public Health England’s ‘Reading Health Profile 2017’:
Life expectancy is 7.8 years lower for men and 6.5 years lower for women in the most deprived areas of Reading than in the least deprived areas. The difference has decreased slightly for women since the previous year when it was 6.6 years, and decreased for men from 9.1 years. However, life expectancy for men is lower than the England average (see also health inequalities below).
The rate of alcohol-related harm hospital stays is 599/100,000 population, which is an increase from the year before at 541/100k, but is better than the average for England. This represents 831 stays per year.
The rate of self-harm hospital stays is 223/100,000, an increase from 130/100k in 2016, and worse than the average for England. This represents 382 stays per year.
The rate of smoking related deaths is 281/ 100,000 population. This represents 175 deaths per year, an increase from 162 in the previous period.
Rates of sexually transmitted infections and TB in Reading are worse than average.
The rate of people killed or seriously injured on roads is better than average.
Priorities in Reading include preventing and reducing early deaths from cardiovascular disease & cancer, promoting positive mental health & wellbeing, reducing levels of infectious disease e.g. TB, and reducing alcohol consumption to safe levels. For more information see www.reading.gov.uk/jsna.
Source: Public Health England Health Profile 2017

Reading Poverty Needs Analysis 2017
53
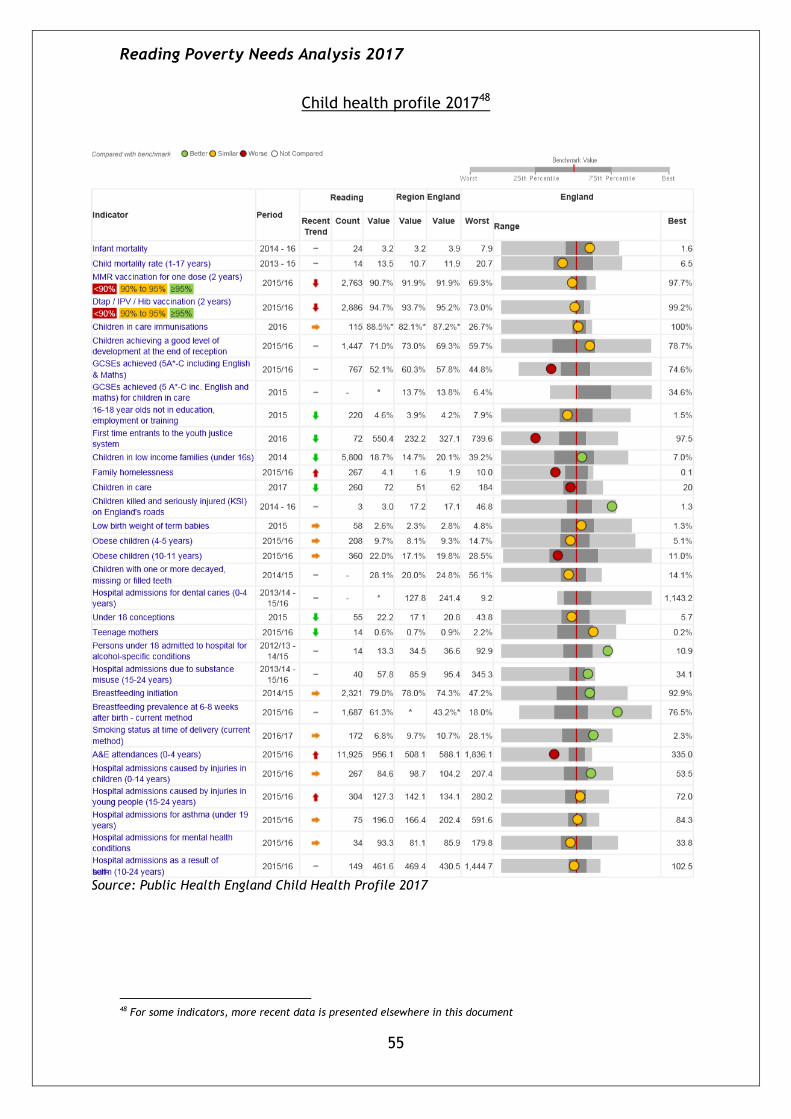
Reading health profile 201742
Source: Public Health England Health Profile 2017
42 For some indicators, more recent data is presented elsewhere in this document
Reading Poverty Needs Analysis 2017
54
Child health profile
43 ONS mid year population estimates 2016 44 RBC School Census 2016 45 Children in low income households local measure, HM Revenues and Customs 2015 46 Department for Education 2017 47 Source: gov.uk 2015/16 (average at end of Jan-Mar 17 and Apr-Jun 17 quarters)
According to Public Health England’s Child Health Profile, the health and wellbeing of children in Reading is mixed compared with the England average.
Children and young people under the age of 20 make up 25.4% of the Reading population43. 54% of primary school children and 49% of secondary school children are from a Black and Minority Ethnic group44.
The level of child poverty is better than the England average with 16.1% of children aged under 16 years living in poverty45.
Infant and child mortality rates are similar to the England average.
The rate of family homelessness is worse than the England average.
9.7% of children aged 4-5 years and 22.0% of children aged 10-11 years are classified as obese (the latter worse than the national average).
GCSE results are above the national average on all of the measures, and above the regional average on most46.
In 2014, approximately 27 girls aged under 18 conceived for every 1,000 women aged 15-17 years. This is higher than the regional average, but similar to the national average.
The proportion of mothers breastfeeding their babies is higher than the national average, with 79% of mothers initiating breastfeeding and 61.3% of babies still being breastfed after 6-8 weeks.
The percentage of young people aged 16 to 18 not in education, employment or training is now lower than the England average47 (see also NEETs in the ‘Work-related poverty’ chapter).
Source: Public Health England Child Health Profile 2017 (except where indicated otherwise)
Reading Poverty Needs Analysis 2017
55
Child health profile 201748
Source: Public Health England Child Health Profile 2017
48 For some indicators, more recent data is presented elsewhere in this document
Reading Poverty Needs Analysis 2017
56
Life expectancy and health inequalities
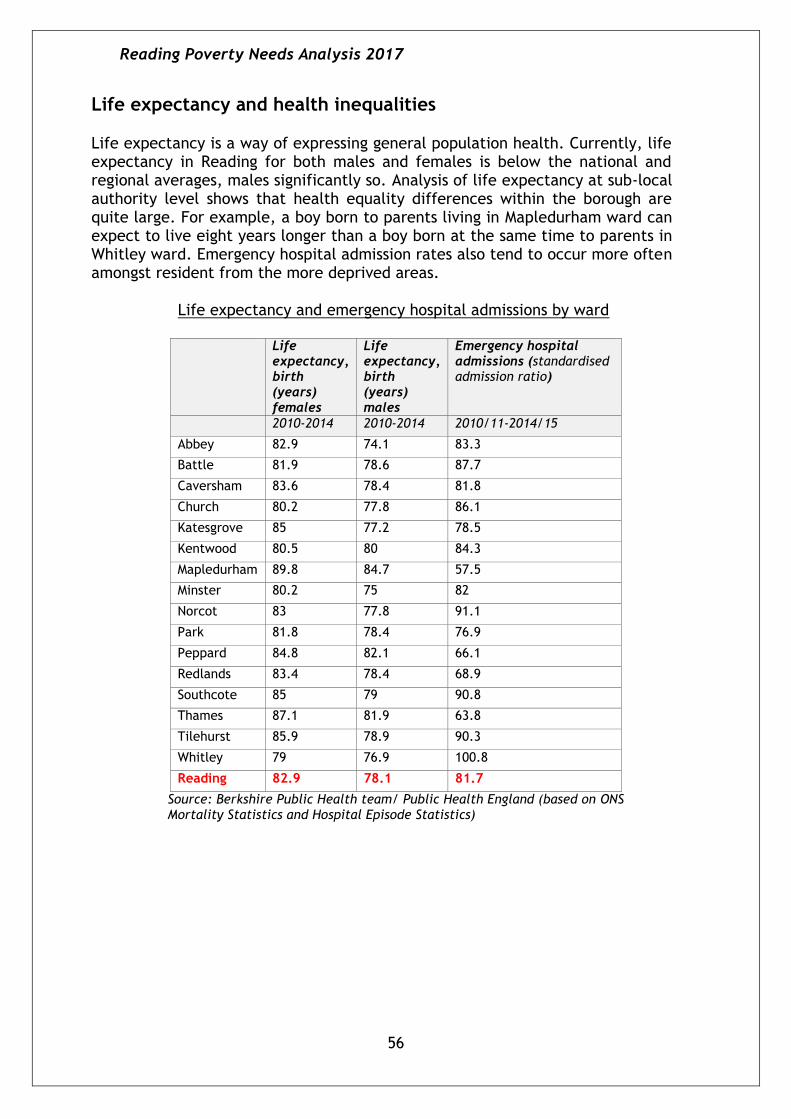
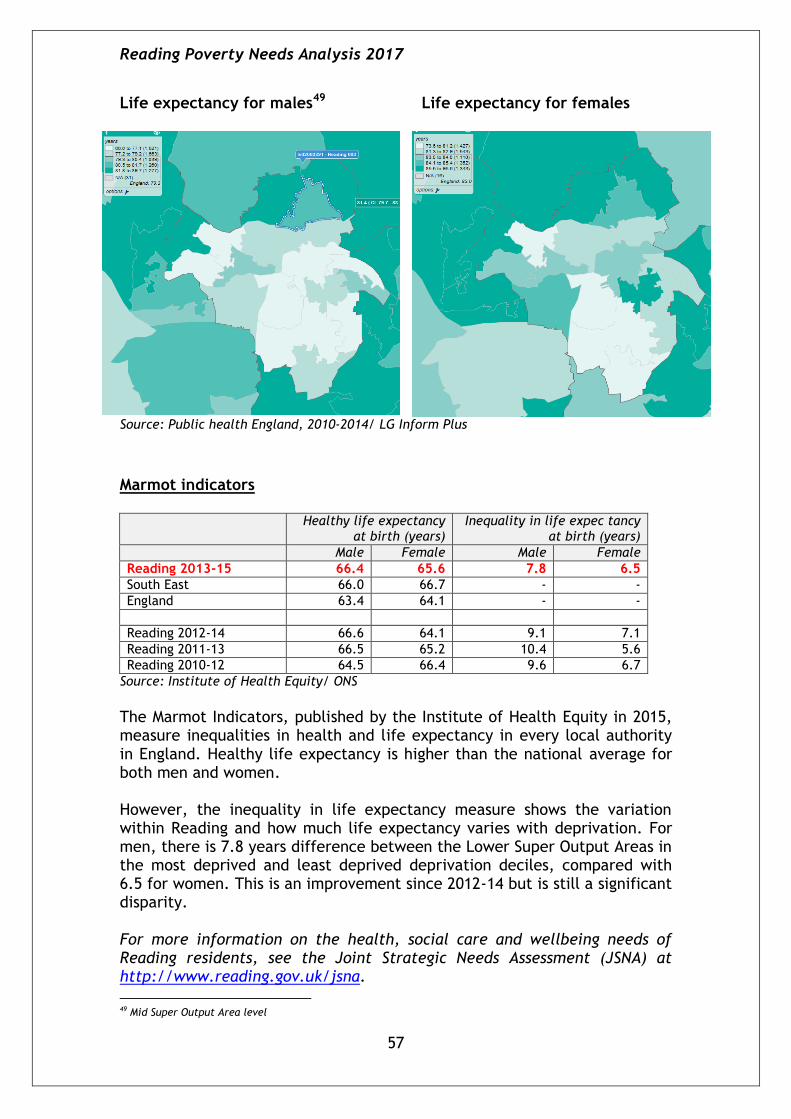
Life expectancy is a way of expressing general population health. Currently, life expectancy in Reading for both males and females is below the national and regional averages, males significantly so. Analysis of life expectancy at sub-local authority level shows that health equality differences within the borough are quite large. For example, a boy born to parents living in Mapledurham ward can expect to live eight years longer than a boy born at the same time to parents in Whitley ward. Emergency hospital admission rates also tend to occur more often amongst resident from the more deprived areas.
Life expectancy and emergency hospital admissions by ward
Life expectancy, birth (years) females
Life expectancy, birth (years) males
Emergency hospital admissions (standardised admission ratio)
2010-2014 2010-2014 2010/11-2014/15
Abbey 82.9 74.1 83.3
Battle 81.9 78.6 87.7
Caversham 83.6 78.4 81.8
Church 80.2 77.8 86.1
Katesgrove 85 77.2 78.5
Kentwood 80.5 80 84.3
Mapledurham 89.8 84.7 57.5
Minster 80.2 75 82
Norcot 83 77.8 91.1
Park 81.8 78.4 76.9
Peppard 84.8 82.1 66.1
Redlands 83.4 78.4 68.9
Southcote 85 79 90.8
Thames 87.1 81.9 63.8
Tilehurst 85.9 78.9 90.3
Whitley 79 76.9 100.8
Reading 82.9 78.1 81.7
Source: Berkshire Public Health team/ Public Health England (based on ONS Mortality Statistics and Hospital Episode Statistics)
Reading Poverty Needs Analysis 2017
57
Life expectancy for males49 Life expectancy for females
Source: Public health England, 2010-2014/ LG Inform Plus
Marmot indicators
Healthy life expectancy at birth (years)
Inequality in life expec tancy at birth (years)
Male Female Male Female
Reading 2013-15 66.4 65.6 7.8 6.5
South East 66.0 66.7 - -
England 63.4 64.1 - -
Reading 2012-14 66.6 64.1 9.1 7.1
Reading 2011-13 66.5 65.2 10.4 5.6
Reading 2010-12 64.5 66.4 9.6 6.7
Source: Institute of Health Equity/ ONS
The Marmot Indicators, published by the Institute of Health Equity in 2015, measure inequalities in health and life expectancy in every local authority in England. Healthy life expectancy is higher than the national average for both men and women. However, the inequality in life expectancy measure shows the variation within Reading and how much life expectancy varies with deprivation. For men, there is 7.8 years difference between the Lower Super Output Areas in the most deprived and least deprived deprivation deciles, compared with 6.5 for women. This is an improvement since 2012-14 but is still a significant disparity. For more information on the health, social care and wellbeing needs of Reading residents, see the Joint Strategic Needs Assessment (JSNA) at http://www.reading.gov.uk/jsna.
49 Mid Super Output Area level
Reading Poverty Needs Analysis 2017
58
POVERTY AND ETHNICITY Children from ethnic minorities face a particularly high risk of growing up in poverty. Risks of poverty are highest for those from Bangladeshi, Pakistani and Black African communities, but are also above average for those from Caribbean, Indian and Chinese communities.
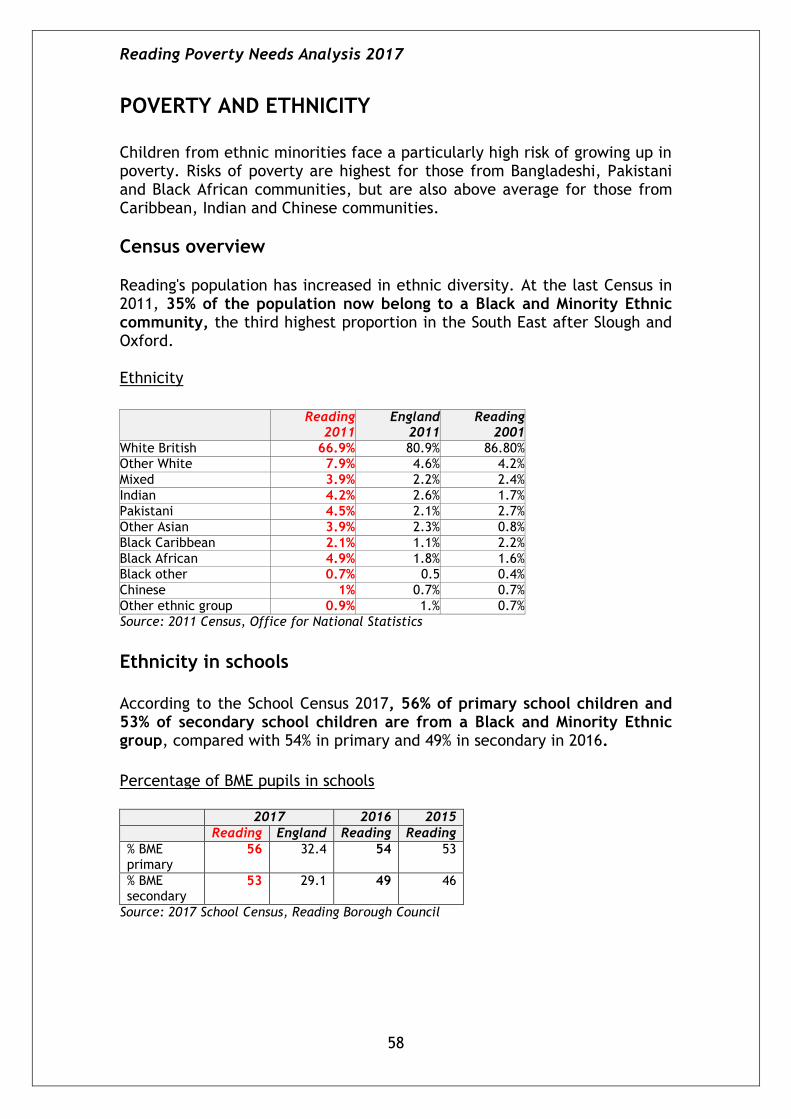
Census overview Reading's population has increased in ethnic diversity. At the last Census in 2011, 35% of the population now belong to a Black and Minority Ethnic community, the third highest proportion in the South East after Slough and Oxford. Ethnicity
Reading
2011 England
2011 Reading
2001
White British 66.9% 80.9% 86.80%
Other White 7.9% 4.6% 4.2%
Mixed 3.9% 2.2% 2.4%
Indian 4.2% 2.6% 1.7%
Pakistani 4.5% 2.1% 2.7%
Other Asian 3.9% 2.3% 0.8%
Black Caribbean 2.1% 1.1% 2.2%
Black African 4.9% 1.8% 1.6%
Black other 0.7% 0.5 0.4%
Chinese 1% 0.7% 0.7%
Other ethnic group 0.9% 1.% 0.7%
Source: 2011 Census, Office for National Statistics
Ethnicity in schools According to the School Census 2017, 56% of primary school children and 53% of secondary school children are from a Black and Minority Ethnic group, compared with 54% in primary and 49% in secondary in 2016. Percentage of BME pupils in schools 2017 2016 2015
Reading England Reading Reading
% BME primary
56 32.4 54 53
% BME secondary
53 29.1 49 46
Source: 2017 School Census, Reading Borough Council
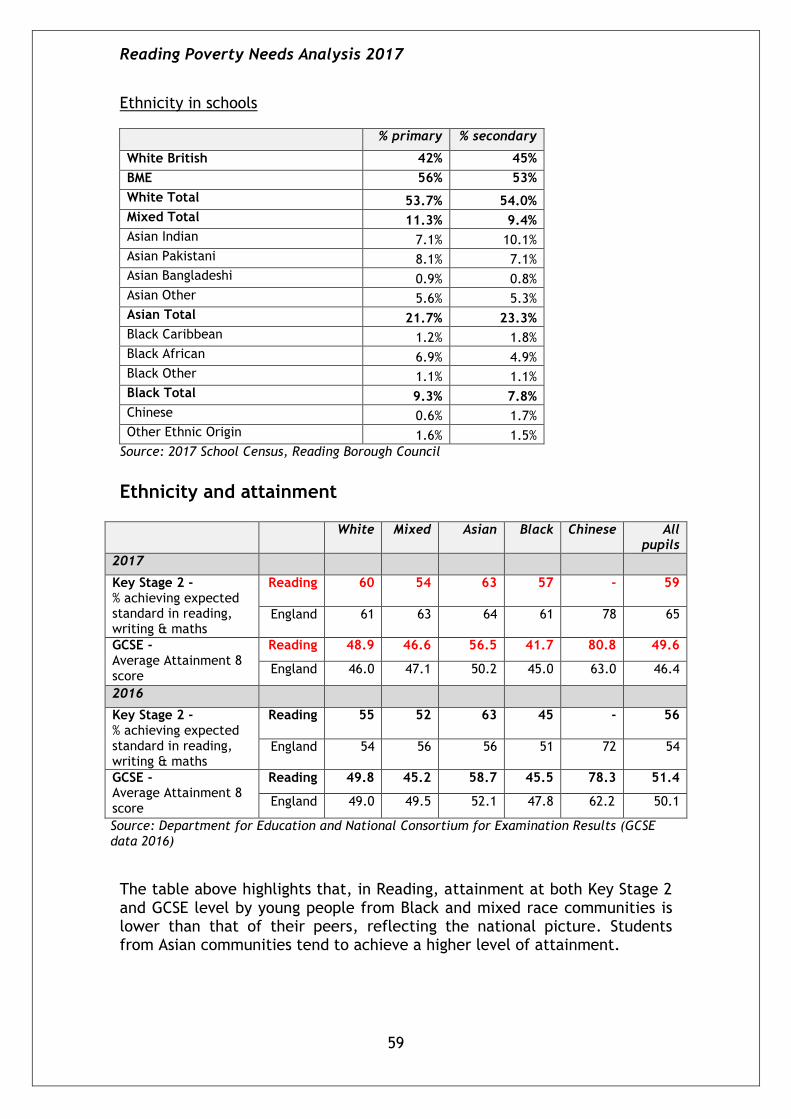
Reading Poverty Needs Analysis 2017
59
Ethnicity in schools
% primary % secondary
White British 42% 45%
BME 56% 53%
White Total 53.7% 54.0%
Mixed Total 11.3% 9.4%
Asian Indian 7.1% 10.1%
Asian Pakistani 8.1% 7.1%
Asian Bangladeshi 0.9% 0.8%
Asian Other 5.6% 5.3%
Asian Total 21.7% 23.3%
Black Caribbean 1.2% 1.8%
Black African 6.9% 4.9%
Black Other 1.1% 1.1%
Black Total 9.3% 7.8%
Chinese 0.6% 1.7%
Other Ethnic Origin 1.6% 1.5%
Source: 2017 School Census, Reading Borough Council
Ethnicity and attainment
White Mixed Asian Black Chinese All pupils
2017
Key Stage 2 - % achieving expected standard in reading, writing & maths
Reading 60 54 63 57 - 59
England 61 63 64 61 78 65
GCSE - Average Attainment 8 score
Reading 48.9 46.6 56.5 41.7 80.8 49.6
England 46.0 47.1 50.2 45.0 63.0 46.4
2016
Key Stage 2 - % achieving expected standard in reading, writing & maths
Reading 55 52 63 45 - 56
England 54 56 56 51 72 54
GCSE - Average Attainment 8 score
Reading 49.8 45.2 58.7 45.5 78.3 51.4
England 49.0 49.5 52.1 47.8 62.2 50.1
Source: Department for Education and National Consortium for Examination Results (GCSE data 2016)
The table above highlights that, in Reading, attainment at both Key Stage 2 and GCSE level by young people from Black and mixed race communities is lower than that of their peers, reflecting the national picture. Students from Asian communities tend to achieve a higher level of attainment.

Reading Poverty Needs Analysis 2017
60
Free school meals A higher proportion of mixed race and Black children are eligible for free school meals than White children, but a lower proportion of Asian and Chinese children. The proportion eligible has decreased since 2014 for all groups, except for Chinese children. Research shows that nationally White children who are eligible for free school meals are consistently the lowest performing group in the country, and the difference between their educational performance and that of their less-deprived White peers is larger than for any other ethnic group. The gap exists at age five and widens as children get older50.
Eligibility for free school meals by ethnic group
Eligible for free school meals 2017
Eligible for free school meals 2016
White 14.1% 14.5%
Mixed 24.3% 25.8%
Asian 8.1% 8.7%
Black 17.6% 18.1%
Chinese 3.6% 2.7%
Source: Reading Borough Council School Census Health This table shows the percentage of hospital admissions in 2014/15 that were emergencies for each ethnic group in Reading. A high percentage of emergency admissions may reflect some patients not accessing or receiving the care most suited to managing their conditions. There is a higher proportion of admissions by residents from all BME groups than White groups in Reading (though nationally the percentage for mixed and Chinese communities is lower). The proportion has increased since the previous year for all groups nationally and for most groups in Reading, except for Black communities where it has decreased from 47.6% to 45.1%. Percentage of emergency hospital admissions by ethnic group All
ethnic groups
White Mixed Asian Black Chinese Other Un known
Reading - no of emergency admissions
12,257
9,094
227
1,089
574
53
182
1,038
Reading
41.3%
42.4%
45.4%
47.2%
45.1%
45.0%
51.5%
28.4%
England
39.4%
39.9%
38.8%
44.0%
43.1%
35.9%
44.9%
30.9%
Source: Reading Health Profile 2016, Public Health England (data 2014/15)
50 the Government’s Education Committee, ‘Underachievement in Education by White Working Class Children’

Reading Poverty Needs Analysis 2017
61
Job Seekers Allowance claimant count
In Nov 2017, 67.3% JSA claimants were White and 28% claimants were from BME groups (a slight increase since Nov 2016).
JSA claimants by ethnic group
Source: NOMIS
Migration and country of birth International migration is a key driver of population growth in Reading, and the number of people coming to live in Reading is considerably higher than in neighbouring boroughs. Consequently, Reading has a higher proportion of residents born outside of the UK than the South East and the UK as a whole, with an estimated 40,000 born outside of the UK in 2014, representing 25.32% of the total population51. These are likely to be mostly working age people, with the largest proportions born in Poland, India, Pakistan, Republic of Ireland and Germany, and they are more likely to be resident in areas near the town centre.
Country of birth (top 10 in Reading)
% of Reading
Population
No. in Reading
population
% of England and Wales population
India 3% 4670 1.2%
Poland 2.5% 3919 1.0%
Pakistan 2% 3160 0.9%
Republic of Ireland 1.1% 1732 0.7%
Germany 0.7% 1042 0.5%
Zimbabwe 0.5% 827 0.2%
South Africa 0.5% 818 0.3%
Ghana 0.5% 816 0.2%
Hong Kong 0.5% 785 0.2%
Nigeria 0.5% 755 0.3%
Source: 2011 Census, Office for National Statistics
51 Office of National Statistics, Migration Indicators Tool (August 2015).
Ethnicity Nov 2017 Nov 2016
No claimants
% claimants
No claimants
% claimants
White 855 67.3% 850 67.7%
Total ethnic minority 355 28.0% 340 27.1%
Mixed 65 5.1% 55 4.4%
Asian or Asian British 95 7.5% 100 8.0%
Black or Black British 160 12.6% 150 12.0%
Chinese or Other 35 2.8% 35 2.8%
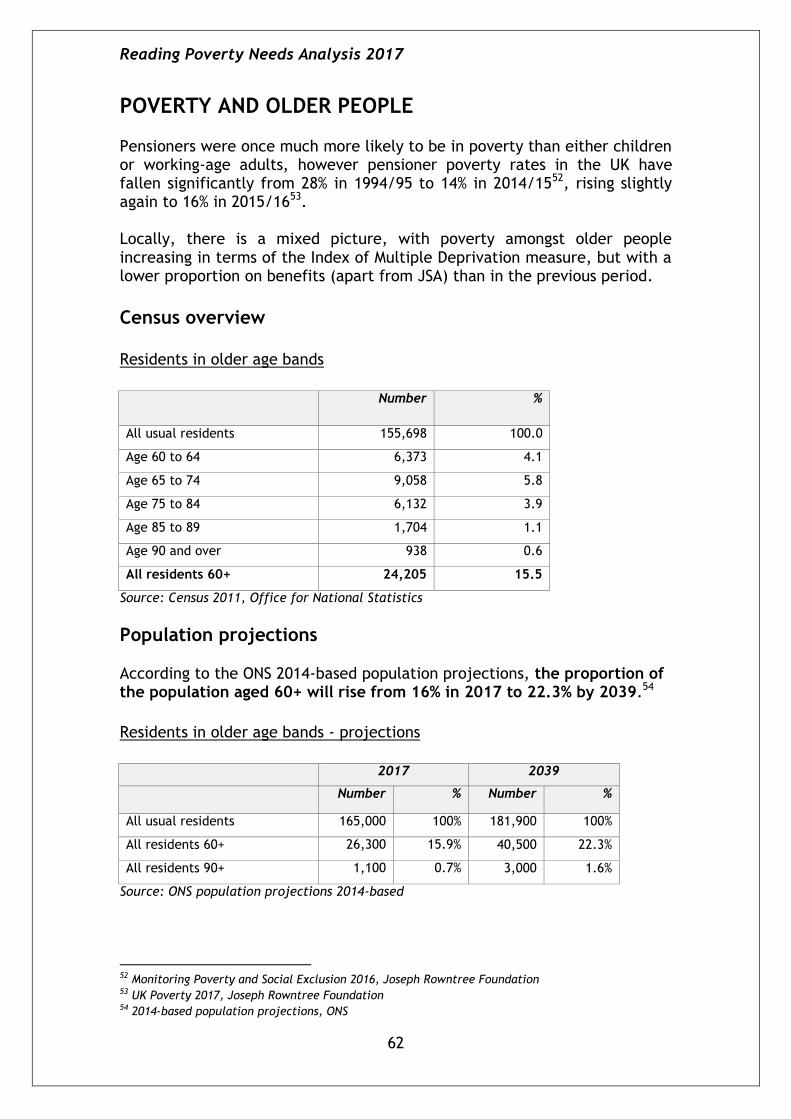
Reading Poverty Needs Analysis 2017
62
POVERTY AND OLDER PEOPLE Pensioners were once much more likely to be in poverty than either children or working-age adults, however pensioner poverty rates in the UK have fallen significantly from 28% in 1994/95 to 14% in 2014/1552, rising slightly again to 16% in 2015/1653. Locally, there is a mixed picture, with poverty amongst older people increasing in terms of the Index of Multiple Deprivation measure, but with a lower proportion on benefits (apart from JSA) than in the previous period.
Census overview Residents in older age bands
Number %
All usual residents 155,698 100.0
Age 60 to 64 6,373 4.1
Age 65 to 74 9,058 5.8
Age 75 to 84 6,132 3.9
Age 85 to 89 1,704 1.1
Age 90 and over 938 0.6
All residents 60+ 24,205 15.5
Source: Census 2011, Office for National Statistics
Population projections According to the ONS 2014-based population projections, the proportion of the population aged 60+ will rise from 16% in 2017 to 22.3% by 2039.54
Residents in older age bands - projections
2017 2039
Number % Number %
All usual residents 165,000 100% 181,900 100%
All residents 60+ 26,300 15.9% 40,500 22.3%
All residents 90+ 1,100 0.7% 3,000 1.6%
Source: ONS population projections 2014-based
52 Monitoring Poverty and Social Exclusion 2016, Joseph Rowntree Foundation 53 UK Poverty 2017, Joseph Rowntree Foundation 54 2014-based population projections, ONS
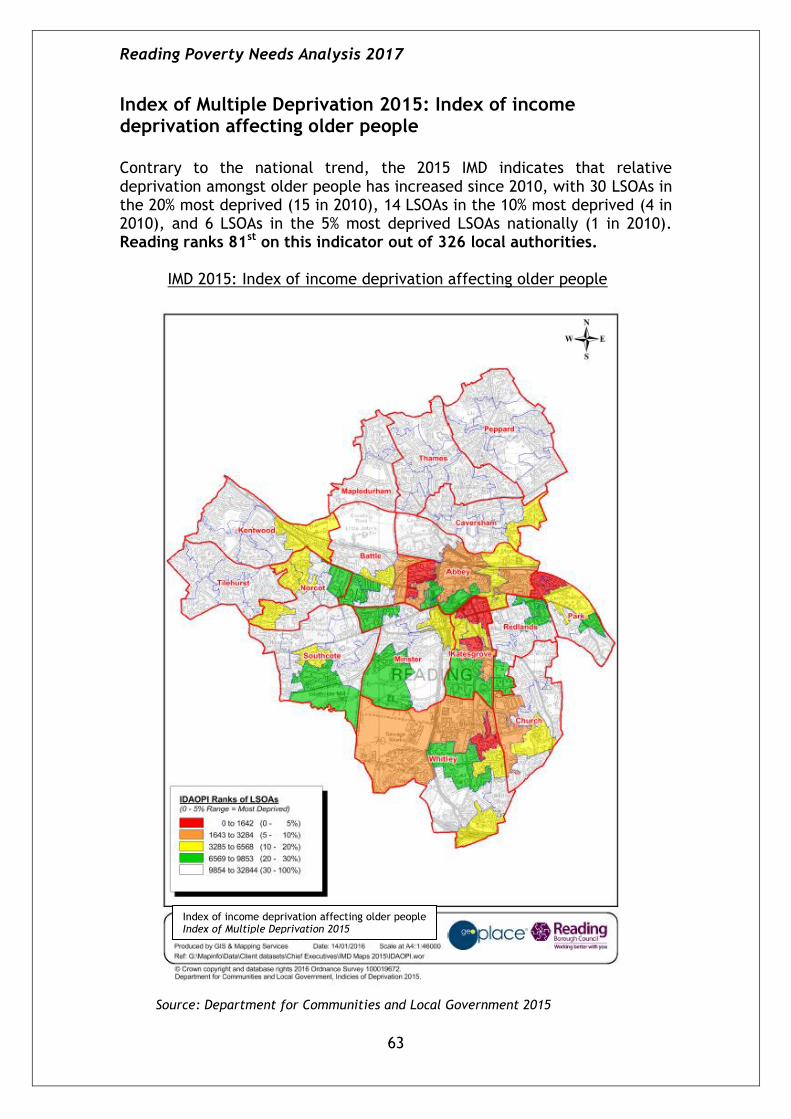
Reading Poverty Needs Analysis 2017
63
Index of Multiple Deprivation 2015: Index of income deprivation affecting older people Contrary to the national trend, the 2015 IMD indicates that relative deprivation amongst older people has increased since 2010, with 30 LSOAs in the 20% most deprived (15 in 2010), 14 LSOAs in the 10% most deprived (4 in 2010), and 6 LSOAs in the 5% most deprived LSOAs nationally (1 in 2010). Reading ranks 81st on this indicator out of 326 local authorities. IMD 2015: Index of income deprivation affecting older people
Source: Department for Communities and Local Government 2015
Index of income deprivation affecting older people Index of Multiple Deprivation 2015
Reading Poverty Needs Analysis 2017
64
Excess winter deaths The ratio of excess winter deaths to expected deaths55 increased in Reading to the highest in the country in the period 2008-2011 (3 year average). Since then, the ratio has fallen to around the national average. Both the Reading and national ratios have decreased since the previous period. Excess winter deaths 2013-16 2012-15 2011-14 2010-13
Reading 17.7 25.7 19.1 23.3
England 17.9 19.6 15.6 17.4 Source: Public Health England Health Profile 2017
Benefits claimants Although pensioner poverty may have fallen at a national level, the proportion of deprived people aged 65 and over in Reading is above the average for South East.56
Benefit claimants over 65
May 2017 May 2016
Benefit No claimants
Rate57 No claimants
Rate58
Disability Living Allowance
890 4.5% 1,010 5.2%
Pension Credits
3,490 17.8% 3,620 18.6%
Carers Allowance
60 0.3% 50 0.3%
Incapacity Benefit / Severe Disablement
30 0.2% 40 0.2%
Source: NOMIS; ONS 2016 & 2015 mid-year estimates
Nationally, many older people are not claiming benefits to which they are entitled. According to DWP data for 2015/16, up to 33% of older people were failing to claim Pension Credit.
55 the number of additional deaths that occurred between December and March expressed as a percentage of the number of deaths expected to occur in a different four month period 56 Based on number of pension credit claimants 57 Rate of 65+ population, ONS 2016 mid year estimates 58 Rate of 65+ population, ONS 2015 mid year estimates

Reading Poverty Needs Analysis 2017
65
Pension credit The map below shows the distribution of Reading’s 3,610 Pension Credit claimants (aged 60+)59 in May 2017. This represents 13.9% of the 60+ population60 (down from 15% in May 2016), a higher rate than for both the South East (8.8%) and England (12%).
Pension credit claimants
Legend = no claimants at Lower Super Output level Source: NOMIS May 2017 (aged 60+)/ Office for National Statistics
JSA claimants The rate for JSA claimants in Reading over 50 is higher than the rate for the South East but in line with the national average, and has increased since Dec 2016. JSA claimants over 50 claimant rate61
Dec 2017 claimant rate
Dec 2016
Reading 0.5% 0.4%
South East 0.3% 0.3%
England 0.5% 0.4%
Source: NOMIS
See also the section on fuel poverty in the Meeting Basic Needs chapter.
59 Maps at LSOA level only available for 60+ population 60 Based on ONS 2016 mid-year population estimates 61 As a proportion of residents aged 16-64 (ONS 2016 mid year estimates)
Reading Poverty Needs Analysis 2017
66
POVERTY AND DISABILITY Nationally, 30% of people in a family with a disabled adult or child (6.4 million) live in poverty, a lower proportion than 20 years ago. However, this compares with a poverty rate of 19% for people in families without a disabled adult or child62. In relation to physical disabilities, it is estimated that by 2025, 50% of the national population will have at least one long-term condition63.
Census overview The rates of limiting long term illness and provision of unpaid care have changed little since 2001 and are below the average for England. Limiting long term illness and unpaid care
Reading 2011
England 2011
Reading 2001
People with limiting long-term illness 13.0% 17.6% 13.5%
Provision of unpaid care: % persons 8.0% 10.3% 7.7%
Source: 2011 Census, Office for National Statistics
Extent to which illness or disability is limiting % of resident population
Ward A lot A little Not at all
Reading 5.66 7.25 87.08
Abbey 4.51 5.38 90.11
Battle 4.13 5.98 89.89
Caversham 4.94 7.33 87.73
Church 6.33 7.77 85.90
Katesgrove 4.06 6.01 89.92
Kentwood 5.84 7.47 86.68
Mapledurham 4.59 9.55 85.86
Minster 7.43 7.39 85.19
Norcot 7.48 9.28 83.24
Park 4.09 5.01 90.90
Peppard 6.08 8.29 85.63
Redlands 3.65 5.48 90.87
Southcote 8.96 9.77 81.27
Thames 4.06 6.53 89.41
Tilehurst 7.15 9.11 83.74
Whitley 7.36 8.51 84.14 Source: 2011 Census, Office for National Statistics
62 UK Poverty 2017, Joseph Rowntree Foundation. 63 The Hidden Need in Berkshire, Overcoming Social Deprivation, Berkshire Community foundation, December 2010
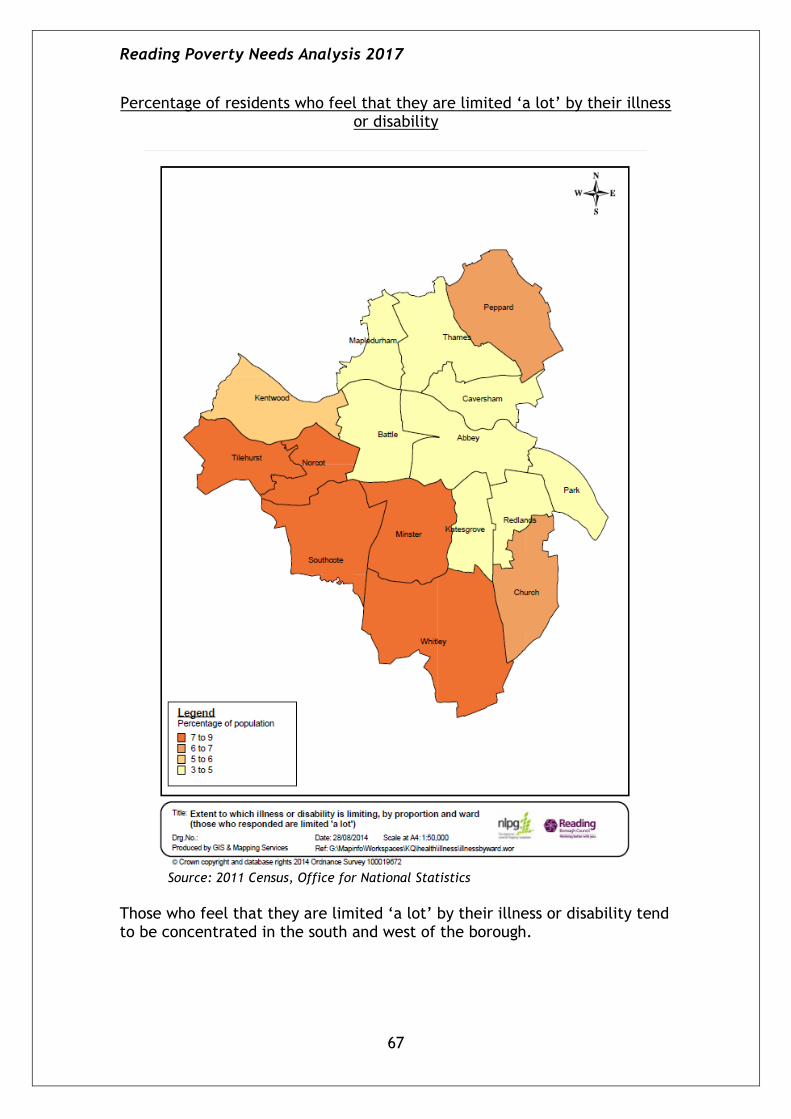
Reading Poverty Needs Analysis 2017
67
Percentage of residents who feel that they are limited ‘a lot’ by their illness or disability
Source: 2011 Census, Office for National Statistics
Those who feel that they are limited ‘a lot’ by their illness or disability tend to be concentrated in the south and west of the borough.

Reading Poverty Needs Analysis 2017
68
Benefits claimants In May 2017, 4,190 people in Reading were claiming Disability Living Allowance, 3.8% of the working age population64 (down slightly from May 2016, and lower than the South East and England averages). Their distribution is shown in the following map. 260 people were claiming Incapacity Benefit or Severe Disablement Allowance in May 2016, 0.2% of the working population.
Disability Living Allowance claimants
Legend = no claimants at Lower Super Output area level
Source: NOMIS May 2017/ Office for National Statistics
64 Based on ONS population projections mid 2016 (age 16-64)

Reading Poverty Needs Analysis 2017
69
Index of Multiple Deprivation 2015: Health deprivation and disability domain
Reading ranks 109th most deprived out of 326 LAs on this domain, with 3 LSOAs in bottom 20%, compared with 16 LSOAs in 2010. This domain measures rates of poor health, early mortality and disability and covers the entire age range, though areas high on this index tend to be those with a higher proportion of older residents.
IMD 2015: Health deprivation and disability domain
Source: Department for Communities and Local Government 2015

Reading Poverty Needs Analysis 2017
70
DEBT
According to the Joseph Rowntree Foundation, just under one in 10 households report having ‘problem debt’65. Research by Citizens’ Advice66 finds that one in twenty adults have debt worth more than six months of their income. When looking at different groups in society however, that figure is far higher:
One in fourteen of the lowest paid fifth of the population have debt worth more than six months’ income (7%)
One in ten private renters have debts worth six months of their income, nearly twice the proportion among people with a mortgage (10% compared to 6%)
One in seven of 20–29 year olds have more than six months’ income in debt, twice the figure for 30–39 year olds (14% compared to 7%)
Citizens Advice report that nationally around half of the people they help with debt problems have a problem in at least one other area of their life.
The most striking finding is the relationship between debt and mental health. People with unmanageable levels of debt are 24% more likely to have poor mental health – even taking into account their incomes and other factors
65 defined by the Family Resources Survey as being behind with any household bill or credit
commitment; UK Poverty 2017, Joseph Rowntree Foundation 66 Citizens Advice, Aug 2016
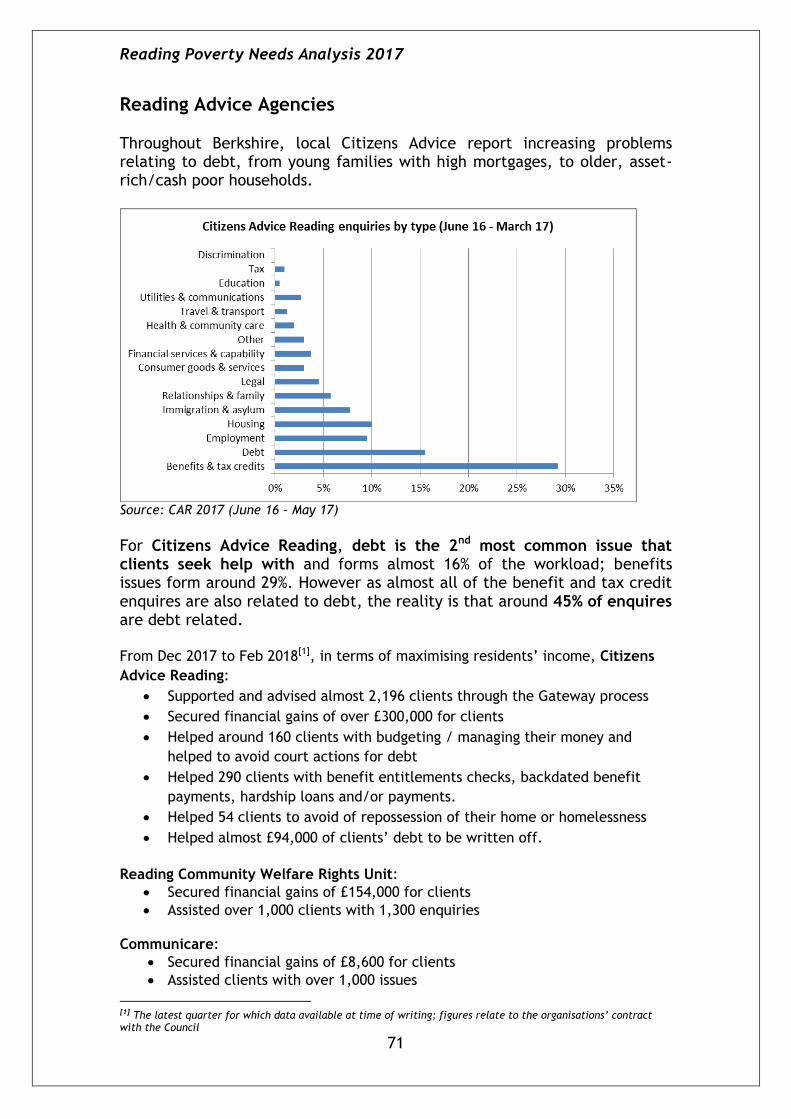
Reading Poverty Needs Analysis 2017
71
Reading Advice Agencies Throughout Berkshire, local Citizens Advice report increasing problems relating to debt, from young families with high mortgages, to older, asset-rich/cash poor households.
Source: CAR 2017 (June 16 – May 17) For Citizens Advice Reading, debt is the 2nd most common issue that clients seek help with and forms almost 16% of the workload; benefits issues form around 29%. However as almost all of the benefit and tax credit enquires are also related to debt, the reality is that around 45% of enquires are debt related. From Dec 2017 to Feb 2018[1], in terms of maximising residents’ income, Citizens
Advice Reading:
Supported and advised almost 2,196 clients through the Gateway process
Secured financial gains of over £300,000 for clients
Helped around 160 clients with budgeting / managing their money and
helped to avoid court actions for debt
Helped 290 clients with benefit entitlements checks, backdated benefit
payments, hardship loans and/or payments.
Helped 54 clients to avoid of repossession of their home or homelessness
Helped almost £94,000 of clients’ debt to be written off.
Reading Community Welfare Rights Unit:
Secured financial gains of £154,000 for clients
Assisted over 1,000 clients with 1,300 enquiries Communicare:
Secured financial gains of £8,600 for clients
Assisted clients with over 1,000 issues
[1] The latest quarter for which data available at time of writing; figures relate to the organisations’ contract with the Council