real estate institute of australia
TRANSCRIPT

Inquiry into housing affordability and supply in Australia Standing Committee on Tax and Revenue
September 2021
REAL ESTATE INSTITUTE OF AUSTRALIA

//02
CONTENTS
INTRODUCTION 03
REFERENCE LIST 16
RECOMMENDATIONS 09
COVID-19: A RISING MARKET 05
STATE OF THE STATES 13
About the Real Estate Institute of Australia 03
By the numbers 05
The great Australian dream 03
House sales 05
Rentals 05
Practitioner insights 06
Supply and listings over 20 years 07
Housing and rental affordability over 20 years 08
Recommendation 1: ‘Axe the tax.’ 09
Recommendation 2: ‘Build more houses.’ 11
Recommendation 3: ‘Get government right.’ 12
Home ownership and private rentals 03
First home buyers 04

INTRODUCTIONSummary of Recommendations REIA recommends three key areas to the Committee for immediate action to improve supply and affordability:
AXE THE TAXRemove punitive
taxation on Australian homes
and households and continue to support market entry and
exit programs.
BUILD MORE HOUSES
Increase new housing stock.
GET GOVERNMENT
RIGHTThe State
and Federal Governments must have a national plan
for housing.
About the Real Estate Institute of Australia REIA is the national voice for Australian real estate agents and agencies. Established in 1924, REIA is a federated body of State & Territory Real Estate Institutes representing 85% of Australian real estate agencies.There are 46,793 real estate agencies in Australia with 99% of these are small businesses. Agents employ 130,000 Australians across principles, sales agents, property managers and other business and operational support. Agents help 6.9 million Australians into new homes and rentals each year. The great Australian dream Home ownership remains a major part of the great Australian dream, with 75% of Australians viewing home ownership as part of the Australian way of life.1
Australian residential real estate outstrips other wealth asset classes at $8.8 trillion, compared with superannuation ($3.1 trillion), shares ($2.8 trillion) and commercial real estate ($978 billion).2
Home ownership and private rentals Australians largely live in owner-occupied dwellings, with housing in Australia categorised by the National Housing Investment Finance Corporation (NHFIC)3 in the following segments: • Private rentals: 27% of Australians live in private rentals • First home buyers: 15% of Australians are in the first home buyer category • Home owners: 67% of Australians are home owners, with 37% of households
having a mortgage• Social and affordable housing: 3% of Australians live in social and affordable rentals• Homelessness: 0.5% of Australians are categorised as homeless Census data shows that home ownership was at its highest level in 1966 at 73%, its lowest in 1947 at 53%, and sat at 67% at the last Census in 2016. Home ownership over time has been sustained at the 70% mark and has yet to exceed this point.4
1 CommBank, 2019. The Great Australian Dream Lives on as Home Loan Affordability Improves.2 Corelogic, September 2021. Housing Market Update.3 National Housing Finance and Investment Corporation, 2020. State of the Nation’s Housing 2020.4 Australian Housing and Urban Research Institute, 2020. Australian home ownership: past reflections.

Dual income home ownership has risen from 50% in 1981 to over 85% in 2016, whilst single income home ownership has declined from 50% in 1981 to under 15% in 2016. First home buyers Access to the market for first home buyers was at its best in June 2009, when 48.2% of all new loans were from first home buyers.5
In contrast, in March 2004 only 21.8% of new loans were from first home buyers. By June 2021, the number of first home buyers had risen to 43,226, a 67.7% increase from 2001. At that time, first home buyers made up 40% of new home loans, capitalizing on low interest rates and Government stimulus. Comparably high levels of market entry by first home buyers were achieved in both 2009 and 2020. This was as a result of wholesale first home buyer support introduced as stimulus measures in response to the G.F.C., including grants and stamp duty waivers.With COVID-19 economic stimulus and housing support programs ending, first home buyer activity has declined 20% since the start of 2021.6
From 2002 through to 2021, the average loan for first home buyers increased from $169,789 to $450,467, a 165.3% increase.The 2021 Census results, to be revealed in 2022, will highlight the impacts of the ten year high of first home buyers purchasing their first home in 2020.7
//4
5 Real Estate Institute of Australia, 2021. Housing Affordability Report – The case for home ownership: A 20 year analysis.6 Australian Bureau of Statistics, July, 2021. Lending indicators.7 Real Estate Institute of Australia, 2020. First Home Buyers Dominate Australia’s Property Market for the First Time in a Decade.

By the numbers Since the onset of the COVID-19 pandemic, house sales have accelerated. House prices have entered a period of sustained growth, while rents have remained relatively stable.These trends are evidenced in REIA’s Real Estate Market Facts for the June quarter:House sales • House prices recorded their highest ever quarterly increase, at 18.4%. • The weighted average median house price for the eight capital cities increased to
$913,946 over the year to June 2021. • The median price for other dwellings increased to $642,899.• Weighted average capital city median prices rose for all residential property types,
up 4.5% last quarter for houses and 2.9% for other dwellings.Rentals • Despite low vacancy rates across the nation, rental prices have remained relatively stable.8
• June quarter weighted average median rent for a 3-bedroom house increased by 0.4% to $453 in the eight capital cities.
• Median rent for a 3-bedroom house remained stable in Sydney, Melbourne, Brisbane and Adelaide. It increased in Perth, Hobart, Canberra and Darwin.
• Median rent for a 2-bedroom other dwelling increased in Adelaide, Perth and Darwin, but remained stable in Sydney and Hobart. It decreased in Melbourne, Brisbane, and Canberra.
• Vacancy rates decreased in Brisbane (to 1.3%), Canberra (0.7%), Hobart (1.1%), Darwin (1.5%) and Sydney (3%). Adelaide stabilised but maintained a very low vacancy rate at 0.7%. Melbourne recorded the only increase, to 6.3%.
COVID-19: A RISING MARKET
//5
SYDNEY MELBOURNE BRISBANE ADELAIDE PERTH CANBERRA HOBART DARWIN CAP. CITY
JUN Q 1,410.1 1,010.0 622.8 536.9 515.0 825.0 675.0 580.0 913.9
Q % CHANGE 8.2% 0.2% 6.5% 3.3% 2.2% 4.1% 8.2% 6.0% 4.4%
A % CHANGE 24.0% 16.0% 17.5% 11.9% 8.4% 17.7% 26.2% 21.5% 18.4%
Chart 2: Media house sales ($’000) for capital cities (REIA REMF, June quarter 2021)
6.3%
3.0%
1.3% 1.5% 0.7% 0.7% 1.0% 1.1%
Chart 1: Rental vacancy for capital cities (REIA REMF, June quarter 2021)
SYDNEY MELBOURNE PERTH CANBERRA HOBART DARWINBRISBANE ADELAIDE
8 Real Estate Institute of Australia, 2021. Real Estate Market Facts - June Quarter.(REMF)

//6
Practitioner insights Equally as important to analysing the market barriers is looking to feedback from real estate agents from within their networks on what is driving market behavior. This can be summarised as follows: • Listings: Currently there are simply not enough listings to keep pace with demand.
As a consequence, many houses are spending a single-digit number of days on the market.
• Expected ‘rightsizer’ behaviour is not playing out: Despite the introduction of tax-free downsizer super contributions, older Australians are preferring to remain in family homes or live across two dwellings rather than the expected ‘downsizing’ or ‘rightsizing’ behaviour expected of an ageing population.
• Competition interstate and internationally: Regional migrants and repatriating Australians are buying sight unseen at premium prices.
• Regional demand: Higher demand in regional areas as people escape from the cities, especially in regional rental market which has a drastic undersupply.
• Preference for houses: COVID-19 has seen a marked increase in demand for houses over apartments. COVID-19 social distancing and lockdown measures have meant a preference for a family home with bigger living and outdoor spaces to optimize work-life balance in one place.
• Social housing: Lack of government investment in social and affordable housing means the private market is left to fill this void. This has always been the case, but COVID-19 government responses, such as eviction moratoriums, have exacerbated the situation.
It is within this total context – considering both market facts and feedback from practitioners on the ground talking to Australians about housing options – that supply and affordability must be considered.
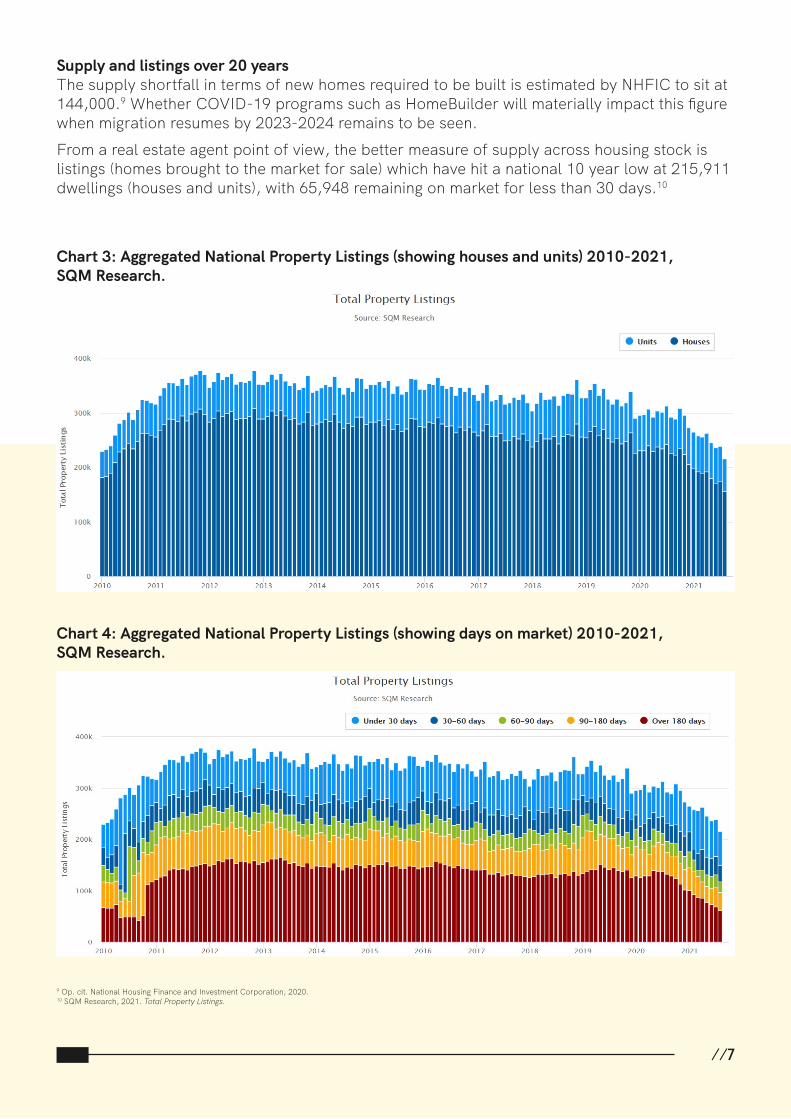
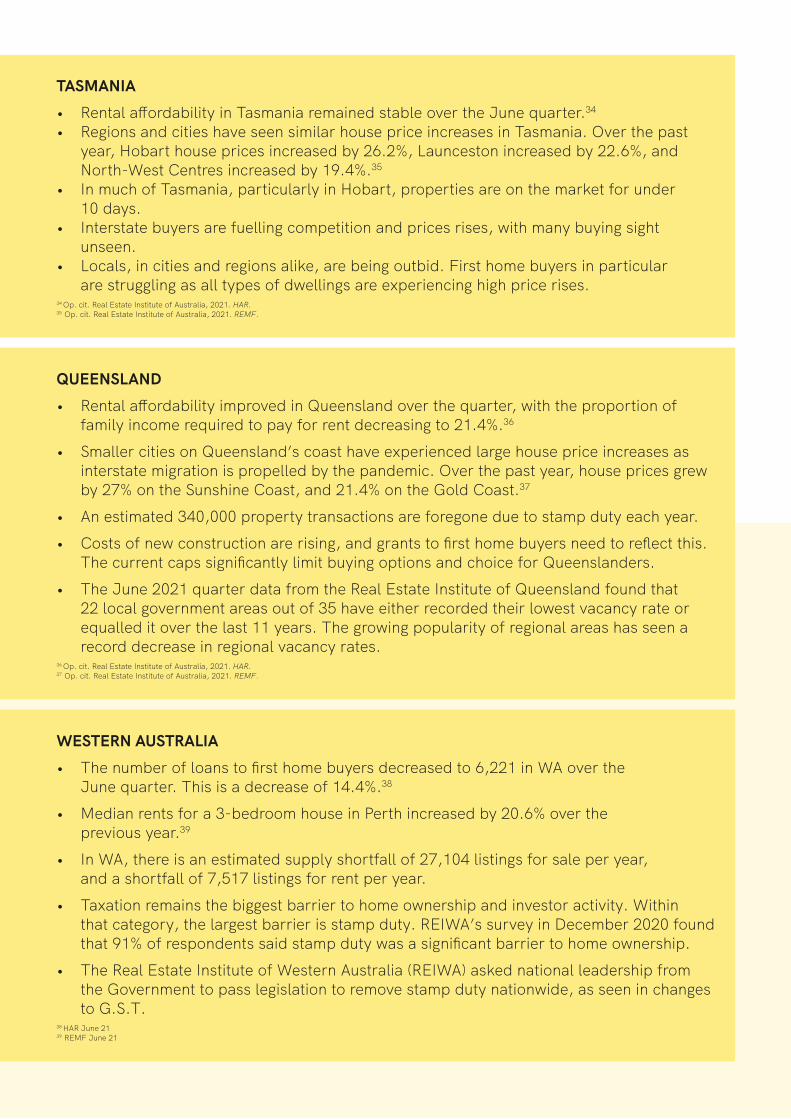
Supply and listings over 20 years The supply shortfall in terms of new homes required to be built is estimated by NHFIC to sit at 144,000.9 Whether COVID-19 programs such as HomeBuilder will materially impact this figure when migration resumes by 2023-2024 remains to be seen. From a real estate agent point of view, the better measure of supply across housing stock is listings (homes brought to the market for sale) which have hit a national 10 year low at 215,911 dwellings (houses and units), with 65,948 remaining on market for less than 30 days.10
9 Op. cit. National Housing Finance and Investment Corporation, 2020.10 SQM Research, 2021. Total Property Listings.
Chart 3: Aggregated National Property Listings (showing houses and units) 2010-2021, SQM Research.
Chart 4: Aggregated National Property Listings (showing days on market) 2010-2021, SQM Research.
//7

112.8%
179.4%
248.7%
Housing and rental affordability over 20 years REIA recently published a baseline report as a practitioner-led evidence base to guide housing affordability policy, Housing Affordability Report – The case for home ownership: a 20-year analysis.Since 2001, housing affordability was at its worst in September 2008, when 45.8% of median income was required to meet home loan repayments. Over the past 20 years, the weighted average proportion of income required to meet loan repayments has increased from 27.2% in 2001 (a monthly loan repayment of $1,093), to 35.7% in 2021 (a monthly loan repayment of $3,054). This is an increase of 8.5 percentage points). Rental affordability over the past 20 years has been largely stable.In 2001, 22.1% of median family income was required to meet rent commitments, which rose to 23.0% of family income in 2021, a marginal increase of 0.9 percentage points.Rental affordability was at its most affordable in December 2004 at 21.1%, and at its least affordable in March 2010 at 26.3%.
With these issues in mind, REIA makes three recommendations to the Inquiry:
Chart 5: Housing and rental affordability trend 2001-2021, REIA.
Chart 6: Increases in family income, home loan repayments and owner occupier home loans.
AXE THE TAXRemove punitive
taxation on Australian homes and households
and continue to support market entry and exit programs.
BUILD MORE HOUSES
Increase new housing stock.
GET GOVERNMENT
RIGHTThe State and Federal
Governments must have a national plan
for housing.
//8
FAMILY INCOME
REPAYMENTS AVERAGE HOME LOAN
50%
40%
30%
20%
10%
0%
2001 2003 2005 2007 2009 2011 2013 2015 2017 2019 2021
% of income on home loan
% of income on rent

//9
RECOMMENDATIONS
Real estate agents have long highlighted to State and Federal governments investors and owner-occupiers alike are discouraged from buying a property due to stamp duty. This is a major deterrent for Australians are struggling to buy a home and lower investor activity means upward pressure is placed on rentals. Thresholds for stamp duty and land tax have remained stagnant for over a decade. This means that the significant rise in property values makes thresholds (i.e. median prices) far too low. Agents have called for higher tax-free thresholds and broadening of exemptions, especially for first homebuyers, downsizers and rightsizers.
Foreign investor activity has also declined. There are a number of reasons for this, but chief among these reasons are Commonwealth and State charges. More foreign investment to add housing supply would have a positive impact on housing affordability, but current policies prove a disincentive. State governments remain over-reliant on stamp duty for revenue. There is a critical need for national taxation reform with benefits to economic growth, labour mobility and better use of housing stock providing benefits to renters, owners and buyers.
RECOMMENDATION 1: ‘AXE THE TAX.’Remove punitive taxation on Australian homes and households and continue to support market entry and exit programs.
Chart 7: Australian Stamp Duty Rates and Thresholds (PwC, 2021)

Axe the tax REIA has long taken the position that stamp or transfer duties are regressive taxes that should be removed, and that this would improve both supply and affordability over the long term. Stamp or transfer duties now total on average 4% of the cost of a home,11 and over 90% of first home buyers say this is a major deterrent to buying a home.In 2021, National Housing Finance and Investor Corporation has provided an excellent case for change in their paper Stamp Duty: Benefits and Challenges,12 outlining the non-financial benefits to stamp duty reform, primarily increased mobility. Beyond restricting mobility, NHFIC listed the negative effects of stamp duty:• Discourages efficient housing stock (2016 Census found that 11% of dwellings
were unoccupied).• Large economic cost • Narrow base (stamp duty contributes approximately 13% of State and Territory
Revenue, but is only paid by 4% of households per annum)• Volatile revenue source (property market cycles heavily impact government
finance and make predictions difficult)NHFIC found that Australia’s State and Territories are 40% more sensitive to duty than most European OECD countries – meaning stamp duty reform would see particularly significant benefits from increased mobility, including more efficient use of housing stock and improved labour productivity.13
There are a range of ways stamp duty could be sensibly dealt with, including: • Wholesale tax reform, revisiting the land tax proposal as per the 2009 Henry Review14
• Introduction of performance based Federal productivity schemes to incentivise States to remove inefficient taxation
• Stamp duty paid off over time, not as a cost of the transaction NHFIC details how a transition out of stamp duty can be achieved in a revenue neutral way, recommending a short phase-out period that will cost Australians less and provide more certainty around revenue replacement.
11 Australian Government, 2020. Commonwealth Grants Commission – 2020 Review.12 National Housing Finance and Investment Corporation, 2021. Stamp Duty Reform: Benefits and Challenges. 13 Ibid.14 Henry, K., 2009. Australia’s future tax system: Report to the Treasurer.15 Op. cit. National Housing Finance and Investment Corporation, 2021.
“A short phase out period can help by limiting the impact of house price growth on the cost of transition. For example, a substitute revenue neutral broad-based land tax would need to be 0.02ppts higher in NSW (0.45%) under a 20-year transition, assuming 5% per annum price growth, compared with a shorter 5-year transition (0.43%).”15
//10

Rightsizing Lone households with residents aged 70+ will grow strongly (+23 per cent) over the period 2019 to 2025, and couples without children are expected to also grow strongly over the same period (+9 per cent).16
Additional barriers to older Australians downsizing or rightsizing need to be addressed. Whilst programs like the Extending access to downsizer contributions announced in Budget 2021 are a welcome start.17
To stimulate the number of listings coming to market, additional concessions (such as the removal of CGT on second residences and investment properties) should be given serious consideration. Removal of stamp duty (so that it does not act as a further disincentive to rightsizers on purchasing a new home) remains a core barrier to turnover. Market support programs Market support programs should be progressively maintained and expanded by the Federal Government for all players within the housing spectrum. • First home buyers: The First Home Loan Deposit Scheme and the First Home Super Saver
Scheme should be continuously improved and expanded. Interest rates for first home buyers should also be tax deductable, as is the case in six other OECD countries, including Canada and New Zealand.18
• Investors: Negative gearing has served Australia well in supporting and promoting private rental markets, allowing the prevalence of mum-and-dad investors. 70 per cent of investors own just one investment property.19
In short, removal of inefficient property taxes – long an aspiration of many – should be prioritised. Proven market support programs should remain in place and expanded. Both would have a flow-on impact to both supply and affordability.
RECOMMENDATION 2: ‘BUILD MORE HOUSES.’Increase new housing stock.
NHFIC forecasts that project completions will fall by 12% by 2022, but that demand will fully rebound by 2023 and the supply crunch will return in force. After 2023, housing demand will lift to 144,700 dwellings in 2023. By 2024, demand will fall back close to pre-COVID levels of around 178,800 dwellings.From 2023 to 2025, on the back of a recovering economy and a return to normalisation of migration, new demand is expected to exceed new supply, highlighting the critical relationship between supply and affordability: “Over the longer term, NHFIC’s projections see housing demand bouncing back and will exceed housing supply between 2023 and 2025. Affordability for renters and prospective first home buyers could deteriorate if supply is not responsive to the strong rebound in demand.”20
In real estate agent’s terms, we must plan for this and build more new houses, in order to deal with both supply and affordability.
//11
16 Op. cit. National Housing Finance and Investment Corporation, 2021.17 Real Estate Institute of Australia, 2021. REIA Welcomes Property & Small Business Focus in Budget 2021. 18 Real Estate Institute of Australia, 2021. Budget Priorities for the 2021-2022 Federal Budget.19 Real Estate Institute of Australia, 2021. Sensible Approach to Royal Commission Reforms to Benefit Home Owners and Mum-and-Dad Investors.20 Op. cit. National Housing Finance and Investment Corporation, 2021.

RECOMMENDATION 3: ‘GET GOVERNMENT RIGHT.’The State and Federal Governments must have a national plan for housing.
Supply and demand-side issues, for example, Local and State Government Planning processes, will be well tabled by many stakeholders to this Inquiry. From a practitioner point of view, REIA wishes to highlight the following punitive components on home buyers and investors, which remain major impediments to supply and affordability: • Fees and charges: A new report analysing developer contributions by NHFIC report
showed that 8-11% of the cost of a new home is absorbed by local developers’ fees. These are ultimately worn by the homebuyer, not by developers.21 Charges can be as much as 40% of the total cost in land tax, stamp duty, development fees, infrastructure charges and GST.22
• Planning and land release: Costly application processes, slow release of land and delayed planning approval are major impediments to supply.
• Restricting residential tenancy legislation: This is the single biggest regulatory issue affecting private rentals with an equitable, national and best practise regulatory approach needed in developing residential tenancy legislation.
Government leadership is needed to combat undersupply and improve affordability. A clear plan, involving the three levels of government and regular industry engagement, needs to be undertaken. A strategic approach will respond to current inefficiencies, data, and feedback from buyers, renters, and agents on the ground. A national plan should include: The establishment of a government-led mechanism for reliable data on housing demand and supply, identify targets and benchmark performance on housing supply, land release and national planning reform and with annual progress tracked and reviewed.
21 National Housing Finance and Investment Corporation (2021, August 21.) Developer contributions – how should we pay for new local infrastructure?22 Corcoran, M., 2017. Government tax take as much as 40 per cent of total home cost.
//12

STATE OF THE STATESAustralian real estate is by nature highly localised, and each market tells a different story.
THE AUSTRALIAN CAPITAL TERRITORY• Total number of home loans over the past year increased by 33.7% in ACT.23
• Canberra has a high proportion of renters, as the city is more transient than most and has a high student population. Canberra’s vacancy rate sits below1%. Areas which were previously less competitive have become even tighter, such as the Inner South with a 0.7% vacancy rate.24
• The Real Estate Institute of the Australian Capital Territory (REIACT) estimates that there is a yearly shortfall of 2,583 listings for homes to market, and a shortfall of 4,145 listings for rent.
• At a local level, stamp duty caps for first home buyers purchasing existing properties need to match the rising sales prices, with the median house in the ACT now $825,000.25
• Land tax and reduction of lessor rights has seen an 8% exodus of investors – reducing the number of private rentals available – over the period March 2020-June 2021.
23 Real Estate Institute of Australia, 2021. Housing Affordability Report – June Quarter. (HAR)24 Op. cit. Real Estate Institute of Australia, 2021. REMF. 25 Ibid.
NEW SOUTH WALES• The proportion of family income devoted to meeting the average loan repayments was
43.9% in the June quarter of 2021, increasing 3.7% over the previous quarter.26
• Both regional and inner-city and outer-city regions are seeing substantial increases in house price. Over the past year, prices in NSW grew 28.7% in Inner Sydney, 19.8% in Middle Sydney, 20.1% in Outer Sydney, 23.1% in Wollongong and 21.9% in Newcastle.27
• NSW has seen particularly pronounced price rises, and the pandemic has seen regional hotspots reach record increases. For example, the median Byron Bay home sold for an extra $1,286,000 in the space of a year.28
• Government continues to focus on incentivizing buyers to come into the market, but needs to also give incentives to increase supply so that buyers can access properties at more affordable prices. Supply is the answer to affordability.
26 Op. cit. Real Estate Institute of Australia, 2021. HAR.27 Op. cit. Real Estate Institute of Australia, 2021. REMF.28 Flaherty, A., 2021. The suburbs where prices are rising by more than $50k a month.
//13

VICTORIA• In the June quarter, the number of home loans to first home buyers increased to
13,717, the highest number across Australia.32 • In the June quarter, the rental vacancy rate in Melbourne increased to 6.3%.33
• The Real Estate Institute of Victoria (REIV) has observed that the number of sales transactions has decreased by 21% compared to 5 years ago, with 2019 seeing some of the lowest levels of activity on record.
• On the other hand, the regional rental market is experiencing a significant shortage, as vacancy rates drop to just 1.1% in April 2021, significantly lower than the 3-4% that is considered a healthy market.
• There needs to be more investment in social and affordable housing. At present, the private market is the de facto solution to the lack of appropriate housing.
32 Op. cit. Real Estate Institute of Australia, 2021. HAR.33 Op. cit. Real Estate Institute of Australia, 2021. REMF.
NORTHERN TERRITORY• The number of first home buyers has increased by 65.9% over the year in NT.
However, over the June quarter, this decreased by 2.0% to 350 loans.30
• Rental prices are seeing much higher price rises than sale price rises in the NT. Over the past year, rent for a 3-bedroom house increased by 45.8% in Darwin Inner, and 34.5% in Palmerston.31
• The Real Estate Institute of the Northern Territory (REINT) has argued against the cessation of COVID-19 temporary stimulus measures for first home buyers, warning that once they are taken away, barriers to entry will once again be too high for many.
• Turnover at a local level is impaired by many inefficiencies: Government bureaucracy, time taken getting planning approval, running marketing campaigns, booking pre-sales and securing finance, and slow release of land for new homes.
• Social housing is also of critical need and should be maintained, upgraded and expanded.
30 Op. cit. Real Estate Institute of Australia, 2021. HAR.31 Op. cit. Real Estate Institute of Australia, 2021. REMF.
SOUTH AUSTRALIA• Over the past year, there has been a 53.9% increase in the total number of loans in SA,
with the average loan size increasing 7.2% over the year, to $401,109.• The median rent for 3-bedroom houses in Adelaide has remained stable at $400 a week,
increasing 11.1% over the past year. However, trends in regional areas over the quarter have been varied, with Mount Gambier having SA’s largest rental increase (5.5%), and Port Lincoln having the sharpest decrease (-11.7%).29
• Vacancy rates have halved in SA, to below 1%. • There is a sales listing shortfall for every type of house on the market.• SA is seeing an influx of interstate migrants and buyers, with three consecutive quarters
of positive net migration.29 Op. cit. Real Estate Institute of Australia, 2021. REMF.
QUEENSLAND• Rental affordability improved in Queensland over the quarter, with the proportion of
family income required to pay for rent decreasing to 21.4%.36
• Smaller cities on Queensland’s coast have experienced large house price increases as interstate migration is propelled by the pandemic. Over the past year, house prices grew by 27% on the Sunshine Coast, and 21.4% on the Gold Coast.37
• An estimated 340,000 property transactions are foregone due to stamp duty each year.• Costs of new construction are rising, and grants to first home buyers need to reflect this.
The current caps significantly limit buying options and choice for Queenslanders. • The June 2021 quarter data from the Real Estate Institute of Queensland found that
22 local government areas out of 35 have either recorded their lowest vacancy rate or equalled it over the last 11 years. The growing popularity of regional areas has seen a record decrease in regional vacancy rates.
36 Op. cit. Real Estate Institute of Australia, 2021. HAR.37 Op. cit. Real Estate Institute of Australia, 2021. REMF.
WESTERN AUSTRALIA• The number of loans to first home buyers decreased to 6,221 in WA over the
June quarter. This is a decrease of 14.4%.38
• Median rents for a 3-bedroom house in Perth increased by 20.6% over the previous year.39
• In WA, there is an estimated supply shortfall of 27,104 listings for sale per year, and a shortfall of 7,517 listings for rent per year.
• Taxation remains the biggest barrier to home ownership and investor activity. Within that category, the largest barrier is stamp duty. REIWA’s survey in December 2020 found that 91% of respondents said stamp duty was a significant barrier to home ownership.
• The Real Estate Institute of Western Australia (REIWA) asked national leadership from the Government to pass legislation to remove stamp duty nationwide, as seen in changes to G.S.T.
38 HAR June 2139 REMF June 21
TASMANIA• Rental affordability in Tasmania remained stable over the June quarter.34
• Regions and cities have seen similar house price increases in Tasmania. Over the past year, Hobart house prices increased by 26.2%, Launceston increased by 22.6%, and North-West Centres increased by 19.4%.35
• In much of Tasmania, particularly in Hobart, properties are on the market for under 10 days.
• Interstate buyers are fuelling competition and prices rises, with many buying sight unseen.
• Locals, in cities and regions alike, are being outbid. First home buyers in particular are struggling as all types of dwellings are experiencing high price rises.
34 Op. cit. Real Estate Institute of Australia, 2021. HAR.35 Op. cit. Real Estate Institute of Australia, 2021. REMF.

REFERENCE LISTAustralian Bureau of Statistics, 2021. Lending indicators - July. [Online] Available at: https://www.abs.gov.au/statistics/economy/finance/lending-indicators/latest-release#first- home-buyers [Accessed 20 August 2021].
Australian Government, 2020. Commonwealth Grants Commission - 2020 Review, s.l.: s.n.
Australian Housing and Urban Research Institute, 2020. Australian home ownership: past reflections, Melbourne: s.n.
CommBank, 2019. THE GREAT AUSTRALIAN DREAM LIVES ON AS HOME LOAN AFFORDABILITY IMPROVES. [Online] Available at: https://www.commbank.com.au/guidance/newsroom/cba-aussie-dream-social-201907.html [Accessed 10 September 2021].
Corcoran, M., 2017. Government tax take as much as 40 per cent of total home cost. Australian Financial Review, 2017 April.
CoreLogic, 2021. Housing Market Update - September, s.l.: s.n.
Flaherty, A., 2021. The suburbs where prices are rising by more than $50k a month. [Online] Available at: https://www.realestate.com.au/insights/the-suburbs-where-prices-are-rising-by-more-than- 50k-a-month/ [Accessed 10 September 2021].
Henry, K., 2009. Australia’s future tax system: Report to the Treasurer, Canberra: Commonwealth of Australia.
National Housing Finance and Investment Corporation. (2021, August 31). Developed contributions – How should we pay for new local infrastructure? NHFIC Housing Research Portal: https://www.nhfic.gov.au/media/1735/210831-research-paper-developer-contributions-how-should-we-pay-for-new-local-infrastructure-final.pdf [Accessed 9 September 2021].
National Housing Finance and Investment Corporation, 2020. State of the Nation’s Housing 2020, s.l.: s.n.
National Housing Finance and Investment Corportation, 2021. Stamp Duty Reform: Benefits and Challenges, s.l.: s.n.
Real Estate Institute of Australia, 2021. Budget Priorities for the 2021-2022 Federal Budget. [Online] Available at: https://reia.asn.au/wp-content/uploads/2021/02/Final_REIA-2021-2022-Federal-Budget.pdf [Accessed 9 September 2021].
Real Estate Institute of Australia, 2021. First Home Buyers Flee the Market as Housing Prices Continue to Soar. [Online] Available at: https://reia.asn.au/wp-content/uploads/2021/09/REIA-MEDIA-RELEASE_LENDING-RATES-020921.pdf [Accessed 9 September 2021].
Real Estate Institute of Australia, 2021. Housing Affordability Report - The case for home ownership: A 20 year analysis, Canberra: s.n.
Real Estate Institute of Australia, 2021. Real Estate Market Facts - June Quarter, Canberra: s.n.
Real Estate Institute of Australia, 2021. REIA Welcomes Property & Small Business Focus in Budget 2021. [Online] Available at: https://reia.asn.au/wp-content/uploads/2021/05/REIA-MEDIA-RELEASE-2021-BUDGET-RESPONSE-110521.pdf [Accessed 9 September 2021].
Real Estate Institute of Australia, 2021. Sensible Approach to Royal Commission Reforms to Benefit Home Owners and Mum-and-Dad Investors. [Online] Available at: https://reia.asn.au/wp-content/uploads/2021/07/ REIA-MEDIA-RELEASE-COMMISSION-REFORMS-130721.pdf [Accessed 9 September 2021].
SQM Research, 2021. Total Property Listings. [Online] Available at: https://sqmresearch.com.au/total- property-listings.php?national=1&t=1&hu=1 [Accessed 9 September 2021].

THANK YOU