real personal income for states and metropolitan areas, 2016 · • across large metropolitan...
TRANSCRIPT
EMBARGOED UNTIL RELEASE AT 8:30 A.M. EDT, Thursday, May 17, 2018 BEA 18-23
Technical: Eric Figueroa 301.278.9328 [email protected]
Media: Jeannine Aversa 301.278.9003 [email protected]
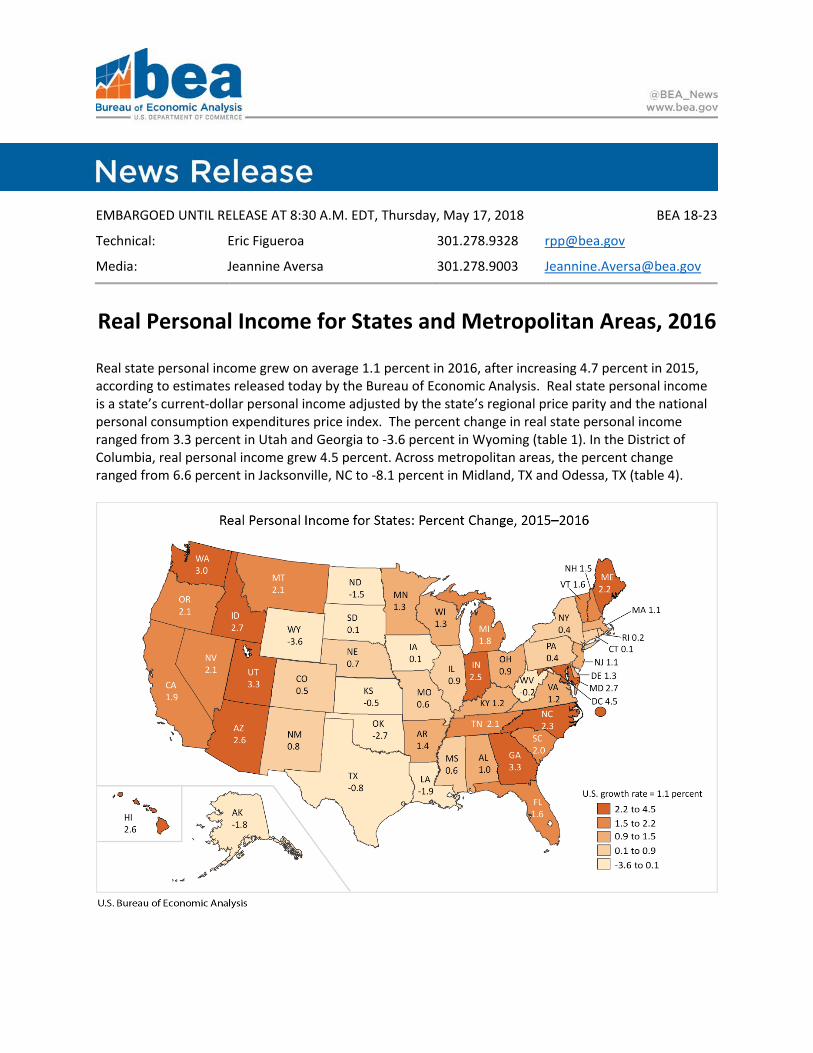
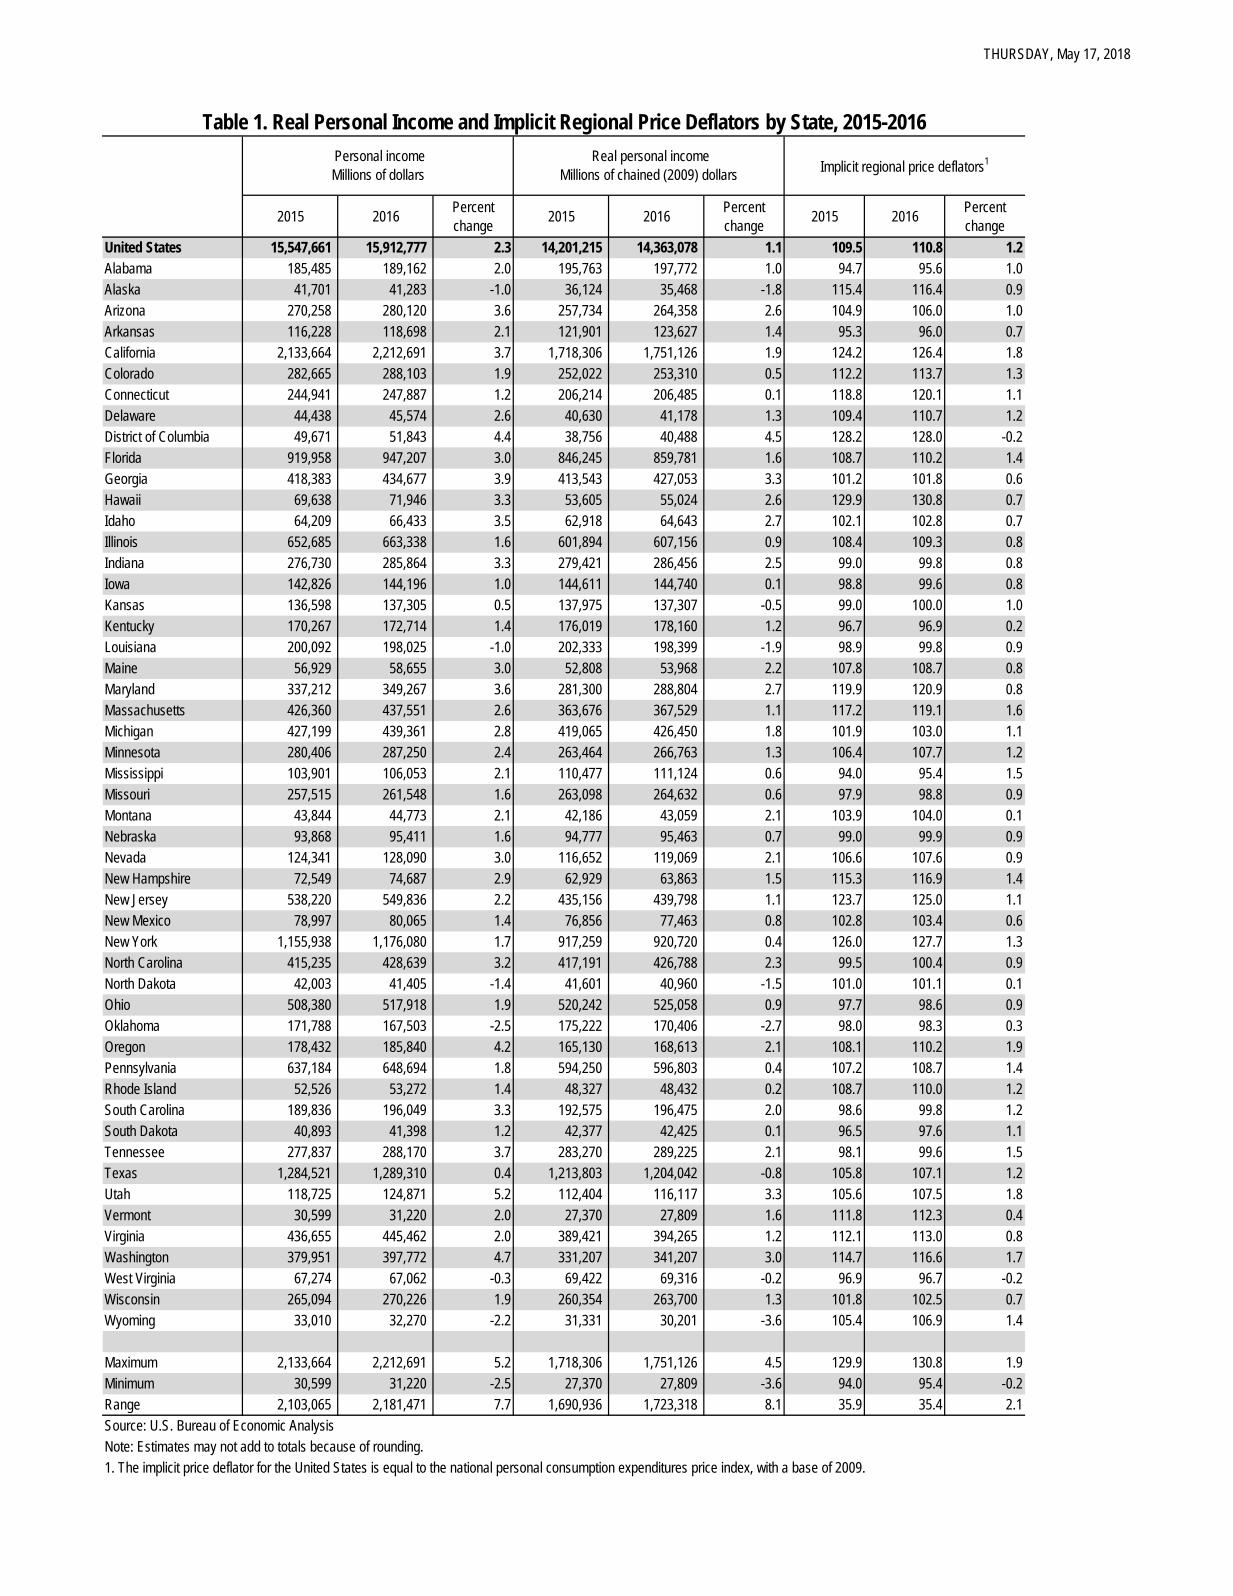
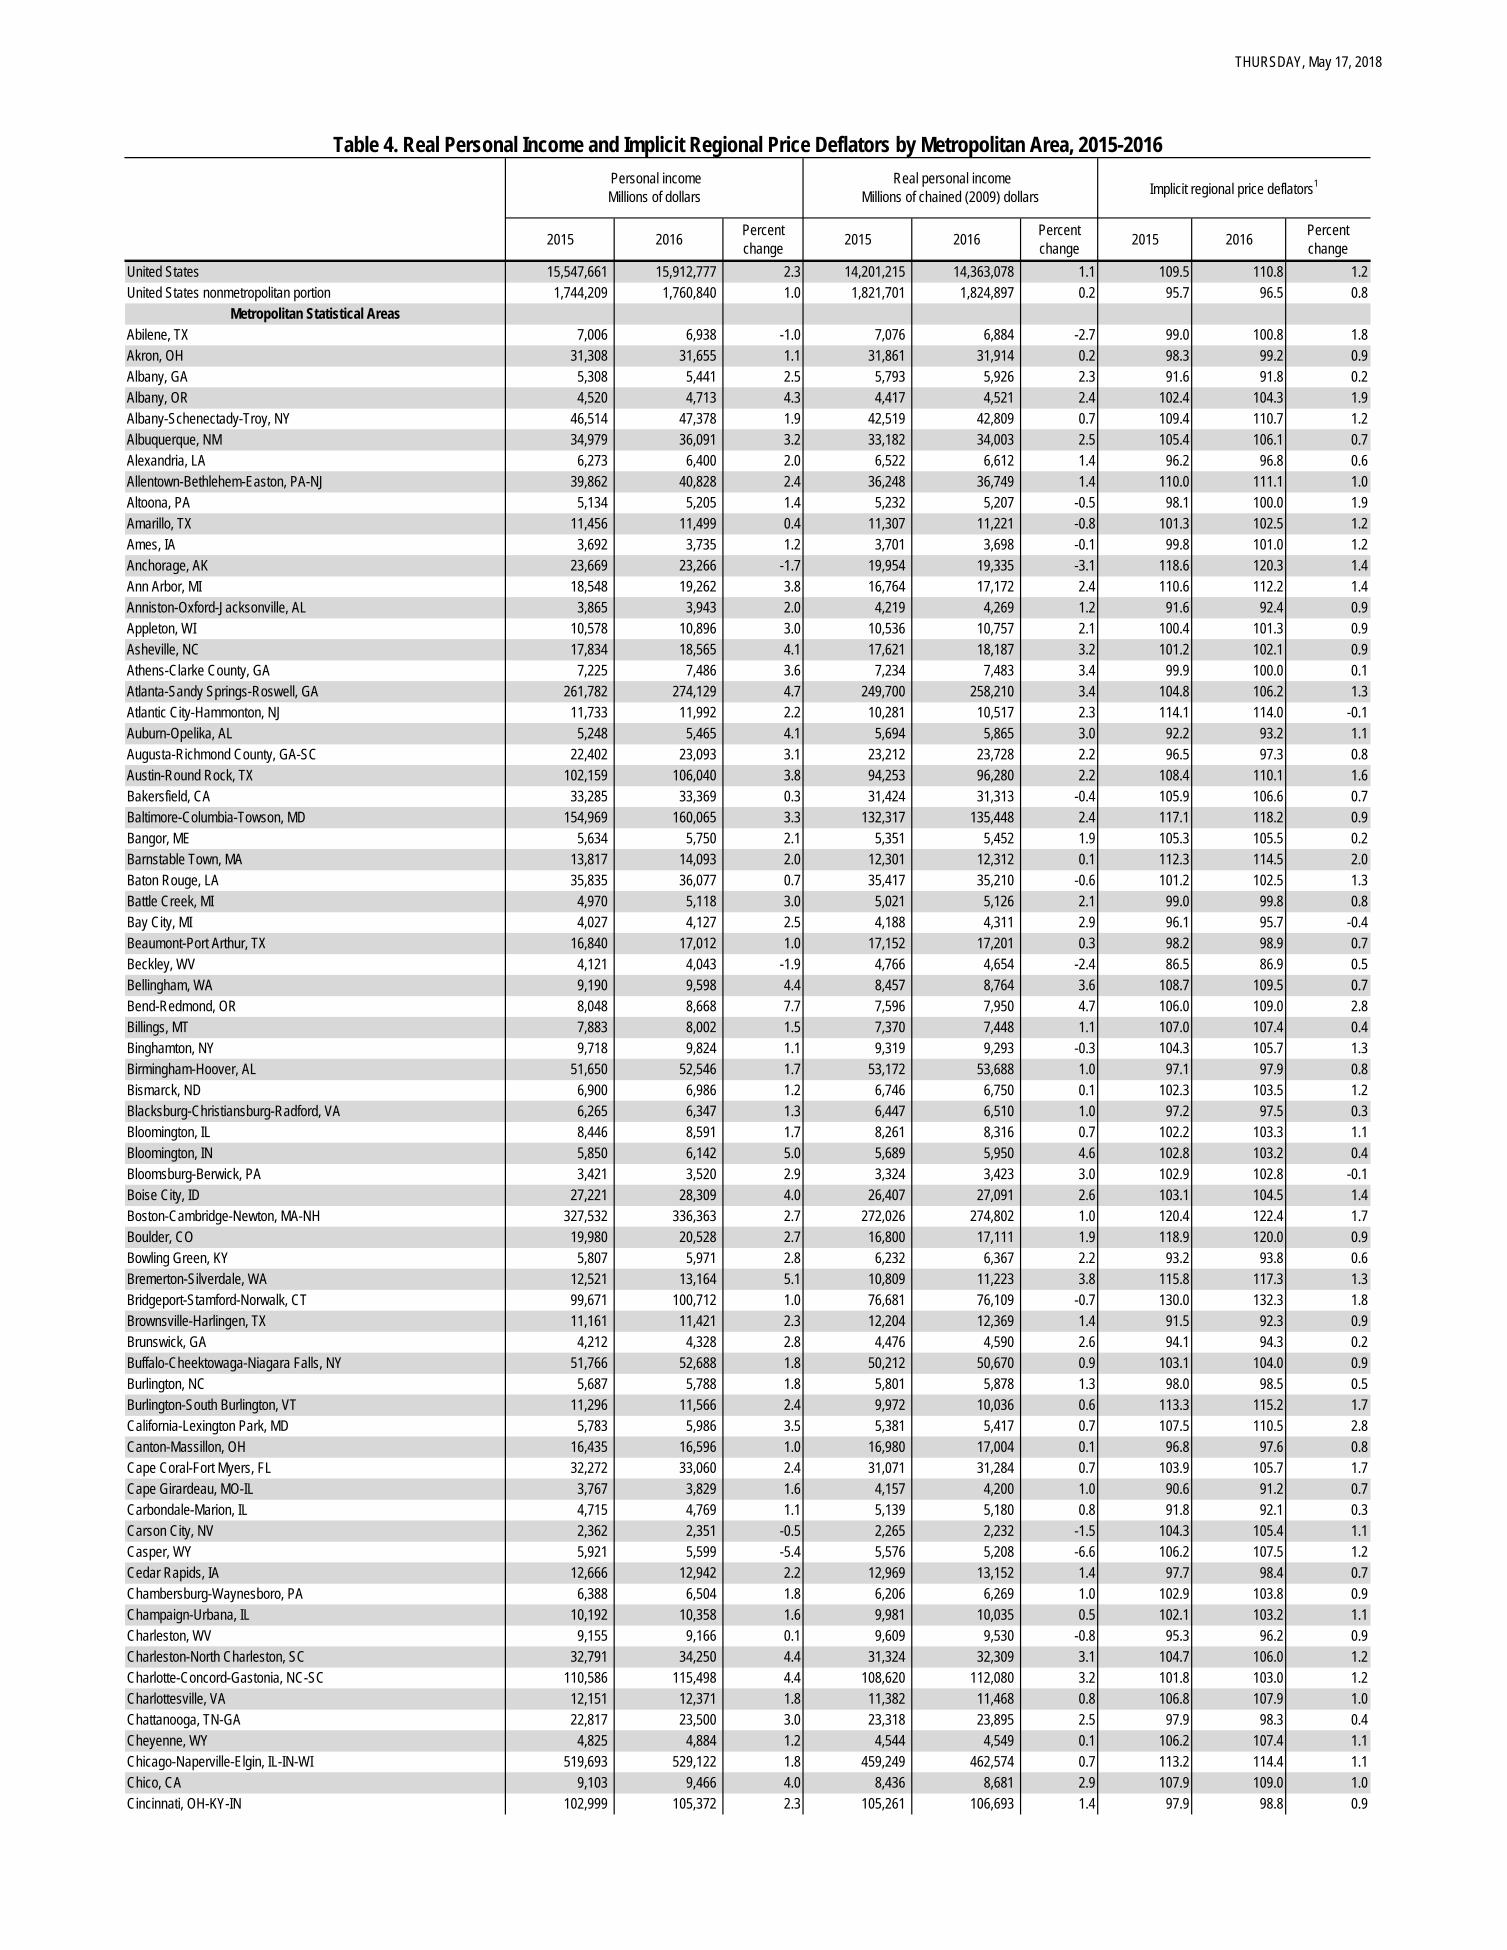
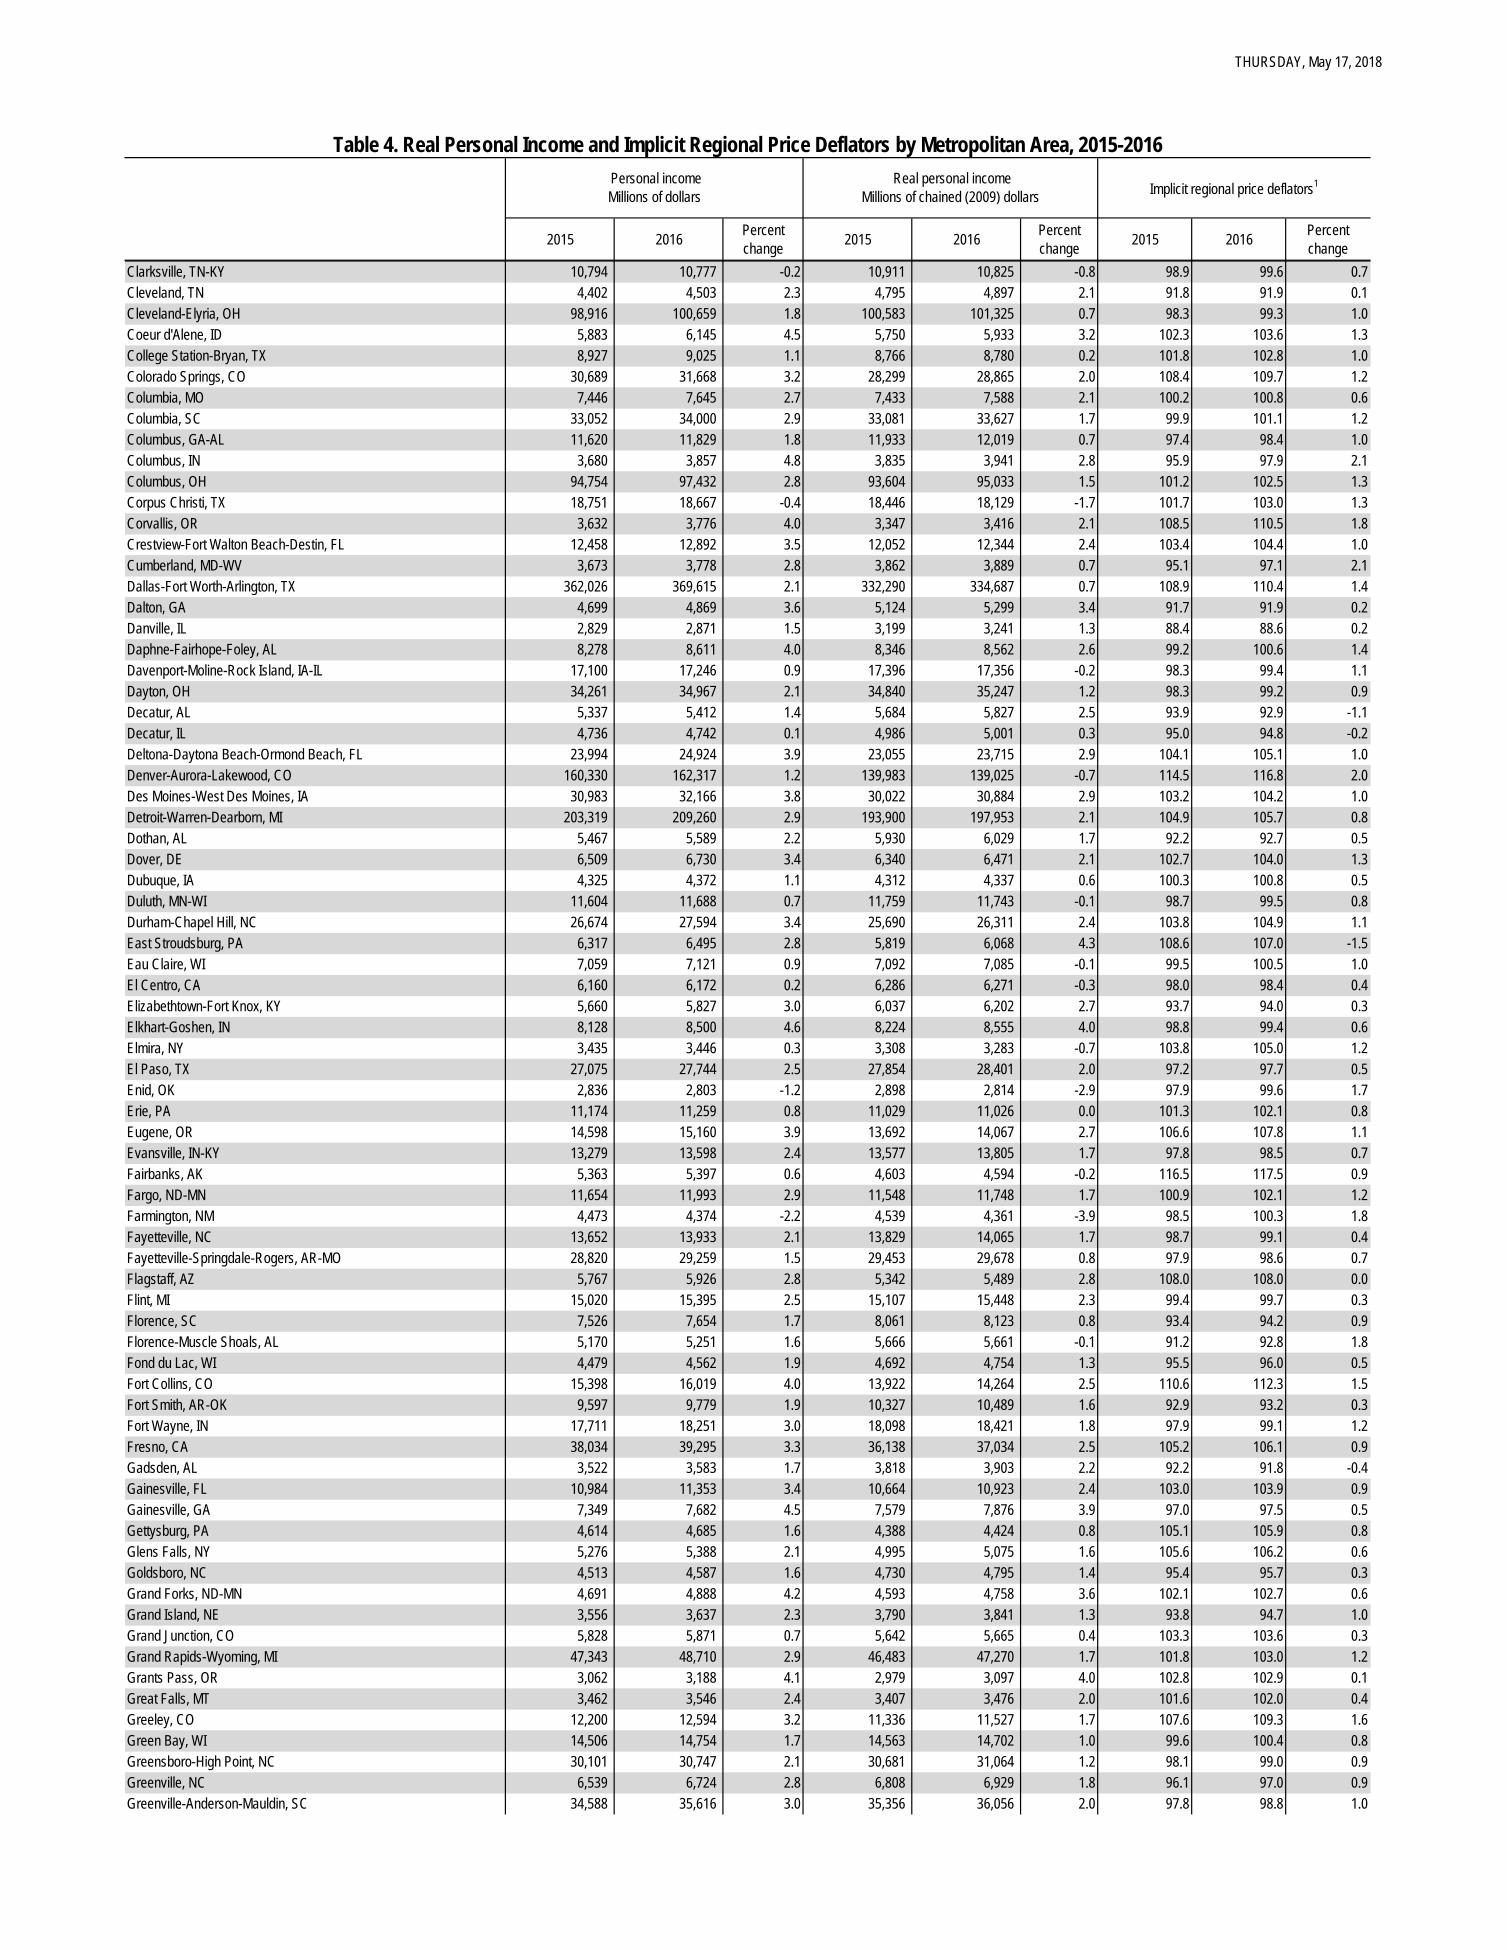
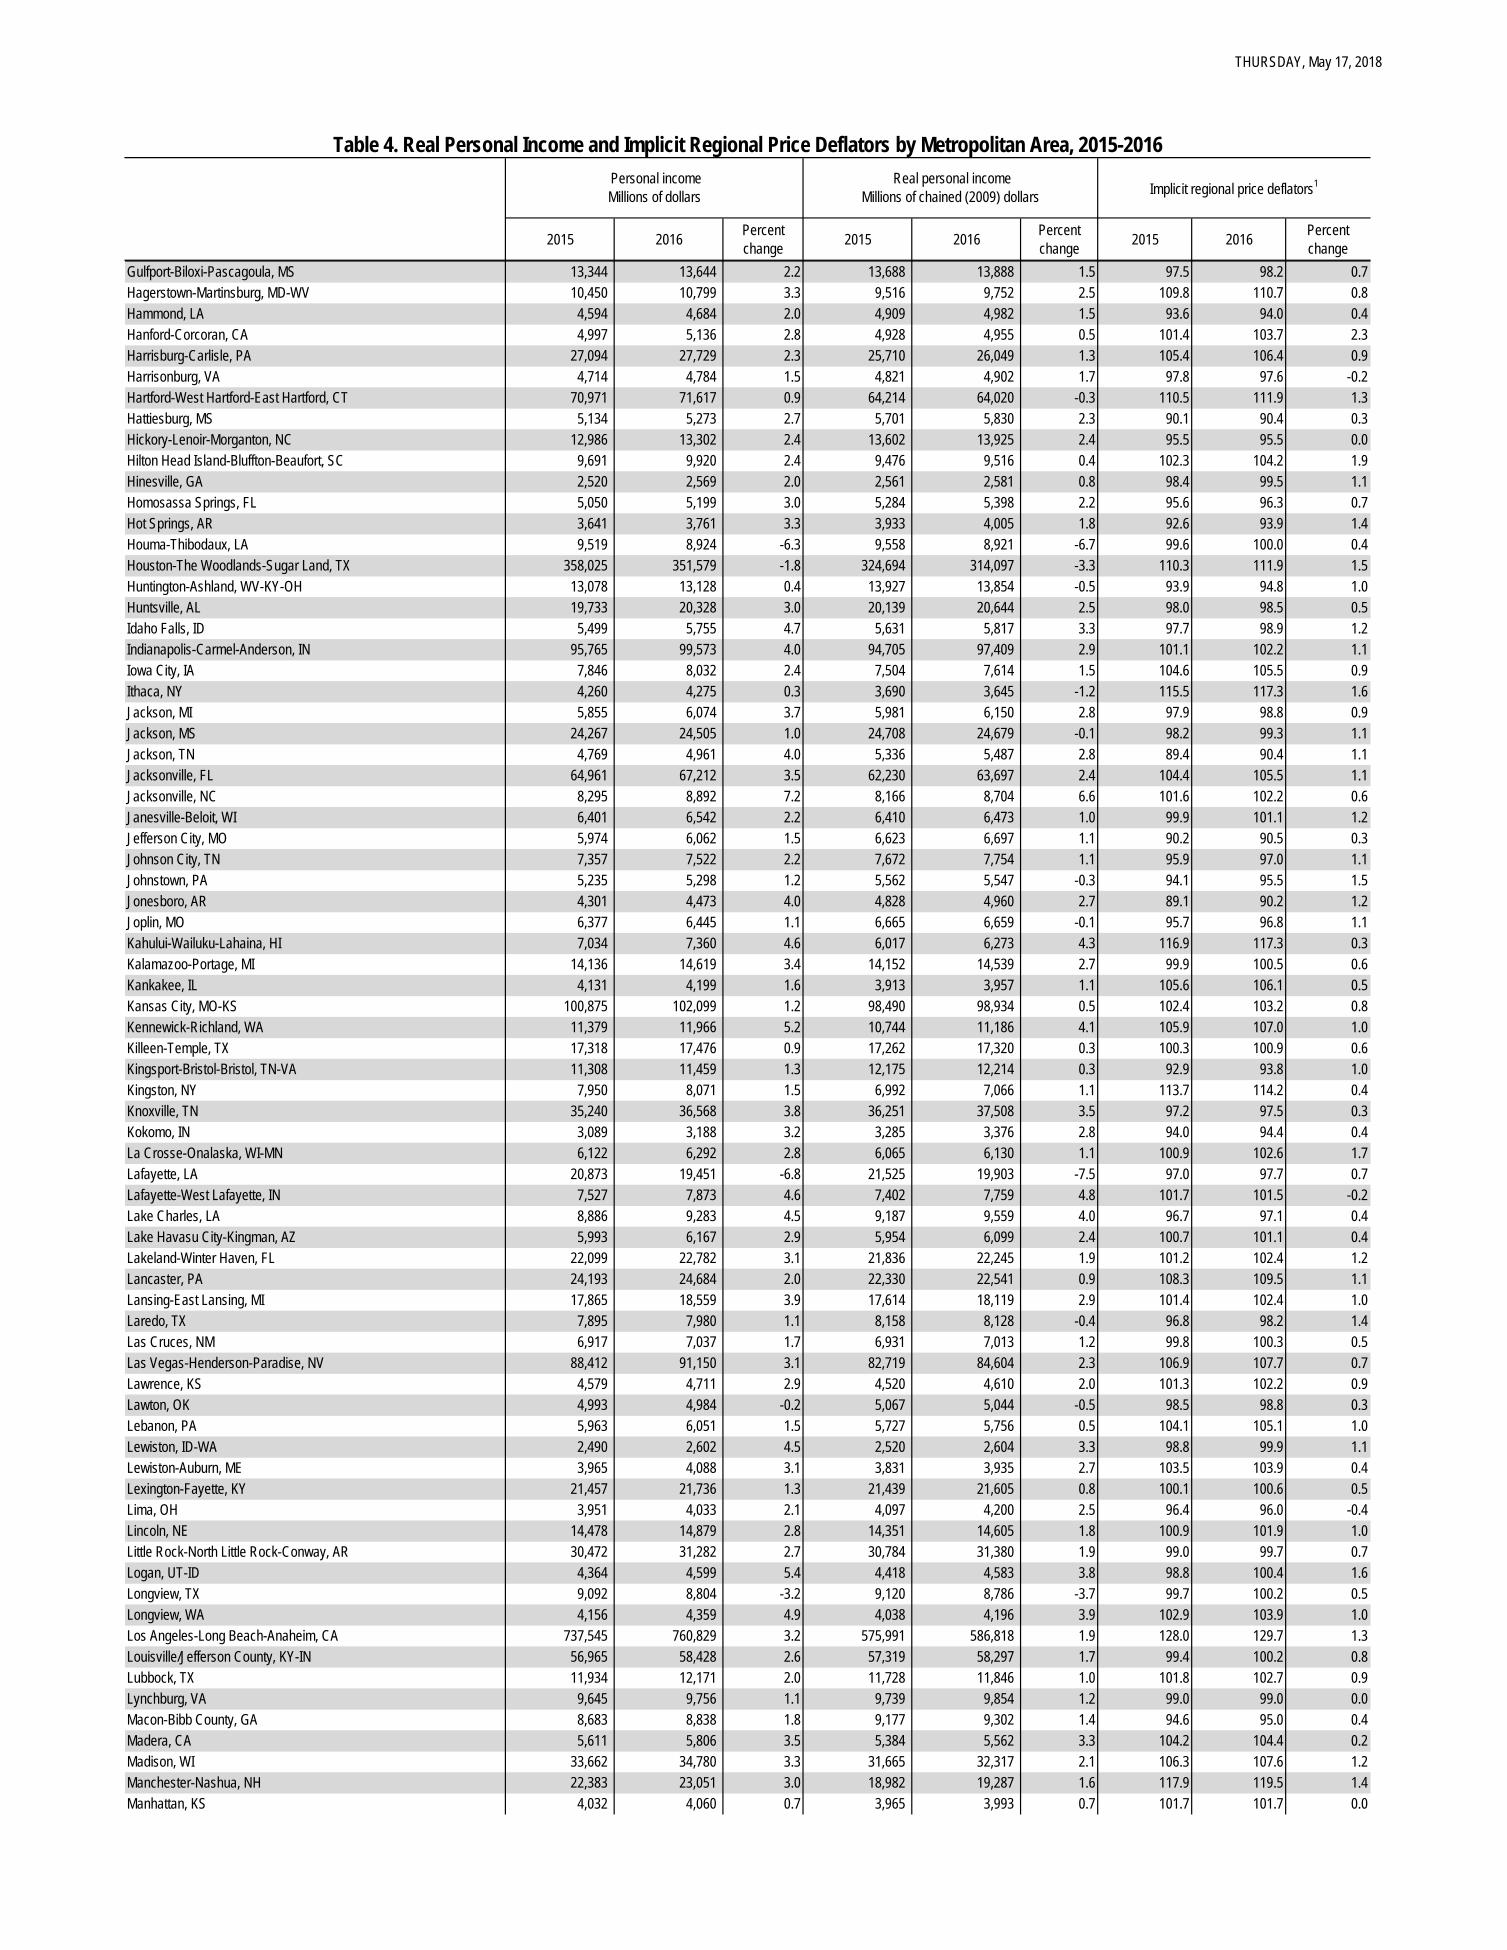
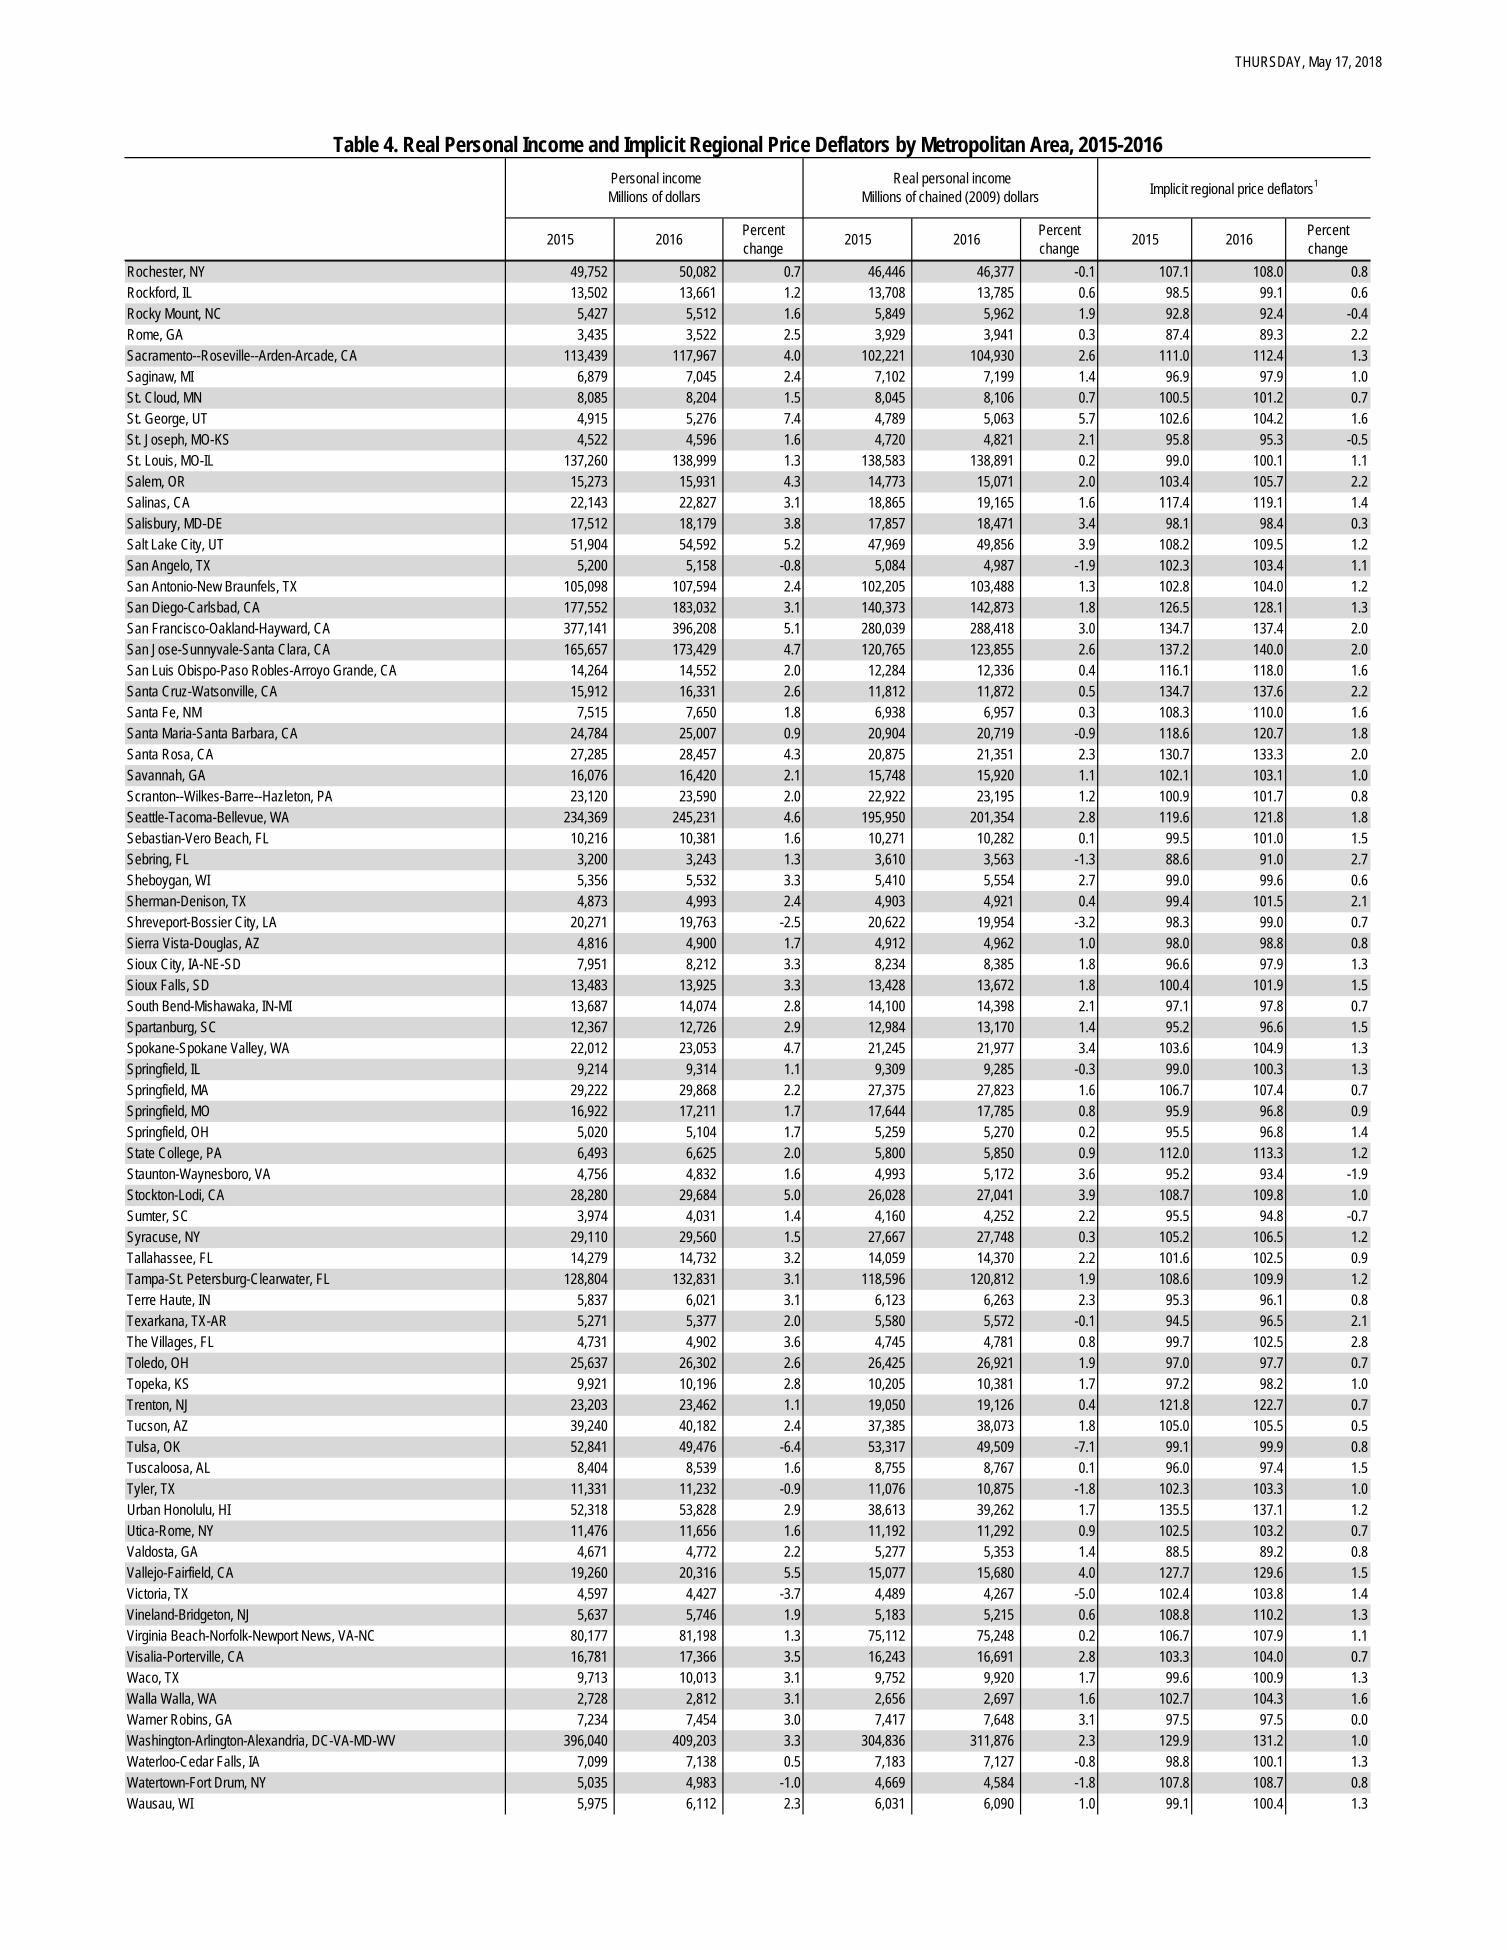
Real Personal Income for States and Metropolitan Areas, 2016 Real state personal income grew on average 1.1 percent in 2016, after increasing 4.7 percent in 2015, according to estimates released today by the Bureau of Economic Analysis. Real state personal income is a state’s current-dollar personal income adjusted by the state’s regional price parity and the national personal consumption expenditures price index. The percent change in real state personal income ranged from 3.3 percent in Utah and Georgia to -3.6 percent in Wyoming (table 1). In the District of Columbia, real personal income grew 4.5 percent. Across metropolitan areas, the percent change ranged from 6.6 percent in Jacksonville, NC to -8.1 percent in Midland, TX and Odessa, TX (table 4).

- 2 -
Real Personal Income in 2016
• States with the fastest growth in real personal income were Utah (3.3 percent), Georgia (3.3 percent), and Washington (3.0 percent). The District of Columbia’s real personal income grew 4.5 percent.
• Eight states had declining real personal income. The largest percent declines were in Wyoming (-3.6 percent), Oklahoma (-2.7 percent), and Louisiana (-1.9 percent).
• Large metropolitan areas — those with population greater than two million — with the fastest growth in real personal income were Atlanta-Sandy Springs-Roswell, GA (3.4 percent), Orlando-Kissimmee-Sanford, FL (3.3 percent), and Charlotte-Concord-Gastonia, NC-SC (3.2 percent).
• The three large metropolitan areas with declining real personal income were Houston-The Woodlands-Sugar Land, TX (-3.3 percent), Denver-Aurora-Lakewood, CO (-0.7 percent), and Pittsburgh, PA (-0.4 percent).
Regional Price Parities in 2016
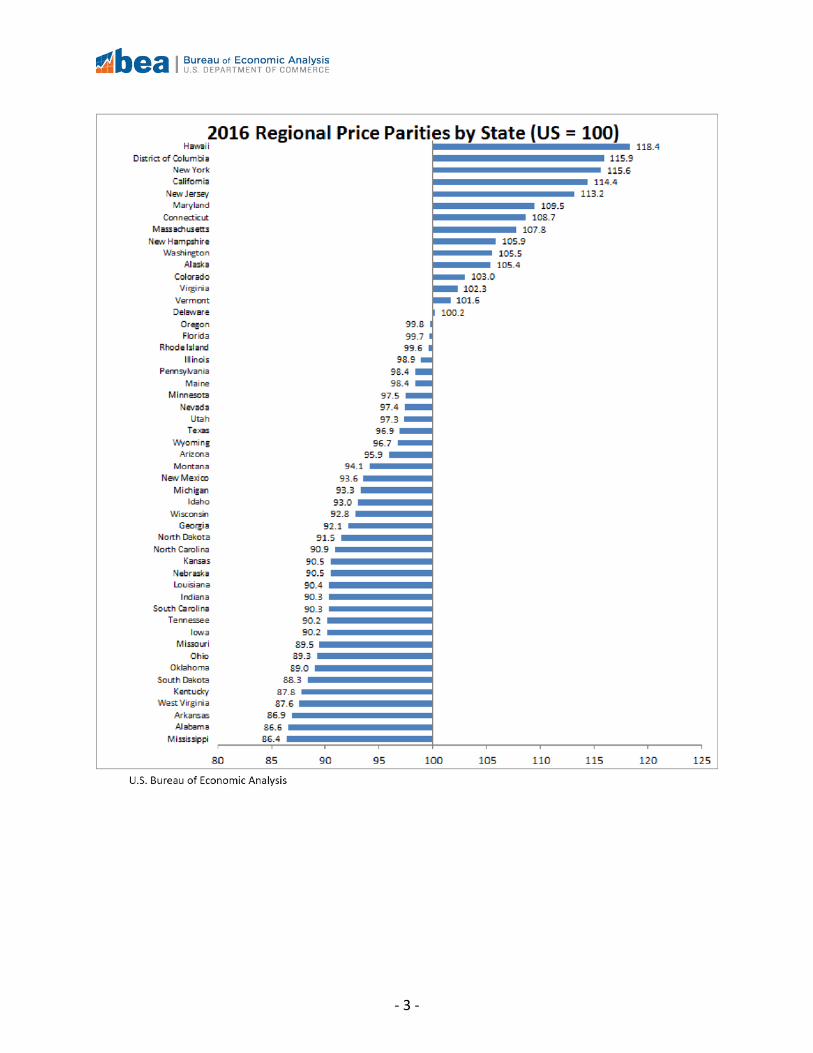
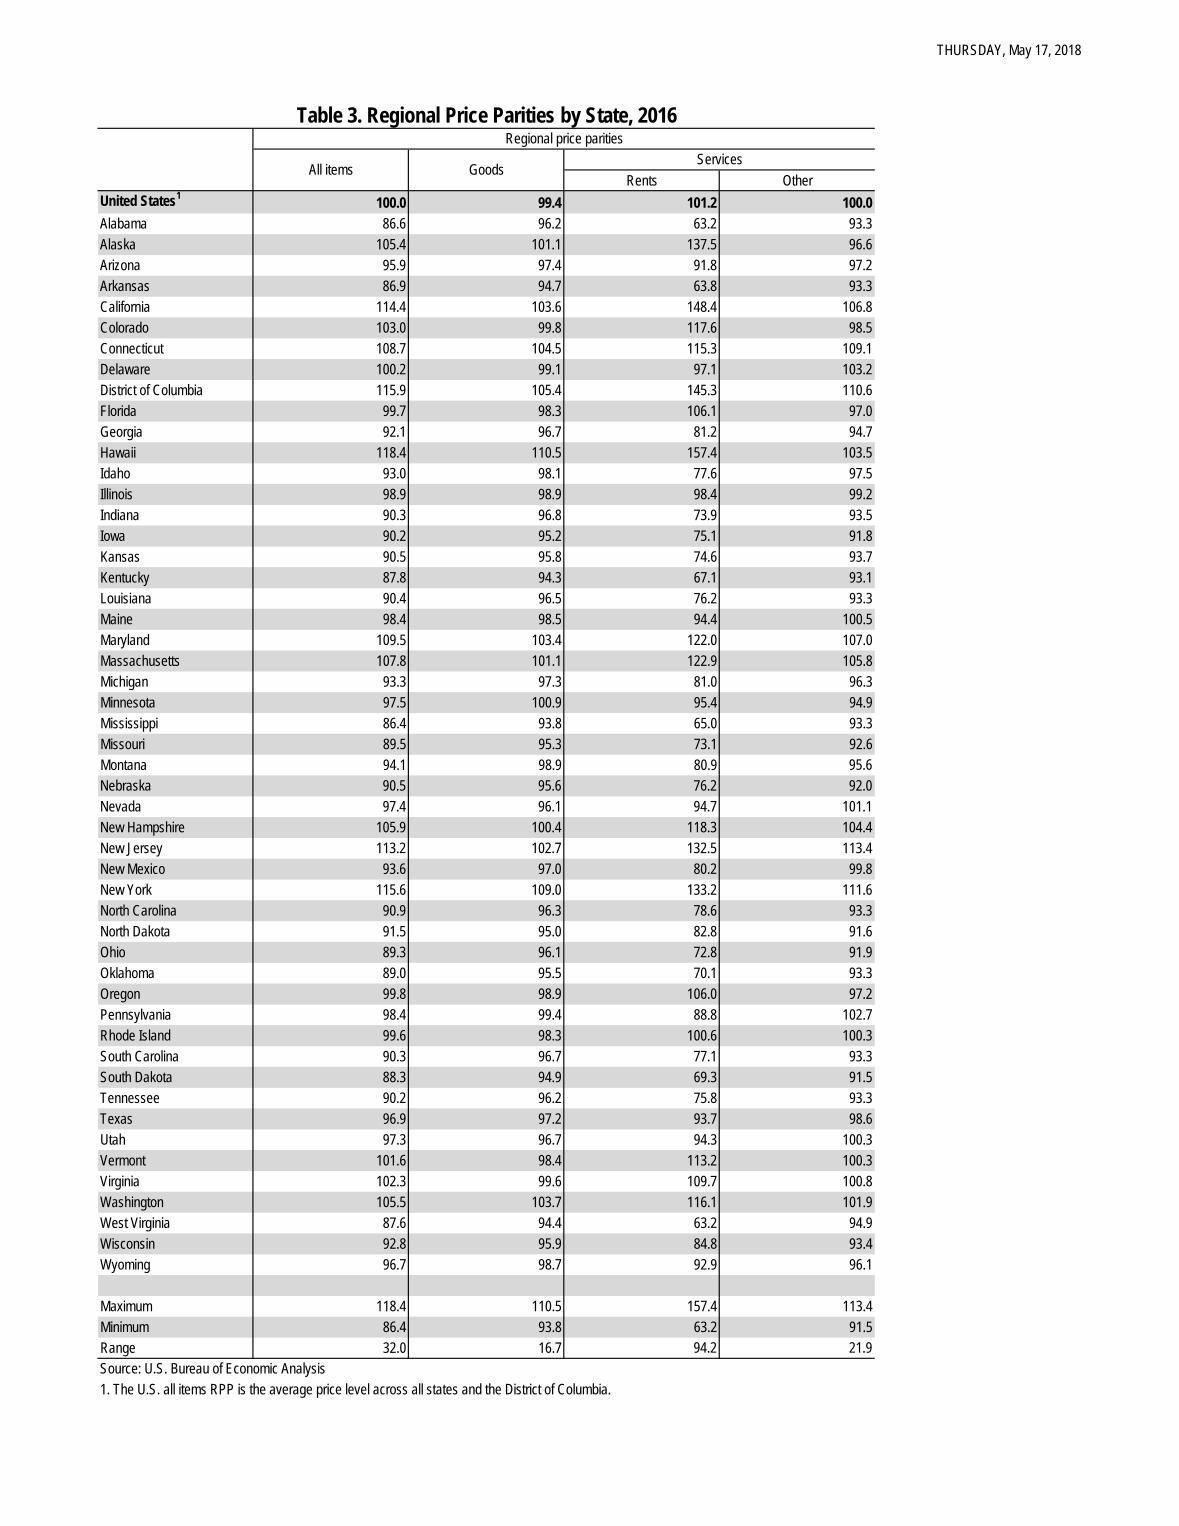
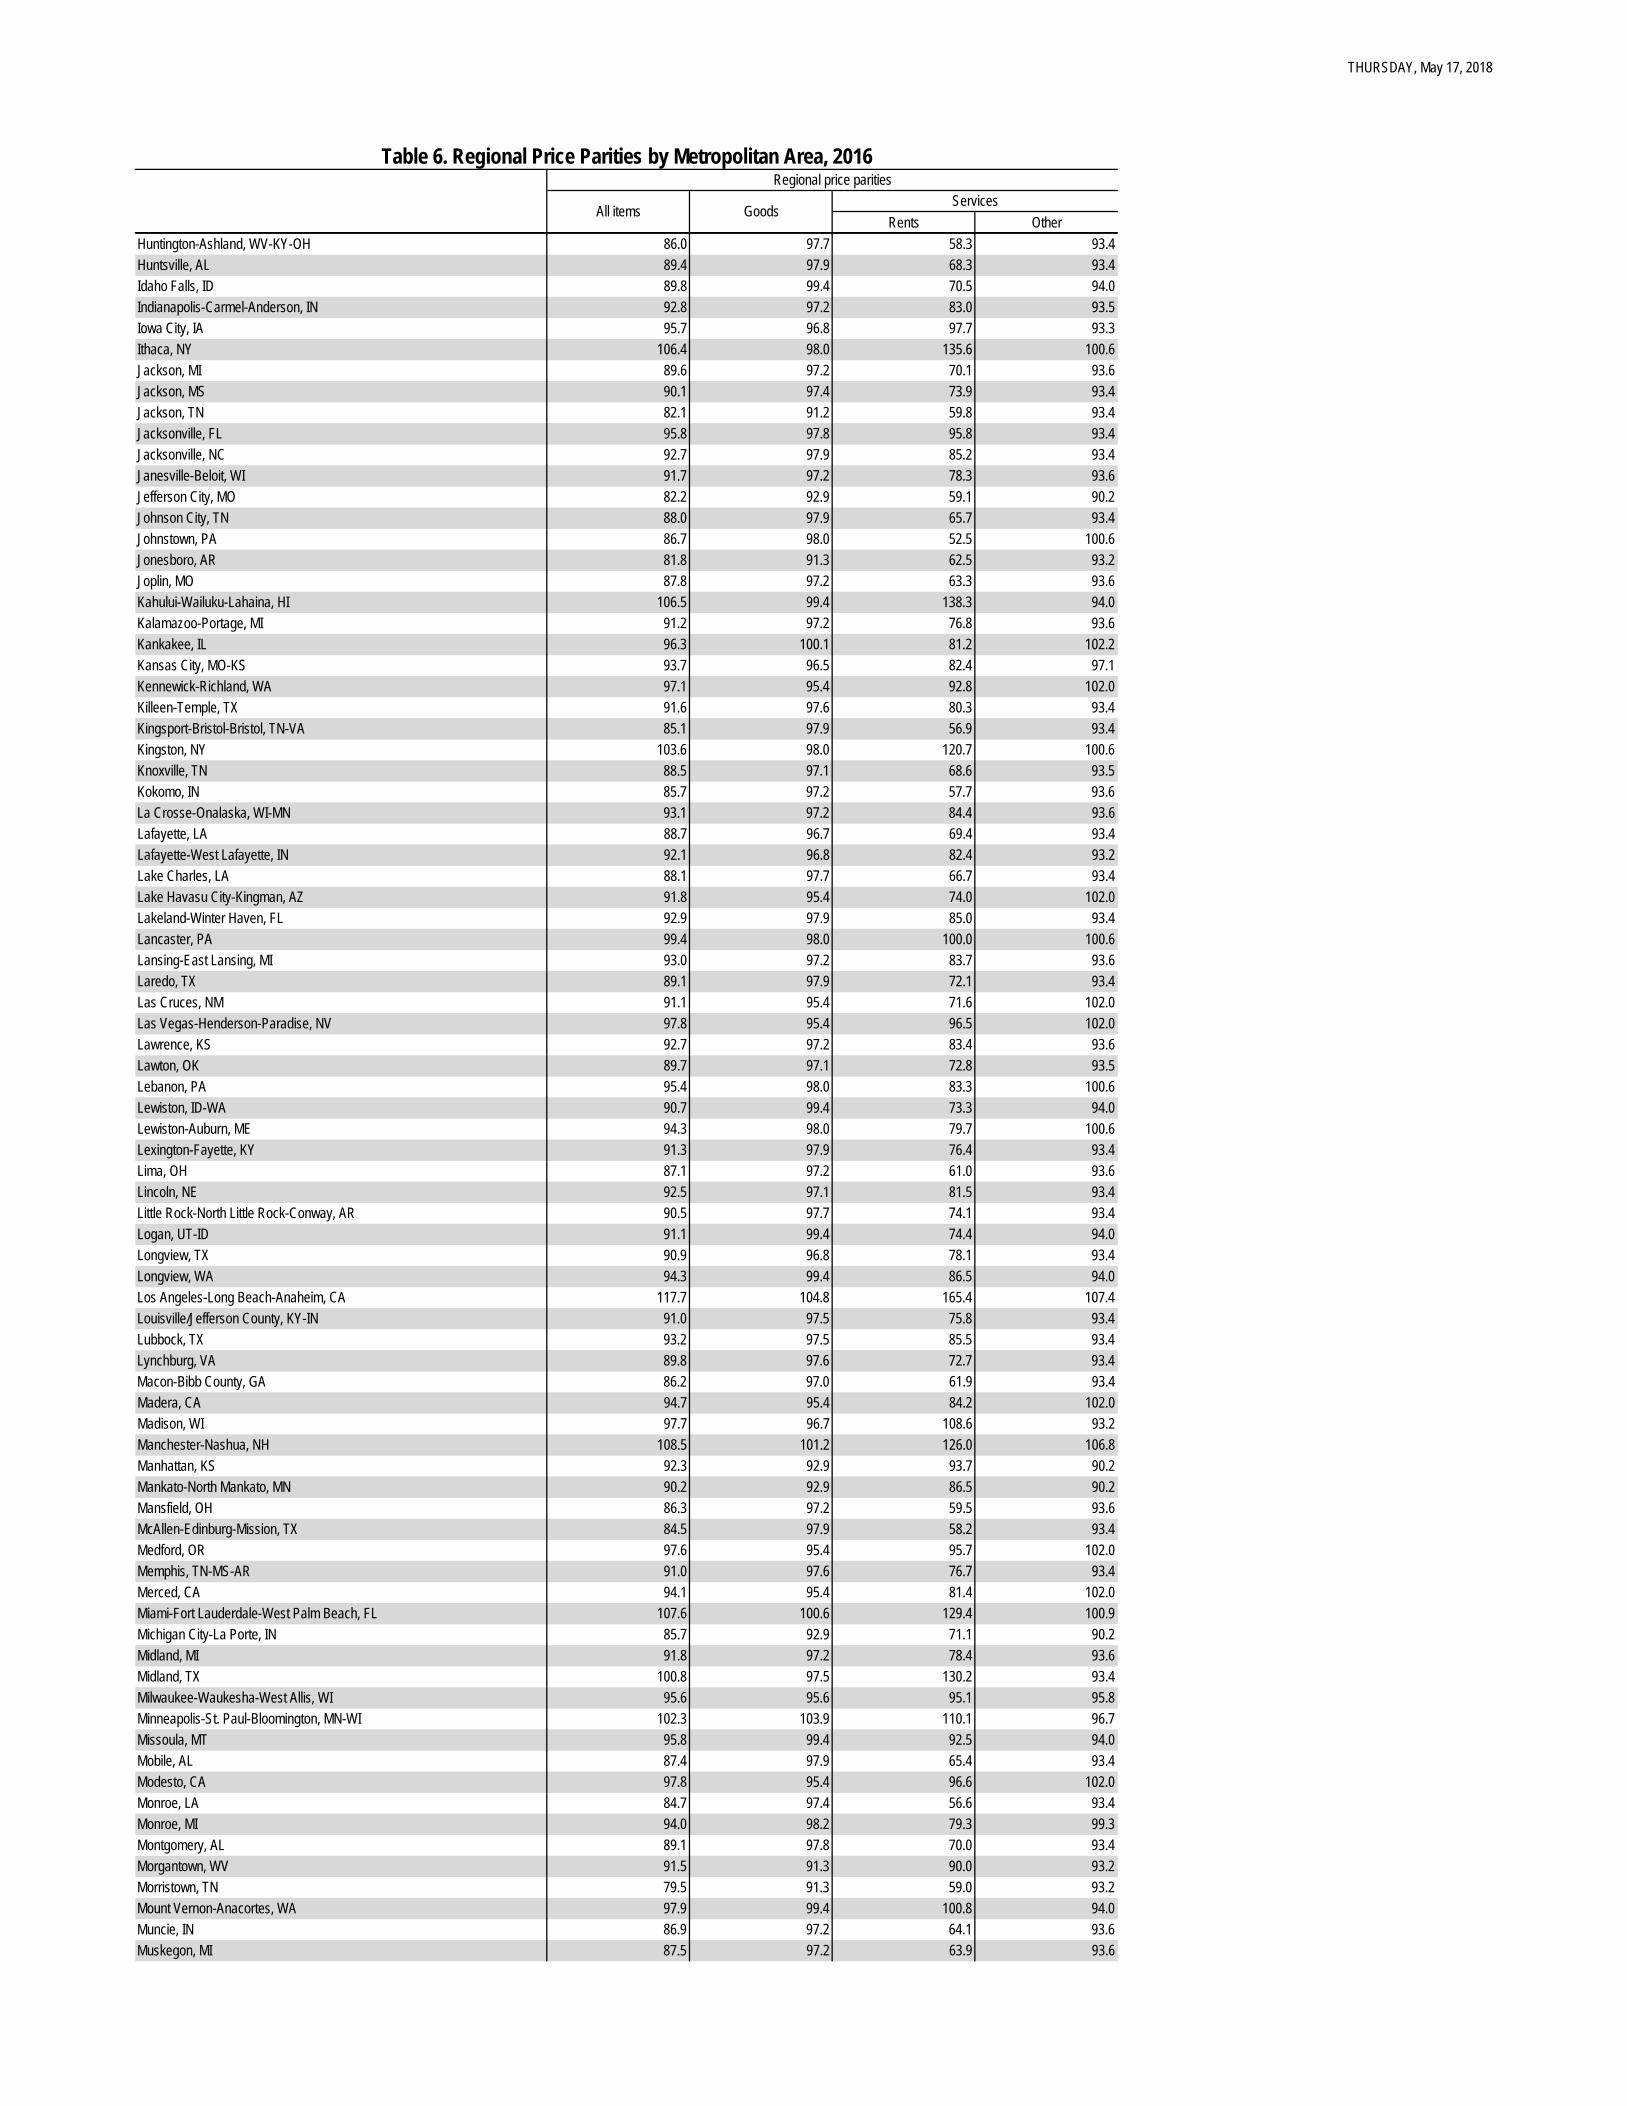
Regional Price Parities (RPPs) measure the differences in price levels across states and metropolitan areas for a given year and are expressed as a percentage of the overall national price level. All items RPPs cover all consumption goods and services, including rents. Areas with high/low RPPs typically correspond to areas with high/low price levels for rents.
• States with the highest RPPs were Hawaii (118.4), New York (115.6), and California (114.4) (table 3). The District of Columbia’s RPP was 115.9.
• States with the lowest RPPs were Mississippi (86.4), Alabama (86.6), and Arkansas (86.9).
• Across states, Hawaii had the highest rents RPP (157.4) and Alabama and West Virginia had the lowest (63.2).
• Large metropolitan areas with the highest RPPs were San Francisco-Oakland-Hayward, CA
(124.7), New York-Newark-Jersey City, NY-NJ-PA (122.0), and Washington-Arlington-Alexandria, DC-VA-MD-WV, (119.1) (table 6).
• Large metropolitan areas with the lowest RPPs were Cincinnati, OH-KY-IN (89.6), Cleveland-Elyria, OH (90.2), and St. Louis, MO-IL (90.8).
• Across large metropolitan areas, San Francisco-Oakland-Hayward, CA had the highest rents RPP (190.9) and Cleveland-Elyria, OH had the lowest (77.9).
• Across all metropolitan areas, San Jose-Sunnyvale-Santa Clara, CA had the highest rents RPP (213.3) and Gadsden, AL had the lowest (51.5).
Estimates of real personal income and regional price parities for state metropolitan and nonmetropolitan portions can be found at https://www.bea.gov/itable. Supplemental tables are available upon request.
- 3 -
- 4 -
Next release: May 2019 – Real Personal Income for States and Metropolitan Areas, 2017.
Updates to Real Personal Income Today, BEA also released revised real personal income statistics for states and metropolitan areas for 2014-2015 and real per capita personal income statistics for states for 2010-2013. These revisions were made to incorporate newly available source data. BEA will update real personal income for states on September 25, 2018 with the release of state personal income. Real personal income for metropolitan areas will be updated on November 15, 2018 with the release of local area personal income.

- 5 -
Technical Notes on Regional Price Parities and Implicit Regional Price Deflators
Price indexes commonly measure price changes over time. The BEA’s personal consumption expenditures (PCE) price index and the Bureau of Labor Statistics’ consumer price index (CPI) are two examples. Spatial price indexes measure price level differences across regions for one time period. An example of these type of indexes are purchasing power parities (PPPs), which measure differences in price levels across countries for a given period, and can be used to convert estimates of per capita GDP into comparable levels in a common currency. The regional price parities (RPPs) that BEA has developed compare regions within the United States, but without the need for currency conversion. An implicit regional price deflator (IRPD) can be derived by combining the RPPs and the U.S. PCE price index. Regional Price Parities. The RPPs are calculated using price quotes for a wide array of items from the CPI, which are aggregated into broader expenditure categories (such as food, transportation or education)1. Data on rents are obtained separately from the Census Bureau’s American Community Survey (ACS). The expenditure weights for each category are constructed using CPI expenditure weights, BEA’s personal consumption expenditures, and ACS rents expenditures2. The broader categories and the data on rents are combined with the expenditure weights using a multilateral aggregation method that expresses a region’s price level relative to the U.S3. For example, if the RPP for area A is 120 and for area B is 90, then on average, prices are 20 percent higher and 10 percent lower than the U.S. average for A and B, respectively. If the personal income for area A is $12,000 and for area B is $9,000, then RPP-adjusted incomes are $10,000 (or $12,000/1.20) and $10,000 (or $9,000/0.90), respectively. In other words, the purchasing power of the two incomes is equivalent when adjusted by their respective RPPs. Implicit Regional Price Deflator. The IRPD is a regional price index derived as the product of two terms: the regional price parity and the U.S. PCE price index. The implicit regional price deflator will equal current dollar personal income divided by real personal income in chained dollars. The growth rate or year-to-year change in the IRPDs is a measure of regional inflation4. Detailed information on the methodology used to estimate the RPPs may be found on the regional methodology page of the BEA website: www.bea.gov/regional/methods.cfm.
1 The BEA Regional Price Parity statistics are based in part on restricted access Consumer Price Index data from the Bureau of Labor Statistics (BLS). The BEA statistics presented herein are products of BEA and not BLS. 2 To estimate RPPs, CPI price quotes are quality adjusted and pooled over 5 years. The ACS rents are also quality adjusted and are either annual for states or pooled over 3 years for metropolitan areas. The expenditure weights are specific for each year. 3 The multilateral system that is used is the Geary additive method. Any region or combination of regions may be used as the base or reference region without loss of consistency. 4 The growth rate of the implicit regional price deflators will not necessarily equal the region or metro area price deflators published by the BLS. This is because the CPI deflators are calculated directly while the IRPDs are indirect estimates, and because of differences in the source data and methodology.
- 6 -
Additional Information Resources
• Stay informed about BEA developments by reading the BEA blog, signing up for BEA’s email subscription service, or following BEA on Twitter @BEA_News.
• Historical time series for these estimates can be accessed in BEA’s Interactive Data Application.
• Access BEA data by registering for BEA’s Data Application Programming Interface (API).
• For more on BEA’s statistics, see our monthly online journal, the Survey of Current Business.
• BEA’s news release schedule. Definitions Personal income is the income received by, or on behalf of, all persons from all sources: from participation as laborers in production, from owning a home or business, from the ownership of financial assets, and from government and business in the form of transfers. It includes income from domestic sources as well as the rest of world. It does not include realized or unrealized capital gains or losses. Per capita personal income is calculated as the total personal income of the residents of a given area divided by the population of the area. In computing per capita personal income, BEA uses Census Bureau mid-year population estimates. Personal income is measured before the deduction of personal income taxes and other personal taxes and is reported in current dollars (no adjustment is made for price changes). Comparisons for different regions and time periods reflect changes in both the price and quantity components of regional personal income. The estimate of personal income for the United States is the sum of the state estimates and the estimate for the District of Columbia; it differs slightly from the estimate of personal income in the national income and product accounts (NIPAs) because of differences in coverage, in the methodologies used to prepare the estimates, and in the timing of the availability of source data.
5 The CPI represents about 93 percent of the total U.S. population, including almost all residents of urban or metropolitan areas. In the Northeast region, rural area prices (exclusive of rents) are assumed to be the same as those in the small metropolitan areas of the CPI; in the Midwest, South, and West regions, they are assumed to be the same as those in the nonmetropolitan urban areas of the CPI. 6 RPP should first be divided by 100.
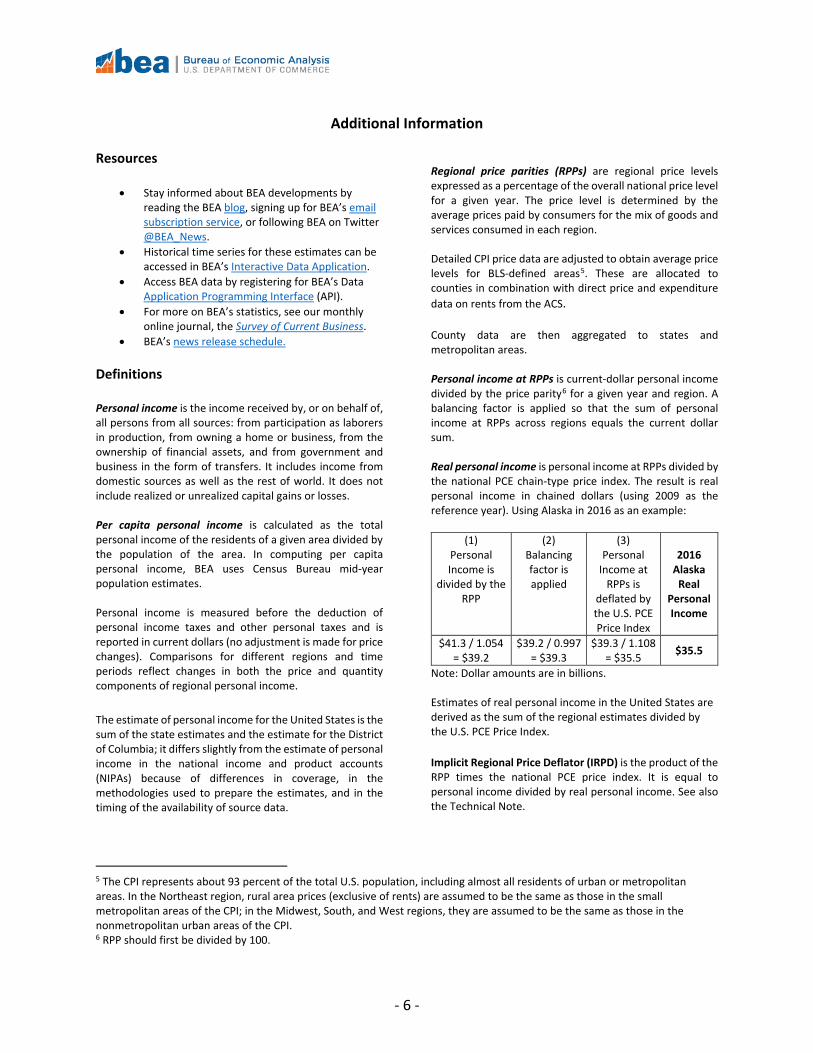
Regional price parities (RPPs) are regional price levels expressed as a percentage of the overall national price level for a given year. The price level is determined by the average prices paid by consumers for the mix of goods and services consumed in each region. Detailed CPI price data are adjusted to obtain average price levels for BLS-defined areas5. These are allocated to counties in combination with direct price and expenditure data on rents from the ACS. County data are then aggregated to states and metropolitan areas. Personal income at RPPs is current-dollar personal income divided by the price parity6 for a given year and region. A balancing factor is applied so that the sum of personal income at RPPs across regions equals the current dollar sum. Real personal income is personal income at RPPs divided by the national PCE chain-type price index. The result is real personal income in chained dollars (using 2009 as the reference year). Using Alaska in 2016 as an example:
(1) Personal Income is
divided by the RPP
(2) Balancing factor is applied
(3) Personal
Income at RPPs is
deflated by the U.S. PCE Price Index
2016
Alaska Real
Personal Income
$41.3 / 1.054 = $39.2
$39.2 / 0.997 = $39.3
$39.3 / 1.108 = $35.5 $35.5
Note: Dollar amounts are in billions. Estimates of real personal income in the United States are derived as the sum of the regional estimates divided by the U.S. PCE Price Index. Implicit Regional Price Deflator (IRPD) is the product of the RPP times the national PCE price index. It is equal to personal income divided by real personal income. See also the Technical Note.

- 7 -
List of News Release Tables
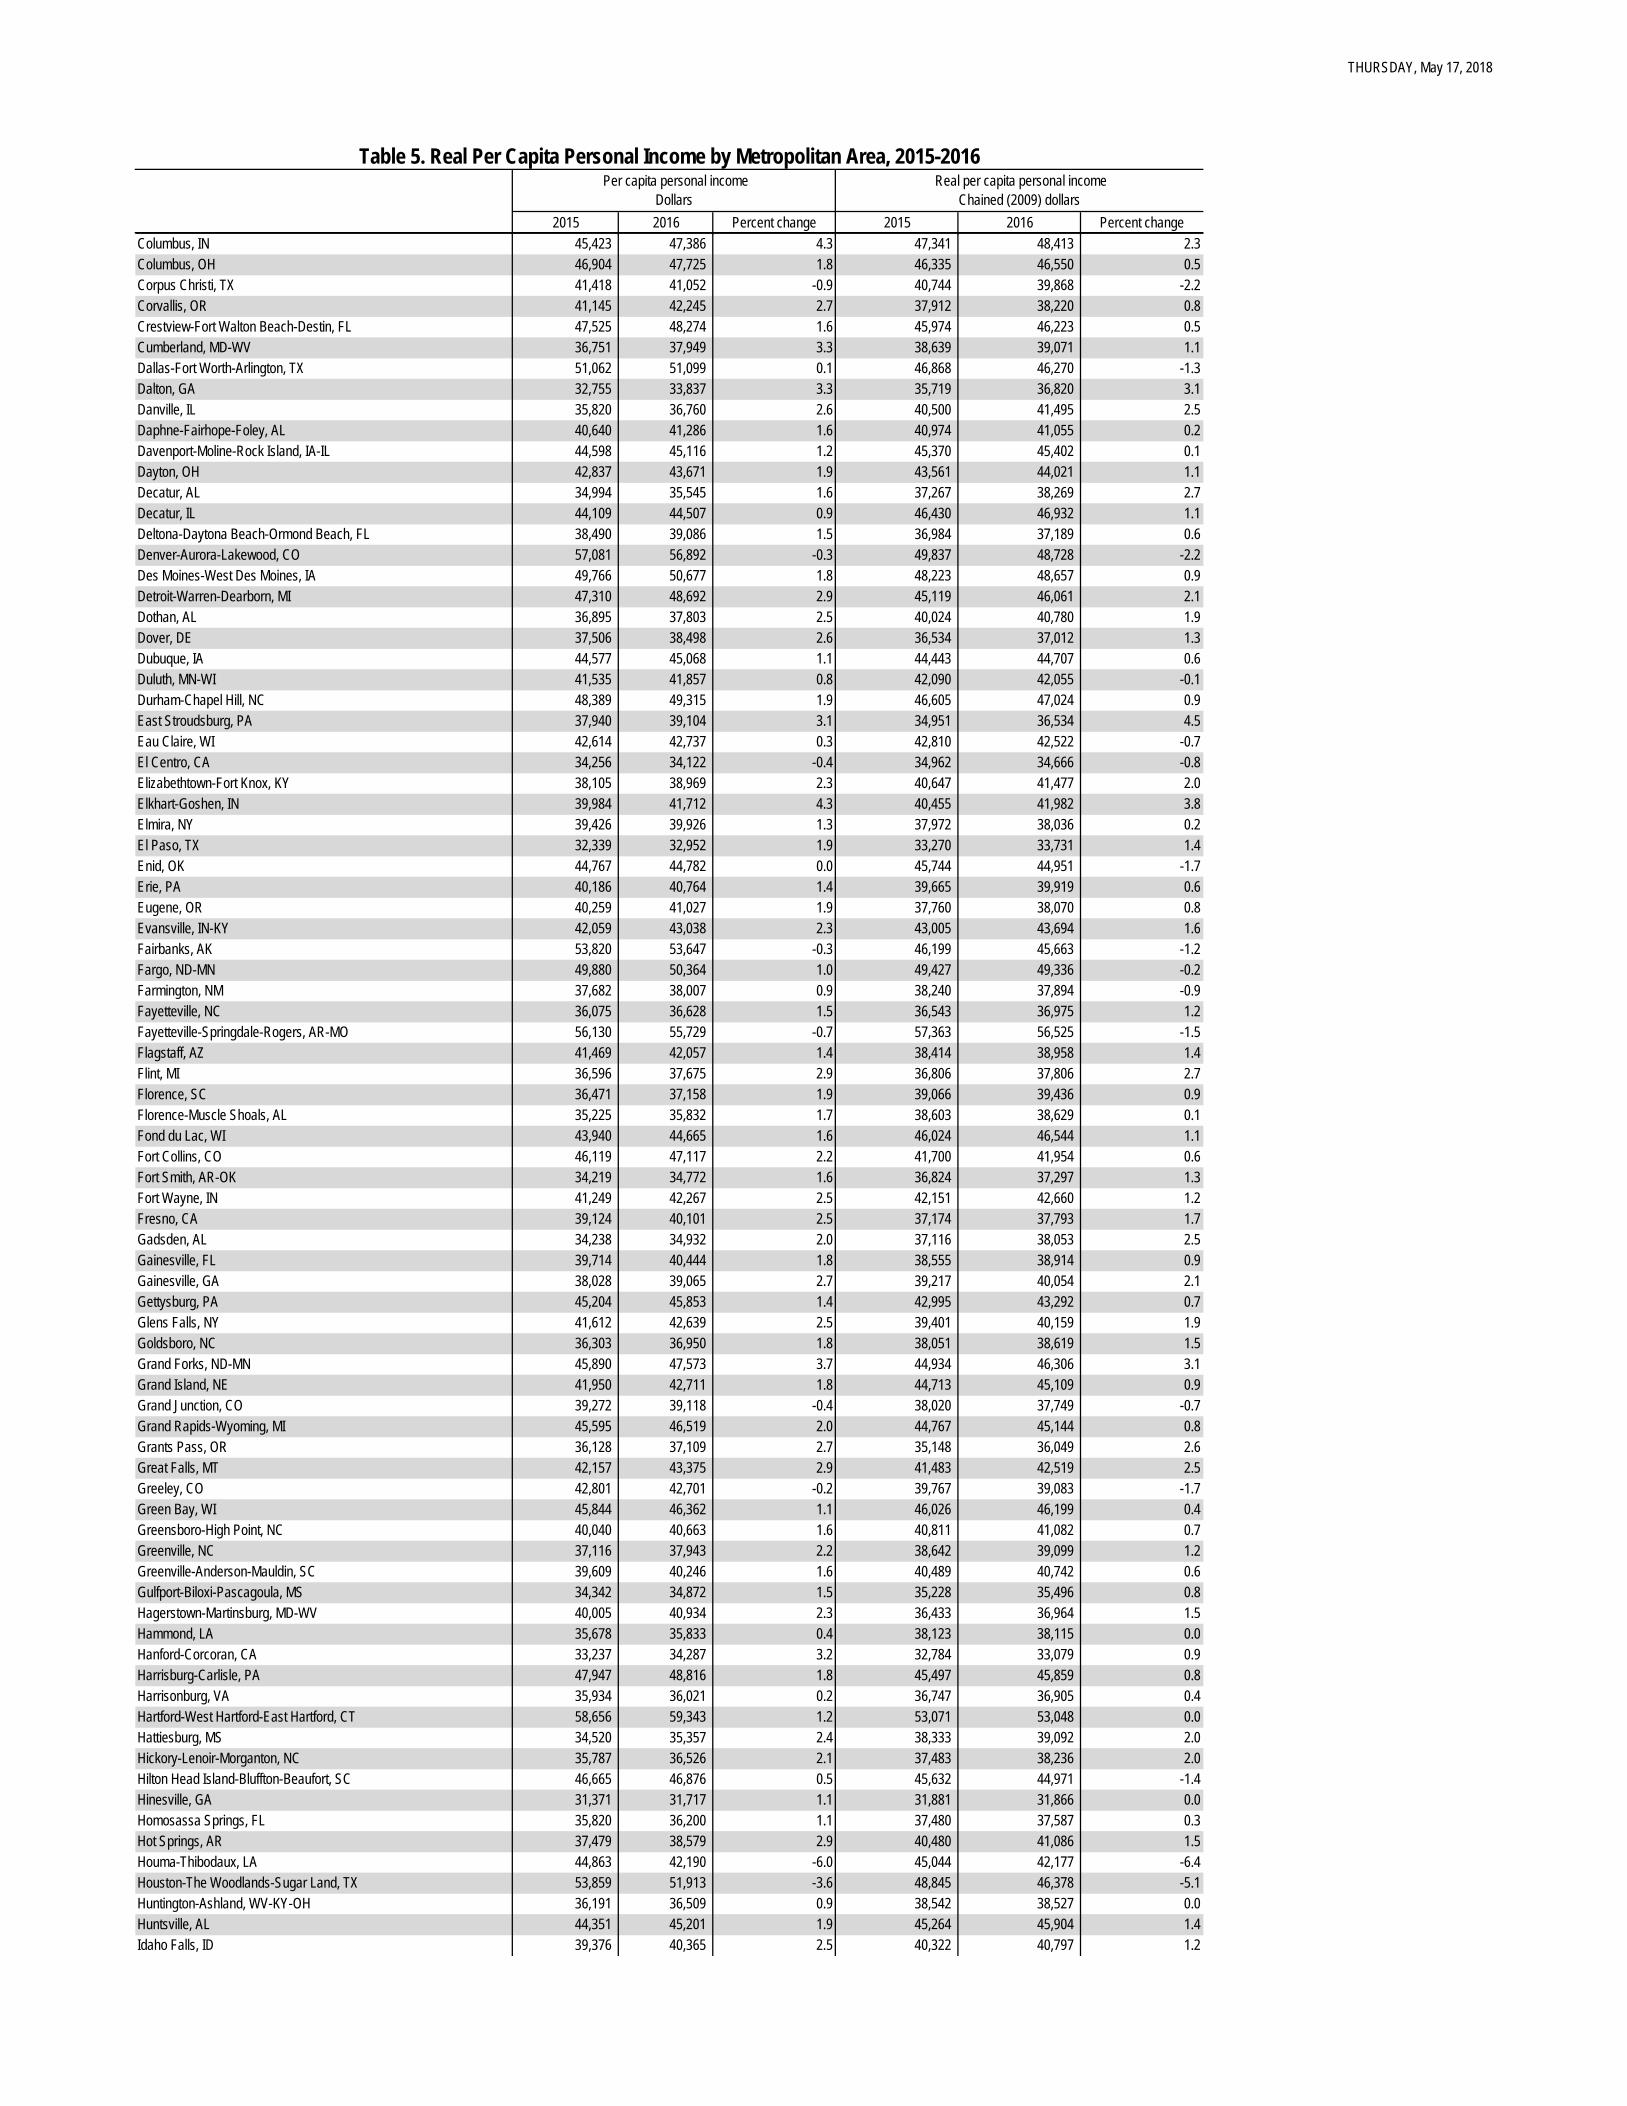
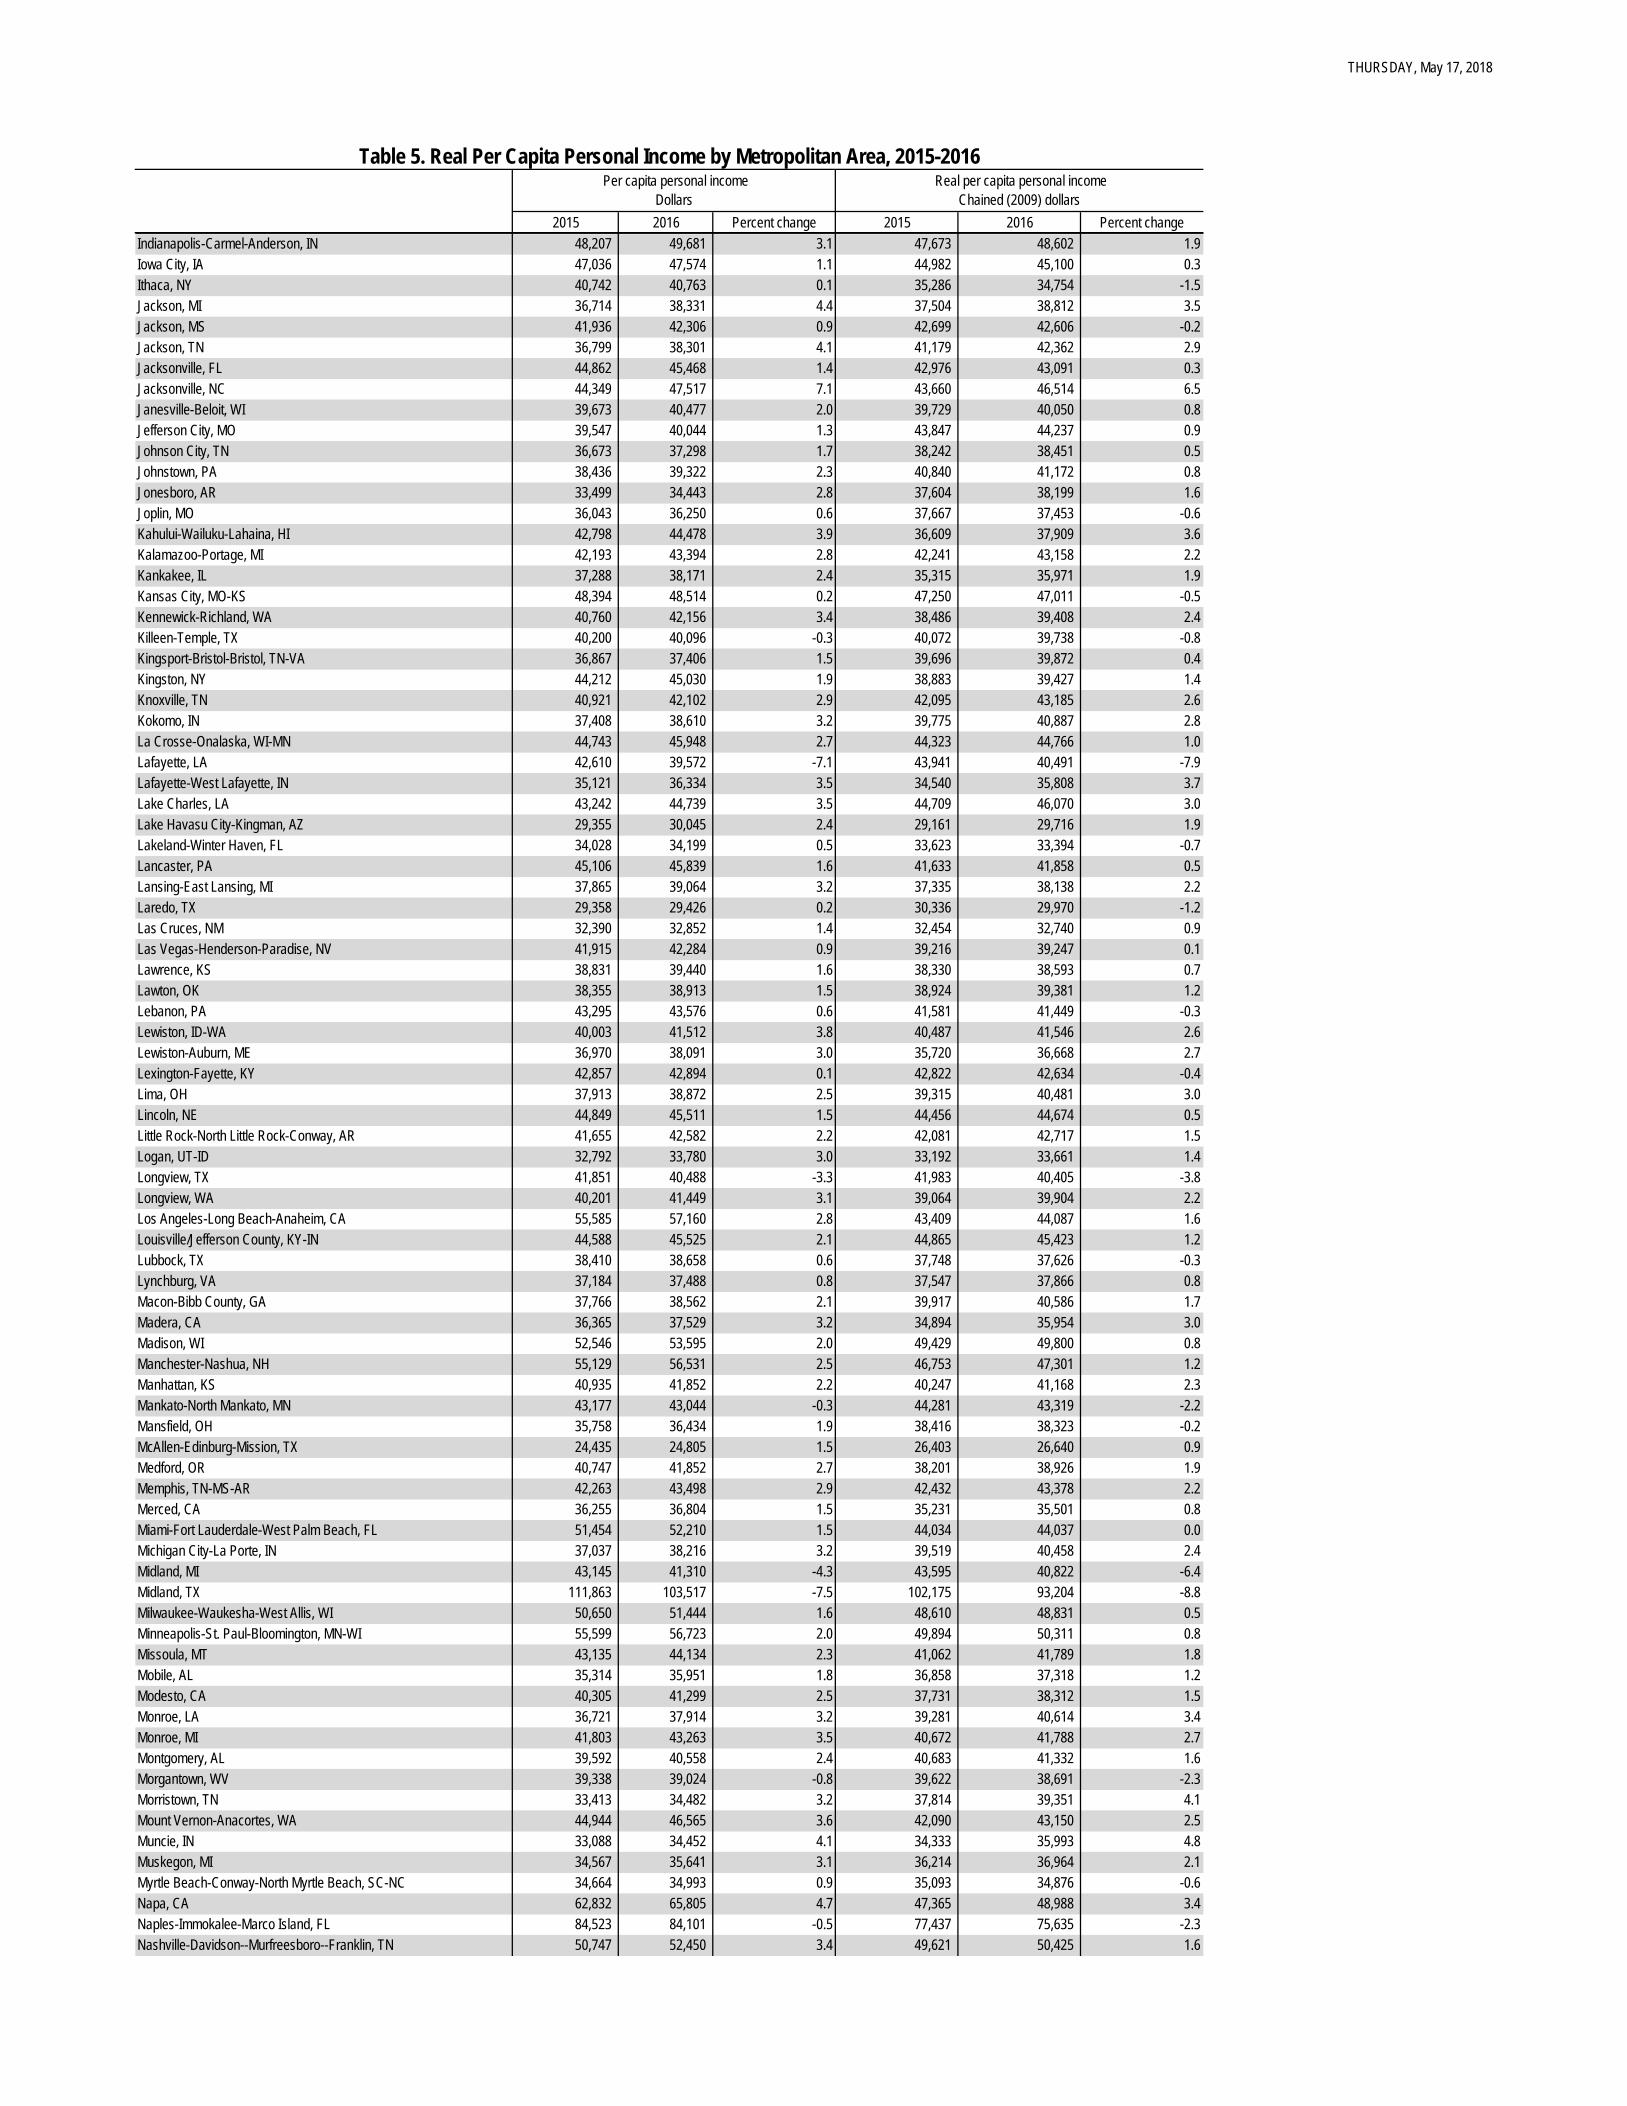
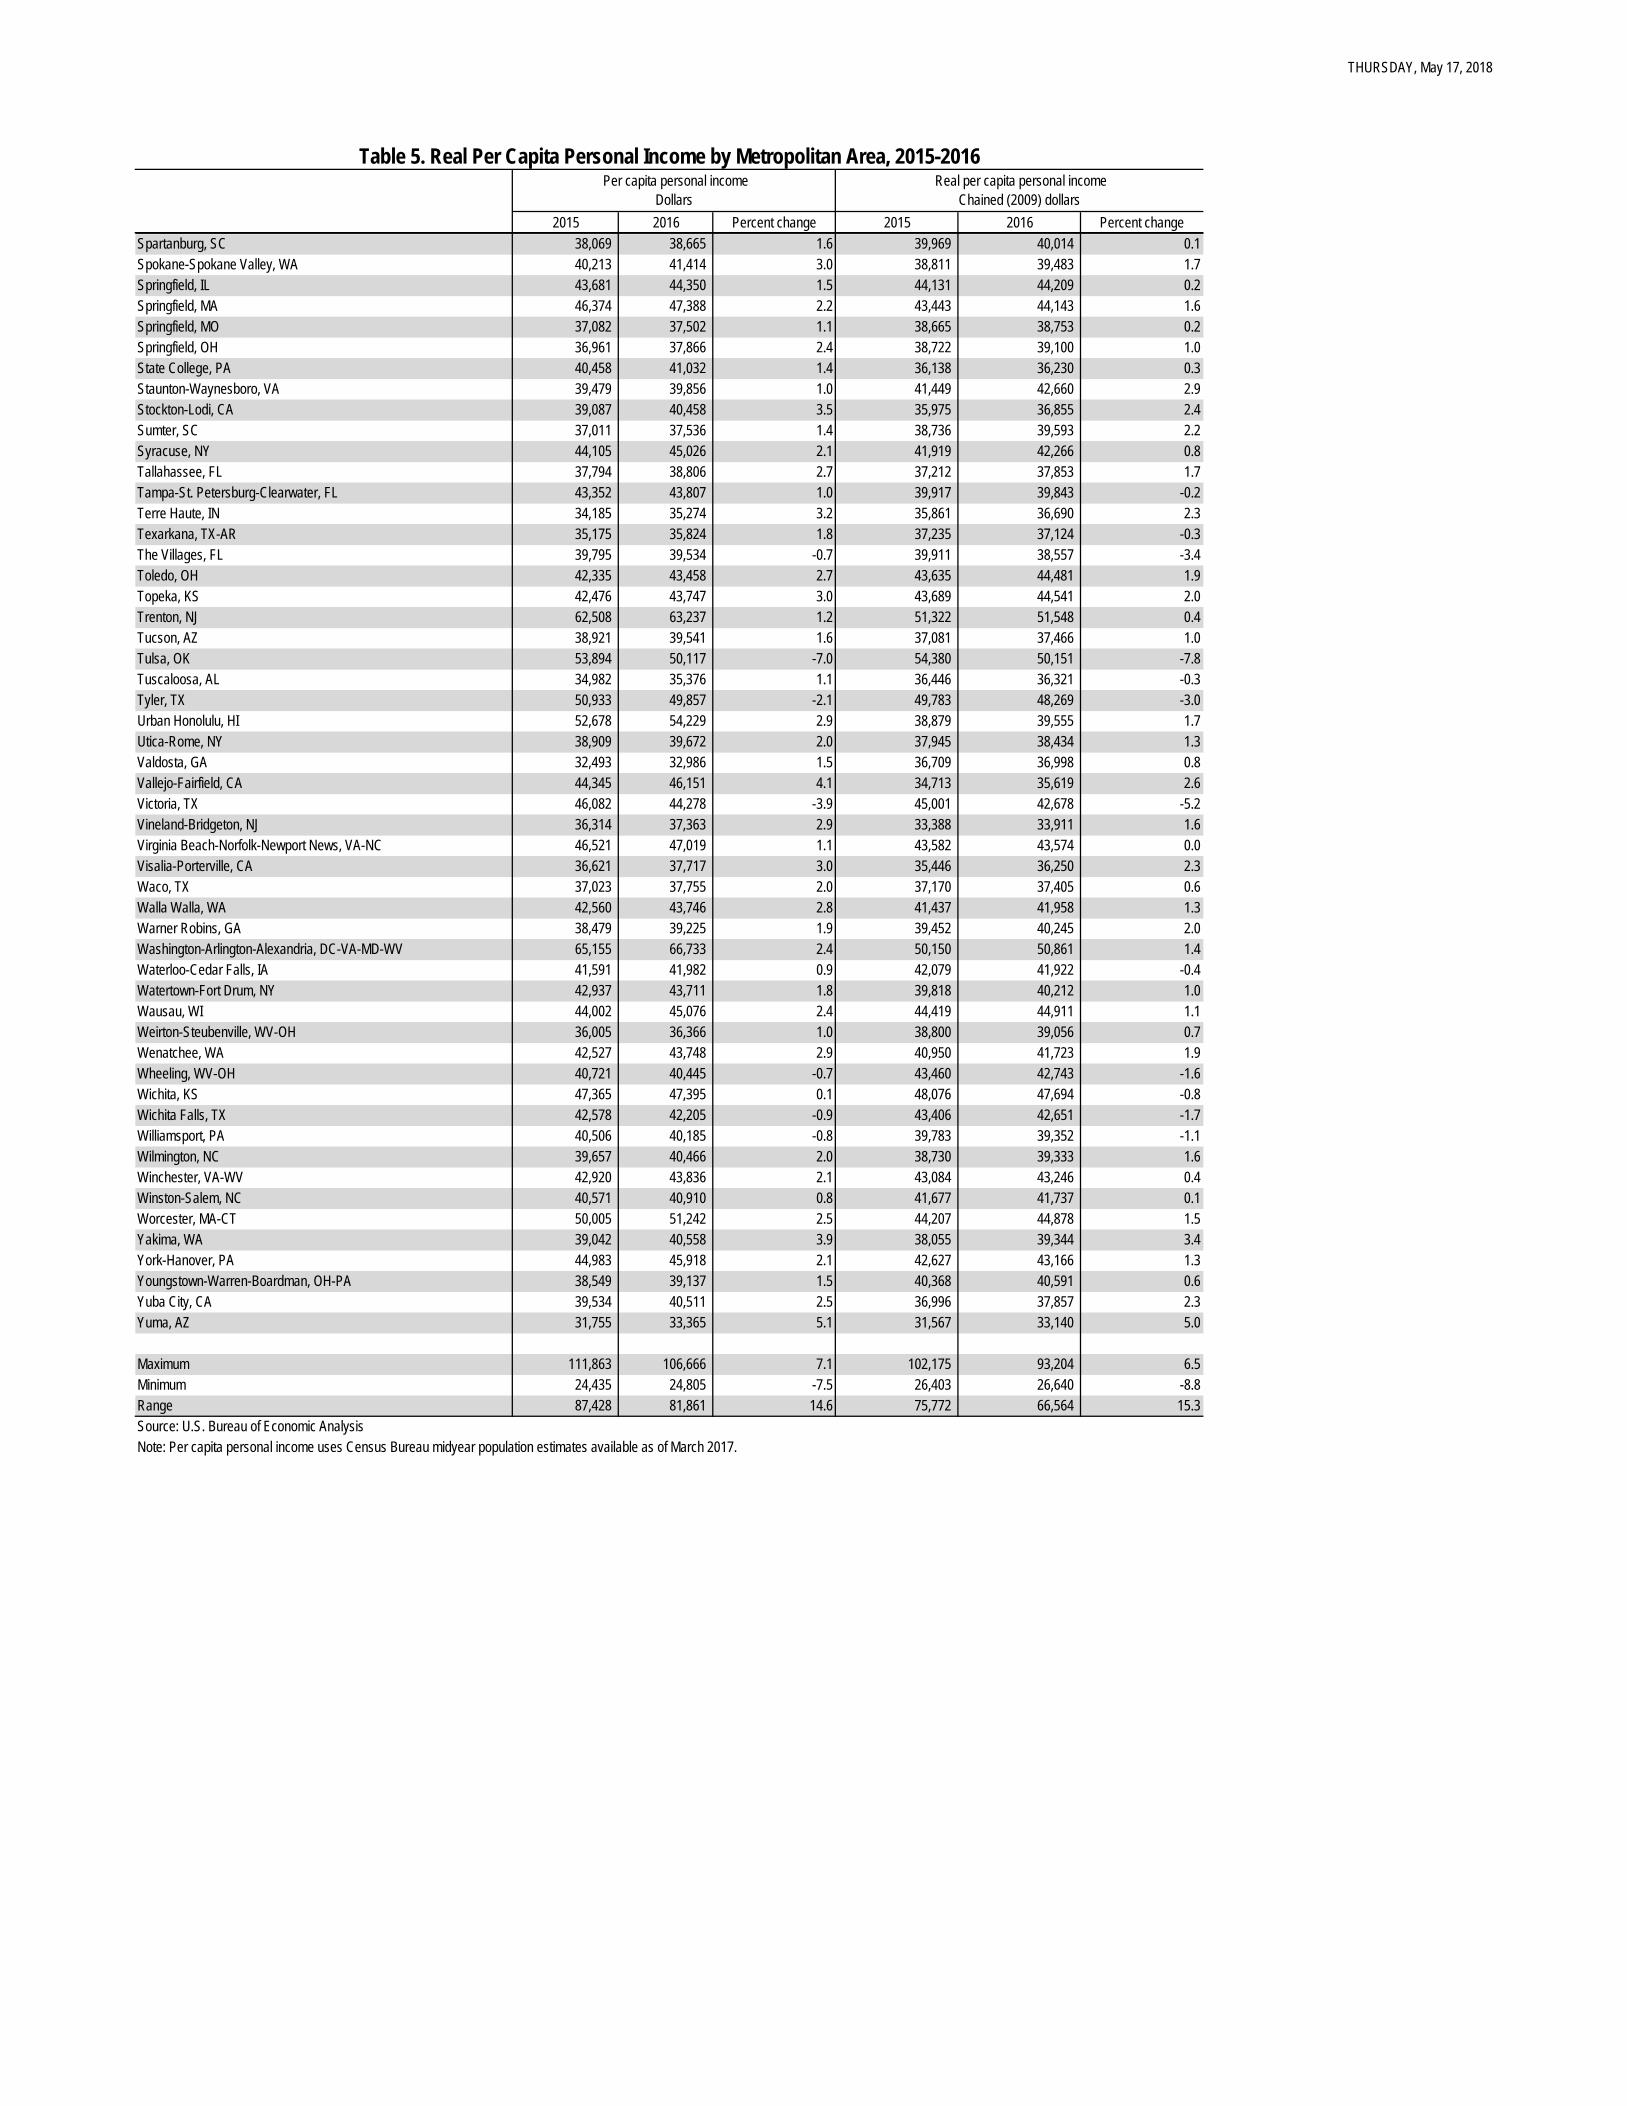
Table 1. Real Personal Income and Implicit Regional Price Deflators by State, 2015-2016 Table 2. Real Per Capita Personal Income by State, 2015-2016 Table 3. Regional Price Parities by State, 2016 Table 4. Real Personal Income and Implicit Regional Price Deflators by Metropolitan Area, 2015-2016 Table 5. Real Per Capita Personal Income by Metropolitan Area, 2015-2016 Table 6. Regional Price Parities by Metropolitan Area, 2016
THURSDAY, May 17, 2018
2015 2016 Percent change 2015 2016 Percent
change 2015 2016 Percent change
United States 15,547,661 15,912,777 2.3 14,201,215 14,363,078 1.1 109.5 110.8 1.2Alabama 185,485 189,162 2.0 195,763 197,772 1.0 94.7 95.6 1.0Alaska 41,701 41,283 -1.0 36,124 35,468 -1.8 115.4 116.4 0.9Arizona 270,258 280,120 3.6 257,734 264,358 2.6 104.9 106.0 1.0Arkansas 116,228 118,698 2.1 121,901 123,627 1.4 95.3 96.0 0.7California 2,133,664 2,212,691 3.7 1,718,306 1,751,126 1.9 124.2 126.4 1.8Colorado 282,665 288,103 1.9 252,022 253,310 0.5 112.2 113.7 1.3Connecticut 244,941 247,887 1.2 206,214 206,485 0.1 118.8 120.1 1.1Delaware 44,438 45,574 2.6 40,630 41,178 1.3 109.4 110.7 1.2District of Columbia 49,671 51,843 4.4 38,756 40,488 4.5 128.2 128.0 -0.2Florida 919,958 947,207 3.0 846,245 859,781 1.6 108.7 110.2 1.4Georgia 418,383 434,677 3.9 413,543 427,053 3.3 101.2 101.8 0.6Hawaii 69,638 71,946 3.3 53,605 55,024 2.6 129.9 130.8 0.7Idaho 64,209 66,433 3.5 62,918 64,643 2.7 102.1 102.8 0.7Illinois 652,685 663,338 1.6 601,894 607,156 0.9 108.4 109.3 0.8Indiana 276,730 285,864 3.3 279,421 286,456 2.5 99.0 99.8 0.8Iowa 142,826 144,196 1.0 144,611 144,740 0.1 98.8 99.6 0.8Kansas 136,598 137,305 0.5 137,975 137,307 -0.5 99.0 100.0 1.0Kentucky 170,267 172,714 1.4 176,019 178,160 1.2 96.7 96.9 0.2Louisiana 200,092 198,025 -1.0 202,333 198,399 -1.9 98.9 99.8 0.9Maine 56,929 58,655 3.0 52,808 53,968 2.2 107.8 108.7 0.8Maryland 337,212 349,267 3.6 281,300 288,804 2.7 119.9 120.9 0.8Massachusetts 426,360 437,551 2.6 363,676 367,529 1.1 117.2 119.1 1.6Michigan 427,199 439,361 2.8 419,065 426,450 1.8 101.9 103.0 1.1Minnesota 280,406 287,250 2.4 263,464 266,763 1.3 106.4 107.7 1.2Mississippi 103,901 106,053 2.1 110,477 111,124 0.6 94.0 95.4 1.5Missouri 257,515 261,548 1.6 263,098 264,632 0.6 97.9 98.8 0.9Montana 43,844 44,773 2.1 42,186 43,059 2.1 103.9 104.0 0.1Nebraska 93,868 95,411 1.6 94,777 95,463 0.7 99.0 99.9 0.9Nevada 124,341 128,090 3.0 116,652 119,069 2.1 106.6 107.6 0.9New Hampshire 72,549 74,687 2.9 62,929 63,863 1.5 115.3 116.9 1.4New Jersey 538,220 549,836 2.2 435,156 439,798 1.1 123.7 125.0 1.1New Mexico 78,997 80,065 1.4 76,856 77,463 0.8 102.8 103.4 0.6New York 1,155,938 1,176,080 1.7 917,259 920,720 0.4 126.0 127.7 1.3North Carolina 415,235 428,639 3.2 417,191 426,788 2.3 99.5 100.4 0.9North Dakota 42,003 41,405 -1.4 41,601 40,960 -1.5 101.0 101.1 0.1Ohio 508,380 517,918 1.9 520,242 525,058 0.9 97.7 98.6 0.9Oklahoma 171,788 167,503 -2.5 175,222 170,406 -2.7 98.0 98.3 0.3Oregon 178,432 185,840 4.2 165,130 168,613 2.1 108.1 110.2 1.9Pennsylvania 637,184 648,694 1.8 594,250 596,803 0.4 107.2 108.7 1.4Rhode Island 52,526 53,272 1.4 48,327 48,432 0.2 108.7 110.0 1.2South Carolina 189,836 196,049 3.3 192,575 196,475 2.0 98.6 99.8 1.2South Dakota 40,893 41,398 1.2 42,377 42,425 0.1 96.5 97.6 1.1Tennessee 277,837 288,170 3.7 283,270 289,225 2.1 98.1 99.6 1.5Texas 1,284,521 1,289,310 0.4 1,213,803 1,204,042 -0.8 105.8 107.1 1.2Utah 118,725 124,871 5.2 112,404 116,117 3.3 105.6 107.5 1.8Vermont 30,599 31,220 2.0 27,370 27,809 1.6 111.8 112.3 0.4Virginia 436,655 445,462 2.0 389,421 394,265 1.2 112.1 113.0 0.8Washington 379,951 397,772 4.7 331,207 341,207 3.0 114.7 116.6 1.7West Virginia 67,274 67,062 -0.3 69,422 69,316 -0.2 96.9 96.7 -0.2Wisconsin 265,094 270,226 1.9 260,354 263,700 1.3 101.8 102.5 0.7Wyoming 33,010 32,270 -2.2 31,331 30,201 -3.6 105.4 106.9 1.4
Maximum 2,133,664 2,212,691 5.2 1,718,306 1,751,126 4.5 129.9 130.8 1.9Minimum 30,599 31,220 -2.5 27,370 27,809 -3.6 94.0 95.4 -0.2Range 2,103,065 2,181,471 7.7 1,690,936 1,723,318 8.1 35.9 35.4 2.1Source: U.S. Bureau of Economic AnalysisNote: Estimates may not add to totals because of rounding.1. The implicit price deflator for the United States is equal to the national personal consumption expenditures price index, with a base of 2009.
Table 1. Real Personal Income and Implicit Regional Price Deflators by State, 2015-2016 Personal income Millions of dollars
Real personal income Millions of chained (2009) dollars Implicit regional price deflators1

THURSDAY, May 17, 2018
2015 2016 Percent change 2015 2016 Percent
changeUnited States 48,429 49,204 1.6 44,235 44,412 0.4Alabama 38,238 38,918 1.8 40,356 40,689 0.8Alaska 56,507 55,674 -1.5 48,949 47,831 -2.3Arizona 39,731 40,546 2.1 37,889 38,265 1.0Arkansas 39,060 39,722 1.7 40,967 41,371 1.0California 54,664 56,308 3.0 44,022 44,562 1.2Colorado 51,956 52,097 0.3 46,324 45,806 -1.1Connecticut 68,155 69,094 1.4 57,380 57,554 0.3Delaware 47,069 47,837 1.6 43,036 43,223 0.4District of Columbia 73,834 75,756 2.6 57,609 59,163 2.7Florida 45,388 45,855 1.0 41,752 41,623 -0.3Georgia 41,020 42,146 2.7 40,545 41,407 2.1Hawaii 48,823 50,358 3.1 37,583 38,514 2.5Idaho 38,931 39,543 1.6 38,148 38,477 0.9Illinois 50,745 51,679 1.8 46,796 47,302 1.1Indiana 41,862 43,091 2.9 42,269 43,180 2.2Iowa 45,800 46,056 0.6 46,372 46,230 -0.3Kansas 47,009 47,221 0.5 47,483 47,221 -0.6Kentucky 38,504 38,934 1.1 39,805 40,161 0.9Louisiana 42,835 42,257 -1.3 43,315 42,337 -2.3Maine 42,875 44,094 2.8 39,772 40,570 2.0Maryland 56,197 57,972 3.2 46,879 47,936 2.3Massachusetts 62,755 64,122 2.2 53,529 53,860 0.6Michigan 43,072 44,231 2.7 42,252 42,931 1.6Minnesota 51,139 51,990 1.7 48,049 48,283 0.5Mississippi 34,804 35,524 2.1 37,007 37,222 0.6Missouri 42,406 42,939 1.3 43,325 43,445 0.3Montana 42,637 43,107 1.1 41,025 41,457 1.1Nebraska 49,572 50,016 0.9 50,052 50,043 0.0Nevada 43,128 43,579 1.0 40,461 40,510 0.1New Hampshire 54,543 55,945 2.6 47,310 47,837 1.1New Jersey 60,069 61,240 1.9 48,567 48,984 0.9New Mexico 37,938 38,393 1.2 36,910 37,145 0.6New York 58,324 59,289 1.7 46,281 46,416 0.3North Carolina 41,351 42,203 2.1 41,546 42,020 1.1North Dakota 55,643 54,801 -1.5 55,110 54,213 -1.6Ohio 43,803 44,561 1.7 44,825 45,176 0.8Oklahoma 43,999 42,717 -2.9 44,879 43,458 -3.2Oregon 44,424 45,482 2.4 41,112 41,266 0.4Pennsylvania 49,815 50,730 1.8 46,458 46,672 0.5Rhode Island 49,744 50,373 1.3 45,768 45,795 0.1South Carolina 38,802 39,527 1.9 39,362 39,613 0.6South Dakota 47,882 48,051 0.4 49,620 49,243 -0.8Tennessee 42,156 43,338 2.8 42,980 43,496 1.2Texas 46,787 46,204 -1.2 44,211 43,148 -2.4Utah 39,775 41,018 3.1 37,657 38,142 1.3Vermont 49,002 50,084 2.2 43,830 44,611 1.8Virginia 52,189 52,941 1.4 46,544 46,856 0.7Washington 53,119 54,632 2.8 46,304 46,863 1.2West Virginia 36,566 36,673 0.3 37,734 37,906 0.5Wisconsin 46,025 46,809 1.7 45,202 45,679 1.1Wyoming 56,322 55,172 -2.0 53,456 51,634 -3.4
Maximum 73,834 75,756 3.2 57,609 59,163 2.7Minimum 34,804 35,524 -2.9 36,910 37,145 -3.4Range 39,030 40,232 6.1 20,699 22,018 6.1Source: U.S. Bureau of Economic AnalysisNote: Per capita personal income uses Census Bureau midyear population estimates available as of December 2017.
Table 2. Real Per Capita Personal Income by State, 2015-2016 Per capita personal income
Dollars Real per capita personal income
Chained (2009) dollars
THURSDAY, May 17, 2018
Rents OtherUnited States1 100.0 99.4 101.2 100.0Alabama 86.6 96.2 63.2 93.3Alaska 105.4 101.1 137.5 96.6Arizona 95.9 97.4 91.8 97.2Arkansas 86.9 94.7 63.8 93.3California 114.4 103.6 148.4 106.8Colorado 103.0 99.8 117.6 98.5Connecticut 108.7 104.5 115.3 109.1Delaware 100.2 99.1 97.1 103.2District of Columbia 115.9 105.4 145.3 110.6Florida 99.7 98.3 106.1 97.0Georgia 92.1 96.7 81.2 94.7Hawaii 118.4 110.5 157.4 103.5Idaho 93.0 98.1 77.6 97.5Illinois 98.9 98.9 98.4 99.2Indiana 90.3 96.8 73.9 93.5Iowa 90.2 95.2 75.1 91.8Kansas 90.5 95.8 74.6 93.7Kentucky 87.8 94.3 67.1 93.1Louisiana 90.4 96.5 76.2 93.3Maine 98.4 98.5 94.4 100.5Maryland 109.5 103.4 122.0 107.0Massachusetts 107.8 101.1 122.9 105.8Michigan 93.3 97.3 81.0 96.3Minnesota 97.5 100.9 95.4 94.9Mississippi 86.4 93.8 65.0 93.3Missouri 89.5 95.3 73.1 92.6Montana 94.1 98.9 80.9 95.6Nebraska 90.5 95.6 76.2 92.0Nevada 97.4 96.1 94.7 101.1New Hampshire 105.9 100.4 118.3 104.4New Jersey 113.2 102.7 132.5 113.4New Mexico 93.6 97.0 80.2 99.8New York 115.6 109.0 133.2 111.6North Carolina 90.9 96.3 78.6 93.3North Dakota 91.5 95.0 82.8 91.6Ohio 89.3 96.1 72.8 91.9Oklahoma 89.0 95.5 70.1 93.3Oregon 99.8 98.9 106.0 97.2Pennsylvania 98.4 99.4 88.8 102.7Rhode Island 99.6 98.3 100.6 100.3South Carolina 90.3 96.7 77.1 93.3South Dakota 88.3 94.9 69.3 91.5Tennessee 90.2 96.2 75.8 93.3Texas 96.9 97.2 93.7 98.6Utah 97.3 96.7 94.3 100.3Vermont 101.6 98.4 113.2 100.3Virginia 102.3 99.6 109.7 100.8Washington 105.5 103.7 116.1 101.9West Virginia 87.6 94.4 63.2 94.9Wisconsin 92.8 95.9 84.8 93.4Wyoming 96.7 98.7 92.9 96.1
Maximum 118.4 110.5 157.4 113.4Minimum 86.4 93.8 63.2 91.5Range 32.0 16.7 94.2 21.9Source: U.S. Bureau of Economic Analysis1. The U.S. all items RPP is the average price level across all states and the District of Columbia.
Table 3. Regional Price Parities by State, 2016Regional price parities
All items GoodsServices
THURSDAY, May 17, 2018
2015 2016 Percent change 2015 2016 Percent
change 2015 2016 Percent change
United States 15,547,661 15,912,777 2.3 14,201,215 14,363,078 1.1 109.5 110.8 1.2United States nonmetropolitan portion 1,744,209 1,760,840 1.0 1,821,701 1,824,897 0.2 95.7 96.5 0.8
Metropolitan Statistical AreasAbilene, TX 7,006 6,938 -1.0 7,076 6,884 -2.7 99.0 100.8 1.8Akron, OH 31,308 31,655 1.1 31,861 31,914 0.2 98.3 99.2 0.9Albany, GA 5,308 5,441 2.5 5,793 5,926 2.3 91.6 91.8 0.2Albany, OR 4,520 4,713 4.3 4,417 4,521 2.4 102.4 104.3 1.9Albany-Schenectady-Troy, NY 46,514 47,378 1.9 42,519 42,809 0.7 109.4 110.7 1.2Albuquerque, NM 34,979 36,091 3.2 33,182 34,003 2.5 105.4 106.1 0.7Alexandria, LA 6,273 6,400 2.0 6,522 6,612 1.4 96.2 96.8 0.6Allentown-Bethlehem-Easton, PA-NJ 39,862 40,828 2.4 36,248 36,749 1.4 110.0 111.1 1.0Altoona, PA 5,134 5,205 1.4 5,232 5,207 -0.5 98.1 100.0 1.9Amarillo, TX 11,456 11,499 0.4 11,307 11,221 -0.8 101.3 102.5 1.2Ames, IA 3,692 3,735 1.2 3,701 3,698 -0.1 99.8 101.0 1.2Anchorage, AK 23,669 23,266 -1.7 19,954 19,335 -3.1 118.6 120.3 1.4Ann Arbor, MI 18,548 19,262 3.8 16,764 17,172 2.4 110.6 112.2 1.4Anniston-Oxford-Jacksonville, AL 3,865 3,943 2.0 4,219 4,269 1.2 91.6 92.4 0.9Appleton, WI 10,578 10,896 3.0 10,536 10,757 2.1 100.4 101.3 0.9Asheville, NC 17,834 18,565 4.1 17,621 18,187 3.2 101.2 102.1 0.9Athens-Clarke County, GA 7,225 7,486 3.6 7,234 7,483 3.4 99.9 100.0 0.1Atlanta-Sandy Springs-Roswell, GA 261,782 274,129 4.7 249,700 258,210 3.4 104.8 106.2 1.3Atlantic City-Hammonton, NJ 11,733 11,992 2.2 10,281 10,517 2.3 114.1 114.0 -0.1Auburn-Opelika, AL 5,248 5,465 4.1 5,694 5,865 3.0 92.2 93.2 1.1Augusta-Richmond County, GA-SC 22,402 23,093 3.1 23,212 23,728 2.2 96.5 97.3 0.8Austin-Round Rock, TX 102,159 106,040 3.8 94,253 96,280 2.2 108.4 110.1 1.6Bakersfield, CA 33,285 33,369 0.3 31,424 31,313 -0.4 105.9 106.6 0.7Baltimore-Columbia-Towson, MD 154,969 160,065 3.3 132,317 135,448 2.4 117.1 118.2 0.9Bangor, ME 5,634 5,750 2.1 5,351 5,452 1.9 105.3 105.5 0.2Barnstable Town, MA 13,817 14,093 2.0 12,301 12,312 0.1 112.3 114.5 2.0Baton Rouge, LA 35,835 36,077 0.7 35,417 35,210 -0.6 101.2 102.5 1.3Battle Creek, MI 4,970 5,118 3.0 5,021 5,126 2.1 99.0 99.8 0.8Bay City, MI 4,027 4,127 2.5 4,188 4,311 2.9 96.1 95.7 -0.4Beaumont-Port Arthur, TX 16,840 17,012 1.0 17,152 17,201 0.3 98.2 98.9 0.7Beckley, WV 4,121 4,043 -1.9 4,766 4,654 -2.4 86.5 86.9 0.5Bellingham, WA 9,190 9,598 4.4 8,457 8,764 3.6 108.7 109.5 0.7Bend-Redmond, OR 8,048 8,668 7.7 7,596 7,950 4.7 106.0 109.0 2.8Billings, MT 7,883 8,002 1.5 7,370 7,448 1.1 107.0 107.4 0.4Binghamton, NY 9,718 9,824 1.1 9,319 9,293 -0.3 104.3 105.7 1.3Birmingham-Hoover, AL 51,650 52,546 1.7 53,172 53,688 1.0 97.1 97.9 0.8Bismarck, ND 6,900 6,986 1.2 6,746 6,750 0.1 102.3 103.5 1.2Blacksburg-Christiansburg-Radford, VA 6,265 6,347 1.3 6,447 6,510 1.0 97.2 97.5 0.3Bloomington, IL 8,446 8,591 1.7 8,261 8,316 0.7 102.2 103.3 1.1Bloomington, IN 5,850 6,142 5.0 5,689 5,950 4.6 102.8 103.2 0.4Bloomsburg-Berwick, PA 3,421 3,520 2.9 3,324 3,423 3.0 102.9 102.8 -0.1Boise City, ID 27,221 28,309 4.0 26,407 27,091 2.6 103.1 104.5 1.4Boston-Cambridge-Newton, MA-NH 327,532 336,363 2.7 272,026 274,802 1.0 120.4 122.4 1.7Boulder, CO 19,980 20,528 2.7 16,800 17,111 1.9 118.9 120.0 0.9Bowling Green, KY 5,807 5,971 2.8 6,232 6,367 2.2 93.2 93.8 0.6Bremerton-Silverdale, WA 12,521 13,164 5.1 10,809 11,223 3.8 115.8 117.3 1.3Bridgeport-Stamford-Norwalk, CT 99,671 100,712 1.0 76,681 76,109 -0.7 130.0 132.3 1.8Brownsville-Harlingen, TX 11,161 11,421 2.3 12,204 12,369 1.4 91.5 92.3 0.9Brunswick, GA 4,212 4,328 2.8 4,476 4,590 2.6 94.1 94.3 0.2Buffalo-Cheektowaga-Niagara Falls, NY 51,766 52,688 1.8 50,212 50,670 0.9 103.1 104.0 0.9Burlington, NC 5,687 5,788 1.8 5,801 5,878 1.3 98.0 98.5 0.5Burlington-South Burlington, VT 11,296 11,566 2.4 9,972 10,036 0.6 113.3 115.2 1.7California-Lexington Park, MD 5,783 5,986 3.5 5,381 5,417 0.7 107.5 110.5 2.8Canton-Massillon, OH 16,435 16,596 1.0 16,980 17,004 0.1 96.8 97.6 0.8Cape Coral-Fort Myers, FL 32,272 33,060 2.4 31,071 31,284 0.7 103.9 105.7 1.7Cape Girardeau, MO-IL 3,767 3,829 1.6 4,157 4,200 1.0 90.6 91.2 0.7Carbondale-Marion, IL 4,715 4,769 1.1 5,139 5,180 0.8 91.8 92.1 0.3Carson City, NV 2,362 2,351 -0.5 2,265 2,232 -1.5 104.3 105.4 1.1Casper, WY 5,921 5,599 -5.4 5,576 5,208 -6.6 106.2 107.5 1.2Cedar Rapids, IA 12,666 12,942 2.2 12,969 13,152 1.4 97.7 98.4 0.7Chambersburg-Waynesboro, PA 6,388 6,504 1.8 6,206 6,269 1.0 102.9 103.8 0.9Champaign-Urbana, IL 10,192 10,358 1.6 9,981 10,035 0.5 102.1 103.2 1.1Charleston, WV 9,155 9,166 0.1 9,609 9,530 -0.8 95.3 96.2 0.9Charleston-North Charleston, SC 32,791 34,250 4.4 31,324 32,309 3.1 104.7 106.0 1.2Charlotte-Concord-Gastonia, NC-SC 110,586 115,498 4.4 108,620 112,080 3.2 101.8 103.0 1.2Charlottesville, VA 12,151 12,371 1.8 11,382 11,468 0.8 106.8 107.9 1.0Chattanooga, TN-GA 22,817 23,500 3.0 23,318 23,895 2.5 97.9 98.3 0.4Cheyenne, WY 4,825 4,884 1.2 4,544 4,549 0.1 106.2 107.4 1.1Chicago-Naperville-Elgin, IL-IN-WI 519,693 529,122 1.8 459,249 462,574 0.7 113.2 114.4 1.1Chico, CA 9,103 9,466 4.0 8,436 8,681 2.9 107.9 109.0 1.0Cincinnati, OH-KY-IN 102,999 105,372 2.3 105,261 106,693 1.4 97.9 98.8 0.9
Table 4. Real Personal Income and Implicit Regional Price Deflators by Metropolitan Area, 2015-2016 Personal incomeMillions of dollars
Real personal incomeMillions of chained (2009) dollars Implicit regional price deflators1
THURSDAY, May 17, 2018
2015 2016 Percent change 2015 2016 Percent
change 2015 2016 Percent change
Table 4. Real Personal Income and Implicit Regional Price Deflators by Metropolitan Area, 2015-2016 Personal incomeMillions of dollars
Real personal incomeMillions of chained (2009) dollars Implicit regional price deflators1
Clarksville, TN-KY 10,794 10,777 -0.2 10,911 10,825 -0.8 98.9 99.6 0.7Cleveland, TN 4,402 4,503 2.3 4,795 4,897 2.1 91.8 91.9 0.1Cleveland-Elyria, OH 98,916 100,659 1.8 100,583 101,325 0.7 98.3 99.3 1.0Coeur d'Alene, ID 5,883 6,145 4.5 5,750 5,933 3.2 102.3 103.6 1.3College Station-Bryan, TX 8,927 9,025 1.1 8,766 8,780 0.2 101.8 102.8 1.0Colorado Springs, CO 30,689 31,668 3.2 28,299 28,865 2.0 108.4 109.7 1.2Columbia, MO 7,446 7,645 2.7 7,433 7,588 2.1 100.2 100.8 0.6Columbia, SC 33,052 34,000 2.9 33,081 33,627 1.7 99.9 101.1 1.2Columbus, GA-AL 11,620 11,829 1.8 11,933 12,019 0.7 97.4 98.4 1.0Columbus, IN 3,680 3,857 4.8 3,835 3,941 2.8 95.9 97.9 2.1Columbus, OH 94,754 97,432 2.8 93,604 95,033 1.5 101.2 102.5 1.3Corpus Christi, TX 18,751 18,667 -0.4 18,446 18,129 -1.7 101.7 103.0 1.3Corvallis, OR 3,632 3,776 4.0 3,347 3,416 2.1 108.5 110.5 1.8Crestview-Fort Walton Beach-Destin, FL 12,458 12,892 3.5 12,052 12,344 2.4 103.4 104.4 1.0Cumberland, MD-WV 3,673 3,778 2.8 3,862 3,889 0.7 95.1 97.1 2.1Dallas-Fort Worth-Arlington, TX 362,026 369,615 2.1 332,290 334,687 0.7 108.9 110.4 1.4Dalton, GA 4,699 4,869 3.6 5,124 5,299 3.4 91.7 91.9 0.2Danville, IL 2,829 2,871 1.5 3,199 3,241 1.3 88.4 88.6 0.2Daphne-Fairhope-Foley, AL 8,278 8,611 4.0 8,346 8,562 2.6 99.2 100.6 1.4Davenport-Moline-Rock Island, IA-IL 17,100 17,246 0.9 17,396 17,356 -0.2 98.3 99.4 1.1Dayton, OH 34,261 34,967 2.1 34,840 35,247 1.2 98.3 99.2 0.9Decatur, AL 5,337 5,412 1.4 5,684 5,827 2.5 93.9 92.9 -1.1Decatur, IL 4,736 4,742 0.1 4,986 5,001 0.3 95.0 94.8 -0.2Deltona-Daytona Beach-Ormond Beach, FL 23,994 24,924 3.9 23,055 23,715 2.9 104.1 105.1 1.0Denver-Aurora-Lakewood, CO 160,330 162,317 1.2 139,983 139,025 -0.7 114.5 116.8 2.0Des Moines-West Des Moines, IA 30,983 32,166 3.8 30,022 30,884 2.9 103.2 104.2 1.0Detroit-Warren-Dearborn, MI 203,319 209,260 2.9 193,900 197,953 2.1 104.9 105.7 0.8Dothan, AL 5,467 5,589 2.2 5,930 6,029 1.7 92.2 92.7 0.5Dover, DE 6,509 6,730 3.4 6,340 6,471 2.1 102.7 104.0 1.3Dubuque, IA 4,325 4,372 1.1 4,312 4,337 0.6 100.3 100.8 0.5Duluth, MN-WI 11,604 11,688 0.7 11,759 11,743 -0.1 98.7 99.5 0.8Durham-Chapel Hill, NC 26,674 27,594 3.4 25,690 26,311 2.4 103.8 104.9 1.1East Stroudsburg, PA 6,317 6,495 2.8 5,819 6,068 4.3 108.6 107.0 -1.5Eau Claire, WI 7,059 7,121 0.9 7,092 7,085 -0.1 99.5 100.5 1.0El Centro, CA 6,160 6,172 0.2 6,286 6,271 -0.3 98.0 98.4 0.4Elizabethtown-Fort Knox, KY 5,660 5,827 3.0 6,037 6,202 2.7 93.7 94.0 0.3Elkhart-Goshen, IN 8,128 8,500 4.6 8,224 8,555 4.0 98.8 99.4 0.6Elmira, NY 3,435 3,446 0.3 3,308 3,283 -0.7 103.8 105.0 1.2El Paso, TX 27,075 27,744 2.5 27,854 28,401 2.0 97.2 97.7 0.5Enid, OK 2,836 2,803 -1.2 2,898 2,814 -2.9 97.9 99.6 1.7Erie, PA 11,174 11,259 0.8 11,029 11,026 0.0 101.3 102.1 0.8Eugene, OR 14,598 15,160 3.9 13,692 14,067 2.7 106.6 107.8 1.1Evansville, IN-KY 13,279 13,598 2.4 13,577 13,805 1.7 97.8 98.5 0.7Fairbanks, AK 5,363 5,397 0.6 4,603 4,594 -0.2 116.5 117.5 0.9Fargo, ND-MN 11,654 11,993 2.9 11,548 11,748 1.7 100.9 102.1 1.2Farmington, NM 4,473 4,374 -2.2 4,539 4,361 -3.9 98.5 100.3 1.8Fayetteville, NC 13,652 13,933 2.1 13,829 14,065 1.7 98.7 99.1 0.4Fayetteville-Springdale-Rogers, AR-MO 28,820 29,259 1.5 29,453 29,678 0.8 97.9 98.6 0.7Flagstaff, AZ 5,767 5,926 2.8 5,342 5,489 2.8 108.0 108.0 0.0Flint, MI 15,020 15,395 2.5 15,107 15,448 2.3 99.4 99.7 0.3Florence, SC 7,526 7,654 1.7 8,061 8,123 0.8 93.4 94.2 0.9Florence-Muscle Shoals, AL 5,170 5,251 1.6 5,666 5,661 -0.1 91.2 92.8 1.8Fond du Lac, WI 4,479 4,562 1.9 4,692 4,754 1.3 95.5 96.0 0.5Fort Collins, CO 15,398 16,019 4.0 13,922 14,264 2.5 110.6 112.3 1.5Fort Smith, AR-OK 9,597 9,779 1.9 10,327 10,489 1.6 92.9 93.2 0.3Fort Wayne, IN 17,711 18,251 3.0 18,098 18,421 1.8 97.9 99.1 1.2Fresno, CA 38,034 39,295 3.3 36,138 37,034 2.5 105.2 106.1 0.9Gadsden, AL 3,522 3,583 1.7 3,818 3,903 2.2 92.2 91.8 -0.4Gainesville, FL 10,984 11,353 3.4 10,664 10,923 2.4 103.0 103.9 0.9Gainesville, GA 7,349 7,682 4.5 7,579 7,876 3.9 97.0 97.5 0.5Gettysburg, PA 4,614 4,685 1.6 4,388 4,424 0.8 105.1 105.9 0.8Glens Falls, NY 5,276 5,388 2.1 4,995 5,075 1.6 105.6 106.2 0.6Goldsboro, NC 4,513 4,587 1.6 4,730 4,795 1.4 95.4 95.7 0.3Grand Forks, ND-MN 4,691 4,888 4.2 4,593 4,758 3.6 102.1 102.7 0.6Grand Island, NE 3,556 3,637 2.3 3,790 3,841 1.3 93.8 94.7 1.0Grand Junction, CO 5,828 5,871 0.7 5,642 5,665 0.4 103.3 103.6 0.3Grand Rapids-Wyoming, MI 47,343 48,710 2.9 46,483 47,270 1.7 101.8 103.0 1.2Grants Pass, OR 3,062 3,188 4.1 2,979 3,097 4.0 102.8 102.9 0.1Great Falls, MT 3,462 3,546 2.4 3,407 3,476 2.0 101.6 102.0 0.4Greeley, CO 12,200 12,594 3.2 11,336 11,527 1.7 107.6 109.3 1.6Green Bay, WI 14,506 14,754 1.7 14,563 14,702 1.0 99.6 100.4 0.8Greensboro-High Point, NC 30,101 30,747 2.1 30,681 31,064 1.2 98.1 99.0 0.9Greenville, NC 6,539 6,724 2.8 6,808 6,929 1.8 96.1 97.0 0.9Greenville-Anderson-Mauldin, SC 34,588 35,616 3.0 35,356 36,056 2.0 97.8 98.8 1.0
THURSDAY, May 17, 2018
2015 2016 Percent change 2015 2016 Percent
change 2015 2016 Percent change
Table 4. Real Personal Income and Implicit Regional Price Deflators by Metropolitan Area, 2015-2016 Personal incomeMillions of dollars
Real personal incomeMillions of chained (2009) dollars Implicit regional price deflators1
Gulfport-Biloxi-Pascagoula, MS 13,344 13,644 2.2 13,688 13,888 1.5 97.5 98.2 0.7Hagerstown-Martinsburg, MD-WV 10,450 10,799 3.3 9,516 9,752 2.5 109.8 110.7 0.8Hammond, LA 4,594 4,684 2.0 4,909 4,982 1.5 93.6 94.0 0.4Hanford-Corcoran, CA 4,997 5,136 2.8 4,928 4,955 0.5 101.4 103.7 2.3Harrisburg-Carlisle, PA 27,094 27,729 2.3 25,710 26,049 1.3 105.4 106.4 0.9Harrisonburg, VA 4,714 4,784 1.5 4,821 4,902 1.7 97.8 97.6 -0.2Hartford-West Hartford-East Hartford, CT 70,971 71,617 0.9 64,214 64,020 -0.3 110.5 111.9 1.3Hattiesburg, MS 5,134 5,273 2.7 5,701 5,830 2.3 90.1 90.4 0.3Hickory-Lenoir-Morganton, NC 12,986 13,302 2.4 13,602 13,925 2.4 95.5 95.5 0.0Hilton Head Island-Bluffton-Beaufort, SC 9,691 9,920 2.4 9,476 9,516 0.4 102.3 104.2 1.9Hinesville, GA 2,520 2,569 2.0 2,561 2,581 0.8 98.4 99.5 1.1Homosassa Springs, FL 5,050 5,199 3.0 5,284 5,398 2.2 95.6 96.3 0.7Hot Springs, AR 3,641 3,761 3.3 3,933 4,005 1.8 92.6 93.9 1.4Houma-Thibodaux, LA 9,519 8,924 -6.3 9,558 8,921 -6.7 99.6 100.0 0.4Houston-The Woodlands-Sugar Land, TX 358,025 351,579 -1.8 324,694 314,097 -3.3 110.3 111.9 1.5Huntington-Ashland, WV-KY-OH 13,078 13,128 0.4 13,927 13,854 -0.5 93.9 94.8 1.0Huntsville, AL 19,733 20,328 3.0 20,139 20,644 2.5 98.0 98.5 0.5Idaho Falls, ID 5,499 5,755 4.7 5,631 5,817 3.3 97.7 98.9 1.2Indianapolis-Carmel-Anderson, IN 95,765 99,573 4.0 94,705 97,409 2.9 101.1 102.2 1.1Iowa City, IA 7,846 8,032 2.4 7,504 7,614 1.5 104.6 105.5 0.9Ithaca, NY 4,260 4,275 0.3 3,690 3,645 -1.2 115.5 117.3 1.6Jackson, MI 5,855 6,074 3.7 5,981 6,150 2.8 97.9 98.8 0.9Jackson, MS 24,267 24,505 1.0 24,708 24,679 -0.1 98.2 99.3 1.1Jackson, TN 4,769 4,961 4.0 5,336 5,487 2.8 89.4 90.4 1.1Jacksonville, FL 64,961 67,212 3.5 62,230 63,697 2.4 104.4 105.5 1.1Jacksonville, NC 8,295 8,892 7.2 8,166 8,704 6.6 101.6 102.2 0.6Janesville-Beloit, WI 6,401 6,542 2.2 6,410 6,473 1.0 99.9 101.1 1.2Jefferson City, MO 5,974 6,062 1.5 6,623 6,697 1.1 90.2 90.5 0.3Johnson City, TN 7,357 7,522 2.2 7,672 7,754 1.1 95.9 97.0 1.1Johnstown, PA 5,235 5,298 1.2 5,562 5,547 -0.3 94.1 95.5 1.5Jonesboro, AR 4,301 4,473 4.0 4,828 4,960 2.7 89.1 90.2 1.2Joplin, MO 6,377 6,445 1.1 6,665 6,659 -0.1 95.7 96.8 1.1Kahului-Wailuku-Lahaina, HI 7,034 7,360 4.6 6,017 6,273 4.3 116.9 117.3 0.3Kalamazoo-Portage, MI 14,136 14,619 3.4 14,152 14,539 2.7 99.9 100.5 0.6Kankakee, IL 4,131 4,199 1.6 3,913 3,957 1.1 105.6 106.1 0.5Kansas City, MO-KS 100,875 102,099 1.2 98,490 98,934 0.5 102.4 103.2 0.8Kennewick-Richland, WA 11,379 11,966 5.2 10,744 11,186 4.1 105.9 107.0 1.0Killeen-Temple, TX 17,318 17,476 0.9 17,262 17,320 0.3 100.3 100.9 0.6Kingsport-Bristol-Bristol, TN-VA 11,308 11,459 1.3 12,175 12,214 0.3 92.9 93.8 1.0Kingston, NY 7,950 8,071 1.5 6,992 7,066 1.1 113.7 114.2 0.4Knoxville, TN 35,240 36,568 3.8 36,251 37,508 3.5 97.2 97.5 0.3Kokomo, IN 3,089 3,188 3.2 3,285 3,376 2.8 94.0 94.4 0.4La Crosse-Onalaska, WI-MN 6,122 6,292 2.8 6,065 6,130 1.1 100.9 102.6 1.7Lafayette, LA 20,873 19,451 -6.8 21,525 19,903 -7.5 97.0 97.7 0.7Lafayette-West Lafayette, IN 7,527 7,873 4.6 7,402 7,759 4.8 101.7 101.5 -0.2Lake Charles, LA 8,886 9,283 4.5 9,187 9,559 4.0 96.7 97.1 0.4Lake Havasu City-Kingman, AZ 5,993 6,167 2.9 5,954 6,099 2.4 100.7 101.1 0.4Lakeland-Winter Haven, FL 22,099 22,782 3.1 21,836 22,245 1.9 101.2 102.4 1.2Lancaster, PA 24,193 24,684 2.0 22,330 22,541 0.9 108.3 109.5 1.1Lansing-East Lansing, MI 17,865 18,559 3.9 17,614 18,119 2.9 101.4 102.4 1.0Laredo, TX 7,895 7,980 1.1 8,158 8,128 -0.4 96.8 98.2 1.4Las Cruces, NM 6,917 7,037 1.7 6,931 7,013 1.2 99.8 100.3 0.5Las Vegas-Henderson-Paradise, NV 88,412 91,150 3.1 82,719 84,604 2.3 106.9 107.7 0.7Lawrence, KS 4,579 4,711 2.9 4,520 4,610 2.0 101.3 102.2 0.9Lawton, OK 4,993 4,984 -0.2 5,067 5,044 -0.5 98.5 98.8 0.3Lebanon, PA 5,963 6,051 1.5 5,727 5,756 0.5 104.1 105.1 1.0Lewiston, ID-WA 2,490 2,602 4.5 2,520 2,604 3.3 98.8 99.9 1.1Lewiston-Auburn, ME 3,965 4,088 3.1 3,831 3,935 2.7 103.5 103.9 0.4Lexington-Fayette, KY 21,457 21,736 1.3 21,439 21,605 0.8 100.1 100.6 0.5Lima, OH 3,951 4,033 2.1 4,097 4,200 2.5 96.4 96.0 -0.4Lincoln, NE 14,478 14,879 2.8 14,351 14,605 1.8 100.9 101.9 1.0Little Rock-North Little Rock-Conway, AR 30,472 31,282 2.7 30,784 31,380 1.9 99.0 99.7 0.7Logan, UT-ID 4,364 4,599 5.4 4,418 4,583 3.8 98.8 100.4 1.6Longview, TX 9,092 8,804 -3.2 9,120 8,786 -3.7 99.7 100.2 0.5Longview, WA 4,156 4,359 4.9 4,038 4,196 3.9 102.9 103.9 1.0Los Angeles-Long Beach-Anaheim, CA 737,545 760,829 3.2 575,991 586,818 1.9 128.0 129.7 1.3Louisville/Jefferson County, KY-IN 56,965 58,428 2.6 57,319 58,297 1.7 99.4 100.2 0.8Lubbock, TX 11,934 12,171 2.0 11,728 11,846 1.0 101.8 102.7 0.9Lynchburg, VA 9,645 9,756 1.1 9,739 9,854 1.2 99.0 99.0 0.0Macon-Bibb County, GA 8,683 8,838 1.8 9,177 9,302 1.4 94.6 95.0 0.4Madera, CA 5,611 5,806 3.5 5,384 5,562 3.3 104.2 104.4 0.2Madison, WI 33,662 34,780 3.3 31,665 32,317 2.1 106.3 107.6 1.2Manchester-Nashua, NH 22,383 23,051 3.0 18,982 19,287 1.6 117.9 119.5 1.4Manhattan, KS 4,032 4,060 0.7 3,965 3,993 0.7 101.7 101.7 0.0

THURSDAY, May 17, 2018
2015 2016 Percent change 2015 2016 Percent
change 2015 2016 Percent change
Table 4. Real Personal Income and Implicit Regional Price Deflators by Metropolitan Area, 2015-2016 Personal incomeMillions of dollars
Real personal incomeMillions of chained (2009) dollars Implicit regional price deflators1
Mankato-North Mankato, MN 4,282 4,305 0.5 4,392 4,333 -1.3 97.5 99.4 1.9Mansfield, OH 4,347 4,412 1.5 4,671 4,641 -0.6 93.1 95.1 2.1McAllen-Edinburg-Mission, TX 20,509 21,081 2.8 22,161 22,640 2.2 92.5 93.1 0.6Medford, OR 8,701 9,062 4.2 8,157 8,429 3.3 106.7 107.5 0.7Memphis, TN-MS-AR 56,715 58,411 3.0 56,941 58,250 2.3 99.6 100.3 0.7Merced, CA 9,684 9,888 2.1 9,410 9,538 1.4 102.9 103.7 0.8Miami-Fort Lauderdale-West Palm Beach, FL 308,815 316,724 2.6 264,277 267,148 1.1 116.9 118.6 1.5Michigan City-La Porte, IN 4,102 4,204 2.5 4,377 4,451 1.7 93.7 94.5 0.9Midland, MI 3,608 3,448 -4.4 3,645 3,407 -6.5 99.0 101.2 2.2Midland, TX 18,681 17,421 -6.7 17,063 15,685 -8.1 109.5 111.1 1.5Milwaukee-Waukesha-West Allis, WI 79,741 80,895 1.4 76,529 76,786 0.3 104.2 105.4 1.2Minneapolis-St. Paul-Bloomington, MN-WI 195,613 201,427 3.0 175,538 178,654 1.8 111.4 112.7 1.2Missoula, MT 4,917 5,125 4.2 4,680 4,853 3.7 105.0 105.6 0.6Mobile, AL 14,643 14,914 1.9 15,283 15,481 1.3 95.8 96.3 0.5Modesto, CA 21,579 22,366 3.6 20,201 20,748 2.7 106.8 107.8 0.9Monroe, LA 6,590 6,804 3.3 7,050 7,289 3.4 93.5 93.4 -0.1Monroe, MI 6,249 6,455 3.3 6,080 6,235 2.5 102.8 103.5 0.7Montgomery, AL 14,790 15,165 2.5 15,198 15,455 1.7 97.3 98.1 0.8Morgantown, WV 5,418 5,400 -0.3 5,457 5,354 -1.9 99.3 100.9 1.6Morristown, TN 3,899 4,045 3.7 4,413 4,617 4.6 88.4 87.6 -0.9Mount Vernon-Anacortes, WA 5,471 5,759 5.3 5,123 5,337 4.2 106.8 107.9 1.0Muncie, IN 3,839 3,983 3.7 3,983 4,161 4.5 96.4 95.7 -0.7Muskegon, MI 5,970 6,180 3.5 6,254 6,410 2.5 95.5 96.4 0.9Myrtle Beach-Conway-North Myrtle Beach, SC-NC 14,992 15,722 4.9 15,178 15,670 3.2 98.8 100.3 1.5Napa, CA 8,913 9,355 5.0 6,719 6,964 3.7 132.7 134.3 1.2Naples-Immokalee-Marco Island, FL 30,139 30,708 1.9 27,612 27,617 0.0 109.2 111.2 1.8Nashville-Davidson--Murfreesboro--Franklin, TN 92,815 97,835 5.4 90,755 94,058 3.6 102.3 104.0 1.7New Bern, NC 5,099 5,216 2.3 5,402 5,544 2.6 94.4 94.1 -0.3New Haven-Milford, CT 44,282 45,074 1.8 36,386 36,721 0.9 121.7 122.7 0.8New Orleans-Metairie, LA 60,445 59,897 -0.9 58,028 57,074 -1.6 104.2 104.9 0.7New York-Newark-Jersey City, NY-NJ-PA 1,301,218 1,327,036 2.0 982,682 987,360 0.5 132.4 134.4 1.5Niles-Benton Harbor, MI 6,543 6,777 3.6 6,733 6,913 2.7 97.2 98.0 0.8North Port-Sarasota-Bradenton, FL 39,926 40,945 2.6 37,074 37,519 1.2 107.7 109.1 1.3Norwich-New London, CT 14,367 14,538 1.2 13,057 13,061 0.0 110.0 111.3 1.2Ocala, FL 11,662 12,134 4.0 11,861 12,204 2.9 98.3 99.4 1.1Ocean City, NJ 5,046 5,181 2.7 4,347 4,430 1.9 116.1 117.0 0.8Odessa, TX 7,085 6,538 -7.7 6,668 6,128 -8.1 106.3 106.7 0.4Ogden-Clearfield, UT 24,477 25,771 5.3 23,628 24,594 4.1 103.6 104.8 1.2Oklahoma City, OK 61,219 61,308 0.1 61,058 60,721 -0.6 100.3 101.0 0.7Olympia-Tumwater, WA 11,961 12,642 5.7 10,309 10,734 4.1 116.0 117.8 1.6Omaha-Council Bluffs, NE-IA 48,218 49,545 2.8 47,382 48,115 1.5 101.8 103.0 1.2Orlando-Kissimmee-Sanford, FL 93,706 98,062 4.6 87,916 90,839 3.3 106.6 108.0 1.3Oshkosh-Neenah, WI 7,228 7,414 2.6 7,292 7,382 1.2 99.1 100.4 1.3Owensboro, KY 4,600 4,604 0.1 4,825 4,799 -0.5 95.3 95.9 0.6Oxnard-Thousand Oaks-Ventura, CA 46,269 47,398 2.4 36,394 36,704 0.9 127.1 129.1 1.6Palm Bay-Melbourne-Titusville, FL 23,375 24,141 3.3 22,517 22,923 1.8 103.8 105.3 1.4Panama City, FL 7,792 8,025 3.0 7,598 7,768 2.2 102.6 103.3 0.7Parkersburg-Vienna, WV 3,480 3,439 -1.2 3,705 3,592 -3.1 93.9 95.8 2.0Pensacola-Ferry Pass-Brent, FL 18,839 19,420 3.1 18,601 19,086 2.6 101.3 101.7 0.4Peoria, IL 17,225 17,327 0.6 17,280 17,325 0.3 99.7 100.0 0.3Philadelphia-Camden-Wilmington, PA-NJ-DE-MD 347,533 355,663 2.3 301,019 304,795 1.3 115.5 116.7 1.0Phoenix-Mesa-Scottsdale, AZ 189,307 196,801 4.0 179,220 183,922 2.6 105.6 107.0 1.3Pine Bluff, AR 2,920 2,964 1.5 3,222 3,243 0.6 90.6 91.4 0.9Pittsburgh, PA 119,025 119,896 0.7 115,908 115,391 -0.4 102.7 103.9 1.2Pittsfield, MA 6,462 6,635 2.7 6,193 6,262 1.1 104.4 106.0 1.5Pocatello, ID 2,812 2,929 4.1 2,875 2,991 4.0 97.8 97.9 0.1Portland-South Portland, ME 26,045 26,944 3.5 23,499 24,038 2.3 110.8 112.1 1.2Portland-Vancouver-Hillsboro, OR-WA 117,373 122,434 4.3 106,505 109,206 2.5 110.2 112.1 1.7Port St. Lucie, FL 22,196 22,726 2.4 21,277 21,332 0.3 104.3 106.5 2.1Prescott, AZ 7,888 8,200 3.9 7,579 7,783 2.7 104.1 105.4 1.2Providence-Warwick, RI-MA 79,173 80,641 1.9 72,851 73,387 0.7 108.7 109.9 1.1Provo-Orem, UT 20,340 21,812 7.2 19,273 20,455 6.1 105.5 106.6 1.0Pueblo, CO 5,762 5,969 3.6 5,781 5,922 2.4 99.7 100.8 1.1Punta Gorda, FL 6,651 6,866 3.2 6,454 6,581 2.0 103.1 104.3 1.2Racine, WI 8,601 8,745 1.7 8,431 8,513 1.0 102.0 102.7 0.7Raleigh, NC 63,205 65,726 4.0 60,580 62,227 2.7 104.3 105.6 1.2Rapid City, SD 6,432 6,572 2.2 6,454 6,568 1.8 99.7 100.1 0.4Reading, PA 18,631 18,983 1.9 17,772 17,900 0.7 104.8 106.1 1.2Redding, CA 7,359 7,618 3.5 6,927 7,095 2.4 106.2 107.4 1.1Reno, NV 21,982 22,724 3.4 20,498 20,884 1.9 107.2 108.8 1.5Richmond, VA 64,724 66,245 2.3 61,805 62,548 1.2 104.7 105.9 1.1Riverside-San Bernardino-Ontario, CA 160,049 166,658 4.1 137,035 140,762 2.7 116.8 118.4 1.4Roanoke, VA 13,757 13,822 0.5 13,860 13,884 0.2 99.3 99.6 0.3Rochester, MN 10,401 10,761 3.5 10,214 10,403 1.9 101.8 103.4 1.6
THURSDAY, May 17, 2018
2015 2016 Percent change 2015 2016 Percent
change 2015 2016 Percent change
Table 4. Real Personal Income and Implicit Regional Price Deflators by Metropolitan Area, 2015-2016 Personal incomeMillions of dollars
Real personal incomeMillions of chained (2009) dollars Implicit regional price deflators1
Rochester, NY 49,752 50,082 0.7 46,446 46,377 -0.1 107.1 108.0 0.8Rockford, IL 13,502 13,661 1.2 13,708 13,785 0.6 98.5 99.1 0.6Rocky Mount, NC 5,427 5,512 1.6 5,849 5,962 1.9 92.8 92.4 -0.4Rome, GA 3,435 3,522 2.5 3,929 3,941 0.3 87.4 89.3 2.2Sacramento--Roseville--Arden-Arcade, CA 113,439 117,967 4.0 102,221 104,930 2.6 111.0 112.4 1.3Saginaw, MI 6,879 7,045 2.4 7,102 7,199 1.4 96.9 97.9 1.0St. Cloud, MN 8,085 8,204 1.5 8,045 8,106 0.7 100.5 101.2 0.7St. George, UT 4,915 5,276 7.4 4,789 5,063 5.7 102.6 104.2 1.6St. Joseph, MO-KS 4,522 4,596 1.6 4,720 4,821 2.1 95.8 95.3 -0.5St. Louis, MO-IL 137,260 138,999 1.3 138,583 138,891 0.2 99.0 100.1 1.1Salem, OR 15,273 15,931 4.3 14,773 15,071 2.0 103.4 105.7 2.2Salinas, CA 22,143 22,827 3.1 18,865 19,165 1.6 117.4 119.1 1.4Salisbury, MD-DE 17,512 18,179 3.8 17,857 18,471 3.4 98.1 98.4 0.3Salt Lake City, UT 51,904 54,592 5.2 47,969 49,856 3.9 108.2 109.5 1.2San Angelo, TX 5,200 5,158 -0.8 5,084 4,987 -1.9 102.3 103.4 1.1San Antonio-New Braunfels, TX 105,098 107,594 2.4 102,205 103,488 1.3 102.8 104.0 1.2San Diego-Carlsbad, CA 177,552 183,032 3.1 140,373 142,873 1.8 126.5 128.1 1.3San Francisco-Oakland-Hayward, CA 377,141 396,208 5.1 280,039 288,418 3.0 134.7 137.4 2.0San Jose-Sunnyvale-Santa Clara, CA 165,657 173,429 4.7 120,765 123,855 2.6 137.2 140.0 2.0San Luis Obispo-Paso Robles-Arroyo Grande, CA 14,264 14,552 2.0 12,284 12,336 0.4 116.1 118.0 1.6Santa Cruz-Watsonville, CA 15,912 16,331 2.6 11,812 11,872 0.5 134.7 137.6 2.2Santa Fe, NM 7,515 7,650 1.8 6,938 6,957 0.3 108.3 110.0 1.6Santa Maria-Santa Barbara, CA 24,784 25,007 0.9 20,904 20,719 -0.9 118.6 120.7 1.8Santa Rosa, CA 27,285 28,457 4.3 20,875 21,351 2.3 130.7 133.3 2.0Savannah, GA 16,076 16,420 2.1 15,748 15,920 1.1 102.1 103.1 1.0Scranton--Wilkes-Barre--Hazleton, PA 23,120 23,590 2.0 22,922 23,195 1.2 100.9 101.7 0.8Seattle-Tacoma-Bellevue, WA 234,369 245,231 4.6 195,950 201,354 2.8 119.6 121.8 1.8Sebastian-Vero Beach, FL 10,216 10,381 1.6 10,271 10,282 0.1 99.5 101.0 1.5Sebring, FL 3,200 3,243 1.3 3,610 3,563 -1.3 88.6 91.0 2.7Sheboygan, WI 5,356 5,532 3.3 5,410 5,554 2.7 99.0 99.6 0.6Sherman-Denison, TX 4,873 4,993 2.4 4,903 4,921 0.4 99.4 101.5 2.1Shreveport-Bossier City, LA 20,271 19,763 -2.5 20,622 19,954 -3.2 98.3 99.0 0.7Sierra Vista-Douglas, AZ 4,816 4,900 1.7 4,912 4,962 1.0 98.0 98.8 0.8Sioux City, IA-NE-SD 7,951 8,212 3.3 8,234 8,385 1.8 96.6 97.9 1.3Sioux Falls, SD 13,483 13,925 3.3 13,428 13,672 1.8 100.4 101.9 1.5South Bend-Mishawaka, IN-MI 13,687 14,074 2.8 14,100 14,398 2.1 97.1 97.8 0.7Spartanburg, SC 12,367 12,726 2.9 12,984 13,170 1.4 95.2 96.6 1.5Spokane-Spokane Valley, WA 22,012 23,053 4.7 21,245 21,977 3.4 103.6 104.9 1.3Springfield, IL 9,214 9,314 1.1 9,309 9,285 -0.3 99.0 100.3 1.3Springfield, MA 29,222 29,868 2.2 27,375 27,823 1.6 106.7 107.4 0.7Springfield, MO 16,922 17,211 1.7 17,644 17,785 0.8 95.9 96.8 0.9Springfield, OH 5,020 5,104 1.7 5,259 5,270 0.2 95.5 96.8 1.4State College, PA 6,493 6,625 2.0 5,800 5,850 0.9 112.0 113.3 1.2Staunton-Waynesboro, VA 4,756 4,832 1.6 4,993 5,172 3.6 95.2 93.4 -1.9Stockton-Lodi, CA 28,280 29,684 5.0 26,028 27,041 3.9 108.7 109.8 1.0Sumter, SC 3,974 4,031 1.4 4,160 4,252 2.2 95.5 94.8 -0.7Syracuse, NY 29,110 29,560 1.5 27,667 27,748 0.3 105.2 106.5 1.2Tallahassee, FL 14,279 14,732 3.2 14,059 14,370 2.2 101.6 102.5 0.9Tampa-St. Petersburg-Clearwater, FL 128,804 132,831 3.1 118,596 120,812 1.9 108.6 109.9 1.2Terre Haute, IN 5,837 6,021 3.1 6,123 6,263 2.3 95.3 96.1 0.8Texarkana, TX-AR 5,271 5,377 2.0 5,580 5,572 -0.1 94.5 96.5 2.1The Villages, FL 4,731 4,902 3.6 4,745 4,781 0.8 99.7 102.5 2.8Toledo, OH 25,637 26,302 2.6 26,425 26,921 1.9 97.0 97.7 0.7Topeka, KS 9,921 10,196 2.8 10,205 10,381 1.7 97.2 98.2 1.0Trenton, NJ 23,203 23,462 1.1 19,050 19,126 0.4 121.8 122.7 0.7Tucson, AZ 39,240 40,182 2.4 37,385 38,073 1.8 105.0 105.5 0.5Tulsa, OK 52,841 49,476 -6.4 53,317 49,509 -7.1 99.1 99.9 0.8Tuscaloosa, AL 8,404 8,539 1.6 8,755 8,767 0.1 96.0 97.4 1.5Tyler, TX 11,331 11,232 -0.9 11,076 10,875 -1.8 102.3 103.3 1.0Urban Honolulu, HI 52,318 53,828 2.9 38,613 39,262 1.7 135.5 137.1 1.2Utica-Rome, NY 11,476 11,656 1.6 11,192 11,292 0.9 102.5 103.2 0.7Valdosta, GA 4,671 4,772 2.2 5,277 5,353 1.4 88.5 89.2 0.8Vallejo-Fairfield, CA 19,260 20,316 5.5 15,077 15,680 4.0 127.7 129.6 1.5Victoria, TX 4,597 4,427 -3.7 4,489 4,267 -5.0 102.4 103.8 1.4Vineland-Bridgeton, NJ 5,637 5,746 1.9 5,183 5,215 0.6 108.8 110.2 1.3Virginia Beach-Norfolk-Newport News, VA-NC 80,177 81,198 1.3 75,112 75,248 0.2 106.7 107.9 1.1Visalia-Porterville, CA 16,781 17,366 3.5 16,243 16,691 2.8 103.3 104.0 0.7Waco, TX 9,713 10,013 3.1 9,752 9,920 1.7 99.6 100.9 1.3Walla Walla, WA 2,728 2,812 3.1 2,656 2,697 1.6 102.7 104.3 1.6Warner Robins, GA 7,234 7,454 3.0 7,417 7,648 3.1 97.5 97.5 0.0Washington-Arlington-Alexandria, DC-VA-MD-WV 396,040 409,203 3.3 304,836 311,876 2.3 129.9 131.2 1.0Waterloo-Cedar Falls, IA 7,099 7,138 0.5 7,183 7,127 -0.8 98.8 100.1 1.3Watertown-Fort Drum, NY 5,035 4,983 -1.0 4,669 4,584 -1.8 107.8 108.7 0.8Wausau, WI 5,975 6,112 2.3 6,031 6,090 1.0 99.1 100.4 1.3
THURSDAY, May 17, 2018
2015 2016 Percent change 2015 2016 Percent
change 2015 2016 Percent change
Table 4. Real Personal Income and Implicit Regional Price Deflators by Metropolitan Area, 2015-2016 Personal incomeMillions of dollars
Real personal incomeMillions of chained (2009) dollars Implicit regional price deflators1
Weirton-Steubenville, WV-OH 4,339 4,337 0.0 4,676 4,658 -0.4 92.8 93.1 0.3Wenatchee, WA 4,933 5,148 4.3 4,750 4,909 3.3 103.9 104.9 1.0Wheeling, WV-OH 5,866 5,783 -1.4 6,261 6,111 -2.4 93.7 94.6 1.0Wichita, KS 30,456 30,554 0.3 30,913 30,747 -0.5 98.5 99.4 0.9Wichita Falls, TX 6,410 6,362 -0.8 6,535 6,429 -1.6 98.1 99.0 0.9Williamsport, PA 4,692 4,631 -1.3 4,608 4,535 -1.6 101.8 102.1 0.3Wilmington, NC 11,007 11,435 3.9 10,749 11,114 3.4 102.4 102.9 0.5Winchester, VA-WV 5,746 5,928 3.2 5,768 5,848 1.4 99.6 101.4 1.8Winston-Salem, NC 26,690 27,086 1.5 27,417 27,633 0.8 97.3 98.0 0.7Worcester, MA-CT 46,716 47,951 2.6 41,299 41,996 1.7 113.1 114.2 1.0Yakima, WA 9,687 10,125 4.5 9,442 9,822 4.0 102.6 103.1 0.5York-Hanover, PA 19,879 20,376 2.5 18,838 19,155 1.7 105.5 106.4 0.9Youngstown-Warren-Boardman, OH-PA 21,178 21,320 0.7 22,178 22,112 -0.3 95.5 96.4 0.9Yuba City, CA 6,732 6,965 3.5 6,300 6,509 3.3 106.9 107.0 0.1Yuma, AZ 6,469 6,861 6.1 6,430 6,815 6.0 100.6 100.7 0.1
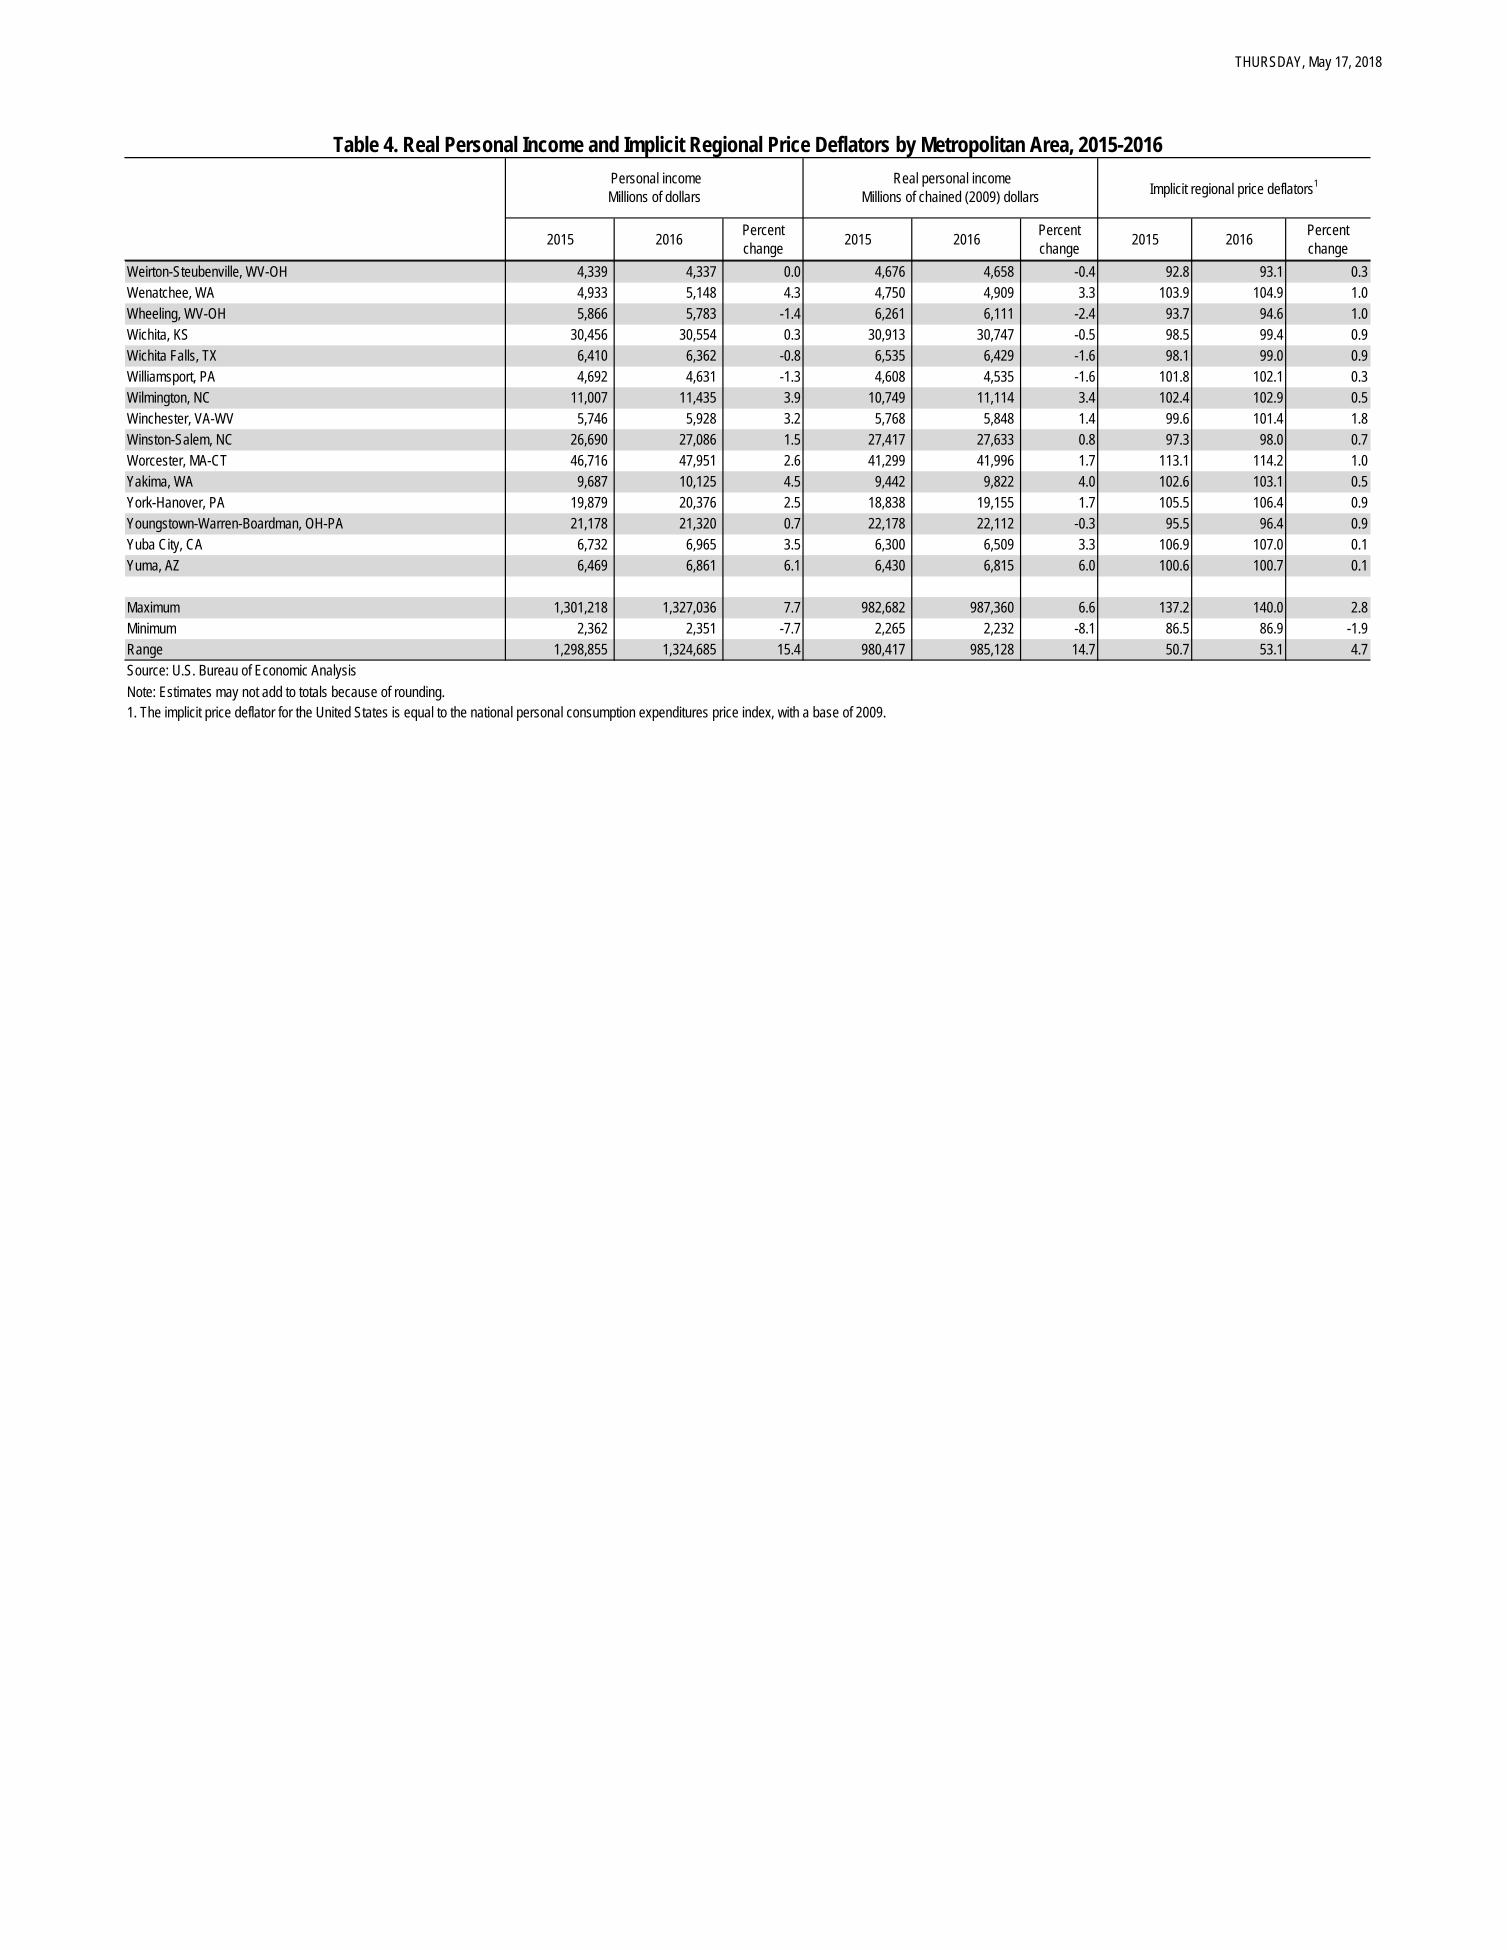
Maximum 1,301,218 1,327,036 7.7 982,682 987,360 6.6 137.2 140.0 2.8Minimum 2,362 2,351 -7.7 2,265 2,232 -8.1 86.5 86.9 -1.9Range 1,298,855 1,324,685 15.4 980,417 985,128 14.7 50.7 53.1 4.7Source: U.S. Bureau of Economic AnalysisNote: Estimates may not add to totals because of rounding.1. The implicit price deflator for the United States is equal to the national personal consumption expenditures price index, with a base of 2009.
THURSDAY, May 17, 2018
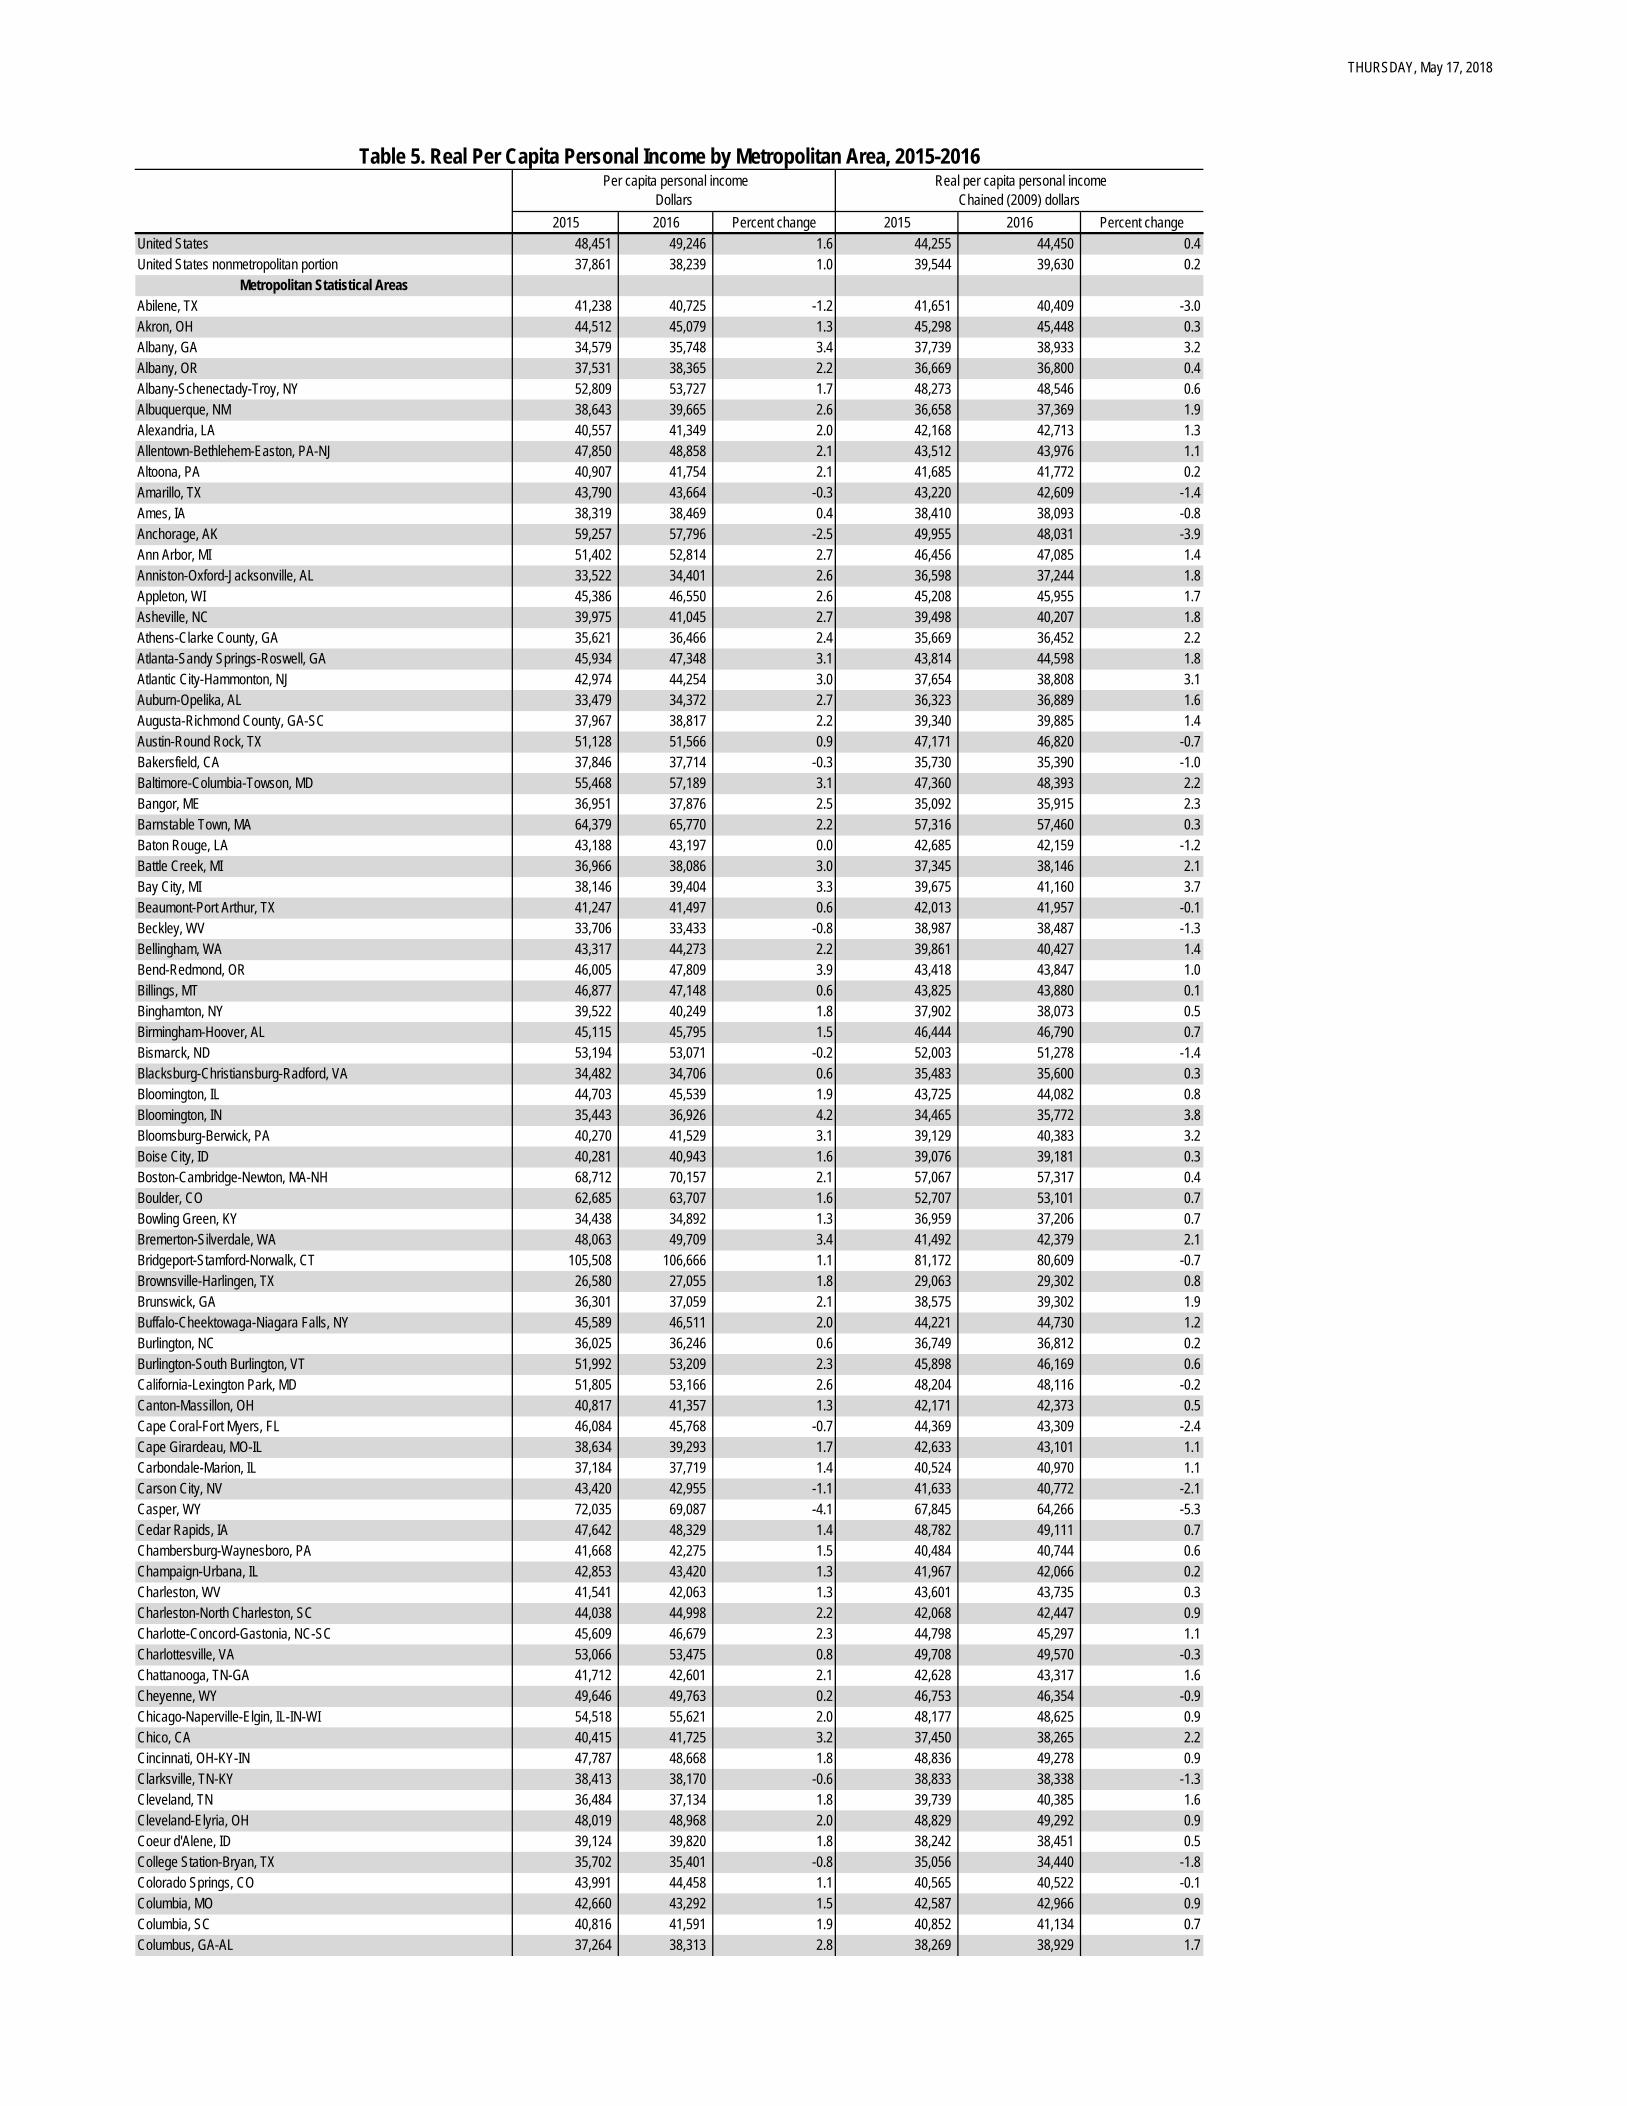
2015 2016 Percent change 2015 2016 Percent changeUnited States 48,451 49,246 1.6 44,255 44,450 0.4United States nonmetropolitan portion 37,861 38,239 1.0 39,544 39,630 0.2
Metropolitan Statistical AreasAbilene, TX 41,238 40,725 -1.2 41,651 40,409 -3.0Akron, OH 44,512 45,079 1.3 45,298 45,448 0.3Albany, GA 34,579 35,748 3.4 37,739 38,933 3.2Albany, OR 37,531 38,365 2.2 36,669 36,800 0.4Albany-Schenectady-Troy, NY 52,809 53,727 1.7 48,273 48,546 0.6Albuquerque, NM 38,643 39,665 2.6 36,658 37,369 1.9Alexandria, LA 40,557 41,349 2.0 42,168 42,713 1.3Allentown-Bethlehem-Easton, PA-NJ 47,850 48,858 2.1 43,512 43,976 1.1Altoona, PA 40,907 41,754 2.1 41,685 41,772 0.2Amarillo, TX 43,790 43,664 -0.3 43,220 42,609 -1.4Ames, IA 38,319 38,469 0.4 38,410 38,093 -0.8Anchorage, AK 59,257 57,796 -2.5 49,955 48,031 -3.9Ann Arbor, MI 51,402 52,814 2.7 46,456 47,085 1.4Anniston-Oxford-Jacksonville, AL 33,522 34,401 2.6 36,598 37,244 1.8Appleton, WI 45,386 46,550 2.6 45,208 45,955 1.7Asheville, NC 39,975 41,045 2.7 39,498 40,207 1.8Athens-Clarke County, GA 35,621 36,466 2.4 35,669 36,452 2.2Atlanta-Sandy Springs-Roswell, GA 45,934 47,348 3.1 43,814 44,598 1.8Atlantic City-Hammonton, NJ 42,974 44,254 3.0 37,654 38,808 3.1Auburn-Opelika, AL 33,479 34,372 2.7 36,323 36,889 1.6Augusta-Richmond County, GA-SC 37,967 38,817 2.2 39,340 39,885 1.4Austin-Round Rock, TX 51,128 51,566 0.9 47,171 46,820 -0.7Bakersfield, CA 37,846 37,714 -0.3 35,730 35,390 -1.0Baltimore-Columbia-Towson, MD 55,468 57,189 3.1 47,360 48,393 2.2Bangor, ME 36,951 37,876 2.5 35,092 35,915 2.3Barnstable Town, MA 64,379 65,770 2.2 57,316 57,460 0.3Baton Rouge, LA 43,188 43,197 0.0 42,685 42,159 -1.2Battle Creek, MI 36,966 38,086 3.0 37,345 38,146 2.1Bay City, MI 38,146 39,404 3.3 39,675 41,160 3.7Beaumont-Port Arthur, TX 41,247 41,497 0.6 42,013 41,957 -0.1Beckley, WV 33,706 33,433 -0.8 38,987 38,487 -1.3Bellingham, WA 43,317 44,273 2.2 39,861 40,427 1.4Bend-Redmond, OR 46,005 47,809 3.9 43,418 43,847 1.0Billings, MT 46,877 47,148 0.6 43,825 43,880 0.1Binghamton, NY 39,522 40,249 1.8 37,902 38,073 0.5Birmingham-Hoover, AL 45,115 45,795 1.5 46,444 46,790 0.7Bismarck, ND 53,194 53,071 -0.2 52,003 51,278 -1.4Blacksburg-Christiansburg-Radford, VA 34,482 34,706 0.6 35,483 35,600 0.3Bloomington, IL 44,703 45,539 1.9 43,725 44,082 0.8Bloomington, IN 35,443 36,926 4.2 34,465 35,772 3.8Bloomsburg-Berwick, PA 40,270 41,529 3.1 39,129 40,383 3.2Boise City, ID 40,281 40,943 1.6 39,076 39,181 0.3Boston-Cambridge-Newton, MA-NH 68,712 70,157 2.1 57,067 57,317 0.4Boulder, CO 62,685 63,707 1.6 52,707 53,101 0.7Bowling Green, KY 34,438 34,892 1.3 36,959 37,206 0.7Bremerton-Silverdale, WA 48,063 49,709 3.4 41,492 42,379 2.1Bridgeport-Stamford-Norwalk, CT 105,508 106,666 1.1 81,172 80,609 -0.7Brownsville-Harlingen, TX 26,580 27,055 1.8 29,063 29,302 0.8Brunswick, GA 36,301 37,059 2.1 38,575 39,302 1.9Buffalo-Cheektowaga-Niagara Falls, NY 45,589 46,511 2.0 44,221 44,730 1.2Burlington, NC 36,025 36,246 0.6 36,749 36,812 0.2Burlington-South Burlington, VT 51,992 53,209 2.3 45,898 46,169 0.6California-Lexington Park, MD 51,805 53,166 2.6 48,204 48,116 -0.2Canton-Massillon, OH 40,817 41,357 1.3 42,171 42,373 0.5Cape Coral-Fort Myers, FL 46,084 45,768 -0.7 44,369 43,309 -2.4Cape Girardeau, MO-IL 38,634 39,293 1.7 42,633 43,101 1.1Carbondale-Marion, IL 37,184 37,719 1.4 40,524 40,970 1.1Carson City, NV 43,420 42,955 -1.1 41,633 40,772 -2.1Casper, WY 72,035 69,087 -4.1 67,845 64,266 -5.3Cedar Rapids, IA 47,642 48,329 1.4 48,782 49,111 0.7Chambersburg-Waynesboro, PA 41,668 42,275 1.5 40,484 40,744 0.6Champaign-Urbana, IL 42,853 43,420 1.3 41,967 42,066 0.2Charleston, WV 41,541 42,063 1.3 43,601 43,735 0.3Charleston-North Charleston, SC 44,038 44,998 2.2 42,068 42,447 0.9Charlotte-Concord-Gastonia, NC-SC 45,609 46,679 2.3 44,798 45,297 1.1Charlottesville, VA 53,066 53,475 0.8 49,708 49,570 -0.3Chattanooga, TN-GA 41,712 42,601 2.1 42,628 43,317 1.6Cheyenne, WY 49,646 49,763 0.2 46,753 46,354 -0.9Chicago-Naperville-Elgin, IL-IN-WI 54,518 55,621 2.0 48,177 48,625 0.9Chico, CA 40,415 41,725 3.2 37,450 38,265 2.2Cincinnati, OH-KY-IN 47,787 48,668 1.8 48,836 49,278 0.9Clarksville, TN-KY 38,413 38,170 -0.6 38,833 38,338 -1.3Cleveland, TN 36,484 37,134 1.8 39,739 40,385 1.6Cleveland-Elyria, OH 48,019 48,968 2.0 48,829 49,292 0.9Coeur d'Alene, ID 39,124 39,820 1.8 38,242 38,451 0.5College Station-Bryan, TX 35,702 35,401 -0.8 35,056 34,440 -1.8Colorado Springs, CO 43,991 44,458 1.1 40,565 40,522 -0.1Columbia, MO 42,660 43,292 1.5 42,587 42,966 0.9Columbia, SC 40,816 41,591 1.9 40,852 41,134 0.7Columbus, GA-AL 37,264 38,313 2.8 38,269 38,929 1.7
Table 5. Real Per Capita Personal Income by Metropolitan Area, 2015-2016 Per capita personal income
Dollars Real per capita personal income
Chained (2009) dollars
THURSDAY, May 17, 2018
2015 2016 Percent change 2015 2016 Percent change
Table 5. Real Per Capita Personal Income by Metropolitan Area, 2015-2016 Per capita personal income
Dollars Real per capita personal income
Chained (2009) dollars
Columbus, IN 45,423 47,386 4.3 47,341 48,413 2.3Columbus, OH 46,904 47,725 1.8 46,335 46,550 0.5Corpus Christi, TX 41,418 41,052 -0.9 40,744 39,868 -2.2Corvallis, OR 41,145 42,245 2.7 37,912 38,220 0.8Crestview-Fort Walton Beach-Destin, FL 47,525 48,274 1.6 45,974 46,223 0.5Cumberland, MD-WV 36,751 37,949 3.3 38,639 39,071 1.1Dallas-Fort Worth-Arlington, TX 51,062 51,099 0.1 46,868 46,270 -1.3Dalton, GA 32,755 33,837 3.3 35,719 36,820 3.1Danville, IL 35,820 36,760 2.6 40,500 41,495 2.5Daphne-Fairhope-Foley, AL 40,640 41,286 1.6 40,974 41,055 0.2Davenport-Moline-Rock Island, IA-IL 44,598 45,116 1.2 45,370 45,402 0.1Dayton, OH 42,837 43,671 1.9 43,561 44,021 1.1Decatur, AL 34,994 35,545 1.6 37,267 38,269 2.7Decatur, IL 44,109 44,507 0.9 46,430 46,932 1.1Deltona-Daytona Beach-Ormond Beach, FL 38,490 39,086 1.5 36,984 37,189 0.6Denver-Aurora-Lakewood, CO 57,081 56,892 -0.3 49,837 48,728 -2.2Des Moines-West Des Moines, IA 49,766 50,677 1.8 48,223 48,657 0.9Detroit-Warren-Dearborn, MI 47,310 48,692 2.9 45,119 46,061 2.1Dothan, AL 36,895 37,803 2.5 40,024 40,780 1.9Dover, DE 37,506 38,498 2.6 36,534 37,012 1.3Dubuque, IA 44,577 45,068 1.1 44,443 44,707 0.6Duluth, MN-WI 41,535 41,857 0.8 42,090 42,055 -0.1Durham-Chapel Hill, NC 48,389 49,315 1.9 46,605 47,024 0.9East Stroudsburg, PA 37,940 39,104 3.1 34,951 36,534 4.5Eau Claire, WI 42,614 42,737 0.3 42,810 42,522 -0.7El Centro, CA 34,256 34,122 -0.4 34,962 34,666 -0.8Elizabethtown-Fort Knox, KY 38,105 38,969 2.3 40,647 41,477 2.0Elkhart-Goshen, IN 39,984 41,712 4.3 40,455 41,982 3.8Elmira, NY 39,426 39,926 1.3 37,972 38,036 0.2El Paso, TX 32,339 32,952 1.9 33,270 33,731 1.4Enid, OK 44,767 44,782 0.0 45,744 44,951 -1.7Erie, PA 40,186 40,764 1.4 39,665 39,919 0.6Eugene, OR 40,259 41,027 1.9 37,760 38,070 0.8Evansville, IN-KY 42,059 43,038 2.3 43,005 43,694 1.6Fairbanks, AK 53,820 53,647 -0.3 46,199 45,663 -1.2Fargo, ND-MN 49,880 50,364 1.0 49,427 49,336 -0.2Farmington, NM 37,682 38,007 0.9 38,240 37,894 -0.9Fayetteville, NC 36,075 36,628 1.5 36,543 36,975 1.2Fayetteville-Springdale-Rogers, AR-MO 56,130 55,729 -0.7 57,363 56,525 -1.5Flagstaff, AZ 41,469 42,057 1.4 38,414 38,958 1.4Flint, MI 36,596 37,675 2.9 36,806 37,806 2.7Florence, SC 36,471 37,158 1.9 39,066 39,436 0.9Florence-Muscle Shoals, AL 35,225 35,832 1.7 38,603 38,629 0.1Fond du Lac, WI 43,940 44,665 1.6 46,024 46,544 1.1Fort Collins, CO 46,119 47,117 2.2 41,700 41,954 0.6Fort Smith, AR-OK 34,219 34,772 1.6 36,824 37,297 1.3Fort Wayne, IN 41,249 42,267 2.5 42,151 42,660 1.2Fresno, CA 39,124 40,101 2.5 37,174 37,793 1.7Gadsden, AL 34,238 34,932 2.0 37,116 38,053 2.5Gainesville, FL 39,714 40,444 1.8 38,555 38,914 0.9Gainesville, GA 38,028 39,065 2.7 39,217 40,054 2.1Gettysburg, PA 45,204 45,853 1.4 42,995 43,292 0.7Glens Falls, NY 41,612 42,639 2.5 39,401 40,159 1.9Goldsboro, NC 36,303 36,950 1.8 38,051 38,619 1.5Grand Forks, ND-MN 45,890 47,573 3.7 44,934 46,306 3.1Grand Island, NE 41,950 42,711 1.8 44,713 45,109 0.9Grand Junction, CO 39,272 39,118 -0.4 38,020 37,749 -0.7Grand Rapids-Wyoming, MI 45,595 46,519 2.0 44,767 45,144 0.8Grants Pass, OR 36,128 37,109 2.7 35,148 36,049 2.6Great Falls, MT 42,157 43,375 2.9 41,483 42,519 2.5Greeley, CO 42,801 42,701 -0.2 39,767 39,083 -1.7Green Bay, WI 45,844 46,362 1.1 46,026 46,199 0.4Greensboro-High Point, NC 40,040 40,663 1.6 40,811 41,082 0.7Greenville, NC 37,116 37,943 2.2 38,642 39,099 1.2Greenville-Anderson-Mauldin, SC 39,609 40,246 1.6 40,489 40,742 0.6Gulfport-Biloxi-Pascagoula, MS 34,342 34,872 1.5 35,228 35,496 0.8Hagerstown-Martinsburg, MD-WV 40,005 40,934 2.3 36,433 36,964 1.5Hammond, LA 35,678 35,833 0.4 38,123 38,115 0.0Hanford-Corcoran, CA 33,237 34,287 3.2 32,784 33,079 0.9Harrisburg-Carlisle, PA 47,947 48,816 1.8 45,497 45,859 0.8Harrisonburg, VA 35,934 36,021 0.2 36,747 36,905 0.4Hartford-West Hartford-East Hartford, CT 58,656 59,343 1.2 53,071 53,048 0.0Hattiesburg, MS 34,520 35,357 2.4 38,333 39,092 2.0Hickory-Lenoir-Morganton, NC 35,787 36,526 2.1 37,483 38,236 2.0Hilton Head Island-Bluffton-Beaufort, SC 46,665 46,876 0.5 45,632 44,971 -1.4Hinesville, GA 31,371 31,717 1.1 31,881 31,866 0.0Homosassa Springs, FL 35,820 36,200 1.1 37,480 37,587 0.3Hot Springs, AR 37,479 38,579 2.9 40,480 41,086 1.5Houma-Thibodaux, LA 44,863 42,190 -6.0 45,044 42,177 -6.4Houston-The Woodlands-Sugar Land, TX 53,859 51,913 -3.6 48,845 46,378 -5.1Huntington-Ashland, WV-KY-OH 36,191 36,509 0.9 38,542 38,527 0.0Huntsville, AL 44,351 45,201 1.9 45,264 45,904 1.4Idaho Falls, ID 39,376 40,365 2.5 40,322 40,797 1.2
THURSDAY, May 17, 2018
2015 2016 Percent change 2015 2016 Percent change
Table 5. Real Per Capita Personal Income by Metropolitan Area, 2015-2016 Per capita personal income
Dollars Real per capita personal income
Chained (2009) dollars
Indianapolis-Carmel-Anderson, IN 48,207 49,681 3.1 47,673 48,602 1.9Iowa City, IA 47,036 47,574 1.1 44,982 45,100 0.3Ithaca, NY 40,742 40,763 0.1 35,286 34,754 -1.5Jackson, MI 36,714 38,331 4.4 37,504 38,812 3.5Jackson, MS 41,936 42,306 0.9 42,699 42,606 -0.2Jackson, TN 36,799 38,301 4.1 41,179 42,362 2.9Jacksonville, FL 44,862 45,468 1.4 42,976 43,091 0.3Jacksonville, NC 44,349 47,517 7.1 43,660 46,514 6.5Janesville-Beloit, WI 39,673 40,477 2.0 39,729 40,050 0.8Jefferson City, MO 39,547 40,044 1.3 43,847 44,237 0.9Johnson City, TN 36,673 37,298 1.7 38,242 38,451 0.5Johnstown, PA 38,436 39,322 2.3 40,840 41,172 0.8Jonesboro, AR 33,499 34,443 2.8 37,604 38,199 1.6Joplin, MO 36,043 36,250 0.6 37,667 37,453 -0.6Kahului-Wailuku-Lahaina, HI 42,798 44,478 3.9 36,609 37,909 3.6Kalamazoo-Portage, MI 42,193 43,394 2.8 42,241 43,158 2.2Kankakee, IL 37,288 38,171 2.4 35,315 35,971 1.9Kansas City, MO-KS 48,394 48,514 0.2 47,250 47,011 -0.5Kennewick-Richland, WA 40,760 42,156 3.4 38,486 39,408 2.4Killeen-Temple, TX 40,200 40,096 -0.3 40,072 39,738 -0.8Kingsport-Bristol-Bristol, TN-VA 36,867 37,406 1.5 39,696 39,872 0.4Kingston, NY 44,212 45,030 1.9 38,883 39,427 1.4Knoxville, TN 40,921 42,102 2.9 42,095 43,185 2.6Kokomo, IN 37,408 38,610 3.2 39,775 40,887 2.8La Crosse-Onalaska, WI-MN 44,743 45,948 2.7 44,323 44,766 1.0Lafayette, LA 42,610 39,572 -7.1 43,941 40,491 -7.9Lafayette-West Lafayette, IN 35,121 36,334 3.5 34,540 35,808 3.7Lake Charles, LA 43,242 44,739 3.5 44,709 46,070 3.0Lake Havasu City-Kingman, AZ 29,355 30,045 2.4 29,161 29,716 1.9Lakeland-Winter Haven, FL 34,028 34,199 0.5 33,623 33,394 -0.7Lancaster, PA 45,106 45,839 1.6 41,633 41,858 0.5Lansing-East Lansing, MI 37,865 39,064 3.2 37,335 38,138 2.2Laredo, TX 29,358 29,426 0.2 30,336 29,970 -1.2Las Cruces, NM 32,390 32,852 1.4 32,454 32,740 0.9Las Vegas-Henderson-Paradise, NV 41,915 42,284 0.9 39,216 39,247 0.1Lawrence, KS 38,831 39,440 1.6 38,330 38,593 0.7Lawton, OK 38,355 38,913 1.5 38,924 39,381 1.2Lebanon, PA 43,295 43,576 0.6 41,581 41,449 -0.3Lewiston, ID-WA 40,003 41,512 3.8 40,487 41,546 2.6Lewiston-Auburn, ME 36,970 38,091 3.0 35,720 36,668 2.7Lexington-Fayette, KY 42,857 42,894 0.1 42,822 42,634 -0.4Lima, OH 37,913 38,872 2.5 39,315 40,481 3.0Lincoln, NE 44,849 45,511 1.5 44,456 44,674 0.5Little Rock-North Little Rock-Conway, AR 41,655 42,582 2.2 42,081 42,717 1.5Logan, UT-ID 32,792 33,780 3.0 33,192 33,661 1.4Longview, TX 41,851 40,488 -3.3 41,983 40,405 -3.8Longview, WA 40,201 41,449 3.1 39,064 39,904 2.2Los Angeles-Long Beach-Anaheim, CA 55,585 57,160 2.8 43,409 44,087 1.6Louisville/Jefferson County, KY-IN 44,588 45,525 2.1 44,865 45,423 1.2Lubbock, TX 38,410 38,658 0.6 37,748 37,626 -0.3Lynchburg, VA 37,184 37,488 0.8 37,547 37,866 0.8Macon-Bibb County, GA 37,766 38,562 2.1 39,917 40,586 1.7Madera, CA 36,365 37,529 3.2 34,894 35,954 3.0Madison, WI 52,546 53,595 2.0 49,429 49,800 0.8Manchester-Nashua, NH 55,129 56,531 2.5 46,753 47,301 1.2Manhattan, KS 40,935 41,852 2.2 40,247 41,168 2.3Mankato-North Mankato, MN 43,177 43,044 -0.3 44,281 43,319 -2.2Mansfield, OH 35,758 36,434 1.9 38,416 38,323 -0.2McAllen-Edinburg-Mission, TX 24,435 24,805 1.5 26,403 26,640 0.9Medford, OR 40,747 41,852 2.7 38,201 38,926 1.9Memphis, TN-MS-AR 42,263 43,498 2.9 42,432 43,378 2.2Merced, CA 36,255 36,804 1.5 35,231 35,501 0.8Miami-Fort Lauderdale-West Palm Beach, FL 51,454 52,210 1.5 44,034 44,037 0.0Michigan City-La Porte, IN 37,037 38,216 3.2 39,519 40,458 2.4Midland, MI 43,145 41,310 -4.3 43,595 40,822 -6.4Midland, TX 111,863 103,517 -7.5 102,175 93,204 -8.8Milwaukee-Waukesha-West Allis, WI 50,650 51,444 1.6 48,610 48,831 0.5Minneapolis-St. Paul-Bloomington, MN-WI 55,599 56,723 2.0 49,894 50,311 0.8Missoula, MT 43,135 44,134 2.3 41,062 41,789 1.8Mobile, AL 35,314 35,951 1.8 36,858 37,318 1.2Modesto, CA 40,305 41,299 2.5 37,731 38,312 1.5Monroe, LA 36,721 37,914 3.2 39,281 40,614 3.4Monroe, MI 41,803 43,263 3.5 40,672 41,788 2.7Montgomery, AL 39,592 40,558 2.4 40,683 41,332 1.6Morgantown, WV 39,338 39,024 -0.8 39,622 38,691 -2.3Morristown, TN 33,413 34,482 3.2 37,814 39,351 4.1Mount Vernon-Anacortes, WA 44,944 46,565 3.6 42,090 43,150 2.5Muncie, IN 33,088 34,452 4.1 34,333 35,993 4.8Muskegon, MI 34,567 35,641 3.1 36,214 36,964 2.1Myrtle Beach-Conway-North Myrtle Beach, SC-NC 34,664 34,993 0.9 35,093 34,876 -0.6Napa, CA 62,832 65,805 4.7 47,365 48,988 3.4Naples-Immokalee-Marco Island, FL 84,523 84,101 -0.5 77,437 75,635 -2.3Nashville-Davidson--Murfreesboro--Franklin, TN 50,747 52,450 3.4 49,621 50,425 1.6

THURSDAY, May 17, 2018
2015 2016 Percent change 2015 2016 Percent change
Table 5. Real Per Capita Personal Income by Metropolitan Area, 2015-2016 Per capita personal income
Dollars Real per capita personal income
Chained (2009) dollars
New Bern, NC 40,403 41,357 2.4 42,802 43,961 2.7New Haven-Milford, CT 51,546 52,603 2.1 42,354 42,855 1.2New Orleans-Metairie, LA 47,893 47,205 -1.4 45,979 44,979 -2.2New York-Newark-Jersey City, NY-NJ-PA 64,679 65,846 1.8 48,846 48,992 0.3Niles-Benton Harbor, MI 42,317 44,007 4.0 43,540 44,886 3.1North Port-Sarasota-Bradenton, FL 51,986 51,931 -0.1 48,272 47,585 -1.4Norwich-New London, CT 53,085 53,885 1.5 48,244 48,409 0.3Ocala, FL 33,950 34,765 2.4 34,530 34,967 1.3Ocean City, NJ 53,209 54,865 3.1 45,831 46,908 2.3Odessa, TX 44,365 41,522 -6.4 41,754 38,918 -6.8Ogden-Clearfield, UT 38,108 39,381 3.3 36,787 37,581 2.2Oklahoma City, OK 45,115 44,646 -1.0 44,996 44,218 -1.7Olympia-Tumwater, WA 44,433 45,932 3.4 38,298 39,000 1.8Omaha-Council Bluffs, NE-IA 52,740 53,613 1.7 51,825 52,066 0.5Orlando-Kissimmee-Sanford, FL 39,337 40,169 2.1 36,907 37,210 0.8Oshkosh-Neenah, WI 42,626 43,641 2.4 43,003 43,451 1.0Owensboro, KY 39,140 39,027 -0.3 41,054 40,687 -0.9Oxnard-Thousand Oaks-Ventura, CA 54,581 55,779 2.2 42,931 43,195 0.6Palm Bay-Melbourne-Titusville, FL 41,157 41,685 1.3 39,647 39,582 -0.2Panama City, FL 39,387 40,130 1.9 38,408 38,848 1.1Parkersburg-Vienna, WV 37,782 37,608 -0.5 40,228 39,276 -2.4Pensacola-Ferry Pass-Brent, FL 39,406 39,984 1.5 38,907 39,298 1.0Peoria, IL 45,573 46,052 1.1 45,721 46,047 0.7Philadelphia-Camden-Wilmington, PA-NJ-DE-MD 57,327 58,589 2.2 49,654 50,209 1.1Phoenix-Mesa-Scottsdale, AZ 41,443 42,218 1.9 39,235 39,455 0.6Pine Bluff, AR 31,096 32,227 3.6 34,316 35,266 2.8Pittsburgh, PA 50,622 51,187 1.1 49,296 49,264 -0.1Pittsfield, MA 50,616 52,288 3.3 48,505 49,342 1.7Pocatello, ID 33,515 34,709 3.6 34,268 35,449 3.4Portland-South Portland, ME 49,440 50,871 2.9 44,608 45,384 1.7Portland-Vancouver-Hillsboro, OR-WA 49,217 50,489 2.6 44,660 45,034 0.8Port St. Lucie, FL 48,879 48,852 -0.1 46,853 45,855 -2.1Prescott, AZ 35,600 36,353 2.1 34,203 34,505 0.9Providence-Warwick, RI-MA 49,097 49,940 1.7 45,177 45,448 0.6Provo-Orem, UT 34,747 36,154 4.0 32,926 33,905 3.0Pueblo, CO 35,326 36,148 2.3 35,443 35,866 1.2Punta Gorda, FL 38,402 38,473 0.2 37,262 36,874 -1.0Racine, WI 44,127 44,813 1.6 43,252 43,624 0.9Raleigh, NC 49,714 50,444 1.5 47,649 47,759 0.2Rapid City, SD 44,647 45,120 1.1 44,799 45,088 0.6Reading, PA 44,933 45,763 1.8 42,861 43,151 0.7Redding, CA 41,044 42,411 3.3 38,631 39,499 2.2Reno, NV 48,912 49,653 1.5 45,610 45,632 0.0Richmond, VA 50,947 51,685 1.4 48,650 48,800 0.3Riverside-San Bernardino-Ontario, CA 35,762 36,807 2.9 30,619 31,088 1.5Roanoke, VA 43,800 44,060 0.6 44,127 44,258 0.3Rochester, MN 48,667 49,844 2.4 47,794 48,190 0.8Rochester, NY 46,012 46,421 0.9 42,954 42,986 0.1Rockford, IL 39,635 40,254 1.6 40,241 40,619 0.9Rocky Mount, NC 36,728 37,412 1.9 39,584 40,471 2.2Rome, GA 35,670 36,470 2.2 40,803 40,818 0.0Sacramento--Roseville--Arden-Arcade, CA 50,026 51,370 2.7 45,079 45,693 1.4Saginaw, MI 35,587 36,630 2.9 36,740 37,429 1.9St. Cloud, MN 41,529 41,931 1.0 41,326 41,430 0.3St. George, UT 31,616 32,924 4.1 30,809 31,594 2.5St. Joseph, MO-KS 35,691 36,314 1.7 37,252 38,093 2.3St. Louis, MO-IL 48,876 49,519 1.3 49,347 49,480 0.3Salem, OR 37,308 38,099 2.1 36,086 36,044 -0.1Salinas, CA 51,256 52,448 2.3 43,668 44,034 0.8Salisbury, MD-DE 44,387 45,424 2.3 45,262 46,154 2.0Salt Lake City, UT 44,458 46,023 3.5 41,087 42,030 2.3San Angelo, TX 43,523 43,004 -1.2 42,547 41,582 -2.3San Antonio-New Braunfels, TX 44,127 44,284 0.4 42,912 42,595 -0.7San Diego-Carlsbad, CA 53,963 55,168 2.2 42,663 43,063 0.9San Francisco-Oakland-Hayward, CA 81,241 84,675 4.2 60,324 61,639 2.2San Jose-Sunnyvale-Santa Clara, CA 84,150 87,643 4.2 61,346 62,590 2.0San Luis Obispo-Paso Robles-Arroyo Grande, CA 50,769 51,442 1.3 43,722 43,607 -0.3Santa Cruz-Watsonville, CA 58,151 59,455 2.2 43,169 43,224 0.1Santa Fe, NM 50,879 51,461 1.1 46,968 46,799 -0.4Santa Maria-Santa Barbara, CA 55,843 56,048 0.4 47,101 46,438 -1.4Santa Rosa, CA 54,409 56,567 4.0 41,627 42,442 2.0Savannah, GA 42,435 42,758 0.8 41,570 41,456 -0.3Scranton--Wilkes-Barre--Hazleton, PA 41,453 42,488 2.5 41,097 41,776 1.7Seattle-Tacoma-Bellevue, WA 62,883 64,553 2.7 52,574 53,003 0.8Sebastian-Vero Beach, FL 69,126 68,491 -0.9 69,493 67,841 -2.4Sebring, FL 32,178 32,135 -0.1 36,305 35,303 -2.8Sheboygan, WI 46,332 47,930 3.4 46,802 48,117 2.8Sherman-Denison, TX 38,820 38,932 0.3 39,052 38,375 -1.7Shreveport-Bossier City, LA 45,642 44,737 -2.0 46,432 45,168 -2.7Sierra Vista-Douglas, AZ 38,105 38,962 2.2 38,865 39,451 1.5Sioux City, IA-NE-SD 47,130 48,553 3.0 48,803 49,577 1.6Sioux Falls, SD 53,526 54,454 1.7 53,309 53,464 0.3South Bend-Mishawaka, IN-MI 42,800 43,880 2.5 44,091 44,889 1.8
THURSDAY, May 17, 2018
2015 2016 Percent change 2015 2016 Percent change
Table 5. Real Per Capita Personal Income by Metropolitan Area, 2015-2016 Per capita personal income
Dollars Real per capita personal income
Chained (2009) dollars
Spartanburg, SC 38,069 38,665 1.6 39,969 40,014 0.1Spokane-Spokane Valley, WA 40,213 41,414 3.0 38,811 39,483 1.7Springfield, IL 43,681 44,350 1.5 44,131 44,209 0.2Springfield, MA 46,374 47,388 2.2 43,443 44,143 1.6Springfield, MO 37,082 37,502 1.1 38,665 38,753 0.2Springfield, OH 36,961 37,866 2.4 38,722 39,100 1.0State College, PA 40,458 41,032 1.4 36,138 36,230 0.3Staunton-Waynesboro, VA 39,479 39,856 1.0 41,449 42,660 2.9Stockton-Lodi, CA 39,087 40,458 3.5 35,975 36,855 2.4Sumter, SC 37,011 37,536 1.4 38,736 39,593 2.2Syracuse, NY 44,105 45,026 2.1 41,919 42,266 0.8Tallahassee, FL 37,794 38,806 2.7 37,212 37,853 1.7Tampa-St. Petersburg-Clearwater, FL 43,352 43,807 1.0 39,917 39,843 -0.2Terre Haute, IN 34,185 35,274 3.2 35,861 36,690 2.3Texarkana, TX-AR 35,175 35,824 1.8 37,235 37,124 -0.3The Villages, FL 39,795 39,534 -0.7 39,911 38,557 -3.4Toledo, OH 42,335 43,458 2.7 43,635 44,481 1.9Topeka, KS 42,476 43,747 3.0 43,689 44,541 2.0Trenton, NJ 62,508 63,237 1.2 51,322 51,548 0.4Tucson, AZ 38,921 39,541 1.6 37,081 37,466 1.0Tulsa, OK 53,894 50,117 -7.0 54,380 50,151 -7.8Tuscaloosa, AL 34,982 35,376 1.1 36,446 36,321 -0.3Tyler, TX 50,933 49,857 -2.1 49,783 48,269 -3.0Urban Honolulu, HI 52,678 54,229 2.9 38,879 39,555 1.7Utica-Rome, NY 38,909 39,672 2.0 37,945 38,434 1.3Valdosta, GA 32,493 32,986 1.5 36,709 36,998 0.8Vallejo-Fairfield, CA 44,345 46,151 4.1 34,713 35,619 2.6Victoria, TX 46,082 44,278 -3.9 45,001 42,678 -5.2Vineland-Bridgeton, NJ 36,314 37,363 2.9 33,388 33,911 1.6Virginia Beach-Norfolk-Newport News, VA-NC 46,521 47,019 1.1 43,582 43,574 0.0Visalia-Porterville, CA 36,621 37,717 3.0 35,446 36,250 2.3Waco, TX 37,023 37,755 2.0 37,170 37,405 0.6Walla Walla, WA 42,560 43,746 2.8 41,437 41,958 1.3Warner Robins, GA 38,479 39,225 1.9 39,452 40,245 2.0Washington-Arlington-Alexandria, DC-VA-MD-WV 65,155 66,733 2.4 50,150 50,861 1.4Waterloo-Cedar Falls, IA 41,591 41,982 0.9 42,079 41,922 -0.4Watertown-Fort Drum, NY 42,937 43,711 1.8 39,818 40,212 1.0Wausau, WI 44,002 45,076 2.4 44,419 44,911 1.1Weirton-Steubenville, WV-OH 36,005 36,366 1.0 38,800 39,056 0.7Wenatchee, WA 42,527 43,748 2.9 40,950 41,723 1.9Wheeling, WV-OH 40,721 40,445 -0.7 43,460 42,743 -1.6Wichita, KS 47,365 47,395 0.1 48,076 47,694 -0.8Wichita Falls, TX 42,578 42,205 -0.9 43,406 42,651 -1.7Williamsport, PA 40,506 40,185 -0.8 39,783 39,352 -1.1Wilmington, NC 39,657 40,466 2.0 38,730 39,333 1.6Winchester, VA-WV 42,920 43,836 2.1 43,084 43,246 0.4Winston-Salem, NC 40,571 40,910 0.8 41,677 41,737 0.1Worcester, MA-CT 50,005 51,242 2.5 44,207 44,878 1.5Yakima, WA 39,042 40,558 3.9 38,055 39,344 3.4York-Hanover, PA 44,983 45,918 2.1 42,627 43,166 1.3Youngstown-Warren-Boardman, OH-PA 38,549 39,137 1.5 40,368 40,591 0.6Yuba City, CA 39,534 40,511 2.5 36,996 37,857 2.3Yuma, AZ 31,755 33,365 5.1 31,567 33,140 5.0
Maximum 111,863 106,666 7.1 102,175 93,204 6.5Minimum 24,435 24,805 -7.5 26,403 26,640 -8.8Range 87,428 81,861 14.6 75,772 66,564 15.3Source: U.S. Bureau of Economic AnalysisNote: Per capita personal income uses Census Bureau midyear population estimates available as of March 2017.

THURSDAY, May 17, 2018
Rents OtherUnited States1 100.0 99.0 101.7 100.1United States nonmetropolitan portion 87.6 93.9 63.8 93.8
Metropolitan Statistical AreasAbilene, TX 91.5 97.1 79.5 93.4Akron, OH 90.0 95.9 76.8 90.9Albany, GA 83.3 97.0 54.8 93.4Albany, OR 94.6 99.4 88.0 94.0Albany-Schenectady-Troy, NY 100.4 98.0 105.1 100.6Albuquerque, NM 96.3 95.4 90.1 102.0Alexandria, LA 87.9 97.3 66.2 93.4Allentown-Bethlehem-Easton, PA-NJ 100.8 98.6 101.5 102.9Altoona, PA 90.7 98.0 64.6 100.6Amarillo, TX 93.0 97.6 83.9 93.4Ames, IA 91.6 92.9 91.5 90.2Anchorage, AK 109.2 102.1 145.6 99.8Ann Arbor, MI 101.8 98.2 114.0 99.3Anniston-Oxford-Jacksonville, AL 83.8 97.9 53.1 93.4Appleton, WI 91.9 97.2 77.8 93.6Asheville, NC 92.6 95.9 87.0 93.5Athens-Clarke County, GA 90.8 97.6 77.7 93.4Atlanta-Sandy Springs-Roswell, GA 96.3 98.3 93.5 95.9Atlantic City-Hammonton, NJ 103.5 101.2 100.8 107.9Auburn-Opelika, AL 84.6 91.3 70.7 93.2Augusta-Richmond County, GA-SC 88.3 97.4 68.7 93.4Austin-Round Rock, TX 100.0 97.9 117.2 93.4Bakersfield, CA 96.7 95.4 91.7 102.0Baltimore-Columbia-Towson, MD 107.2 102.8 116.0 105.2Bangor, ME 95.7 98.0 85.9 100.6Barnstable Town, MA 103.9 98.0 121.1 100.6Baton Rouge, LA 93.0 96.6 86.2 93.4Battle Creek, MI 90.6 97.2 74.5 93.6Bay City, MI 86.9 97.2 61.7 93.6Beaumont-Port Arthur, TX 89.8 97.5 71.1 93.4Beckley, WV 78.8 91.3 54.1 93.2Bellingham, WA 99.4 95.4 103.7 102.0Bend-Redmond, OR 99.0 99.4 105.2 94.0Billings, MT 97.5 95.6 95.0 101.7Binghamton, NY 95.9 98.0 85.4 100.6Birmingham-Hoover, AL 88.8 97.5 68.8 93.4Bismarck, ND 93.9 97.0 87.7 93.4Blacksburg-Christiansburg-Radford, VA 88.5 91.2 79.1 93.3Bloomington, IL 93.8 96.7 87.8 93.2Bloomington, IN 93.7 96.8 89.1 93.3Bloomsburg-Berwick, PA 93.3 98.0 75.4 100.6Boise City, ID 94.8 95.5 83.3 101.8Boston-Cambridge-Newton, MA-NH 111.1 101.4 141.0 107.2Boulder, CO 108.9 100.9 144.5 99.4Bowling Green, KY 85.1 91.1 65.5 93.4Bremerton-Silverdale, WA 106.4 106.3 111.2 104.0Bridgeport-Stamford-Norwalk, CT 120.1 110.5 147.9 116.8Brownsville-Harlingen, TX 83.8 97.9 57.1 93.4Brunswick, GA 85.6 91.3 73.1 93.2Buffalo-Cheektowaga-Niagara Falls, NY 94.4 98.0 78.2 100.6Burlington, NC 89.4 97.9 71.2 93.4Burlington-South Burlington, VT 104.6 98.0 126.3 100.6California-Lexington Park, MD 100.3 91.3 122.3 93.2Canton-Massillon, OH 88.6 97.2 64.9 93.6Cape Coral-Fort Myers, FL 95.9 97.9 96.3 93.4Cape Girardeau, MO-IL 82.7 92.9 63.9 90.2Carbondale-Marion, IL 83.5 92.9 65.9 90.2Carson City, NV 95.6 99.4 91.7 94.0Casper, WY 97.6 95.4 95.2 102.0Cedar Rapids, IA 89.3 96.7 69.5 93.2Chambersburg-Waynesboro, PA 94.2 98.0 77.6 100.6Champaign-Urbana, IL 93.7 96.8 88.5 93.2Charleston, WV 87.3 97.4 61.7 93.4Charleston-North Charleston, SC 96.2 97.9 97.6 93.4Charlotte-Concord-Gastonia, NC-SC 93.5 97.4 86.5 93.4Charlottesville, VA 97.9 96.9 108.7 93.5Chattanooga, TN-GA 89.3 97.6 70.8 93.4Cheyenne, WY 97.4 95.4 94.6 102.0Chicago-Naperville-Elgin, IL-IN-WI 103.8 100.1 114.8 102.2Chico, CA 99.0 95.4 101.6 102.0Cincinnati, OH-KY-IN 89.6 94.6 78.7 90.9Clarksville, TN-KY 90.4 97.6 76.9 93.4Cleveland, TN 83.4 91.3 66.4 93.2Cleveland-Elyria, OH 90.2 95.9 77.9 90.9Coeur d'Alene, ID 94.0 99.4 85.7 94.0College Station-Bryan, TX 93.3 97.2 87.4 93.4Colorado Springs, CO 99.6 95.5 104.8 101.8Columbia, MO 91.4 97.2 77.7 93.6
Services
Table 6. Regional Price Parities by Metropolitan Area, 2016Regional price parities
All items Goods

THURSDAY, May 17, 2018
Rents OtherServices
Table 6. Regional Price Parities by Metropolitan Area, 2016Regional price parities
All items Goods
Columbia, SC 91.8 97.3 80.4 93.4Columbus, GA-AL 89.3 97.8 72.5 93.4Columbus, IN 88.8 92.9 80.8 90.2Columbus, OH 93.0 96.9 84.2 93.4Corpus Christi, TX 93.4 97.6 86.5 93.4Corvallis, OR 100.3 99.4 110.9 94.0Crestview-Fort Walton Beach-Destin, FL 94.8 94.9 96.7 93.6Cumberland, MD-WV 88.1 97.9 66.7 93.4Dallas-Fort Worth-Arlington, TX 100.2 99.0 103.2 99.9Dalton, GA 83.4 91.3 65.9 93.2Danville, IL 80.4 92.9 57.3 90.2Daphne-Fairhope-Foley, AL 91.3 97.9 81.2 93.4Davenport-Moline-Rock Island, IA-IL 90.2 97.1 72.1 93.5Dayton, OH 90.0 97.2 72.1 93.6Decatur, AL 84.3 97.9 53.1 93.4Decatur, IL 86.1 97.2 57.9 93.6Deltona-Daytona Beach-Ormond Beach, FL 95.4 97.9 94.2 93.4Denver-Aurora-Lakewood, CO 106.0 100.8 127.9 99.3Des Moines-West Des Moines, IA 94.5 97.1 90.6 93.5Detroit-Warren-Dearborn, MI 95.9 98.2 86.7 99.3Dothan, AL 84.1 96.5 57.1 93.5Dover, DE 94.4 97.9 90.2 93.4Dubuque, IA 91.5 97.2 77.7 93.6Duluth, MN-WI 90.3 96.9 75.6 93.3Durham-Chapel Hill, NC 95.2 97.7 93.3 93.4East Stroudsburg, PA 97.1 98.0 91.1 100.6Eau Claire, WI 91.2 97.2 76.3 93.6El Centro, CA 89.3 99.4 71.6 94.0Elizabethtown-Fort Knox, KY 85.3 91.3 72.6 93.2Elkhart-Goshen, IN 90.2 97.2 72.7 93.6Elmira, NY 95.3 98.0 82.4 100.6El Paso, TX 88.7 97.8 72.2 93.4Enid, OK 90.4 97.9 73.0 93.4Erie, PA 92.7 98.0 73.4 100.6Eugene, OR 97.8 95.4 96.6 102.0Evansville, IN-KY 89.4 97.2 68.3 93.6Fairbanks, AK 106.6 99.4 147.7 94.0Fargo, ND-MN 92.6 97.2 82.1 93.6Farmington, NM 91.0 99.4 73.3 94.0Fayetteville, NC 89.9 97.3 76.5 93.4Fayetteville-Springdale-Rogers, AR-MO 89.5 97.6 70.3 93.4Flagstaff, AZ 98.0 99.4 101.0 94.0Flint, MI 90.4 98.2 66.8 99.3Florence, SC 85.5 96.4 60.2 93.5Florence-Muscle Shoals, AL 84.2 97.9 52.2 93.4Fond du Lac, WI 87.1 92.9 75.0 90.2Fort Collins, CO 101.9 95.4 117.7 102.0Fort Smith, AR-OK 84.6 97.1 57.1 93.4Fort Wayne, IN 89.9 97.2 70.0 93.6Fresno, CA 96.3 95.4 90.1 102.0Gadsden, AL 83.3 97.9 51.5 93.4Gainesville, FL 94.3 97.6 90.5 93.4Gainesville, GA 88.5 91.3 81.0 93.2Gettysburg, PA 96.1 98.0 85.8 100.6Glens Falls, NY 96.4 98.0 87.2 100.6Goldsboro, NC 86.8 97.9 63.3 93.4Grand Forks, ND-MN 93.2 97.2 85.2 93.6Grand Island, NE 85.9 93.0 67.6 90.3Grand Junction, CO 94.0 99.4 86.4 94.0Grand Rapids-Wyoming, MI 93.5 96.7 87.0 93.2Grants Pass, OR 93.4 99.4 84.2 94.0Great Falls, MT 92.6 95.4 75.2 102.0Greeley, CO 99.2 100.9 96.1 99.4Green Bay, WI 91.1 96.7 76.8 93.1Greensboro-High Point, NC 89.8 97.4 72.6 93.4Greenville, NC 88.1 97.9 67.8 93.4Greenville-Anderson-Mauldin, SC 89.6 97.6 72.0 93.4Gulfport-Biloxi-Pascagoula, MS 89.2 97.9 72.6 93.4Hagerstown-Martinsburg, MD-WV 100.5 105.4 82.2 110.7Hammond, LA 85.3 91.3 71.5 93.2Hanford-Corcoran, CA 94.1 99.4 85.9 94.0Harrisburg-Carlisle, PA 96.6 98.0 87.7 100.6Harrisonburg, VA 88.6 91.3 81.5 93.2Hartford-West Hartford-East Hartford, CT 101.5 98.2 109.3 101.0Hattiesburg, MS 82.1 91.3 64.1 93.2Hickory-Lenoir-Morganton, NC 86.7 97.9 61.1 93.4Hilton Head Island-Bluffton-Beaufort, SC 94.6 91.3 100.1 93.2Hinesville, GA 90.3 91.3 87.3 93.2Homosassa Springs, FL 87.4 91.3 79.5 93.2Hot Springs, AR 85.2 91.3 71.5 93.2Houma-Thibodaux, LA 90.8 97.9 75.3 93.4Houston-The Woodlands-Sugar Land, TX 101.6 96.2 103.2 107.3
THURSDAY, May 17, 2018
Rents OtherServices
Table 6. Regional Price Parities by Metropolitan Area, 2016Regional price parities
All items Goods
Huntington-Ashland, WV-KY-OH 86.0 97.7 58.3 93.4Huntsville, AL 89.4 97.9 68.3 93.4Idaho Falls, ID 89.8 99.4 70.5 94.0Indianapolis-Carmel-Anderson, IN 92.8 97.2 83.0 93.5Iowa City, IA 95.7 96.8 97.7 93.3Ithaca, NY 106.4 98.0 135.6 100.6Jackson, MI 89.6 97.2 70.1 93.6Jackson, MS 90.1 97.4 73.9 93.4Jackson, TN 82.1 91.2 59.8 93.4Jacksonville, FL 95.8 97.8 95.8 93.4Jacksonville, NC 92.7 97.9 85.2 93.4Janesville-Beloit, WI 91.7 97.2 78.3 93.6Jefferson City, MO 82.2 92.9 59.1 90.2Johnson City, TN 88.0 97.9 65.7 93.4Johnstown, PA 86.7 98.0 52.5 100.6Jonesboro, AR 81.8 91.3 62.5 93.2Joplin, MO 87.8 97.2 63.3 93.6Kahului-Wailuku-Lahaina, HI 106.5 99.4 138.3 94.0Kalamazoo-Portage, MI 91.2 97.2 76.8 93.6Kankakee, IL 96.3 100.1 81.2 102.2Kansas City, MO-KS 93.7 96.5 82.4 97.1Kennewick-Richland, WA 97.1 95.4 92.8 102.0Killeen-Temple, TX 91.6 97.6 80.3 93.4Kingsport-Bristol-Bristol, TN-VA 85.1 97.9 56.9 93.4Kingston, NY 103.6 98.0 120.7 100.6Knoxville, TN 88.5 97.1 68.6 93.5Kokomo, IN 85.7 97.2 57.7 93.6La Crosse-Onalaska, WI-MN 93.1 97.2 84.4 93.6Lafayette, LA 88.7 96.7 69.4 93.4Lafayette-West Lafayette, IN 92.1 96.8 82.4 93.2Lake Charles, LA 88.1 97.7 66.7 93.4Lake Havasu City-Kingman, AZ 91.8 95.4 74.0 102.0Lakeland-Winter Haven, FL 92.9 97.9 85.0 93.4Lancaster, PA 99.4 98.0 100.0 100.6Lansing-East Lansing, MI 93.0 97.2 83.7 93.6Laredo, TX 89.1 97.9 72.1 93.4Las Cruces, NM 91.1 95.4 71.6 102.0Las Vegas-Henderson-Paradise, NV 97.8 95.4 96.5 102.0Lawrence, KS 92.7 97.2 83.4 93.6Lawton, OK 89.7 97.1 72.8 93.5Lebanon, PA 95.4 98.0 83.3 100.6Lewiston, ID-WA 90.7 99.4 73.3 94.0Lewiston-Auburn, ME 94.3 98.0 79.7 100.6Lexington-Fayette, KY 91.3 97.9 76.4 93.4Lima, OH 87.1 97.2 61.0 93.6Lincoln, NE 92.5 97.1 81.5 93.4Little Rock-North Little Rock-Conway, AR 90.5 97.7 74.1 93.4Logan, UT-ID 91.1 99.4 74.4 94.0Longview, TX 90.9 96.8 78.1 93.4Longview, WA 94.3 99.4 86.5 94.0Los Angeles-Long Beach-Anaheim, CA 117.7 104.8 165.4 107.4Louisville/Jefferson County, KY-IN 91.0 97.5 75.8 93.4Lubbock, TX 93.2 97.5 85.5 93.4Lynchburg, VA 89.8 97.6 72.7 93.4Macon-Bibb County, GA 86.2 97.0 61.9 93.4Madera, CA 94.7 95.4 84.2 102.0Madison, WI 97.7 96.7 108.6 93.2Manchester-Nashua, NH 108.5 101.2 126.0 106.8Manhattan, KS 92.3 92.9 93.7 90.2Mankato-North Mankato, MN 90.2 92.9 86.5 90.2Mansfield, OH 86.3 97.2 59.5 93.6McAllen-Edinburg-Mission, TX 84.5 97.9 58.2 93.4Medford, OR 97.6 95.4 95.7 102.0Memphis, TN-MS-AR 91.0 97.6 76.7 93.4Merced, CA 94.1 95.4 81.4 102.0Miami-Fort Lauderdale-West Palm Beach, FL 107.6 100.6 129.4 100.9Michigan City-La Porte, IN 85.7 92.9 71.1 90.2Midland, MI 91.8 97.2 78.4 93.6Midland, TX 100.8 97.5 130.2 93.4Milwaukee-Waukesha-West Allis, WI 95.6 95.6 95.1 95.8Minneapolis-St. Paul-Bloomington, MN-WI 102.3 103.9 110.1 96.7Missoula, MT 95.8 99.4 92.5 94.0Mobile, AL 87.4 97.9 65.4 93.4Modesto, CA 97.8 95.4 96.6 102.0Monroe, LA 84.7 97.4 56.6 93.4Monroe, MI 94.0 98.2 79.3 99.3Montgomery, AL 89.1 97.8 70.0 93.4Morgantown, WV 91.5 91.3 90.0 93.2Morristown, TN 79.5 91.3 59.0 93.2Mount Vernon-Anacortes, WA 97.9 99.4 100.8 94.0Muncie, IN 86.9 97.2 64.1 93.6Muskegon, MI 87.5 97.2 63.9 93.6
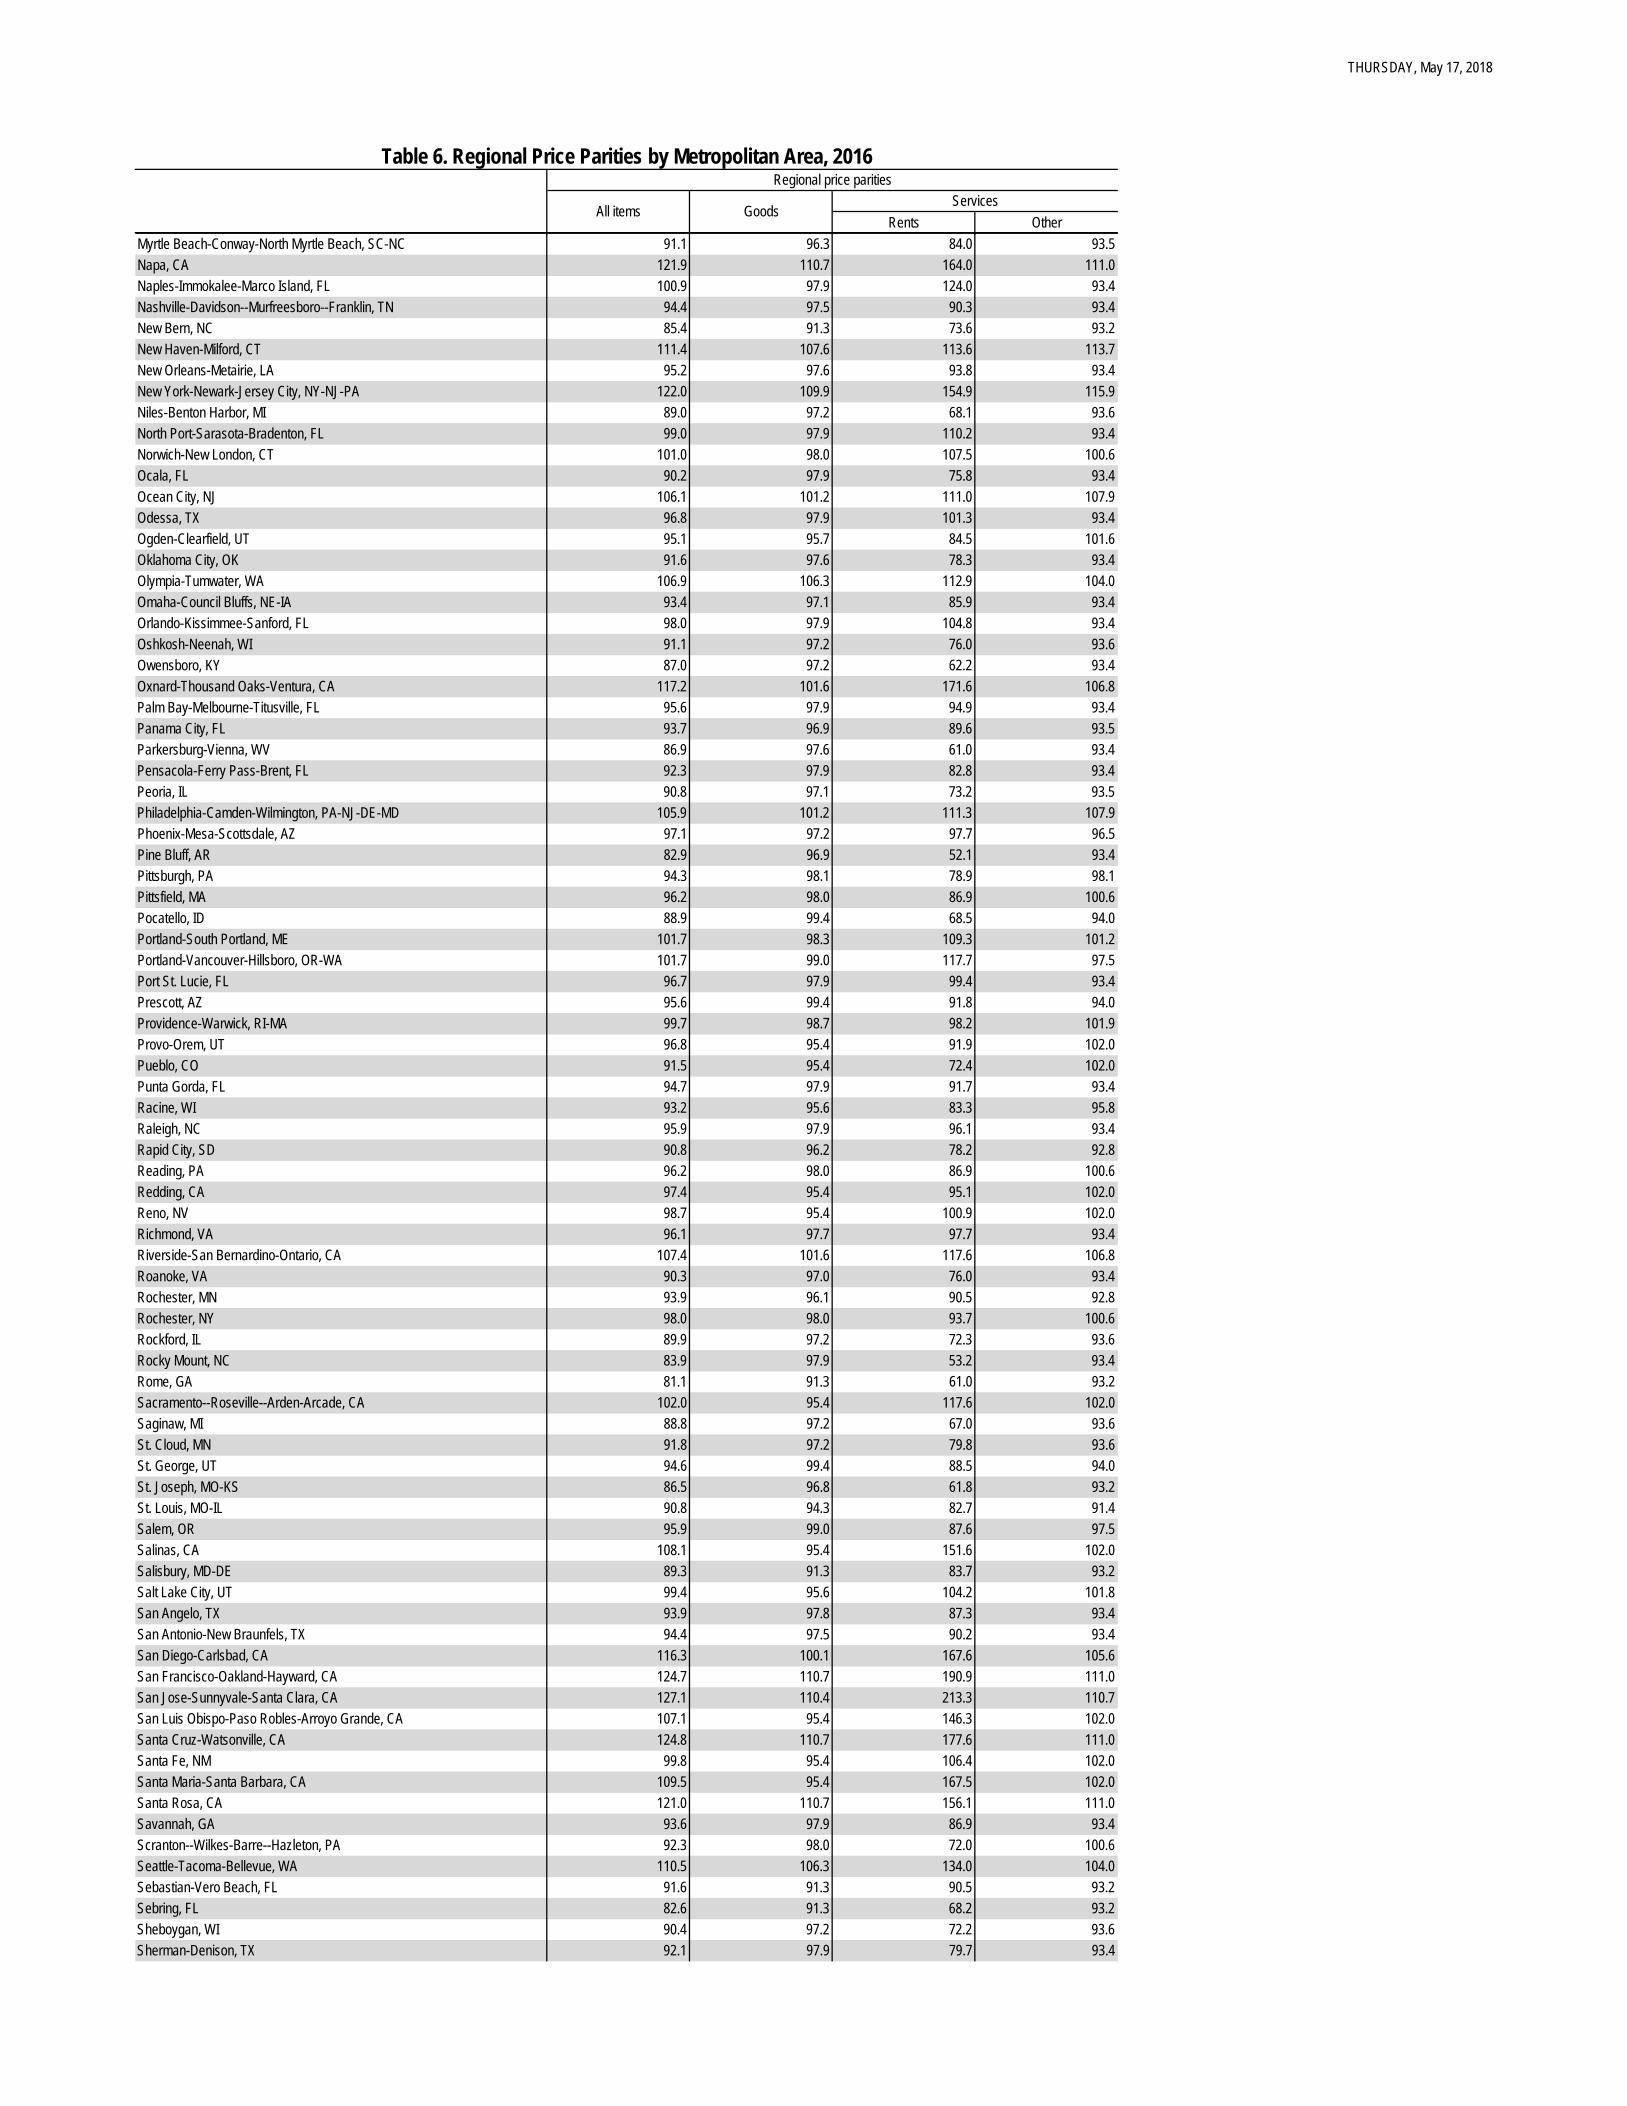
THURSDAY, May 17, 2018
Rents OtherServices
Table 6. Regional Price Parities by Metropolitan Area, 2016Regional price parities
All items Goods
Myrtle Beach-Conway-North Myrtle Beach, SC-NC 91.1 96.3 84.0 93.5Napa, CA 121.9 110.7 164.0 111.0Naples-Immokalee-Marco Island, FL 100.9 97.9 124.0 93.4Nashville-Davidson--Murfreesboro--Franklin, TN 94.4 97.5 90.3 93.4New Bern, NC 85.4 91.3 73.6 93.2New Haven-Milford, CT 111.4 107.6 113.6 113.7New Orleans-Metairie, LA 95.2 97.6 93.8 93.4New York-Newark-Jersey City, NY-NJ-PA 122.0 109.9 154.9 115.9Niles-Benton Harbor, MI 89.0 97.2 68.1 93.6North Port-Sarasota-Bradenton, FL 99.0 97.9 110.2 93.4Norwich-New London, CT 101.0 98.0 107.5 100.6Ocala, FL 90.2 97.9 75.8 93.4Ocean City, NJ 106.1 101.2 111.0 107.9Odessa, TX 96.8 97.9 101.3 93.4Ogden-Clearfield, UT 95.1 95.7 84.5 101.6Oklahoma City, OK 91.6 97.6 78.3 93.4Olympia-Tumwater, WA 106.9 106.3 112.9 104.0Omaha-Council Bluffs, NE-IA 93.4 97.1 85.9 93.4Orlando-Kissimmee-Sanford, FL 98.0 97.9 104.8 93.4Oshkosh-Neenah, WI 91.1 97.2 76.0 93.6Owensboro, KY 87.0 97.2 62.2 93.4Oxnard-Thousand Oaks-Ventura, CA 117.2 101.6 171.6 106.8Palm Bay-Melbourne-Titusville, FL 95.6 97.9 94.9 93.4Panama City, FL 93.7 96.9 89.6 93.5Parkersburg-Vienna, WV 86.9 97.6 61.0 93.4Pensacola-Ferry Pass-Brent, FL 92.3 97.9 82.8 93.4Peoria, IL 90.8 97.1 73.2 93.5Philadelphia-Camden-Wilmington, PA-NJ-DE-MD 105.9 101.2 111.3 107.9Phoenix-Mesa-Scottsdale, AZ 97.1 97.2 97.7 96.5Pine Bluff, AR 82.9 96.9 52.1 93.4Pittsburgh, PA 94.3 98.1 78.9 98.1Pittsfield, MA 96.2 98.0 86.9 100.6Pocatello, ID 88.9 99.4 68.5 94.0Portland-South Portland, ME 101.7 98.3 109.3 101.2Portland-Vancouver-Hillsboro, OR-WA 101.7 99.0 117.7 97.5Port St. Lucie, FL 96.7 97.9 99.4 93.4Prescott, AZ 95.6 99.4 91.8 94.0Providence-Warwick, RI-MA 99.7 98.7 98.2 101.9Provo-Orem, UT 96.8 95.4 91.9 102.0Pueblo, CO 91.5 95.4 72.4 102.0Punta Gorda, FL 94.7 97.9 91.7 93.4Racine, WI 93.2 95.6 83.3 95.8Raleigh, NC 95.9 97.9 96.1 93.4Rapid City, SD 90.8 96.2 78.2 92.8Reading, PA 96.2 98.0 86.9 100.6Redding, CA 97.4 95.4 95.1 102.0Reno, NV 98.7 95.4 100.9 102.0Richmond, VA 96.1 97.7 97.7 93.4Riverside-San Bernardino-Ontario, CA 107.4 101.6 117.6 106.8Roanoke, VA 90.3 97.0 76.0 93.4Rochester, MN 93.9 96.1 90.5 92.8Rochester, NY 98.0 98.0 93.7 100.6Rockford, IL 89.9 97.2 72.3 93.6Rocky Mount, NC 83.9 97.9 53.2 93.4Rome, GA 81.1 91.3 61.0 93.2Sacramento--Roseville--Arden-Arcade, CA 102.0 95.4 117.6 102.0Saginaw, MI 88.8 97.2 67.0 93.6St. Cloud, MN 91.8 97.2 79.8 93.6St. George, UT 94.6 99.4 88.5 94.0St. Joseph, MO-KS 86.5 96.8 61.8 93.2St. Louis, MO-IL 90.8 94.3 82.7 91.4Salem, OR 95.9 99.0 87.6 97.5Salinas, CA 108.1 95.4 151.6 102.0Salisbury, MD-DE 89.3 91.3 83.7 93.2Salt Lake City, UT 99.4 95.6 104.2 101.8San Angelo, TX 93.9 97.8 87.3 93.4San Antonio-New Braunfels, TX 94.4 97.5 90.2 93.4San Diego-Carlsbad, CA 116.3 100.1 167.6 105.6San Francisco-Oakland-Hayward, CA 124.7 110.7 190.9 111.0San Jose-Sunnyvale-Santa Clara, CA 127.1 110.4 213.3 110.7San Luis Obispo-Paso Robles-Arroyo Grande, CA 107.1 95.4 146.3 102.0Santa Cruz-Watsonville, CA 124.8 110.7 177.6 111.0Santa Fe, NM 99.8 95.4 106.4 102.0Santa Maria-Santa Barbara, CA 109.5 95.4 167.5 102.0Santa Rosa, CA 121.0 110.7 156.1 111.0Savannah, GA 93.6 97.9 86.9 93.4Scranton--Wilkes-Barre--Hazleton, PA 92.3 98.0 72.0 100.6Seattle-Tacoma-Bellevue, WA 110.5 106.3 134.0 104.0Sebastian-Vero Beach, FL 91.6 91.3 90.5 93.2Sebring, FL 82.6 91.3 68.2 93.2Sheboygan, WI 90.4 97.2 72.2 93.6Sherman-Denison, TX 92.1 97.9 79.7 93.4

THURSDAY, May 17, 2018
Rents OtherServices
Table 6. Regional Price Parities by Metropolitan Area, 2016Regional price parities
All items Goods
Shreveport-Bossier City, LA 89.9 97.6 72.8 93.4Sierra Vista-Douglas, AZ 89.6 99.4 72.3 94.0Sioux City, IA-NE-SD 88.9 95.7 67.7 92.5Sioux Falls, SD 92.4 97.1 81.2 93.4South Bend-Mishawaka, IN-MI 88.7 96.7 69.6 93.1Spartanburg, SC 87.7 97.5 65.7 93.4Spokane-Spokane Valley, WA 95.2 96.0 85.0 100.9Springfield, IL 91.0 97.2 72.8 93.6Springfield, MA 97.4 98.0 91.9 100.6Springfield, MO 87.8 97.0 66.6 93.4Springfield, OH 87.9 97.2 63.9 93.6State College, PA 102.8 98.0 115.8 100.6Staunton-Waynesboro, VA 84.8 91.3 71.7 93.2Stockton-Lodi, CA 99.6 95.4 104.9 102.0Sumter, SC 86.0 97.9 62.7 93.4Syracuse, NY 96.7 98.0 88.0 100.6Tallahassee, FL 93.0 97.4 85.8 93.4Tampa-St. Petersburg-Clearwater, FL 99.8 96.5 103.5 101.8Terre Haute, IN 87.2 96.9 63.5 93.3Texarkana, TX-AR 87.6 96.7 63.0 93.5The Villages, FL 93.1 91.3 94.3 93.2Toledo, OH 88.7 97.2 66.3 93.6Topeka, KS 89.1 96.5 70.4 93.0Trenton, NJ 111.3 102.6 120.5 114.6Tucson, AZ 95.8 95.4 87.9 102.0Tulsa, OK 90.7 97.7 74.4 93.4Tuscaloosa, AL 88.4 96.6 67.6 93.5Tyler, TX 93.7 97.9 86.8 93.4Urban Honolulu, HI 124.4 114.1 179.6 106.4Utica-Rome, NY 93.7 98.0 75.9 100.6Valdosta, GA 80.9 91.3 62.7 93.2Vallejo-Fairfield, CA 117.6 110.7 138.1 111.0Victoria, TX 94.2 97.5 88.9 93.4Vineland-Bridgeton, NJ 100.0 101.2 88.4 107.9Virginia Beach-Norfolk-Newport News, VA-NC 97.9 97.8 104.9 93.4Visalia-Porterville, CA 94.4 95.4 82.7 102.0Waco, TX 91.6 97.1 78.8 93.5Walla Walla, WA 94.6 99.4 86.9 93.9Warner Robins, GA 88.5 97.2 68.1 93.5Washington-Arlington-Alexandria, DC-VA-MD-WV 119.1 105.4 166.4 110.7Waterloo-Cedar Falls, IA 90.9 96.4 77.0 92.9Watertown-Fort Drum, NY 98.6 98.0 97.1 100.6Wausau, WI 91.1 97.2 73.6 93.6Weirton-Steubenville, WV-OH 84.5 97.2 52.3 93.6Wenatchee, WA 95.2 99.4 89.6 94.0Wheeling, WV-OH 85.9 97.9 57.0 93.4Wichita, KS 90.2 97.0 72.0 93.4Wichita Falls, TX 89.8 97.5 73.0 93.4Williamsport, PA 92.7 98.0 75.0 100.6Wilmington, NC 93.4 97.1 87.7 93.4Winchester, VA-WV 92.0 91.3 91.7 93.2Winston-Salem, NC 89.0 97.9 68.6 93.4Worcester, MA-CT 103.6 101.0 103.7 106.4Yakima, WA 93.6 95.4 77.8 102.0York-Hanover, PA 96.5 98.0 87.6 100.6Youngstown-Warren-Boardman, OH-PA 87.5 97.4 60.9 95.0Yuba City, CA 97.1 95.4 93.6 102.0Yuma, AZ 91.4 95.4 72.7 102.0
Maximum 127.1 114.1 213.3 116.8Minimum 78.8 91.1 51.5 90.2Range 48.3 23.0 161.8 26.6Source: U.S. Bureau of Economic Analysis1. The U.S. all items RPP is the average price level across all metropolitan areas and the U.S. nonmetropolitan portion.