real probability of liquefaction, liquefaction potential...
TRANSCRIPT

ISBN 978-93-84422-56-1
Proceedings of International Conference on Architecture, Structure and Civil Engineering (ICASCE'15)
Antalya (Turkey) Sept. 7-8, 2015 pp. 1-7
Real Probability of Liquefaction, Liquefaction Potential Index Based In CPTU Data for Golem Area, In Albania
Shpresa Gashi1, Neritan Shkodrani
2
1 Department of Geotechnical, Faculty of Civil Engineering, Polytechnic University of Tirana, Tirana, Albania
2 Department of Geotechnical, Faculty of Civil Engineering, Polytechnic University of Tirana, Tirana, Albania.
Abstract: Several authors have studies liquefaction in different approaches like deterministic and probabilistic approach based in situ and laboratory test.
In this article we are going to evaluate the Real Probability of Liquefaction (PR[L]) in Golem area related with the Factor of Safety (FS) computed with the deterministic piezocone penetration test (CPTU)-based model by Juang et al (2008). The real probability of liquefaction is calculated for a given seismic hazard level expressed in terms of acceleration, with the probability of exceeding the same acceleration during the lifespan of engineering structures (usually 50 years). The effects of liquefaction are going to calculate with Liquefaction Potential Index IPL. The computed liquefaction probabilities indicate that during the life span of a structure, the phenomenon may be encountered and it should be taken into consideration during the design stage of the engineering projects.
Keywords: Liquefaction, cone penetration test, probability of liquefaction, liquefaction potential index.
1. Introduction
The simplified procedure for evaluating the liquefaction potential of a soil was created by Seed & Idriss (1971) [1]. Generally speaking, the framework of the analysis with the simplified procedure consists of evaluation of the seismic loading, in the form of the cyclic stress ratio (CSR), and of the soil resistance against liquefaction, in the form of the cyclic resistance ratio (CRR). The liquefaction potential or triggering is then measured with a Factor of Safety (FS=CRR/CSR), in which liquefaction is said to occur if FS<1. In practice, to evaluate CRR correlations with in situ tests data are different tests such as the standard penetration test (SPT), the cone penetration test (CPT), the Becker penetration test (BPT), and shear wave (Vs) measurements. The present study focuses on the use of piezocone penetration tests (CPTU), and thus only CPT-based models proposed by Juang et al (2010) [2] is presented here. For performance-based earthquake engineering (PBEE) design, it is often necessary to determine the probability of liquefaction of a soil at a site in a given exposure time or the Real Probability of Liquefaction (PR [L]). To measure the effect of liquefaction is necessary to calculate Liquefaction Potential Index
IPL. In this study we are going to present the methodology and the result of calculation of FS, (PR[L]) and IPL in the area of Golem where 10 CPTU test where done to conduce this study. The area under study is situated at Golem municipally of Kavaja County, at the central Albanian coast, in Tirana Prefecture. From the seismic point of view this area is located in the Periardiatic Depression, denoted as PL – zone, strongly affected by post– Pliocene compression movements, in direct convergence with Adria microplate. It is characterized by a high seismic activity and according to the seismic hazard map of Albania the second level of hazard represent an earthquake with 10% probability of exceedance in 50 years, or a PGA=0.273g [3]. According to the Albanian earthquakes catalogue, the expected
earthquake surface wave magnitudes (Ms) of the considered area vary from 4.5 – 6.6 [4]. The highest magnitude is
Ms = 6.6 (occurred in year 346 and in the region with coordinates: 41.30 0N; 19.30
0E).The soil behavior type index,
Ic, as defined by Robertson and Wride (1998) [5] is used to identify the soils type and the boundaries of the Ic are indicate in Table 1. The type of soils met in Golem area are silty sands and sandy silt, clay and silty clay.This type of soils are suspected to liquefy when they are in e seismic area and under the ground water table.
http://dx.doi.org/10.17758/UR.U0915316 56
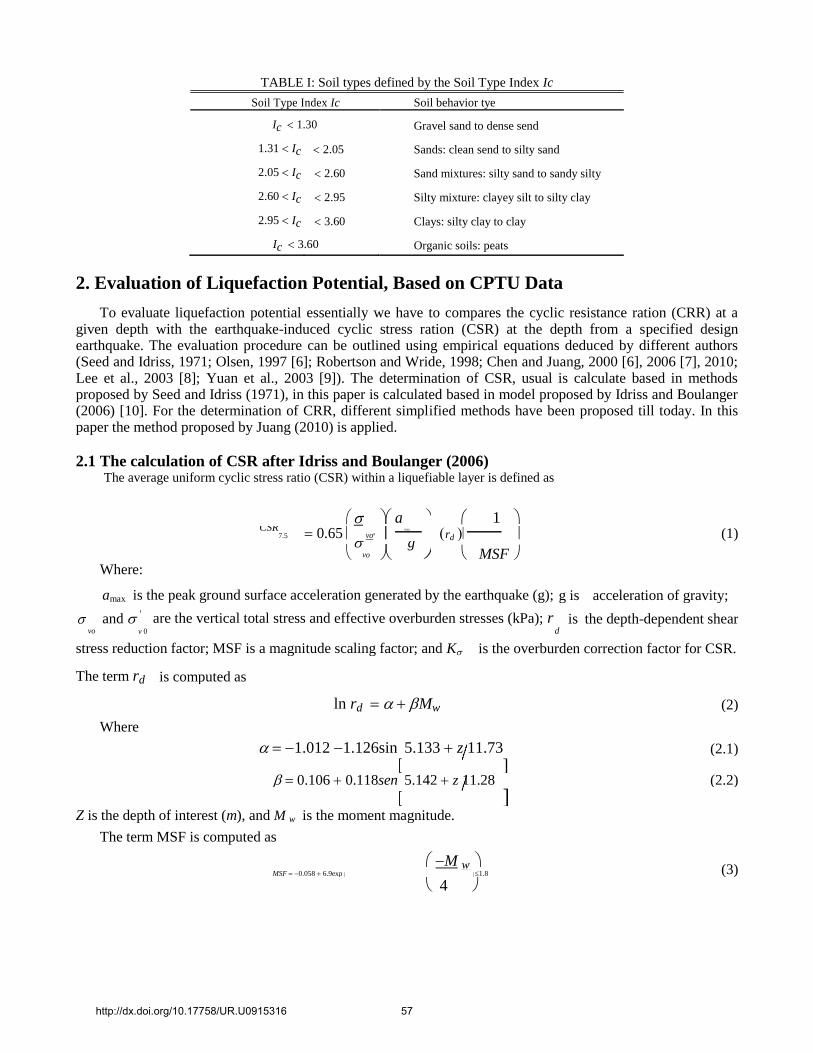
TABLE I: Soil types defined by the Soil Type Index Ic
Soil Type Index Ic Soil behavior tye
Ic 1.30 Gravel sand to dense send
1.31 Ic 2.05 Sands: clean send to silty sand
2.05 Ic 2.60 Sand mixtures: silty sand to sandy silty
2.60 Ic 2.95 Silty mixture: clayey silt to silty clay
2.95 Ic 3.60 Clays: silty clay to clay
Ic 3.60 Organic soils: peats
2. Evaluation of Liquefaction Potential, Based on CPTU Data
To evaluate liquefaction potential essentially we have to compares the cyclic resistance ration (CRR) at a given depth with the earthquake-induced cyclic stress ration (CSR) at the depth from a specified design earthquake. The evaluation procedure can be outlined using empirical equations deduced by different authors (Seed and Idriss, 1971; Olsen, 1997 [6]; Robertson and Wride, 1998; Chen and Juang, 2000 [6], 2006 [7], 2010; Lee et al., 2003 [8]; Yuan et al., 2003 [9]). The determination of CSR, usual is calculate based in methods proposed by Seed and Idriss (1971), in this paper is calculated based in model proposed by Idriss and Boulanger (2006) [10]. For the determination of CRR, different simplified methods have been proposed till today. In this paper the method proposed by Juang (2010) is applied. 2.1 The calculation of CSR after Idriss and Boulanger (2006)
The average uniform cyclic stress ratio (CSR) within a liquefiable layer is defined as
a 1 CSR
7.5 0.65
vo' max
rd
(1)
vo g MSF
Where:
amax is the peak ground surface acceleration generated by the earthquake (g); g is acceleration of gravity;
vo
and ' are the vertical total stress and effective overburden stresses (kPa); r is the depth-dependent shear
v 0 d
stress reduction factor; MSF is a magnitude scaling factor; and K is the overburden correction factor for CSR.
The term rd is computed as
ln rd Mw (2)
Where
1.012 1.126sin 5.133 z 11.73 (2.1)
0.106 0.118sen 5.142 z 11.28 (2.2)
Z is the depth of interest (m), and M w is the moment magnitude.
The term MSF is computed as
M w (3) MSF 0.058 6.9exp 1.8
4
http://dx.doi.org/10.17758/UR.U0915316 57

2.2 The calculation of CRR after Juang (2000, 2006, 2010) Cyclic resistance ratio (CRR) in the CPTU-based model is a function of two derived CPTU parameters, the
adjustment cone tip resistance qt1N and the soil behaviour type index I .In the present study the parameter
qt 1N is defined by Robertson (2009 a) [11] and Ic, BJ is defined by Been and Jefferies (1992)
[12]. CRR after Juang 2010 has the following equation:
q c
CRR 0.05 exp A B t 1N (4)
100
Where
A I c , BJ qt 1N 100 14.7 (4.1) (4.1)
B 0.909 I 3 7.47 I 19.28 (4.2)
c , BJ c ,BJ
C 0.059 0.015I 2 (4.3)
c ,BJ
Ic, BJ defined by Been and Jefferies (1992) is
I 3 log Q 1 B 1 2 1.5 1.3
log F
2 (4.4)
c , BJ 10 t q 10 r
qt 1N defined by Robertson (1998) is
q q v 0
P P '
n (4.5)
t 1 N t a a v0
n 0.381I
c , RW
0.05 ' P 0.5
n 1 (4.6)
v 0 a
I c , BW
3.47 log Q 2 1.22 log F 2 (4.7)
10 t 10 R
Where
qc is cone resistance; qt is corrected resistance ( qc 1 a u2 ); a is the area ratio of the cone used (in this
paper, a=0.85); u2 is penetration pore pressure (kPa); Bq is pore pressure parameter = u2 u0 qt v 0 ; u0 is
hydrostatic water pressure (kPa); Qt is normalized cone resistance qt v 0 v' 0 ; R f is friction
ratio f s qc 100% ; Fr is normalised friction ratio f s qt v 0 100% ; Pa= atmospheric pressure (≈100
kPa). 2.3 Calculation of Factor of Safety (FS)
After determine CSR and CRR we can calculate FS which after Lee et al., 2003 is:
FS CRR CSR7.5 (5)
A soil is predicted to liquefy if FS 1.2 (Sonmez, 2003) [13].
3. Probability Calculation
The real probability of liquefaction, PR L, is the probability of liquefaction during the lifespan of an engineering structure for different levels of safety, corresponding to different seismic hazard levels. For a given
hazard seismic level, PR L is calculated by combining the conditional probability of liquefaction for the
corresponding acceleration, PR L PGA a , with the probability of occurrence of the scenario causing the
exceedance of this accerelation PR PGA a.
c, BJ
http://dx.doi.org/10.17758/UR.U0915316 58
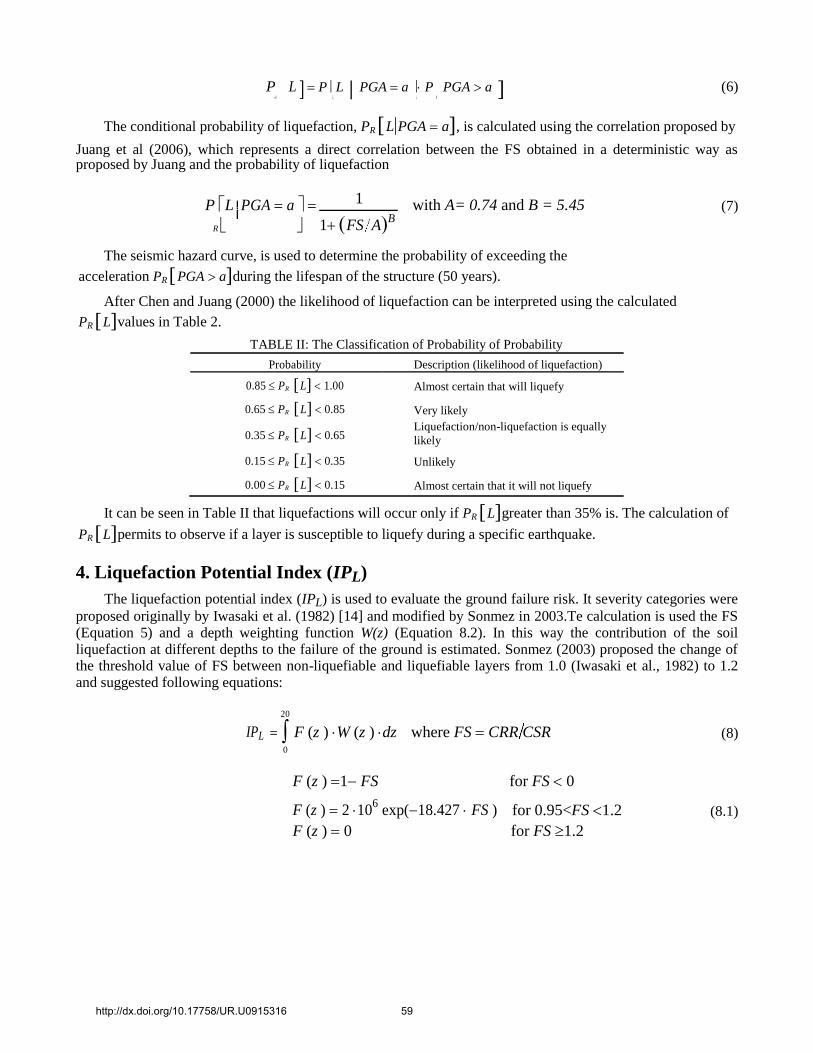
P L P L PGA a P PGA a (6)
R
The conditional probability of liquefaction, PR L PGA a, is calculated using the correlation proposed by Juang et al (2006), which represents a direct correlation between the FS obtained in a deterministic way as proposed by Juang and the probability of liquefaction
P L
PGA a 1 with A= 0.74 and B = 5.45 (7)
R
1 FS AB
The seismic hazard curve, is used to determine the probability of exceeding the
acceleration PR PGA aduring the lifespan of the structure (50 years).
After Chen and Juang (2000) the likelihood of liquefaction can be interpreted using the calculated
PR Lvalues in Table 2.
TABLE II: The Classification of Probability of Probability
Probability Description (likelihood of liquefaction)
0.85 PR L 1.00 Almost certain that will liquefy
0.65 PR L 0.85 Very likely
0.35 PR L 0.65 Liquefaction/non-liquefaction is equally
likely
0.15 PR L 0.35 Unlikely
0.00 PR L 0.15 Almost certain that it will not liquefy
It can be seen in Table II that liquefactions will occur only if PR Lgreater than 35% is. The calculation of
PR Lpermits to observe if a layer is susceptible to liquefy during a specific earthquake.
4. Liquefaction Potential Index (IPL)
The liquefaction potential index (IPL) is used to evaluate the ground failure risk. It severity categories were
proposed originally by Iwasaki et al. (1982) [14] and modified by Sonmez in 2003.Te calculation is used the FS (Equation 5) and a depth weighting function W(z) (Equation 8.2). In this way the contribution of the soil liquefaction at different depths to the failure of the ground is estimated. Sonmez (2003) proposed the change of the threshold value of FS between non-liquefiable and liquefiable layers from 1.0 (Iwasaki et al., 1982) to 1.2 and suggested following equations:
20
IPL F (z ) W (z ) dz where FS CRR CSR (8)
0
F (z ) 1 FS for FS 0
F (z ) 2 106 exp(18.427 FS ) for 0.95<FS 1.2 (8.1)
F (z ) 0 for FS 1.2
http://dx.doi.org/10.17758/UR.U0915316 59

qc (MPa) Ic (MPa) FS P[L|PGA=a]% IPL %
0 4 8 12 16 1 2 3 4 0 0.6 1.2 1.8 2.4 3 3.6 0 35 70 105140175 0 15 30 45 60
0 0 0 0 0
1 GW=1.7 m
1
1
1
1
2 2 2 2 2
3 3 3 3 3
4 4 4 4 4
5 5 5 5 5
6 6 6 6 6
7 7 7 7 7
8 8 8 8 8
9 9 9 9 9
10 10 10 10 10
11 11 11 11 11
12 12 12 12 12
13 13 13 13 13
14 14 14 14 14
Cone tip resistance Soil Type Index Factor of Safety Real Probability of Liquefaction
(Mpa ) Liquefaction Potential Index
(Robertson and Wride, 1998) ( Lee et al., 2003) (Juang et al., 2006) (Sonmez, 2003)
Fig. 2: Liquefaction evaluation for Golem area, BH.2
qc (MPa) Ic (MPa) FS P[L|PGA=a]% IPL %
0 4 8 12 16 1 2 3 4 0 0.6 1.2 1.8 2.4 3 3.6 0 35 70 105140175 0 15 30 45 60
0 0 0 0 0
1 GW=1.2 m 1
1 1
2 2 2 2 2
3 3 3 3 3
4 4 4 4 4
5 5 5 5 5
6 6 6 6 6
7 7 7 7 7
8 8 8 8 8
9 9 9 9 9
10 10 10 10 10
11 11 11 11 11
Cone tip resistance Soil Type Index Factor of Safety Real Probability of Liquefaction
(Mpa ) Liquefacti Potential Index (Robertson and Wride, 1998) ( Lee et al., 2003) (Juang et al., 2006) (Sonmez, 2003)
Fig. 2: Liquefaction evaluation for Golem area, BH.8
http://dx.doi.org/10.17758/UR.U0915316 60

W (z ) 10 0.5 z , for 0 z 20m
W (z ) 0, for z 20m (8.2)
z depth (m)
To interpret the obtained values of IPL (Equation 8), a classification proposed by Iwasaki (1982) and
modified by Sonmez (2003) is used. In Table 3 liquefaction potential categories are presented. TABLE III: Liquefaction potential classification proposed by Sonmes (2003)
Liquefaction Potential Index IPL Liquefaction potential category 0 Non-liquefiable (based on FS 1.2 )
0 IPL 2 Low
2 IPL 5 Moderate
5 IPL 15 High
IPL 15 Very high
5. Results
The detailed lithological profiles based on the soil Behavior Type Index Ic for two represented borehole for
Golem area are shown in Fig. 1 and Fig.2. The dashed line green, in Fig.1 and Fig.2, corresponded to a value of Ic 2.8 .This value represents the uppermost limit below which the liquefaction assessment is necessary, Yuang
et al., 2003.In Fig.1 where Ic 2.8 are two intervals to calculate about the liquefaction potential. The first
interval is 0.72-7.97 m depth with 1.31 Ic 2.05 (Sandy to silty sand) and the second interval 7.97-12.78 m
depth with 2.05 Ic 2.60 (Silty sand & sandy silty). In Fig.2 almost in all penetration depth Ic 2.8 . There are
two interval where1.31 Ic 2.05 (Sandy to silty sand).The first one is 0.0-6.46m depth, and the second one is
7.14-10 m depth. The interval where 2.05 Ic 2.60 (Silty sand & sandy silty) is 6.46-7.14 m depth. Factor of Safety, FS<1.2(the dashed line red) is for two interval. In Fig.1 in the interval 8.5-12.7 m depth and the second interval is 3.8-8.2 m depth in Fig.2.
The conditional probability of liquefaction PR L PGA a show that in generally the susceptible layers is
liquefiable. According to the value in Table 2, in Fig.1 for the interval 8.5-12.7 where P[ L PGA a] 100 the
liquefaction is “almost certain that will liquefy”. In the Fig.2 P[ L PGA a] 100 P[ L PGA a] 100 the
liquefaction is “almost certain that will liquefy” for the interval of depth 3.8-8 m depth. Liquefaction potential index that evaluate the ground failure risk has a value >15, that means “very high risk” in the same interval for both Fig1, and Fig.2 where FS<1.2.
6. Conclusions
The Factor of Safety, the conditional probability value obtained for the given seismic hazard level indicate that in generally the liquefaction is almost certain to happen. The liquefaction probabilities attempt such values requiring to consideration of the phenomenon during the design of engineering projects especially because this is an important area of truism of the sea coast line in Albanian. Since this type of soils are met along the coast line of Adriatic Sea a study like this is very important in a large scale.
7. References [1] Seed H.B. & Idriss I.M. (1971), “Simplified procedures for evaluating soil liquefaction potential”, Journal of
Geotechnical. Engineering Division, ASCE, 97 (9), 1249-1273.(Periodical style)
http://dx.doi.org/10.17758/UR.U0915316 61

[2] Juang C.H., Ku C.S., C.C Chen (2010), “Simplified model for evaluating soil liquefaction potential using CPTU”, Proceeding CPT’ 10. (Published Conference Proceedings style)
[3] Sulstarova E., Kociaj S. & Aliaj SH. (1980), “Seismic Regionalization of PSR of Albania”. Publication of Academy
of Sciences, Tirana-Albania. (Book style) [4] Aliaj Sh., Kociaj S. & Muço B., Sulstarova Sh. (2010, “Seismic Regionalization of PSR of Albania”. Publication of
Academy of Sciences, Tirana-Albania, 22. (Book style) [5] Robertson P.K. & Wride C. (1998), “Evaluating cyclic liquefaction potential using the cone penetration test”.
Canadian Geotechnical Journal, 35, 442-459N. Kawasaki, “Parametric study of thermal and chemical non equilibrium nozzle flow,” M.S. thesis, Dept. Electron. Eng., Osaka Univ., Osaka, Japan, 1993. (Periodical style)
[6] Olsen, R.S. (1997), “cyclic liquefaction based on the cone penetration test”. In: Youd, T.L. and Idriss, I.M. (Eds.), Proceedings of the NCEER Workshop of Evaluation of Liquefaction Resistance of Soils, State University of New York at Buffalo, Buffalo, NY, 225-276. (Published Conference Proceedings style)
[7] Juang C.H., Fang S.Y., Khor E.H. (2006), “First order reliability method for probabilistic liquefaction triggering
analyses using CPT”, Journal of Geotechnical and Geoenvironmental Engineering, 132, 3, 337-350.( Periodical style) http://dx.doi.org/10.1061/(ASCE)1090-0241(2006)132:3(337)
[8] Lee, D.-H., Ku, C.-S, Yuan, H., 2003, “A study of the liquefaction risk potential at Yuanlin, Taiwan”,
Engineering Geology, 71, pp. 97-117. ( Periodical style)
http://dx.doi.org/10.1016/S0013-7952(03)00128-5 [9] Yuan, H., Yang, S.H., Andrus, R.D., Juang, C.H., 2003, “Liquefaction-induced ground failure: a study of the Chi-Chi
earthquake cases, Engineering Geology 17, pp. 141-155. ( Periodical style) [10] Idriss, I. M. & Boulanger, R. W. (2006), “Semi-empirical procedures for evaluating liquefaction potential
during earthquakes”. Soil Dynamic. Earthquake Engineering 26, No. 2–4, 115–130. ( Periodical style) [11] Robertson, P. K. (2009a), “Performance based earthquake design using the CPT”. Proc. IS-Tokyo 2009, Tokyo, 3–20.
(Published Conference Proceedings style) http://dx.doi.org/10.1201/noe0415556149.ch1
[12] Jefferies, M. G. & Been, K. (2006). “Soil liquefaction”: A critical state approach. New York, NY, USA: Taylor &
Francis.
http://dx.doi.org/10.4324/9780203301968 [13] Sonmez, H., 2003, “Modification to the liquefaction potential index and liquefaction susceptibility mapping for a
liquefaction-prone area (Inegol-Turkey)”, Environmental Geology, 44 (7), pp. 862-871. ( Periodical style) http://dx.doi.org/10.1007/s00254-003-0831-0 [14] Iwasaki, T., Arakawa, T., Tokida, K., 1982, “Simplified procedures for assessing soil liquefaction during earthquakes”.
Proceedings of the Conference on Soil Dynamics and Earthquake Engineering, Southampton, UK, pp. 925-939. (Published Conference Proceedings style)
http://dx.doi.org/10.17758/UR.U0915316 62