real time breath analysis using portable gas
TRANSCRIPT

metabolites
H
OH
OH
Article
Real Time Breath Analysis Using Portable Gas Chromatographyfor Adult Asthma Phenotypes
Ruchi Sharma 1,†, Wenzhe Zang 1,†, Menglian Zhou 1, Nicole Schafer 2, Lesa A. Begley 2, Yvonne J. Huang 2,* andXudong Fan 1,*
�����������������
Citation: Sharma, R.; Zang, W.;
Zhou, M.; Schafer, N.; Begley, L.A.;
Huang, Y.J.; Fan, X. Real Time Breath
Analysis Using Portable Gas
Chromatography for Adult Asthma
Phenotypes. Metabolites 2021, 11, 265.
https://doi.org/10.3390/
metabo11050265
Academic Editor: Peter Meikle
Received: 13 March 2021
Accepted: 22 April 2021
Published: 23 April 2021
Publisher’s Note: MDPI stays neutral
with regard to jurisdictional claims in
published maps and institutional affil-
iations.
Copyright: © 2021 by the authors.
Licensee MDPI, Basel, Switzerland.
This article is an open access article
distributed under the terms and
conditions of the Creative Commons
Attribution (CC BY) license (https://
creativecommons.org/licenses/by/
4.0/).
1 Department of Biomedical Engineering, University of Michigan, Ann Arbor, MI 48109, USA;[email protected] (R.S.); [email protected] (W.Z.); [email protected] (M.Z.)
2 Division of Pulmonary and Critical Care Medicine, Department of Internal Medicine, University of Michigan,Ann Arbor, MI 48109, USA; [email protected] (N.S.); [email protected] (L.A.B.)
* Correspondence: [email protected] (Y.J.H.); [email protected] (X.F.)† These authors contributed equally to this work.
Abstract: Asthma is heterogeneous but accessible biomarkers to distinguish relevant phenotypesremain lacking, particularly in non-Type 2 (T2)-high asthma. Moreover, common clinical character-istics in both T2-high and T2-low asthma (e.g., atopy, obesity, inhaled steroid use) may confoundinterpretation of putative biomarkers and of underlying biology. This study aimed to identify volatileorganic compounds (VOCs) in exhaled breath that distinguish not only asthmatic and non-asthmaticsubjects, but also atopic non-asthmatic controls and also by variables that reflect clinical differ-ences among asthmatic adults. A total of 73 participants (30 asthma, eight atopic non-asthma, and35 non-asthma/non-atopic subjects) were recruited for this pilot study. A total of 79 breath sampleswere analyzed in real-time using an automated portable gas chromatography (GC) device developedin-house. GC-mass spectrometry was also used to identify the VOCs in breath. Machine learning,linear discriminant analysis, and principal component analysis were used to identify the biomarkers.Our results show that the portable GC was able to complete breath analysis in 30 min. A set of ninebiomarkers distinguished asthma and non-asthma/non-atopic subjects, while sets of two and of fourbiomarkers, respectively, further distinguished asthmatic from atopic controls, and between atopicand non-atopic controls. Additional unique biomarkers were identified that discriminate subjectsby blood eosinophil levels, obese status, inhaled corticosteroid treatment, and also acute upperrespiratory illnesses within asthmatic groups. Our work demonstrates that breath VOC profilingcan be a clinically accessible tool for asthma diagnosis and phenotyping. A portable GC system is aviable option for rapid assessment in asthma.
Keywords: asthma; exhaled breath; portable gas chromatography; precision medicine
1. Introduction
Asthma is a chronic inflammatory airway disease characterized by reversible airflowobstruction and episodic symptoms of wheezing and shortness of breath. However, asthmais clinically heterogeneous and while many phenotypes have been described, the mech-anisms for most remain poorly understood. Type 2 (T2) -high asthma, linked to allergicinflammation, is the best understood endophenotype, defined by elevated Type 2 immuneresponses (e.g., eosinophilia and increased exhaled nitric oxide, etc.) and a better responseto treatments like inhaled corticosteroids (ICS) and biologics targeting Type 2 cytokines [1].In contrast, T2-low asthma represents a constellation of other phenotypes characterizedby diminished or absent Type 2 inflammation, although atopy may still co-exist. Non-eosinophilic asthma may characterize up to 50% of asthmatic adults based on sputumeosinophil assessment [2,3]. Further understanding of T2-low asthma and identifyingrelevant biomarkers that inform underlying biology is of great interest; there currently areno treatments that target specific phenotypes of T2-low asthma.
Metabolites 2021, 11, 265. https://doi.org/10.3390/metabo11050265 https://www.mdpi.com/journal/metabolites

Metabolites 2021, 11, 265 2 of 15
Non-invasive approaches to investigate asthma biology are attractive because theydecrease burden on research participants and may lead to the identification of clinicallyuseful and deployable biomarkers. Breath analysis has increasingly been used to identifydiscriminatory patterns of exhaled compounds associated with asthma and other airwaydiseases [4,5]. To date, measurement of exhaled nitric oxide (FeNO) is the only suchbiomarker validated for clinical use [6] and is largely reflective of Type 2 inflammation,correlating with greater atopy and allergic inflammation [7]. Applications of electronic nose(eNose) technologies have demonstrated their ability to distinguish asthmatic from healthysubjects, as well as predict some clinical features including atopic status [8], circulatinginflammatory patterns [9], and loss of asthma control [10]. However, eNose identifiescomposite signature patterns without direct ascertainment of the contributory chemicalcompounds. Identifying the specific exhaled metabolites associated with particular featuresof asthma would offer insights into potential biology contributing to that phenotypefor further study. For example, a recent large study used gas chromatography-massspectrometry (GC-MS) to identify specific exhaled compounds that distinguish eosinophilicfrom neutrophilic asthma, as defined by sputum cell counts [11]. More such studiesare needed to elucidate exhaled metabolites that may serve as surrogate markers forother clinically important asthma phenotypes and also in different populations to informclinical validity.
In this pilot study, we aimed to address some of these gaps by exploring in our U.S.-based adult cohort whether exhaled breath metabolites, measured by our portable GCsystem are capable to distinguish asthmatic from non-asthmatic/non-atopic and atopic non-asthmatic (atopic control) subjects. We also hypothesized that exhaled breath metaboliteswould discriminate subjects by blood eosinophil levels, obese status, and asthmatics oninhaled corticosteroid (ICS) treatments or experiencing an upper respiratory illness withinasthmatic groups. With the detection, identification, and statistical analysis of the exhaledbreath VOCs, we demonstrate the application of a portable GC system as a potential aid toasthma clinical diagnosis and therapeutic monitoring.
2. Results2.1. Clinical Cohort
Asthmatic and non-asthmatic subjects were enrolled in a prospective observationalstudy at the University of Michigan (CAARS; NCT02887911; clinicaltrials.gov (accessed on26 March 2021), Bethesda, MD, USA) and provided written informed consent to participatein a longitudinal component of the study (MICROMAAP) entailing subsequent quarterlyvisits for a year. The study protocols were approved by the University of MichiganInstitutional Review Board (HUM00097163 and HUM00136068). Subjects underwentdetailed baseline assessments as previously described [12], including asthma and allergyhistory questionnaires and lung function testing (spirometry, methacholine challenge, andbronchodilator reversibility). Asthma diagnosis was confirmed by spirometry with positivemethacholine challenge and/or bronchodilator reversibility, performed according to theAmerican Thoracic Society/European Respiratory Society guidelines [13,14]. Exclusioncriteria included significant smoking history (>10 pack-years) and acute lower respiratoryillness, asthma exacerbation and/or systemic antibiotic use within 8 weeks of the baselinestudy visit. Blood was collected for complete blood count with differential cell analysisand determination of atopic sensitization to common respiratory allergens (specific IgE to16 aeroallergens; Phadia ImmunoCAP). Presence of at least one positive specific IgE onthis panel was considered evidence of atopy. Induced sputum was collected by inhalationof 3% saline for 12 min and used to determine sputum inflammatory cell counts. Assummarized in Table 1, a total of 73 participants contributed 79 total breath samples.These included 30 asthma, 8 atopic non-asthma, and 35 non-asthma/non-atopic subjectsevaluated between June 2018 and February 2020. All breath samples from MICROMAAPsubjects were collected during study visits during the morning hours; study subjects hadfasted overnight except for taking medications with water or using their prescribed inhaled

Metabolites 2021, 11, 265 3 of 15
therapies. Some exhaled air samples from control subjects (non-asthma/non-atopic) werecollected from colleagues (33 breath samples) after informing them about the study andobtaining verbal consent. Three asthma patients who later developed upper respiratoryillness and one asthma patient who took ICS treatment were respectively sampled twiceover the course of regular study visits that occurred quarterly or in the setting of subsequentupper respiratory illness. For the latter scenario, asthma subjects returned for a study visitwithin one week of symptom onset for additional sample and data collection.
A total of 79 breath chromatograms were analyzed. Detailed description of theportable GC device and its operation can be found in Section 4, and Section S1 in theSupplementary Materials. After chromatogram pre-processing (see Section 4 and SectionS2 in the Supplementary Materials), approximately 90 peaks can be detected in each breathchromatogram (Figure 1). Collectively, there were a total of 103 different peaks in the79 chromatograms, although some of the 103 peaks could contain co-eluted VOCs. Finally,through machine learning, linear discriminant analysis (LDA), and principal componentanalysis (PCA) were used for biomarker selection and statistical analyses (see details inSection S3 in the Supplementary Materials).
Metabolites 2021, 11, x FOR PEER REVIEW 4 of 14
Figure 1. Representative GC chromatogram from an asthma patient (A) and a non-asthma/non-atopic (B). The blue lines and numbers mark the peak positions of the identified biomarkers listed in Tables 2 and 3.
2.2. Biomarkers to Distinguish Asthma and Non-Asthma Not all peaks may be relevant to asthma, since some peaks may be from normal met-
abolic activities, other conditions that a patient may have, or exogenous factors (indoor air background, smoking, and use of consumer products, etc.) [15]. Therefore, it is critical to determine which subset of the peaks is most responsible for the differences observed between asthma and non-asthma groups. For selecting the optimal subset of peaks (i.e., biomarkers), 45 chromatograms from asthma and non-asthma/non-atopic were used as the training set, whereas the remaining 26 chromatograms were used as the testing set. As detailed in Section S3 of the Supplementary Materials, optimal peak subset (peak ID: 7, 32, 50, 51, 69, 73, 80, 85, 93 listed in Table 2) is identified through LDA, which yields the maximum classification accuracy of 94.4% and the maximum boundary distance to dis-tinguish asthma and non-asthma. Those biomarkers are mainly from alkane families (see Table 3), some of which are same as or similar to biomarkers previously reported, such as Compound 32 (Heptane, 2,4-dimethyl), Compound 50 (Heptane, 2,2,4-trimethyl), Com-pound 51 (Octane, 3,3-dimethyl), Compound 69 (Heptane, 2,3,5-trimethyl-), Compound 73 (Decane, 2,4,6-trimethyl), and Compound 93 (Decane, 2,6,6-trimethyl) [16–23]. The de-tails of the biomarker discovery process can be found in Section S3 of the Supplementary Materials. Figure 2 shows the PC plot of the training and the combined (training and test-ing) set. The corresponding statistics are given in Table S3.
Figure 1. Representative GC chromatogram from an asthma patient (A) and a non-asthma/non-atopic (B). The blue linesand numbers mark the peak positions of the identified biomarkers listed in Tables 2 and 3.

Metabolites 2021, 11, 265 4 of 15
Table 1. Summary of recruited subjects, the total number of breath samples collected and number available for each clinical characteristic analyzed. # post-albuterol, mean ± standarddeviation. FEV1, forced expiratory volume in 1 s % predicted; ICS, inhaled corticosteroid; BMI, body-mass index.
Category Non-Asthma,Non-Atopic
Non-Asthma,Atopic
Asthma
Total FEV1/FVC # FEV1(% pred) # ICSTreatment
No ICSTreatment
Obese(BMI ≥ 30)
Non-Obese(BMI < 30)
BloodEosinophils ≥
0.3 × 10⁹/L
BloodEosinophils< 0.3 × 10⁹/L
UpperRespiratory
Illness
No UpperRespiratory Illness
Number of subjects 35 8 300.78 ± 0.12 97.7 ± 18.7
20 13 17 17 17 17 3Same 3 subjects asthose with upperrespiratory illness
Number of breathsamples analyzed 37 8 34 21 13 17 17 17 17 3 3
Age, yrs(range)
40.9(23–71)
29.4(19–43)
40.2(18–72)
Sex, % female 75 50 69
Metabolites 2021, 11, 265 5 of 15
2.2. Biomarkers to Distinguish Asthma and Non-Asthma
Not all peaks may be relevant to asthma, since some peaks may be from normalmetabolic activities, other conditions that a patient may have, or exogenous factors (indoorair background, smoking, and use of consumer products, etc.) [15]. Therefore, it is criticalto determine which subset of the peaks is most responsible for the differences observedbetween asthma and non-asthma groups. For selecting the optimal subset of peaks (i.e.,biomarkers), 45 chromatograms from asthma and non-asthma/non-atopic were used asthe training set, whereas the remaining 26 chromatograms were used as the testing set.As detailed in Section S3 of the Supplementary Materials, optimal peak subset (peak ID:7, 32, 50, 51, 69, 73, 80, 85, 93 listed in Table 2) is identified through LDA, which yieldsthe maximum classification accuracy of 94.4% and the maximum boundary distance todistinguish asthma and non-asthma. Those biomarkers are mainly from alkane families(see Table 3), some of which are same as or similar to biomarkers previously reported, suchas Compound 32 (Heptane, 2,4-dimethyl), Compound 50 (Heptane, 2,2,4-trimethyl), Com-pound 51 (Octane, 3,3-dimethyl), Compound 69 (Heptane, 2,3,5-trimethyl-), Compound73 (Decane, 2,4,6-trimethyl), and Compound 93 (Decane, 2,6,6-trimethyl) [16–23]. Thedetails of the biomarker discovery process can be found in Section S3 of the SupplementaryMaterials. Figure 2 shows the PC plot of the training and the combined (training andtesting) set. The corresponding statistics are given in Table S3.
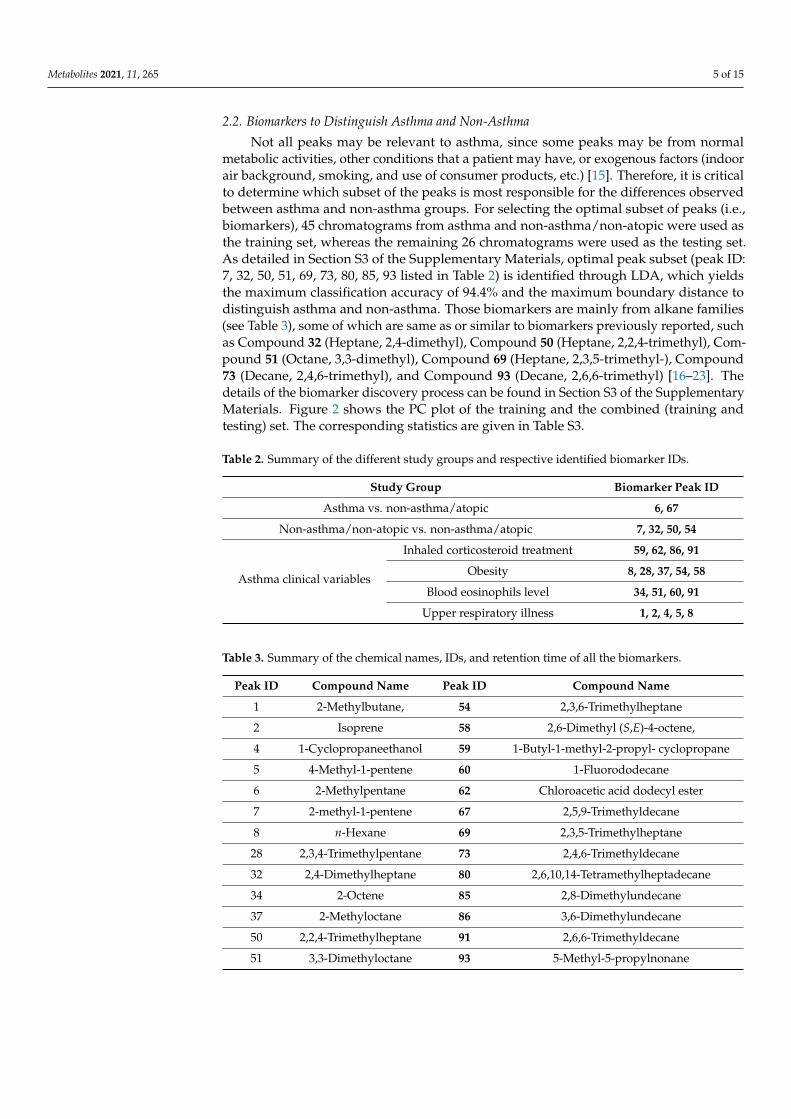
Table 2. Summary of the different study groups and respective identified biomarker IDs.
Study Group Biomarker Peak ID
Asthma vs. non-asthma/atopic 6, 67
Non-asthma/non-atopic vs. non-asthma/atopic 7, 32, 50, 54
Asthma clinical variables
Inhaled corticosteroid treatment 59, 62, 86, 91
Obesity 8, 28, 37, 54, 58
Blood eosinophils level 34, 51, 60, 91
Upper respiratory illness 1, 2, 4, 5, 8
Table 3. Summary of the chemical names, IDs, and retention time of all the biomarkers.
Peak ID Compound Name Peak ID Compound Name
1 2-Methylbutane, 54 2,3,6-Trimethylheptane
2 Isoprene 58 2,6-Dimethyl (S,E)-4-octene,
4 1-Cyclopropaneethanol 59 1-Butyl-1-methyl-2-propyl- cyclopropane
5 4-Methyl-1-pentene 60 1-Fluorododecane
6 2-Methylpentane 62 Chloroacetic acid dodecyl ester
7 2-methyl-1-pentene 67 2,5,9-Trimethyldecane
8 n-Hexane 69 2,3,5-Trimethylheptane
28 2,3,4-Trimethylpentane 73 2,4,6-Trimethyldecane
32 2,4-Dimethylheptane 80 2,6,10,14-Tetramethylheptadecane
34 2-Octene 85 2,8-Dimethylundecane
37 2-Methyloctane 86 3,6-Dimethylundecane
50 2,2,4-Trimethylheptane 91 2,6,6-Trimethyldecane
51 3,3-Dimethyloctane 93 5-Methyl-5-propylnonane

Metabolites 2021, 11, 265 6 of 15
Metabolites 2021, 11, x FOR PEER REVIEW 5 of 14
Table 2. Summary of the different study groups and respective identified biomarker IDs.
Study Group Biomarker Peak ID Asthma vs. non-asthma/atopic 6, 67
Non-asthma/non-atopic vs. non-asthma/atopic 7, 32, 50, 54
Asthma clinical
variables
Inhaled corticosteroid treatment 59, 62, 86, 91 Obesity 8, 28, 37, 54, 58
Blood eosinophils level 34, 51, 60, 91 Upper respiratory illness 1, 2, 4, 5, 8
Table 3. Summary of the chemical names, IDs, and retention time of all the biomarkers.
Peak ID Compound Name Peak ID Compound Name 1 2-Methylbutane, 54 2,3,6-Trimethylheptane 2 Isoprene 58 2,6-Dimethyl (S,E)-4-octene,
4 1-Cyclopropaneethanol 59 1-Butyl-1-methyl-2-propyl- cyclopropane
5 4-Methyl-1-pentene 60 1-Fluorododecane 6 2-Methylpentane 62 Chloroacetic acid dodecyl ester 7 2-methyl-1-pentene 67 2,5,9-Trimethyldecane 8 n-Hexane 69 2,3,5-Trimethylheptane 28 2,3,4-Trimethylpentane 73 2,4,6-Trimethyldecane 32 2,4-Dimethylheptane 80 2,6,10,14-Tetramethylheptadecane 34 2-Octene 85 2,8-Dimethylundecane 37 2-Methyloctane 86 3,6-Dimethylundecane 50 2,2,4-Trimethylheptane 91 2,6,6-Trimethyldecane 51 3,3-Dimethyloctane 93 5-Methyl-5-propylnonane
Figure 2. PCA plots using the optimal 9-peak subset (9 biomarkers) for distinguishing asthma from non-asthma/non-atopic subjects. (A) Training set. (B) Training set plus testing set. Asthma and non-asthma/non-atopic are denoted as red circles and black crosses, respectively. The yellow line marks the position of the boundary. The peak IDs and their chemical names of the nine biomarkers can be found in Table 2.
2.3. Biomarkers to Distinguish Atopic Subjects Figure S7 shows how the PCA plot would look like for asthma, non-asthma/non-
atopic, and non-asthma atopic subjects if we used only the nine aforementioned bi-omarkers (i.e., peak IDs: 7, 32, 50, 51, 69, 73, 80, 85, 93 in Table 2). The distribution of the atopic subjects was found to be biased on the asthma side, implying that the pattern of these nine biomarkers from the atopic subjects look more like asthma. Given that atopy is
Figure 2. PCA plots using the optimal 9-peak subset (9 biomarkers) for distinguishing asthma from non-asthma/non-atopicsubjects. (A) Training set. (B) Training set plus testing set. Asthma and non-asthma/non-atopic are denoted as red circlesand black crosses, respectively. The yellow line marks the position of the boundary. The peak IDs and their chemical namesof the nine biomarkers can be found in Table 2.
2.3. Biomarkers to Distinguish Atopic Subjects
Figure S7 shows how the PCA plot would look like for asthma, non-asthma/non-atopic, and non-asthma atopic subjects if we used only the nine aforementioned biomarkers(i.e., peak IDs: 7, 32, 50, 51, 69, 73, 80, 85, 93 in Table 2). The distribution of the atopicsubjects was found to be biased on the asthma side, implying that the pattern of these ninebiomarkers from the atopic subjects look more like asthma. Given that atopy is a commonunderlying feature in asthma, this is unsurprising. Thus, using those nine biomarkers alone,it was difficult to distinguish between asthma and atopic, and between non-asthma/non-atopic and non-asthma/atopic subjects. Therefore, new sets of biomarkers may be neededfor further classification.
In this study, all of the eight non-asthma/atopic subjects were used in the trainingset (due to the limited number of subjects), along with another eight randomly selectedasthma subjects and eight non-asthma/non-atopic subjects. The remaining asthma subjectsand asthma/non-atopic subjects were used as the testing set for validation. The PCAplots are presented in Figure 3, showing significant improvement in distinguishing atopyfrom asthma and from non-asthma/non-atopic. Two new biomarkers (peak IDs: 6, 67)yielded the maximum classification accuracy of 90.5% and the maximum boundary dis-tance for the discrimination between asthma and non-asthma/atopic subjects. Four otherbiomarkers (peak IDs: 7, 32, 50, 54) gave the maximum classification accuracy of 93.2%with the maximum boundary distance to distinguish the non-asthma/atopic from thenon-asthma/non-atopic group. The corresponding statistics are given in Table S4. Basedon the above discussion, atopic subjects can be identified through two steps. First, thenine biomarkers (7, 32, 50, 51, 69, 73, 80, 85, 93) are applied to separate out “asthma” and“non-asthma/non-atopic” (note that non-asthma/atopic subjects might be mis-classifiedas asthma or non-asthma/non-atopic in this step as shown in Figure S7). Then two newsets of biomarkers (6, 67) and (7, 32, 50, and 54) are used to further identify atopic from the“asthma” group and “non-asthma/non-atopic” group, respectively.
Metabolites 2021, 11, 265 7 of 15
Metabolites 2021, 11, x FOR PEER REVIEW 6 of 14
a common underlying feature in asthma, this is unsurprising. Thus, using those nine bi-omarkers alone, it was difficult to distinguish between asthma and atopic, and between non-asthma/non-atopic and non-asthma/atopic subjects. Therefore, new sets of bi-omarkers may be needed for further classification.
In this study, all of the eight non-asthma/atopic subjects were used in the training set (due to the limited number of subjects), along with another eight randomly selected asthma subjects and eight non-asthma/non-atopic subjects. The remaining asthma sub-jects and asthma/non-atopic subjects were used as the testing set for validation. The PCA plots are presented in Figure 3, showing significant improvement in distinguishing atopy from asthma and from non-asthma/non-atopic. Two new biomarkers (peak IDs: 6, 67) yielded the maximum classification accuracy of 90.5% and the maximum boundary dis-tance for the discrimination between asthma and non-asthma/atopic subjects. Four other biomarkers (peak IDs: 7, 32, 50, 54) gave the maximum classification accuracy of 93.2% with the maximum boundary distance to distinguish the non-asthma/atopic from the non-asthma/non-atopic group. The corresponding statistics are given in Table S4. Based on the above discussion, atopic subjects can be identified through two steps. First, the nine bi-omarkers (7, 32, 50, 51, 69, 73, 80, 85, 93) are applied to separate out “asthma” and “non-asthma/non-atopic” (note that non-asthma/atopic subjects might be mis-classified as asthma or non-asthma/non-atopic in this step as shown in Figure S7). Then two new sets of biomarkers (6, 67) and (7, 32, 50, and 54) are used to further identify atopic from the “asthma” group and “non-asthma/non-atopic” group, respectively.
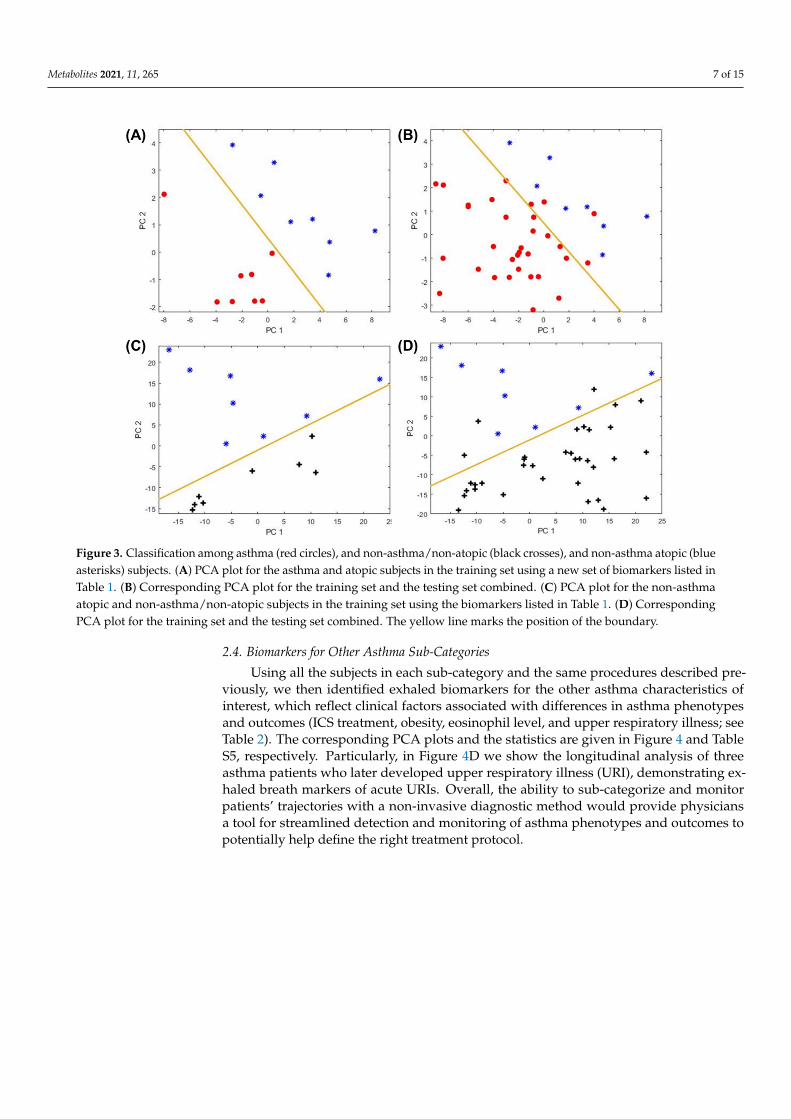
Figure 3. Classification among asthma (red circles), and non-asthma/non-atopic (black crosses), and non-asthma atopic (blue asterisks) subjects. (A) PCA plot for the asthma and atopic subjects in the training set using a new set of biomarkers listed in Table 1. (B) Corresponding PCA plot for the training set and the testing set combined. (C) PCA plot for the non-asthma atopic and non-asthma/non-atopic subjects in the training set using the biomarkers listed in Table 1. (D) Corre-sponding PCA plot for the training set and the testing set combined. The yellow line marks the position of the boundary.
Figure 3. Classification among asthma (red circles), and non-asthma/non-atopic (black crosses), and non-asthma atopic (blueasterisks) subjects. (A) PCA plot for the asthma and atopic subjects in the training set using a new set of biomarkers listed inTable 1. (B) Corresponding PCA plot for the training set and the testing set combined. (C) PCA plot for the non-asthmaatopic and non-asthma/non-atopic subjects in the training set using the biomarkers listed in Table 1. (D) CorrespondingPCA plot for the training set and the testing set combined. The yellow line marks the position of the boundary.
2.4. Biomarkers for Other Asthma Sub-Categories
Using all the subjects in each sub-category and the same procedures described pre-viously, we then identified exhaled biomarkers for the other asthma characteristics ofinterest, which reflect clinical factors associated with differences in asthma phenotypesand outcomes (ICS treatment, obesity, eosinophil level, and upper respiratory illness; seeTable 2). The corresponding PCA plots and the statistics are given in Figure 4 and TableS5, respectively. Particularly, in Figure 4D we show the longitudinal analysis of threeasthma patients who later developed upper respiratory illness (URI), demonstrating ex-haled breath markers of acute URIs. Overall, the ability to sub-categorize and monitorpatients’ trajectories with a non-invasive diagnostic method would provide physiciansa tool for streamlined detection and monitoring of asthma phenotypes and outcomes topotentially help define the right treatment protocol.
Metabolites 2021, 11, 265 8 of 15
Metabolites 2021, 11, x FOR PEER REVIEW 7 of 14
2.4. Biomarkers for Other Asthma Sub-Categories Using all the subjects in each sub-category and the same procedures described pre-
viously, we then identified exhaled biomarkers for the other asthma characteristics of in-terest, which reflect clinical factors associated with differences in asthma phenotypes and outcomes (ICS treatment, obesity, eosinophil level, and upper respiratory illness; see Ta-ble 2). The corresponding PCA plots and the statistics are given in Figure 4 and Table S5, respectively. Particularly, in Figure 4D we show the longitudinal analysis of three asthma patients who later developed upper respiratory illness (URI), demonstrating exhaled breath markers of acute URIs. Overall, the ability to sub-categorize and monitor patients’ trajectories with a non-invasive diagnostic method would provide physicians a tool for streamlined detection and monitoring of asthma phenotypes and outcomes to potentially help define the right treatment protocol.
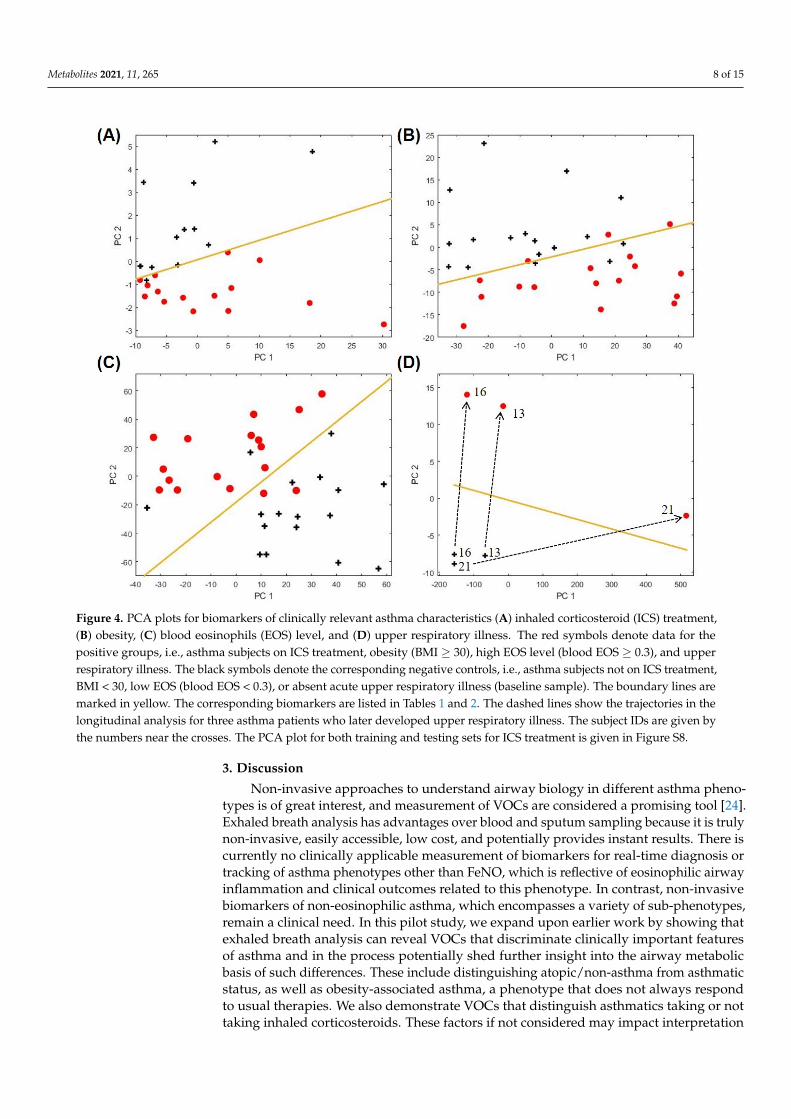
Figure 4. PCA plots for biomarkers of clinically relevant asthma characteristics (A) inhaled corticosteroid (ICS) treatment, (B) obesity, (C) blood eosinophils (EOS) level, and (D) upper respiratory illness. The red symbols denote data for the positive groups, i.e., asthma subjects on ICS treatment, obesity (BMI ≥ 30), high EOS level (blood EOS ≥ 0.3), and upper respiratory illness. The black symbols denote the corresponding negative controls, i.e., asthma subjects not on ICS treat-ment, BMI < 30, low EOS (blood EOS < 0.3), or absent acute upper respiratory illness (baseline sample). The boundary lines are marked in yellow. The corresponding biomarkers are listed in Tables 1 and 2. The dashed lines show the trajectories in the longitudinal analysis for three asthma patients who later developed upper respiratory illness. The subject IDs are given by the numbers near the crosses. The PCA plot for both training and testing sets for ICS treatment is given in Figure S8.
Figure 4. PCA plots for biomarkers of clinically relevant asthma characteristics (A) inhaled corticosteroid (ICS) treatment,(B) obesity, (C) blood eosinophils (EOS) level, and (D) upper respiratory illness. The red symbols denote data for thepositive groups, i.e., asthma subjects on ICS treatment, obesity (BMI ≥ 30), high EOS level (blood EOS ≥ 0.3), and upperrespiratory illness. The black symbols denote the corresponding negative controls, i.e., asthma subjects not on ICS treatment,BMI < 30, low EOS (blood EOS < 0.3), or absent acute upper respiratory illness (baseline sample). The boundary lines aremarked in yellow. The corresponding biomarkers are listed in Tables 1 and 2. The dashed lines show the trajectories in thelongitudinal analysis for three asthma patients who later developed upper respiratory illness. The subject IDs are given bythe numbers near the crosses. The PCA plot for both training and testing sets for ICS treatment is given in Figure S8.
3. Discussion
Non-invasive approaches to understand airway biology in different asthma pheno-types is of great interest, and measurement of VOCs are considered a promising tool [24].Exhaled breath analysis has advantages over blood and sputum sampling because it is trulynon-invasive, easily accessible, low cost, and potentially provides instant results. There iscurrently no clinically applicable measurement of biomarkers for real-time diagnosis ortracking of asthma phenotypes other than FeNO, which is reflective of eosinophilic airwayinflammation and clinical outcomes related to this phenotype. In contrast, non-invasivebiomarkers of non-eosinophilic asthma, which encompasses a variety of sub-phenotypes,remain a clinical need. In this pilot study, we expand upon earlier work by showing thatexhaled breath analysis can reveal VOCs that discriminate clinically important featuresof asthma and in the process potentially shed further insight into the airway metabolicbasis of such differences. These include distinguishing atopic/non-asthma from asthmaticstatus, as well as obesity-associated asthma, a phenotype that does not always respondto usual therapies. We also demonstrate VOCs that distinguish asthmatics taking or nottaking inhaled corticosteroids. These factors if not considered may impact interpretation

Metabolites 2021, 11, 265 9 of 15
of VOC biomarkers and how they inform further study of asthma biology and associateddifferences in treatment outcomes.
We demonstrate here that a portable GC device can discriminate and identify specificexhaled biomarker compounds that distinguish clinical features of asthma in real-time(which saves time and complexity involved in sample preparation and storage) with high ac-curacy. Potentially a portable GC analysis system could be developed for home use, whichmay allow the end user to collect and analyze their breath at home to closely monitor theirhealth condition. To our knowledge, this is the first demonstration of a portable real-timeGC system to study breath VOCs in asthma stratified by the additional factors examined,which were chosen for their clinical importance and link to differences in asthma pheno-type or outcomes. As previously mentioned these factors might affect interpretation ofspecific VOCs in asthma. For example, among the nine biomarkers (7, 32, 50, 51, 69, 73, 80,85, 93) delineating asthma from non-asthma/non-atopic subjects, three of them (7, 32, 50)overlapped with the biomarkers distinguishing non-asthma/atopic from non-asthma/non-atopic subjects. This highlights that background atopy needs to be considered wheninterpreting such results, since allergic sensitization is common in asthma. A recent studyreported that eNose breathprints could classify atopic and non-atopic subjects with asthma,but specific VOCs contributing to the distinction were not identifiable by this methodol-ogy [8]. Notably, we identified two additional compounds, 6 (2-methyl- pentane) and 67(2,5,9-trimethyldecane), that distinguished asthmatic from non-asthmatic/atopic subjects.Same or similar compounds to these (such as 2-methylpentane, 2,4-dimethylpentane, andbranched C13 alkanes like 2,3,6-trimethyldecane) were previously reported as markers todistinguish asthma and non-asthma [22,23,25]. Our data suggest that some of these VOCsmay further distinguish atopic asthmatic subjects from atopic subjects without asthma.
We identified exhaled biomarkers for other asthma-relevant traits by the same ap-proach [16]. For example, obesity-associated asthma is a significant clinical managementproblem. Current biomarkers to predict potential response to asthma therapies (e.g.,inhaled steroids) do not perform as well in obese patients and correlate poorly withsputum markers of eosinophilic inflammation [26]. In our exploratory study we iden-tified 5 compounds that distinguished obese and non-obese asthmatics. None of theseoverlapped with biomarker profiles for other group comparisons, except for one com-pound (54, 2,3,6-trimethylheptane) that also distinguished non-asthmatic/atopic fromnon-asthmatic/non-atopic subjects. The other non-overlapping VOCs identified may bebiomarkers of processes that differentiate obese asthma from other phenotypes. Compound58 (2,6-dimethyl-(S,E)-4-octene) in our results is related to 1-octene, a potential marker ofoxidative stress, which an earlier study found to be associated with obese status in childrencompared to lean controls [27]. Breath alkanes are a product of lipid peroxidation [28], andproducts of lipid peroxidation are known to be associated with airway inflammation andincreased asthma severity [29]. We found only one study in the literature that specificallyexamined breath metabolite profiles in obese and non-obese asthmatics [30]. However,this study used exhaled breath condensate and NMR-based metabolomics, and thus thespecific metabolite differences identified in that study cannot be directly compared to theVOCs we identified as distinguishing obese and non-obese asthmatics.
Distinguishing eosinophilic and non-eosinophilic asthma is important because of thetherapeutic implications. Eosinophilic asthma, defined by blood or sputum eosinophilnumbers, is more responsive to ICS treatment, and as such inhaled steroids are morelikely to be prescribed to such patients. This may confound analysis and interpretationof VOCs related to eosinophilic or non-eosinophilic asthma. Moreover, sputum-baseddetermination of eosinophilic asthma is difficult and remains largely a research method.Blood eosinophil counts are often used as a surrogate clinically, but few if any studies haveexamined breath VOCs between asthmatics categorized by clinically used definitions ofhigh or low blood eosinophils. One study reported 2,6,10-trimethyldodecane as an exhaledbiomarker for eosinophilic airway inflammation, which was defined by sputum eosinophilmeasurements [16]. For comparison, we identified a similar compound, 1-fluorododecane,

Metabolites 2021, 11, 265 10 of 15
as one of the biomarkers distinguishing our asthmatics with high or low blood eosinophilscounts. A more recent study also used sputum to categorize asthmatics with or withouteosinophilic inflammation for breath VOC comparisons [11]. None of the four VOCs weidentified as distinguishing asthmatics by blood eosinophil counts overlapped with thefindings of Ibrahim et al. [16] and Schleich et al. [11] who used sputum-based stratification.It is known that sputum and blood eosinophil counts are only modestly correlated inasthmatics, and thus the differences between our findings and others reflect differentdefinitions of eosinophilic and non-eosinophilic asthma. Our findings also suggest that theVOCs that we identified may reflect additional biological processes relevant to the presenceor absence of asthma-associated systemic eosinophilia.
Inhaled corticosteroids (ICS) are commonly prescribed for asthma and are consid-ered to be more effective for Type 2-driven (eosinophilic) asthma. Inhaled corticosteroiduse could also contribute to increased sputum neutrophils, another inflammatory pheno-type [31]. Thus, ICS use may confound interpretation of VOCs in asthma. We identified4 compounds that delineated asthmatics who were or were not on regular ICS therapy.Three of these were uniquely associated with the biomarker profile for this comparison,while 91 (2,6,6-trimethyldecane) also appeared in the biomarker profile that distinguishedhigh/low blood eosinophils. Whether the other three compounds are related to productsfound in inhaled corticosteroid preparations or reflect aspects of ICS effects or metabolismin the airways will require further investigation. Schleich et al. [11] examined the influenceof ICS treatment on the breath VOCs that distinguished asthma sputum inflammatoryprofiles in their study. It was noted that using five of the VOCs identified, which includeddifferentiation of neutrophilic asthma from other phenotypes, it was not possible to distin-guish ICS-treated from non-ICS-using asthmatics in their cohort. One of these compounds(undecane) was also identified in our study (the related compound undecane 3,6-dimethyl)as part of the unique biomarker profile distinguishing asthmatics on or not on regular ICStherapy. Thus, interpretation of VOCs associated with particular inflammation patternsin asthma may be confounded by concurrent treatments for the disease such as ICS. Wealso identified cyclopropane and chloroacetic acid as unique biomarkers distinguishingICS users and non-users in our cohort. These two VOCs may or may not directly relate toasthma airway biology. Nonetheless, we speculate they may serve as potential biomarkersof actual ICS use by patients.
Lastly, we explored whether exhaled breath markers might identify asthmatic subjectsexperiencing acute upper respiratory illness (URI). Longitudinal analysis of three asthmapatients revealed that volatile metabolic changes in exhaled breath distinguished URI statefrom baseline non-ill state in these patients. Interestingly, the biomarker profile consistedof five compounds that did not appear in the other biomarker profiles for our othergroup comparisons. Although Larstad et al. [20] found that isoprene may be negativelyassociated with asthma, others have reported the opposite [17] and we found isoprene tobe one of the biomarkers that discriminated active upper respiratory illness in our affectedasthma patients. Isoprene has been associated with several disease states, thought torelate to cholesterol biosynthesis pathways and is a byproduct of lipid peroxidation [32],thus potentially indicative of increased inflammation. Other VOCs in this respiratoryillness-related profile (e.g., 1-cyclopropaneethanol) could reflect escalation of inhaledbronchodilator treatments and components of such therapies. Further longitudinal analysisin more affected patients is needed to follow up this preliminary observation.
Strengths of our study are the demonstration that a portable GC system can beapplied to investigate exhaled VOC patterns in real-time and identify specific compoundsassociated not just with asthmatic state, but also those associated with clinical variables thatreflect differences in asthma biology, treatment approach or outcomes. However, this was apilot proof-of-concept study with only 73 total participants, and our asthma sub-categorieshad small, if balanced, numbers for comparisons. The major limitation of the study is lack ofindependent validation groups. A much larger groups of participants are needed to furthervalidate our methods and preliminary findings. However, our preliminary results are

Metabolites 2021, 11, 265 11 of 15
encouraging in its demonstration that somewhat unique breath patterns and specific VOCsmay be able to discriminate certain asthma sub-types. Identifying specific compounds,rather than just an overall breathprint, also provides important hypothesis-generatinginformation to inform further mechanistic studies of underlying airway pathobiology. Thiswould include how other products of lipid peroxidation, such as the branched alkanesidentified in our study and others, contribute to or reflect pathways of airway inflammationinvolving membrane lipids in asthma [29]. Another limitation comes from the portableGC itself. In order to maintain portability and rapid analysis time, it uses only a 10-m longcolumn and 10 min of separation time. Consequently, it has lower separation capabilitythan benchtop GC that usually uses a 30 m long column and 30–60 min of separation time.In the future, separation capability can be enhanced by developing 2-dimensional GC.Finally, while our vapor detector (µPID) used in this study is very sensitive already [33],recent improvement shows that its sensitivity can be further increased approximately10-fold. Implementation of the new version of the vapor detector will certainly help detectthose VOCs having extremely low concentrations in breath.
In conclusion, exhaled breath VOC profiling is a clinically accessible tool for asthmadiagnosis and phenotype assessment, that in combination with other tools, such as nu-clear magnetic resonance spectroscopy of exhaled breath condensate, may offer a morecomprehensive breathomics approach to asthma evaluation [34]. We demonstrate that theproposed portable GC system is a viable option for rapid real-time assessment in asthmathat could be further scaled to point-of-care devices for breath phenotyping in clinical trialsas well as in the outpatient clinic.
4. Materials and Methods4.1. Description of the Portable GC Device
The portable GC system used in this study has been reported in our previous work [35,36].Briefly, as shown in Figure 5A, the GC consists of a thermal desorption tube loaded withCarbopackTM X and B, a micro-thermal injector loaded with CarbopackTM X and B, one10 m long Agilent J&W DB-1ms, and a micro-photoionization detector. The entire devicewas housed in a customized plastic case (see Figure 5C) and had a total weight less than 3kg. LabVIEWTM based codes were developed in-house for the user interface, and devicecontrol and automation. The detailed description of the material used, microfabricatedcomponents, the preparation of the thermal desorption tube and the column are presentedin Sections S1.1 and S1.2 of the Supplementary Materials.
4.2. Exhaled Breath Collection and Analysis
Subjects were asked to orally exhale into and fill a 1 L Tedlar bag through a mouthpiececonnected to a one-way valve and a Nafion filter in series, as shown in Figure 5B. Theone-way valve stops the flow back to the patient mouth, and the Nafion filter is to absorbthe moisture content in the breath. The process usually takes about a few minutes. Thebreath analysis took place either in-situ immediately after the breath sample collection orwithin 24 h of breath collection. The Tedlar bags were stored under ambient conditionuntil analyzed. During the breath analysis, the Tedlar bag was connected to the samplingport of the portable GC (Figure 5C). The total assay time was 30 min, including 5 min ofbreath sampling time from the Tedlar bag at a flow rate of 70 mL/min (see the blue pathin Figure 5A), 5 min of desorption/transfer time, 10 min of chromatographic separationtime (see the orange path in Figure 5A), and 10 min of GC system cleaning time. Thedetail about the GC system operation is presented in Section S1.3 and also reported in ourprevious work [35,36].

Metabolites 2021, 11, 265 12 of 15Metabolites 2021, 11, x FOR PEER REVIEW 11 of 14
Figure 5. (A) Layout of the portable GC device. (B) During breath sampling, the subject exhales breath into a Tedlar bag (1 L) via a mouthpiece connected to one-way valve. (C) Photo of the portable GC, showing that a Tedlar bag is connected to the sampling port of the device.
4.2. Exhaled Breath Collection and Analysis Subjects were asked to orally exhale into and fill a 1 L Tedlar bag through a mouth-
piece connected to a one-way valve and a Nafion filter in series, as shown in Figure 5B. The one-way valve stops the flow back to the patient mouth, and the Nafion filter is to absorb the moisture content in the breath. The process usually takes about a few minutes. The breath analysis took place either in-situ immediately after the breath sample collec-tion or within 24 h of breath collection. The Tedlar bags were stored under ambient con-dition until analyzed. During the breath analysis, the Tedlar bag was connected to the sampling port of the portable GC (Figure 5C). The total assay time was 30 min, including 5 min of breath sampling time from the Tedlar bag at a flow rate of 70 mL/min (see the blue path in Figure 5A), 5 min of desorption/transfer time, 10 min of chromatographic separation time (see the orange path in Figure 5A), and 10 min of GC system cleaning time. The detail about the GC system operation is presented in Section S1.3 and also re-ported in our previous work [35,36].
4.3. Chromatogram Processing and Statistical Analysis Chromatogram preprocessing is critical prior to actual breath analysis. In this work,
baseline correction, noise reduction, normalization, peak detection, peak area extraction, and chromatogram aligning is performed prior to the subsequent machine learning and statistical analysis. More detailed description for each step is presented in Section S2 in the Supplementary Materials.
Through machine learning, a subset of peaks (VOCs) were selected as the biomarkers to discriminate between asthma and non-asthma/non-atopic, and among various asthma
Figure 5. (A) Layout of the portable GC device. (B) During breath sampling, the subject exhales breath into a Tedlar bag(1 L) via a mouthpiece connected to one-way valve. (C) Photo of the portable GC, showing that a Tedlar bag is connected tothe sampling port of the device.
4.3. Chromatogram Processing and Statistical Analysis
Chromatogram preprocessing is critical prior to actual breath analysis. In this work,baseline correction, noise reduction, normalization, peak detection, peak area extraction,and chromatogram aligning is performed prior to the subsequent machine learning andstatistical analysis. More detailed description for each step is presented in Section S2 in theSupplementary Materials.
Through machine learning, a subset of peaks (VOCs) were selected as the biomarkersto discriminate between asthma and non-asthma/non-atopic, and among various asthmasubcategories based on clinically important asthma characteristics. The statistical analysismethod is adapted from our previously published approach [35] based on linear discrimi-nant analysis (LDA) and principal component analysis (PCA) with significant improvementin computation efficiency (Section S3.3.2). The detailed description is elaborated in SectionS3 in the Supplementary Materials.
4.4. Identification of VOCs Using Mass Spectrometry
The outlet of the portable GC device (i.e., the outlet of the photoionization detector)was coupled to a Thermo Scientific Single Quadrupole Mass Spectrometer (ISQTM Series)for chemical identification of the VOCs in the breath. C13 was used as a standard sample forMS calibration. The NIST 2014 library was used for the identification of breath compounds.The results were analyzed with ChromeleonTM 7 Software provided by Thermo FisherScientific, Waltha, MA, USA.

Metabolites 2021, 11, 265 13 of 15
Supplementary Materials: The Supplementary Materials are available online at https://www.mdpi.com/article/10.3390/metabo11050265/s1. Section S1: Portable GC Description and Operation,Section S2: Chromatogram Preprocessing, Section S3: Statistical Analysis for Biomarker Discovery.
Author Contributions: Conceived and designed the experiments: R.S., Y.J.H., X.F. Clinical supervi-sion and advice: Y.J.H., N.S., L.A.B. Technical supervision and advice: Y.J.H., X.F. Performing studyprocedures, data collection, and analysis: R.S., N.S., L.A.B., W.Z. Analyzed the data: W.Z., R.S., M.Z.,X.F., Contributed reagents/materials/analysis tools/patient recruitment/breath sample collection:R.S., W.Z., M.Z., N.S., L.A.B., Y.J.H., X.F. Wrote the paper: R.S., W.Z., Y.J.H., X.F. All authors haveread and agreed to the published version of the manuscript.
Funding: This research was funded by Beijing Institute for Collaborative Innovation and the giftfund from NGK Spark Plugs, both are via the University of Michigan (X.F.) and by National Institutesof Health (R01AI129958) (Y.J.H.).
Institutional Review Board Statement: The study was conducted according to the guidelines ofthe Declaration of Helsinki, and approved by the Institutional Review Board of the University ofMichigan (HUM00097163 and HUM00136068; ongoing approval dates 9/17/2020 and 12/10/2020,respectively).
Informed Consent Statement: Informed consent was obtained from all subjects involved in the study.
Data Availability Statement: The data are available on request from the corresponding authors dueto ongoing study.
Acknowledgments: The authors thank the support from Flux HPC Cluster provided by the Uni-versity of Michigan Office of Research and Advanced Research Computing–Technology Services(ARC-TS), and Analytical Chemistry Lab at the University of Michigan Biological Station at Pellston,Michigan, for using their mass spectrometry facility. We thank the subjects who participated in ourUniversity of Michigan CAARS/MICROMAAP studies and who contributed samples and data forthis analysis.
Conflicts of Interest: X.F. is a co-inventor of the photo-ionization detector technology used in thisarticle. The related IP is licensed to Nanova. X.F. serves as a paid consultant to Nanova.
References1. Chung, K.F. Asthma phenotyping: A necessity for improved therapeutic precision and new targeted therapies. J. Intern. Med.
2016, 279, 192–204. [CrossRef]2. Douwes, J.; Gibson, P.; Pekkanen, J.; Pearce, N. Non-eosinophilic asthma: Importance and possible mechanisms. Thorax 2002, 57,
643–648. [CrossRef]3. McGrath, K.W.; Icitovic, N.; Boushey, H.A.; Lazarus, S.C.; Sutherland, E.R.; Chinchilli, V.M.; Fahy, J.V. A large subgroup of
mild-to-moderate asthma is persistently noneosinophilic. Am. J. Respir. Crit. Care Med. 2012, 185, 612–619. [CrossRef] [PubMed]4. Montuschi, P.; Santonico, M.; Mondino, C.; Pennazza, G.; Mantini, G.; Martinelli, E.; Capuano, R.; Ciabattoni, G.; Paolesse, R.; Di
Natale, C.; et al. Diagnostic performance of an electronic nose, fractional exhaled nitric oxide, and lung function testing in asthma.Chest 2010, 137, 790–796. [CrossRef]
5. Santini, G.; Mores, N.; Penas, A.; Capuano, R.; Mondino, C.; Trové, A.; Macagno, F.; Zini, G.; Cattani, P.; Martinelli, E.; et al.Electronic nose and exhaled breath NMR-based metabolomics applications in airways disease. Curr. Top. Med. Chem. 2016, 16,1610–1630. [CrossRef] [PubMed]
6. Dweik, R.A.; Boggs, P.B.; Erzurum, S.C.; Irvin, C.G.; Leigh, M.W.; Lundberg, J.O.; Olin, A.-C.; Plummer, A.L.; Taylor, D.R. Anofficial ATS clinical practice guideline: Interpretation of Exhaled Nitric Oxide Levels (FeNO) for clinical applications. Am. J.Respir. Crit. Care Med. 2011, 184, 602–615. [CrossRef] [PubMed]
7. Dweik, R.A.; Sorkness, R.L.; Wenzel, S.; Hammel, J.; Curran-Everett, D.; Comhair, S.A.A.; Bleecker, E.; Busse, W.; Calhoun, W.J.;Castro, M.; et al. Use of exhaled nitric oxide measurement to identify a reactive, at-risk phenotype among patients with asthma.Am. J. Respir. Crit. Care Med. 2010, 181, 1033–1041. [CrossRef]
8. Abdel-Aziz, M.I.; Brinkman, P.; Vijverberg, S.J.; Neerincx, A.H.; de Vries, R.; Dagelet, Y.W.; Riley, J.H.; Hashimoto, S.; Montuschi,P.; Chung, K.F.; et al. eNose breath prints as a surrogate biomarker for classifying patients with asthma by atopy. J. Allergy Clin.Immunol. 2020, 146, 1045–1055. [CrossRef]
9. Brinkman, P.; Wagener, A.H.; Hekking, P.P.; Bansal, A.T.; Maitland-van der Zee, A.H.; Wang, Y.; Weda, H.; Knobel, H.H.; Vink,T.J.; Rattray, N.J.; et al. Identification and prospective stability of electronic nose (eNose)-derived inflammatory phenotypes inpatients with severe asthma. J. Allergy Clin. Immunol. 2019, 143, 1811–1820.e7. [CrossRef]

Metabolites 2021, 11, 265 14 of 15
10. Brinkman, P.; Van De Pol, M.A.; Gerritsen, M.G.; Bos, L.D.; Dekker, T.; Smids, B.S.; Sinha, A.; Majoor, C.J.; Sneeboer, M.M.; Knobel,H.H.; et al. Exhaled breath profiles in the monitoring of loss of control and clinical recovery in asthma. Clin. Exp. Allergy 2017, 47,1159–1169. [CrossRef]
11. Schleich, F.N.; Zanella, D.; Stefanuto, P.-H.; Bessonov, K.; Smolinska, A.; Dallinga, J.W.; Henket, M.; Paulus, V.; Guissard, F.; Graff,S.; et al. Exhaled volatile organic compounds are able to discriminate between neutrophilic and eosinophilic asthma. Am. J. Respir.Crit. Care Med. 2019, 200, 444–453. [CrossRef]
12. Begley, L.; Madapoosi, S.; Opron, K.; Ndum, O.; Baptist, A.; Rysso, K.; Erb-Downward, J.R.; Huang, Y.J. Gut microbiotarelationships to lung function and adult asthma phenotype: A pilot study. BMJ Open Respir. Res. 2018, 5, e000324. [CrossRef][PubMed]
13. Graham, B.L.; Steenbruggen, I.; Miller, M.R.; Barjaktarevic, I.Z.; Cooper, B.G.; Hall, G.L.; Hallstrand, T.S.; Kaminsky, D.A.;McCarthy, K.; McCormack, M.C.; et al. Standardization of spirometry 2019 update. An official american thoracic society andeuropean respiratory society technical statement. Am. J. Respir. Crit. Care Med. 2019, 200, e70–e88. [CrossRef] [PubMed]
14. Coates, A.L.; Wanger, J.; Cockcroft, D.W.; Culver, B.H.; Carlsen, K.-H.; Diamant, Z.; Gauvreau, G.; Hall, G.L.; Hallstrand, T.S.;Horvath, I.; et al. ERS technical standard on bronchial challenge testing: General considerations and performance of methacholinechallenge tests. Eur. Respir. J. 2017, 49, 1601526. [CrossRef] [PubMed]
15. Blanchet, L.; Smolinska, A.; Baranska, A.; Tigchelaar, E.; Swertz, M.; Zhernakova, A.; Dallinga, J.W.; Wijmenga, C.; Van Schooten,F.J. Factors that influence the volatile organic compound content in human breath. J. Breath Res. 2017, 11, 016013. [CrossRef]
16. Ibrahim, B.; Basanta, M.; Cadden, P.; Singh, D.; Douce, D.; Woodcock, A.; Fowler, S.J. Non-invasive phenotyping using exhaledvolatile organic compounds in asthma. Thorax 2011, 66, 804–809. [CrossRef]
17. Dragonieri, S.; Schot, R.; Mertens, B.J.; Le Cessie, S.; Gauw, S.A.; Spanevello, A.; Resta, O.; Willard, N.P.; Vink, T.J.; Rabe, K.F.;et al. An electronic nose in the discrimination of patients with asthma and controls. J. Allergy Clin. Immunol. 2007, 120, 856–862.[CrossRef] [PubMed]
18. Cavaleiro Rufo, J.; Madureira, J.; Oliveira Fernandes, E.; Moreira, A. Volatile organic compounds in asthma diagnosis: Asystematic review and meta-analysis. Allergy 2016, 71, 175–188. [CrossRef]
19. Pereira, J.; Porto-Figueira, P.; Cavaco, C.; Taunk, K.; Rapole, S.; Dhakne, R.; Nagarajaram, H.; Câmara, J.S. Breath analysis as apotential and non-invasive frontier in disease diagnosis: An overview. Metabolites 2015, 5, 3–55. [CrossRef]
20. Lärstad, M.A.E.; Torén, K.; Bake, B.; Olin, A.-C. Determination of ethane, pentane and isoprene in exhaled air ? effects ofbreath-holding, flow rate and purified air. Acta Physiol. 2007, 189, 87–98. [CrossRef]
21. Azim, A.; Barber, C.; Dennison, P.; Riley, J.; Howarth, P. Exhaled volatile organic compounds in adult asthma: A systematicreview. Eur. Respir. J. 2019, 54, 1900056. [CrossRef] [PubMed]
22. Smolinska, A.; Klaassen, E.M.M.; Dallinga, J.W.; Van De Kant, K.D.G.; Jobsis, Q.; Moonen, E.J.C.; Van Schayck, O.C.P.; Dompeling,E.; Van Schooten, F.J. Profiling of volatile organic compounds in exhaled breath as a strategy to find early predictive signatures ofasthma in children. PLoS ONE 2014, 9, e95668. [CrossRef] [PubMed]
23. Caldeira, M.; Barros, A.S.; Bilelo, M.J.; Parada, A.; Câmara, J.D.S.; Rocha, S.M. Profiling allergic asthma volatile metabolic patternsusing a headspace-solid phase microextraction/gas chromatography based methodology. J. Chromatogr. A 2011, 1218, 3771–3780.[CrossRef] [PubMed]
24. García-Marcos, L.; Edwards, J.; Kennington, E.; Aurora, P.; Baraldi, E.; Carraro, S.; Gappa, M.; Louis, R.; Moreno-Galdó, A.; Peroni,D.G.; et al. Priorities for future research into asthma diagnostic tools: A PAN-EU consensus exercise from the European asthmaresearch innovation partnership (EARIP). Clin. Exp. Allergy 2017, 48, 104–120. [CrossRef]
25. Dallinga, J.W.; Robroeks, C.M.H.H.T.; Van Berkel, J.J.B.N.; Moonen, E.J.C.; Godschalk, R.W.L.; Jöbsis, Q.; Dompeling, E.; Wouters,E.F.M.; Van Schooten, F.J. Volatile organic compounds in exhaled breath as a diagnostic tool for asthma in children. Clin. Exp.Allergy 2009, 40, 68–76. [PubMed]
26. Lugogo, N.; Green, C.L.; Agada, N.; Zhang, S.; Meghdadpour, S.; Zhou, R.; Yang, S.; Anstrom, K.J.; Israel, E.; Martin, R. Obesity’seffect on asthma extends to diagnostic criteria. J. Allergy Clin. Immunol. 2018, 141, 1096–1104. [CrossRef]
27. Alkhouri, N.; Eng, K.; Cikach, F.; Patel, N.; Yan, C.; Brindle, A.; Rome, E.; Hanouneh, I.; Grove, D.; Lopez, R.; et al. Breathprints ofchildhood obesity: Changes in volatile organic compounds in obese children compared with lean controls. Pediatr. Obes. 2015, 10,23–29. [CrossRef]
28. Van Gossum, A.; Decuyper, J. Breath alkanes as an index of lipid peroxidation. Eur. Respir J. 1989, 2, 787–791.29. Wood, L.; Gibson, P.; Garg, M. Biomarkers of lipid peroxidation, airway inflammation and asthma. Eur. Respir. J. 2003, 21, 177–186.
[CrossRef]30. Maniscalco, M.; Paris, D.; Melck, D.J.; D’Amato, M.; Zedda, A.; Sofia, M.; Stellato, C.; Motta, A. Coexistence of obesity and asthma
determines a distinct respiratory metabolic phenotype. J. Allergy Clin. Immunol. 2017, 139, 1536–1547.e5. [CrossRef]31. Boulet, L.-P. Effects of steroid therapy on inflammatory cell subtypes in asthma. Thorax 2010, 65, 374–376. [CrossRef]32. Salerno-Kennedy, R.; Cashman, K.D. Potential applications of breath isoprene as a biomarker in modern medicine: A concise
overview. Wien. Klin. Wochenschr. 2005, 117, 180–186. [CrossRef] [PubMed]33. Zhu, H.; Nidetz, R.; Zhou, M.; Lee, J.; Buggaveeti, S.; Kurabayashi, K.; Fan, X. Flow-through microfluidic photoionization
detectors for rapid and highly sensitive vapor detection. Lab Chip 2015, 15, 3021–3029. [CrossRef] [PubMed]34. Motta, A.; Paris, D.; Melck, D.; De Laurentiis, G.; Maniscalco, M.; Sofia, M.; Montuschi, P. Nuclear magnetic resonance-based
metabolomics of exhaled breath condensate: Methodological aspects. Eur. Respir. J. 2012, 39, 498–500. [CrossRef]

Metabolites 2021, 11, 265 15 of 15
35. Zhou, M.; Sharma, R.; Zhu, H.; Li, Z.; Li, J.; Wang, S.; Bisco, E.; Massey, J.; Pennington, A.; Sjoding, M.; et al. Rapid breath analysisfor acute respiratory distress syndrome diagnostics using a portable two-dimensional gas chromatography device. Anal. Bioanal.Chem. 2019, 411, 6435–6447. [CrossRef]
36. Sharma, R.; Zhou, M.; Hunter, M.D.; Fan, X. Rapid in situ analysis of plant emission for disease diagnosis using a portable gaschromatography device. J. Agric. Food Chem. 2019, 67, 7530–7537. [CrossRef] [PubMed]