real-time data analytics case studies
DESCRIPTION
The goal of this report is to explore executive perceptions and opinions about real time data applications and operations. We have interviewed over forty (40) Key Innovation Leaders who have been cited as the most innovative thinkers within the world of analytics and have documented distinctive case studies which have clearly optimized business intelligence.TRANSCRIPT

Case Studies Utilizing Real-Time Data Analytics
2
Project Overview:
The goal of this report is to explore executive perceptions and opinions about real time data
applications and operations. We have interviewed over forty (40) Key Innovation Leaders who
have been cited as the most innovative thinkers within the world of analytics and have
documented distinctive case studies which have clearly optimized business intelligence.
With every passing day, the pace of business is accelerating. Paradigm shifts in the global
economy combined with rapid technology adoption are forcing business executives to contend
with a new global marketplace fraught with uncertainty and constant change. To be successful
under these new market dynamics, firms must adjust operational processes, corporate strategies
and business models at lightning speed—allowing them to leverage intelligence instantly and
take immediate action. At the same time, they must make sure their decisions are informed by
proper data and analysis.
The interviews and research conducted focused on large and medium-sized business units in four
sectors of the economy—consumer products, technology, oil and gas, and retailing.
The data revealed some interesting findings:
Executives realize they need to take their businesses into real time. In fact,
30% of firms already derive considerable benefit from real-time business, and
nearly two-thirds of companies yet to implement real-time business
techniques plan to do so over the next five years. With at least one-fifth of
companies in every sector or region using real-time business techniques, its
value to businesses of all types is growing. For the majority of the businesses
that are behind these leaders, the imperative is to make up lost ground.
There are some surprising leaders—and laggards. The majority of oil and gas
firms have implemented a real-time business approach, particularly as part of
their production processes and financial and business risk management
strategies. This indicates the importance of real-time operations particularly
for complex, capital-intensive firms. Consumer product and retailing firms,
meanwhile, lag in terms of implementation. Retailers in particular are behind
in the implementation of real-time operations for customer experience and
supply-chain management, two critical areas for retailing success. Retailers
also report their efforts around real-time business to be less effective than
firms in other industries.

3
Real-Time Business in the New Global Marketplace
Early adopters have seen substantial results. The main strategic goals of
executives choosing to implement real-time business techniques are to
increase market share and enhance service and quality advantages.
Operationally, real-time business is proving especially effective in delivering
improvements in customer experience, production processes and supply chain
management. But perhaps most striking is the tangible return on investment:
Those able to estimate put revenues gains at over 20%, and cost reduction at
nearly 20%. In fact, future gains are expected to exceed earlier ones, with
revenue increases of 28%.
But challenges are significant, in a number of areas. Respondents cite a lack
of technology as a main obstacle, as well as suppliers’ unfamiliarity with real-
time systems and a lack of internal expertise. Indeed, the move to real-time
operations can be extremely complex, and will require careful planning and
strategy to ensure success.
Those planning to roll out real-time systems have different strategies than
early adopters. They will put particular focus on financial and business risk,
production processes and supply-chain management. Meanwhile, almost all
early adopters plan to carry on investing, though they will shift their focus
from sales and marketing towards product design and innovation, while
continuing to focus on customer experience.
The need for speed
We live in a world that increasingly communicates and operates in real time. Over the past
decade, the spread of social media and mobile phone use, combined with the explosion of
accessible information and increasing interconnectedness of global markets and cultures, has
dramatically sped the pace of our daily lives. The evidence is clear in the dissemination of
international news: For example, when US Airways Flight 1549 emergency-landed on New
York’s Hudson River after striking a flock of geese during takeoff in January 2009, it took only
three minutes for the first “tweet” to alert the world
4
The pace of business, too, has dramatically accelerated. Customers and clients expect their
queries and problems to be addressed immediately. In an uncertain global market where there are
many more competitors and constant change, executives know that success depends on the
ability to take fast action and make rapid decisions. Indeed, in the business world today, speed is
not only expected, but required. As Rupert Murdoch noted: “The world is changing very fast.
Big will not beat small anymore. It will be the fast beating the slow.”
But are companies prepared to take their firms into real time?
While nearly all respondents agree that doing so is critical, only one-third of businesses have
already implemented real-time business applications in some way (though 65% of those who
have not yet implemented real-time systems expect to do so within five years). And the
experience is far from uniform. For example, companies that focus on business-to-business
operations (35%), are more likely to have moved to real-time than those in the business-to
consumer space (16%). And almost half of the very large businesses studied— those with annual
revenues in excess of US$25 billion—have introduced real-time business, significantly more
than those with a turnover of less than US$1 billion (22%) or between US$1 billion and US$10
billion (28%).
Adopting a real-time business approach can provide companies with myriad benefits at
both the operational and management levels
At an operational level : by speeding up data capture and simplifying
processes, executives can reduce inventories, minimize business risks, lower
operational costs, accelerate speed to market, foster productivity and better
meet customer needs.
At the management level, by accelerating decision-making and planning,
executives can exploit market opportunities faster, identify competitive threats
sooner, cope with market shifts more quickly and transform stagnating
businesses.
With the internet transforming business, mobility moving to center stage and
on-demand computing becoming the norm, global firms are on the threshold
of an era that will radically transform operations. Companies need to consider
how to adopt real-time into the fabric of their firms, or risk falling behind their
competitors.
5
What does it mean to be a “real-time business”?
For purposes of our research, “real-time business” refers to processes that allow companies to
conduct a range of business activities instantaneously. The activities that make up realtime
business can, therefore, incorporate all aspects of business, including gathering and acting on
business intelligence, developing promotional and marketing tactics, controlling and adjusting
production processes, managing inventory, identifying and managing business risks, closing and
fulfilling sales and meeting customer needs.
Real-time operations depend on in-memory analytics, which takes a different approach than
traditional business intelligence systems. Rather than storing information on various external
disks and caching bits of data in a computer’s random access memory (RAM), real-time
intelligence puts the data directly into RAM. Advancements in computing power and storage
have made it possible to store vastly more amounts of data in RAM than ever before, and allows
for extremely fast query responses
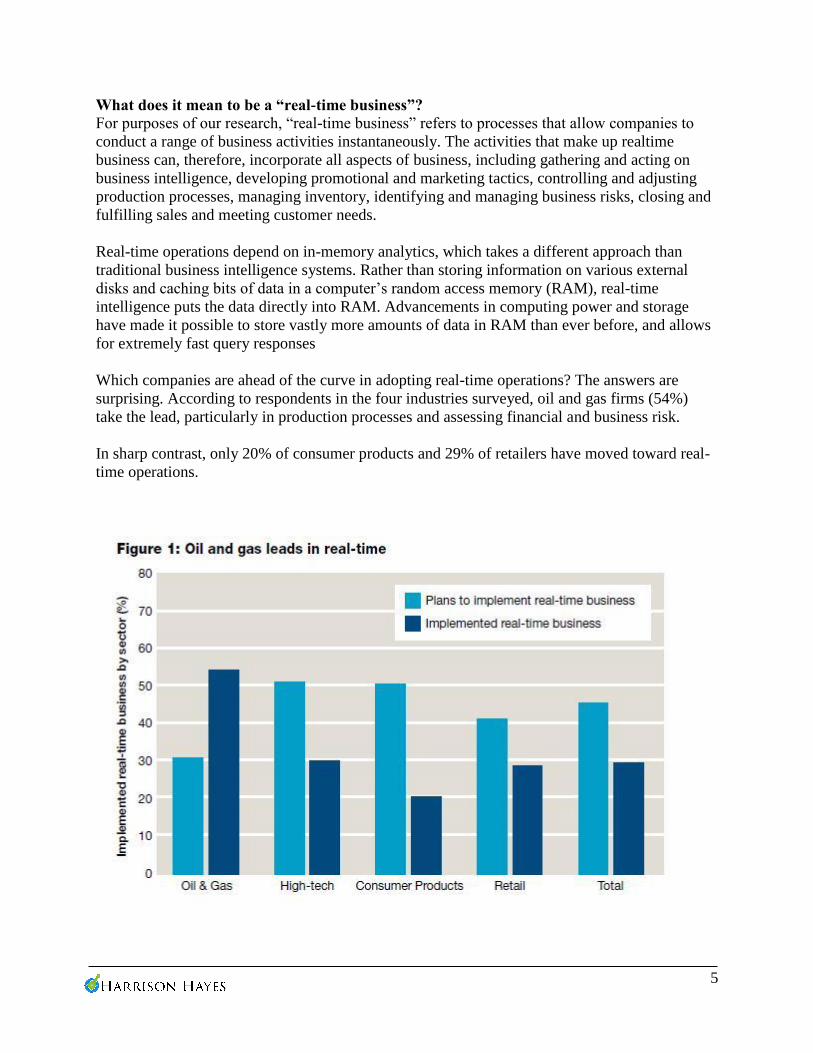
Which companies are ahead of the curve in adopting real-time operations? The answers are
surprising. According to respondents in the four industries surveyed, oil and gas firms (54%)
take the lead, particularly in production processes and assessing financial and business risk.
In sharp contrast, only 20% of consumer products and 29% of retailers have moved toward real-
time operations.

6
In the oil and gas industry, real-time data is critical to monitor drilling sites. Shell, for example,
maintains six real-time operation sites around the world, in Houston; New Orleans, La.; Miri,
Malaysia; Muscat, Oman; Port Harcourt, Nigeria; and Aberdeen, UK. These centers provide
around-the-clock monitoring of the firm’s assets and operations.
Considering some of the strides of the world’s most formidable retailers and consumer products
companies in championing real-time operations (Wal-Mart and P&G, to name but a few)—and
the clear opportunities to improve critical areas of the business such as supply chain management
and inventory control, it seems particularly surprising that these sectors would rate so low on our
survey.
Sunil Verma, Chief Information Officer and Senior Vice President of US-based clothing retailer
The Children’s Place, is not surprised. “In terms of technology, the retail industry is a follower,”
he says. “It’s an old industry which is changing quickly because of the internet. We quickly
understand that there is a competitive advantage in doing real-time analytics and the idea that we
need to infuse every customer touch point with some element of personalization. The minute you
start to internalize that, the need for real-time computing becomes more urgent.”
According to Ranjay Gulati, the Jaime and Josefina Chua Tiampo Professor of Business
Administration at Harvard Business School, the reasons may center on a lack of understanding of
its benefits. “The retail sector is pretty fast-moving— looks at how quickly fads and fashions
change. Yet retailers don’t have that kind of cycle speed on being able to look at the data and run
analytics on it. Even worse, the people who have the data and the people who need the data are
not sitting in the same place—in fact; the people who need the information might not even know
it exists. So there is a huge disconnect.”

7
Still, the fact that so many respondents say their firms are planning to move in this direction
points to an understanding that this disconnect exists—an encouraging step. “I don’t think we’re
at the tipping point yet,” says Professor Gulati. “It’s still early stages. But we are approaching a
point where business competition is becoming so strong that it will eventually force companies
to find a way to get it done.”
Drivers of adoption
For “early implementers”—firms that have already adopted real-time business methods, use is
pervasive across the enterprise: Upwards of 95% of these respondents have some form of real-
time business applications in place across all departments. And the commitment to real-time
business is substantial. For each of the functions identified (consumer experience; supply-chain
management; production; sales and marketing; financial and business risk; and product design
and innovation), over 50% of early implementers report a high or very high degree of adoption.
Customer experience and supply chain management top the ranking (each at 64%), followed
closely by production processes (63%), and sales and marketing (62%).
Naturally, obtaining a strategic benefit is a key driver for implementing real-time operations.
Among early adopters, growth in market share (77%) is the most frequently cited driver for
adoption. This is followed by building service and/or quality advantages (71%), expanding
addressable markets (68%) and building cost advantages (67%).

8
Meanwhile, “planners”—firms that are in the process of moving to real-time operations or
intend to do so over the next five years—comprise some 46% of survey respondents. For these
respondents, building service and/or quality advantage is most frequently identified (87%) as
an important or very important driver. This is followed by ambitions to grow market share
(83%) and building cost advantages (82%).

9
Adoption strategies of planners are different from those of early implementers. By function,
production process and financial and business risk lead initial investment among planners, with
roughly 77% of those surveyed reporting fairly or very significant plans in these aspects of their
operations. The next areas for investment are supply chain management, where 75% of planners
have fairly or very significant plans, and product design and innovation (74%).
Among oil and gas businesses that plan to make their first efforts to move to real time, most
consider building service/quality advantage and cost advantages as key drivers with 95%
indicating this is quite or very important. Among new adopters in the retail sector, the greatest
perceived benefit is building cost advantages (85%). In contrast, a higher proportion of new
adopters in the consumer products sector (87%) cite increasing market share as the greatest
anticipated benefits.
Benefits and opportunities
Clearly, the purpose of real-time operations is to help companies make better decisions and
speed time to market. As such, it is of little surprise that early adopters cite increased revenue
(31%) and cost reduction (35%) as the most important benefits. In this area, real-time operations
seem to offer a tangible benefit: On average, companies that have implemented such systems are
seeing revenue gains of 21% and cost reductions of 19%. In fact, among early adopters, 77%
report revenue gains.

10
For some companies, the benefits are even more substantial. Oil and gas firms report revenue
gains of 36%, which are significantly greater than those in the consumer products sector
(revenue gains of 14%). Business-to-business operations (27%), meanwhile, also report
significantly higher revenue gains than business-to-customer units (13%). The higher figures
may be attributed to the fact that firms in these categories are further along the implementation
curve, suggesting a connection between real-time operations and revenue.
At GE Energy, work is under way to embed real-time sensing software and controls into
equipment to run its plants. “There is a huge wave of activity that is taking place now around
data collection,” says Dr. Peter Evans, head of strategy for GE Energy. “We are putting in place
the frameworks for better decision-making about how to run these plants at higher performance.”
For example, GE is now sharing with its clients the real-time data it collects from its fleet of over
1,000 gas turbines so customers can benchmark performance. “We collect and analyze the data,
and turn n it into better solutions,” he says.
For UK-based movie streaming service LOVEFiLM, which has more than 1.6 million members
and manages four million rentals monthly across Europe, the conversion rate of trial to paid
subscriptions is critical. “A 1% or 2% change in conversion has a huge effect on the bottom
line,” says Mike Blakemore, the firm’s Chief Technical Office. “So we manage that constantly.”
Real-time systems are key to that effort: In addition to crucial housekeeping, such as tracking
credit cards and payments in real time, LOVEFiLM can tailor its offerings to members based on
their past preferences.
Furthermore, because LOVEFiLM can track instantly which films are most popular among its
customer segments, its content team knows which films it should promote to drive sales. “The
sooner we have the customer data,” says Mr. Blakemore, “the quicker we can adapt.” It’s a
strategy that has paid off. In February 2008, Amazon became the firm’s largest shareholder; this
January, the online retail giant announced that it would take full control of the LOVEFiLM.
The benefits of real-time operations are not limited to companies whose business models are
mainly digitally. Among airline executives, for example, the expression “wheels up” is a key
phrase: Once a plane takes off, the value of an empty seat is zero—it can never again generate
revenue. To keep financial performance aloft at Continental Airlines (now a unit of United
Continental Holdings), real-time analytics track empty seats prior to takeoff to put as many
travelers on board as possible. At any time, Continental executives can see an accurate account
of revenue-generating passengers on its flights.
But real-time data helps with more than in-flight operations. It is now critical in helping the
airline manage seat availability for its 2,000 daily flights, each of which can have as many as 30
different seating classifications. In the past, says Anne Marie Reynolds, director of the airline’s
data warehouse, it was difficult to manage the complexity of the various pricing options—
updates were done nightly in a batch process. “The science behind it hasn’t changed all that
dramatically but now we are able to respond within a few minutes rather than waiting until the
next morning.” That alone, she says, has meant millions in increased revenues.

11
Study respondents also expect to see substantial benefits from real-time operations in the future.
For the sample as a whole, the expected gains in revenue average 28%; the expected cost
reductions average 20%; and the gains in productivity 24%.
At The Children’s Place, says Mr. Verma, the company is undergoing a significant
transformation. “We have a new mandate to elevate what we do both in terms of product and in
terms of how we service the customer,” he says. Real-time operations are critical to that
mandate, particularly in terms of personalization. “Having access to immediate customer data is
a huge opportunity,” he says. For example, in the past it took 30 days to know if a customer had
made a purchase online or in a store. “Because a customer’s status couldn’t be updated
immediately,” he explains, “they may have received suboptimal offers or incentives.”
Despite being most pessimistic about future revenue gains and cost reductions, respondents in
the consumer products sector anticipate the biggest increase in these measures (when comparing
between what has been realized in the past and what is expected for the future). This is likely
because these firms have yet to adopt these systems in a fundamental way. In contrast,
respondents in the oil and gas sector expect just the opposite—future revenue gains and cost
reductions are expected to be smaller than what was previously realized, though they will remain
higher than in other sectors. This further underscores the maturity of adoption in this industry.
Assessing Effectiveness
While early implementers agree that real-time business is effective, there is some variation in the
degree of effectiveness among functions. For example, early adopters rank its effectiveness more
highly in consumer experience (69%) and production processes (65%) than in financial and
business risk (58%) and sales and marketing (55%).

12
Real-time operations are seen as more effective by firms in the oil and gas sector than in the
other industries surveyed, perhaps as a consequence of the high level of adoption within the
sector. Apart from sales and marketing, a higher proportion of oil and gas respondents see real-
time business to be fairly or highly effective than the sample as a whole.
This gap is particularly marked for product design and innovation, and financial and business
risks, underscoring the power of real-time information in complex, capital-intensive
organizations.
The weak ranking of sales and marketing likely reflects the commodity nature of much of the
industry’s output. Meanwhile, early implementers from the retail sector are more likely to see the
initiative as ineffective or of limited effectiveness than their colleagues in other industries.
Future Investments
The vast majority of early adopters plan further investment across their business functions. For
them, consumer experience, supply-chain management, and product design and innovation rank
top as the business functions where further investment in real-time business will be directed,
with over 55% reporting fairly or very significant plans in these aspects of their operations
Fewer early implementers in oil and gas plan for further investment in sales and marketing
functions; instead, they plan to extend real-time approaches in production processes, supply-
chain management, and product design and innovation. Early adopters in retail, meanwhile, have
more modest plans for investment than other sectors. Nevertheless, for all business functions
except production processes, more than 40% of these firms plan for intensive expansion of their
capabilities.
As noted earlier, those planning to roll out real-time systems have different strategies than early
adopters. Rather than focusing on customer experience, they will focus on sales, marketing and
supply-chain management. These firms may be missing an important aspect of real-time
business, as early adopters rate consumer experience as the most effective area for real-time
operations. Meanwhile, almost all early adopters plan to continue investing and expanding their
real-time efforts, though they will move their spending from sales and marketing to product
design and innovation, while continuing to focus on customers.

13
Barriers to operating in real time
Despite the understood value of real-time systems, significant challenges remain with regard to
adoption. At the top of this list, respondents note the lack of availability or adoption of
technology (59%), suppliers’ unfamiliarity with real-time systems (58%) and a general lack of
internal knowledge or awareness of (58%) real-time operations.
Professor Gulati is not surprised by these findings, and points to data silos as one culprit. Similar
to the aforementioned barriers in retail, when information is not transparent or easily accessible,
“you have a situation where the person who owns the data, even if they are able to analyze it and
figure it out, is not in a position to impact change.” The resulting opacity around what types of
data exist and how they might best improve the business continues to hold companies back.
“You need to either move the decisions to the people who have the information, or move the
information to the people who are making the decisions,” he says.
At The Children’s Place, the challenges have been both cultural and technical. When Mr. Verma
arrived at the company a year ago, there were at least six separate merchandising systems, each
with its own set of data. Moving to a single system requires full-on collaboration and
communication—setting standards for data, and creating processes for generating reports and
sharing information. At the same time, asks Mr. Verma, “how do you get people to believe that
the new way is better?” Like any organization undergoing transformation, “there’s caution
among associates who have been here a while who have seen things work a certain way. You
have to demonstrate there are alter natives that have better outcomes. It’s all about educating.”
To that end, Mr. Verma has established a cross-functional IT innovation group at the company.
“If you give your team the opportunity to work in different environments and understand how
systems within individual business areas work together to connect business processes, they
become more open to change.”
By sector, consumer products firms see a lack of available technology as a particular barrier, and
generally judge the obstacles in the way of implementing real-time business to be greater than
other sectors. Surprising given their lead in using realtime business, oil and gas companies see
substantial barriers around communicating the benefits of real-time operations. From a cultural
perspective, “it takes time to roll these things out so that it becomes embedded in day-to-day

14
operations,” says Dr. Evans. “Given the high stakes that are involved in sustaining large energy
systems, both trust and capability need to be built for wide-spread deployment into pipelines,
networks and electrical distribution systems to be achieved.”
At Continental Airlines, Ms. Reynolds says the greatest challenge for her group will be
integrating the airline’s real-time revenue management systems with its new parent company,
United Airlines. Thankfully, “United reservations will be done on the Continental system once
they’re fully integrated, so all we have to do is figure out how to back populate the United
history and incorporate the new United forecasting system into the revenue management
calculations. It’s a lot of work—there are cases where United’s data doesn’t have all the
attributes that Continental has, but we expect to be fully integrated by the middle of next year.”
For the small group of respondents who do not plan to implement real-time operations, more
than half cite a lack of availability of technology, a lack of internal expertise and an inability to
communicate the benefits as quite or very important. It’s possible that for these firms, real-time
data is not necessary for operations. However, it is more likely that these respondents have not
yet fully considered how such systems could improve their business.
For firms that are at the beginning of their efforts to move to real time, Professor Gulati says
there are three steps executives must consider. The first is to make sure the information that is
gathered across the firm is accurate. Professor Gulati refers to this as the information
architecture. This may seem obvious, but executives constantly underestimate the complexity of
creating a single version of the truth.
The second step is to understand the processes by which information is shared across the firm,
and how departments need to use information to perform critical tasks. “This is the
organizational architecture,” Professor Gulati says. “Without clarity around who needs access to
what information, you’re working in a vacuum. No technology ever solved a business problem
by itself.”
The third step is to take a hard look at how decisions are actually made inside companies—which
can be different from understanding the organizational processes. Professor Gulati calls this the

15
decision architecture. “Think in terms of the reporting, and who has what mandates.” This will
require the IT team to work closely with executives across functions to ensure that the systems
are designed to be truly useful. “What happens in a lot of the initiatives that are CIO-driven is
that they work on the information, build a data warehouse and then add analytics. And then what
do you find? Nobody uses it.
Conclusion: Looking ahead
As our respondents confirm, use of real-time systems will only grow more pervasive in the
coming years. According to research firm Gartner, 30% of business analytics tools will use in-
memory functions to add scale and computational speed by 2014. And 30% of business
intelligence applications will use predictive forecasting.
As noted earlier in this report, executives expect to reap substantial revenues as a result of real-
time adoption. Mr. Verma of The Children’s Place says that real-time systems will be
instrumental in helping the company move to enable mobile commerce—a move that he believes
will transform the retail industry. “In the near future customers aren’t going to come into a store
to find their size. It will be more a scenario where on a whim, a customer decides he or she needs
something. They will use their mobile device to figure out what they are going to buy and where
they are going to buy it. Then purchase it wirelessly, and simply pick it up in the store.”
At LOVEFiLM, plans are under way to use real-time data to improve the streaming quality of
films.“We have capacity to scale based on demand, and the only constraints are around the
physical infrastructure associated with people’s network connections in the home,” says Mr.
Blakemore. “What we can do with real-time data is to look at the network down to customers’
internet service providers, and see which are the best local points of delivery.” In other words,
“If customers are having buffering issues or difficulty with playbacks because the network is
overloaded, we can switch to a different route to deliver content.” That, says Mr. Blakemore, will
dramatically improve service—and help it gain market share.
At GE Energy, one of the longer-term objectives for real-time data is “to allow consumers to
have more information and control of their energy use,” says Dr. Evans. While some of that
work is already happening with GE’s business-to business customers, Dr. Evans envisions a day
when a smart electricity grid provides transparent information to consumers so they can better
control the electricity consumed by the various appliances in their home.

16
Real-Time Data Analytics
Identified and Developed Case Studies
17
Case Study 1: KTH – Royal Institute of Technology
Overview
Analyzing large volumes of streaming data in real time is leading to smarter, more efficient and
environmentally friendly traffic in urban areas
Business Need: Researchers at KTH, Sweden’s leading technical university, gather real-time traffic data from a
variety of sources such as GPS from large numbers of vehicles, radar sensors on motorways,
congestion charging, weather, etc. The integration and analysis of the data in order to better
manage traffic is a difficult task.
Solution: Collected data is now flowing into a unique software tool that analyzes large volumes of
streaming, real-time data, both structured and unstructured. The data is then used to help
intelligently identify current conditions, and estimate how long it would take to travel from point
to point in the city, offer advice on various travel alternatives, such as routes, and eventually help
improve traffic in a metropolitan area.
Benefits: Uses diverse data, including GPS locations, weather conditions, speeds and flows from sensors
on motorways, incidents and roadworks -Enters data into the InfoSphere Streams software,
which can handle all types of data, both structured and unstructured -Handles, in real time, the
large traffic and traffic-related data streams to enable researchers to quickly analyze current
traffic conditions and develop historical databases for monitoring and more efficient
management of the system
Real Business Results
Uses diverse data, including GPS locations, weather conditions, speeds and flows from
sensors on motorways, incidents and road works
Enters data into the InfoSphere Streams software, which can handle all types of data, both
structured and unstructured.
Handles, in real time, the large traffic and traffic-related data streams to enable
researchers to quickly analyze current traffic conditions and develop historical databases
for monitoring and more efficient management of the system
18
Case Study 2: Pepperl+Fuchs
Overview:
After evaluating different alternatives, Pepperl+Fuchs decided to implement the log-based
technology IBM® InfoSphere™ Change Data Capture (previously DataMirror) for data
replication in the heterogeneous database environment. This means that data changes within
heterogeneous data storage systems can be monitored in real time and only the changed data
transferred.
Business need: Following the introduction of a central Enterprise Resource Planning (ERP) system, data in
different worldwide locations had to be integrated and synchronized so that production processes
and reporting on site can continue to be optimally supported.
Solution: Pepperl+Fuchs implemented IBM InfoSphere Change Date Capture (previously DataMirror) for
real-time data synchronization between different database platforms. The solution provides
minimal load on the central ERP system, high performance and reliable data integrity.
Benefits: Error tolerance and stability reduce administrator costs. Efficient implementation by a small
team within just a few days helped ensure low implementation costs and transparent training
efforts. High data transfer speed via existing landlines helps ensure low communication costs.
Operational data stores at the production locations in the United States and Singapore receive
current information at all times. The load of the central ERP system is significantly reduced;
expensive batch runs are not necessary; and operational systems are not exposed to risk.

19
Case Study 3: Ducati
Overview
Around the world motorcycle manufacturers are rolling out new models to delight bikers and
define success on and off the track. Ducati is responsible for the construction, importation and
distribution of motorcycles.
Business need: Ducati had been employing expensive manual methods to track its parts via a system of paper-
based spreadsheets. Human error occurred from time to time and delayed production.
Solution: A service oriented architecture-based RFID solution alerts management if an incorrect part is
being incorporated into the manufacturing of a motorcycle so that the company can rectify the
situation before the vehicle is manufactured, sold and driven.
Benefits: Projected 50% savings on revision campaigns and maintenance and monitoring of production
line ~ 30% decrease in time for scheduling and verification of products ~20% savings in
reclaimed scrap and missing parts
Tracking parts automatically Leveraging a strong preexisting business relationship, Ducati decided to design and implement
the RFID tag solution, which would enable real-time, automatic identification of each vehicle
and vehicle component along the entire production chain.
“This solution is the backbone of our development,” says the coordinator of informatics systems.
“We export the data coming from the RFID devices into a Java™ program in a web architecture.
We have a message system which alerts management to issues with components.”
Reducing errors and improving production efficiency The manufacturer deployed a total of three IBM® System x® 336 servers running the SUSE
Linux® V10 operating system to support IBM WebSphere® software and an IBM DB2® 9 data
server. Employees use wireless devices to scan RFID-tagged components and VINs into the
system. Approximately 100 users leverage the DB2 9 data server, 60 of whom can access it
concurrently. A custom-developed Java Platform, Enterprise Edition (Java EE) application—
powered by IBM WebSphere Application Server Network Deployment V6 software—will
enable employees to track inventory throughout the production life cycle.
The manufacturer anticipates that by replacing its legacy component-tracking system with an
RFID solution, it will reduce errors and improve production efficiency. For the company, fewer

20
errors translates into a higher-quality finished product, which will help improve customer
satisfaction and could potentially expand the company’s already large share of one European
motorcycle market. The new solution will also help improve the company’s ability to provide
suppliers with accurate inventory data. Using real-time data collected from the WebSphere-based
inventory-tracking application, employees can now tell suppliers if a certain product is in stock,
and quickly order new materials when inventory levels are low.
Up to 50 percent cost savings If a motorcycle is destined to be delivered to France and the factory installs a speedometer that
displays miles instead of kilometers, the solution alerts management in real time. “That way we
reduce the amount of errors directly in the assembly line,” says the coordinator of informatics
systems. “Another important innovation is replenishment of the components from the line to the
warehouse.” We also have fewer employees verifying parts manually, which saves costs.
Altogether, the cost of monitoring, maintenance, replenishment is 50 percent less.
“With the RFID solution we have seen a 30 percent decrease in the time for scheduling and
verification of production, so products reach the market 30 percent faster. In addition, we’ve
seen a 20 percent decrease in the cost of missing parts and scrap. We’ve had improvements in
other indirect costs because of the efficiency of the production line. All of these have shown
improvements in quality and service.”
Preventing revision campaigns As yet, Ducati hasn’t had a revision campaign in which it has had to test its new technology―a
sign that prevention is happening in the factory. “By avoiding the cost of one revision campaign
we have paid for this entire RFID implementation,” says the coordinator of informatics systems.
“So we are going to continue to invest in this technology. In the future, we would like to export
this SOA technology, this business project management, to our outside suppliers, so that our
suppliers can have this information at the same time we do. We also want to know what our
suppliers are doing at a particular moment for us, and therefore we will be able to consider if
something will be just in time or if it’s delayed. We’re also eager to change over to the smart
factory with smart supervision. And we will be doing this all in real time using Web 2.0
technology and the latest innovations in SOA and business project management, thanks to IBM’s
help.”
The improvements to the assembly line and inventory system have brought about efficiencies
that were unthinkable just three to four years ago, and the coordinator of informatics systems
hopes there will be more benefits to enjoy three or four years from now
Smarter car manufacturing Ducati was struggling with a parts tracking system that was based on paper and prone to error.
When a wrong part found its way onto a motorcycle on the assembly line, it was expensive to
correct the mistake. Now the company is working smarter and benefitting from savings in time
and money with the automatic monitoring and alerting performed by its RFID parts tracking
solution.

21
Case Study 4: Heathrow Airport
Overview:
In recent years, Heathrow faced a challenge not only keeping up with existing traffic but bracing
for major increases in traffic. Due to political and geographic issues, the airport had to live
within its existing footprint. In short, it needed to be a model of efficiency.
By harnessing the analytic capabilities of a BPM system, Heathrow managers have been able to
tune ground crews to incoming traffic by linking to the Euro Air Space system to give crews a
full 30 minutes warning before a plane arrives. A business activity monitoring (BAM) capability
is also used to manage crews, gate assignments, docking and undocking, refueling, cleaning, and
more.
In addition to providing a visual and intuitive indicator of where planes are in the process,
numerous scenarios can be invoked for different levels of traffic and delays. For instance, if
significant delays are expected for departing passengers, security systems are adjusted to keep
people in retail areas rather than gate areas for a longer period. This has resulted in happier
passengers and security workers and also had the serendipitous result of substantially raising
retail revenues.
“Today’s BPM handles expected exceptions but with newer tools you can start looking for
unexpected exceptions,” says Jim Sinur of Gartner Research. For instance, he indicated, you can
start to look for signs of inflation or deflation. You can look at complex event patterns and
certain recurring events and combine that with modeling.
“That is the top level—where someone managing the process gets notification either from
complex events or modeling tools that there is a good chance something unusual is happening,”
says Sinur.
Seek, model, adapt
Sinur says Gartner talks about using BPM in conjunction with a “Seek, Model, and Adapt”
approach. To date, BPM has tended to focus on the adapting part of the equation and may have
missed the “seeking” part, often because information exists across multiple processes.
He says the most successful users of BPM real time analytics should consider taking different
approaches, depending on whether they are a planning-oriented or reactive company and
depending on the specific analytic capabilities their system provides. Plan-oriented companies
often prepare for different scenarios and compose alternative responses for each—so when BPM
provides an early warning, they can leverage that information for quick action. Reactive
companies, on the other hand, may be able to leverage elements of real time analysis to “learn by
doing”—inventing new ways to operate quickly with the help of BPM analytics. “Some BPM
systems can provide modeling tools and automated process discovery to look for patterns,” says
Sinur. “This stuff is hot and will be for the next decade—companies are just starting to discover
the potential this represents,” he adds.

22
Case Study 5: KEMCO
Overview:
Korea Energy Management Corporation (KEMCO) is an organization that contributes the
national economy and develops and supplies future energy. KEMCO has created and provided
the data lookup screens by OLAP dedicated tool and key business system, every time line-of-
business users request. Meanwhile, as green growth has become the keyword to stand for these
times and the related laws have been embodied, the organization felt the need of having the new
class of business efficiency. KEMCO selected the Voluntary Agreement (VA)-related business
system started from 1998 as the first target for innovation and then they got the development of
BI system going in the end of 2009. It has driven the BI project to maximize the ease-of-use
through the Microsoft's solution instead of the existing OLAP tools. Through this, having noticed
the business efficiency of the user environment where they can draw the statistics they want on
Excel without moving to lookup screen each time, KEMCO has a plan to extend the user-
oriented BI into their other system areas.
Situation
The statistical and analytical business is of the highest importance to Korea Entergy
Management Corporation (KEMCO) leading the charge as it tries to implement the green growth
and low carbon economy. Since it is the organization managing the demands for energy, the
statistics and analysis is the key to its all businesses.
KEMCO has made a number of statistical and analytical data viewed in a data lookup page by
key business system. Prior to creating reports, they had to log in the data lookup site of the
related business system and extract the data. And if there is any hard-to-acquire information from
the view, they had requested it to Information Statistics Division and KEMCO via e-mails or
phone calls. After collecting data, they arranged and analyzed it in Excel to create reports
ordinarily.
The need of new class of efficiency has not been on the rise in such a business process until the
'green' emerged as the keyword passing through this time. In a major move towards green growth
everywhere including economy and society, the government declared the low carbon green
growth as a national vision in 2008.
To support this institutionally, the preparation for the Framework Act on Low Carbon, Green
Growth (hereinafter, Green Act) is under discussion commonly. Naturally, as the KEMCO's
stature and role has grown, for statistics and analysis business as well, they need to prepare the
future changes with the stream of times.
VA (Voluntary Agreement)-related business was picked up as the first target for innovation. VA
is the non-compulsory energy saving measurement where a corporation sets itself the objective
of energy saving or greenhouse gas emission reduction for five years and makes an agreement
with government, and then the government helps the company fulfill this agreement to make the
objectives achieved with the collaborative effort of two parties.
23
KEMCO has collected and analyzed a number of information for evaluating and monitoring VA
related corporations' fulfillment. As the demand for this statistical and analytical information has
increased in an era of Green Act, the VA related business is chosen first as a target for
innovation.
Yeong-sang Yoon, Leader of Information Statistics Division, KEMCO, stated, "Analytic works
related to VA has increased. It is because of increased corporations participating to VA, and
Green Act is the key background as well. KEMCO manages the industrial development segment,
one of targets to be managed by Ministry of Environment, with regard to the enforcement of
Green Act."
Actually, in addition to its existing job of establishing the energy saving goal and then
monitoring and evaluating its enforcement, its statistical and analytical activity will be extended
to the measurement, reporting and verification of greenhouse gas emission for the emission
trading scheme between corporations regarding the industrial development initiatives.
Solution
KEMCO selected the new approach of BI (Business Intelligence) for innovating statistical and
analytical business related to VA system. Making a decision that it was no more efficient to
develop the screen each time needed, KEMCO viewed BI the best way, since the kind and the
number of materials required to analyze increased.
KEMCO grappled with the problem of finding technical methodology for implementing BI.
It thought adding BI to VA would only have a marginal effect in the light of its own experience,
unless it could overcome the limitations of OLAP dedicated tool. Yoon-geun Han, Director of
RealWeb which was responsible for this BI project, explained, "KEMCO has ever introduced the
PowerPlay of Cognos and OLAP tools developed by a domestic development firm. As it difficult
to use these tools without expertise, its usage was not too high. Thus these proprietary tools were
not appropriate for satisfying the needs of users to extract statistics they want if needed."
The system developed during August to December 2008 was configured to make the data
exported from VA systems operated on SQL Server 2005 and distributed and shared through the
Microsoft Office SharePoint Server 2007's Excel Services. The existing lookup screens were
removed except the page used to access by its staff outside the company. Besides, About 10 data
marts were created to reside on SQL Server 2008.
Finishing BI development for VA system successfully, KEMCO is considering extending BI into
its other systems step by step. Mr. Yoon stated, "We have noticed that BI was very useful from
the case of VA system. Now we are in discussions with Microsoft about applying BI to Climate
Change related business and have a plan of approaching to all sorts of statistical and analytical
business which we do from a enterprise-wide BI perspective in the mid- and long-term."
24
Benefits
Complete the data collection that used to take 3 days in real time Staffs dealing with data analysis related to VA are feeling that all the before and after of BI
implementation are certainly different. This is because they spend less time to collect materials,
thus they have to only focus on writing reports.
Mr. Yoon said, "If we failed to get information we want in the lookup screen, we have to request
the materials to the Information Statistics Division and it took at least 2-3 days to receive it. Now
we don't have to spend our time to wait materials. We can bring the data on data marts in system
into Excel."
Respond immediately to the request of a variety of statistical reports Analysts don't have to drill down to 10~20 lookup pages or request the materials they need to the
information statistics division, which increase their responsiveness to businesses.
Mr. Yoon said, "Unlike general enterprises, a public institution has to consider the statistics in
building business systems. It has to submit the data to superior authorities if they request. After
the SQL Server based BI system was implemented, we don't have to look up the law data case by
case, freeing us to focus on our own tasks including writing graphs, which makes our
responsiveness to statistical and analytical business increased."
Reduce cost about 60% compared to that of OLAP dedicated tool KEMCO broke stereotypes that BI is the expensive tool from this project. It was not a challenge
followed by big investment once the organization actually tried to do it. They found that their
will and practice were important.
Mr. Yoon explained, "While Introducing OLAP tool will need at least 100 million won to be
invested, we spent less than 30 million won in this BI system implementation."
KEMCO expects that these cost reduction effects will really come into its own in the case of
applying BI into the system that many people use in the future. Unlike the VA system that 50
analysts use, in case of the system that has to support more users, cost benefits of Microsoft's BI
solution is expected to be much higher compared to that of the traditional OLAP tool.
Ensure a smooth transition One of results of moving from lookup screen to BI is the smooth transition of VA related
business. Mr. Yoon said, "A person in charge is changed regularly in our organization, so there
was a difficulty in transition for the successor in analytical business. Analysts often need their
personalized environment due to the nature of statistical and analytical tasks. Thus in case of
delivering information based on lookup screen in the past, the new analyst often requested a new
screen to be developed. Now using Excel ensures a smooth transition

25
Case Study 6: Faro Hospital
Overview: Faro Hospital provides medical services for citizens in the Algarve region of Portugal. The
organisation wanted to improve decision making and increase efficiency. It deployed a business
intelligence solution based on Microsoft SQL Server 2008 R2 data management software.
Funding and resourcing strategies are now based on accurate, real-time data, which has helped
the hospital reduce costs and improve patient care.
Business Needs Founded in 1979, Faro Hospital provides medical services for more than 250,000 people in the
Algarve. The hospital complex covers 46,500 square meters and has 530 beds. In December
1999, it became a state-managed organisation, with specific government targets. In addition to
providing high-quality medical care to patients, the hospital managers needed to streamline
processes and minimize costs.
Until recently, each department used its own applications to manage patient records and
employee schedules. Francisco Serra, Head of IT Strategy for Faro Hospital, says: “It was
slow—often impossible—to share information across departments quickly.” For example, any
time nurses needed outpatient treatment information they had to request a manual transfer of the
records from the outpatient clinic. This slowed patient treatments, and prevented the hospital
from providing the quality of care to which it aspired.”
This lack of integration also delayed decision making. “It took a long time to consolidate
sufficient information to achieve an overview of the entire hospital,” says Serra. “Managers had
no day-to-day view of the organization’s activities, so it was difficult for them to make crucial
decisions quickly. For example, if a problem occurred, such as a need to arrange cover for a
surgeon or specialist, it was impossible to make a fast decision about how to resolve it.”
Collecting the data was also a lot of work for employees. “Staff were spending too much time
collecting, organising, and re-entering information, instead of doing their jobs. For example, if an
employee needed information from another department, such as medical records, it would have
to be requested and manually delivered. We needed to increase employee efficiency and start
generating a better return on investment from our workforce,” says Serra.
Solution
In January 2009, Faro Hospital engaged with Microsoft Services to create a hospital management
solution based on Microsoft SQL Server 2008 data management software, Microsoft Office
SharePoint Server 2007, and Microsoft Office PerformancePoint Server 2007 business
intelligence software. The solution consolidates data, such as patient records, appointments, and
staff schedules, into a centralized repository.

26
Office SharePoint Server 2007 acts as the hospital intranet where employees can update and
view patient data. If a patient is transferred to a different department or specialist, this
information is always captured in Office SharePoint Server 2007, ensuring that treatment history
can be accessed by doctors and nurses in different departments.
Benefits
Since deploying SQL Server 2008, Faro Hospital can make decisions based on real-time data.
This helps the hospital to manage resources effectively, minimize costs and reduce employee
workloads. As a result, patient and employee satisfaction has increased.
Managers make more informed decisions. Faro Hospital creates reports with up-to-
date information about every part of the hospital, and can make intelligent decisions
based on that data.
Costs are reduced. “With SQL Server 2008 R2, we can identify areas where we are
failing to get a return on investment,” says Serra. “We can then reallocate these resources
to make sure everything is as cost-effective as possible.”
Quality of care has improved. Patient appointments are easier to manage than before.
Serra says: “We can optimize the number of patient appointments in a day, because we
can forecast them more accurately. By looking at historical data we can get a good idea
of how many employees are needed to meet patient demands, and plan for cover if any
personnel are absent on leave or as a result of sickness.”
Patient care has improved. Because different departments can collaborate more
efficiently, patients get a better service. Serra says: “All departments have access to
accurate data, and can share information, such as medical records, with ease. As a result,
patients receive a consistently good service across all departments, getting care very
quickly.”
Employee satisfaction has increased. “Employees have noticed a distinct improvement
in services, and are much happier as a result. There’s less pressure on them because
planning has improved, and they have more time available to do their jobs,” says Serra.
Improved shipping efficiency—and thus profitability—by eliminating silos across
business lines and enabling users to model and analyze shipments to determine where
they can consolidate or add multiple stops to improve service or reduce costs
Exceeded expectations for productivity improvements and cost savings at the eight sites
deployed to date, already saving more than US$2 million
Provided more predictable processes in outbound shipping, enabling planners to more
quickly and easily manage exceptions, which now happens much less frequently
Freed planners from day-to-day outbound shipping monitoring, instead enabling them to
work on continuous improvement by reaching out to customers to see how they can better
meet their needs

27
Benefited from integrations between Oracle E-Business Suite, as well as third-party
applications, which is helping to improve efficiency and reduce administrative effort

28
Predictive Data Analytics
Identified and Developed Case Studies

29
Case Study 1: Ingersoll Rand
Overview:
Ingersoll Rand is a global, diversified industrial firm providing products, services, and solutions
that enhance the quality of air and comfort in homes, buildings, and transport and that protect
food and perishables, secure homes and commercial properties, and increase industrial
productivity and efficiency.
Given the breadth of its product offerings and its global reach, the company has a complex
network of manufacturing and distribution operations. To increase efficiency while ensuring that
it continues to deliver the superior service its customers expect, Ingersoll Rand implemented
Oracle Transportation Management to coordinate its outbound shipping across various lines of
business and facilities.
Even while the application was implemented currently at eight sites of the company’s more than
70 locations, it already exceeded expectations for improved productivity and cost savings. With
Oracle Transportation Management, users can view shipping plans across lines of business and
facilities, enabling them to adjust shipments to increase efficiency, such as making multiple stops
within one shipment. The application has already contributed to more than 2 million dollars in
savings and increased on-time delivery rates.
Challenges
Provide superior customer service by ensuring quality, cost-effective, on-time delivery of
products across multiple business lines, ranging from Trane heating and cooling systems
to Schlage locks
Manage high shipping volumes, amounting to several thousand lines per day, from
several facilities, including discrete manufacturing centers and warehouses
Meet tight delivery windows for industrial products, such as compressed air systems,
which must arrive when an installation crew is on site to deploy it to avoid undue
customer costs and project delays
Solutions
Deployed Oracle Transportation Management to replace legacy transportation
management systems and provide a streamlined and integrated outbound shipping
process―leveraging truckload, less-than-truck-load, and parcel modes―across four
diverse business sectors
Rolled out the application as part of an Oracle E-Business Suite implementation at eight
sites with plans to roll out to all Ingersoll Rand manufacturing and distribution locations
Increased the percentage of on-time deliveries―with on-time deliveries now averaging
above 95%

30
Case Study 2: EMC Insurance Companies
Overview:
EMC Insurance Companies struggled with pinpointing the right amount of money to hold in
reserve against potential case payouts; holding back either too much or too little could be
disadvantageous to the firm’s bottom line. After a year in which the company experienced a run-
up in reserves, EMC took steps to improve financial reserve management. The company selected
PolyVista, advanced data analytics software built on Microsoft SQL Server Analysis Services, to
uncover anomalies, correlations, relationships, and patterns hidden within the firm’s warehouse
of claim data. After deploying the solution, EMC was able to improve financial reserve
management, identify claims requiring special attention, improve data quality, support executive
decision making with improved analysis, and better manage expenses.
Situation
EMC Insurance Companies sell workers’ compensation, property, and casualty insurance
through independent insurance agents in 16 branch offices across the United States. Founded in
1911, EMC is one of the largest insurance companies in its home state of Iowa. With assets of
approximately U.S.$3 billion, the insurance firm has the bulk of its volume in commercial lines
of business, with the remaining 15 percent in personal lines.
The Challenge of Financial Reserve Management
EMC manages its loss reserves—money set aside for paying future insurance claims—by setting
up a reserve for every case that the company handles. “When a claim walks in the door, we try to
determine what is the most likely outcome for that claim,” explains Rich Schulz, Senior Vice
President of Claims for EMC Insurance Companies. Strategic management of financial reserves
can be a key contributor to the success of any insurance firm, and they are important indicators
that are looked at by both insurance regulators and investors.
“It’s a real balancing act; you don’t want to underreserve or overreserve accounts. Consistency is
critical,” says Schulz. “In 2004, we saw that our loss reserves were starting to creep up and yet,
with all the tools we had, we were unable to pinpoint exactly what was happening. We realized
we had to get a better handle on the way we were setting our reserves, and I was brought in to
EMC to improve our management of our financial reserves.”
Schulz wanted to be able to predict the company’s claim outcomes on an ongoing basis and,
hopefully, identify and closely monitor those cases likely to have negative outcomes such as
increased costs, additional services, or a lengthy resolution. “We had all this claim data and not
an effective way to look at it,” says Schulz. “We wanted a tool that would allow us to look at
trends that the company was experiencing and be able to figure out what was driving them.” He
looked at a number of predictive modeling tools available on the market, but found that initial
investment costs were high and the cost of maintaining those tools was far beyond what the
company was willing to pay.

31
The Need to Identify Trends EMC stored a great deal of data in its internal claim processing system, but managers needed the
ability to sift through that data more efficiently. For example, executives at EMC wanted to track
and understand company trends related to claim frequency, which is the ratio of claim volume to
premium volume, and severity, which is the ratio of claim cost to premium volume. Not only did
they need to track these measures in order to manage their business, but executives also were
expected to provide explanations of sudden trend changes to industry analysts.
“Right before a first quarter earnings call, I was asked about a change in the severity and
frequency of workers’ compensation claims,” says Schulz. “At the time, I had to call individual
branches to inquire as to what was going on.” EMC had no good system of reporting that could
be quickly used to discover the reasons behind unexpected changes.
Schulz also needed to be able to track expenses both across the company and by individual
branch, and he wanted the flexibility to analyze expenses in consideration with other factors.
“Currently, most claim people are under a lot of stress about expenses,” Schulz says. “The ability
to understand where expenses were running high is important. All of our adjustment expenses
are open to analysis. [For example,] do we have one or two business units that are overusing
certain types of vendors to investigate claims?”
Solution
In need of an affordable and effective solution, EMC Insurance Companies heard about
PolyVista business intelligence software, which provides two important capabilities: A business
user can use it to drill up and down on data, and it can automatically identify anomalies,
correlations, relationships, and patterns that are hidden in that data—all without requiring custom
code or predefining the anticipated results.
EMC was interested in determining whether the PolyVista software, which uses Microsoft SQL
Server Analysis Services as its core engine, could help the firm with its data analysis needs.
Analysis Services has become the dominant multidimensional engine in the market. It provides a
robust open development environment that allows us to build and enhance our unique
sophisticated analytic product at an affordable price point.
EMC decided to move forward with implementation of the business intelligence solution.
Because the company had not previously used SQL Server 2005 Analysis Services, key IT
personnel at EMC completed training.
After EMC completed the training, PolyVista sent a senior consultant to EMC to train key IT
staff members and business users on the business intelligence software. During the fall of 2007,
the complete implementation of the business intelligence solution at EMC was finished in less
than eight weeks.
As of February 2010, there are 24 PolyVista users at EMC—8 powers users and 16 casual users.
EMC has relied on the power users to complete complex analysis and to assist other users with
the software.
32
Benefits From the beginning, EMC Insurance Companies anticipated many uses for the business
intelligence solution. The initial goal was to improve reserve account management; however, the
insurance firm is also building predictive modeling into the claim system and has improved the
quality of data. Finally, EMC is improving decision making and controlling expenses.
Effective Management of Financial Reserves
EMC relies on PolyVista as its primary tool for managing case reserves. Since the
implementation of the business intelligence solution, EMC has managed its financial reserves
more accurately and the company has avoided the volatility that can occur when reserves are not
consistently and accurately established.
The software has helped the firm ensure that all branches are in compliance with the company’s
reserve guidelines.”
Predictive Modeling System for Improved Claim Outcomes
EMC is using PolyVista to add predictive capabilities to the automated claim system. Now, the
company can identify casualty and workers’ compensation claims that are likely to have a
negative outcome and assign these claims to the company’s most experienced people to help
mitigate potential risks. If a claim is not properly identified or assigned, it can take longer to
resolve and result in additional costs and services. By recognizing the complexity and risk
factors early on, an experienced claim manager can expedite the claim with better results for both
the claimant and EMC.
Better Data Quality Enhanced reliability and accuracy of data with the business intelligence solution was an
important realization for EMC.
In the highly regulated insurance industry, data quality is an important aspect of compliance. For
example, Schulz says, “Under the federal government’s Medicare Secondary Payer laws, we
have to have the age of the claimant or insured in our system. We now can run reports showing
the portion of claims that don’t have an age or have an age that doesn’t match other data or
doesn’t make sense.” These reports allow EMC to identify and fix errors before submitting data
to the Medicare program.
Improved Executive Analysis to Support Decision Making During periods of rapid change, EMC relies on its business intelligence solution to help
executives turn data into knowledge and make more informed decisions. “When you have
weather events or the economy is changing in a specific area, you need to understand how it is
affecting the business,” says Schulz.
Effective Control of Expenses By using the business intelligence solution, EMC is able to track expenses and control costs that
are tied to specific buys, and match data by business unit.

33
Case Study 3: National Science Foundation
Overview:
The NSF is helping to predict earthquakes across the world in real time. The system has been
developed by a consortium of universities and government agencies, with funding from NSF
(National Science Foundation), to provide an infrastructure of networked tools for research in
ocean science – constructing an internet-based system to collect and share data.
Real-time Seismic Monitoring Program
This is a large system with 16,000 land and sea-based sensors, each sending several channels of
seismic event data at a rate of 40 data points per second. The application executes in an Amazon
EC2 Cloud on a cluster of SQLstream servers, connected by an AMQP message bus.
SQLstream’s AMQP adapter (built with RabbitMQ) enables the streaming SQL application to
view the AMQP bus as a domain of input and output data streams. The initial prototype was
upgraded to a full-scale system running on a cluster of servers without any changes to the
streaming SQL application.
SQLstream’s contribution to the project, an application that processes seismographic data in real-
time, demonstrates:
1. An operational deployment of streaming SQL for scientific calculations in real-time
2. Real-time distributed processing in an Amazon EC2 cloud using SQLstream and AMQP
3. Rapid development and rollout of real-time data applications using standards-based
streaming SQL.

34
Seismic Monitoring:
The sensor network contains about 16,000 seismic sensors, organized into grids, covering large
parts of the North American continent and the adjacent oceans (see illustration below). Each
sensor measures the motion of the ground under it in three dimensions, and transmits its data as
several digitized channels, typically sampled 40 times a second.
While the rate of each signal channel is modest (since seismic waves are low-frequency),
this adds up to a large amount of data to process in real time. Moreover, the rules for detecting a
seismic event are heuristics that apply to a time interval of several minutes: so the application has
to calculate some quantities from the raw data and to store these calculated values over a time
window.
But to detect an earthquake reliably, it’s better to monitor all the sensors at once, looking for a
disturbance in the signals that first appear in one place, and then appear in nearby places: a
disturbance signal that propagates and changes shape in a way consistent with the physics of a
seismic wave.
Real-time sensor network management in an EC2 Cloud Monitoring tens of thousands of signal channels arriving at 40 sample points per second is a
complicated problem, but it can be made simpler by breaking it into stages. We’re interested in
earthquakes, which are infrequent, so SQLstream first reduces the amount of data by scanning
each channel for patterns that suggest the beginning, the peak or the end of a quake: in other
words reduce the dense signal to a sequence of interesting events. Then we can look for events
detected on other channels that could be due to the same quake propagating in physical space and
time.
In the first phase, we built a real-time seismic event detector in streaming SQL.
We translated a scientific algorithm into streaming SQL, and connected to the scientific sensor
data infrastructure – using our AMQP adapter. This involved less than 100 lines of streaming
SQL.
In the second phase, the prototype was scaled up to a full-size system, dealing with 16,000
sensor channels, running on multiple SQLstream server nodes created automatically in an
Amazon Elastic Cloud. This expansion required no changes to the streaming SQL application
developed for the initial prototype – simply running the same streaming SQL application inside
an elastic container/manager.

35
Real-time Event Detection with Streaming SQL:
The sensor data processing pipeline has five functional stages
1. Reading Messages – over the AMQP adapter. A configuration parameter specifies which
“topics” SQLstream subscribes to, that is, which set of sensor channels it receives.
2. Unpack Data – a user defined transform (UDX) unpacks data channel messages into
individual data points.
3. Signal Processing – extract higher order information from the raw data to identify seismic
events given background noise and non-seismic ‘bumps’. An example function would be
to calculate the ratios of multiple rolling averages of the signal value (x) over different
time windows.
4. Event Detection – The next stage applies heuristic rules to the processed data streams –
the output is much sparser: a stream of significant events, each indicating a possible
start/peak/stop of a seismic wave on a particular channel. If events of the correct type
occur within a correct interval of each other (as shown in the Signal Plot Diagram), they
are accepted as significant.
5. Writing Messages – output (publish) significant events over the AMQP adapter.

36
Case Study 4: Laboratorios Indas
Overview:
Laboratorios Indas is the largest manufacturer of sanitary and hygiene products in Spain.
Headquartered in Madrid, the company distributes its products through retail channels such as
pharmacies, hypermarkets and supermarkets, as well as hospitals throughout the country.
Business need: The company’s existing method of collating sales data was neither reliable nor user-friendly, and
the inability of sales teams to share client information prevented analysis of customer behavior,
which limited potential sales revenue.
Solution: Laboratorios Indas has implemented a business intelligence solution that provides precise
intelligence on where and how sales efforts should be focused in order to maximize profitability.
The company now integrates and analyzes large quantities of sales data captured and uploaded
via sales reps’ PDAs, together with demographic data to build sophisticated statistical models
that provide deep insights into likely sales patterns, at the individual product level, for
pharmacies in different locations.
Results: Increased average sales per pharmacy by 37 percent over the prior year. Reduced the average
time it takes sales reps to compile sales data from store visits by 92 percent, from five minutes to
25 seconds.
Benefits: Began generating commercial benefits just four months after implementation by providing
insights into the likely product demand patterns for individual pharmacies. This enabled the
company to target key pharmacies more systematically with visits, emails and mailings to help
drive sales.
Instrumented Captures all sales data and order history, plus client and customer demographics, in a central data
warehouse for data mining.
Interconnected This technology integrates sales information from PDAs in the field with population size,
socioeconomic levels and number of pharmacies in the region, providing real-time predictive
marketing support.

37
Intelligent Increases sales per pharmacy by 37 percent by using statistical analysis to leverage real-time
order history and local demand patterns. It also reduces effort for sales teams while optimizing
sales visits, strengthening customer loyalty and expanding the business.