real-time monitoring of phase maps of digital shearography
TRANSCRIPT
Real-time monitoring of phase maps ofdigital shearography
Lianqing ZhuYonghong WangNan XuSijin WuMingli DongLianxiang Yang
Downloaded From: https://www.spiedigitallibrary.org/journals/Optical-Engineering on 06 Jan 2022Terms of Use: https://www.spiedigitallibrary.org/terms-of-use

Real-time monitoring of phase maps of digitalshearography
Lianqing ZhuBeijing Information Science and Technology
UniversitySchool of Instrument Science and Opto-Electronic
Engineering12 E. Xiaoyin Rd., Qinghe of Haidan DistrictBeijing 100192, China
Yonghong WangHefei University of TechnologySchool of Instrument Science and Opto-Electronic
Engineering59 Tunxi Rd., Hefei 230009,China
Nan XuOakland UniversityDepartment of Mechanical EngineeringOptical Laboratory2200 N. Squirrel Rd.Rochester, Michigan 48309
Sijin WuMingli DongBeijing Information Science and Technology
UniversitySchool of Instrument Science and Opto-Electronic
Engineering12 E. Xiaoyin Rd., Qinghe of Haidan DistrictBeijing 100192, China
Lianxiang YangOakland UniversityDepartment of Mechanical EngineeringOptical Laboratory2200 N. Squirrel Rd.Rochester, Michigan 48309E-mail: [email protected]
Abstract. Digital shearography has demonstrated great potential in directstrain measurement and, thus, has become an industrial tool for non-destructive testing (NDT), especially for NDT of delaminations anddetection of impact damage in composite materials such as carbon fiberreinforced plastics and honeycomb structures. The increasing demand forhigh measurement sensitivity has led to the need for real-time monitoringof a digital shearographic phase map. Phase maps can be generated byapplying a temporal, or spatial, phase shift technique. The temporal phaseshift technique is simpler and more reliable for industry applications and,thus, has widely been utilized in practical shearographic inspection sys-tems. This paper presents a review of the temporal phase shift digitalshearography method with different algorithms and the possibility forreal-time monitoring of phase maps for NDT. Quantitative and real-timemonitoring of full-field strain information, using different algorithms, ispresented. The potentials and limitations for each algorithm are discussedand demonstrated through examples of shearographic testing. © TheAuthors. Published by SPIE under a Creative Commons Attribution 3.0 Unported License.Distribution or reproduction of this work in whole or in part requires full attribution of theoriginal publication, including its DOI. [DOI: 10.1117/1.OE.52.10.101902]
Subject terms: digital shearography; nondestructive testing; real time; phase map;temporal phase stepping.
Paper 121756SS received Nov. 29, 2012; revised manuscript received Feb. 13,2013; accepted for publication Feb. 25, 2013; published online Apr. 8, 2013.
1 IntroductionVarious full-field optical techniques such as digital shearog-raphy, digital holography, electronic speckle pattern interfer-ometry (ESPI), thermography, and digital image correlationhave been applied in recent years for full-field non-destructive testing (NDT).1–6 Of these techniques, digitalshearography has demonstrated many advantages for real-world applications.7–11 Unlike other techniques, digitalshearography uses a special shearing device to directly mea-sure a displacement gradient rather than the displacementitself. This significant feature is particularly important forfield NDT applications. Displacement gradients containstrain information and defects in materials generate strainconcentration. As a result, digital shearography displays de-fects more directly. Rigid body motion also does not producea displacement derivative. The relative insensitivity of digitalshearography to environmental noises makes it better suitedfor field applications. Currently, digital shearography has
become an industrial tool for NDT, especially, for NDT ofdelaminations in composite materials and honeycombstructures.12–17
There are two modes for displaying the testing resultsobtained from shearographic NDT which include the inten-sity fringe pattern and the phase map. The intensity fringepatterns are obtained by subtraction and squaring operationsor taking an absolute value. Even though an intensity fringepattern can be observed in real time, its measuring sensitivityand resolution is not as high as the phase map.18 The inten-sity fringe pattern’s smallest measurable phase value is2π, and phase can only be measured at locations of fringeorders. It is true that a smaller phase value can be measuredin the intensity fringe pattern by interpolation, and it shouldbe good for quantitative measurement of deformation andstrain such as in ESPI. However, it requires intensive com-putation and usually needs an off-line operation and, thus,the on-line and real-time measurement becomes impossible.
Optical Engineering 101902-1 October 2013/Vol. 52(10)
Optical Engineering 52(10), 101902 (October 2013)
Downloaded From: https://www.spiedigitallibrary.org/journals/Optical-Engineering on 06 Jan 2022Terms of Use: https://www.spiedigitallibrary.org/terms-of-use
Furthermore, the interpolation enables the measurement ofsmaller phase values; however, it is unable to increase thespatial resolution. By comparison, the phase map modecan measure phase values much smaller than 2π with muchhigh spatial resolution, usually to a resolution of 2π∕30 to2π∕50, depending on such factors as speckle noise (dueto the setup built) and software developed for the system.19,20
In addition, the phase can be measured at the location of eachpixel. Obviously, the phase map mode has much highermeasuring sensitivity and resolution than the intensity fringepattern mode for phase measurement. Therefore, it has amuch higher sensitivity for measuring the displacement gra-dients because the phase is directly related to the displace-ment gradient in shearography. The increasing demand foron-line NDT by digital shearography has led to the needfor a real-time monitoring of phase maps. Real-time moni-toring can provide effective procedures allowing interactionof the operator such as applying proper load levels wheninspecting unknown configurations. Furthermore, the oper-ator can observe the evolution of defect-related phasechanges which leads to higher reliability. A phase map canbe generated by applying the temporal, or spatial phase, shifttechnique. It is generally considered that the temporal phaseshift technique is better suited for static measurement whilethe spatial phase shift technique is suited more for dynamicmeasurement and has enormous potential for real-time dis-play of the phase map.21–24 Theoretically, this statement istrue if a shearographic system is used under a laboratory con-dition. Practically, however, the spatial phase shift techniquehas not been accepted by commercialized shearographicNDT tools in field applications15–17 because of its relativecomplexity in optics and a high requirement for preciseadjustment of the optical setup. In the spatial phase shiftshearography, carrier fringes are usually required. Carrierfringes can be generated by a Mach–Zehnder based interfer-ometer by introducing an additional reference beam or byutilizing a multiple-aperture mask diffraction.25–27 All ofthese techniques require precise adjustment of the referencemirror and beam or a specially designed multiple-aperturemask structure. If they are disarranged during transportationor field application, a complicated and fine adjustment isneeded which does not meet the requirements of a practicalindustrial testing system.
The temporal phase shift technique is simple and reliablefor industry applications.28 Therefore, it has been widelyutilized in practical shearographic inspection systems. Thetechnique, however, needs to record three or more images,which makes real-time display of the phase maps difficultor impossible. In the last decade, different research groupshave reported their attempts for measuring a phase distribu-tion using only one speckle interference pattern acquiredunder dynamic conditions, such as N þ 1 (N ¼ 3, 4, and 5)clustering methods, N þ 1 least squares methods, and N þ 1temporal phase shifting methods (also called as filteredsecondary speckle interferograms methods).1,2,8,29–31 Theclustering algorithm is able to determine a phase changeusing only one loaded image; however, to determine thephase change on each single point, it needs the informationfrom its multiple adjacent points, which requires high inten-sive computation. The algorithm is good for postprocessinginstead of on-line and real-time test. Likewise, the leastsquares method also requires high intensive computation.
This paper will present a review of simple N þ 1 temporalphase shift methods for real-time display of phase map inshearography. A comparison of the display speed and phasemap quality among N þ N (N ¼ 3, 4, and 5), N þ 2, andN þ 1 have been made. Quantitative and real-time moni-torings of full-field strain information, using differentalgorithms, are presented. Each algorithm’s potentials andlimitations are discussed and demonstrated through exam-ples of shearographic testing. For simplification, 3þ 3,3þ 2, and 3þ 1 algorithms has been selected for studyingin details. The results obtained are also suited for 4þ 4,4þ 2, 4þ 1 and 5þ 5, 5þ 2, and 5þ 1 algorithms.
2 Brief Review of Fundamental of DigitalShearography
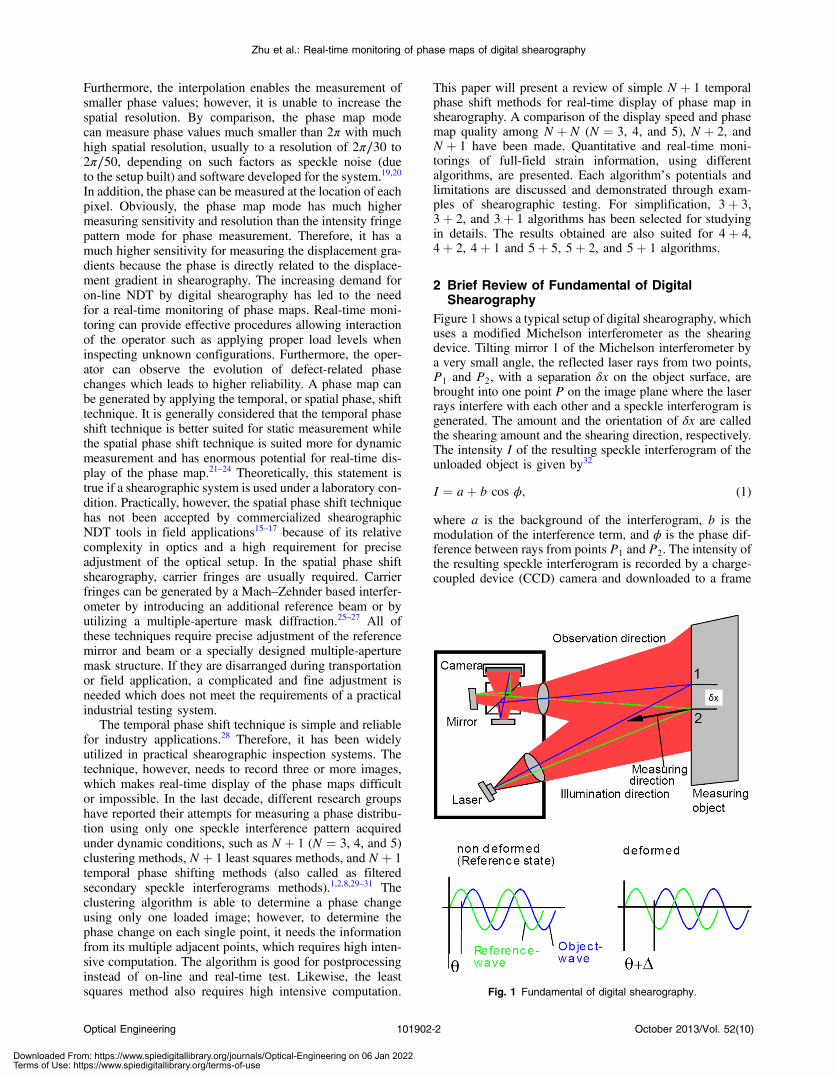
Figure 1 shows a typical setup of digital shearography, whichuses a modified Michelson interferometer as the shearingdevice. Tilting mirror 1 of the Michelson interferometer bya very small angle, the reflected laser rays from two points,P1 and P2, with a separation δx on the object surface, arebrought into one point P on the image plane where the laserrays interfere with each other and a speckle interferogram isgenerated. The amount and the orientation of δx are calledthe shearing amount and the shearing direction, respectively.The intensity I of the resulting speckle interferogram of theunloaded object is given by32
I ¼ aþ b cos ϕ; (1)
where a is the background of the interferogram, b is themodulation of the interference term, and ϕ is the phase dif-ference between rays from points P1 and P2. The intensity ofthe resulting speckle interferogram is recorded by a charge-coupled device (CCD) camera and downloaded to a frame
Fig. 1 Fundamental of digital shearography.
Optical Engineering 101902-2 October 2013/Vol. 52(10)
Zhu et al.: Real-time monitoring of phase maps of digital shearography
Downloaded From: https://www.spiedigitallibrary.org/journals/Optical-Engineering on 06 Jan 2022Terms of Use: https://www.spiedigitallibrary.org/terms-of-use
grabbing circuit board where the analog signals from theCCD array are digitized.
When the object is loaded, an optical path change occursdue to the deformation of the object’s surface. The opticalpath change induces a relative phase change between raysfrom two points P1 and P2. Thus, the intensity distributionof the speckle interferogram is slightly altered; this is math-ematically represented by
I 0 ¼ aþ b cosðϕþ ΔÞ; (2)
where I 0 is the intensity distribution after deformation and Δis the relative phase change due to the relative displacementbetween the two points P1 and P2 in measuring direction.
2.1 Display of Shearographic Test Result UsingIntensity Fringe Pattern
Subtraction between I 0 and I and displaying the absolutevalue of the subtraction data Is (intensity value is always pos-itive) results in a visible fringe pattern with the followingrepresentation:
jIsj ¼ jI 0 − Ij ¼ bj cosðϕþ ΔÞ − cos ϕj: (3)
At the locations where Δ ¼ 2nπ, n is the fringe order whichis equal to 0; 1; 2; 3; : : : ; Is becomes zero, resulting in theformation of dark fringes. This is known as displaying modethrough the intensity fringe pattern. If the intensity of the un-loaded image I (reference image) is continuously subtractedfrom the intensity of loaded live image I 0 (loaded image), thevisible fringe pattern can be observed in real time.
If the angle between the illumination direction of the laserand the observation direction of the camera is equal or closeto zero, the relative phase change Δ is related to an out-of-plane displacement gradient ∂w∕∂x (if the shearing directionis oriented in the x-direction) or ∂w∕∂y (if the shearingdirection is in the y-direction) and the relationships aregiven by33,34
∂w∂x
¼ λ
4πδxΔ ðshearing in x-directionÞ
∂w∂y
¼ λ
4πδyΔ ðshearing in y-directionÞ:
(4)
In the intensity fringe pattern, the smallest measureable rel-ative phase change Δ is 2π (if only one fringe is visible).Therefore, the minimum measurable displacement gradientis λ∕ð2πδxÞ or λ∕ð2πδyÞ. In order to increase the measure-ment sensitivity for the displacement gradient, the sensitivityfor measuring the relative phase change Δ has to beenhanced. The phase shift techniques have been appliedfor this purpose, which will be discussed in the followingsections.
2.2 Display of Shearographic Test Result UsingPhase Map
A phase ϕ of the speckle interferogram, as shown in Eq. (1),cannot be directly recorded by a CCD camera, but can bedetermined indirectly through three or more digitized inten-sity images using the phase shift technique.35 The piezoelec-tric transducer (PZT) mirror, as shown in Fig. 1, is used forthis purpose. As we know, there are three unknowns in a
recorded intensity image [cf. Eq. (1)]. They are a backgrounda, a modulation amplitude b, and the phase term ϕ. To deter-mine the phase term ϕ, three or more images, with threeequations, as shown in Eq. (5), are required:
I1 ¼ aþ b cosðϕÞI2 ¼ aþ b cosðϕþ 120°ÞI3 ¼ aþ b cosðϕþ 240°Þ:
(5)
The 120 deg and 240 deg phase shifts can be obtained bymoving the PZT mirror a distance of λ∕6 between two adja-cent images. Here, λ refers to the wavelength of the laser. Thephase distribution ϕ can be determined from the above threedigitized intensity values as follows:
ϕ ¼ arc tan
ffiffiffi3
p ðI3 − I2Þ2I1 − I2 − I3
: (6)
After the object is loaded, the interference phase ϕ changesthe value to ϕ 0, which is equal to ϕþ Δ [cf. Fig. 1 andEq. (2)]. In the same way, ϕ 0 can be calculated by recordingthree additional images under the loading condition. A dig-ital subtraction of ϕ from ϕ 0, as described in Eq. (7), gen-erates a quantitative distribution of the relative phase changeΔ, which is called a shearographic phase map.
Δ ¼ ϕ 0 − ϕ
¼ arc tan
ffiffiffi3
p ðI 03 − I 02Þ2I 01 − I 02 − I 03
− arc tan
ffiffiffi3
p ðI3 − I2Þ2I1 − I2 − I3
ðadd 2π if Δ < 0Þ;
(7)
where I 01, I02, and I
03 are the intensity of the three images after
loading. Because the phase map is a fringe pattern withmodulus 2π, a value of 2π should be added if the calculatedΔ value is smaller than zero.36
The time required for recording three intensity images andfor shifting the PZT mirror three times ranges from 400 to500 ms, depending on the camera’s frame rate and softwareprogram developed. For a camera with 15 frames per second(fps), the required time for capturing three images is 200 ms.A PZT can shift the mirror very fast (within a microsecond),but needs time to wait for the mirror to stabilize before thecamera takes the next image. Usually, a 100 ms waiting timeis adopted for each shift. Under these conditions, the totalrequired time for data acquisition is about 500 ms. If thephase distribution under unloaded condition (referencephase) can be calculated before loading, the display rateof Eq. (7) mainly depends on the speed of the acquisitionof data for the loaded object, which is about 500 ms. Accord-ingly, the displaying rate, for phase map by using the 3þ 3algorithm, can reach no more than two images per second.Thus, it is impossible for real-time observation.
2.3 Comparison of Intensity Fringe Pattern andPhase Map Mode
Figure 2 shows shearographic measurement results displayedusing the intensity fringe pattern mode [Fig. 2(a)] and thephase map mode [Fig. 2(b)]. Even though an intensity fringepattern can be observed in real time, it is only qualitative.
Optical Engineering 101902-3 October 2013/Vol. 52(10)
Zhu et al.: Real-time monitoring of phase maps of digital shearography
Downloaded From: https://www.spiedigitallibrary.org/journals/Optical-Engineering on 06 Jan 2022Terms of Use: https://www.spiedigitallibrary.org/terms-of-use

In the intensity fringe pattern, phases can be measured onlyat the locations of fringe orders and the smallest mea-surable phase value is 2π. By comparison, for the phasemap mode, phase can be measured, quantitatively, at eachpixel location, resulting in much higher spatial resolution.Theoretically, a relative phase change Δ can be measured ata very small value based on Eq. (7). Practically, however, itcannot be infinitely small due to speckle noise and spatialresolution of the digital camera. Usually, it can reach to aresolution of about 2π∕30. As a result, the phase map hasa greater potential for measuring small defects.
Figure 3 shows a shearography measurement for a com-posite plate with three delaminations. The third and smallestdelamination was not visible in the intensity fringe pattern,whereas all of the three delaminations were clearly identifiedin the phase map. Both tests utilized the same vacuum load.
Phase shift digital shearography has become an industrytool for NDT due to its quantitative and direct measurementof strain information with high measurement sensitivity. Theincreasing demand for inspection speed with different load-ing methods, such as dynamic loading, has led to the need fora real-time monitoring of phase maps of digital shearogra-phy. In the following section, we will discuss the possibilityfor real-time monitoring of phase maps of shearographyusing the temporal phase shift technique.
3 Real-Time Monitoring of Phase Map of DigitalShearography
If the phase of the unloaded object ϕ can be calculated beforethe start of measurement, then the display rate of relativephase change Δ ð¼ ϕ 0 − ϕÞ, i.e., the phase map, will dependmainly on the time of data acquisition for determining thephase of the loaded object ϕ 0. According to Eq. (1), a, b,
and the phase ϕ are the three unknowns in a digitized inten-sity equation. After the object is loaded, a and b remainconstant, while the phase ϕ becomes ϕ 0. The two intensityequations, taken before and after loading, consist of a totalof four unknowns which are a, b, phase ϕ before loading,and phase ϕ 0 after loading. Four or more intensity equations(images) are required to determine these unknowns. The3þ 3 algorithm uses six equations to determine the phasemap. It is too slow because the displaying rate is limited to2 fps. To increase the display rate, the number of imagestaken should be reduced. Two other methods can be utilizedsuch as 3þ 2 (5 images) and 3þ 1 (4 images) methods.
3.1 3þ 2 Method
In the 3þ 2 method, three images (three equations) arerecorded before loading and two images (two equations) arerecorded after loading as shown in Eq. (8):
I1¼aþb cosðϕÞI2¼aþb cosðϕþ120°ÞI3¼aþb cosðϕþ240°Þðbefore loadingÞ
andI 01¼aþb cosðϕþΔÞI 02¼aþb cosðϕþΔþ120°Þðafter loadingÞ
:
(8)
From the images taken before loading, the phase ϕ can bedetermined using Eq. (6). In addition, the parameter a canalso be solved:
a ¼ I1 þ I2 þ I33
: (9)
Based on the two equations taken after loading andEq. (9), the phase of loaded object ϕ 0, which is equal to(ϕþ Δ), is solved:
ϕþ Δ ¼ arc tan3a − 2I 02 − I 01ffiffiffi
3p ðI 01 − aÞ
¼ arc tan
ffiffiffi3
p ðI1 þ I2 þ I3 − 2I 02 − I 01Þ3I 01 − ðI1 þ I2 þ I3Þ
: (10)
A subtraction of ϕ from ϕ 0 generates a phase differenceΔ, or shearographic phase map:
Δ ¼ arc tan
ffiffiffi3
p ðI1 þ I2 þ I3 − 2I 02 − I 01Þ3I 01 − ðI1 þ I2 þ I3Þ
− arc tan
ffiffiffi3
p ðI3 − I2Þ2I1 − I2 − I3
ðadd 2π × if Δ < 0Þ: (11)
One can also use 90 deg phase shift for the loaded images.In this case, the phase shift of 120 deg should be replacedby 90 deg, and the relative phase change Δ becomes
Δ ¼ arc tanI1 þ I2 þ I3 − 3I 023I 01 − ðI1 þ I2 þ I3Þ
− arc tan
ffiffiffi3
p ðI3 − I2Þ2I1 − I2 − I3
× ðadd 2π × if Δ < 0Þ: (12)
The 3þ 2method is based on an assumption that a and b,in Eq. (8), remain constant before and after a loading. In real-ity, a and bmay not be identical due to decorrelation of some
Fig. 2 Two modes for displaying shearographic results: (a) intensityfringe pattern and (b) phase map; the sample is a fully clampedsquare plate with a load applied at the center of the plate fromback side.
Fig. 3 Intensity fringe pattern versus phase map of shearography forNDT of a composite plate with same vacuum loading. (a) The smallestdelamination in the middle was not visible in the intensity mode. (b) Allof the three delaminations were clearly identified in the phase map.
Optical Engineering 101902-4 October 2013/Vol. 52(10)
Zhu et al.: Real-time monitoring of phase maps of digital shearography
Downloaded From: https://www.spiedigitallibrary.org/journals/Optical-Engineering on 06 Jan 2022Terms of Use: https://www.spiedigitallibrary.org/terms-of-use

speckles which will result in more noises. This is the reasonwhy the phase map of 3þ 3 method has better quality thanthat of the 3þ 2 method. In Sec. 3, we shall demonstrate thephase maps of the methods.
The time required for capturing two intensity images ofloaded object and shifting the PZT mirror two times for acamera with a data acquisition speed of 15 fps is about335 ms. With this time value required, the displaying rate ofthe phase map can reach a speed of about three images persecond if everything is optimized. Though the displayingspeed is increased, it is still not fast enough and, therefore,is still not suited for dynamic loading.
3.2 3þ 1 Method
In the 3þ 1 method, three images (three equations) arerecorded before loading and one image, with no phase shift,is recorded after loading, as shown in Eq. (13):
I1¼aþb cosðϕÞI2¼aþb cosðϕþ120°ÞI3¼aþb cosðϕþ240°Þðbefore loadingÞ
and I 0 ¼aþb cosðϕþΔÞ
ðafter loadingÞ: (13)
The algorithm for calculating the relative phase changeΔ, using the 3þ 1 method, is somewhat complicated.Subtracting I 0 from I1, I2, and I3, respectively, and takingthe square of the three subtracted results generates thefollowing three equations:
ðI1 − I 0Þ2 ¼ 4b2 sin2ðϕþ Δ∕2Þsin2ðΔ∕2ÞðI2 − I 0Þ2 ¼ 4b2 sin2ðϕþ Δ∕2þ π∕3Þsin2ðΔ∕2 − π∕3ÞðI3 − I 0Þ2 ¼ 4b2 sin2ðϕþ Δ∕2þ 2π∕3Þsin2ðΔ∕2 − 2π∕3Þ:
(14)
Though Δ∕2 is a low-frequency component (induced by aloading), the phase ϕ (phase difference between two pointsP1 and P2, as seen in Fig. 1) is a high-frequency compo-nent due to the surface roughness. The terms (ϕþ Δ∕2),(ϕþ Δ∕2þ π∕3), and (ϕþ Δ∕2þ 2π∕3) are also high-frequency components. For the high-frequency term, a detec-tor captures the average value of the term within eachspeckle.35 With this assumption, we have the followingresult:�sin2
�Δ2þ θ
��≈
1
2nπ
Z2nπ
0
sin2�Δ2þ θ
�d
�Δ2þ θ
�
¼ 1
2; (15)
where n is an integer number. The feasibility of equation isbased on the assumption that the speckle size is smaller thanthe pixel size so that a pixel will cover several speckles. Inour experiment, the pixel size of the CCD camera is about17 μm and the speckle diameter is about 6 μm (depending onaperture size). In this case, one pixel will cover about ninespeckles. Therefore, the phase range covered by one pixel isenough to meet the assumption. If a higher resolution cam-era, such as a five mega camera, will be used, the pixel sizewill be significantly reduced. Consequently, the averageeffect will be reduced and more noises will be introduced.
However, on the other hand, the high-resolution camerasignificantly increases the spatial resolution, which is moreimportant for inspecting smaller defects in objects, becausethe high-frequency noises can be suppressed by enlarging thelens aperture or applying a low-pass filter. With the resultshown in Eq. (15), Eq. (14) can be simplified as follows:
ðI1 − I 0Þ2 ≈ 2b2 sin2ðΔ∕2Þ ¼ b2½1− cosðΔÞ�ðI2 − I 0Þ2 ≈ 2b2 sin2ðΔ∕2− π∕3Þ ¼ b2½1− cosðΔ− 2π∕3Þ�ðI3 − I 0Þ2 ≈ 2b2 sin2ðΔ∕2− 2π∕3Þ ¼ b2½1− cosðΔ− 4π∕3Þ�:
(16)
The distribution of the relative phase change Δ, i.e., theshearographic phase map, can then be determined by
Δ ¼ arctan
ffiffiffi3
p ½ðI3 − I 0Þ2 − ðI2 − I 0Þ2�2ðI1 − I 0Þ2 − ðI2 − I 0Þ2 − ðI3 − I 0Þ2 : (17)
For a camera with 15 fps, the display rate can reach higherthan 10 images per second, allowing the phase map to beobserved in real time. Furthermore, the technique can beapplied for dynamic analysis, if combined with a high-speedcamera.
4 Discussion, Comparison, and DemonstrationsFigure 4 shows a comparison of three shearographic phasemaps created by the 3þ 1, 3þ 2, and 3þ 3 methods,respectively (from left to right). The three phase maps weretaken from the same object using the same loading andsmoothed twice by the same window size (5 × 5 window).
From the point of view of the speed for displaying thephase map, the display rate for the 3þ 1 method can reach10 images per second or higher depending on the cameraspeed. The method enables real-time observation of phasemap. It is well suited for shearographic NDTwhile a contin-ued loading, such as a thermal loading, an internal press, or avacuum loading, is needed to make all flaws visible. Figure 5shows inspection results for the composite plate, shown inFig. 3, using the 3þ 1 real-time phase map observationmethod and an increasing vacuum load. All three delamina-tions were clearly identified when the vacuum loading in-creases to −8 kPa. This function will make shearographictesting more convenient for real-world applications.
With respect to the image quality, Fig. 4 shows that the3þ 3 method has the best quality, the quality of 3þ 2method is still quite good, and the 3þ 1 method has morenoise than the other two. Though the 3þ 1 method has morenoise, it is still an acceptable level for NDT. The camera usedin the investigation, shown in Fig. 4, has 640 × 480 pixels.Should a camera with higher spatial resolution be utilized,the quality of the phase map will increase. Despite goodquality in the 3þ 3 and 3þ 2 methods, the displayingspeed for phase map is approximately two images per secondfor the 3þ 3 method and three images per second for the3þ 2method. Obviously, the applications are mainly limitedto static or quasi-static loading.
A further significant feature of the 3þ 1 method is itsability for dynamic applications. The 3þ 1 method hasgreat potential, in combination with a high-speed camera, togenerate phase maps for digital shearography in dynamicmeasurement because only a single image is needed under
Optical Engineering 101902-5 October 2013/Vol. 52(10)
Zhu et al.: Real-time monitoring of phase maps of digital shearography
Downloaded From: https://www.spiedigitallibrary.org/journals/Optical-Engineering on 06 Jan 2022Terms of Use: https://www.spiedigitallibrary.org/terms-of-use

a loaded condition. Figure 6 shows our attempt using the3þ 1 method and a high-speed digital shearographic systemfor NDT. The sample is an aerospace honeycomb plate witha delamination. First, the three initial images were takenstatically before loading. Based on Eq. (5), a phase shiftof 120 deg was introduced between two adjacent images.Then, the sample was heated, by a normal heat gun, for about20 s. After waiting for about 5 s, a series of images werecaptured by a high-speed camera as the temperature drops.Because the loading is not really dynamic and the laserpower is not high enough, a rate of only 100 fps was taken.
The phase maps shown in Fig. 6 were picked every 30images, one every 300 ms, and calculated by Eq. (17)together with the first recorded three images. The delamina-tion area can be obviously located in the phase maps. Thetemperature in these images was dropping from left to rightand from top to bottom. Because the reference is an unheatedobject, the phase map at the top left has the most fringes andthe phase map at the bottom right has the fewest fringes.Though this trial was taken at a rate of 100 fps, the resulthas demonstrated that the 3þ 1 temporal phase shifttechnique is capable of dynamic measurement and has great
Fig. 4 A comparison of phase maps created by (a) 3þ 1, (b) 3þ 2, and (c) 3þ 3 methods.
Fig. 5 Shearographic NDT by real-time observation of phase map by using 3þ 1 method, loading increasing from left to right and all threedelaminations were clearly detected while the vacuum increases to −8 kPa (the most right image).
Fig. 6 NDT with high-speed digital shearographic system for inspection of a honeycomb plate with a delamination while temperature dropping(from top left to bottom right).
Optical Engineering 101902-6 October 2013/Vol. 52(10)
Zhu et al.: Real-time monitoring of phase maps of digital shearography
Downloaded From: https://www.spiedigitallibrary.org/journals/Optical-Engineering on 06 Jan 2022Terms of Use: https://www.spiedigitallibrary.org/terms-of-use

potential for phase shift shearography for NDT underdynamic loading such as with harmonic excitation or withimpact testing.
Despite many advantages, the 3þ 1 method has somelimitations. Three reference images must be taken whileobject is unloaded. Refreshing these reference images duringmeasurement is impossible, which limits the load magnitudethat can be applied. If the reference images need to berefreshed, the object to be tested must be under a stable con-dition. The background a and modulation of the interferenceterm b in the intensity equation must also be exactly identicalwhile taking intensity measurements of the unloaded andloaded object. This means that the background a andmodulation of the interference term b of the laser usedshould be stable with time. If a diode laser will be utilized,it must be in possession of current and temperature stabili-zation functions.
Due to the limited length of the content, this paper onlyreviews and compares 3þ 3, 3þ 2, and 3þ 1 algorithms. Itshould be emphasized that all potentials and limitations dis-cussed and presented in this paper are suited for 4þ 4, 4þ 2,4þ 1 and 5þ 5, 5þ 2, 5þ 5 due to similar fundaments aswell. In summary, N þ N (N ¼ 3, 4, and 5) methods havethe best quality for phase map; however, it is suited foron-line testing only with a static loading. For a camera witha data acquisition speed of 15 fps, the displaying speed forphase map is approximately 2, 1.5, and 1.2 images per sec-ond for the 3þ 3, 4þ 4, and 5þ 5 methods, respectively.N þ 2 methods still have a good quality in phase maps asthey can reach approximately three images per second forall of the 3þ 2, 4þ 2, and 5þ 2 methods and are suitedfor on-line shearographic NDT with a quasi-static loading.Finally, N þ 1 methods have the fastest displaying speed forphase maps, which can reach 10 images per second or higher,depending on the camera speed. The N þ 1 methods enablereal-time monitoring of phase map and make shearographictest more convenient for real-world applications. Further-more, N þ 1 methods are capable of dynamic applications.The phase maps in N þ 1 methods have a little more noisebut are still in an acceptable level for the applications ofNDT. Regarding the N number, there is no big difference inusing 3, 4, or 5 method in shearographic NDT if the mainpurpose is to just inspect defects.
5 ConclusionThis paper has presented a review of the temporal phase shiftdigital shearography using 3þ 3, 3þ 2, and 3þ 1 algo-rithms and the possibility for real-time monitoring of thephase maps for NDT. Displaying phase map of digital shear-ography enhances the measurement sensitivity which offersthe possibility for NDT of smaller defects in different mate-rials. A real-time monitoring of the phase maps makes themeasurement more convenient and effective. Theoreticalanalysis, and experimental, tests have demonstrated that the3þ 1 method is capable of real-time monitoring of phasemaps with a simple concept and a simple optical setup.Experimental investigations also indicate that the 3þ 1method has great potential for high speed, digital shearo-graphic, NDT with dynamic loading. Likewise, the 4þ 1or 5þ 1 method has the same features as describedabove. For better understanding of the usefulness, the limi-tations of different algorithms have also been presented and
discussed. This paper has provided useful information forresearchers who are planning to use simple temporal phaseshift technique for real-time monitoring of phase map of dig-ital shearography and for the NDT with dynamic loading.
AcknowledgmentsThe authors would also like to express their sincere thanks toMr. Bernard Sia, PhD candidate of the Optical Laboratoryat Oakland University, who carefully and thoroughly readthe manuscript and provided valuable criticisms. The workis supported by the National Natural Science Foundationof China under grants 51275054 and 51075116, and theInternational Science and Technology Cooperation Plan ofAnhui Province (No. 12030603012).
References
1. D. Francis, R. P. Tatam, and R. M. Groves, “Shearography technologyand applications: a review,”Meas. Sci. Technol. 20(10), 102001 (2010).
2. W. Steinchen and L. X. Yang, Digital Shearography: Theory and Appli-cation of Digital Speckle Pattern Shearing Interferometry,” SPIE Press,Bellingham, WA (2003).
3. Y. Y. Hung, H. M. Shang, and L. X. Yang, “Unified approach for holog-raphy and shearography in surface deformation measurement andnondestructive testing,” Opt. Eng. 42(5), 1197–1207 (2003).
4. L. X. Yang and A. Ettemeyer, “Strain measurement by 3D-electronicspeckle pattern interferometry: potentials, limitation and applications,”Opt. Eng. 42(5), 1257–1266 (2003).
5. X. Chen et al., “High temperature displacement and strain measurementusing a monochromatic light illuminated stereo digital image correlationsystem,” Meas. Sci. Technol. 23(12), 125603 (2012).
6. Y. Y. Hung et al., “Review and comparison of shearography and activethermography for nondestructive evaluation,” Mater. Sci. Eng. R64(5), 73–112 (2009).
7. L. X. Yang, “Recent developments in digital shearography for nonde-structive testing,” Mater. Eval. 64(7), 704–709 (2006).
8. Y. H. Huang et al., “NDT&E using shearography with impulsivethermal stressing and clustering phase extraction,” Opt. Laser Eng.47(7), 774–781 (2009).
9. C. J. Tay and Y. Fu, “Determination of curvature and twist by digitalshearography and wavelet transforms,” Opt. Lett. 30(21), 2873–2875(2005).
10. W. Steinchen et al., “Nondestructive testing of aerospace compositematerials using digital shearography,” J. Aerosp. Eng. 212(1), 21–30(1998).
11. T. W. Ng, “Shear measurement in digital speckle shearing interferom-etry using digital correlation,” Opt. Comm. 115(3), 241–244 (1995).
12. M. Kalms and W. Osten, “Mobile shearography system for the inspec-tion of aircraft and automotive components,” Opt. Eng. 42(5),1188–1196 (2003).
13. M. Schuth, F. Voessing, and L. X. Yang, “A shearographic endoscopefor nondestructive test,” J. Holography Speckle 1(1), 46–52 (2004).
14. S. J. Wu, X. Y. He, and L. X. Yang, “Enlarging the angle of view inMichelson interferometer-based shearography by embedding a 4fsystem,” Appl. Opt. 50(21), 3789–3794 (2011).
15. Dantec Dynamics GmbH, “Shearography–Non Destructive Testing,”http://www.dantecdynamics.com/Default.aspx?ID=665.
16. Laser Technology Inc., “Laser Shearography Technology,” http://www.laserndt.com/technology/shearography.htm.
17. Steinbichler Inspiring Innovation, “Shearography NDT,” http://www.steinbichler.com/products/surface-scanning/shearography-ndt.html.
18. J. R. Huang, H. D. Ford, and R. P. Tatam, “Phase-stepped speckle shear-ing interferometry by source wavelength modulation,”Opt. Lett. 21(18),1421–1423 (1996).
19. D. C. Ghiglia and M. D. Pritt, Two-Dimensional Phase Unwrapping:Theory, Algorithms, and Software,” Wiley, New York (1998).
20. L. X. Yang and T. Siebert, “Digital speckle interferometry in engineer-ing,” in New Directions in Holography and Speckle, H. J. Caulfield andC. Vikram, Eds., pp. 405–440, American Scientific Publishers,Stevenson Ranch, California (2008).
21. A. Fernández et al., “Measurement of transient out-of-plane displace-ment gradients in plates using double-pulsed subtraction TV shearog-raphy,” Opt. Eng. 39(8), 2106–2113 (2000).
22. J. M. Huntley, “Automated analysis of speckle interferograms,” in Dig-ital Speckle Interferometry and Related Techniques, P. K. Rastogi, Ed.,pp. 59–83, Wiley, Chichester (2001).
23. A. Dávila, G. H. Kaufmann, and C. Pérez-López, “Transient deforma-tion analysis by a carrier method of pulsed electronic speckle-shearingpattern interferometry,” Appl. Opt. 37(19), 4116–4122 (1998).
Optical Engineering 101902-7 October 2013/Vol. 52(10)
Zhu et al.: Real-time monitoring of phase maps of digital shearography
Downloaded From: https://www.spiedigitallibrary.org/journals/Optical-Engineering on 06 Jan 2022Terms of Use: https://www.spiedigitallibrary.org/terms-of-use

24. F. Santos, M. Vaz, and J. Monteiro, “A new set-up for pulsed digitalshearography applied to defect detection in composite structures,”Opt. Laser Eng. 42(2), 131–140 (2004).
25. G. Pedrini, Y. L. Zou, and H. J. Tiziani, “Quantitative evaluation of dig-ital shearing interferogram using the spatial carrier method,” Pure Appl.Opt. 5(3), 313–321 (1996).
26. X. Xie et al., “Simultaneous measurement of deformation and the firstderivative with spatial phase-shift digital shearography,” Opt. Comm.286(1), 277–281 (2013).
27. B. Bhaduri et al., “Use of spatial phase shifting technique in digitalspeckle pattern interferometry (DSPI) and digital shearography (DS),”Opt. Exp. 14(24), 11598–11607 (2006).
28. L. X. Yang et al., “Digital shearography for nondestructive testing:potentials, limitations and applications,” J. Holography Speckle 1(2),69–79 (2004).
29. K. Li and K. Qian, “Dynamic phase retrieval in temporal speckle patterninterferometry using least squares method and windowed Fourier filter-ing,” Opt. Exp. 19(19), 18058–18066 (2011).
30. C. C. Kao et al., “Phase-shifting algorithms for electronic specklepattern interferometry,” Appl. Opt. 41(1), 46–54 (2002).
31. M. Hipp, W. Fliesser, and T. Nerger, “Temporal resolved phase steppedspeckle interferometry of instationary plasma discharges,” Proc. SPIE3745, 366–376 (1999).
32. J. A. Leendertz and J. N. Butters, “An image-shearing speckle-patterninterferometer for measuring bending moments,” J. Phys. E: Sci.Instrum. 6(11), 1107–1110 (1973).
33. R. Kästle, E. Hack, and U. Sennhauser, “Multiwavelength shearographyfor quantitative measurements of two-dimensional strain distributions,”Appl. Opt. 38(1), 96–100 (1999).
34. R. M. Groves, S. W. James, and R. P. Tatam, “Full surface strainmeasurement using shearography,” Proc. SPIE 4448, 142–152 (2001).
35. K. Creath, “Phase shifting speckle interferometry,” Appl. Opt. 24(18),3053–3058 (1985).
36. S. Liu and L. X. Yang, “Regional phase unwrapping method based onfringe estimation and phase map segmentation,” Opt. Eng.46(5), 051012 (2007).
Lianqing Zhu is a professor of the School ofInstruments Science and Opto-ElectronicEngineering at Beijing Information Scienceand Technology University in China. He hasmultidisciplinary research experiences in-cluding optical metrology, biomedical detec-tion technology, and 3-D computer vision. Heis the director of Beijing Engineering Re-search Center of Photoelectric Informationand Instruments, a council member ofChinese Society for Measurement, and an
executive member of the council and assistant secretary general atMechanical Quantity Measurement Instrument Federation of ChinaInstrument and Control Society.
YonghongWang received his PhD degree inprecision mechanical engineering from HefeiUniversity of Technology, China, in 2004. Hewas a postdoctoral fellow in the OpticalLaboratory at Oakland University in Michiganfrom 2007 to 2008. He is currently a professorin the School of Instrument Science andOpto-Electronic Engineering, Hefei Universityof Technology. He has authored and co-authored over 30 scientific research papersand has owned four Chinese patents in the
areas of optical techniques for whole-field and 3-D measurement.His current research interests are precision metrology, advancedoptical measuring techniques, and image processing and their appli-cations for the automotive, high-tech, and biomedical industries.
Nan Xu is a PhD candidate in the OpticalLaboratory of Mechanical Engineering atOakland University. He received BE in com-puter science from Northeastern University,Shenyang, China, in 2000 and ME in opticalengineering from Beijing Jiaotong University,China, in 2008. His research interests includeoptical metrology, nondestructive testing withdigital shearography experimental strain/stress analysis, nondestructive testing, 3-Dcomputer vision, and software programmingand development.
Sijin Wu received his PhD degree in opticalengineering from Beijing Jiaotong University,China, in 2012. Prior to receiving his PhDdegree, he was an exchanged PhD studentin the Optical Laboratory at Oakland Univer-sity for two years. He joined Beijing Informa-tion Science and Technology University inJuly 2012 as a faculty member. His researchinterests include optical metrology, such asdigital holography and digital shearography,experimental strain/stress analysis, non-destructive testing, and 3-D computer vision.
Mingli Dong received her PhD in physicalelectronics from Beijing Institute of Technol-ogy, China. She is a professor in the Schoolof Instruments Science and Opto-ElectronicEngineering at Beijing Information Scienceand Technology University in China andthe head of the Department of Measurementand Control Technology and Instruments.She has multidisciplinary research experien-ces including vision measuring technology,optical metrology, and biomedical detectiontechnology.
Lianxiang Yang received his PhD inmechanical engineering from the Universityof Kassel, Germany, in 1997. He is the direc-tor of Optical Laboratory and a professor inthe Department of Mechanical Engineeringat Oakland University in USA. Prior to joiningOakland University in 2001, he was an R&Dscientist at JDS-Uniphase, Canada, from2000 to 2001, a senior engineer at Dantec-Ettemeyer AG (currently called Dantec-Dynamics GmbH), Germany, from 1998 to
2000, a research and senior research fellow at the University ofKassel, Germany, from 1991 to 1998, and a lecturer at Hefei Univer-sity of Technology, China, from 1986 to 1991. He has multidisciplinaryresearch experiences including optical metrology, experimentalstrain/stress analysis, nondestructive testing, and 3-D computervision. He is a Fellow of SPIE, a Changjiang scholar of Hefei Univer-sity of Technology, and an adjunct professor of Beijing InformationScience and Technology University.
Optical Engineering 101902-8 October 2013/Vol. 52(10)
Zhu et al.: Real-time monitoring of phase maps of digital shearography
Downloaded From: https://www.spiedigitallibrary.org/journals/Optical-Engineering on 06 Jan 2022Terms of Use: https://www.spiedigitallibrary.org/terms-of-use