real-time monitoring of volatile organic compounds in hazardous sites
TRANSCRIPT

14
Real-Time Monitoring of Volatile Organic Compounds in Hazardous Sites
Gianfranco Manes1, Giovanni Collodi1, Rosanna Fusco2, Leonardo Gelpi2, Antonio Manes3 and Davide Di Palma3
1Centre for Technology for Environment Quality & Safety, University of Florence, 2eni SpA,
3Netsens Srl,
Italy
1. Introduction
Volatile Organic Compounds (VOCs) are largely used in many industries as solvents or chemical intermediates. Unfortunately, they include some components, present in the atmosphere, that can represent a risk factor for human health. They are also present as a contaminant or a by-product in many processes, i.e. in combustion gas stacks and groundwater clean-up systems. Benzene, in particular, shows a high toxicity resulting in a Time-Weighted Average (TWA) limit of 0.5 ppm, as compared, for instance, with TWA for gasoline, in the range of 300 ppm. Detection of VOCs at sub-ppm levels is, thus, of paramount importance for human safety and industrial hygiene in hazardous environments. The commonly used field-portable instruments for VOC detection are the hand-held Photo-Ionisation Detectors (PIDs), sometime using pre-filter tubes for specific gas detection. PIDs are accurate to sub-ppm, measurements are fast, in the range of one or two minutes and, thus, compatible with on-field operation. However, they require skilled personnel and cannot provide continuous monitoring. Wireless connected hand-held PID Detectors start being available on the market, thus overcoming some of the previously described limitations, but suffering for the limited battery life and relatively high cost. The paper describes the implementation and on-field results of an end-to-end distributed monitoring system integrating VOC detectors, capable of performing real-time analysis of gas concentration in hazardous sites at unprecedented time/space scale. The system consists of a Wireless Sensor Network (WSN) infrastructure, whose nodes are equipped with distributed meteo-climatic sensors and gas detectors, of TCP/IP over GPRS Gateways forwarding data via Internet to a remote server and of a user interface which provides data rendering in various formats and access to data. The paper provides a survey of the VOC detector technologies of interest, of the state-of-the-art of the fixed and area wireless technologies available for Gas detection in hazardous areas and a detailed description of the WSN based monitoring system.
www.intechopen.com
Environmental Monitoring
220
2. Regulatory requirements for oil&gas industry
The oil&gas sector is characterised by a high complexity in terms of processes, materials and final products. Consequently, activities related to the oil&gas industry need to be effectively controlled to minimize their impact on the environmental matrices (air, water and soil) and to avoid any potential risks for human health. Environmental issues related to the oil&gas sector are also strictly dependent on the specific activities performed. In particular, petrochemical and refining sectors are involved in the production of waste materials, such as water and toxic sludge, and atmospheric pollutant emissions, including many VOCs potentially harmful both to the environment and to human health. All these environmental issues are considered areas of high human and environmental risk and therefore subject to stringent international and local environmental regulations. During the last decade the EU has fixed several Thematic Strategies to improve the management and control on Air Pollution, Soil Protection, Prevention and Recycling of Waste as a follow-up to the Sixth Community Environment Action Programme (Council of 22nd July 2002). In particular, the EU set objectives and regulations on the industrial sector to protect human health and the environment, objectives can be met only with further reductions in emissions arising from industrial activities. The final act of this process was the publication, on 24th November 2010, of the new Directive 75/2010 (IED) on industrial emissions (integrated pollution prevention and control) which recasts together six directives on industrial emissions (IPPC, LCP, VOC, TiOxide). Based on the principle of the polluter pays and also on the pollution prevention one, industrial owners should manage their activities in order to protect the environment as a whole, in compliance to the IPPC integrated approach. Furthermore, in accordance with the Århus Convention on access to information and public participation, operators should both improve and promote tools and procedures, such as adopting environmental management system (ISO 14001), increasing the accountability and transparency of the monitoring and reporting data process and contributing to public awareness of environmental issues, and support for the decisions taken. In order to ensure the prevention and control of pollution, each installation should operate only if it holds a permit, which should include all the measures necessary to achieve a high level of protection of the environment as a whole, and to ensure that the installation is operated in accordance with the general principles governing the basic obligations of the operator. The permit should also include emission limit values for polluting substances or technical measures and monitoring requirements; all conditions should be set on the basis of Best Available Techniques (BAT)1 applied on each specific installation. On the other hand, the European Union has issued, in 2008, Directive No 2008/50/EC concerning ambient air quality and cleaner air for Europe. In order to protect human health and mostly urban environment, the directive addresses the following key points:
1 In the IPPC Directive, BAT are defined as “the most effective technologies available for achieving a high level of environmental protection concerned in an economically feasible and technical view of the costs and benefits”. Currently BAT is identified on the basis of an exchange of information organized by the European Commission that occurs between the Member States, industry and non-governmental organisations
www.intechopen.com

Real-Time Monitoring of Volatile Organic Compounds in Hazardous Sites
221
It’s very important to prevent and reduce pollutant emissions at source, implementing the best effective reduction measures, both technological and on management. Emissions of air pollutant should be reduced by each member state according to World Health Organisation guidelines.
The directive establishes the need of a strong monitoring system and the reciprocal exchange of information and data from networks and individual stations measuring ambient air pollution in order to incorporate the latest health and scientific developments and the experience of the Community.
Each Member State should ensure consistency and representativeness of the information collected on air pollution; standardised measurement techniques and common criteria for the number and location of measuring stations are defined.
For assessing air quality, information and data collected from fixed measurement stations may be integrated with data from alternative techniques, such as modelling or indicative measurements. The use of measurement methods other than standardised methods allows improving data monitoring and interpretation in some critical areas (such as, for instance, industrial sites) in an economical and feasible way.
Alternative measurement methods may provide indicative results that could be less accurate than those made with the reference method. Indicative measurement techniques based on the use of automatic sensors, mobile laboratories, portable analysers and manual methods of measurement, such as diffusive sampling techniques, are very interesting due to the relatively low cost and simplicity of operation compared with instrumental and operative costs of fixed measuring stations.
3. Volatile Organic Compounds
Volatile Organic Compounds are defined as all compounds containing organic carbon characterized by low vapour pressure at ambient temperature. They are present in the atmosphere mainly in the gas phase. The number of volatile organic compounds observed in the atmosphere, both in urban and remote areas, is extremely high and includes, in addition to hydrocarbons (compounds containing only carbon and hydrogen), also oxygen species such as ketones, aldehydes, alcohols, acids and esters. Natural emissions of VOCs include the direct emissions from vegetation and the degradation of organic matter; anthropogenic emissions are mainly caused by the incomplete combustion of hydrocarbons, the evaporation of solvents and fuels, and processing industries. On a global scale, natural and anthropogenic emissions of VOCs are of the same order of magnitude. A lot of volatile organic compounds are highly toxic; this makes them extremely dangerous to human health. In addition, many compounds react with nitrogen oxides and other substances, contributing to the formation of ozone in the lower atmosphere, with impact on climate change and pollution issues (i.e. photochemical smog). Finally, some substances are characterized by a very low odour threshold, resulting in complaints from population and community living around industrial sites.
4. VOC classification
There are many classification systems, based on chemical characteristics, or based on the impact on the environment and human health. The term VOC covers several groups of
www.intechopen.com

Environmental Monitoring
222
organic substances with different chemical and physical characteristics. VOC compounds include in fact compounds containing only atoms of carbon and hydrogen (which include for example aromatic compounds such as benzene). One type of classification used in many states is defined by German regulations (TA Luft - Technical Instructions on Air Quality Control): it identifies three classes of VOCs based on their impact and it defines appropriate prevention and control. The three classes are: extremely hazardous to health – such as benzene, vinyl-chloride and 1,2 dichloroethane class A Compounds – that may cause significant harm to the environment (e.g.
acetaldehyde, aniline, benzyl chloride) class B Compounds – that have lower environmental impact. Benzene (C6H6) is a volatile organic compound belonging to the family of hydrocarbons and characterized by a monocyclic aromatic structure. It is a natural constituent of petroleum, and it is present in gasoline by virtue of its anti-knock properties (it contributes to increase octane number).
Fig. 1. VOC emission distribution in Italy
In the chemical industry, benzene is a solvent widely used, especially as an intermediate for the synthesis of other products (ethylbenzene, cumene, cyclohexane, etc.) in turn used for the production of plastics, resins, paints, tires, detergents etc. Benzene exposure is very dangerous to human health; it is classified as a human carcinogen, due to the high toxicity. Among VOCs, benzene is the only compound for which the European directive on air quality has set a limit to 5 g/m3 (about 1.5 ppb), with no margin of tolerance. At work, the TLV-TWA limit is set at 0.5 ppm for prolonged exposure of 8 hours per day and 2.5 ppm for exposures not exceeding 15 minutes (for reference TLW-TWA for gasoline is in the range of 300 ppm). Benzene emissions related to petroleum activities are about 5% of total emissions, while for the non-methane VOCs the chemical industry appears to be more involved than refining sector. The graphs in Fig. 1 (2008 VOC and Benzene emission distribution in Italy - data from ISPRA Database) show that motor vehicles are the main pollution sources for benzene, while painting is the main source for non-methane VOCs.
www.intechopen.com

Real-Time Monitoring of Volatile Organic Compounds in Hazardous Sites
223
Main VOC sources in petroleum industry
Oil installations, petrochemical plants and refineries are industrial sites that manage several raw materials (crude oil, natural gas, chemical intermediates, etc.), thus having great impact on the environment. Industrial processes may generate VOC emissions to the atmosphere, so prevention and control is becoming a very important issue in the petroleum industry. The main quantity of VOC releases are due to diffuse and fugitive emission sources. The main sources of VOCs from refineries and petrochemicals are fugitive emission from piping, vents, flares, air blowing, waste water system, storage tanks and handling activities, loading and unloading systems.
Fugitive emissions from piping
Fugitive emissions are defined as emissions of pollutants (gases and dust) in the atmosphere resulting from losses such as pumps, valves, flanges, drains, compressors, sampling points, open ended lines, agitators. The loss of process fluids affects all plant equipment; although the amount emitted from single components may be individually small, the cumulative emissions of the plant can be considerable in some cases. Fugitive emissions can be considered as the main source of VOCs in the refinery. The application of Best Available Techniques requires industrial facilities to define a Leak Detection and Repair programme (LDAR), which allows the monitoring at defined frequency of the leaks from plant’s component, thus providing a swift repair of leaker. A standard method (EPA 21) is available to define the monitoring criteria. In addition, it is possible to calculate fugitive emissions based on average literature data, but this approach does not provide evidence of improvements and does not allow for leaker repair. For this reason, on-site monitoring is mandatory.
Handling and storage tanks
VOC emissions from storage tanks are due to evaporative loss of the hydrocarbon liquid stored. There are two main types of tanks, fixed roof and floating (internal or external) roof tanks. In the first case, evaporation losses occur mainly from vents and fittings. In floating roof tanks, where the roof is in direct contact with the liquid, emissions may occur from the seals, especially during changes of liquid level. Emissions depend on the type of product stored and the vapour pressure of the product: higher vapour pressure tends to generate higher VOC emissions. The emissions are generally estimated by calculation software that takes into account numerous factors such as construction types (type of the roof, seals, colour, etc.), number of loading and unloading cycles, etc. It is possible to perform monitoring with analytical instrumentation, as long as the requirements of intrinsically safe regulations (ATEX) are met. During loading, i.e. product stored on vessels, VOC emissions may occur in the vapour phase.
Waste Water Treatment Plants
VOC emissions from Waste Water Treatment Plants are due to evaporation of more volatile compounds from tanks, ponds and sewerage system drains. Because of contamination of treated water, this type of plant is a major source of odorous emissions, thus causing the need for careful monitoring and control. VOCs are emitted also during air stripping in flotation units and in the biotreaters. Emissions of VOCs and other pollutants into the atmosphere from the treatment ponds and basins can be significantly
www.intechopen.com

Environmental Monitoring
224
limited by implementing systems of coverage (almost all industrial sites have this requirement from local authority).
Flare systems
VOC emissions are due to an incomplete combustion of flare gas. However, this type of source does not represent a major cause of VOC emissions. From a first analysis of the major sources, it is clear that VOC emissions come from widespread areas inside the industrial site. The individual emission sources may have small or large impact, but it is important to consider the overall impact of all sources combined. Often a regular monitoring at the source may be ineffective, and sometimes the use of methods of monitoring network in the areas close the critical area could be of great help to combat the phenomenon and to achieve a significant reduction of emissions in an economically feasible way.
VOC monitoring systems
Common VOC concentration measurement methods include colorimetric tubes, Infrared Detectors, Photo Ionisation Detectors (PIDs) and Flame Ionisation Detectors (FIDs), portable/transportable Gas Chromatograph (GC) and sampling followed by laboratory analysis. Deployable sensors are of particular relevance, as they are capable to provide on-site monitoring.
Sampling and laboratory analysis
The main sampling technologies for subsequent laboratory analysis are based on the use of active and passive samplers. In the first case, sampling is done by exposing a trap in the site under investigation connected with a pump capable of sucking a steady flow of air. The trap is usually made of absorbent material, e.g. charcoal. The exposure time may vary from a few tens of minutes to hours. The sample is then analysed in the laboratory with gas chromatography techniques (GC). Passive samplers instead use the diffusive properties of substances dispersed in the atmosphere. They are generally exposed to ambient air for even longer periods (days, weeks), and they are protected in order to prevent damage and contamination caused by weather phenomena (wind, rain). The pollutants are captured at different rates because each of them has different diffusive properties. Sample is then desorbed and analysed in the laboratory (GC). The sampler can be treated with appropriate reagents, in order to obtain selectivity only on a few compound families. Various passive sampling devices are commercially available. One of the most popular is the sampler Radiello, characterized by radially distributed operation and a better sensitivity due to increased diffusive surface. The difference between the two types of samplers is linked to the range of compounds they are able to detect; passive sampler are not useful to detect many VOCs (olefins, compounds with less than 5 atoms of carbon, etc.) because they tend not to remain adherent to the passive diffusion sampler, due to prolonged exposure to the atmosphere. The use of one or another depends on the family of VOCs under study. The main advantage of this sampling technology is the low cost of materials and resources, giving the opportunity to create very dense monitoring networks in an economical feasible way. The disadvantage is the impossibility to continuously collect real-time data, so they are not suitable for emergency management and early warning, but they may be useful for air characterization of an hazardous industrial site, in terms of average concentrations and
www.intechopen.com

Real-Time Monitoring of Volatile Organic Compounds in Hazardous Sites
225
emission source profiles. Another important application is the use in monitoring networks for checking compliance with the TWA for toxic component (e.g. Benzene).
On-field monitoring
On-field monitoring technologies allow obtaining real-time concentration of pollutants close to a specific source or along the perimeter of the industrial establishment, enabling to manage specific emergency situations in real-time. The equipment usually yields a response in terms of quantitative concentration levels of VOCs in the atmosphere; in some cases it is even possible to get a specification of the components in the air. Below an overview of the main methods used on-site, especially at industrial sites, is carried out.
VOC fixed analysers
The use of automatic VOC GC analysers able to collect air samples at regular intervals and analyse them is particularly common when performing monitoring campaigns using fixed stations or a mobile laboratory. Mobile laboratories (as well as transferable measuring stations) usually combine the advantages of automated measurement methods with the mobility and flexibility. Many commercially available VOC analysers can be used to perform the task. Unlike active and passive samplers, in this case air sampled is pumped through a sampling probe and is sent directly to the instrument, to run GC analysis by using several detection technologies (photo ionization, flame ionization, thermal conductivity, etc.). The measurement interval is in the range of tens of minutes. This methodology allows quick answers as well as concentrations for individual compounds to be achieved; however, it does not allow simultaneous monitoring over an industrial site grid, due to the high costs of devices (ten thousand Euros) and operation/ maintenance cost and complexity; furthermore, to cover all the families of compounds of interest - BTEX, C1-C6, sulphur, etc. – more than one analyser is needed.
VOC portable analysers
Portable VOC analysers are instruments of limited size and weight, easily transportable by an operator in the plant and able to provide real-time analysis of gas concentration in hazardous sites. They are usually equipped with battery life in the range 8-12 hours and allow the storage of data acquired in a time-programmable internal logger. The main application in industry is the detection of gas leaks, leaks from piping, releases in proximity of storage tanks, monitoring of loading and unloading areas, etc. Based on the sensor technology, they can be classified in the main following typologies. a. PID - Photo Ionization Detectors. These detectors are equipped with a lamp emitting
ultraviolet light. The emitted light ionizes targeted VOCs in the air sample so they can be detected and reported as a concentration. Depending on the features of the lamp (there are many on the market able to ionize VOCs depending on ionisation potential), a portable PID can detect a wide range of VOC substances. The analyser is not selective but generally provides a cumulative figure of VOCs; however, knowing emission profiles or mixture composition (in the case of measures directly at the source, such as for fugitive emissions from the plant components), concentration values can be calculated for each substance by applying the response factors. It is usually possible to attach a pre-filter tube to allow detection and selective measurement of a single VOC component (eg. Benzene).
www.intechopen.com

Environmental Monitoring
226
b. FID - Flame Ionization Detector. In FIDs sample air is channelled through a chamber where a flame ionizes it, measuring the concentration as a function of electric potential. The fuel gas used is usually hydrogen, contained in a small pressurized cylinder inside the analyser. A charge of hydrogen typically allows for about ten hours undiscontinued operation. This analyser is often used in hazardous industrial sites where there are high concentrations of total organic compound, such as methane.
c. Portable GC-MS- This device collects an air sample through a heated probe on a charcoal trap. After sample desorption, the separation is carried out on a chromatographic column and the individual components are analysed by mass spectrometry. It is normally used for on-site monitoring of environmental pollutants (organic substances, sulphur compounds) and to detect oil spills and waste water in the exhaust gases. Unlike PID and FID, this detector is most expensive, weighty and it requires experienced operators.
d. Colorimetric tubes. Colorimetric tubes are portable and disposable devices for detecting the concentration of pollutants in ambient air. As for active samplers, a pump draws an air volume within the vial. The sample reagent reacts with the substance causing a colour change proportional to the concentration of the substance to be measured. Devices are disposable and are commercially available for hundreds of pollutants. The advantage is the low cost, rapid response and ease of use; however, measurement accuracy is very low, due to the deterioration of the reagent, contamination and interference with other substances in the sample other than those to be measured.
Optical remote sensing methods
These methods are based on real-time measurement of concentrations of pollutants by taking advantage of the properties of absorption and diffusion of gases in the atmosphere in the visible, ultraviolet and infrared light regions. In fact, the optical path of a light beam of a certain wavelength can be changed by contact with gases and/or dust. The combination with a computerised system allows for automatic management tools, and data processing/presentation to be implemented. Multiple-path optical configurations also allows to measure concentration averaged over a given area . In the Best Reference Documents (BREF) are mentioned the following optical remote sensing techniques: i. DIAL (Differential Absorption Infrared Laser): pulsing light is diffused and absorbed
by gases in the atmosphere; the analysis of the response time is observed with an optical device that allows the determination of the concentration of the pollutant, and (with modelling support) a generic indication of the origin.
ii. DOAS (Differential Optical Absorption Spectrometry): a continuous light beam is absorbed by pollutants; The receiver, placed at the end of the optical path, directs the beam into an optical fibre and through this to the analyser.
iii. FT-IR (Fourier Transform - Infra Red): absorption in the IR spectrum between a source and a receiver allows the quantitative analysis of numerous substances.
iv. BAGI (Back scatter Absorption Gas Imaging): an infrared laser illuminate the potential source of emission, permitting quantification of gas concentrations by means of the Lambert Beers’ law and producing real-time video images of numerous organic vapours of interest.
www.intechopen.com
Real-Time Monitoring of Volatile Organic Compounds in Hazardous Sites
227
5. Wireless Sensor Network platform overview
Real-time monitoring of VOCs at unprecedented time/space scale can be performed using Wireless Sensor Networks (WSNs); WSNs have been extensively investigated since the last decade; they consist of spatially distributed autonomous sensors to monitor physical or environmental conditions, such as temperature, sound, vibration and pressure motion or pollutants and to cooperatively pass their data through the network to a sink node. A WSN generally consists of a base-station (or “gateway”) that can communicate with a number of wireless sensors via a radio link. Data are collected at the wireless sensor node, compressed, and transmitted to the gateway directly or, if required, using other wireless sensor nodes to forward data to the gateway. The transmitted data are then presented to the system by the gateway connection and can be accessed worldwide via Internet by authenticated users. The power of WSNs lies in the ability to deploy large numbers of nodes that assemble and configure themselves, with minimal deployment costs, unlike traditional wired systems, while featuring a high degree of flexibility, re-reconfigurability and scalability. The most difficult resource constraint to meet is electrical energy, as the WSNs are typically designed as stand-alone systems only relying on autonomous energy sources. Energy budget is shared between the radio/computational unit and the sensor(s), often power hungry and, thus, predominant in power consumption. The WSN architecture presented here includes both a proprietary hardware platform and communication routines designed specifically to address the needs of an application intended for VOC monitoring in a chemical plant. The VOC Concentration Precision Monitoring System (VCPMS) based on a Wireless Sensor Network (WSN) has been deployed and tested at the Mantova Petrochemical plant in Italy, starting with May 2011. The lay-out of the installation is represented in Fig. 2. The system was designed for stand-alone operation, i.e. only relying on autonomous energy and connectivity resources. This is very useful for installation in industrial plant where excavation may be difficult. Internet connectivity is provided via TCP/IP over GPRS using GSM mobile network; wireless connectivity uses the UHF-ISM unlicensed band; electrical power is provided by primary sources (batteries) and secondary sources (photovoltaic cells); highly efficient power saving strategies have been implemented to prolong battery life, as the system is designed to operate undiscontinued and unattended. The wireless network infrastructure includes base stations operating as Sink Nodes (SNs) exhibiting superior computational capability and energy resources and featuring both TCP/IP over GPRS and wireless connectivity; The SNs are wirelessy connected to distributed wireless units, or End Node (ENs) units. The SNs are equipped with meteo-climatic sensors thus providing a map of air relative humidity/temperature (RHT) and wind speed/direction (WSD) over the area, while the ENs are equipped with VOC sensors and RHT sensors for accurate VOC sensor read-out compensation. Owing to the extension and complexity of the Mantova plant, covering some 300 acres and featuring complex metallic infrastructures, it was decided to subdivide the area of interest in 7 different sub-areas. Accordingly, each of the sub-areas was equipped with a SN unit and with an appropriate number of EN units. The VCPMS gathers data from the field at minute data rate to produce a real-time VOC concentration map of some key areas in the plant, namely the ST40 chemical plant ( eni 6, eni 7), the benzene pipeline (eni 5), the perimeter (eni 1, eni 2, eni 5) and one of the benzene tanks (eni 3). In the ST40 area six
www.intechopen.com

Environmental Monitoring
228
ENs were located, regularly positioned around the plant to detect any VOC emission generated by the plant itself. Two WSD sensors provide information about wind intensity/direction in form of a blue arrow (see Fig. 2). Taking into account for the fact that the wind is turbulent within the plant, the WSD information turns out to be very useful to establish a proper correlation between wind distribution and VOC concentration.
Fig. 2. Lay-out of the installation featuring the SN units (grey) and the EN units (rose)
In the pipeline area two ENs were located in close proximity of the possible sources of fugitive, while three ENs were located along the perimeter. The installation on top of the benzene tank requires ATEX certification which was not yet completed at the time this paper was edited. The units deployed so far consist of a total of seven SNs and ten ENs; owing to the high degree of modularity of the WSN architecture, however, the system is fully scalable by simply deploying additional ENs, with self-configuration capability.
6. System architecture
Various WSN architectures, including mesh and cluster three, have been investigated as potential candidates, each exhibiting advantages and drawbacks; in this application, as it will be explained below, the VOC detectors have to be continuously powered-on and the wireless node has to transmit data at minute data-rate. VOC detector cost, in terms of power consumption, is thus predominant with respect to transmission cost; in that context, the mesh configuration turned-out to be unnecessarily complicate in terms of protocols and less efficient in terms of energy budget; consequently, the much simpler and effective cluster
www.intechopen.com

Real-Time Monitoring of Volatile Organic Compounds in Hazardous Sites
229
three configuration represented in Fig. 3 was selected. The basic elements of the network are, the SN, the EN and the Router Node (RN). In this application only SNs and ENs were used. The GPRS unit is always connected to the GSM base station and transmits the gathered meteo-climate data down to 1 second rate (e.g wind). The ENs are normally in the low-power sleeping mode; they wake-up for a short time at 1 minute time interval, perform read-out of the VOC sensor and forward the gathered concentration data to the SN unit, along with other climatic and diagnostic information.
7. System requirements
For hazardous and complex industrial sites, it is very important to have a monitoring tool with a whole range of features in an economically feasible way. In particular, when designing a monitoring network is necessary to take into account the following issues: i. Data grid: in the presence of multiple diffuse sources (as for VOC in industrial sites), it is
important to implement a grid monitoring network, in order to have simultaneously available data over the whole area of the plant. Correlation with meteorological parameters allows then to better interpret the data and identify major emission sources.
ii. Real-time acquisition: the availability of real-time and continuous data is relevant to detect and effectively manage emergencies that may occur within the perimeter of the plant.
iii. Data rate: it is important to have high sampling rate (i.e. samping interval of one minute or less) to determine in detail for critical short-term situations and to address the best corrective actions.
iv. Scalability and reconfigurability: network scalability and reconfigurability are key issues, in particular in complex industrial sites; in addition to deploy fixed stations (e.g. on the perimeter of the plant), it can be useful to move the monitoring stations in specific areas during critical process phases with potential impact in terms of VOC emissions (eg. stop, start, revamping, etc.).
v. Data rendering: depending on the purpose of monitoring (emergency management, monitoring air quality, etc.) it is useful to make available real-time VOC concentration data as well as statistical index or cumulative parameters. This solution can be effective in terms of cost/benefit if specific information for a particular compound is not required.
vi. Detection threshold: if the purpose of monitoring is not only the management of emergency situations but also the evaluation of mean VOC concentrations or specific substances (for example, using the fixed monitoring stations), the choice should fall on detectors able to collect data at concentration levels in the order of ppb (as already mentioned, the air quality limit value for benzene in ambient air is about 1.5 ppb).
vii. Communication: the use of wireless stations connected to web-based graphical interface allows to significantly reduce operating costs, infrastructure and personnel involved.
8. System implementation
Based on the previous requirements the WSN-based VOC monitoring system prototype was implemented and tested at Mantova, Italy, petrochemical plant. The aim was to test a new distributed instrument for collecting VOC emission data in real-time with a high degree of flexibility and scalability, thus transferable to other monitoring
www.intechopen.com

Environmental Monitoring
230
stations as needed, reconfigurable, in terms of data acquisition strategies, and economically sustainable as compared to traditional fixed monitoring stations.
Fig. 3. The hybrid cluster-three network configuration
Critical locations were identified along the perimeter of the industrial sites, and within some specific relevant internal areas potentially involved in emissive processes. Seven SNs and 10 ENs to be described in the following have been deployed so far.
8.1 The SN unit Each SN unit typically consists of the five components such as sensor unit, analogue digital converter (ADC), central processing unit (CPU), power unit, and communication unit. Communication unit’s task is to receive command or query and transmit data from CPU to outside world. CPU is the most complex unit; it interprets the command or query to ADC, monitors and controls power if necessary, processes received data and manages the EN wake-up. The block diagram of the SN unit is represented in Fig. 4. It consists of a GPRS antenna and GPRS/EDGE quadriband modem, a sensor board, a wireless unit and a micro-controller ARM-9, operating at 96 MHz clock.
Fig. 4. Block diagram of the Sink Node Unit
www.intechopen.com

Real-Time Monitoring of Volatile Organic Compounds in Hazardous Sites
231
The GPRS unit operates on the basis of a proprietary communication protocol over TCP/IP, with DHCP. Dynamic re-connectivity strategies were implemented to provide an efficient and reliable communication with the GSM base station. All the main communication parameters like, IP address, IP port (server and client), APN, PIN code and logic ID can be remotely controlled.
Fig. 5. Block diagram of the wireless interface
The system is based on an embedded architecture with high degree of integration among the different subsystems. The unit is equipped with various interfaces including LAN/Ethernet (IEEE 802.1) with TCP/UDP protocols, USB and RS485/RS422, in addition to a wireless interface, which provides short range connectivity. The sensor acquisition board is equipped with 8 analogue inputs, and 2 digital inputs. The SN unit is also equipped with a Wireless Interface (WI), represented in Fig. 5, providing connectivity with the EN units. The WI operates in the low-power, ISM UHF unlicensed band (868 MHz) with FSK modulation, featuring proprietary hardware and communication protocols. Distinctive features of the unit are the integrated antenna, which is enclosed in the box for improved ruggedness, and a PA and LNA for improved link budget. The PA delivers some 17 dBm to the antenna, while the receiver Noise Figure was reduced to some 3.5 dB, compared with the intrinsic 15 dB NF of the integrated transceiver. As a matter of fact, a connectivity range in line-of-sight in excess of 500 meters was obtained. This results in a reliable communication with low BER, even in hostile e.m. environments. The energy required for the operation of the unit is provided by a 80 Ah primary source and by a photovoltaic panel equipped with a smart voltage regulator. Owing to a careful low-power design, the unit could be powered with a small (20 W) photovoltaic panel for undiscontinued and unattended operation. A picture of one of the SN unit installed at the Mantova plant is represented in Fig. 6, left. The battery and photovoltaic panel are clearly visible; the GPRS unit is the grey box close to
www.intechopen.com

Environmental Monitoring
232
the photovoltaic panel, and the WI is the white box on the top. The wind sensor and the RHT sensor with the solar shield are also visible. A concrete plinth serves as base for the unit, thus avoiding the need of excavations, which could be troublesome in the context of the plant due to pollution and contamination issues. A picture of an EN unit is represented in Fig. 6, right. The photovoltaic panel along with the power supply and sensor board units are visible in the middle, while the VOC detector unit, protected by a metallic enclosure, is visible at the bottom. Also in this case a concrete plinth serves as the base for the unit.
Fig. 6. SN (left) and EN (right) units installed in proximity of the pipeline and of the chemical plant
8.2 The EN unit
The block diagram of the EN is represented in Fig. 7; it consists of a WI, similar to that previously described, and includes a VOC sensor board and a VOC detector. The WI unit is visible on the pole-top. Additionally, that solution allows wired connectivity of multiple VOC unit to the same EN, thus increasing modularity and flexibility of the architecture. The acquisition/communication subsystem of the EN unit is based on an ARM Cortex-M3 32 bit micro-controller, operating at 72 MHz, which provides the required computational capability compatible with the limited power budget available. To reduce the power requirement of the overall subsystem, two different power supplies have been implemented, one for the micro-controller and one for the peripheral units; accordingly, the microcontroller is able to connect/disconnect the peripheral units, thus preserving the local energy resources. The VOC detector subsystem, in particular, is powered by a dedicated switching voltage regulator; this provides a very stable and spike-free energy source, as required for proper operation of the VOC detector itself.
www.intechopen.com

Real-Time Monitoring of Volatile Organic Compounds in Hazardous Sites
233
Fig. 7. Block diagram of the End Node Unit
The communication between EN unit and VOC detector board is based on a RS485 serial interface, providing high immunity to interference and bidirectional communication capability, as required for remote configuration/re-configuration of the unit.
Fig. 8. Energy balance of the photovoltaic subsystem
Thanks to the efficient communication protocols and effective power management strategies, the EN unit has a battery life on some two months of continuous VOC detector operation at 1 minute transmission data-rate, only relaying on primary energy resources. The technologies described above allow for the implementation of monitoring procedures in different ways, namely real-time sampling, continuous or discontinuous measurement, VOC analysis with specific concentration of single compounds, to name a few.The secondary energy source plays a key role in ensuring the stand-alone and unattended operation of the sensor network infrastructure. The photovoltaic power supply unit includes a charge
www.intechopen.com

Environmental Monitoring
234
regulator which was specifically designed to provide maximum energy transfer efficiency from the panel to the battery under any operative condition. In Fig. 8 upper left, the weekly graph of the power absorbed/generated by the photovoltaic power supply is represented; the blue line represents the positive balance, i.e. the panel is charging the battery, while the red line represents the negative balance, i.e. the primary source is supplying energy to the subsystem. In Fig. 8, bottom left, a comparison between the current generated by the system and the solar radiation under very clean daylight condition is presented; the right sheet represents the energy budget statistics generated by the system for one of SN unit. In Fig. 8 right, a summary of the daily, weekly and monthly energy balance is represented; more detailed analysis and diagnostics are available.
9. The VOC detector
The VOC detector obviously plays a key role for the real-time monitoring system; the main requirements are listed in Table 1.
Operation mode Diffusion (no pumped) Targeted gas VOCs IP> 10.6 eV Concentration range (ppb) 2,5 to 5,000 Minimum Detectable Level (ppb) > 2,5 Sensitivity > 20 mV/ppm Accuracy < 5% in the overall range Linearity n.a. VOC data sampling int. (minutes) < 15 Power consumption (mW) < 200 Stabilisation time from power-on T90 (s) < 60 Warm-up time (s) < 60 Interval between services (days) > 120 Lifetime (years) > 5 Specificity to benzene typically broad band
Table 1. VOC detector requirements
Inspection of Table 1 shows very demanding requirements; an extensive analysis of the state-of-the-art of VOC detectors available on the market was performed to identify the most suitable technology. Different candidate technologies were considered, including Photo Ionisation Detector (PID), Amperometric Sensors, Quartz Crystal Microbalance (QMC) sensors, Fully Asymmetric Ion Mobility Spectrography (FAIMS) based on MEMS, Electrochemical Sensors and Metal Oxide Semiconductor Sensors (MOSS). It turned-out that PID technology fitted quite well to the requirements of Table I, and thus it was elected as the basic technology to be used for this application. The device chosen for this application was he Alphasense AH, which exhibits 5ppb (isobutylene) minimum detection level. Both theoretical and experimental investigations of PID operation were carried-out to assess the technology. Two major issues were identified, capable of potentially affecting the use the PID in our application; the first was that in the low ppb range the calibration curve of the PID is non-linear; this would require an individual, accurate and multipoint calibration with inherent cost and complexity; the second was that, when operated in diffusion mode at low
www.intechopen.com

Real-Time Monitoring of Volatile Organic Compounds in Hazardous Sites
235
ppb and after a certain time of power-off, the detector requires a stabilisation time of several minutes, thus preventing from operating it at minutes duty-cycles. As for the calibration issue, a linearisation procedure was developed based on a behavioural model of the PID2; accordingly, the voltage read-outs received by the detector, Vn, are prior preprocessed by multiplying with a non-linearity compensation factor, α(C), function of the concentration C:
nCvSnV)nC(=cnV (1)
where Vcn is the read-out corrected by the non-linearity compensation factor α, Cn is the concentration in ppm and Vn is the nth read-out in mV, and Sv is the PID sensitivity in mV/ppm. Equation (1) shows that, after compensation, the values Vcn can be easily mapped in the corresponding concentration value. In Fig. 9 and 10 the linearised calibration curves in the range 0-500 ppb are presented for two different PIDs. Fig. 9 represents the experimental calibration curve (read-out vs concentration) of a PID with a relatively high sensitivity, 150 mV/ppm. The non-linearity in the range 0-200 ppb is clearly observed, blue line.
Fig. 9. Calibration curves for a PID with high sensitivity before (blue) and after (red) linearisation
The result of the linearisation process, according to the previously outlined procedure, is represented by the red line. Fig. 10 represents the same as Fig. 9 for a PID with relatively low sensitivity (50mV/ppm). In both cases, the linearisation procedure proved to be effective. The main advantage of the described approach is that for performing the PID calibration, one single parameter is needed, i.e. the value of the PID sensitivity, which is measured at ppm concentrations; this makes much simpler and less costly the calibration process. 2 GF Manes, unpublished results
www.intechopen.com

Environmental Monitoring
236
As for the stabilisation time, several experiments were performed to qualify the PID performance; it was found that at low concentration (tens or hundreds ppb), which represents the area of operation of the VOC detectors in our application and when operated in the diffusion mode, the PID exhibits a stabilisation time of some minutes after a power-off/power-on cycle. A typical PID duty cycled response after storage is represented in Fig. 11. The experimental stabilisation curve is compared with a 80 s decay-time exponential function showing an excellent fitting. After a warm-up of several hours the PID was powered-off for 15 minutes and then powered-on again; thie sequence simulated a 15 minute sampling interval, which was the initial target of our application; in this experiment ambient concentration was around 50 ppb, which represents the average concentration where the PID is supposed to be set up.
Fig. 10.Calibration curves for a PID with low sensitivity before (blue) and after (red) linearisation
As observed in Fig. 11, a 300 seconds stabilisation time is needed prior the PID can reach a stable read-out value. This experiment shows that a 15 minutes sampling interval calls for a 5 minutes stabilisation time, thus resulting in some 30% duty-cycle. A duty-cycled operation, as compared with a continuous power-on operation, is desirable in principle to prolong both the battery- and lamp-life; however, the benefit of energy saving allowed for by the 30% duty cycle is marginal, when compared with the advantage of achieving a more time-intensive monitoring of VOC concentration, as provided by continuous power-on operation. In terms of energy resources, continuous power-on operation requires some 35 mAh charge, which corresponds to 1 month of full operation with a 30 Ah primary energy source; the corresponding power consumption of 360 mW@12 Vdc can be balanced using a 5 W photovoltaic panel. The UV lamp expected life is more than 6000 hours of continuous operation; we expect at least a quarterly service for the PIDs, due to environment contamination and related lamp
www.intechopen.com

Real-Time Monitoring of Volatile Organic Compounds in Hazardous Sites
237
efficiency degradation. For those reasons it was decided to operate the PID in continuous operation mode.
Fig. 11. PID stabilisation curve on duty-cycled power-on
10. Experimental results
Data from the field are forwarded to a central database for data storage and data rendering. A rich and proactive user interface was implemented, in order to provide detailed graphical data analysis and presentation of the relevant parameters, both in graphical and bi-dimensional format. Data from the individual sensors deployed on the field can be directly accessed and presented in various formats by addressing the appropriate sensor(s) displayed on the plant map, see Fig 12 left. The position of each SN and EN unit is displayed on the map; by positioning the mouse pointer over the corresponding icon, a window opens showing a summary of current parameter values. A summary of the sensor status for each deployed unit can be obtained by opening the summary panel, Fig. 12, right. The summary panel reports current air temperature/humidity values, along with min/max values of the day (left lower, in Fig. 12), wind speed and direction (left upper, in Fig. 12), and VOC concentration (right, in Fig. 12), in the last six hours. A graphic representation of data gathered by each sensor on-the field can be obtained by opening the graphic panel window, see Fig. 13. The graphic panel allows anyone to display the stored data in any arbitrary time interval in graphic format; up to six different and arbitrarily selected sensors can be represented in the same graphic window for purpose of analysis and comparison.
www.intechopen.com

Environmental Monitoring
238
Fig. 12. Plant lay-out and details of the sensors
In Fig. 13 left, the VOC concentration traces of three different detectors are represented in a period of one day; in Fig. 13 right, the same data are displayed in a period of 30 days. By using the pointer, it is possible to select a time sub-interval and to obtain the corresponding graphic representation at high resolution.
Fig. 13. Representation of sensor data in graphic format
In Fig. 13 left, the VOC concentration background is around 50 ppb; thanks to the very intensive sample-interval, 1 minute, the evolution of the concentration in time, along with other relevant meteo-climatic parameters can be very accurately displayed; it should be noted that the spikes which can be observed in the blue trace, Fig. 13 left, have a duration of some 3 minutes. The multi-trace graphic feature is very useful to perform correlation between different parameters. In Fig. 14 two examples of correlation between WSD and VOC concentration are shown. In Fig. 14 left, the VOC concentration, green line, exhibits a night/day variation; this is compared with the wind speed, rosé line, which increases during the day hours and decreases during the night hours, very likely due to the thermal activity. As it can be observed, in fact, wind speed and VOC concentration are in phase opposition, i.e. the greater the wind speed, the lower the average VOC concentration in the plant, that is in good agreement with what one can expect.
www.intechopen.com

Real-Time Monitoring of Volatile Organic Compounds in Hazardous Sites
239
Fig. 14. Correlation between wind speed and VOC concentration
The effect of a sudden wind speed increase, light green line, is shown on the right graph of Fig. 14 right. It can be observed a wind speed increases to some 5m/s and more, green line, around 10 pm; accordingly, the VOC concentration detected by the three PIDs deployed in the plant is suddenly decreased. It should be noted that the three PIDs are located several hundred meters far apart each other.
Fig. 15. Multi-trace read-outs of the six VOC sensors deployed around the ST40 plant
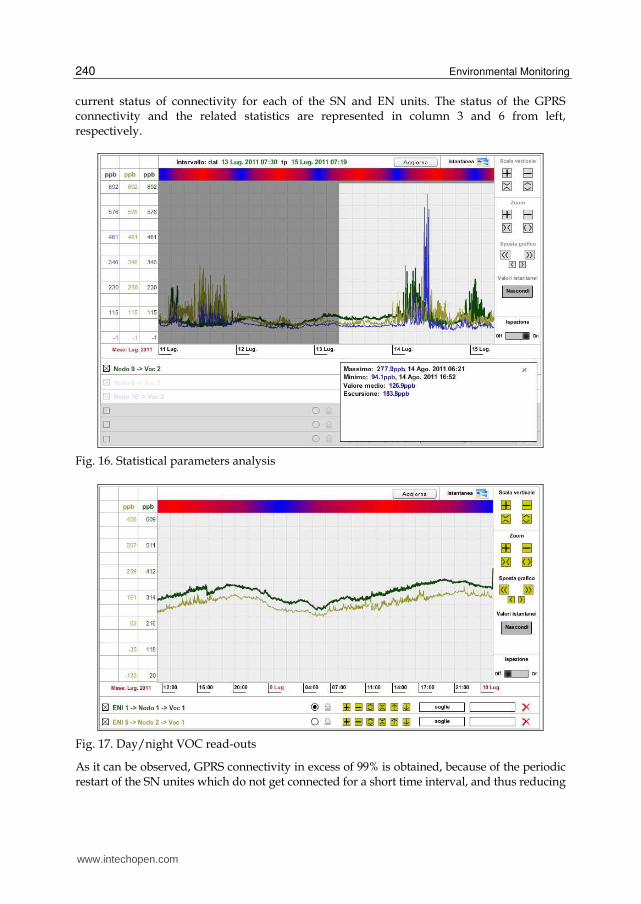
In Fig. 15, the read-outs of the 6 VOC sensors deployed around the ST40 plant are represented; it should be noted the very good uniformity among the background concentration levels demonstrating the effectiveness of the calibration procedure. The user interface can perform various statistics on the data items; in the graphic panel, the user can enter the inspection mode, see the button on the lower right in Fig. 16, and set an user defined inspection window (in white); the window can be set over an arbitrary time interval; parameters like max/min, arithmetic mean and maximum variation can be then obtained for each of the sensor represented in the graphic window, lower right. The sensitivity of the PID sensor is demonstrated in Fig. 17, where the traces of two different PIDs are shown. The PIDs are located some 500 meters far apart. At the time of data recording, there were some maintenance works going on in the plant’s area. The VOC components due to maintenance works were detected by the PIDs and recorded as small variation of the concentration around the mean value during the working hours (from 8 am to 6 pm, roughly), to be compared with the more smoothed traces recorded during the night. A diagnostic panel is available to evaluate the system Quality of service (QoS) and the gathered data reliability, see Fig. 18; connectivity statistics are displayed along with the
www.intechopen.com
Environmental Monitoring
240
current status of connectivity for each of the SN and EN units. The status of the GPRS connectivity and the related statistics are represented in column 3 and 6 from left, respectively.
Fig. 16. Statistical parameters analysis
Fig. 17. Day/night VOC read-outs
As it can be observed, GPRS connectivity in excess of 99% is obtained, because of the periodic restart of the SN unites which do not get connected for a short time interval, and thus reducing
www.intechopen.com

Real-Time Monitoring of Volatile Organic Compounds in Hazardous Sites
241
the overall GPRS efficiency figure. EN unit status and connectivity are displayed in the columns 4 and 9 from left, while power supply status is showed in column 5 from left. The diagnostic panel identifies any lack of connectivity and/or reliability of each single SN or EN unit for immediate service action.
Fig. 18. The diagnostic panel
In addition to the graphic format, data items can be represented in a bi-dimensional format. It is quite difficult to correlate the data in graphic format from different sensors deployed over the plant; a helpful bi-dimensional picture of the area based on an interpolation of algorithms has been implemented, resulting in a very synthetic representation of the parameters of interest over the plant in pseudo-colours. The sensors are basically punctual and, thus, are only representative of the area in their proximity. For that reason the interpolation would be only effective if an adequate number of sensors is deployed on the field, so that the area is subdivided into elementary cells, quasi- homogeneous in terms of the parameter values. This requirement would result in an unnecessarily high number of units to be deployed. A more effective approach is to take into account the morphology and functionality of the different areas of the plant and deploy the sensors accordingly. As for the VOC, by instance, the potential sources of VOC emissions in the plant are located in well identified areas like, the chemical plant and the benzene tanks; accordingly, the deployment strategy includes a number (6) of VOC sensors surrounding the chemical plant infrastructure, thus resulting in a virtual fence, capable of effectively evaluating VOC emissions on the basis of the concentration pattern around the plant itself. As for wind speed and direction, which are relevant for correlation with VOC concentration, on the basis of an evaluation of the plant infrastructures, the areas of potential turbulence were identified and the wind sensors were deployed accordingly. Both SN and EN units were equipped with RHT sensors, whose cost is marginal. In Fig. 19 two bidimensional pictures of the temperature (left) and RH (right) in the area of the plant are represented. Not surprisingly, both temperature and RH are not uniformly distributed; according to the colour scale of air temperature blue means lower temperature and red means higher temperature; in this case the temperature ranges from 28°C (blue) to 31°C (red). Two areas of higher temperature are clearly identified, one on the left around the chemical plant ST40
www.intechopen.com

Environmental Monitoring
242
and the other on the right around the arrival of the pipeline; this is obviously related to the mechanical activity in those areas. The thermal distribution also influences the air RH as demonstrated in Fig. 19, left. In this case the grey colour means lower RH and the blue colour means higher RH. The RH values range from 26% to 33%, in this case. The temperature gradient among the different areas in the plant, which in some cases grew to up 5°C, is responsible of some thermal activity possibly affecting the VOC concentration distribution.
Fig. 19. Bi-dimensional map of air temperature (left) and air RH (right) distribution in the area of the plant
Fig. 20. Bi-dimensional map representing VOC concentration in the plant
VOC concentration is mapped in Fig. 20 in pseudo-colours. In this case blue denotes lower concentration, while red denotes higher concentration; it should be emphasized that the red colour has no reference with any risky or critical condition at all, beings only a chromatic option.
www.intechopen.com

Real-Time Monitoring of Volatile Organic Compounds in Hazardous Sites
243
As it can be noted, wind direction represented by blue arrows is far by being uniform over the plant, thus denoting turbulences due to the plant infrastructures and surrounding vegetation.
11. Conclusions
An end-to-end distributed monitoring system integrating VOC detectors, capable of performing real-time analysis of gas concentration in hazardous sites at unprecedented time/space scale, has been implemented and successfully tested in an industrial site The aim was to provide the industrial site with a flexible and cost-effective monitoring tool, in order to achieve a better management of emergency situations, identify emission sources in real time, and collect continuous VOC concentration data using easily re-deployable and rationally distributed monitoring stations. The choice of collecting data at minute time interval reflects the need to identify short term critical events, quantify the emission impacts as a function of weather conditions and operational process, and identify critical areas of the plant. The choice of a WSN communication platform gave excellent results, above all the possibility to re-deploy and re-scale the network configuration according to specific needs, while greatly reducing installation cost. Furthermore, to manage real-time data through a web based interface allowed both adequate level of control and quick data interpretation in order to manage critical situations. Among the various alternatives available on the market, the choice of PID technology proved to meet all the major requirements. PIDs are effective in terms of energy consumption, measuring range, cost and maintenance, once installed in the field. The installation of weather sensors at the nodes of the main network stations allowed for a better understanding of on-field phenomena and their evolution along with clearer identifcation of potential emission sources. Future activity will include a number of further developments, primarily the development of a standard application to allow the deployment of WSN in other network industries (e.g. refineries) and an assessment of potential applications for WSN infrastructure monitoring of other environmental indicators.
12. Acknowledgement
This work was supported by eni SpA under contract N.o 3500007596. The authors wish to thank W O Ho and A Burnley, Alphasense Ltd., for many helpful comments and clarifications concerning the PID operation, S Zampoli and G Cardinali, IMM CNR Bologna, for many discussions on PID characterisation and E Benvenuti, Netsens Srl, for his valuable technical support. Assistance and support by the Management and technical Staff of Polimeri Europa Mantova is also gratefully acknowledged.
13. References
Adler R.; Buonadonna, P. Chhabra, J. Flanigan, M. Krishnamurthy, L. Kushalnagar, N. Nachman, L. & Yarvis M. (2005). Design and Deployment of Industrial Sensor Networks: Experiences from the North Sea and a Semiconductor Plant in ACM SenSys, November 2-4, 2005, San Diego, CA.
www.intechopen.com

Environmental Monitoring
244
Alphasense Ltd.; Application Note AAN 301-02 Dargie W.; & Poellabauer, C. (2010). Fundamentals of wireless sensor networks: theory and
practice. John Wiley and Sons, ISBN 978-0-470-99765-9, 168–183, 191–192 EC Working Group on Guidance for the Demonstration of Equivalence, Guide to the
Demonstration of Equivalence of Ambient Air Monitoring Methods, January 2010 European Commission, Integrated Pollution Prevention and Control (IPPC): Reference Document
on Best Available Techniques for Mineral Oil and Gas Refineries , February 2003 European Commission, Integrated Pollution Prevention and Control (IPPC): Reference Document
on Best Available Techniques in the Large Volume Organic Chemical Industry, February 2003
European Commission, Integrated Pollution Prevention and Control (IPPC): Reference Document on the General Principles of Monitoring, July 2003
European Parliament and Council, DIRECTIVE 2008/50/EC on ambient air quality and cleaner air for Europe, 21 May 2008
European Parliament and Council, DIRECTIVE 2010/75/EU on industrial emissions (integrated pollution prevention and control), 24 November 2010
ISPRA, Database of historical emissions of main pollutants in Italy by sectors J. Jeong J.; Culler. D.E & Oh. J. H. (2007). Empirical analysis of transmission power control
algorithms for wireless sensor networks in Proc. 4th Intl. Conf. on Networked Sensing Systems (INSS '07), Piscataway, NJ: IEEE Press, 2007, pp. 27-34.
Karl, H.; & Willig, A. “Protocols and Architectures for Wireless Sensor Networks”, Wiley, 1st Edition.
Locke D.C.; & Meloan, C. E. (1965). Study of the Photoionisation Detector for Gas Chromatography, in Vol. 37, No. 3, March 1965 pp. 389-397.
Lorincz K.; Malan, D. Fulford-Jones. T.R.F. Nawoj. A. Clavel A. Shnayder, V. Mainland, G. Moulton. S. & Welsh M (2004). Sensor Network for Emergency Response: Challenges and Opportunities” In IEEE Pervasive Computing, Special Issue on Pervasive Computing for First Response, Oct-Dec 2004.
Pakzad S. M.; Fenves, G. L. Kim, S. & Culler. D. E. (2008). Design and Implementation of Scalable Wireless sensor Network for Structural Monitoring. In ASCE Journal of Infrastructure Engineering, March 2008, Volume 14, Issue 1, pp. 89-101.
Price J. G. W.; Fenimore. D.C. Simmonds, P.G. & Zlatkis A. (1968). Design and Operation of a Photoionization Detector for Gas Chromatography, in Analytical Chemistry, Vol. 40, No. 3, March 1968, pp. 541, 547.
R. Szewczyk R.; Mainwaring, A. Polastre, J. & Culler, D. E. (2004). An Analysis of a Large Scale Habitat Monitoring Application. ACM Conference on Embedded Networked Sensor Systems (SenSys), November 2004.
Sohraby, K.; Minol, D. & Znati, T. (2007). Wireless sensor networks: technology, protocols, and applications. John Wiley and Sons, 2007 ISBN 978-0-471-74300-2, pp. 203–209
Stoianov I.; Nachman, L. & Madden, S. (2007). PIPENET: A Wireless Sensor Network for Pipeline Monitoring IPSN’07, April 25-27, 2007, pp. 264-273 Cambridge, Massachusetts, U.S.A.
www.intechopen.com

Environmental MonitoringEdited by Dr Ema Ekundayo
ISBN 978-953-307-724-6Hard cover, 528 pagesPublisher InTechPublished online 04, November, 2011Published in print edition November, 2011
InTech EuropeUniversity Campus STeP Ri Slavka Krautzeka 83/A 51000 Rijeka, Croatia Phone: +385 (51) 770 447 Fax: +385 (51) 686 166www.intechopen.com
InTech ChinaUnit 405, Office Block, Hotel Equatorial Shanghai No.65, Yan An Road (West), Shanghai, 200040, China
Phone: +86-21-62489820 Fax: +86-21-62489821
"Environmental Monitoring" is a book designed by InTech - Open Access Publisher in collaboration withscientists and researchers from all over the world. The book is designed to present recent research advancesand developments in the field of environmental monitoring to a global audience of scientists, researchers,environmental educators, administrators, managers, technicians, students, environmental enthusiasts and thegeneral public. The book consists of a series of sections and chapters addressing topics like the monitoring ofheavy metal contaminants in varied environments, biolgical monitoring/ecotoxicological studies; and the use ofwireless sensor networks/Geosensor webs in environmental monitoring.
How to referenceIn order to correctly reference this scholarly work, feel free to copy and paste the following:
Gianfranco Manes, Giovanni Collodi, Rosanna Fusco, Leonardo Gelpi, Antonio Manes and Davide Di Palma(2011). Real-Time Monitoring of Volatile Organic Compounds in Hazardous Sites, Environmental Monitoring,Dr Ema Ekundayo (Ed.), ISBN: 978-953-307-724-6, InTech, Available from:http://www.intechopen.com/books/environmental-monitoring/real-time-monitoring-of-volatile-organic-compounds-in-hazardous-sites

© 2011 The Author(s). Licensee IntechOpen. This is an open access articledistributed under the terms of the Creative Commons Attribution 3.0License, which permits unrestricted use, distribution, and reproduction inany medium, provided the original work is properly cited.