real-time surveillance system of mechanical specific
TRANSCRIPT
Real-time Surveillance System of Mechanical Specific Energy Applied in
Drilling Parameters Optimization
Yong-Xing SUN1,a,*, Li-Hua QIAO1,b, Hai-Fang SUN1,c, Lie-Xiang HAN1,d, Guo ZHANG1,e
CCDC Drilling & Production Technology Research Institute, Zhongshan Avenue South 2nd section, Guanghan, Sichuan Province, China
[email protected], [email protected], [email protected], [email protected], [email protected]
*Corresponding author
Keywords: Drilling, Mechanical Specific Energy (MSE), Parameters Optimization, Application Evaluation.
Abstract. High efficiency in drilling is measured by Mechanical Specific Energy (MSE). MSE can
be expressed mathematically in terms of controllable parameters Weight on Bit (WOB), Rate of
Penetration (ROP), Revolutions per Minute (RPM) etc. Once the optimum WOB was determined, the
correlation with Torque and Penetration per Revolution was used to determine optimum values for
those parameters for a given drilling situation. The MSE surveillance process provides the ability to
detect changes in the efficiency of the drilling system, more or less continuously. The use of MSE
surveillance is a key feature of well planning and operational practice, MSE analysis has resulted in
redesigned in areas as diverse as well control practices, bit selection, BHA design, makeup torque,
directional target sizing and motor differential ratings. Through lots investigation and research, my
research group has redesigned the MSE calculation modes and developed a MSE software system and
applied in some wells and developed a software, whose ROP was increased an average of 80% on
several pilot wells.
Introduction
It is well known that MSE is the estimate way of the amount of energy input required to remove a
unit volume of rock, expressed in units of energy input divided by volume removed. It is well
documented that MSE by optimizing controllable factors results in maximum ROP [1, 2]
. Most
research regarding MSE focused on its use as a gauge, indicating the relative effects of changes to
efficiency. The MSE concept [3]
presented in 1965, and the formula has been used in bit mechanics
labs as a metric for drilling efficiency and to lesser extent in post-well performance analysis. In 2004,
the MSE has effectively used to optimize drilling parameters and daily drilling progress was
increased an average of 213% on eleven pilot wells [4]
.
MSE real-time surveillance provides a more objective assessment of the efficiency of the system.
The drilling information provider's software has developed to calculate this value continuously from
log data. Like other optimization tools, the MSE plot enables the ROP to be optimized by identifying
the founder point. According to the MSE curve trends besides Torque, RPM etc. analysis, bit
selection, BHA design, makeup torque, directional target sizing and motor differential ratings can be
redesigned to obtain the optimal drilling parameters.
Bit Mechanics
Before MSE was used as an operating tool for optimism drilling parameters, it is necessary to
establish a structured view of the bits drill manner, and the factors that may affect their performance.
Fig.1 [5]
shows a classic drilloff curve that is used for this purpose. The curve is divided into three
regions.
2nd Annual International Conference on Advanced Material Engineering (AME 2016)
© 2016. The authors - Published by Atlantis Press 771
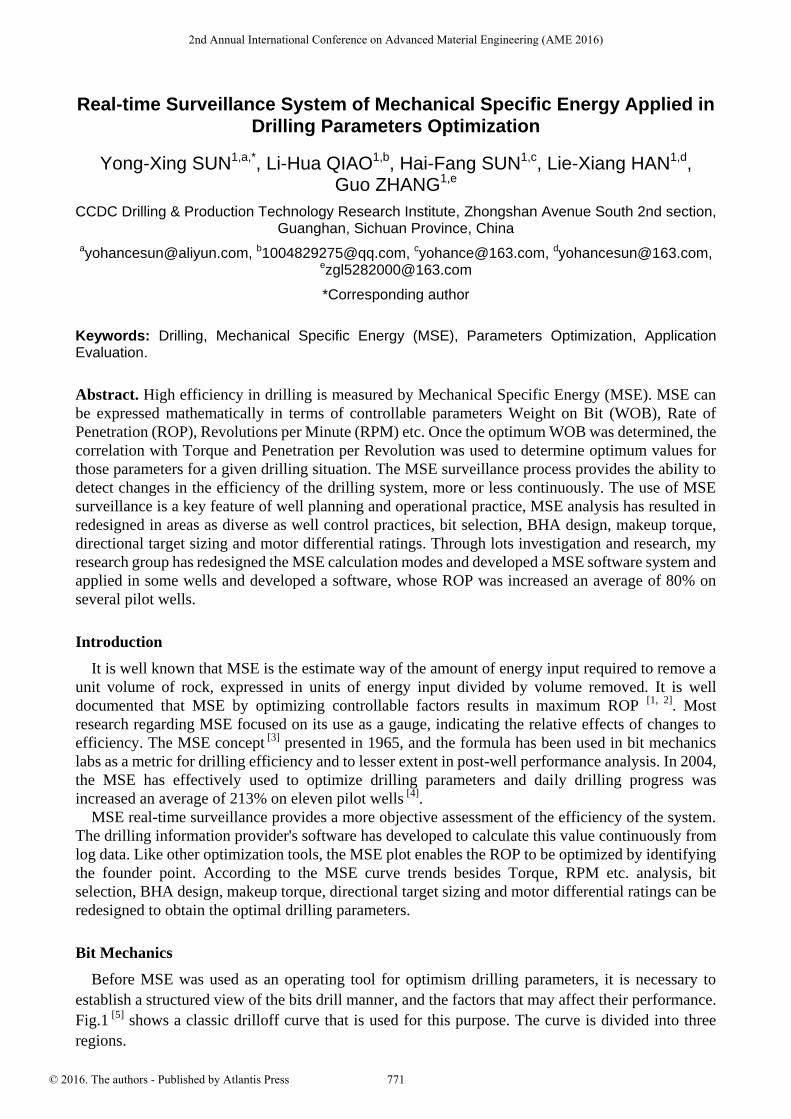
In Region I, poor efficiency drilling performance is constrained by inadequate depth of cut (DOC)
due to low WOB. As the WOB increasing, DOC increasing, and the bit eventually approaches its
peak efficiency.
Region II of the drilloff curve starts when the DOC becomes adequate for the bit's performance to
stabilize. The bit efficiency then remains at about the same level as bit weight is increased up to the
founder point. Throughout this region, changes of WOB cause a proportionate change of ROP.
Though the bit efficiency is not changing, a greater amount of energy is being applied so the ROP
increases proportionately. The slope of the line is relatively constant for eliminate them, but only
delay their onset to a higher WOB [5]
.
Fig.1 A Bit is in its Efficient Range if ROP Responds Linearly to WOB
Fig.2 MSE is Used to Maximize ROP up to the Point of Founder
For given information, bit and rotary speed, and when a bit is loaded into the linear portion of the
drilloff curve, it is transferring the maximum amount of energy that its intrinsic design allows it to
(usually 25-40%) [5]
. If there is no environmental change, it will cause the bit to drill faster when it is
operating within Region II. The WOB or the RPM must be increased in order to drill faster.
Region Ⅲ starts at the founder point in which the transfer of energy from the bit to the rock is
constrained. The founder point is close to the highest ROP, and it's necessary to redesign to extend the
constraining limit for increasing the ROP further. If founder occurs, it must improve drilling
parameters to extend the founder point, or an increase in the input energy if it is limited by
non-founder factors. If founder does not occur, the ROP will continue to increase linearly with WOB
along the slope of this line. The factors that determine ROP can be grouped into two categories, which
772

are 1) factors that create inefficiency (founder), and 2) factors that limit energy input [5]
. Some of
these are shown notionally in Fig.2 [5]
. The three causes of founder are bit balling, bottom hole balling
and vibrations.
MSE Calculation Models
MSE Real-time surveillance is used to find the founder point for the current system and in some
cases the cause of the founder. It is well known that MSE is a ratio. It quantifies the relationship
between input energy and ROP. This ratio should be constant for a given rock, which is to say that a
given volume of rock requires a given amount of energy to destroy. The relationship between energy
and ROP derived firstly by Teal [1, 2]
is:
ROPOutput
EnergyInputMSE
(1)
ROP
NT480WOB4MSE
22 DDT
(2)
It's useful to relate MSE to the drilloff curve. In Region II, the linear slope means that the ratio of
input energy (WOB) to ROP is constant. Since MSE equals this ratio, it must also be a constant value,
but only if the bit is operating within the linear portion of the curve. When the bit is in Region I or III,
a disproportionate amount of energy is being used for the given ROP. This provides a useful
diagnostic. If MSE is constant the bit is efficient and operating in Region II. If MSE rises, the system
is foundering. By plotting MSE continuously at the rig site, the driller can see whether the system is
below or above founder, or whether it moves in or out of founder as various parameters are tested.
The energy required to destroy a given volume of rock is determined by its compressive strength. If
the observed MSE is close to the known confined rock strength, the bit is efficient. If not, energy is
being lost. The value should change as the lithology changes. However, field experience has shown
that the energy losses that occur when the bit founders are usually so large that they cannot be
confused with the small changes that occur with rock compressive strength.
To further improve the usefulness of MSE surveillance in field operations, the specific energy
equation originally derived by Teal has been adjusted to include a mechanical efficiency factor
(EFFM).
)(DDD
T bbmm222M PPROP
Q14400
ROP
NT480WOB4EFFMSEMSE
(3)
Usually, in field operations the operator has set the EFFM uniformly to 0.35, regardless of bit type
or WOB.
Field Application. Based on above results, the MSE Real-time surveillance software system has
been developed, and successfully applied in some wells. Fig.3 shows an example of an MSE display
that is similar to what is viewed by rig site personnel. The inputs to the equation and a few other key
data are plotted in the left-hand tracks and the MSE is shown in the nearly left-hand track. The data is
collected from surface sensors and routed to the data contractor's computer. As drilling progresses,
the calculated MSE is displayed alongside other mechanical drilling curves. Plots can be generated on
time-based or footage-based scales and displayed on any of the rig site monitors. Although the intent
is for MSE analysis to be conducted in real-time by rig site personnel, the information is also
transmitted offsite to the drilling engineer, typically in 50-60kN WOB, and water-based mud. The
formations were sands less than 350MPa. The MSE curve would have been a straight line with a
value of around 500MPa.
773
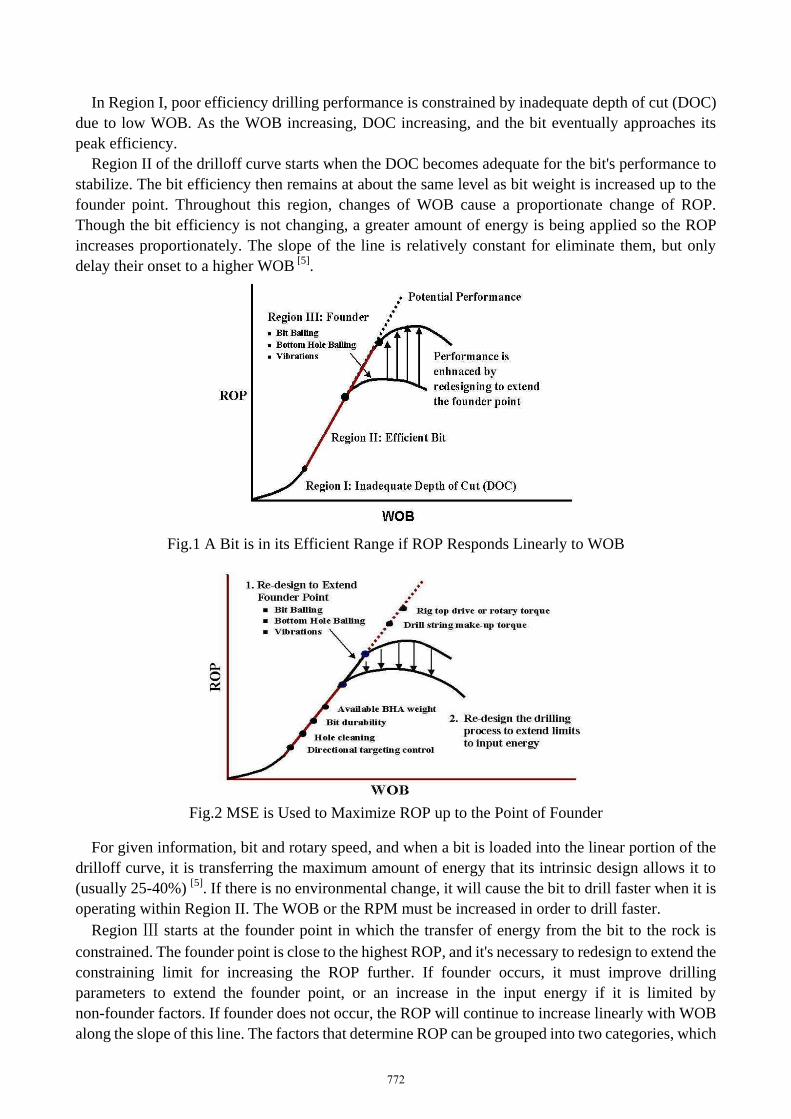
The bit was drilling in a mature area at an average ROP similar to that of the offset record well. The
crew knew that the bit sped up in sands, but viewed this as a result of the sand simply being "slower
drilling". The example illustrates the usefulness of a tool that provides an objective assessment of
performance. The MSE plot makes it clear that this bit and the offset record well were both inefficient
and that it should be possible to drill the entire interval at 2966-2972m if the founder problem in the
sands were addressed. This was done on next depth with a PDC bit.
Fig.3 The MSE Remains Close to the Baseline and ROP Remains a Low Value
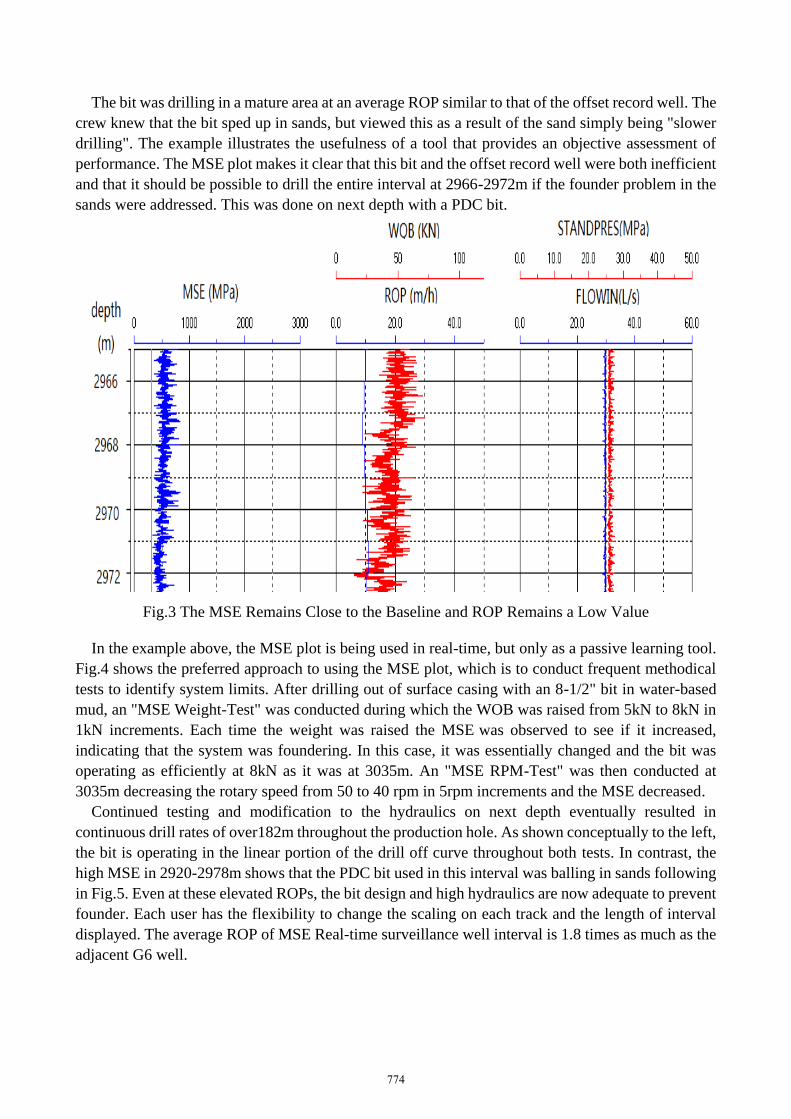
In the example above, the MSE plot is being used in real-time, but only as a passive learning tool.
Fig.4 shows the preferred approach to using the MSE plot, which is to conduct frequent methodical
tests to identify system limits. After drilling out of surface casing with an 8-1/2" bit in water-based
mud, an "MSE Weight-Test" was conducted during which the WOB was raised from 5kN to 8kN in
1kN increments. Each time the weight was raised the MSE was observed to see if it increased,
indicating that the system was foundering. In this case, it was essentially changed and the bit was
operating as efficiently at 8kN as it was at 3035m. An "MSE RPM-Test" was then conducted at
3035m decreasing the rotary speed from 50 to 40 rpm in 5rpm increments and the MSE decreased.
Continued testing and modification to the hydraulics on next depth eventually resulted in
continuous drill rates of over182m throughout the production hole. As shown conceptually to the left,
the bit is operating in the linear portion of the drill off curve throughout both tests. In contrast, the
high MSE in 2920-2978m shows that the PDC bit used in this interval was balling in sands following
in Fig.5. Even at these elevated ROPs, the bit design and high hydraulics are now adequate to prevent
founder. Each user has the flexibility to change the scaling on each track and the length of interval
displayed. The average ROP of MSE Real-time surveillance well interval is 1.8 times as much as the
adjacent G6 well.
774
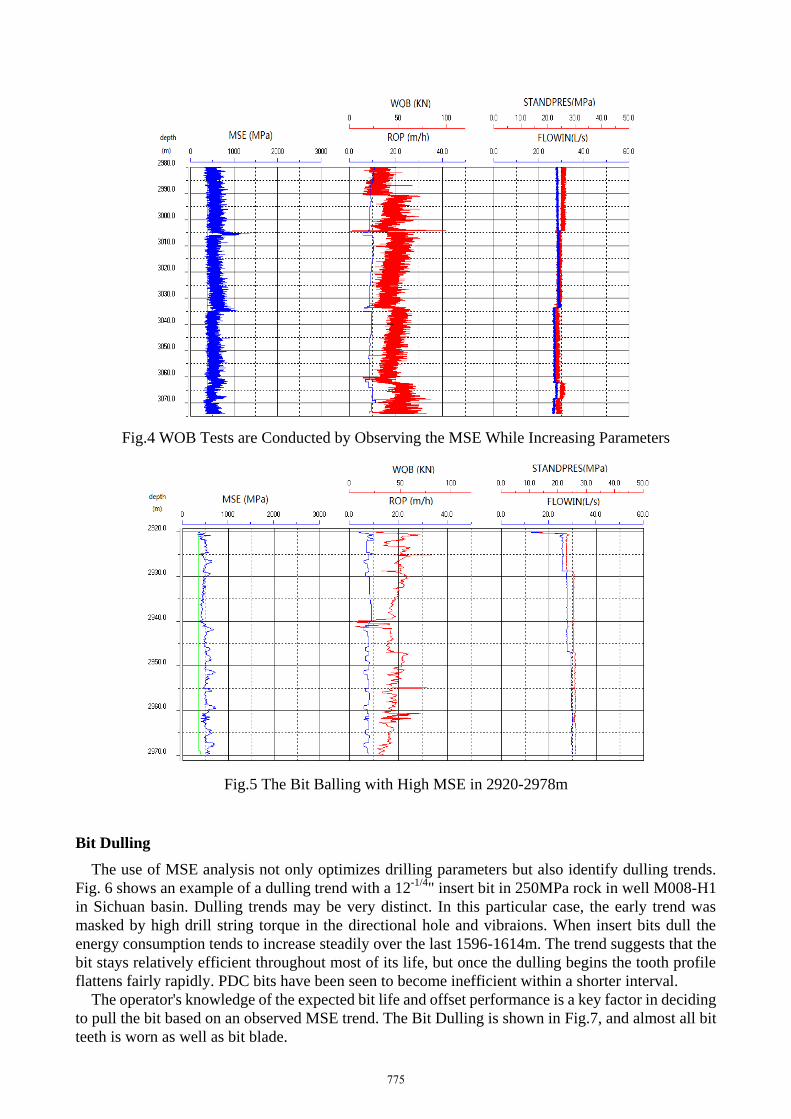
Fig.4 WOB Tests are Conducted by Observing the MSE While Increasing Parameters
Fig.5 The Bit Balling with High MSE in 2920-2978m
Bit Dulling
The use of MSE analysis not only optimizes drilling parameters but also identify dulling trends.
Fig. 6 shows an example of a dulling trend with a 12-1/4
" insert bit in 250MPa rock in well M008-H1
in Sichuan basin. Dulling trends may be very distinct. In this particular case, the early trend was
masked by high drill string torque in the directional hole and vibraions. When insert bits dull the
energy consumption tends to increase steadily over the last 1596-1614m. The trend suggests that the
bit stays relatively efficient throughout most of its life, but once the dulling begins the tooth profile
flattens fairly rapidly. PDC bits have been seen to become inefficient within a shorter interval.
The operator's knowledge of the expected bit life and offset performance is a key factor in deciding
to pull the bit based on an observed MSE trend. The Bit Dulling is shown in Fig.7, and almost all bit
teeth is worn as well as bit blade.
775
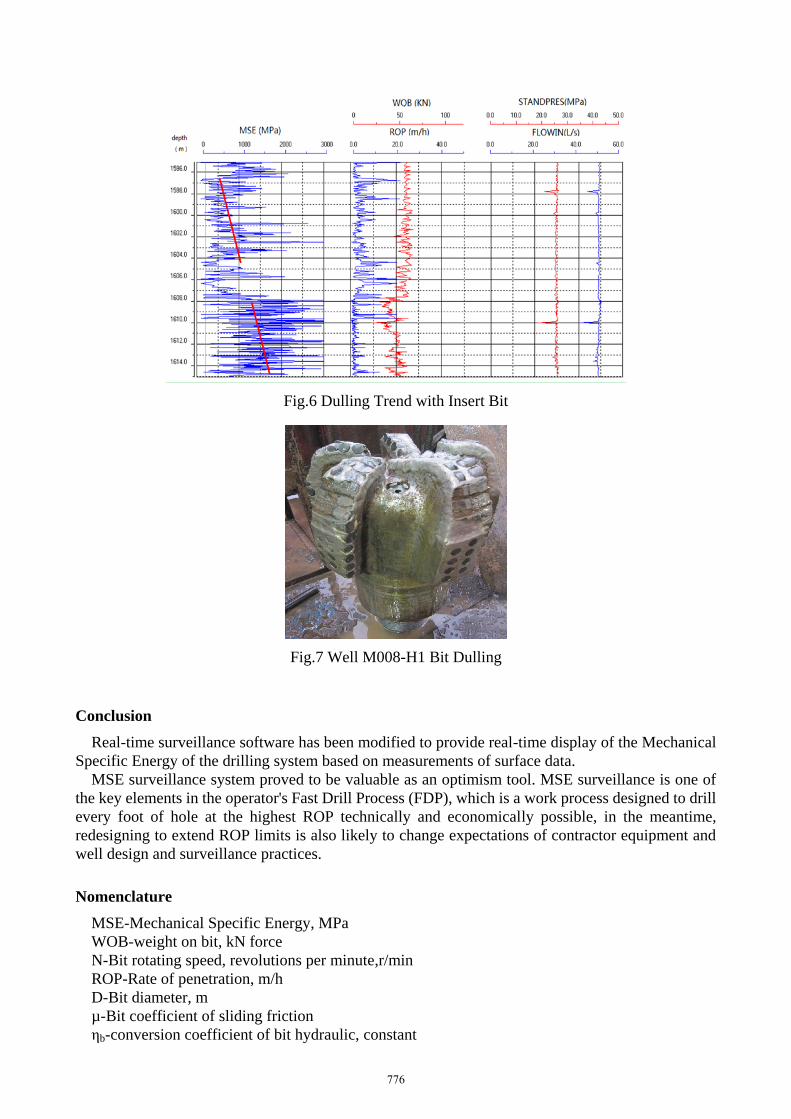
Fig.6 Dulling Trend with Insert Bit
Fig.7 Well M008-H1 Bit Dulling
Conclusion
Real-time surveillance software has been modified to provide real-time display of the Mechanical
Specific Energy of the drilling system based on measurements of surface data.
MSE surveillance system proved to be valuable as an optimism tool. MSE surveillance is one of
the key elements in the operator's Fast Drill Process (FDP), which is a work process designed to drill
every foot of hole at the highest ROP technically and economically possible, in the meantime,
redesigning to extend ROP limits is also likely to change expectations of contractor equipment and
well design and surveillance practices.
Nomenclature
MSE-Mechanical Specific Energy, MPa
WOB-weight on bit, kN force
N-Bit rotating speed, revolutions per minute,r/min
ROP-Rate of penetration, m/h
D-Bit diameter, m
µ-Bit coefficient of sliding friction
ηb-conversion coefficient of bit hydraulic, constant
776

△Pb-bit nozzle pressure loss, MPa
Q-pump displacement, L/s
T-Torque, kN·m
Ηm-conversion coefficient of Screw input power, constant
△Pm-Screw pressure loss, MPa
References
[1] Todd Robert Hamrick. Optimization of Operating Parameters for Minimum Mechanical Specific
Energy in Drilling,” the College of Engineering and Mineral Resources at West Virginia University.
[2] Vivien Azike-Akubue, Steve Barton, Ryan Gee and Timm Burnett, Agitation tool enables
significant reduction in mechanical specific, SPE 158240 presented at Asia Pacific Oil and Gas
Conference and Exhibition held in Perth, Australia, 22-24 Oct. 2012.
[3] Teale, R. The Concept of Specific Energy in Rock Drilling,” Intl. J. Rock Mech. Mining Sci.
(1965) 2, 57-73.
[4] Dupriest, F. and Keoderitz, W. Maximizing Drill Rates with Real-Time Surveillance of
Mechanical Specific Energy, ” SPE paper No.92194 presented at annual Drilling Conference,
Amsterdam, Netherlands, 23-25 February, 2005.
[5] Dupriest F. Maximizing ROP with Real-Time Analysis of Digital Data and MSE, ” IPTC paper
No.10706-PP presented at International Petroleum Technology Conference, Doha, Qatar, 21-23
November, 2005.
777