real-world lorawan network capacity for electrical ... · 3.5 what is the impact of the adr...
TRANSCRIPT
Real-world LoRaWAN™ Network Capacity for Electrical Metering Applications
www.semtech.com Semtech White Paper
Real-world LoRaWAN™ Network Capacity for Electrical MeteringSeptember 2017
www.semtech.com Semtech White Paper2 of 15
TABLE OF CONTENTS
1. Network Setup ........................................................................................................................................3
1.1 Terrain and local conditions ...............................................................................................3
1.2 The LoRa®-enabled meters .................................................................................................4
1.3 Meter protocal.........................................................................................................................4
2. Experimental Results ............................................................................................................................6
3. Network Capacity ..................................................................................................................................7
3.1 Isolated gateway capacity ................................................................................................10
3.2 Average gateway capacity in the network .................................................................10
3.3 Average gateway capacity in the network .................................................................10
3.4 Average gateway capacity in the network .................................................................10
3.5 What is the impact of the ADR algorithm? .................................................................10
3.6 Adding other devices .........................................................................................................13
4. Conclusion ..............................................................................................................................................14
Real-world LoRaWAN™ Network Capacity for Electrical MeteringSeptember 2017
www.semtech.com Semtech White Paper3 of 15
Real-world LoRaWAN™ Network Capacity for Electrical Metering Applications
1. NETWORK SETUPA network of 10,000 electricity meters equipped with Semtech’s LoRa® devices and RF technology (LoRa Technology) has been rolled out in the region of Calenberger Land near Hanover, Germany. The findings in this paper are based on data taken from the installation in the city of Gehrden. Gehrden has a population of 15,000 and includes seven smaller villages nearby. Some 7,000 households were contacted and offered the installation of an electricity meter featuring Semtech’s LoRa Technology. At the time of publishing 536 meters were already installed.
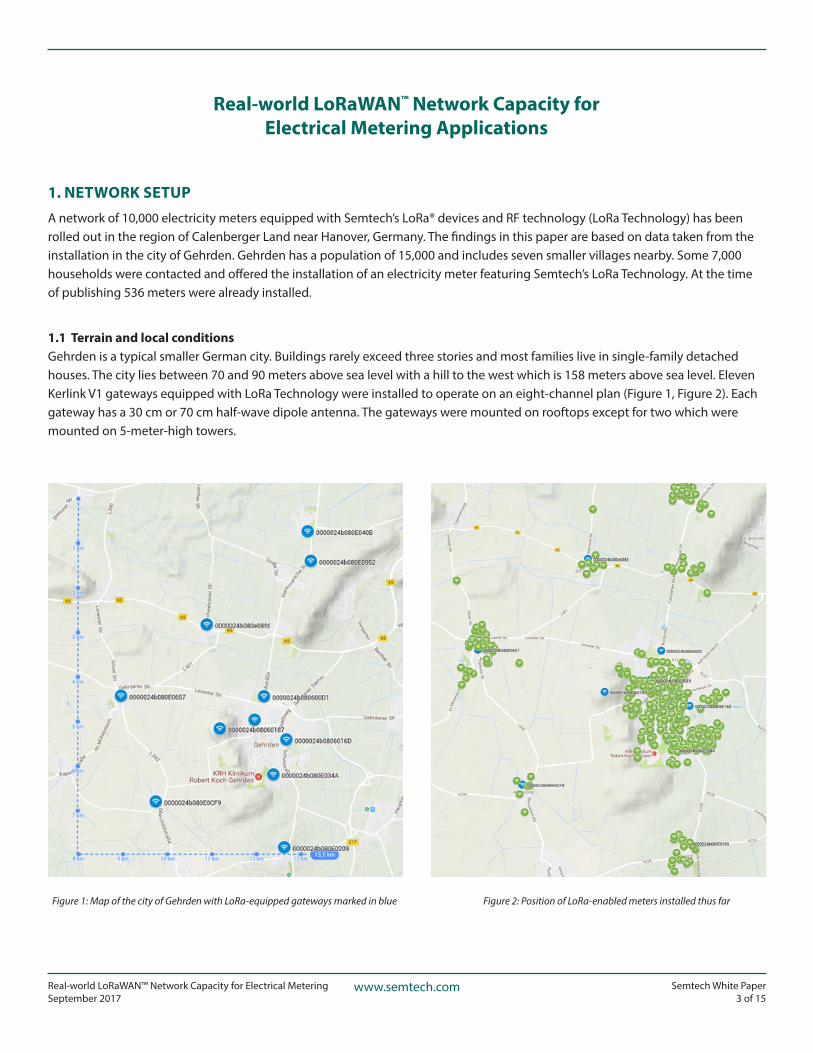
1.1 Terrain and local conditionsGehrden is a typical smaller German city. Buildings rarely exceed three stories and most families live in single-family detached houses. The city lies between 70 and 90 meters above sea level with a hill to the west which is 158 meters above sea level. Eleven Kerlink V1 gateways equipped with LoRa Technology were installed to operate on an eight-channel plan (Figure 1, Figure 2). Each gateway has a 30 cm or 70 cm half-wave dipole antenna. The gateways were mounted on rooftops except for two which were mounted on 5-meter-high towers.
Figure 1: Map of the city of Gehrden with LoRa-equipped gateways marked in blue Figure 2: Position of LoRa-enabled meters installed thus far
Real-world LoRaWAN™ Network Capacity for Electrical MeteringSeptember 2017
www.semtech.com Semtech White Paper4 of 15
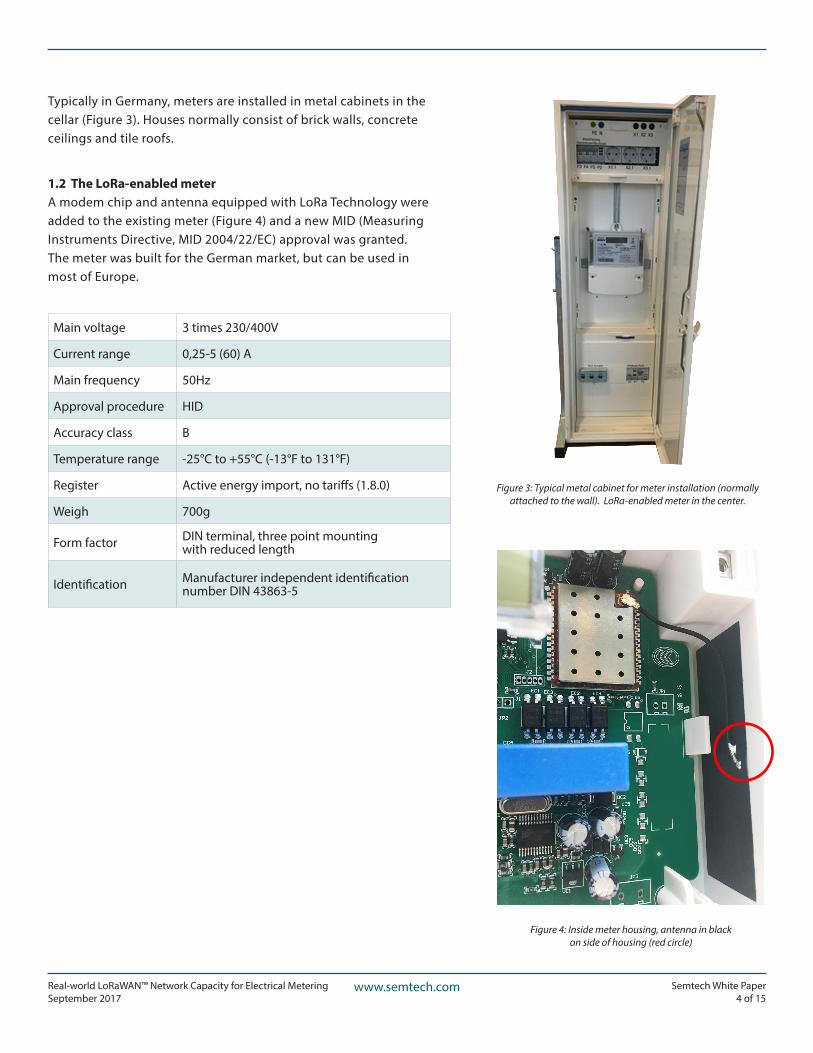
Typically in Germany, meters are installed in metal cabinets in the cellar (Figure 3). Houses normally consist of brick walls, concrete ceilings and tile roofs.
1.2 The LoRa-enabled meterA modem chip and antenna equipped with LoRa Technology were added to the existing meter (Figure 4) and a new MID (Measuring Instruments Directive, MID 2004/22/EC) approval was granted. The meter was built for the German market, but can be used in most of Europe.
Main voltage 3 times 230/400V
Current range 0,25-5 (60) A
Main frequency 50Hz
Approval procedure HID
Accuracy class B
Temperature range - 25°C to +55°C (- 13°F to 131°F)
Register Active energy import, no tariffs (1.8.0)
Weigh 700g
Form factor DIN terminal, three point mounting with reduced length
Identification Manufacturer independent identification number DIN 43863- 5
Figure 3: Typical metal cabinet for meter installation (normally attached to the wall). LoRa-enabled meter in the center.
Figure 4: Inside meter housing, antenna in blackon side of housing (red circle)
Real-world LoRaWAN™ Network Capacity for Electrical MeteringSeptember 2017
www.semtech.com Semtech White Paper5 of 15
1.3 Meter protocolThe protocol is specifically defined for simple metering applications where all that is required is the register reading on the seven-digit display. The goal was to make the protocol as easy as possible and the payload no bigger than necessary. Based on previous experience in smart meter installations, protocols usually implemented tend to be complex for no additional benefit. Hence, a smaller payload, reduced complexity and reduced error probability for the implementation were favored over the support of more complex meter setups.
As a result, the application payload for uplinks consists of only one header byte with status information and three bytes for every register (only one register in the case of the actual meter). The downlink messages have a fixed size (10 bytes) so as to configure reading intervals for confirmed and unconfirmed uplinks, as well as retries in case of unacknowledged confirmed uplinks. Therefore, the meters operate as Class C devices. Each electrical meter is configured to send a four-byte payload every 15 minutes as an unconfirmed uplink and as a confirmed uplink once per day. Taking protocol overhead and security into account, the total frame length is 17 bytes.
The real time-on-air for 17 bytes for each data rate is summarized below:
Data Rate Configuration Indicative physical bit rate (bit/s) Time On Air (ms)
0 LoRa: SF12/125kHz 250 1318,9
1 LoRa: SF11/125kHz 440 659,5
2 LoRa: SF10/125kHz 980 329,7
3 LoRa: SF9/125kHz 1760 164,9
4 LoRa: SF8/125kHz 3125 92,7
5 LoRa: SF7/125kHz 5470 51,5
2. EXPERIMENTAL RESULTSThis section describes the results of the analysis of 24 hours of raw traffic data extracted from Gehrden on February 2, 2017. Individual frames (useful payload transmissions from an end-device), 46,454, were analyzed. During the same time the considered gateways demodulated 81,235 packets from the electrical meters.
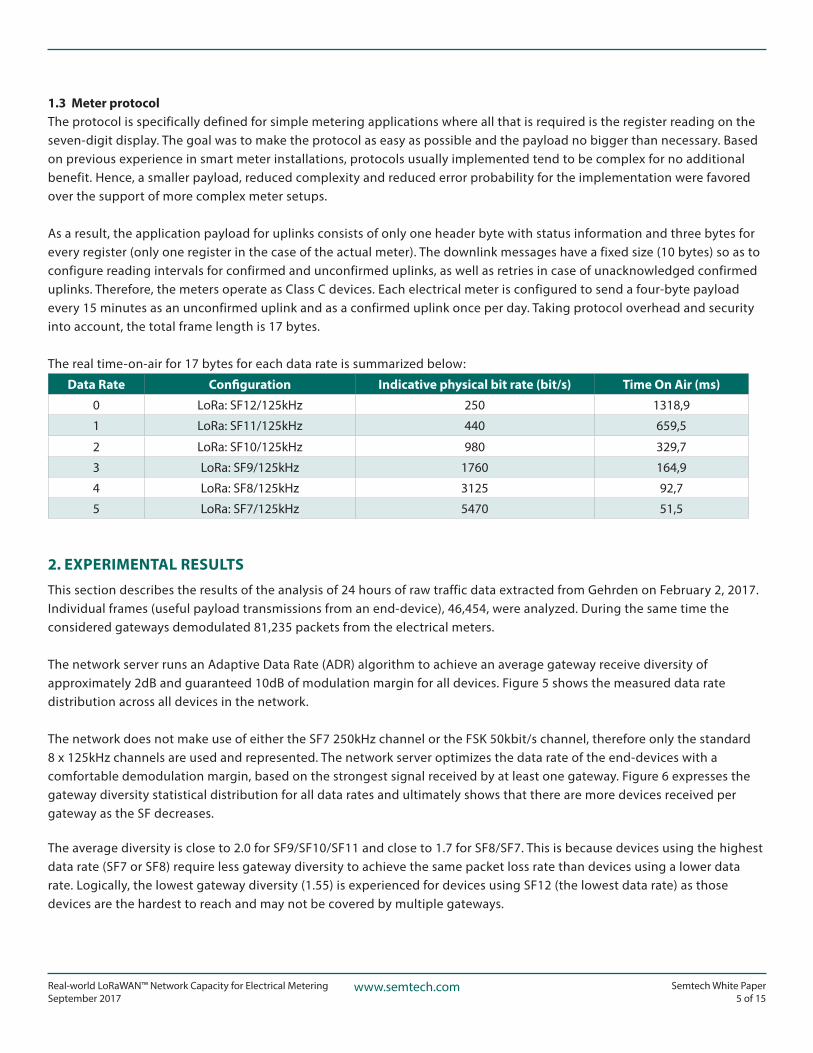
The network server runs an Adaptive Data Rate (ADR) algorithm to achieve an average gateway receive diversity of approximately 2dB and guaranteed 10dB of modulation margin for all devices. Figure 5 shows the measured data rate distribution across all devices in the network.
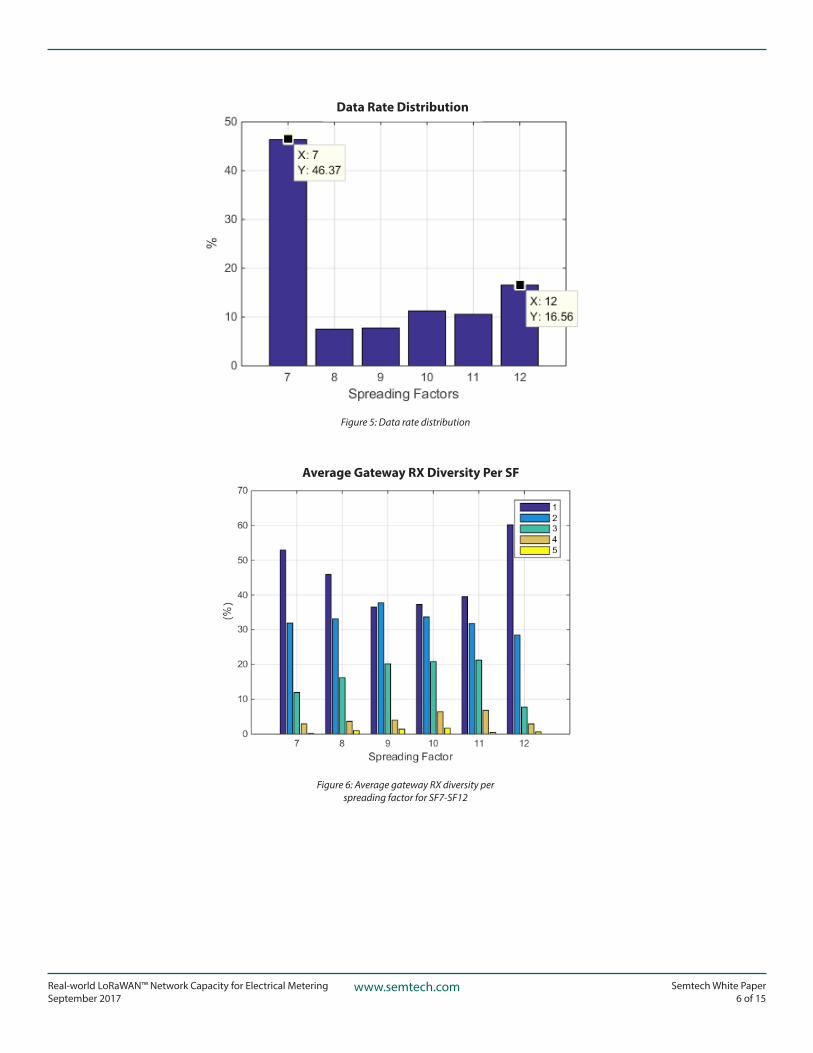
The network does not make use of either the SF7 250kHz channel or the FSK 50kbit/s channel, therefore only the standard 8 x 125kHz channels are used and represented. The network server optimizes the data rate of the end-devices with a comfortable demodulation margin, based on the strongest signal received by at least one gateway. Figure 6 expresses the gateway diversity statistical distribution for all data rates and ultimately shows that there are more devices received per gateway as the SF decreases.
The average diversity is close to 2.0 for SF9/SF10/SF11 and close to 1.7 for SF8/SF7. This is because devices using the highest data rate (SF7 or SF8) require less gateway diversity to achieve the same packet loss rate than devices using a lower data rate. Logically, the lowest gateway diversity (1.55) is experienced for devices using SF12 (the lowest data rate) as those devices are the hardest to reach and may not be covered by multiple gateways.
Real-world LoRaWAN™ Network Capacity for Electrical MeteringSeptember 2017
www.semtech.com Semtech White Paper6 of 15
Figure 5: Data rate distribution
Figure 6: Average gateway RX diversity per spreading factor for SF7-SF12
Data Rate Distribution
Average Gateway RX Diversity Per SF
Real-world LoRaWAN™ Network Capacity for Electrical MeteringSeptember 2017
www.semtech.com Semtech White Paper7 of 15
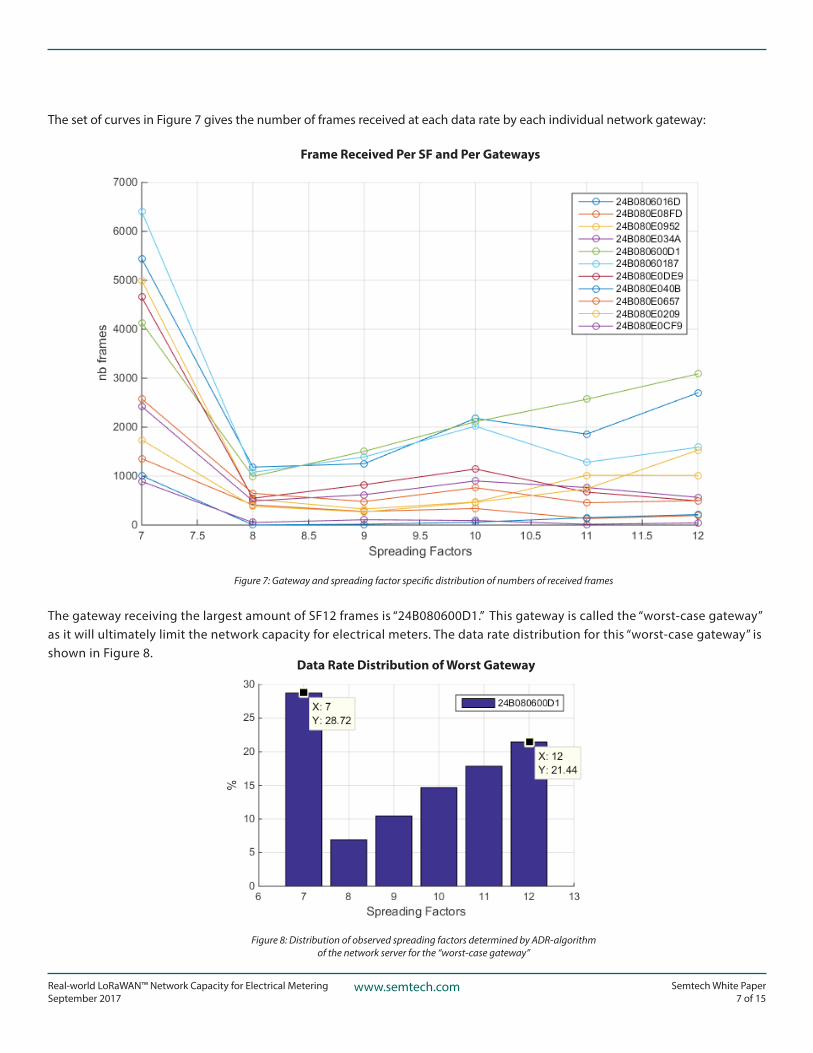
Figure 8: Distribution of observed spreading factors determined by ADR-algorithm of the network server for the “worst-case gateway”
The set of curves in Figure 7 gives the number of frames received at each data rate by each individual network gateway:
The gateway receiving the largest amount of SF12 frames is “24B080600D1.” This gateway is called the “worst-case gateway” as it will ultimately limit the network capacity for electrical meters. The data rate distribution for this “worst-case gateway” is shown in Figure 8.
Frame Received Per SF and Per Gateways
Data Rate Distribution of Worst Gateway
Figure 7: Gateway and spreading factor specific distribution of numbers of received frames
Real-world LoRaWAN™ Network Capacity for Electrical MeteringSeptember 2017
www.semtech.com Semtech White Paper8 of 15
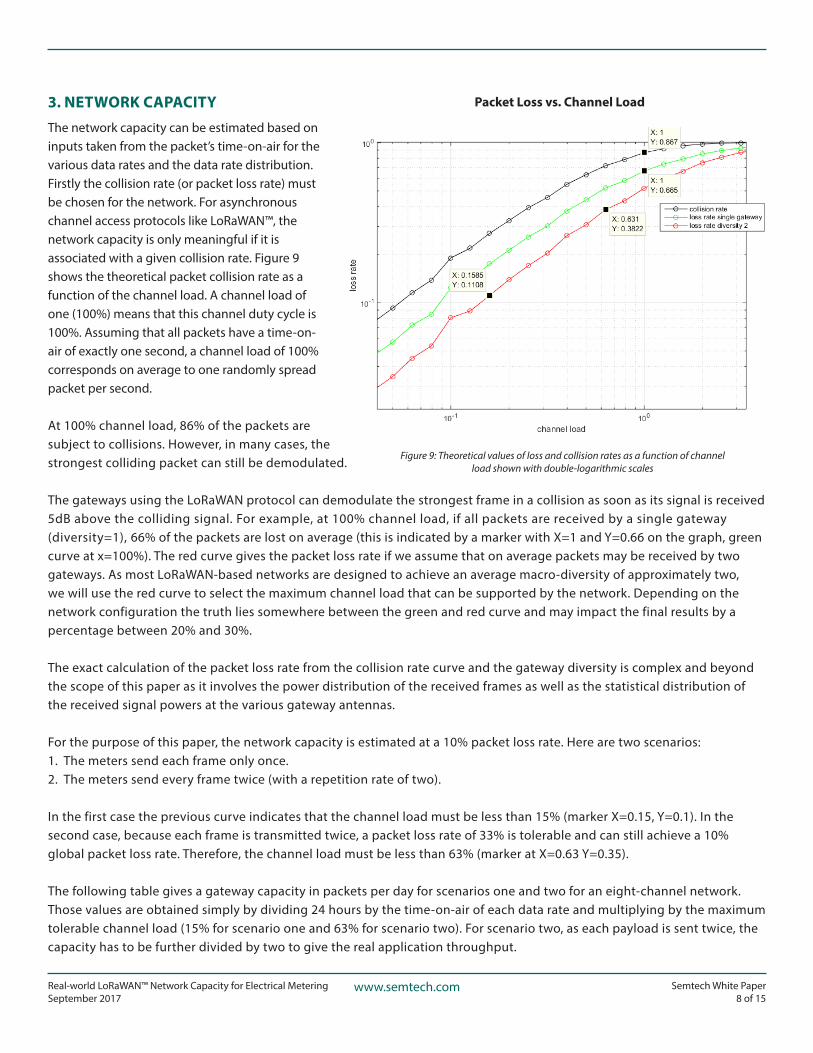
3. NETWORK CAPACITYThe network capacity can be estimated based on inputs taken from the packet’s time-on-air for the various data rates and the data rate distribution. Firstly the collision rate (or packet loss rate) must be chosen for the network. For asynchronous channel access protocols like LoRaWAN™, the network capacity is only meaningful if it is associated with a given collision rate. Figure 9 shows the theoretical packet collision rate as a function of the channel load. A channel load of one (100%) means that this channel duty cycle is 100%. Assuming that all packets have a time-on-air of exactly one second, a channel load of 100% corresponds on average to one randomly spread packet per second.
At 100% channel load, 86% of the packets are subject to collisions. However, in many cases, the strongest colliding packet can still be demodulated.
The gateways using the LoRaWAN protocol can demodulate the strongest frame in a collision as soon as its signal is received 5dB above the colliding signal. For example, at 100% channel load, if all packets are received by a single gateway (diversity=1), 66% of the packets are lost on average (this is indicated by a marker with X=1 and Y=0.66 on the graph, green curve at x=100%). The red curve gives the packet loss rate if we assume that on average packets may be received by two gateways. As most LoRaWAN-based networks are designed to achieve an average macro-diversity of approximately two, we will use the red curve to select the maximum channel load that can be supported by the network. Depending on the network configuration the truth lies somewhere between the green and red curve and may impact the final results by a percentage between 20% and 30%.
The exact calculation of the packet loss rate from the collision rate curve and the gateway diversity is complex and beyond the scope of this paper as it involves the power distribution of the received frames as well as the statistical distribution of the received signal powers at the various gateway antennas.
For the purpose of this paper, the network capacity is estimated at a 10% packet loss rate. Here are two scenarios:1. The meters send each frame only once.2. The meters send every frame twice (with a repetition rate of two).
In the first case the previous curve indicates that the channel load must be less than 15% (marker X=0.15, Y=0.1). In the second case, because each frame is transmitted twice, a packet loss rate of 33% is tolerable and can still achieve a 10% global packet loss rate. Therefore, the channel load must be less than 63% (marker at X=0.63 Y=0.35).
The following table gives a gateway capacity in packets per day for scenarios one and two for an eight-channel network. Those values are obtained simply by dividing 24 hours by the time-on-air of each data rate and multiplying by the maximum tolerable channel load (15% for scenario one and 63% for scenario two). For scenario two, as each payload is sent twice, the capacity has to be further divided by two to give the real application throughput.
Figure 9: Theoretical values of loss and collision rates as a function of channel load shown with double-logarithmic scales
Packet Loss vs. Channel Load
Real-world LoRaWAN™ Network Capacity for Electrical MeteringSeptember 2017
www.semtech.com Semtech White Paper9 of 15
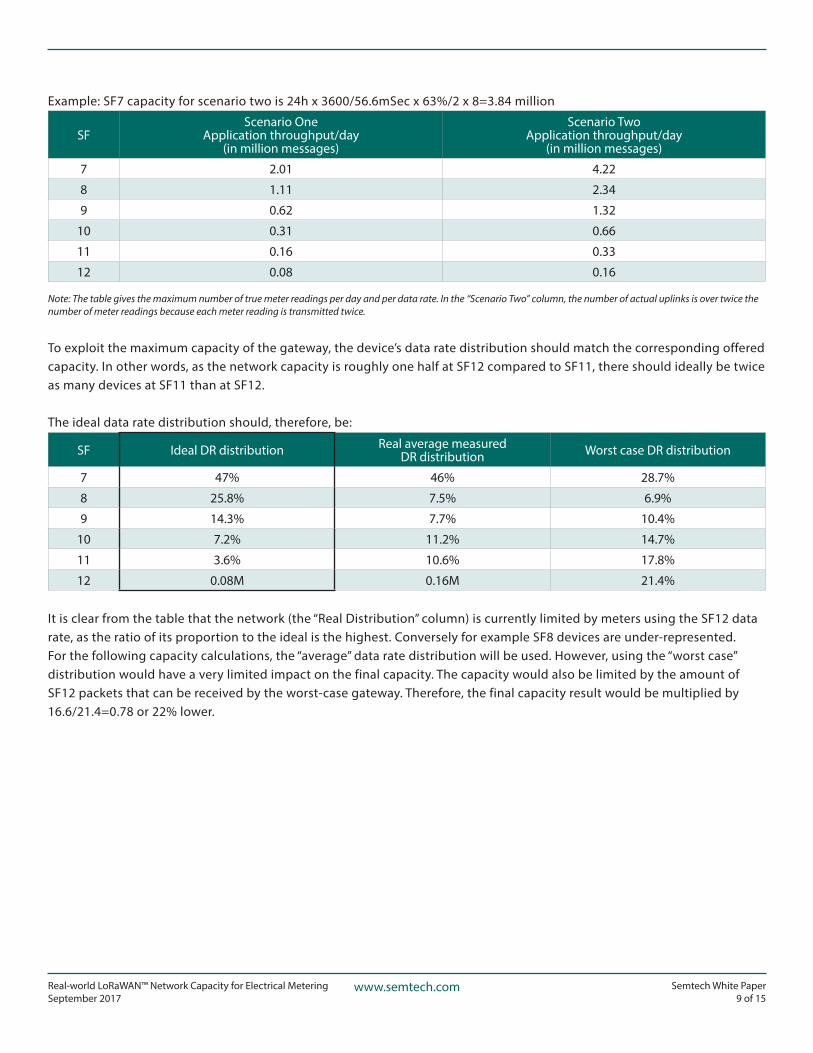
Example: SF7 capacity for scenario two is 24h x 3600/56.6mSec x 63%/2 x 8=3.84 million
SFScenario One
Application throughput/day(in million messages)
Scenario TwoApplication throughput/day
(in million messages)
7 2.01 4.22
8 1.11 2.34
9 0.62 1.32
10 0.31 0.66
11 0.16 0.33
12 0.08 0.16
Note: The table gives the maximum number of true meter readings per day and per data rate. In the “Scenario Two” column, the number of actual uplinks is over twice the number of meter readings because each meter reading is transmitted twice.
To exploit the maximum capacity of the gateway, the device’s data rate distribution should match the corresponding offered capacity. In other words, as the network capacity is roughly one half at SF12 compared to SF11, there should ideally be twice as many devices at SF11 than at SF12.
The ideal data rate distribution should, therefore, be:
SF Ideal DR distribution Real average measured DR distribution Worst case DR distribution
7 47% 46% 28.7%
8 25.8% 7.5% 6.9%
9 14.3% 7.7% 10.4%
10 7.2% 11.2% 14.7%
11 3.6% 10.6% 17.8%
12 0.08M 0.16M 21.4%
It is clear from the table that the network (the “Real Distribution” column) is currently limited by meters using the SF12 data rate, as the ratio of its proportion to the ideal is the highest. Conversely for example SF8 devices are under-represented. For the following capacity calculations, the “average” data rate distribution will be used. However, using the “worst case” distribution would have a very limited impact on the final capacity. The capacity would also be limited by the amount of SF12 packets that can be received by the worst-case gateway. Therefore, the final capacity result would be multiplied by16.6/21.4=0.78 or 22% lower.
Real-world LoRaWAN™ Network Capacity for Electrical MeteringSeptember 2017
www.semtech.com Semtech White Paper10 of 15
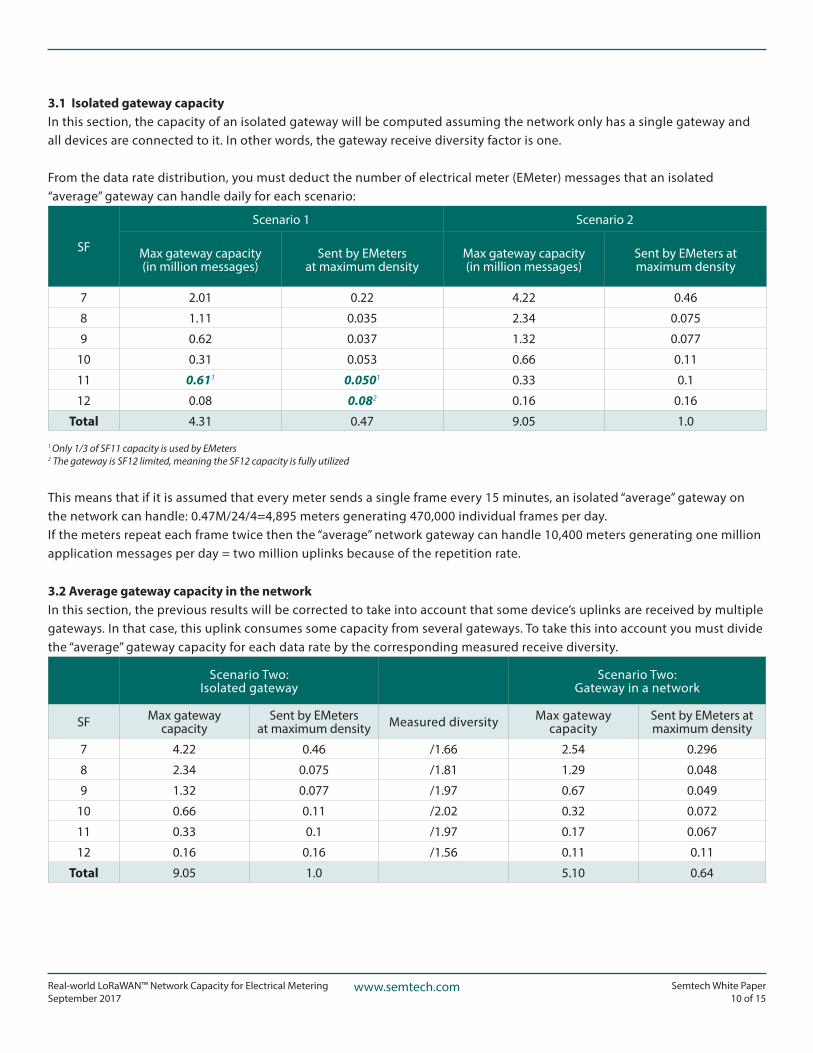
3.1 Isolated gateway capacityIn this section, the capacity of an isolated gateway will be computed assuming the network only has a single gateway and all devices are connected to it. In other words, the gateway receive diversity factor is one.
From the data rate distribution, you must deduct the number of electrical meter (EMeter) messages that an isolated “average” gateway can handle daily for each scenario:
SF
Scenario 1 Scenario 2
Max gateway capacity(in million messages)
Sent by EMeters at maximum density
Max gateway capacity(in million messages)
Sent by EMeters at maximum density
7 2.01 0.22 4.22 0.46
8 1.11 0.035 2.34 0.075
9 0.62 0.037 1.32 0.077
10 0.31 0.053 0.66 0.11
11 0.611 0.0501 0.33 0.1
12 0.08 0.082 0.16 0.16
Total 4.31 0.47 9.05 1.0
1 Only 1/3 of SF11 capacity is used by EMeters 2 The gateway is SF12 limited, meaning the SF12 capacity is fully utilized
This means that if it is assumed that every meter sends a single frame every 15 minutes, an isolated “average” gateway on the network can handle: 0.47M/24/4=4,895 meters generating 470,000 individual frames per day.If the meters repeat each frame twice then the “average” network gateway can handle 10,400 meters generating one million application messages per day = two million uplinks because of the repetition rate.
3.2 Average gateway capacity in the networkIn this section, the previous results will be corrected to take into account that some device’s uplinks are received by multiple gateways. In that case, this uplink consumes some capacity from several gateways. To take this into account you must divide the “average” gateway capacity for each data rate by the corresponding measured receive diversity.
Scenario Two: Isolated gateway
Scenario Two: Gateway in a network
SF Max gateway capacity
Sent by EMeters at maximum density Measured diversity Max gateway
capacitySent by EMeters at maximum density
7 4.22 0.46 /1.66 2.54 0.296
8 2.34 0.075 /1.81 1.29 0.048
9 1.32 0.077 /1.97 0.67 0.049
10 0.66 0.11 /2.02 0.32 0.072
11 0.33 0.1 /1.97 0.17 0.067
12 0.16 0.16 /1.56 0.11 0.11
Total 9.05 1.0 5.10 0.64
Real-world LoRaWAN™ Network Capacity for Electrical MeteringSeptember 2017
www.semtech.com Semtech White Paper11 of 15
3.3 How would the network’s EMeter capacity evolve if new gateways were added?The studied application is limited by SF12 capacity. This is very much linked to the applicative use case. EMeters are installed underground and in metal boxes, therefore a substantial portion of them must use SF12 to connect. If a new gateway is inserted that allows 50% of the devices using SF12 to move to SF11, then the network can accommodate twice the number of EMeters. This requires reducing the link attenuation experienced by the SF12 devices by only 2.5dB. When capacity is studied by simulating a large array of gateways connected to millions of devices the following rules can be derived:
• The network’s capacity, expressed in daily number of uplinks per km2, increases quadratically with the number of gateways.
• This means that if the inter-site distance is divided by two, the number of gateways is multiplied by four, and the capacity is roughly multiplied by 16.
• This means that, in average, each gateway’s individual capacity is multiplied by four. (4 times more gateway x 4 times capacity per gateway = 16 times globally)
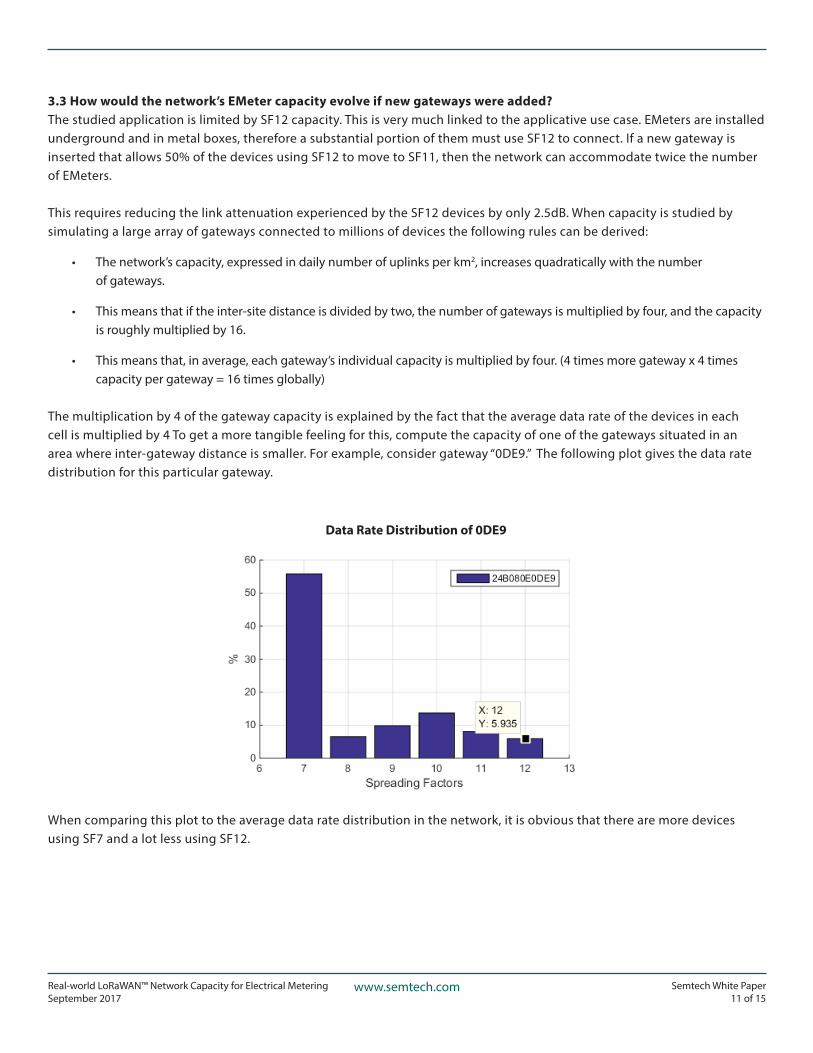
The multiplication by 4 of the gateway capacity is explained by the fact that the average data rate of the devices in each cell is multiplied by 4 To get a more tangible feeling for this, compute the capacity of one of the gateways situated in an area where inter-gateway distance is smaller. For example, consider gateway “0DE9.” The following plot gives the data rate distribution for this particular gateway.
Figure 10: Data rate distribution for one specific gateway
When comparing this plot to the average data rate distribution in the network, it is obvious that there are more devices using SF7 and a lot less using SF12.
Data Rate Distribution of 0DE9
Real-world LoRaWAN™ Network Capacity for Electrical MeteringSeptember 2017
www.semtech.com Semtech White Paper12 of 15
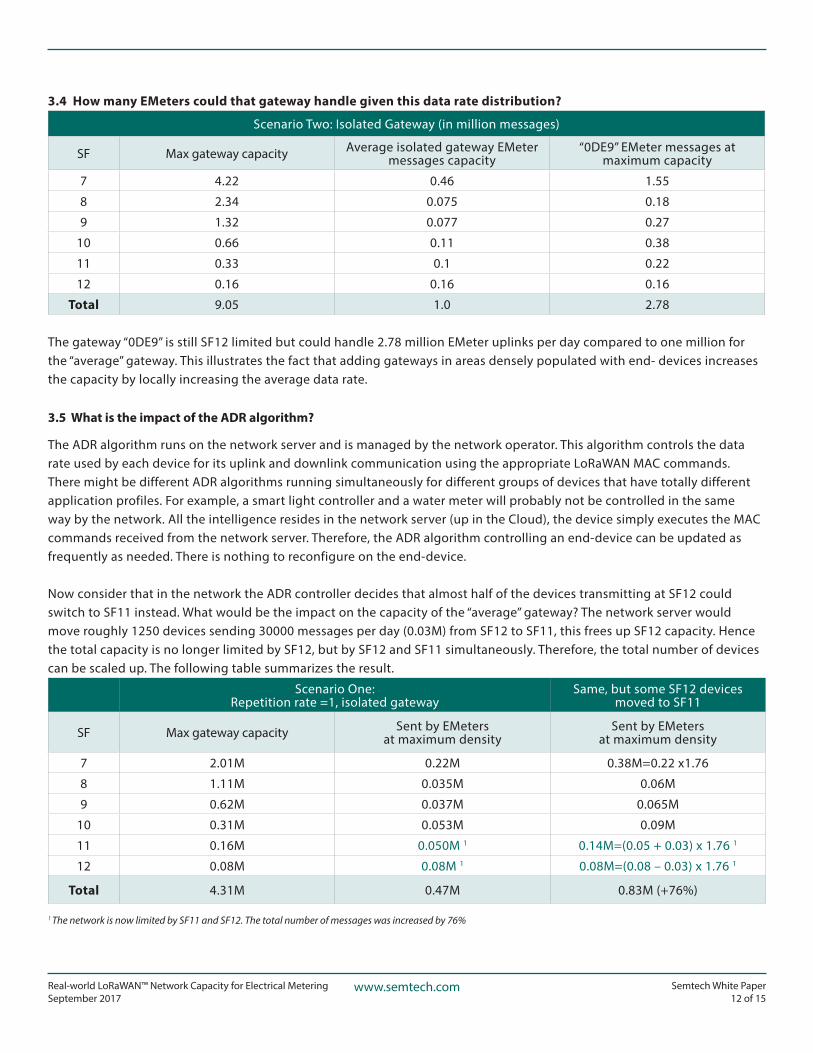
3.4 How many EMeters could that gateway handle given this data rate distribution?
Scenario Two: Isolated Gateway (in million messages)
SF Max gateway capacity Average isolated gateway EMeter messages capacity
“0DE9” EMeter messages at maximum capacity
7 4.22 0.46 1.55
8 2.34 0.075 0.18
9 1.32 0.077 0.27
10 0.66 0.11 0.38
11 0.33 0.1 0.22
12 0.16 0.16 0.16
Total 9.05 1.0 2.78
The gateway “0DE9” is still SF12 limited but could handle 2.78 million EMeter uplinks per day compared to one million for the “average” gateway. This illustrates the fact that adding gateways in areas densely populated with end- devices increases the capacity by locally increasing the average data rate.
3.5 What is the impact of the ADR algorithm?
The ADR algorithm runs on the network server and is managed by the network operator. This algorithm controls the data rate used by each device for its uplink and downlink communication using the appropriate LoRaWAN MAC commands. There might be different ADR algorithms running simultaneously for different groups of devices that have totally different application profiles. For example, a smart light controller and a water meter will probably not be controlled in the sameway by the network. All the intelligence resides in the network server (up in the Cloud), the device simply executes the MAC commands received from the network server. Therefore, the ADR algorithm controlling an end-device can be updated as frequently as needed. There is nothing to reconfigure on the end-device.
Now consider that in the network the ADR controller decides that almost half of the devices transmitting at SF12 could switch to SF11 instead. What would be the impact on the capacity of the “average” gateway? The network server would move roughly 1250 devices sending 30000 messages per day (0.03M) from SF12 to SF11, this frees up SF12 capacity. Hence the total capacity is no longer limited by SF12, but by SF12 and SF11 simultaneously. Therefore, the total number of devices can be scaled up. The following table summarizes the result.
Scenario One: Repetition rate =1, isolated gateway
Same, but some SF12 devices moved to SF11
SF Max gateway capacity Sent by EMeters at maximum density
Sent by EMeters at maximum density
7 2.01M 0.22M 0.38M=0.22 x1.76
8 1.11M 0.035M 0.06M
9 0.62M 0.037M 0.065M
10 0.31M 0.053M 0.09M
11 0.16M 0.050M 1 0.14M=(0.05 + 0.03) x 1.76 1
12 0.08M 0.08M 1 0.08M=(0.08 – 0.03) x 1.76 1
Total 4.31M 0.47M 0.83M (+76%)
1 The network is now limited by SF11 and SF12. The total number of messages was increased by 76%
Real-world LoRaWAN™ Network Capacity for Electrical MeteringSeptember 2017
www.semtech.com Semtech White Paper13 of 15
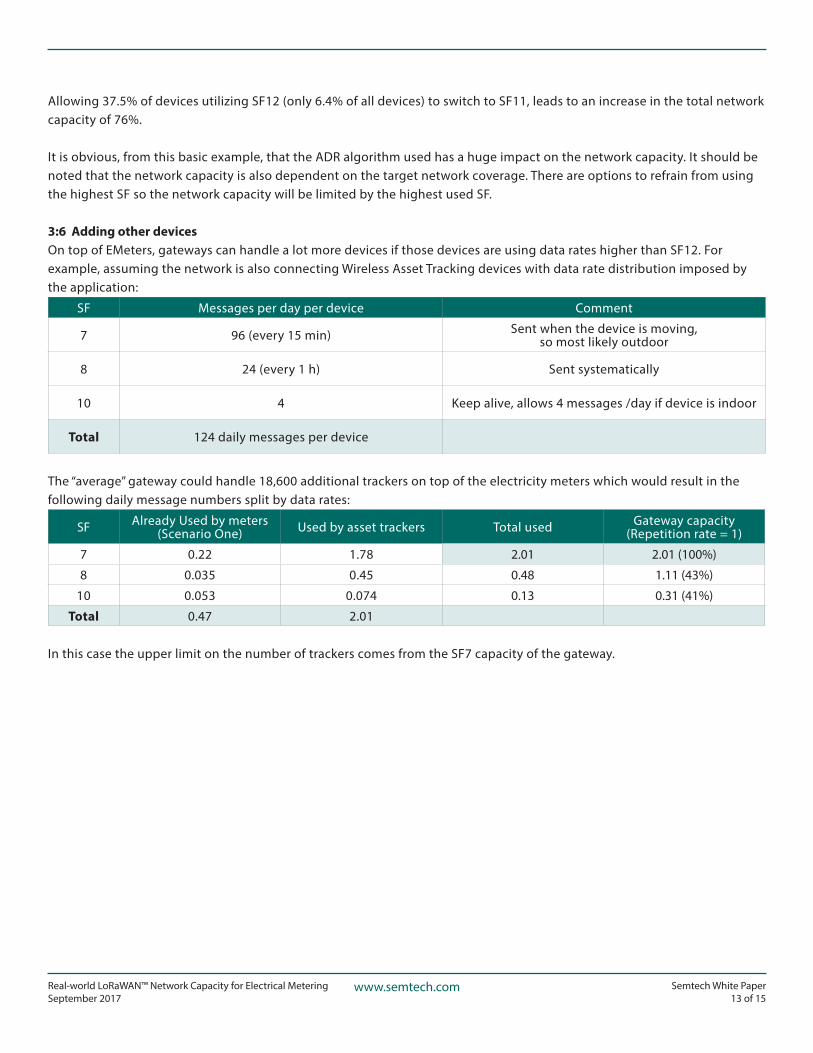
Allowing 37.5% of devices utilizing SF12 (only 6.4% of all devices) to switch to SF11, leads to an increase in the total network capacity of 76%.
It is obvious, from this basic example, that the ADR algorithm used has a huge impact on the network capacity. It should be noted that the network capacity is also dependent on the target network coverage. There are options to refrain from using the highest SF so the network capacity will be limited by the highest used SF.
3:6 Adding other devicesOn top of EMeters, gateways can handle a lot more devices if those devices are using data rates higher than SF12. For example, assuming the network is also connecting Wireless Asset Tracking devices with data rate distribution imposed by the application:
SF Messages per day per device Comment
7 96 (every 15 min) Sent when the device is moving,so most likely outdoor
8 24 (every 1 h) Sent systematically
10 4 Keep alive, allows 4 messages /day if device is indoor
Total 124 daily messages per device
The “average” gateway could handle 18,600 additional trackers on top of the electricity meters which would result in the following daily message numbers split by data rates:
SF Already Used by meters (Scenario One) Used by asset trackers Total used Gateway capacity
(Repetition rate = 1)
7 0.22 1.78 2.01 2.01 (100%)
8 0.035 0.45 0.48 1.11 (43%)
10 0.053 0.074 0.13 0.31 (41%)
Total 0.47 2.01 In this case the upper limit on the number of trackers comes from the SF7 capacity of the gateway.
Real-world LoRaWAN™ Network Capacity for Electrical MeteringSeptember 2017
www.semtech.com Semtech White Paper14 of 15
4. CONCLUSION Using an experimentally measured data rate distribution on an eight-channel network connecting hundreds of EMeters installed mostly in basements and in metal cabinets, it is concluded that an “average” gateway of the network (a gateway where throughput is the average throughput of all the gateways of the network) can handle:
• 470,000 messages per day from the EMeters without repetition.
• Up to one million messages per day if the EMeter packets are repeated twice. This provides the additional benefit of frequency diversity. In this case the gateways process two million uplinks per day (while the probability of collision for an individual packet is increased, the probability of collision of each repetition for one message decreases, thus a higher collision rate for packets can be used when planning and setting up the network).
Additionally the gateway could tolerate two million uplinks from asset tracking type devices. This is possible because the two-device population (EMeters and asset trackers) does not use the same data rate distribution. The maximum number of EMeters connected is limited by the SF12 capacity of the gateway, whereas the maximum number of trackers is limited by the SF7 capacity.
The capacity of a network and its capability of being locally scaled up by simply inserting a gateway are also demonstrated. Finally, the ADR algorithm controlling the devices’ data rates can further increase the capacity by optimizing the data rate, repetition rate of each frame and set of channels used by the device.
For more information about Semtech’s LoRa® Wireless RF Products and Technology for smart city applications, go towww.semtech.com/IoT or scan the quick response code below.
www.semtech.com/iot
Real-world LoRaWAN™ Network Capacity for Electrical MeteringSeptember 2017
www.semtech.com Semtech White Paper15 of 15
ABOUT SEMTECH Semtech Corporation is a leading supplier of high performance analog and mixed-signal semiconductors and advanced algorithms for high-end consumer, enterprise computing, communications, and industrial equipment. Products are designed to benefit the engineering community as well as the global community. The Company is dedicated to reducing the impact it, and its products, have on the environment. Internal green programs seek to reduce waste through material and manufacturing control, use of green technology and designing for resource reduction. Publicly traded since 1967, Semtech is listed on the Nasdaq Global Select Market under the symbol SMTC. For more information, visit www.semtech.com.
Semtech Corporation200 Flynn Road, Camarillo, CA 93012
Phone: (805) 498-2111, Fax: (805) 498-3804
The Semtech®, LoRa®, LoRaWAN™ and LoRa Alliance™ logos and marks are trademarks of Semtech Corporation or its subsidiaries.