realization of safe driving environment - fujitsu · realization of safe driving environment ......
TRANSCRIPT
36 FUJITSU Sci. Tech. J., Vol. 51, No. 4, pp. 36–42 (October 2015)
Realization of Safe Driving Environment
Norio Hashiguchi Masatoshi Tohno
In the field of transportation and traffic, big data are beginning to be used for improving trans-port efficiency and assisting in safe driving. Fujitsu has commercialized FUJITSU Intelligent Society Solution SPATIOWL, a cloud service that uses location data, to build a system that ac-cumulates in the cloud various types of information associated with location data of mobile objects including vehicles. We have also developed sensing technologies for use in vehicles or on road infrastructure that promote road traffic safety. Data acquired by sensing technolo-gies related to road traffic systems have so far only been used in limited applications such as individual vehicle systems and safety systems for specific road sections. But systems are now in place that make it easier to connect with data in the cloud, and this facilitates data aggrega-tion and accumulation. Adequate analysis of the massive amounts of accumulated data makes it possible to identify information about points requiring attention in driving, and to do this requires analysis technology that can accurately identify significant pieces of information that suit the purpose of analysis, out of massive amounts of data. This paper presents a technique of efficiently analyzing massive amounts of data from drive recorders and detecting truly nec-essary information. Then we introduce a system that utilizes SPATIOWL to implement that technique as a functional component for assisting in safe driving.
1. IntroductionThe advancement of transport systems has
brought great benefits to humanity, but it has also given rise to many problems, including traffic accidents, traffic congestion and environmental pollution, which are sometimes referred to as negative legacies of trans-port systems. Of these problems, this paper focuses on the mitigation of traffic accidents, and describes our ef-forts in developing an environment that enhances the safety in driving.
In Japan, the number of fatal traffic accidents con-tinued to decrease for 13 consecutive years up to 2013, and it has been kept under 5000 casualties in recent years.1) However, the year-on-year rate of decline in traffic accident fatalities has been minimal. Possibly an efficient way to address this is to tackle some of the most frequent fatal accidents to further reduce traffic accidents. Most fatal accidents occur when the driver is not concentrating, is distracted or makes an improper driving maneuver. These accidents caused by human errors have not decreased so much.1),2) In the case of
the drivers not concentrated or being distracted, it is highly likely that accidents may be avoided by warn-ing them of the dangerous situations. Similarly, the improper driving maneuver is attributed to the drivers’ losing calm and panicking,3) which may also be allevi-ated if they are informed of the potential danger well in advance, thus leading to a reduction of accidents. Providing drivers with the “right information” in ad-vance will help reduce the number of traffic accidents.
In 2011, Fujitsu commercialized FUJITSU Intelligent Society Solution SPATIOWL,4) a cloud service that uses location data to build a system. This system aggregates, accumulates and analyzes various types of information taken from many mobile objects. It then gives drivers the right information at the right time, aiming to reduce traffic accidents and promote safe driving.
We assume the following two types of right in-formation. One is geographical point information. This includes information about certain points where the incidence of traffic accidents is high when certain
37FUJITSU Sci. Tech. J., Vol. 51, No. 4 (October 2015)
N. Hashiguchi et al.: Realization of Safe Driving Environment
external factors are present, or where many drivers rec-ognized the danger or narrowly avoided an accident by making an emergency maneuver (hereafter referred to as “cautious driving points”), together with information on risk factors involved in these points. The cautious driving points are generated as information accumu-lated on SPATIOWL and organized into a database. The second type of information for drivers is informa-tion about each driver’s operational conditions. The data regarding the driver’s maneuvers are aggregated and accumulated on SPATIOWL, and used to analyze their driving patterns. When a certain abnormality is detected in the driver’s maneuver, the system sends an alarm notifying the driver of the unusual driving pattern.
In preparing for the development of the database for cautious driving points, we succeeded in creating a technology to analyze the driving data stored on the drive record and extract the necessary information effi ciently.
2. Outline of SPATIOWLThe target users of the system behave on the basis
of gathering and analyzing a diverse range of informa-tion in order to achieve certain goals. A good service for a transport system would give appropriate information
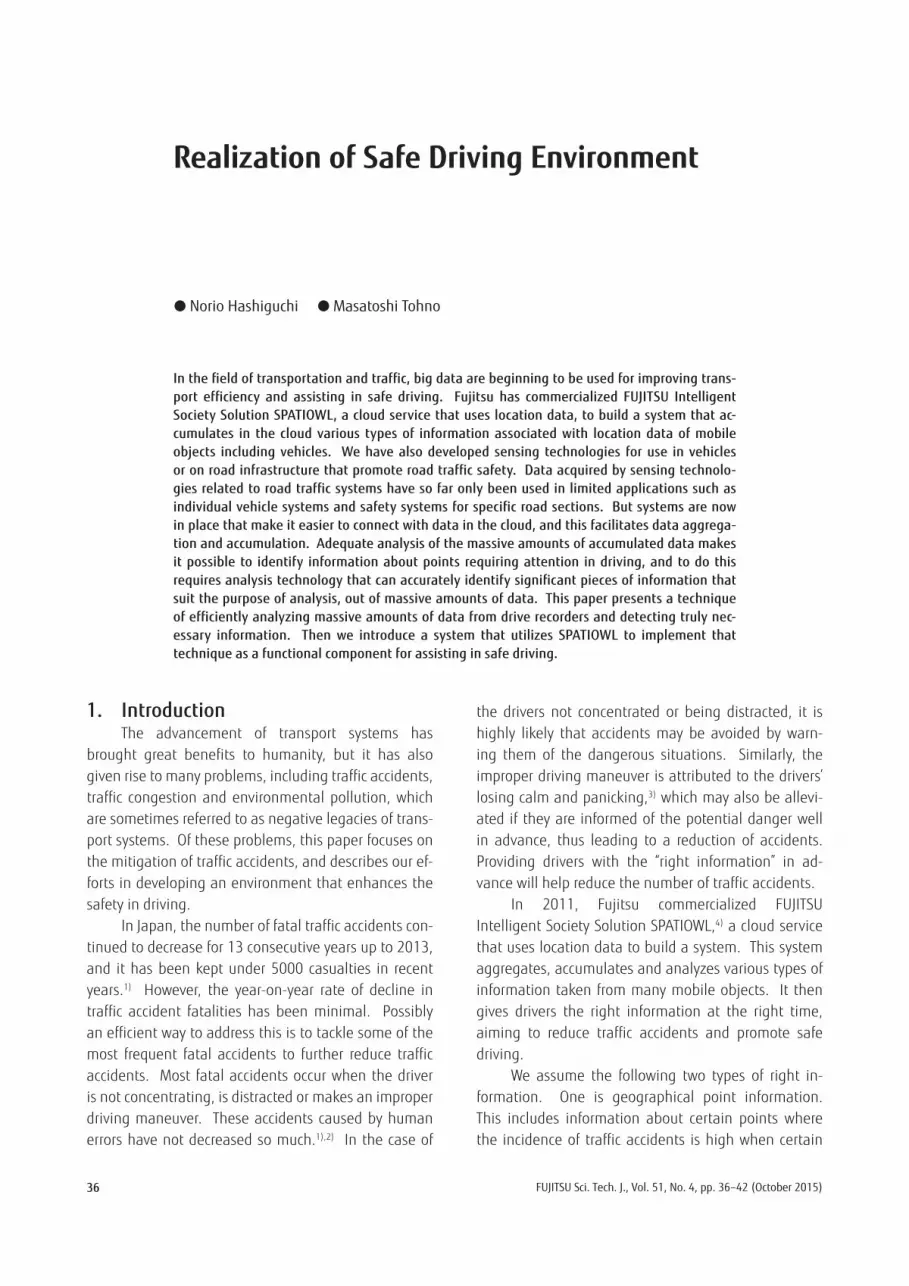
to people depending on the purposes, time, locations and local conditions of their movements, and guide them accordingly. The SPATIOWL service is available on the cloud, and is applicable to many fi elds that use location data. The concept of SPATIOWL’s data use is shown in Figure 1. Being analogous to human action cycles, the system is equipped with the functions nec-essary for each area of data collection, data analysis, and provision of information/service, and it expands as more data are accumulated.
This section presents the method of generating the right information for drivers, and efforts to make the system commercially viable, with a focus on tech-nological aspects. 1) Collection of driving data
We collect data from drive recorders as the source data of driving conditions. A drive recorder is a device capable of recording images and vehicle data, and these can be useful in case of a car accident. Virtues of the drive recorder are recognized as expediting the post-accident procedures, serving evidence to avoid dis-proportionate fault percentages being allocated, and raising drivers’ awareness of safe driving, with more and more cars installing the device. Drive recorders would make signifi cant contributions to collecting the data on roads and vehicle movements because they
Figure 1Concept of SPATIOWL data use.
Real world
Aggregation andaccumulation
Analyticaltechnology
Vehicle data OD analysis
Area analysis
Machine learning
Navigation
Relevantinformation
■ Traffic information■ Road environment information■ Individual vehicle analysis■ Vehicle group analysis
OD: Origin destination
Driving data analysis
Data collection Analysis Provision ofinformation/services
38 FUJITSU Sci. Tech. J., Vol. 51, No. 4 (October 2015)
N. Hashiguchi et al.: Realization of Safe Driving Environment
retain accurate data that can be used to reconstruct the situations in which the driver was found, including the locations, time, speed and acceleration as well as image data. Leveraging these data would make ex-cellent media for resolving issues regarding transport systems. Moreover, the data could also be more useful if they were accumulated on the cloud extensively and in a large volume. 2) Drive recorder data analysis
Several performance tests have already been conducted to verify the driving data use for the pur-pose of preventing car accidents.5) One such test was on near-miss spot mapping. There have been reports of activities based on the outcomes of these tests, raising awareness among drivers and prompting road maintenance/repairs by the national or municipal agencies. Meanwhile, these data from drive recorders are also leveraged in providing training on safe driving. However, the bottleneck is the human cost because the large amounts of data are handled manually for analy-sis. For this reason, an urgent task is to automate the analytical processes. Against this backdrop, Fujitsu has obtained drive recorder data through its unique route and analyzed them for possibilities of developing a new business to provide information on cautious driv-ing points.
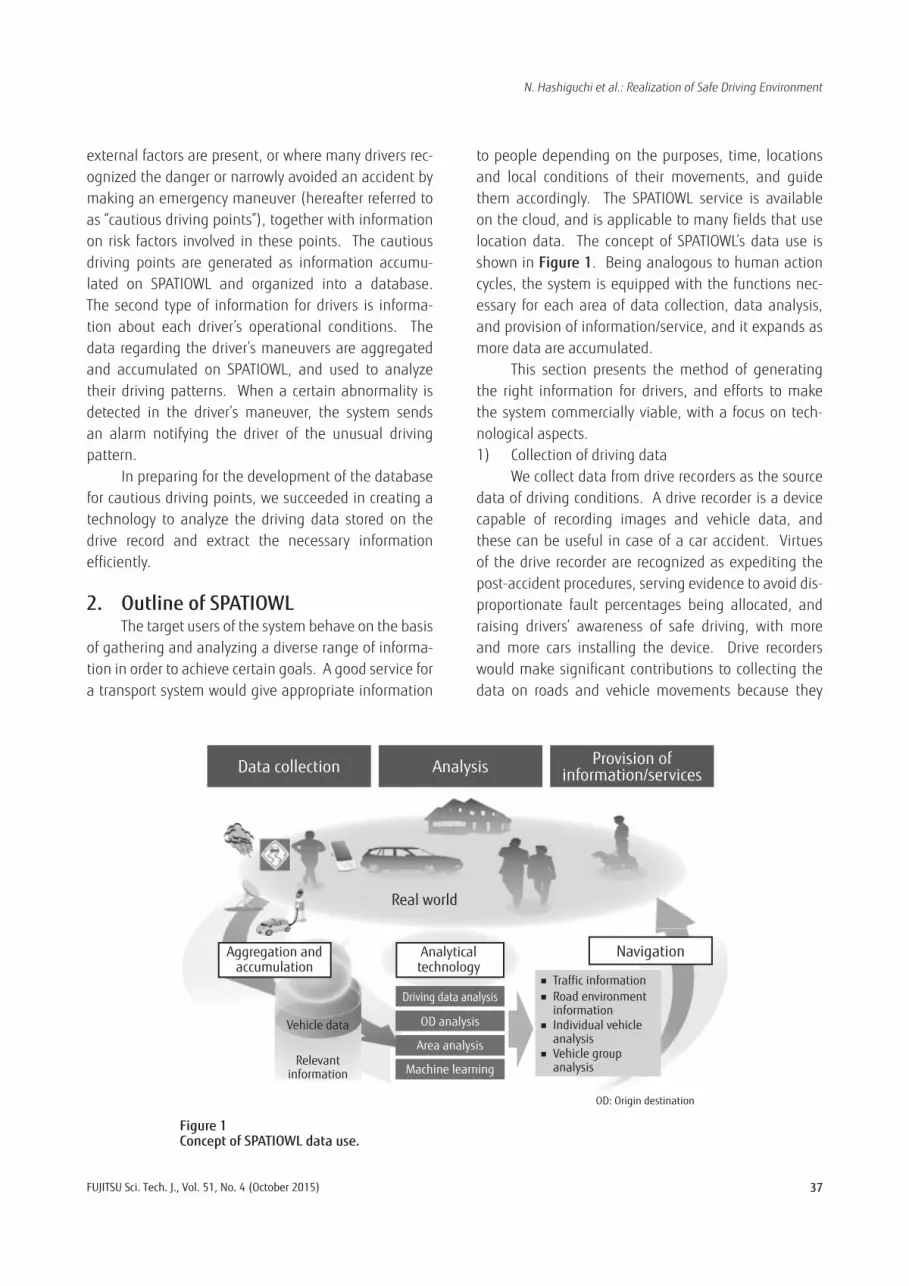
We conducted an experiment in which 837 re-cords from drive recorders were submitted to a visual analysis, and we confirmed that places where there was a high incidence of sudden acceleration or de-celeration did not coincide with points of near-miss incidents (cautious driving points). Figure 2 shows the results. It shows the relationship between the speed (on the horizontal axis) and acceleration (vertical axis) after drive recorder data were visually processed into categories. We divided the data into three categories: no problem (shown as ◇), dangerous (□) and high potential of danger (△).
There is no apparent correlation between speed and acceleration (◇, □ and △) from the visual assessment of dangerousness. When defining the ac-celeration of 0.6 G and above as uniformly a dangerous situation, the accuracy of visual assessment (to discern a dangerous situation from non-dangerous ones cor-rectly) was 47%, while the rate of oversight, the cases in which a visual verdict of dangerous situations was not being registered as such, accounted for 60%. In order to mechanically analyze the collected data, and statistically aggregate them to identify cautious driving points, the accuracy rate must be more than 50% while the rate of oversight has to be kept less than 50%.
We have thus developed a multiple-analysis
Figure 2Results of visual analysis of drive recorder data.
0
0.2
0.4
0.6
0.8
1.0
1.2
1.4
0 10 20 30 40 50 60 70 80 90
No problem
DangerousHigh potential of danger
Visual assessment : 147 pointsStatistical assessment : 131 pointsCommon points : 62 points
Acceleration > 0.6
Acce
lera
tion
(G)
Speed (km/h)
Total # of pieces of data: 837
Accuracy rate : less than 50%False positives rate : more than 50%Rate of oversight : more than 60%
39FUJITSU Sci. Tech. J., Vol. 51, No. 4 (October 2015)
N. Hashiguchi et al.: Realization of Safe Driving Environment
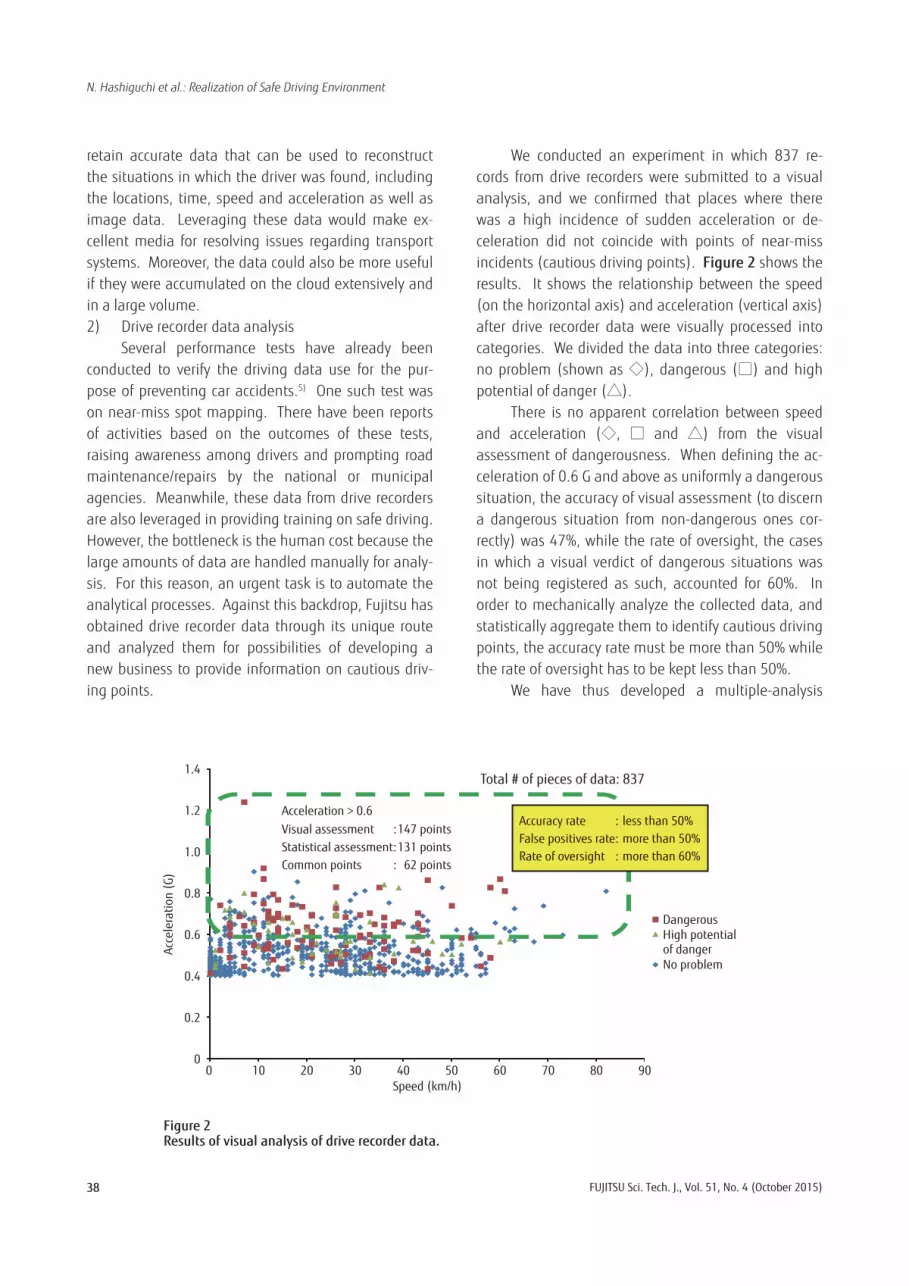
function, combining numerical analysis and image- recognition/analysis, aiming to achieve those thresh-olds. We also succeeded in automating the process. In terms of the numerical analysis, we focused on the changes in acceleration and analyzed the principle components of the acceleration waveforms. The re-sults were classified using the Support Vector Machine (SVM), one of the pattern recognition techniques that employ a supervised learning method.6) As for the image-recognition/analysis, we employed the Generic Object Recognition to identify objects for potential collisions such as vehicles and people, and calculated the level of danger by measuring the distance to the detected objects. As a result, we attained an accuracy rate of 73% and a rate of oversight of 27%, as shown in Figure 3.
The function we have developed for this experi-ment comes with two advantages. One is the selection of data groups to be investigated out of the total data set (reducing the volume of data submitted to the analysis). The other is the identification of assessment points in the selected data groups (simplifying the as-sessment processes). The time required for visually assessing one set of data is said to be three minutes7) for a skilled assessor. Based on this figure, it would
require about 40 hours to visually process all the data provided for the experiment. We estimated that the new function would reduce it to approximately four hours.
An additional benefit of the image-recognition/analysis function is that it shows what drivers should be cautious about, as opposed to merely pointing out the locations where caution is needed while driving. 3) Evaluation
Our experiment has shown that the function will contribute to transport systems, particularly in reducing the incidence of traffic accidents, providing information to meet drivers’ requirements, and navigat-ing the traffic. Regarding the automation processes and techniques employed, we used the supervised learning method for a waveform analysis. In addition, combining the image-recognition/analysis and the numerical analysis has proved to have a synergistic ef-fect. As the image recognition has a reference point in human perception and learning, this function has been improved in accuracy by correlating numerical values/components with drivers’ near-miss experiences. The waveform analysis, however, tends to overburden itself in learning processes, which is an issue that must be addressed in the future.
Figure 3Results of automated multiple-analysis of drive recorder numerical/image data.
Concept
(5)
(6) (7)
(8)
Total 776
(2) (4) (3)
Identification rate (%)Σ(1)(2)(3)(8) / Total
Accurate identification (%)(8) / Σ(5)(6)(7)(8)
75.9
73.0
Correct
54
233
147
5
24
11
108
Simple braking
Object
Misjudgment
Unexpected
Missed
Lack of braking
(1) Irrelevant 194
(2)
(3)
(4)
(5)
Number
(6)
(7)
(8)
Visual assessment (near-misses)
Waveform pattern (sudden braking) Image recognition (object identification)
Filtering rate (%) 32.9
(1): Ungrouped
40 FUJITSU Sci. Tech. J., Vol. 51, No. 4 (October 2015)
N. Hashiguchi et al.: Realization of Safe Driving Environment
Regarding the analytic techniques, we employed a multiple-analysis function to process two types of data that were very different in nature: structured, numerical data and non-structured image data. We used the SVM to analyze the former, and this is also gaining more recognition in the area of image pattern recognition techniques in tandem with the application of artificial intelligence (AI) technology.8) We hope to explore ways to leverage SVM more in the future. We also found that it was possible to improve the effectiveness of the function by mutually applying the judgement criteria through visual association between values and images, even in tasks that involve a degree of ambivalence in judgement, such as the near-miss incident recognition employed in this experiment.
3. Perception of driver’s operational conditionsIn the previous section, we described a method to
efficiently develop a database regarding the cautious driving points, which constitute the “right information” for drivers, as one of the approaches to reduce traffic accidents. In this section, we will describe another approach, a system which is more preventive in that it monitors the driver’s operational conditions and alerts the driver at the “right time” to guide them out of poten-tially dangerous situations. To achieve this, the system must correctly understand the driver’s operational conditions. We assumed that the operational condi-tions could be inferred from the vehicle maneuvers and resulting vehicle movements. Thus, we developed a system that involves various sensors to collect in-driving data. To ensure ease of use, we incorporated smartphones for data collection. As smartphones are equipped with many sensors, the data they produce from within an automobile will reveal the vehicle movements. Such embedded sensors include GPS for locational and temporal data, 3-axis accelerometer sensors, 3-axis gyroscopes and geomagnetic sensors. We also prepared software libraries for collecting data from these sensors and sending them to SPATIOWL, which will facilitate an easy cloud-based storage of the data regarding the vehicle conditions.
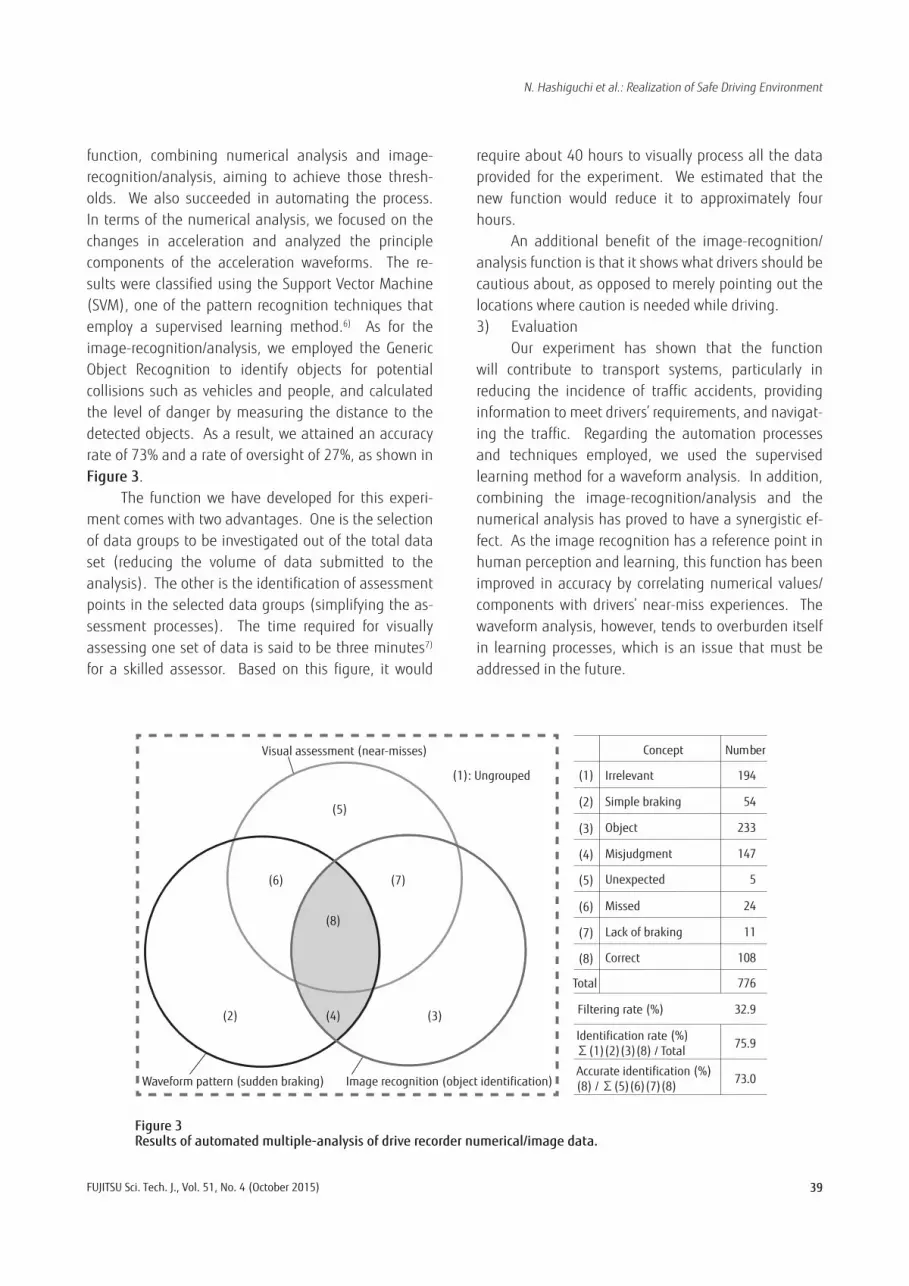
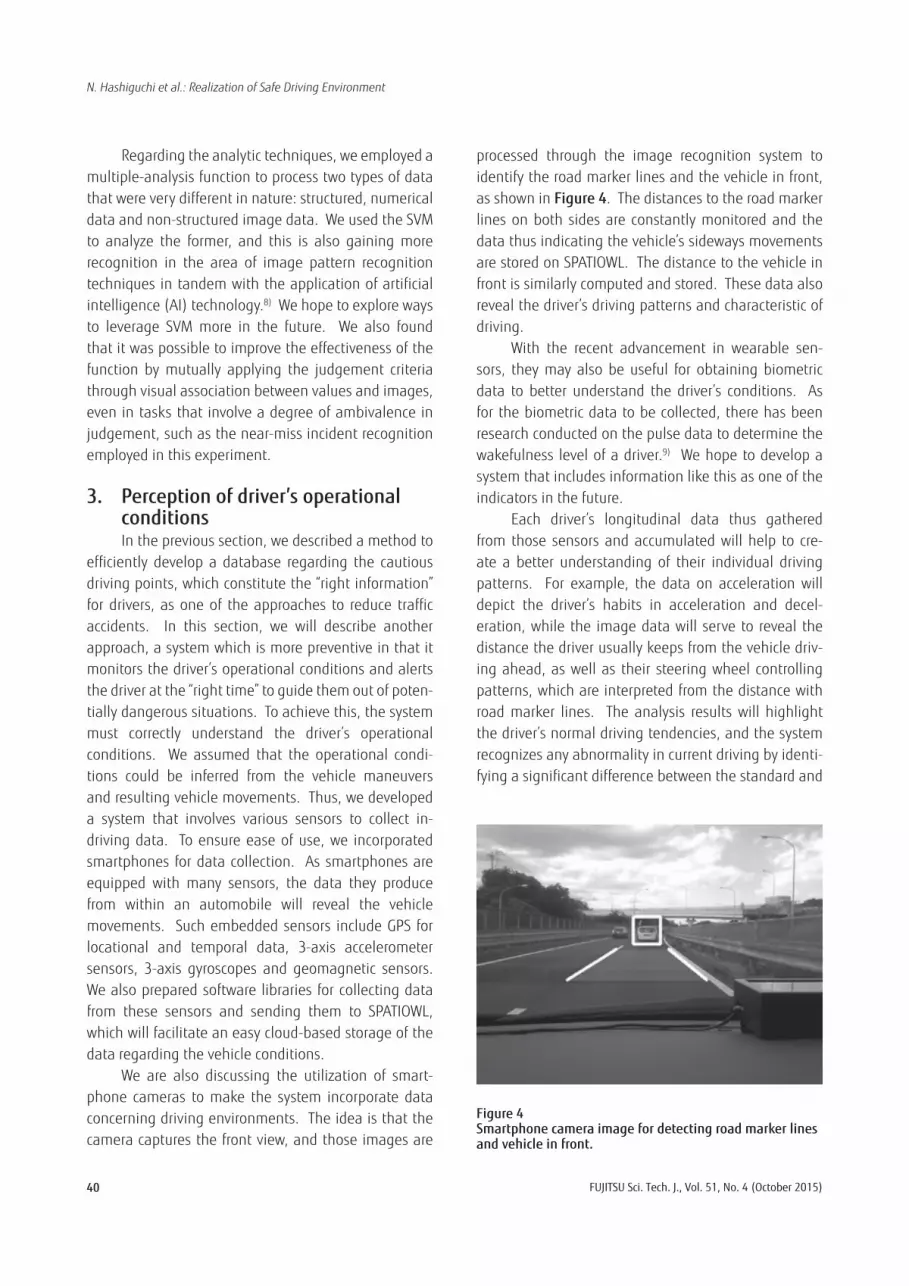
We are also discussing the utilization of smart-phone cameras to make the system incorporate data concerning driving environments. The idea is that the camera captures the front view, and those images are
processed through the image recognition system to identify the road marker lines and the vehicle in front, as shown in Figure 4. The distances to the road marker lines on both sides are constantly monitored and the data thus indicating the vehicle’s sideways movements are stored on SPATIOWL. The distance to the vehicle in front is similarly computed and stored. These data also reveal the driver’s driving patterns and characteristic of driving.
With the recent advancement in wearable sen-sors, they may also be useful for obtaining biometric data to better understand the driver’s conditions. As for the biometric data to be collected, there has been research conducted on the pulse data to determine the wakefulness level of a driver.9) We hope to develop a system that includes information like this as one of the indicators in the future.
Each driver’s longitudinal data thus gathered from those sensors and accumulated will help to cre-ate a better understanding of their individual driving patterns. For example, the data on acceleration will depict the driver’s habits in acceleration and decel-eration, while the image data will serve to reveal the distance the driver usually keeps from the vehicle driv-ing ahead, as well as their steering wheel controlling patterns, which are interpreted from the distance with road marker lines. The analysis results will highlight the driver’s normal driving tendencies, and the system recognizes any abnormality in current driving by identi-fying a significant difference between the standard and
Figure 4Smartphone camera image for detecting road marker lines and vehicle in front.
41FUJITSU Sci. Tech. J., Vol. 51, No. 4 (October 2015)
N. Hashiguchi et al.: Realization of Safe Driving Environment
current data, whereby the system issues an alert to the driver.
To summarize, we have developed an environ-ment where SPATIOWL is deployed to accumulate data regarding two different factors: cautious driving points and drivers’ operational conditions. As for the former, drivers’ acquired rules were applied to determine the safety of driving conditions based mainly on visual data, taking into consideration certain external environmen-tal factors. The data from the drivers’ judgements on cautious driving points are categorized by external environmental conditions and accumulated. Similarly, the data on drivers’ operational conditions such as not concentrating or being distracted also go into catego-ries according to the types, conditions and other factors of the information/service users. The system thus pro-vides drivers with the right information regarding the external environmental conditions and drivers’ opera-tional conditions, at the right time, thereby helping to promote safe driving and reduce road accidents.
4. ConclusionTo develop a safe driving environment, we need
to reduce the number of road accidents. We consider it important to have comprehensibility and acceptability as the requirements, and for this the requirement is to give drivers the right information at the right time. Fujitsu strives to make this a reality through a system based on SPATIOWL. The big data serve as the basis of various types of information regarding driving patterns, driving conditions, and transport systems. The main-stream in analytical techniques is now said to be “the amalgamation of machine learning and large-scale parallel computing.”10),11) Thus, we employ this very technique, and aspire to finding further ways to use it in a broader scope of applications. We will continue our efforts to enhance comprehensibility and accept-ability for drivers, making our contribution to safe and secure driving.
References1) Traffic Bureau, National Police Agency: Statistics on
fatal traffic accident victims in 2013 (in Japanese). http://www.e-stat.go.jp/SG1/estat/
List.do?lid=0000011166102) Traffic Bureau, National Police Agency: Characteristics of
fatal traffic accidents and the state of Road Traffic Law violation control in the first half of 2013 (in Japanese).
http://www.e-stat.go.jp/SG1/estat/ List.do?lid=000001112442
3) Institute for Traffic Accident Research and Data Analysis: Traffic accident due to misconduct-circumstances and causal analysis (in Japanese).
https://www.itarda.or.jp/materials/report_summary.php?q=788&p=h2203/h22–03.html
4) Fujitsu: Enabler of Smart Mobility-SPATIOWL. http://www.fujitsu.com/global/solutions/
business-technology/intelligent-society/smart-mobility/5) Ministry of Land, Infrastructure, Transport and Tourism
report: Final report on third party involvement in transport safety project (Transport safety pilot project). (March 2011) pp. 9–11, 2011 (in Japanese).
6) C. M. Bishop: Pattern recognition and machine learning Volume 1 (in Japanese).
7) Research committee on effective traffic safety educa-tion utilizing drive recorders: Traffic education utilizing image recording drive recorders manual. pp. 10–12, 2009 (in Japanese).
8) C. N. E. Anagnostopulos et al.: A License Plate-Recognition Algorithm for Intelligent Transportation Systems Applications. IEEE Trans. Intelligent Transportation Systems, Vol. 7, No. 3, pp. 377–392 (2006).
9) Y. Nakano et al.: Detection of Driver Drowsiness Level. FUJITSU, Vol. 59, No. 4, pp. 416–420 (2008) (in Japanese).
http://img.jp.fujitsu.com/downloads/jp/jmag/vol59-4/paper12.pdf
10) A. Ghoting et al.: SystemML: Declarative Machine Learning on MapReduce. Proc. 2011 IEEE 27th Int. Conf. on Data Engineering (ICDE 2011), pp. 231–242 (2011).
11) A. Ghoting et al.: NIBMLE: A Toolkit for the Implementation of Parallel Data Mining and Machine Learning Algorithms on MapReduce. Proc. 17th ACM SIGDKK Int. Conf. on Knowledge Discovery and Data Mining (KDDI 2011), pp. 334–342 (2011).

42 FUJITSU Sci. Tech. J., Vol. 51, No. 4 (October 2015)
N. Hashiguchi et al.: Realization of Safe Driving Environment
Norio Hashiguchi Fujitsu Ltd.Mr. Hashiguchi is currently engaged in de-velopment of the cloud system that uses location data.
Masatoshi TohnoFujitsu Ltd.Mr. Tohno is currently engaged in develop-ment of image-based in-vehicle sensing technology.