realizing energy efficiency opportunities industrial fan ...€¦ · realizing energy efficiency...
TRANSCRIPT

Realizing Energy Efficiency Opportunities in Industrial Fan and Pump Systems
R. Neal Elliot and Steven Nadel
April 2003
Report Number A034
©American Council for an Energy-Efficient Economy 1001 Connecticut Avenue, NW, Suite 801, Washington, D.C. 20036 Phone: 202-429-8873, Fax: 202-429-2248, website: http://aceee.org


Industrial Fan and Pump System, ACEEE
i
CONTENTS
Summary ................................................................................................................................... ii
Market Analysis ........................................................................................................................ 1
Technology Description...........................................................Error! Bookmark not defined.
Market Players .......................................................................................................................... 3
Market Barriers ......................................................................................................................... 4
Energy Savings Potential and Economics................................................................................. 5
Energy Savings ..................................................................................................................... 5 Incremental Costs.................................................................................................................. 5 Measure Life ......................................................................................................................... 6
Pump and Fan Programs ........................................................................................................... 7
Past Program Experiences..................................................................................................... 7 Recent and Current Efforts Focusing on Particular Industries ............................................. 8 Broad Programs .................................................................................................................. 11
Program Strategies .................................................................................................................. 12
Conclusion and Recommendations......................................................................................... 14
References............................................................................................................................... 15

Industrial Fan and Pump System, ACEEE
ii
SUMMARY Fans and pumps account for more than a quarter of industrial electricity consumption nationally. Six industries represent 84% of the potential industrial fan and pump energy savings: chemical manufacturing; paper manufacturing; petroleum and coal products manufacturing; mining; food manufacturing; and primary metal manufacturing. Optimizing the operation of these fans and pumps could achieve electricity savings ranging from 20 to well over 50%. While a range of efficiencies exist for fans and pumps, the opportunity exists less with increasing the efficiency inherent in the equipment and more with increasing the efficiency of the application of the equipment. Part of this potential results from the fact that fan and pump energy use varies as approximately the cube of motor speed. In matching the pump and fan characteristics to the process requirements, the target is achieving the lowest flow, and thus the lowest energy usage. A number of approaches can be used to accomplish this, with the optimal approach depending upon the particular circumstances. Knowing the process requirements is key to determining the correct speed of pumps and fans. While this is not a complex engineering problem, it requires familiarity with both the facility processes, and fan and pump system design. Most optimization projects involve greater engineering costs than equipment costs. The average payback for a good optimization project is about 1.2 years, with the cost of saved energy on the order of $0.012 per kilowatt-hour (kWh). These estimates do not account for productivity gains known to exist at many of the sites, which are sometimes as much as two to five times the energy savings. While the potential for fan and pump system efficiency has long been realized in the engineering community, attempts to design energy efficiency programs to capture this potential only date back just over a decade. To date, these programs have struggled to balance the needs for site-specific engineering services with program costs, though interest remains high among mature industrial programs in developing program strategies. Since the biggest challenge has been high program cost for opportunity identification and solution design, it is important that programs quickly focus their efforts on sites likely to result in implemented savings. Programs focused on a few specific industries appear most effective. Programs will need to assemble a toolkit from the extensive existing materials, and identify key local and North American consulting resources that can provide assistance. Under this program approach, there will be limited need for equipment incentives because of the high benefit-cost ratio for most projects. The more important focus should be on incentivizing the engineering service, since once a project is designed the customer is likely to proceed with implementation if it can be shown to be profitable.

Industrial Fan and Pump System, ACEEE
1
MARKET ANALYSIS Nationally, motor systems account for 50–60% of electricity use. Nearly half of this use is in the industrial sector, with the rest distributed among the residential, commercial, and utility sectors. In the industrial sector, about two-thirds of the electricity use is for motors (Nadel et al. 2002). Fan and pump systems account for about 40% of industrial motor system energy use (see Figure 1), or more than a quarter of all industrial electricity use (Nadel et al. 2002). Based on ACEEE’s analysis, four industries represent 74% of the potential industrial fan and pump energy savings (chemical manufacturing, paper manufacturing, petroleum and coal products manufacturing, and mining) and an additional two industries (food manufacturing and primary metal manufacturing) bring the total to 84%. The electricity savings opportunity in these six industries would represent a 30% saving in national motor energy use if this opportunity were fully realized. The share of motor system electricity use and the share represented by fan and pump systems vary by industry. Table 1 presents our estimates of the relative magnitude of electricity consumed by fan and pump systems for the important industries on a national basis.
TECHNOLOGY DESCRIPTION
Motor systems are comprised of a number of sub-systems, as indicated in Figure 2. Efficiency opportunities exist in each sub-system, as has been described in many sources. Much attention has been applied to the motor, where selecting efficient equipment is one significant opportunity. Many studies (including Nadel et al. 2002; XENERGY 1998) have identified the process as the source of even greater energy savings potential. Motors play a key role in many of these processes, with fan and pump systems representing one of the most important. While a range of efficiencies exist for fans and pumps, the opportunity is less with the efficiency inherent in the equipment and more with the application of the equipment (Friedman et al. 1996). Part of this potential results from the fact that fan and pump energy use varies as approximately the cube of motor speed. While small changes in motor speed have modest impacts on process flows, these changes can have large impacts on energy use.
Pump25%
Fan14%
Compressed Air16%
Material Handling12%
Material Process22%
Other4%
Refrigeration7%
Figure 1: National Industrial Motor Systems Energy End-Use (Source: Nadel et al. 2002)

Industrial Fan and Pump System, ACEEE
TUppacore Inais
Table 1. Characterization of Industrial Fan and Pump Load in the United States N
AIC
S**
Indu
stry
Ele
ctri
city
D
eman
d 1
997
Pum
ps
Fans
and
B
low
ers
Tot
al M
otor
s
Mot
or E
lect
rici
ty
Fans
/Pum
ps
Shar
e of
E
lect
rici
ty
Fans
/Pum
ps
Ele
ctri
city
Use
11 Agriculture 16,325 25% 20% 75% 12,244 45% 7,346 22 Mining 85,394 7% 21% 90% 76,854 29% 24,363 311 Food mfg. 66,166 11% 5% 81% 53,756 16% 10,809 314 Textile product mills 5,135 14% 15% 82% 4,221 30% 1,523 321 Wood product mfg. 21,884 4% 10% 80% 17,464 14% 3,064 322 Paper mfg. 119,627 28% 16% 84% 101,078 44% 52,636
324 Petroleum and coal products mfg. 69,601 51% 13% 85% 59,369 63% 44,061
325 Chemical mfg. 212,709 18% 8% 73% 154,693 26% 54,797 326 Plastics & rubber mfg. 52,556 9% 4% 66% 34,847 13% 6,729
327 Nonmetallic minerals product mfg. 37,416 4% 4% 65% 24,328 8% 3,037
331 Primary metal mfg. 172,518 2% 4% 26% 44,855 6% 10,351
332 Fabricated metal product mfg.* 49,590 7% 5% 65% 32,462 12% 6,149
333 Machinery mfg.* 27,295 8% 4% 67% 18,391 12% 3,330
334 Computer & electronic product mfg.* 40,099 2% 3% 54% 21,783 4% 1,801
336 Transportation equipment mfg.* 54,282 4% 6% 64% 34,629 11% 5,753
Total 1,030,598 690,974 235,750
Fraction of total elec. 67% 23% * = Greater uncertainty exists for these numbers than for other estimates, since they come from a single source, and in ACEEE judgement may underrepresent the fraction of electricity accounted for by fans and pumps in these industries. ** = North American Industrial Classification System
2
hus the goal of system optimization is to match flow to the actual process requirements. nfortunately, engineering practice tends to add margins of safety to capacity sizing, so most ump and fan systems tend to be oversized. Complicating the sizing issue is that fan and umps have a range of optimal operating characteristics that must be matched to process flow nd pressure requirements (Nadel et al. 2002). While these process requirements are onstant in many applications, in some cases they may vary over a significant range (e.g., ver a 1 to 3 range of flow). Several different optimums may exist for these different flow gimes.
matching the pump and fan characteristics to the process requirements, the target is chieving the lowest flow, and thus the lowest energy usage. The easiest parameter to adjust the fan or pumps speed. The speed can be changed by:

Industrial Fan and Pump System, ACEEE
3
• adjusting the drivetrain (e.g., different size belts and pulleys); • modification to the pump or fan (e.g., trimming of the pump impeller or substitution
of the fan impeller); • staging of multiple fans or pumps; or • varying the motor speed using an adjustable speed drive (ASD), also known as a
variable frequency drive (VFD).
The choice of technology will be dictated by the particular circumstances. The application of an ASD allows for significant flexibility and is appropriate in a situation with varying load. However, an ASD increases equipment cost significantly and can actually increase energy use in systems where there is no significant variation in load. As a result, ASDs have proven to be the solution of choice in only a portion of the fan and pump system applications. For the majority of applications, other lower-cost approaches represent the best solution (Nadel et al. 2002). Knowing the process requirements is key to determining the correct speed of pumps and fans. In Figure 2, a system analysis is required, beginning at the right of the figure and moving back through the system to ultimately the sizing of the motor, starter, and electric supply. While this is not a complex engineering problem, it requires familiarity with both the facility processes, and fan and pump system design.
Market Players
The fan and pump industries represent a contrast in market structures. The industrial fan and blower market is fragmented and competitive, with no manufacturer accounting for more than a 12% market share (Easton 1995). Manufacturers sell fans and blowers through manufacturer representatives or to other original equipment manufacturers (OEMs), including dust collection, heating ventilation and air conditioning (HVAC), oven, boiler, and pollution control equipment manufacturers, among others. Contractors install most fan and blower systems. Specifiers work with the contractor, end-user, and manufacturer repre-sentatives to design the system and select equipment. Finally, independent air balancing firms may be called upon to test the system after installation and certify that it meets design criteria.
SuppliedElectricity
M OTOR
To Process
Starter/Drive/Controls
Transm ission or Coupling
DrivenEquipm ent
Figure 2: Components of a Motor System

Industrial Fan and Pump System, ACEEE
4
In contrast, the industrial process pump market is more concentrated, but extremely competitive, with not every manufacturer serving each process market. Within a given market, there may be only a few players. The largest of these is ITT Fluid Power as a result of recent industry consolidation. Manufacturers sell pumps through manufacturers’ repre-sentatives and distributors, or, in some cases, directly to very large end-users. Many process pumps are engineered specifically for a particular end-use application and thus are sold directly to the end-user through the manufacturer. Manufacturers and their agents (internal sales staff, distributors, and manufacturers’ representatives) exert strong influences on this market, as together they play a strong role in determining pump efficiency and selection. Pump distributors vary widely in sophistication. Some provide design, repair, and mainte-nance services while others simply order and obtain pumps for the end-user or contractor. Distributors use manufacturer-provided manuals, pump curves, and software to help select pumps. The information provided by the manufacturers is adequate for proper pump selection. Pump distributors play an important role in determining which pump is chosen for a job; however, they have little stake in pump system efficiency. Mechanical contractors install most process pumps. Consulting engineers design nearly all new greenfield sites (i.e., new manufacturing facilities being constructed from the ground up) and may also get involved with system renovation or major retrofit situations. End-users often design smaller system renovations themselves. Larger end-users, particularly in the chemical and petroleum industries, often have internal process engineers who perform system design work.
Market Barriers
Fan and pump markets are beset with many of the afflictions that limit energy savings in other industrial markets. Industrial firms tend to be first cost focused. This behavior is frequently associated with equipment cost, but market experience indicates that first cost concerns may apply even more to engineering services (Nadel et al. 2002). In addition, because of engineers’ tendency to include a margin of safety, system components tend to be oversized. This trend is further complicated because of changes that occur in the process since its initial design. As result, the equipment seldom operates under design conditions (Elliott and Nadel 2002). Since most industrial process loads are site-specific, design of fan and pump systems requires good application-specific engineering, and cannot be obtained in a “cookie cutter” fashion. Most end-users (and even many of the consulting engineers they hire) often lack practical knowledge regarding how best to optimize systems. Furthermore, optimization can be a time-consuming process, and time is something most customers are short of. On the other hand, the equipment cost needed to realize the savings is frequently modest (Nadel et al. 2002).

Industrial Fan and Pump System, ACEEE
ENERGY SAVINGS POTENTIAL AND ECONOMICS
Electricity savings come from optimization of fan and pumps systems. The cost and savings resulting from a project are site specific, reflecting the unique opportunities available at the site, and the engineering and equipment expenditures required.
Energy Savings
Based on past program experience, typical energy savings from fan, pump, or blower-system upgrades vary from 20 to 50% or even higher for systems identified as good candidates for optimization (Nadel et al. 2002). To be conservative, we assume an average 20% saving as did Martin et al. (2000) for their calculations (e.g., if two-thirds of customers achieve 30% savings, average savings across all customers will be approximately 20%). Based on this rate of savings potential, we estimate an electricity savings potential of over 47,150 million kWh nationally in the industrial sector (plus additional savings in the commercial sector, primarily in HVAC). As noted above, these savings are concentrated in four to six industries with large electric energy consumption and significant pump and fan use, accounting for 74–84% of the savings potential (see Table 2 and Figure 3). The concentration of energy savings in a few industries creates an important program design opportunity for program implementers, as will be discussed later in this report. However, the key industries may vary somewhat from region to region and even utility to utility.
Incremental Costs
As noted previously, most projects involve greater engineering costs relative to the cost of the equipment. Many of these costs are associated with collection of system data to allow for the estimation of actual process requirements. Based on known and estimated costs and energy savings for sites that are proceeding toward implementation, the average payback is 1.2 years.
Table 2. Potential Fan and Pump Energy Savings
NA
ICS
Industry P
oten
tial
Savi
ngs
(mill
. kW
h)
Shar
e of
Fa
ns/P
umps
Sa
ving
s Po
tent
ial
11 Agriculture 1,469 3% 22 Mining 4,873 10% 311 Food mfg. 2,162 5% 314 Textile product mills 305 1% 321 Wood product mfg. 613 1% 322 Paper mfg. 10,527 22% 324 Petroleum and coal products mfg. 8,812 19% 325 Chemical mfg. 10,959 23% 326 Plastics & rubber mfg. 1,346 3% 327 Nonmetallic minerals product mfg. 607 1% 331 Primary metal mfg. 2,070 4% 332 Fabricated metal product mfg. 1,230 3% 333 Machinery mfg. 666 1% 334 Computer & electronic product mfg. 360 1% 336 Transportation equipment mfg. 1,151 2%
5
Total 47,150

Industrial Fan and Pump System, ACEEE
6
Cost of saved energy is estimated to be on the order of $0.012/kWh1 (Martin et al. 2000). These estimates do not account for productivity gains known to exist at many of the sites, which are sometimes as much as two to five times the energy savings. These non-energy benefits can include improved equipment reliability, increased productivity, and improved product quality. One frequently cited benefit is the elimination of plant bottlenecks that result in plant-wide productivity improvements (Nadel et al. 2002).
Measure Life
The life of fan and pump system improvements varies from site to site. When the product or process is changed, the system requirements change. Unless the fan or pump system is regularly re-optimized, systems tend to fall out of optimization. In some applications this can occur relatively rapidly, while others can operate for decades with little change. Since the average industrial process refit cycle averages about a decade, the benefits can be assumed to persist for about 10 years.
1 These savings are based on the 36 site evaluations, 11 feasibility studies, and 4 case studies that were conducted by the Energy Center of Wisconsin’s Performance Optimization Program from late 1995 until 1998. Average annual project savings were reported as 110 kW and $40,500 (about 675,000 kWh) in electricity cost. The an average implementation cost for each project was $48,000 (Sturiale 1999).
Figure 3: Distribution of Pump and Fan System Savings Potential by Industry in the United States
��������������������������������������������������������������������������������������������������������������������������������������������������������������������������������������
������������������������������������������������������������������������������������������������������������������������������������������������������������������������������������������������������������������������������������������������������������������������������������������������������������������������������������������������������������������������������������������������������������������������������������������������������������������������������������������������������������������������������������������������������������������������������������������������������������������������������������������������������������
������������������������������������������������������������������������������������������������������������������������������������������������������������������������������������������������������������������������������������������������������������������������������������������������������������������������������������������������������������������������������������������������������������������������������������������������������������������������������������������������������������������������������������������������������������������������������������������������
������������������������������������������������������������������������������������������������������������������������������������������������������������������������������������������������������������������������������������������������������������������������������������������������������������������������������������������������������������������������������������������������������������������������������������������������������������������������������������������������
������������������������������������������������������������������������������������������������������������������������������������������������������������������������������������������������������������������������������������������������������������������������������������������������������������������������������������������������������������������������������������������������������������������������������������������������������������������������������������������������������������������������������������������������������������������������������������������������������������������������������������������������������������������������������������������������������������������������������������������������������������������������������������������������������������������������������������������������������������������������������������������
����������������������������������������������������������������������������������������������������������������������������������������������������������������������������������������������������������������������������������������������������������������������������������������������������������������������������������������������������������������������������������������������������������������������������������������������������������������������������������������������������������������������������������������������������������������������������������������������������������������������������������������������������������������������������������������������������������������������������������������������������������������������������������������������������������������������������������������������������������������������������������������������������������������������������������������������������������������������������������������������������������������������������������������������������������������������������������������������������������������������������������������������������������������
���������������������������������������������������������������������������������������������������������������������������������������������������������������������������������������������������������������������������������������������������������������������������������������������������������������������������������������������������������������������������������������������������������������������������������������������������������������������������������������������������������������������������������������������������
������������������������������������������������������������������������������������������������������������������������������������������������������������������������������������������������������������������������������������������������������������������������������������������������������������������������������������������������������������������������������������������������������������������������������������������������������������������������������������������������������������������������������
�������������������������������������������������������������������������������������������������������������������������������������������������������������������������������������������������������������������������������������������������������������������������������������������������������������������������������������������������������������������������������������������������������������������������������������������������������������������������������������������������������������������������������������
������������������������������������������������������������������������������������������������������������������������������������������������������������������������������������������������������������������������������������������������������������������������������������������������������������������������������������������������������������������������������������
���������������������������������������������������������������������������������������������������������������������������������������������������������������������������������������������������
������������������������������������������������������������������������������������������������������������������������������������������������������������
3%
10%
5%
1%
1%
22%
19%
24%
3%
1%
4%3% 1%1% 2%
��������Agriculture����
Mining����
Food Mfg
Textile Product Mills��������Wood Product Mfg
Paper Mfg����
Petroleum and Coal Products Mfg����
Chemical Mfg��������Plastics & Rubber Mfg��������Nonmetallic Minerals Product Mfg����
Primary Metal Mfg����
Fabricated Metal Product Mfg
Machinery Mfg��������Computer & Electronic Product Mfg��������Transportation Equipment Mfg

Industrial Fan and Pump System, ACEEE
7
PUMP AND FAN PROGRAMS While the potential for fan and pump system efficiency has long been realized in the engineering community, attempts to design energy efficiency programs to capture this potential only date back just over a decade. To date, these programs have struggled to balance the needs for site-specific engineering services with program costs, though interest remains high among mature industrial programs in developing program strategies.
Past Program Experiences
Programs focusing on fans and pumps began around 1990, starting in Canada but then progressing to several regions of the United States. Early programs were offered by B.C. Hydro and Ontario Hydro and focused on identifying good applications for adjustable speed drives. However, this focus proposed an answer before asking which technologies make the most sense for each customer. By 1993, the Canadian utilities began several pilot projects that used a systems approach to optimize the entire motor-driven system. Due to a shift in utility priorities, these programs were discontinued before they moved out of the pilot stage but many of the people working on these programs participated in the development of a Performance Optimization Service (POS) in Wisconsin. The Wisconsin POS program began in 1993 operated by the Energy Center of Wisconsin (a nonprofit organization) in partnership with the state’s utilities. Under the POS program, utility customer service representatives identified candidates for POS services and engineers were hired to provide customers with quick, free engineering “walk-through” analyses of their systems. If substantial savings were projected, the engineers prepared feasibility study proposals to determine what should be done to improve efficiency and performance, and how much this would save the customers. If the proposals were accepted, the program engineers collected system-load and operating data, and prepared the feasibility study reports that recommended design strategies and detailed technical and economic impacts of the projects. As the program evolved, these steps were streamlined and combined so that following the walk-through, customers were given preliminary cost and savings estimates, along with proposals for detailed studies. The utilities participating in the program offered a range of incentives to customers to implement POS projects: partial reimbursement of feasibility study costs; customized rebates based on projected energy savings; low-interest loans; and shared-savings contracts through an independent financing organization. A training program was developed with support materials for utility representatives, consulting engineers, trade allies, and end-users, with training tailored toward specific needs of each of these groups (Wroblewski 1996). The POS program provided initial audits to 36 sites and detailed feasibility studies to 11 sites. Ultimately, however, only six customers decided to implement projects; most of the others never made a decision. An evaluation of the program attributed the low implementation rate to several factors: (1) nothing was broken; (2) it was perceived that savings were risky or cost estimates unrealistic; (3) several plants got a second opinion from a fan vendor who told them not to do the project because of feasibility or reliability concerns; (4) reluctance on the part of plant personnel to acknowledge inefficiencies in their systems;

Industrial Fan and Pump System, ACEEE
8
(5) payback periods that exceeded company targets; and (6) expectation/desire for financial incentives (which Wisconsin utilities were phasing out as the POS program was beginning). The evaluation also found that those customers that did implement projects did so for two main reasons: the project solved an existing problem, and/or the project was low risk and had low or no capital costs. Interviews during the evaluation found that most companies preferred to consider process changes when existing systems fail or need to be expanded. Interviewees recommended greater utility involvement in the process, including presenting the POS concept to senior management. Also, interviewees recommended educating manufacturers and design engineers about POS concepts so that these concepts could be incorporated into system designs when new equipment is installed (Bensch 1999; Sturiale 1999). Of the projects that were implemented, four were evaluated. These projects cost an average of $48,000 and saved an average of $40,500 annually, resulting in an average simple payback period of 1.2 years. As a result of this low implementation rate, as well as the high cost of marketing and engineering, the Energy Center decided to cancel the program. Program staff felt that the concept had a lot of merit, but more work was needed to streamline procedures so that costs could be kept in check and also so that projects were more contained and easier for customers to make decisions about. For example, several of the engineers involved in the program recommended development of improved pre-screening procedures so that inappropriate sites could be better screened out prior to any onsite assessments (Bensch 1999; Meadows 2000).
Recent and Current Efforts Focusing on Particular Industries
Building on these lessons, recent efforts to capture fan and pump efficiency savings have tended to focus on particular industries and the particular fan and pumping systems that are generic to an industry. Focusing on industries allows for knowledge from one project to be applied to other projects, cutting costs. Also, word-of-mouth and case studies within an industry can be very useful in building participation. Examples of programs focused on particular industries include: work in California, Vermont, and Wisconsin on municipal water and wastewater systems; work in California on agricultural pumping systems; work in British Columbia, the Pacific Northwest, and North Carolina on lumber drying kilns; and work in the Northwest on refrigerated storage warehouses. Transport and treatment of water and wastewater account for over 3% of U.S. electricity, of which about a third accounted is water and two-thirds is wastewater. Water and wastewater facilities are energy intensive accounting for 35% of energy used by municipalities on average, with systems accounting more than half of some municipalities’ energy bills (EFAB 2001). Electricity use in water and wastewater treatment and distribution in the United States is estimated to cost over $6.5 billion annually, with savings of 15% readily achievable (ASE 2002). In water systems, pumping accounts for over 95% of the electricity, with 85% consumed by distribution pumping. In wastewater, blowers for aeration of activated sludge account for half the electricity, and pumping for 15% (Burton 1996). These markets appear to be poised to capture the significant savings opportunities that exist in water and wastewater systems.

Industrial Fan and Pump System, ACEEE
9
In 1995, the U.S. Department of Energy (DOE), the Electric Apparatus Service Association (EASA), the Pacific Gas and Electric Company (PG&E), and local motor distributors identified water pumping at water and wastewater treatment facilities as a major energy-saving opportunity, based on several previous demonstration projects. Using three California Energy Commission (CEC) case studies at water and wastewater sites as a foundation, they organized operations and maintenance pumping workshops for members of the Northern California chapter of the American Water Works Association (AWWA). The workshops focused on how to choose motors and pumps, maintenance and operation practices, and motor and pump repair. These workshops were all standing room only. As a result, AWWA partnered with CEC and utilities throughout the state to offer workshops statewide. Based on this success, DOE, CEC, and AWWA, along with the Electric Power Research Institute and the utilities, brought the Pumping System Optimization training (discussed below) to California. They conducted six sessions in both 1997 and 1998, again to standing room only crowds. The success of the California initiative resulted in programs in other states, including New York, Arizona, and Iowa. The strength of the program has been its focus on a narrow market segment. Also, AWWA was an essential partner. Another inducement was that the initiative worked with participating states to give Continuing Education Unit hours for the workshops, which was important to many of the water and wastewater operators who needed the hours to maintain certification (Oliver 1999). More recently, Vermont Energy Investment Corp. (VEIC) has been running water and wastewater energy efficiency programs for Long Island Power Authority and Energy Efficiency Vermont. Similarly, Wisconsin Focus on Energy has deployed a water and wastewater program based on a water and wastewater roadmap it developed (Focus on Energy 2002a). These programs provide a comprehensive assessment of efficiency opportunities. Among the measures included are process technology changes such as change to fine-bubble aeration. The implementation of these measures frequently incorporates pump and blower system optimization to take advantage of the process load reductions that result from the change in process technology. The Wisconsin program has retained industry experts that conduct assessments for municipalities on energy-saving opportunities. The program is particularly targeting smaller (5–10 million gallon per day) facilities because it has found greater replicability of recommendations and ease of implementation at these facilities than at larger systems that are more complex. To date, Door County, Waukesha County, and the City of Hillsboro have each saved thousands of dollars by implementing program recommendations (Focus on Energy 2002b; Griffin 2002). Currently, the Consortium for Energy Efficiency (CEE) is facilitating a discussion among it members regarding possibly developing a water/wastewater initiative that would provide a template for other water and wastewater programs (Jones 2002). California utilities (e.g., PG&E and the Southern California Edison Company [SCE]) have also been promoting pump system improvements to agricultural customers for decades. The foundation of these programs has been a pump testing service that tests pumping systems to determine overall system efficiency, electrical motor performance, pump hydraulics, and water well characteristics. The result is a computerized report containing information on the testing results, and a recommendation on whether replacement or upgrading equipment is

Industrial Fan and Pump System, ACEEE
10
warranted. Where such changes are recommended, estimates of the capital and operating cost impacts for the upgraded system are provided. In recent years, many of these programs have added additional services such as free or subsidized engineering feasibility studies on energy-saving measures, pump system design analysis, and incentives for installing energy-saving measures (Conlon & Weisbrod 1998; SCE 2000). Market research by PG&E found that the major barriers inhibiting good pumping practices are the perception that efficiency measures have many hidden costs, concerns that measures will not perform as advertised, and lack of information and the time needed to find trustworthy information. This research found that the PG&E pumping program was addressing the information barrier to a significant extent and other barriers to a lessor extent (PG&E 1999). A 1998 evaluation of SCE’s pumping program found similar program impacts and further found that pumping system efficiency gradually increased in the 1990s (due in part to the SCE program), that program participants saved energy relative to non-participants, and that the market share for high-efficiency pumps was much greater in California than in a neighboring state that did not have an agricultural pumping program (Conlon & Weisbrod 1998). However, this study also recommended developing additional intervention strategies to better address the remaining market barriers to high-efficiency pumps and good pumping system design, operation, and maintenance practices. Among the recommendations were the following: improving access to financing and other tools to reduce the first cost of more efficient equipment; developing standards for defining and distinguishing high-efficiency pumping equipment; working with municipalities to improve bidding procedures so that efficient and inefficient equipment are no longer evaluated as “comparable;” encouraging dealers to improve stocking of efficient equipment; and offering training for pumping system consultants on the value of long-term payback from investing in the acquisition of higher-efficiency and longer-lasting equipment (Conlon & Weisbrod 1998). The N.C. Alternative Energy Corp., now Advanced Energy (AE), in cooperation with the furniture industry, North Carolina State University, and the state's electric utilities, undertook a project to demonstrate the potential of controlling airflow in hardwood lumber dry kilns. The project’s goals included: understanding the drying process for furniture-grade hardwood; developing a control strategy for the fans; and evaluating the potential for savings. In furniture-grade lumber, especially for some hardwoods such as oak, the control of the drying process is critical for maintaining lumber quality. The AE study developed a control strategy based on the change in the humidity in the air immediately before and after it had passed through the lumber stack to vary the fan speed. Field trials with two industrial demonstration sites confirmed that varying the airflow resulted in at least as good a lumber quality with no effect on production rates. The operators felt that the lumber quality was better with the variable air (particularly on difficult woods to dry, such as oak) though tests were not conclusive. The total energy required for a load of wood was reduced by about half. Paybacks for the fan control systems varied from 2.4 to 8.7 years depending upon motor size and kiln configuration. Following completion of the report, AE conducted a series of seminars on the topic for the Southeastern Dry Kiln Club, the industry technical association (IEL 1992).

Industrial Fan and Pump System, ACEEE
11
A project to promote variable fan speed systems in softwood dry kilns was operated by B.C. Hydro for several years. The program sponsored audits of dry kiln systems in its province and recommended ASDs in applications with a 2-year simple payback or less (36% of audited kilns met this criteria). Ultimately, approximately two-thirds of the kilns in the province were audited, and of these, approximately 25% proceeded to implement the audit recommendations (Ference Weicker & Company 1995). Similarly, industrial efficiency programs offered by the Bonneville Power Administration in the 1990s provided incentives for variable fan speed systems at many wood product plants in the Northwest (Gordon 2000). In the Northwest, a program operated from 1998–2001 that worked with refrigerated fruit storage warehouses to encourage them to install ASDs on refrigeration system evaporator fans. The program built on several previous successful refrigerated storage projects in the region and sought to use these successful projects to promote widespread application of this measure in the Northwest’s large fruit industry. The program centered on educating warehouse owners—as well as vendors, contractors, and systems operators—on the benefits of ASDs in refrigerated warehouses. Project activities included a database on refrigerated warehouses and ASD installations in these warehouses, demonstration projects, and detailed reports on these case studies. As of November 2001, projects were implemented at 24 sites including 18 controlled atmosphere storage facilities, five cold-storage warehouses, and one distribution center. Evaluations of the program found that projects in the controlled atmosphere facilities reduced fan energy use from 24–78% and also reduced fruit mass loss by 0.19–0.58% (which is important since sales revenues depend on weight). About one half of the financial benefits came from energy savings and one half from reduced mass loss. Overall simply paybacks on these projects ranged from 1.1 to 3.6 years. At the other six sites, fan energy was reduced 62–86%, with simple paybacks based on energy savings ranging from 1.4 to 8.0 years. Probably even more importantly, surveys of field trial participants found that the experience convinced them to install more evaporator fan ASDs. Surveys in the industry indicated that 23% of respondents felt that evaporator fan ASDs were standard practice for them and the industry (preferred and nearly always selected) and 33% of respondents believed it was common practice (well known and often used). The evaluation attributed the program’s influence to a significant regional presence in industrial refrigeration and person-to-person marketing by a highly experienced and respected program contractor (Pacific Energy Associates, Inc. and MetaResource Group 2002). While the program has ended due to market acceptance of ASDs in the industry, a number of follow-up activities are taking place (NEEA 2003).
Broad Programs
In addition to these industry-specific programs, a number of broader programs are being offered to promote fan and pump system energy savings. For example, DOE’s Industrial Best Practices: Motors program has developed and offered a series of Pumping System Optimization Workshops. These sessions present the fundamentals of optimizing pump systems and focus on the Pump System Assessment Tool (PSAT), which helps industrial users assess the efficiency of pumping system operations. PSAT uses achievable pump performance data from Hydraulic Institute (HI) standards to calculate potential energy and associated cost savings. In 1999, DOE began a training program on how to use the PSAT software (DOE 2002).
Industrial Fan and Pump System, ACEEE
12
Many utilities offer incentives for installation of ASDs in fan and pump systems. Most of these programs offer “custom” incentives for ASDs and other energy-saving measures. In these custom programs, the customer or its consultants prepares a description of the measure, its costs, and its energy and demand savings. Based on this information, the utility will provide an incentive determined according to a formula (e.g., $x per kWh saved). However, a few utilities offer pre-calculated incentives per unit of horsepower controlled by the ASD, provided certain criteria are met. For example, National Grid USA offers incentives on a per horsepower basis for boiler water feed pumps; hydraulic pumps on injection molding machinery; chilled water distribution pumps employed in building HVAC systems; and supply, return, and building exhaust fans employed in variable air volume building HVAC distribution systems. For each of these applications, annual equipment operating hours must exceed eligibility levels set by the utility. National Grid offers pre-calculated incentives for these applications because it is confident that ASDs in these applications will provide cost-effective energy savings. For other potential applications of ASDs, National Grid accepts custom-measure applications but requires engineering calculations to verify that savings are significant and cost-effective. The National Grid ASD program has been popular with customers and ASD vendors because it is relatively simple to apply for and the amount of incentive is known in advance, making it easier for vendors to sell projects to customers. National Grid had been offering this program since the early 1990s, and as of 2000, had provided incentives for nearly 500 ASDs (McAteer 2000).
PROGRAM STRATEGIES
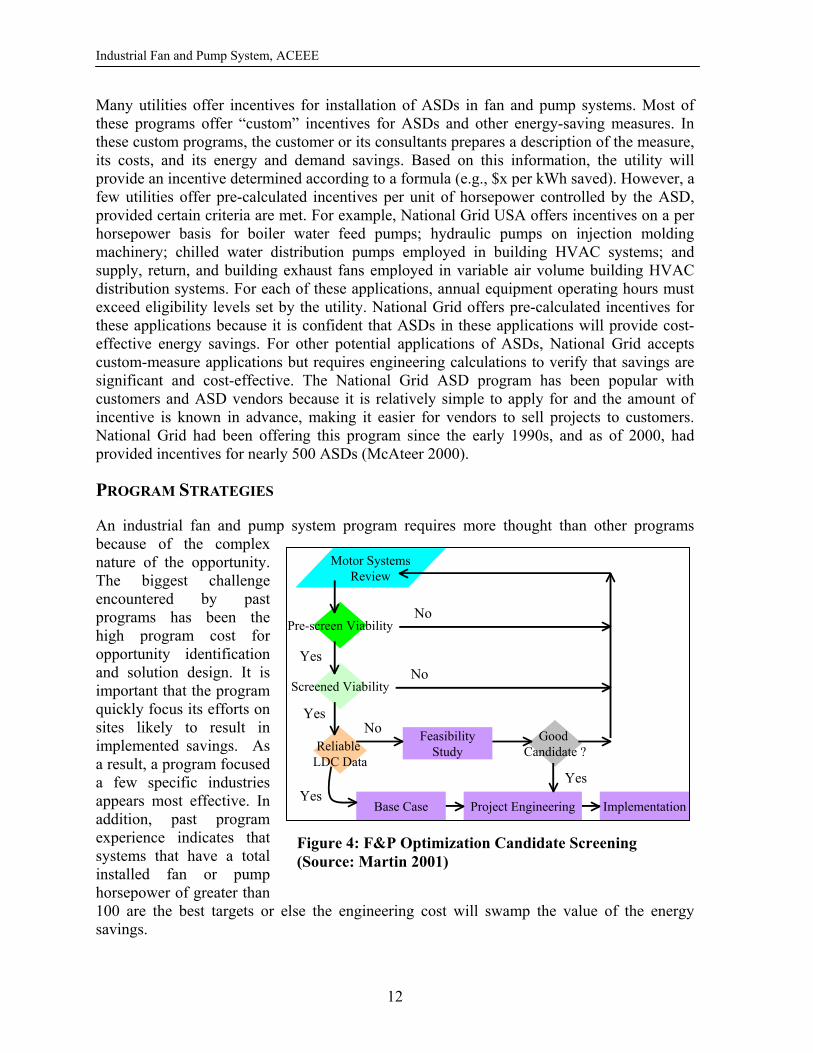
An industrial fan and pump system program requires more thought than other programs because of the complex nature of the opportunity. The biggest challenge encountered by past programs has been the high program cost for opportunity identification and solution design. It is important that the program quickly focus its efforts on sites likely to result in implemented savings. As a result, a program focused a few specific industries appears most effective. In addition, past program experience indicates that systems that have a total installed fan or pump horsepower of greater than 100 are the best targets or else the engineering cost will swamp the value of the energy savings.
Motor SystemsReview
Screened Viability
Pre-screen Viability
Base Case Project Engineering Implementation
FeasibilityStudy
Good Candidate ?Reliable
LDC Data
Yes
Yes
YesYes
No
No
No
Figure 4: F&P Optimization Candidate Screening (Source: Martin 2001)

Industrial Fan and Pump System, ACEEE
13
Flow Care Engineering developed a screening methodology for Ontario Hydro that is graphically represented in Figure 4. This methodology assumes that the program engineers are familiar with the opportunities that exist in the target industries, but it does not require a design engineering level of expertise to accomplish initial screening. A technically oriented field representative with some limited training can do the prescreening. The viability screening may require a greater depth of understanding, but can frequently be accomplished by a conference call, rather than requiring a site visit. If the facility has good process data, a load duration curve (LDC) can be constructed for the application allowing a systems engineer to evaluate the project and undertake the design of a solution. If this data is not available, onsite monitoring will be required to construct the LDC to allow for final screening. This approach allows for different levels of expertise to be focused most effectively to minimize use of high-cost consultants (Martin 2001). The design of a full program requires up-front work to characterize the opportunity in the service region. The general approach is as follows:
analyze the pump and fan market in the service territory(ies); identify key market sectors with significant opportunities; conduct case studies at representative sites to identify key opportunities and solution strategies;
develop semi-prescriptive recommendations for target sectors based on the case studies;
identify and/or develop local technical assistance resources (preferably from the existing consulting engineering community) augmented by national experts;
develop and deploy an outreach effort to the target audience; conduct preliminary screening at interested facilities using a screening process as
discussed above; and support solution development and deployment at the most promising sites.
The program will need to assemble a toolkit from the extensive existing materials. The tool kit should be deployed in a web format similar to that developed by CEE for the Motor Decisions Mater (MDM) initiative (CEE 2002). In addition, the project should assemble a database of key North American consulting resources that could be used to assist programs. With this approach, program costs can be contained. The program must quickly focus on high-probability candidates, with the use of high-priced engineering services effectively targeted at facilities likely to yield the greatest savings. In this program approach, there is limited need for equipment incentives because of the high benefit-cost ratio for most projects, although some equipment incentives may be useful in the early stages to help the program establish a track record in the service territory. The more important focus should be on incentivizing the engineering service, since once a project is designed the customer is likely to proceed with implementation if it can be shown to be profitable.

Industrial Fan and Pump System, ACEEE
14
CONCLUSION AND RECOMMENDATIONS
Programs, such as those with the water/wastewater, lumber drying, and refrigerated warehouse industries, indicate that substantial savings are possible with targeted fan and pumping initiatives. We recommend that utilities and other program implementers begin to develop programs based on these successful examples, but targeting key local industries with extensive fan and pump energy use. Typically a year will be needed for program development plus a year for a pilot program targeted at a specific industrial sector, with large-scale deployment in subsequent years. We suggest that program development include preparation of an assessment of the industrial fan and pump market in the local area, identifying key local industries with opportunities for substantial fan and pump energy savings and also identifying regional industry experts and key trade allies. Concurrent with this survey, programs should assemble a tool kit to support marketing and to provide tools to assist engineers, drawing from available materials and supplementing them with some new materials. Several case studies should be developed for targeted industries as part of this tool kit.
Industrial Fan and Pump System, ACEEE
15
REFERENCES [ASE] Alliance to Save Energy. 2002. Watergy. Washington, D.C. Bensch, I.. 1999. POS Evaluation: Looking Back on the Performance Optimization Service
Program, Report Summary. Madison, Wisc.: Energy Center of Wisconsin. Burton, F.L. 1996. Water and Wastewater Industries: Characteristics and Energy
Management Opportunities. St. Louis, Mo.: The Electric Power Research Institute Community Environmental Center.
[CEE] Consortium for Energy Efficiency. 2002. Meeting notes, Water and Wastewater
Committee, St. Louis, Mo., September 9. Conlon, T. and G. Weisbrod. 1998. Southern California Edison Hydraulic Services Program
Market Effects Study. Final Report. Study ID #3507. Sonoma, Calif.: RLW Analytics. [DOE] U.S. Department of Energy. 2002. http://www.oit.doe.gov/bestpractices/
software/psat_cert.shtml. Washington, D.C.: U.S. Department of Energy. Easton Consultants. 1995. National Market Transformation Strategies for Industrial Electric
Motor Systems, Volume II, DOE/PO-0044: Volume II. Washington, D.C.: U.S. Department of Energy.
[EFAB] Environmental Financial Advisory Board. 2001. “Conservation Savings Increment
Loans: A Proposal Concerning the State Revolving Funds.” Washington, D.C.: U.S. Environmental Protection Agency.
Elliott, R. Neal and Steven Nadel. 2002. Fan and Pump Systems: Markets and Programs.
White Paper. Washington, D.C.: American Council for an Energy-Efficient Economy. Ference Weicker & Company. 1995. Process Evaluation of B.C. Hydro’s Fans, Pumps, and
Compressed Air Programs. Vancouver, B.C., Canada: Ference Weicker & Company. Focus on Energy. 2002a. Roadmap for the Wisconsin Municipal Water and Wastewater
Industry. Madison, Wisc.: Focus on Energy. ———. 2002b. “Wisconsin Municipalities Turn to Focus on Energy.” November 19 Press
Release. www.focusonenergy.com/pressRelease/pressReleaseDetail.jsp?pageId= 603&releaseId=39. Madison, Wisc.: Focus on Energy.
Friedman, R., C. Burrell, J. DeKorte, R.N. Elliott, and B. Meberg. 1996. Electric Motor
System Market Transformation. Washington, D.C.: American Council for an Energy-Efficient Economy.

Industrial Fan and Pump System, ACEEE
16
Gordon, Fred (Pacific Energy Associates). 2000. Personal communication to Steven Nadel. July.
Griffin, T. (Science Applications International Corp.). 2002. Personal communication to R.
Neal Elliott. September. [IEL] Industrial Electrotechnology Laboratory. 1992. ENERGY SAVERS: Variable Airflow
Control to Cut Lumber Drying Costs. Raleigh, N.C.: Industrial Electrotechnology Laboratory.
Jones, Ted (Consortium for Energy Efficiency). 2002. Personal communication to R. Neal
Elliott. September. Martin, N., E. Worrell, M. Ruth, L. Price, R.N. Elliott, A.M. Shipley, and J. Thorne. 2000.
Emerging Energy-Efficient Industrial Technologies. Washington, D.C.: American Council for an Energy-Efficient Economy.
Martin, Vern (FlowCare Engineering, Inc.). 2001. Personal communication to Neal Elliott.
March. McAteer, Michael (National Grid). 2000. Personal communication to Steven Nadel. April. Meadows, K. (Energy Center of Wisconsin). 2000. Personal communication to Steven Nadel.
August. Nadel, S., R.N. Elliott, M. Shepard, S. Greenberg, G. Katz, and A.T. de Almeida. 2002.
Energy-Efficient Motor Systems, Second Edition. Washington, D.C.: American Council for an Energy-Efficient Economy.
[NEEA] Northwest Energy Efficiency Alliance. 2003. www.nwalliance.org/
projects/current/warehouse.html. Portland, Oreg.: Northwest Energy Efficiency Alliance.
Oliver, Julia (U.S. Department of Energy). 1999. Personal communication to Neal Elliott.
March. Pacific Energy Associates, Inc. and MetaResource Group. 2002. Market Progress Evaluation
Report: Evaporator Fan VFD Initiative, No. 3, Final Report. Report #E02-102. Prepared for the Northwest Energy Efficiency Alliance. Portland, Oreg.: Pacific Energy Associates and MetaResource Group.
[PG&E] Pacific Gas and Electric Company. 1999. PY97 Agricultural Energy Efficiency
Incentives: Pumping and Related Market Effects Study. Study ID #335A. San Francisco, Calif.: Pacific Gas and Electric Company.

Industrial Fan and Pump System, ACEEE
17
[SCE] Southern California Edison. 2000. “SCE Business Advisor: Pump Tests.” http://www.scebiz.com/solutionscc/services/pumptest.htm. Rancho Cucamonga, Calif.: Southern California Edison.
Sturiale, Jo Anne. 1999. POS Evaluation. Prepared for the Energy Center of Wisconsin.
Madison, Wis.: Sturiale & Company. Wroblewski, Ron (Energy Center of Wisconsin). 1996. Personal communication to Steven
Nadel. XENERGY. 1998. United States Industrial Electric Motor Systems Market Opportunities
Assessment. Washington, D.C.: U.S. Department of Energy, Office of Industrial Technologies.