realizing the spatial & temporal variations in blue … - rabat 2014 nexus(2).pdf · ocp policy...
TRANSCRIPT

OCP Policy Center Conference series
Realizing the Spatial & Temporal Variations in Blue & Green Agricultural Water in Jordan
Samer Talozi
11-13 June 2014

Dimensions & Scope of Presentation
Rational Water(s)
Agriculture Energy
Sustainability of Resources
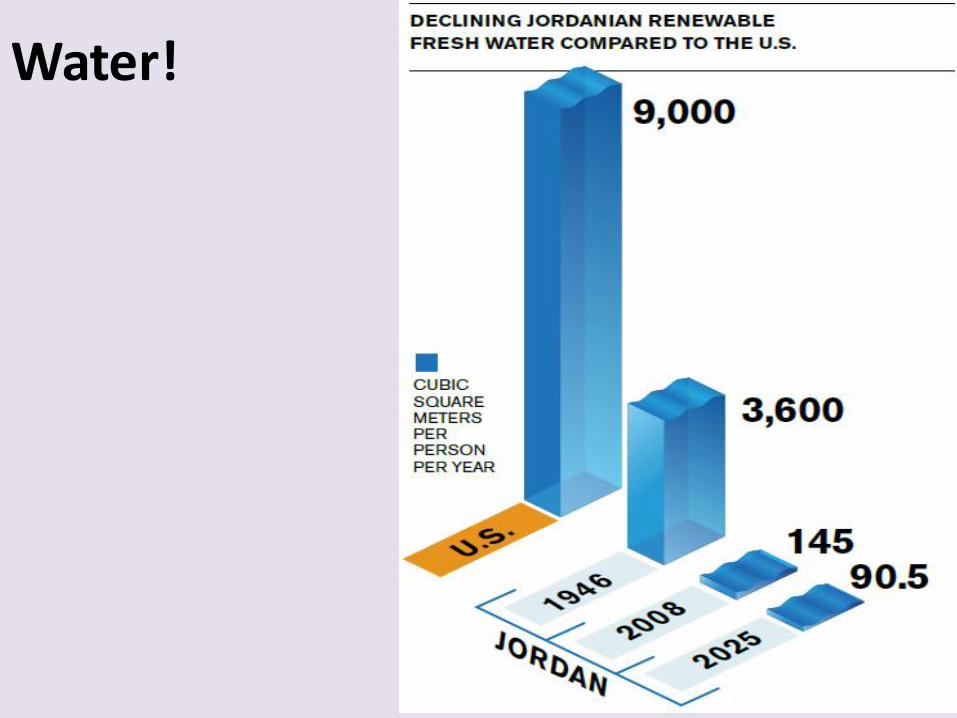
Water!

Source: Mercy Corps, Tapped Out 2013

Disi Ground Water

Red-Dead Project(s) ?


Distribution of Electricity Consumption by Sector
Households; 43%
Commercial ; 17%
Industrial; 24%
Water 14%
St. Lighting; 2%
2012

Transboundary Surface Water
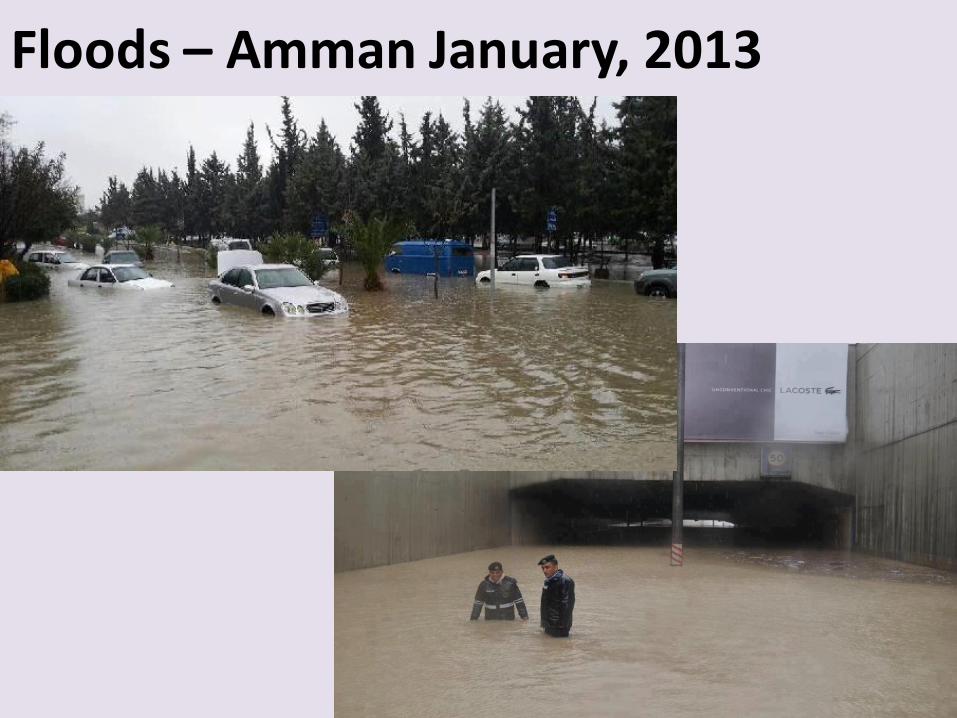
Floods – Amman January, 2013

Floods – Irbid January, 2013

Snow, December 2013

Water Blue Water vs. Green Water Groundwater Marginal water
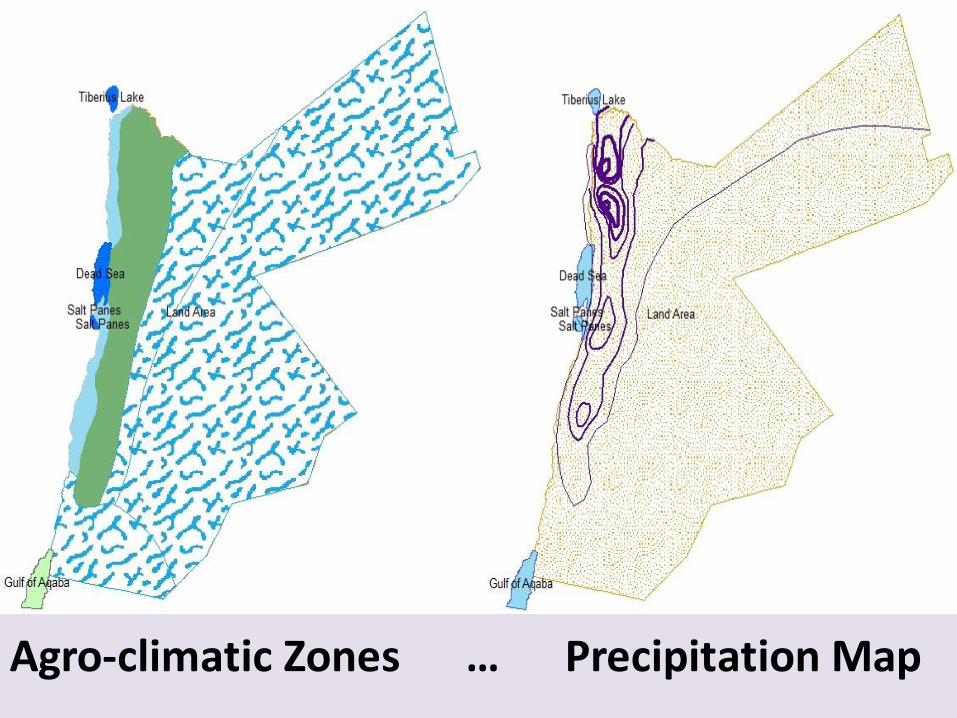
Agro-climatic Zones … Precipitation Map

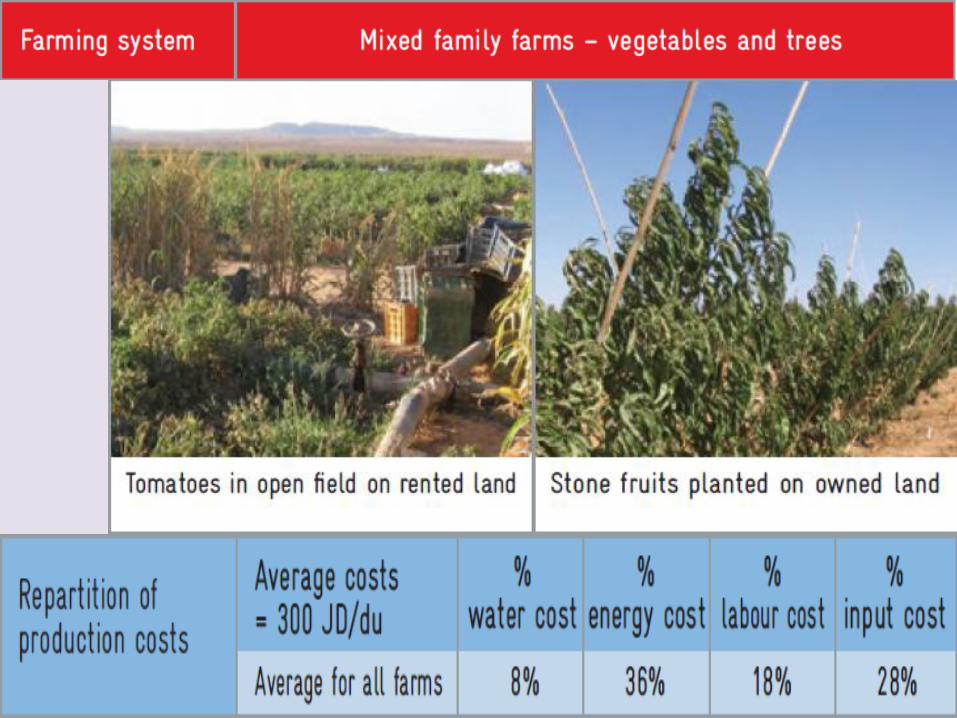
Farming in the Desert

Azraq Basin

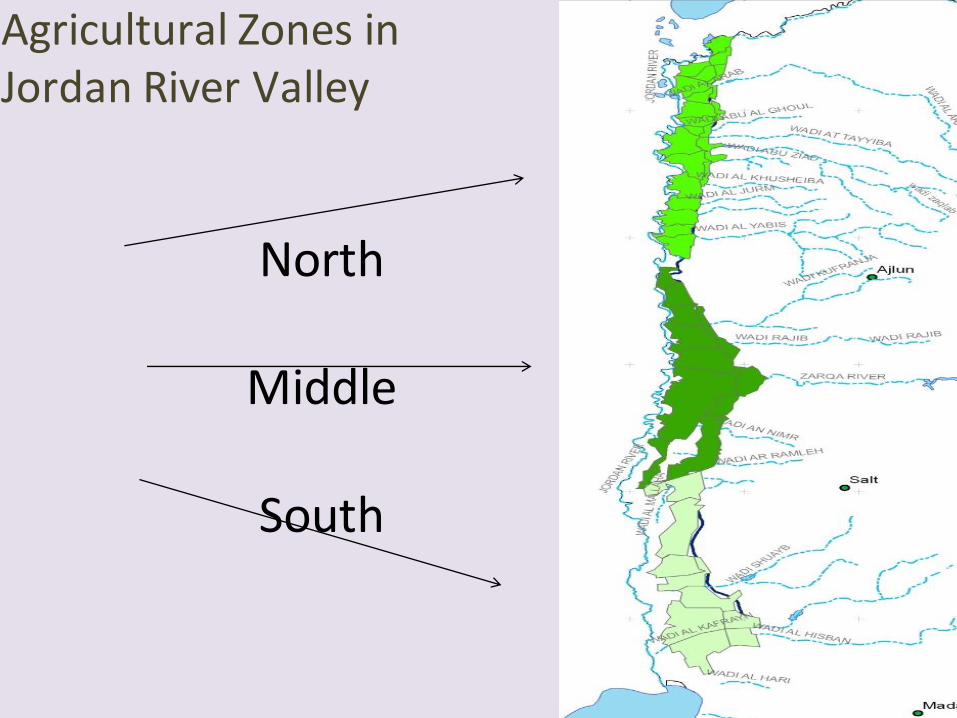
North
Middle
South
Agricultural Zones in Jordan River Valley
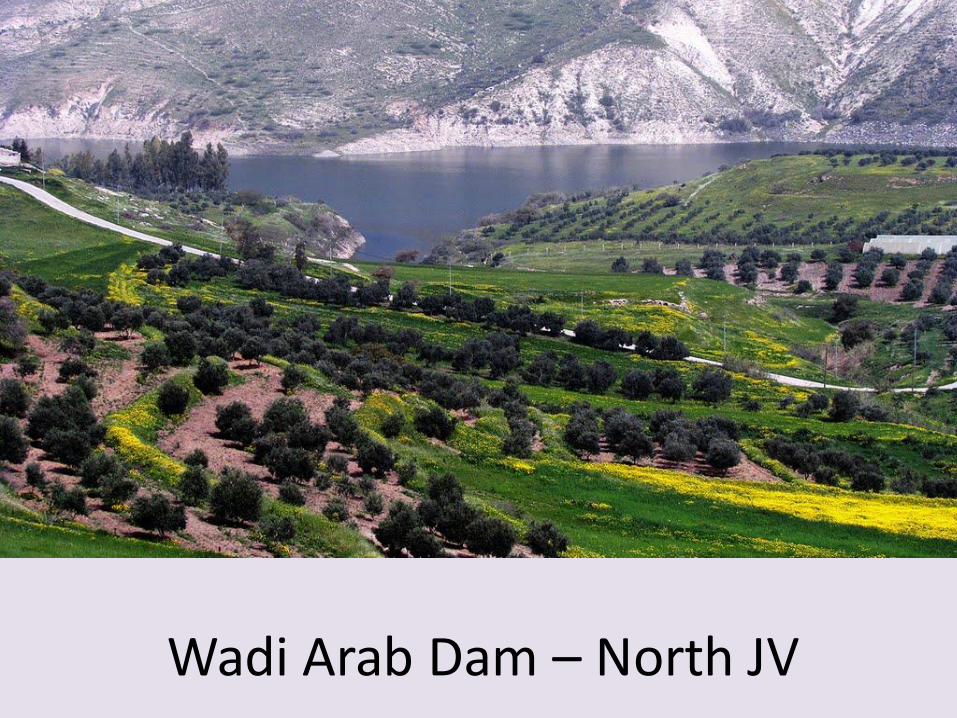
Wadi Arab Dam – North JV

Treated Waste Water

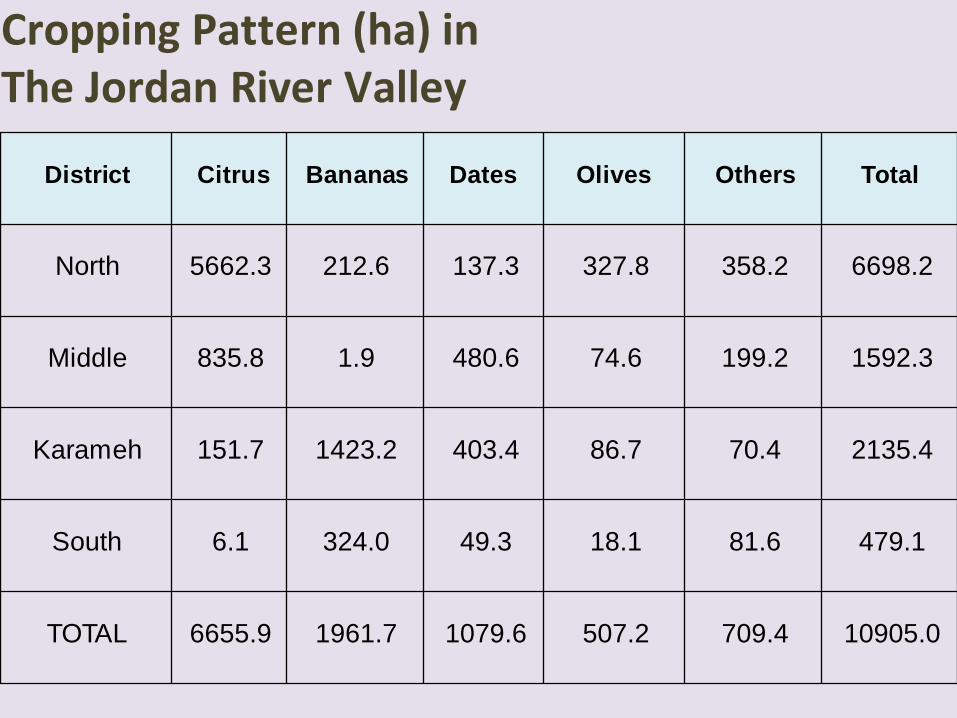
District Citrus Bananas Dates Olives Others Total
North 5662.3 212.6 137.3 327.8 358.2 6698.2
Middle 835.8 1.9 480.6 74.6 199.2 1592.3
Karameh 151.7 1423.2 403.4 86.7 70.4 2135.4
South 6.1 324.0 49.3 18.1 81.6 479.1
TOTAL 6655.9 1961.7 1079.6 507.2 709.4 10905.0
Cropping Pattern (ha) in The Jordan River Valley

Districts
Irrigated
winter
vegetables
Open
field
surface
Open
field drip
Plastic
tunnels
drip
Plastic
houses
drip
Irrigated
summer
vegetables
Shouneh
North 2185.7 74.8 1363.2 59.9 688.5 1551.0
Dair Alla 5052.4 34.4 2773.7 178.3 2066 728.7
Shouneh
South 3196.3 35.3 2785.4 100 276.1 821.8
Ghor Safi 3974.7 3919.7 5.1 49.9 851.4
Total 14409.1 144.5 10842.0 343.3 3081.5 3952.9
Cropping Pattern (ha) in The Jordan River Valley

Name Dunums
m3 per dunum MCM/Yr
Zone 1 - Vegetables Open Field 27633 681 18.8 Zone 1 - Vegetables Green Houses 9187 600 5.5 Zone 1 - Fruit Trees 66982 1,342 89.9 Zone 1 - Field Crops 11501 707 8.1 Zone 2 - Vegetables Open Field 34634 757 26.2 Zone 2 - Vegetables Green Houses 21246 540 11.5 Zone 2 - Fruit Trees 15923 1,332 21.2 Zone 2 - Field Crops 3156 785 2.5 Zone 3 - Vegetables Open Field 33015 647 21.4 Zone 3 - Vegetables Green Houses 6828 543 3.7 Zone 3 - Fruit Trees 21354 1,276 27.3 Zone 3 - Field Crops 6193 926 5.7 Zone 4 - Vegetables Open Field 45378 708 32.1 Zone 4 - Vegetables Green Houses 2810 362 1.0 Zone 4 - Fruit Trees 4791 1,339 6.4 Zone 4 - Field Crops 466 926 0.4 Total 311097 281.8
Irrigation Requirements for The Different Zones


CHANGE
Technology
Policy
Practices
Spatial

THE END
www.just.edu.jo
References
GIZ, DoS, JVA, MWI, Mercy Corps, USAID