realty income 2015 annual report - amazon s3 income 2015 annual report . 1 . 6.6% affo per share...
TRANSCRIPT

RE
AL
TY
INC
OM
E 2
015
AN
NU
AL
RE
PO
RT
2015 ANNUAL REPORT
G E N E R A T I N G S H A R E H O L D E R V A L U EFSCLOGO
FOR POSITION ONLY
1 1 9 9 5 E L C A M I N O R E A L
S A N D I E G O , C A 9 2 1 3 0
w w w . r e a l t y i n c o m e . c o m

R E A L T Y I N C O M E 2 0 1 5 A N N U A L R E P O R T 8 9
COMPANY INFORMATION
Transfer AgentWells Fargo Shareowner ServicesP.O. Box 64873St. Paul, MN 55164
For shareholder administration and account information please visit Wells Fargo’s website at www.shareowneronline.com, call toll-free at 1-877-218-2434, or email your questions to [email protected]
Independent Registered Public Accounting FirmKPMG LLP San Diego, CA
For Additional Corporate Information Visit the Realty Income corporate website at www.realtyincome.com
Contact your financial advisor, or contact Realty Income at: Telephone: 858-284-5000, Email: [email protected]
Copies of Realty Income’s Annual Report on Form 10-K are available upon written request to: REALTY INCOME CORPORATION Attention: Investor Relations 11995 El Camino Real San Diego, CA 92130
EXECUTIVE OFFICERS
DIRECTORS
Top row left to right: Neil Abraham, John Case, Michael Pfeiffer | Bottom row left to right: Sumit Roy, Paul Meurer
Michael D. McKeeChairman of the Board of Directors Chief Executive Officer, Bentall Kennedy
John P. CaseChief Executive Officer
Kathleen R. Allen, Ph.D.Director, Center for Technology Commercialization, Marshall School of Business University of Southern California
A. Larry ChapmanRetired, Executive Vice President, Head of Commercial Real Estate, Wells Fargo Bank
Priya Cherian HuskinsPartner, Woodruff-Sawyer & Co.
Gregory T. McLaughlinPresident, PGA TOUR-Champions Tour
Ronald L. MerrimanRetired Vice Chair, KPMG LLP
Stephen E. SterrettRetired, Senior Executive Vice President, Chief Financial Officer, Simon Property Group, Inc.
Top row left to right: Gregory McLaughlin, Kathleen Allen, Ronald Merriman, Priya Cherian Huskins, Larry Chapman | Bottom row left to right: Michael McKee, John Case, Stephen Sterrett
ADDITIONAL OFFICERS
Robert J. IsraelSenior Vice President, Research
Elizabeth CateVice President, Portfolio Management
Benjamin N. FoxSenior Vice President,Asset and Portfolio Management
Dawn NguyenSenior Vice President, Portfolio Management
Theresa M. CaseyVice President, IT Enterprise Software
Janeen S. BedardVice President, Administration
Stephen D. BurchettVice President, Senior Legal Counsel
Shannon C. JensenVice President,Associate General Counseland Assistant Secretary
Sean P. NugentVice President,Controller
Clint SchmuckerVice President, Information Technology
Joel TomlinsonSenior Vice President, Acquisitions
Cary J. WenthurSenior Vice President, Acquisitions
Jill M. CossaboomAssociate Vice President, Assistant Controller
Kristin K. FerrellVice President, Head of Lease Administration
Teresa M. GlennAssociate Vice President,Human Resources and Operations
Scott A. KohnenVice President,Research
Jenette S. O’BrienVice President, Asset Management
Gregory M. LibbyAssociate Vice President, Property Management
Shannon KehleVice President, Human Resources
Lori SatterfieldVice President, Senior Legal Counsel
Ashley N. WellsVice President, Research
Kyle B. CampbellAssociate Vice President,Senior Legal Counsel, Risk Management
Jonathan PongVice President, Head of Capital Markets and Investor Relations
Ross EdwardsVice President, Corporate Leasing
T.J. ChunVice President, Investments
Nicole A. CarrAssociate Vice President, Director of Financial Reporting
John P. CaseChief Executive Officer
Sumit RoyPresident and Chief Operating Officer
Paul M. MeurerExecutive Vice President, Chief Financial Officer and Treasurer
Michael R. PfeifferExecutive Vice President, General Counsel and Secretary
Neil AbrahamExecutive Vice President, Chief Investment Officer
REALTY INCOME
NASDAQ COMPOSITE
EQUITY REIT INDEX
S&P 500
DOW JONES INDUSTRIAL AVERAGE
1.4%
2.8%
5.7%
13.0%
0.2%
TABLE OF CONTENTSHISTORICAL FINANCIAL PERFORMANCE 2LETTER TO SHAREHOLDERS 4HIGH-QUALITY PORTFOLIO 12DISCIPLINED INVESTMENT PROCESS 16CONSERVATIVE CAPITAL STRUCTURE 18MONTHLY DIVIDENDS 192015 ANNUAL REPORT: FORM 10-K 20COMPANY INFORMATION 89
2015 TOTAL SHAREHOLDER RETURN
STRONG PERFORMANCE

R E A L T Y I N C O M E 2 0 1 5 A N N U A L R E P O R T 1
6.6% AFFO PER SHARE GROWTH5 DIVIDEND INCREASES$1.26 BILLION OF ACQUISITIONS98.4% PORTFOLIO OCCUPANCY
2015 PERFORMANCE RESULTS
2 R E A L T Y I N C O M E 2 0 1 5 A N N U A L R E P O R T
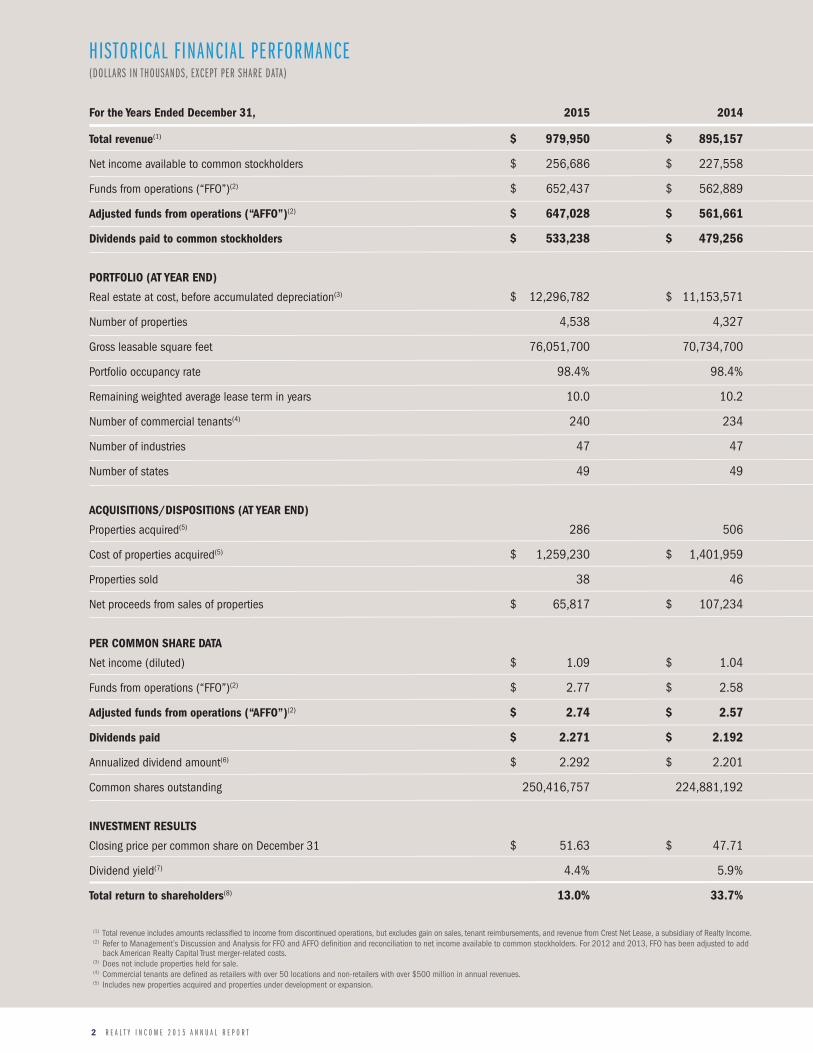
HISTORICAL FINANCIAL PERFORMANCE(DOLLARS IN THOUSANDS, EXCEPT PER SHARE DATA)
(1) Total revenue includes amounts reclassified to income from discontinued operations, but excludes gain on sales, tenant reimbursements, and revenue from Crest Net Lease, a subsidiary of Realty Income. (2) Refer to Management’s Discussion and Analysis for FFO and AFFO definition and reconciliation to net income available to common stockholders. For 2012 and 2013, FFO has been adjusted to add
back American Realty Capital Trust merger-related costs.(3) Does not include properties held for sale.(4) Commercial tenants are defined as retailers with over 50 locations and non-retailers with over $500 million in annual revenues.(5) Includes new properties acquired and properties under development or expansion.
For the Years Ended December 31, 2015 2014
Total revenue(1) $ 979,950 $ 895,157
Net income available to common stockholders $ 256,686 $ 227,558
Funds from operations (“FFO”)(2) $ 652,437 $ 562,889
Adjusted funds from operations (“AFFO”)(2) $ 647,028 $ 561,661
Dividends paid to common stockholders $ 533,238 $ 479,256
PORTFOLIO (AT YEAR END)
Real estate at cost, before accumulated depreciation(3) $ 12,296,782 $ 11,153,571
Number of properties 4,538 4,327
Gross leasable square feet 76,051,700 70,734,700
Portfolio occupancy rate 98.4% 98.4%
Remaining weighted average lease term in years 10.0 10.2
Number of commercial tenants(4) 240 234
Number of industries 47 47
Number of states 49 49
ACQUISITIONS/DISPOSITIONS (AT YEAR END)
Properties acquired(5) 286 506
Cost of properties acquired(5) $ 1,259,230 $ 1,401,959
Properties sold 38 46
Net proceeds from sales of properties $ 65,817 $ 107,234
PER COMMON SHARE DATA
Net income (diluted) $ 1.09 $ 1.04
Funds from operations (“FFO”)(2) $ 2.77 $ 2.58
Adjusted funds from operations (“AFFO”)(2) $ 2.74 $ 2.57
Dividends paid $ 2.271 $ 2.192
Annualized dividend amount(6) $ 2.292 $ 2.201
Common shares outstanding 250,416,757 224,881,192
INVESTMENT RESULTS
Closing price per common share on December 31 $ 51.63 $ 47.71
Dividend yield(7) 4.4% 5.9%
Total return to shareholders(8) 13.0% 33.7%

R E A L T Y I N C O M E 2 0 1 5 A N N U A L R E P O R T 3
(6) Annualized dividend amount reflects the December declared dividend rate per share multiplied by twelve.(7) Dividend yield was calculated by dividing the dividend paid per share, during the year, by the closing share price on December 31 of the preceding year.(8) Total return was calculated by dividing the net change in the share price during the year, plus the dividends paid per share during the year, by the closing share price on December 31 of the
preceding year.Information on the financial performance for all years since the company's public listing in 1994 is available on our website at www.realtyincome.com.
2013 2012 2011 2010
$ 759,798 $ 483,557 $ 421,644 $ 346,437
$ 203,634 $ 114,538 $ 132,779 $ 106,531
$ 462,030 $ 268,761 $ 249,392 $ 193,926
$ 463,139 $ 274,183 $ 253,372 $ 197,256
$ 409,222 $ 236,348 $ 219,297 $ 182,500
$ 9,899,475 $ 5,920,685 $ 4,971,981 $ 4,112,862
3,896 3,013 2,634 2,496
62,644,900 37,677,500 27,369,000 21,215,800
98.2% 97.2% 96.7% 96.6%
10.8 11.0 11.3 11.4
205 150 136 122
47 44 38 32
49 49 49 49
958 423 164 186
$ 4,670,169 $ 1,164,924 $ 1,016,100 $ 713,534
75 44 26 28
$ 134,150 $ 50,586 $ 24,126 $ 27,181
$ 1.06 $ 0.86 $ 1.05 $ 1.01
$ 2.41 $ 2.02 $ 1.98 $ 1.83
$ 2.41 $ 2.06 $ 2.01 $ 1.86
$ 2.147 $ 1.772 $ 1.737 $ 1.722
$ 2.186 $ 1.821 $ 1.746 $ 1.731
207,485,073 133,452,411 133,223,338 118,058,988
$ 37.33 $ 40.21 $ 34.96 $ 34.20
5.3% 5.1% 5.1% 6.6%
-1.8% 20.1% 7.3% 38.6%

4 R E A L T Y I N C O M E 2 0 1 5 A N N U A L R E P O R T
We pride ourselves on the consistency of our performance
and are pleased to have received market recognition for
this in 2015 when our company was added to the exclusive
S&P High Yield Dividend Aristocrats® index. This index
includes companies in the S&P Composite 1500® that have
consistently increased their dividend every year for at least
20 years. For perspective, the index currently consists of 108
constituents and Realty Income is one of only six REITs to be
included in the index.
In April 2015, our company was added to the S&P 500 index,
a milestone that places us among the premier, large-cap,
publicly-traded companies. We are honored by this recognition
and to be one of just 26 REITs and the only net lease REIT
included in the index.
Inclusion in these indices is meaningful for many reasons,
most significant of which is the increased investor awareness it
brings to our company. We have added many new shareholders
and are pleased to have them join as fellow owners of The
Monthly Dividend Company®.
DEAR FELLOW SHAREHOLDERS,2015 represented a year of success and growth for our company, adding yet another
year to our long history of positive operating performance. I would like to thank our
dedicated team members who have worked diligently to continue generating value
for our shareholders. This “value” is created by consistently growing revenue, earnings,
and of course, increasing the monthly dividend.
TOTAL REVENUE(1)
FOR THE YEARS (DOLLARS IN MILLIONS)
AFFO PER COMMON SHAREFOR THE YEARS
(1) Total revenue includes amounts reclassified to income from discontinued operations, but excludes gain on sales, tenant reimbursements, and revenue from Crest Net Lease, a subsidiary of Realty Income.
2015 $980.0
$895.2
$759.8
$483.6
$421.6
2014
2013
2012
2011
$346.42010
2015 $2.74
$2.57
$2.41
$2.06
2014
2013
2012
$2.012011
$1.862010

R E A L T Y I N C O M E 2 0 1 5 A N N U A L R E P O R T 5
MISSIONThe consistency of the company’s performance is a reflection of
the steadfast commitment we have to our mission. Even though
market opportunities and conditions change from year to year,
we remain dedicated to our mission which is to manage our
real estate portfolio in a manner that supports providing our
shareholders with monthly dividends that increase over time.
This is the same mission that has guided us throughout our
47-year operating history and one that consistently positions
us for favorable results.
Achieving our mission involves effectively executing our
business plan. That plan is to:
Pay 12 monthly dividends
Raise the dividend
Remain disciplined in our acquisitions underwriting
approach
Acquire additional properties according to our selective
investment strategy
Maintain high occupancy through active portfolio and
asset management
Maintain a conservative balance sheet
Continue to grow investor interest in The Monthly Dividend
Company®
We are pleased to report that during 2015 we successfully
executed on all aspects of this plan. Total revenue grew
by 9.5% to $980 million which drove earnings per share
growth of 6.6% to $2.74, as measured by Adjusted Funds
from Operations (AFFO). We paid 12 monthly dividends
and increased the dividend five times in 2015, and again
in February 2016, achieving a 5% increase in the dividend
compared to the same time a year earlier. We accomplished
these results by completing our third-largest amount of
property acquisitions in the company’s history, maintaining
consistently high portfolio occupancy, and successfully
accessing the public capital markets on favorable terms to
position our balance sheet well for future growth.
SHAREHOLDER RETURNOur main focus is to provide monthly dividends to our
shareholders that help drive total shareholder return. In 2015,
our shareholders who owned our common stock for the full
calendar year realized a total return of 13%, which captures
the 8% increase in our stock price and the dividends we paid
during the year. Our company’s results compare favorably on
a relative basis to the returns of the broader market indices.
When compared to the more than 150 publicly-traded equity
REITs in the United States, our total shareholder return placed
us in the top 20th percentile.
ANNUALIZED DIVIDENDS(1) AND DIVIDEND INCREASES83 Dividend increases since 1994 NYSE listing73 Consecutive quarterly increasesCompound average annual growth rate of 4.5%Dividends paid for 47 years = over $3.8 billion
(1) Annualized dividend amount reflects the December declared dividend rate per share multiplied by 12.
$0.9
0
94
$0.9
3
95
$0.9
45
96
$0.9
6
97
$1.0
2
98
$1.0
8
99
$1.1
1
00
$1.1
4
01
$1.1
7
02
$1.2
0
03
$1.3
2
04
$1.3
95
05
$1.5
18
06
$1.6
41
07
$1.7
01
08
$1.7
16
09
$1.7
31
10
$1.7
46
11
$1.8
21
12
$2.1
86
13
$2.2
01
14
$2.2
92
15
6 R E A L T Y I N C O M E 2 0 1 5 A N N U A L R E P O R T
We always like to remind our shareholders that our company’s
total return results do not always move in parallel with its
operating performance in any given year. Other factors beyond
our operating performance can impact the price of our shares
including, but not limited to, macroeconomic events, interest
rate trends, and conditions in the broader stock market.
Over the long term, however, our positive and consistent
operating performance has led to advances in our stock price
and dividends, resulting in a compound average annual total
shareholder return of 17% since our public
listing in 1994, as shown in the table on
the next page. We are proud of this result
and our goal is to continue advancing the
company in a manner to support sustainable
value creation for our shareholders.
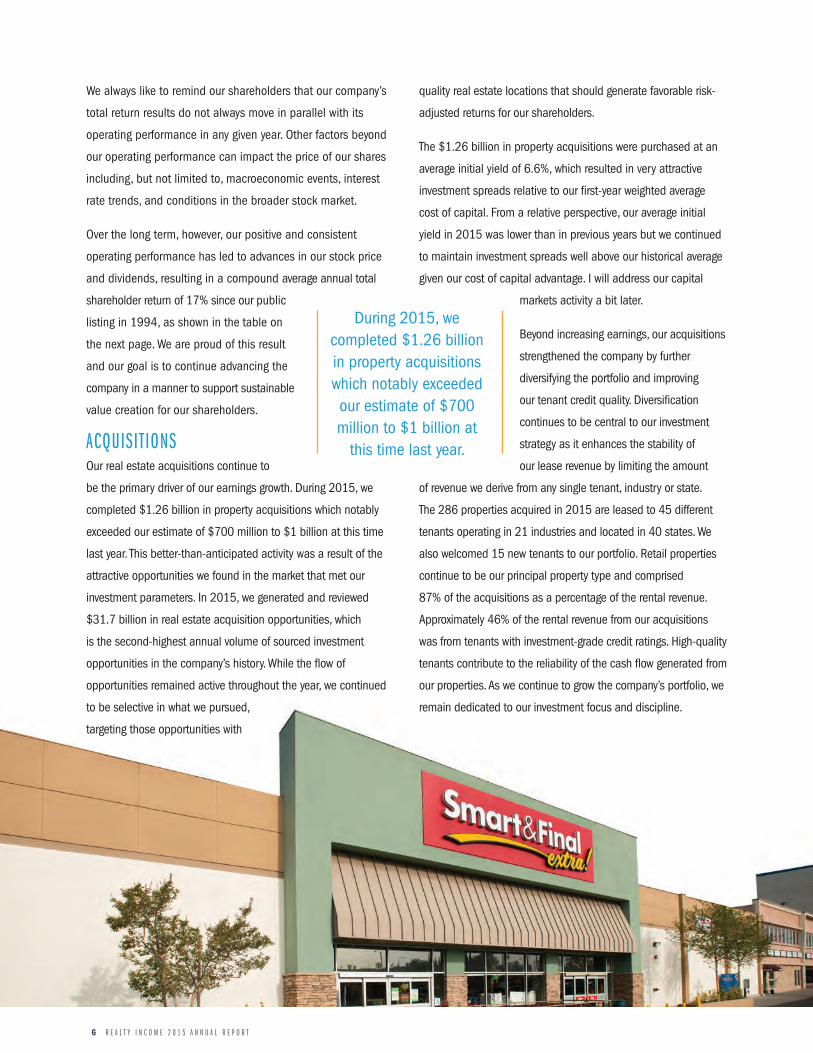
ACQUISIT IONSOur real estate acquisitions continue to
be the primary driver of our earnings growth. During 2015, we
completed $1.26 billion in property acquisitions which notably
exceeded our estimate of $700 million to $1 billion at this time
last year. This better-than-anticipated activity was a result of the
attractive opportunities we found in the market that met our
investment parameters. In 2015, we generated and reviewed
$31.7 billion in real estate acquisition opportunities, which
is the second-highest annual volume of sourced investment
opportunities in the company’s history. While the flow of
opportunities remained active throughout the year, we continued
to be selective in what we pursued,
targeting those opportunities with
quality real estate locations that should generate favorable risk-
adjusted returns for our shareholders.
The $1.26 billion in property acquisitions were purchased at an
average initial yield of 6.6%, which resulted in very attractive
investment spreads relative to our first-year weighted average
cost of capital. From a relative perspective, our average initial
yield in 2015 was lower than in previous years but we continued
to maintain investment spreads well above our historical average
given our cost of capital advantage. I will address our capital
markets activity a bit later.
Beyond increasing earnings, our acquisitions
strengthened the company by further
diversifying the portfolio and improving
our tenant credit quality. Diversification
continues to be central to our investment
strategy as it enhances the stability of
our lease revenue by limiting the amount
of revenue we derive from any single tenant, industry or state.
The 286 properties acquired in 2015 are leased to 45 different
tenants operating in 21 industries and located in 40 states. We
also welcomed 15 new tenants to our portfolio. Retail properties
continue to be our principal property type and comprised
87% of the acquisitions as a percentage of the rental revenue.
Approximately 46% of the rental revenue from our acquisitions
was from tenants with investment-grade credit ratings. High-quality
tenants contribute to the reliability of the cash flow generated from
our properties. As we continue to grow the company’s portfolio, we
remain dedicated to our investment focus and discipline.
During 2015, we completed $1.26 billion in property acquisitions which notably exceeded our estimate of $700 million to $1 billion at
this time last year.

R E A L T Y I N C O M E 2 0 1 5 A N N U A L R E P O R T 7
Note: All of these dividend yields are calculated as annualized dividends based on the last dividend paid in the applicable time period divided by the closing price as of period end. Dividend yield sources: NAREIT website and Bloomberg, except for the 1994 NASDAQ dividend yield, which was sourced from Datastream / Thomson Financial. (1) FTSE NAREIT US Equity REIT Index, as per NAREIT website. (2) Calculated as the difference between the closing stock price as of period end less the closing stock price as of previous period, plus dividends paid in
period, divided by closing stock price as of end of previous period. Does not include reinvestment of dividends for the annual percentages. (3) Includes reinvestment of dividends. Source: NAREIT website and Factset. (4) Price only index, does not include dividends. Source: Factset. (5) All of these Compound Average Annual Total Return rates are calculated in the same manner: from Realty Income's NYSE listing on October 18, 1994
through December 31, 2015, and (except for NASDAQ) assuming reinvestment of dividends. Past performance does not guarantee future performance. Realty Income presents this data for informational purposes only and makes no representation about its future performance or how it will compare in performance to other indices in the future.
REALTY INCOME PERFORMANCE VS. MAJOR STOCK INDICES
REALTY INCOME
EQUITY REIT INDEX(1)
DOW JONES INDUSTRIAL
AVERAGE S&P 500NASDAQ
COMPOSITE
DIVIDEND YIELD
TOTAL RETURN (2)
DIVIDEND Y IELD
TOTAL RETURN (3)
DIVIDEND YIELD
TOTAL RETURN (3)
DIVIDEND YIELD
TOTAL RETURN (3)
DIVIDEND YIELD
TOTAL RETURN (4)
10/18–12/31
1994 10.5% 10.8% 7.7% 0.0% 2.9% (1.6%) 2.9% (1.2%) 0.5% (1.7%)
1995 8.3% 42.0% 7.4% 15.3% 2.4% 36.9% 2.3% 37.6% 0.6% 39.9%
1996 7.9% 15.4% 6.1% 35.3% 2.2% 28.9% 2.0% 23.0% 0.2% 22.7%
1997 7.5% 14.5% 5.5% 20.3% 1.8% 24.9% 1.6% 33.4% 0.5% 21.6%
1998 8.2% 5.5% 7.5% (17.5%) 1.7% 18.1% 1.3% 28.6% 0.3% 39.6%
1999 10.5% (8.7%) 8.7% (4.6%) 1.3% 27.2% 1.1% 21.0% 0.2% 85.6%
2000 8.9% 31.2% 7.5% 26.4% 1.5% (4.7%) 1.2% (9.1%) 0.3% (39.3%)
2001 7.8% 27.2% 7.1% 13.9% 1.9% (5.5%) 1.4% (11.9%) 0.3% (21.1%)
2002 6.7% 26.9% 7.1% 3.8% 2.6% (15.0%) 1.9% (22.1%) 0.5% (31.5%)
2003 6.0% 21.0% 5.5% 37.1% 2.3% 28.3% 1.8% 28.7% 0.6% 50.0%
2004 5.2% 32.7% 4.7% 31.6% 2.2% 5.6% 1.8% 10.9% 0.6% 8.6%
2005 6.5% (9.2%) 4.6% 12.2% 2.6% 1.7% 1.9% 4.9% 0.9% 1.4%
2006 5.5% 34.8% 3.7% 35.1% 2.5% 19.0% 1.9% 15.8% 0.8% 9.5%
2007 6.1% 3.2% 4.9% (15.7%) 2.7% 8.8% 2.1% 5.5% 0.8% 9.8%
2008 7.3% (8.2%) 7.6% (37.7%) 3.6% (31.8%) 3.2% (37.0%) 1.3% (40.5%)
2009 6.6% 19.3% 3.7% 28.0% 2.6% 22.6% 2.0% 26.5% 1.0% 43.9%
2010 5.1% 38.6% 3.5% 27.9% 2.6% 14.0% 1.9% 15.1% 1.2% 16.9%
2011 5.0% 7.3% 3.8% 8.3% 2.8% 8.3% 2.3% 2.1% 1.3% (1.8%)
2012 4.5% 20.1% 3.5% 19.7% 3.0% 10.2% 2.5% 16.0% 2.6% 15.9%
2013 5.8% (1.8%) 3.9% 2.9% 2.3% 29.6% 2.0% 32.4% 1.4% 38.3%
2014 4.6% 33.7% 3.6% 28.0% 2.3% 10.0% 2.0% 13.7% 1.3% 13.4%
2015 4.4% 13.0% 3.9% 2.8% 2.6% 0.2% 2.2% 1.4% 1.4% 5.7%
COMPOUND AVERAGE
ANNUAL TOTAL RETURN(5) 17.0% 11.0% 9.8% 9.3% 9.3%

8 R E A L T Y I N C O M E 2 0 1 5 A N N U A L R E P O R T
PORTFOLIO AND ASSET MANAGEMENTWe experienced a very active and successful year in 2015 with
our property portfolio management activities. Our portfolio of
4,538 properties performed well with high occupancy, positive
re-leasing results, and the strategic sale of non-core assets.
We ended 2015 with occupancy of 98.4% which continues to
remain at a high level. We maintained our high occupancy while
experiencing our most active year ever for lease expirations. We
re-leased 253 properties with leases expiring throughout the
year, surpassing our prior record of 203 properties in 2014.
We re-leased these properties to either existing or new tenants,
achieving rental rates that were 101% of the expiring rent. We
are gratified to not only retain but grow the cash flow generated
from our properties that came full cycle. Our 2015 results
are a testament to our effective underwriting approach that
has enabled us to selectively acquire properties that produce
favorable long-term, risk-adjusted returns.
We also enhance the value of our real estate portfolio through
our asset management efforts. We continue to selectively sell
properties in our portfolio that no longer meet our investment
criteria. In 2015, we sold 38 properties for $65.8 million and
realized attractive returns on these investments. Additionally,
we looked for opportunities in the existing portfolio to further
increase the returns on our assets. For example, we completed
building expansion and development opportunities and
partnered with our tenants on environmental initiatives to
generate incremental revenue from our properties. These
activities collectively helped to maximize the cash flow from
our existing portfolio and thus the value generated for our
shareholders.
CAPITAL MARKETS ACTIVITYWe continue to enjoy access to attractively priced capital to
fund our business activities. In 2015, we took advantage of the
strength in our stock price and the favorable demand for our
shares to raise $1.2 billion in common equity capital, which
accounted for over 80% of the overall capital we raised during
the year. This further strengthened our balance sheet as we
entered 2016. At the beginning of this year, our balance sheet
was the healthiest it has been in more than 10 years. Common
equity represented 71% of our total market capitalization and
our fixed charge coverage ratio was 4.0x. While these levels
will fluctuate from year to year, we remain committed to our
conservative capital structure and intend to fund our balance
sheet with approximately two-thirds equity and one-third long-
term, fixed-rate debt. We believe this is a proven and prudent
way to manage our business, balancing the appeal of attractive
investment spreads while limiting financing risk.
During 2015, we also recast and expanded our credit facility to
further enhance our liquidity and reduce borrowing costs. We
now maintain a $2.0 billion credit facility which offers additional
financial flexibility as we continue to grow our company.
RESOURCESI continue to be impressed by the depth and breadth of
talent at our company. This past year we announced several
PORTFOLIO OCCUPANCY AT THE END OF EACH YEAR(1)
(1) Calculated by number of properties.
99.3
%
99.1
%
99.2
%
99.5
%
98.4
%
97.7
%
98.2
%
97.7
%
98.1
%
97.9
%
98.5
%
98.7
%
97.9
%
97.0
%
96.8
%
96.6
%
96.7
%
1110
98.4
%
15090807060504030201009998979695
99.4
%
94
97.2
%
12
98.2
%
13
98.4
%
14

R E A L T Y I N C O M E 2 0 1 5 A N N U A L R E P O R T 9
internal promotions, including the naming of Sumit Roy as
President. These promotions advanced high-performing and
deserving team members into broader leadership roles, which
have enabled them to have a greater impact on our company.
We also made some structural changes to the organization
to remain prepared for continued growth and to ensure the
company is organized to efficiently manage a larger business
and more active portfolio. Our team has embraced these
changes with agility and dedication,
which has made for a seamless
transition as we continue to operate
our business.
We have made similar structural
changes periodically throughout our
47-year operating history as the
company has evolved. Our goal is
always to maximize our operational
efficiency by ensuring that we have
the right people, processes, and systems in place. In 2015, our
general and administrative expense as a percentage of revenue
was 5%, the lowest in our history and the lowest amongst our
peers in the net lease sector. We continue to capitalize on the
scalability of our business platform, delivering the highest
percentage of our revenue to our earnings of any publicly-
traded net lease company.
An extension of our mission as The Monthly Dividend
Company® is to take an active role in the betterment of our
community. As part of our Corporate Responsibility Program,
this past year we devoted 600 employee volunteer hours to
charitable organizations, which included partnering with San
Diego Habitat for Humanity. Our team members helped paint,
landscape, and install roofing for several local homes. We also
made a corporate donation to the organization and families
occupying the homes. We have had a
significant presence in San Diego County
since our founding in 1969 and we
believe it is important for us to continue
to impact our local community positively
as a responsible corporate citizen.
EARNINGS AND DIVIDENDSOur activities collectively contributed
to our healthy 2015 earnings growth.
We continued to grow our AFFO, or the
cash earnings available to pay the dividend, while remaining
committed to our conservative balance sheet structure. In
2015, we grew our AFFO per share by 6.6% to $2.74, which
exceeds our 21-year average annual percentage growth.
This growth allowed us to increase the dividend five times
throughout the year, and again in February 2016, growing
the dividend by 5% as compared to February 2015. We are
As part of our Corporate Responsibility Program, this past year we devoted 600 employee volunteer hours to charitable organizations, which included partnering
with San Diego Habitat for Humanity.

1 0 R E A L T Y I N C O M E 2 0 1 5 A N N U A L R E P O R T
pleased that the continued strength in our operations allowed
us to increase the dividend, while maintaining a conservative
payout ratio of approximately 83%, which provides a
comfortable margin of safety.
MACROECONOMIC ENVIRONMENT AND OUR POSITIONAs I write this letter, we continue
to operate in a domestic economy
characterized by low interest rates with
modest consumer spending growth amid
decreasing unemployment and moderate
gross domestic product growth. However,
when looking at the environment more
broadly, we are seeing a strained global economy with falling
commodity prices and volatile financial markets. While we
cannot control the macroeconomic factors, or predict how
they might change in the future, we believe we have created a
conservatively capitalized real estate portfolio that should, by
design, perform in virtually any economic environment.
Over our 47-year operating history, we have taken deliberate
steps to position our portfolio to be diversified by tenant,
industry, geography, and to a certain extent, property type,
which enhances the stability of our revenue. Our tenant credit
profile remains strong, with 44% of our rental revenue today
derived from investment-grade rated tenants.
We have conservatively underwritten non-
investment-grade retail tenants who have
demonstrated their resilience throughout varying
economic environments in our company’s history.
Also, over 90% of our rental revenue from our retail properties
is generated from tenants with a service, non-discretionary,
and/or low price point component to their business. We
believe these characteristics better position our tenants to
operate in a variety of economic environments and to compete
effectively with e-commerce. Additionally,
our tenant base is largely insulated from
the aforementioned global macroeconomic
trends as their businesses are primarily
domestically focused. Our track record of
maintaining high occupancy, which has
never been below 96% in our company’s
history, demonstrates the overall health of
our tenant base and the reliability of our revenue that supports
the monthly dividend.
OUTLOOKAs our company enters 2016, we remain positive regarding our
business outlook. During the first quarter of 2016, our share
price closed at an all-time high of $62.11 helping drive our
total market capitalization to more than $20 billion for the first
time in our history. Our total shareholder return year to date
places us in the top 5% of the entire REIT sector in terms of
performance.
We are excited about our growth prospects as we continue to
source a high volume of attractive acquisition opportunities
and remain disciplined and selective in our underwriting
approach. We anticipate completing approximately
$750 million in acquisitions in 2016 at attractive
investment spreads and consistent with our
We believe we have created a conservatively capitalized
real estate portfolio that should, by design, perform in virtually any economic
environment.

R E A L T Y I N C O M E 2 0 1 5 A N N U A L R E P O R T 1 1
investment strategy. At the beginning of 2016, we are realizing
investment spreads at record highs and favorable risk-adjusted
returns. To fund our acquisition activities, we currently have
approximately $1.6 billion available on our $2 billion credit
facility and we continue to have excellent access to long-term
and permanent capital.
Our existing portfolio remains healthy with an average
remaining lease term of 10 years. We expect occupancy in
2016 to remain around 98%, with same store rent growing
by approximately 1.3%, consistent with our 2015 results.
We remain committed to our efforts to maximize the revenue
generated from our real estate properties through our portfolio
and asset management activities. These factors collectively
contribute to what we believe will be another year of favorable
operating results for the company.
CONCLUSIONWe are proud of our accomplishments in 2015. We had
another successful year of operating performance that led
to significant earnings and dividend growth. Our inclusion in
the S&P 500 index and our addition to the S&P High Yield
Dividend Aristocrats® index were milestones recognizing our
long history of success.
As we move into 2016 and beyond, we will operate the
company with the same disciplined approach in managing our
business to generate value for our shareholders. We believe
this value is a result of our dedication to the dividend. Our
mission as The Monthly Dividend Company® is to provide
our shareholders with dependable monthly dividends that
increase over time. This mission has served us well throughout
our 47-year operating history, and will continue to guide the
types of properties we acquire, tenants and industries we
pursue, capital we raise, and talents required of our team.
The dividend is integral to our culture, and as your CEO, I am
committed to continuing to execute our business plan to grow
your dividend responsibly.
While we remain confident in our ability to operate the
company in a manner that supports our mission, we cannot
guarantee that we will be as successful in 2016 as we have
been in the past. Therefore, we always remind our shareholders
how important it is to rely on Realty Income for only a portion
of their income needs. We thank you for your continued support
of our company and will keep you apprised of our progress
throughout the year.
Sincerely,
John P. Case
Chief Executive Officer
COMPARISON OF $100 INVESTED IN REALTY INCOME IN 1994 VS. MAJOR STOCK INDICES
94 95 96 97 98 99 00 01 02 03 04 05 06 07 08 09 10 11 1312
$2,600
$2,100
$1,600
$1,100
$600
$100
$2,253
$911$735$665$665
14 15
REALTY INCOME
EQUITY REIT INDEX
DOW JONES INDUSTRIAL AVERAGE
STANDARD & POORS 500
NASDAQ COMPOSITE

1 2 R E A L T Y I N C O M E 2 0 1 5 A N N U A L R E P O R T
H IGH-QUALITYPORTFOLIOOur real estate portfolio consists of 4,538 freestanding, commercial
properties that are diversified by tenant, industry, geography, and to a
certain extent, property type. At the end of 2015, the properties were
leased to 240 commercial tenants operating across 47 industries and
located in 49 states and Puerto Rico. The majority of our properties
continue to be retail, with the largest component outside of retail
being industrial properties, representing 12.8% of rental revenue. Our
tenant base continues to be healthy, with approximately 44% of our
annualized rental revenue generated from properties leased to tenants
with investment-grade credit ratings. Maintaining a diversified portfolio
leased to strong tenants helps ensure the stability of our revenue that
supports the payment of monthly dividends.
The strength of our portfolio is further enhanced by the experience of
our portfolio and asset management teams in maximizing the revenue
generated from our properties. As one of the most seasoned net lease
companies, we have re-leased or sold over 2,000 properties with
expiring leases throughout our history as a public company. This is
unprecedented and through our active re-leasing and selective property
sales, we have achieved stable occupancy that has never been below
96% in our company’s history.
TENANT DIVERSIFICATION – TOP 20 TENANTS
TENANTNUMBER OF PROPERTIES
% OF REVENUE(1)
GPM Investments / Fas Mart 217 2.1%Rite Aid 68 2.0%Northern Tier Retail / SuperAmerica 134 2.0%Life Time Fitness 9 2.0%CVS Pharmacy* 56 1.9%TBC Corporation* 149 1.7%Walmart / Sam's Club* 19 1.3%NPC International 202 1.3%FreedomRoads / Camping World 18 1.2%Smart & Final 36 1.1%
TENANTNUMBER OF PROPERTIES
% OF REVENUE(1)
Walgreens* 176 6.9%FedEx* 39 5.2%Dollar General* 524 4.6%LA Fitness 46 4.2%Dollar Tree / Family Dollar 457 4.2%Circle K / The Pantry* 302 3.0%AMC Theatres 20 2.7%BJ's Wholesale Clubs 15 2.6%Diageo* 17 2.4%Regal Cinemas 23 2.1%*Investment-grade rated or subsidiaries of investment-grade rated companies.(1) Based on annualized rental revenue as of 12/31/15.

R E A L T Y I N C O M E 2 0 1 5 A N N U A L R E P O R T 1 3
PROPERTY TYPE COMPOSITION
NUMBER OF PROPERTIES
% OF REVENUE(1)
Retail 4,378 79.0%
Industrial 101 12.8%
Office 44 6.1%
Agriculture 15 2.1%
(1) Based on rental revenue for the quarter ended 12/31/15.

1 4 R E A L T Y I N C O M E 2 0 1 5 A N N U A L R E P O R T
INDUSTRY DIVERSIFICATIONINDUSTRY % OF REVENUE(1)
Drug stores 10.9%
Convenience stores 8.8%
Dollar stores 8.8%
Health & fitness 8.4%
Transportation services 5.6%
Theaters 5.0%
Restaurants - quick service 4.5%
Restaurants - casual 3.7%
Wholesale clubs 3.7%
Grocery stores 2.8%
HIGH-QUALITY PORTFOLIO
INDUSTRIESNO INDUSTRY REPRESENTS MORE THAN 11% OF RENTAL REVENUE47
(1) Based on rental revenue for the quarter ended 12/31/15.

R E A L T Y I N C O M E 2 0 1 5 A N N U A L R E P O R T 1 5
PROPERTIES
GEOGRAPHIC DIVERSIFICATION
9.8
<1
<1
1.1
<1
<1
<1
<1
2.5<1
9.1
1.6
1.61.6
<1<1
3.31.4
5.3 5.4
1.6 1.6 4.1
5.8
<1
1.11.6
3.4
<1
<1
1.2
<1<1
1.8
2.73.0
1.5
2.8
2.3
3.0
2.9
4.9
<1 <1
1.4
<1
1.0
1.7
<1
1.8
% Represents percentage of rental revenue for the quarter ended 12/31/15.
LOCATED IN 49 STATES AND PUERTO RICO4,538

1 6 R E A L T Y I N C O M E 2 0 1 5 A N N U A L R E P O R T
D ISCIPLINED INVESTMENT PROCESSWe focus on acquiring freestanding, single-tenant commercial
properties leased to high-quality tenants under long-term
net lease agreements, typically in excess of 10 years. During
2015, we reviewed $31.7 billion of investment opportunities
that generally satisfied one or more of these criteria. These
opportunities went through a rigorous, multi-step internal
underwriting process that resulted in $1.26 billion acquired.
The process begins with a review of the real estate. We target
real estate located in significant markets or strategic locations
critical to generating revenue for the tenant. We examine the
property-level attributes such as access and visibility, the
demographic trends relative to the property’s intended use, and
the overall viability of the market.
In addition to the real estate, we also carefully review the
characteristics and financial strength of the tenant and its
industry. Our team of research professionals conducts a
thorough financial review and analysis of the tenant, which
includes an assessment of the store-level performance of the
retail operations to ensure we own the tenant’s high-performing
locations. Our team stays abreast of trends in the various
industries relative to the economic environment and frequently
meets with management representatives in these industries to
better understand the tenant's operations.
HIGHLY SELECTIVE
PROPERTIESWORTH $31.7 BILLION WERE
REVIEWED
PROPERTIESWORTH $1.26 BILLION WERE
ACQUIRED
5,858
286

R E A L T Y I N C O M E 2 0 1 5 A N N U A L R E P O R T 1 7
ACQUISIT IONS SELECTIVITYFOR THE YEARS (DOLLARS IN BILLIONS)
The information gathered on the real estate, tenant, and
industry determines the appropriate price for an investment.
Our cost of capital remains the lowest in the net lease sector,
so we have the advantage of achieving the widest investment
spreads while offering competitive pricing for particular
properties. We also ensure the real estate is appropriately
priced relative to replacement cost and leased at rental
rates that are in line with market rent in order to support the
long-term returns generated by each asset. Our Investment
Committee, comprised of select senior-level executives,
collectively reviews these characteristics and metrics to
decide which properties to acquire.
AMOUNT SOURCED
AMOUNT ACQUIRED SELECTIVITY(1)
2010 $5.7 $0.7 12%
2011 $13.3 $1.0 8%
2012 $17.0 $1.2 7%
2013 $39.4 $4.7 12%
2014 $24.3 $1.4 6%
2015 $31.7 $1.3 4%
(1) Selectivity is calculated as the amount of acquisitions acquired divided by the amount of acquisitions sourced.
As we continue to grow the company’s portfolio, we remain dedicated to our
investment focus and discipline.

1 8 R E A L T Y I N C O M E 2 0 1 5 A N N U A L R E P O R T
CONSERVATIVE CAPITAL STRUCTUREOur commitment to the dividend is demonstrated by the way
we manage our balance sheet. We believe it is important to
maintain a conservative capital structure that is primarily
equity-focused in order to protect the dividend. At the end of
2015, our total market capitalization was $18.2 billion, of
which $13.0 billion or 71% was common equity.
When we use debt to fund our growth, we structure it in a
conservative manner. Over the life of the company, 91.5% of
the bonds we have issued have been for terms of 10 years
or longer and 100% of our outstanding bonds are fixed-rate.
Our debt-to-EBITDA ratio was at a healthy 5.1x at the end
of 2015. We maintain a $2.0 billion line of credit, which
provides us flexibility to close on acquisitions quickly and
then opportunistically raise equity and/or long-term debt
when capital market dynamics are most advantageous to us.
Our investment-grade credit ratings of Baa1/BBB+/BBB+
(Moody’s/S&P/Fitch) continue to provide us with a low cost
of unsecured debt.
2015 2014 2013 2012 2011 2010 2009 2008 2007 2006 2005
Debt and Preferred to Total Market Capitalization 29% 33% 38% 40% 34% 33% 39% 42% 40% 31% 36%
Fixed Charge Coverage Ratio 4.0x 3.4x 3.0x 2.7x 2.9x 2.7x 2.7x 2.6x 3.1x 3.4x 3.6x
At the beginning of 2016, our balance sheet was the healthiest it has been in more than 10 years.

R E A L T Y I N C O M E 2 0 1 5 A N N U A L R E P O R T 1 9
MONTHLY DIVIDENDSAs The Monthly Dividend Company®, we remain committed to operating
our company in a manner that provides our shareholders with monthly
dividends that increase over time. At the core of every business decision
we make is the focus on protecting and growing the dividend. Our
commitment is evidenced by our track record of dividend performance.
Since our company’s listing on the NYSE in 1994, we have increased the
dividend every year at a compound average annual growth rate of 4.5%.
As a result of regular dividend increases, our shareholders’ current yield
on cost has grown over time. Many of our long-term shareholders have
received the equivalent of their original investment dollars in the form of
growing cash dividends.
To quantify the benefit to our shareholders of what we often refer to as
the “magic” of rising dividends over time, we consider a shareholder’s
investment in 1,000 Realty Income shares 10 years ago. As a result of the
dividends received and the dividend increases on these shares over time,
the shareholder’s yield on cost grows. Today, that shareholder would receive:
Our mission as The Monthly Dividend Company® is to
provide our shareholders with dependable monthly dividends
that increase over time.
DIVIDEND YIELD ON THE ORIGINAL INVESTMENT
(VS. ORIGINAL YIELD OF 6.5%)
10.6%OF THE ORIGINAL INVESTMENT
RETURNED TO THE SHAREHOLDER THROUGH DIVIDENDS
84.2%INCREASE IN THE AMOUNT OF
ANNUAL DIVIDENDS PAID TO THE SHAREHOLDER
64.3%

2 0 R E A L T Y I N C O M E 2 0 1 5 A N N U A L R E P O R T
2015 ANNUAL REPORT: FORM 10-K
Certain exhibits and schedules to the Form 10-K are not reproduced here, but can be
provided to you upon request or obtained from our website at www.realtyincome.com.
The Form 10-K includes the section 302 certifications filed with the SEC.
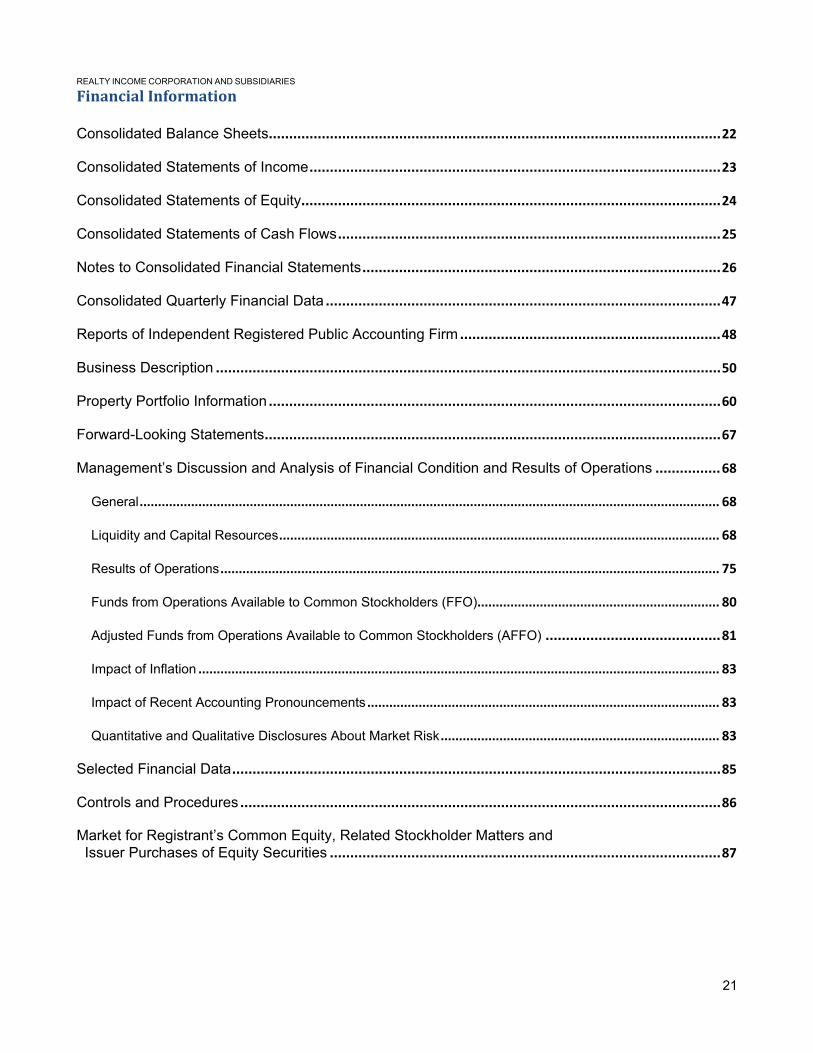
REALTY INCOME CORPORATION AND SUBSIDIARIES
Financial Information Consolidated Balance Sheets ............................................................................................................... 22
Consolidated Statements of Income ..................................................................................................... 23
Consolidated Statements of Equity ....................................................................................................... 24
Consolidated Statements of Cash Flows .............................................................................................. 25
Notes to Consolidated Financial Statements ........................................................................................ 26
Consolidated Quarterly Financial Data ................................................................................................. 47
Reports of Independent Registered Public Accounting Firm ................................................................ 48
Business Description ............................................................................................................................ 50
Property Portfolio Information ............................................................................................................... 60
Forward-Looking Statements ................................................................................................................ 67
Management’s Discussion and Analysis of Financial Condition and Results of Operations ................ 68
General .............................................................................................................................................................. 68
Liquidity and Capital Resources ........................................................................................................................ 68
Results of Operations ........................................................................................................................................ 75
Funds from Operations Available to Common Stockholders (FFO) .................................................................. 80
Adjusted Funds from Operations Available to Common Stockholders (AFFO) ........................................... 81
Impact of Inflation .............................................................................................................................................. 83
Impact of Recent Accounting Pronouncements ................................................................................................ 83
Quantitative and Qualitative Disclosures About Market Risk ............................................................................ 83
Selected Financial Data ........................................................................................................................ 85
Controls and Procedures ...................................................................................................................... 86
Market for Registrant’s Common Equity, Related Stockholder Matters and Issuer Purchases of Equity Securities ................................................................................................ 87
21

REALTY INCOME CORPORATION AND SUBSIDIARIES
Consolidated Balance Sheets At December 31, 2015 and 2014 (DOLLARS IN THOUSANDS, EXCEPT PER SHARE DATA) 2015 2014 ASSETS Real estate, at cost:
Land $ 3,286,004 $ 3,046,372 Buildings and improvements 9,010,778 8,107,199 Total real estate, at cost 12,296,782 11,153,571 Less accumulated depreciation and amortization (1,687,665 ) (1,386,871 ) Net real estate held for investment 10,609,117 9,766,700 Real estate held for sale, net 9,767 14,840
Net real estate 10,618,884 9,781,540 Cash and cash equivalents 40,294 3,852 Accounts receivable, net 81,678 64,386 Acquired lease intangible assets, net 1,034,417 1,039,724 Goodwill 15,321 15,470 Other assets, net 75,276 107,650
Total assets $ 11,865,870 $ 11,012,622 LIABILITIES AND EQUITY Distributions payable $ 50,344 $ 43,675 Accounts payable and accrued expenses 115,826 123,287 Acquired lease intangible liabilities, net 250,916 220,469 Other liabilities 53,965 53,145 Lines of credit payable 238,000 223,000 Term loans 320,000 70,000 Mortgages payable, net 646,740 852,575 Notes payable, net 3,636,746 3,785,372
Total liabilities 5,312,537 5,371,523 Commitments and contingencies Stockholders' equity: Preferred stock and paid in capital, par value $0.01 per share,
69,900,000 shares authorized, 16,350,000 shares issued and outstanding as of December 31, 2015 and December 31, 2014, liquidation preference $25.00 per share 395,378 395,378
Common stock and paid in capital, par value $0.01 per share, 370,100,000 shares authorized, 250,416,757 shares issued and outstanding as of December 31, 2015 and 224,881,192 shares issued and outstanding as of December 31, 2014 7,666,428 6,464,987
Distributions in excess of net income (1,530,210 ) (1,246,964 ) Total stockholders' equity 6,531,596 5,613,401
Noncontrolling interests 21,737 27,698 Total equity 6,553,333 5,641,099 Total liabilities and equity $ 11,865,870 $ 11,012,622
The accompanying notes to consolidated financial statements are an integral part of these statements.
22
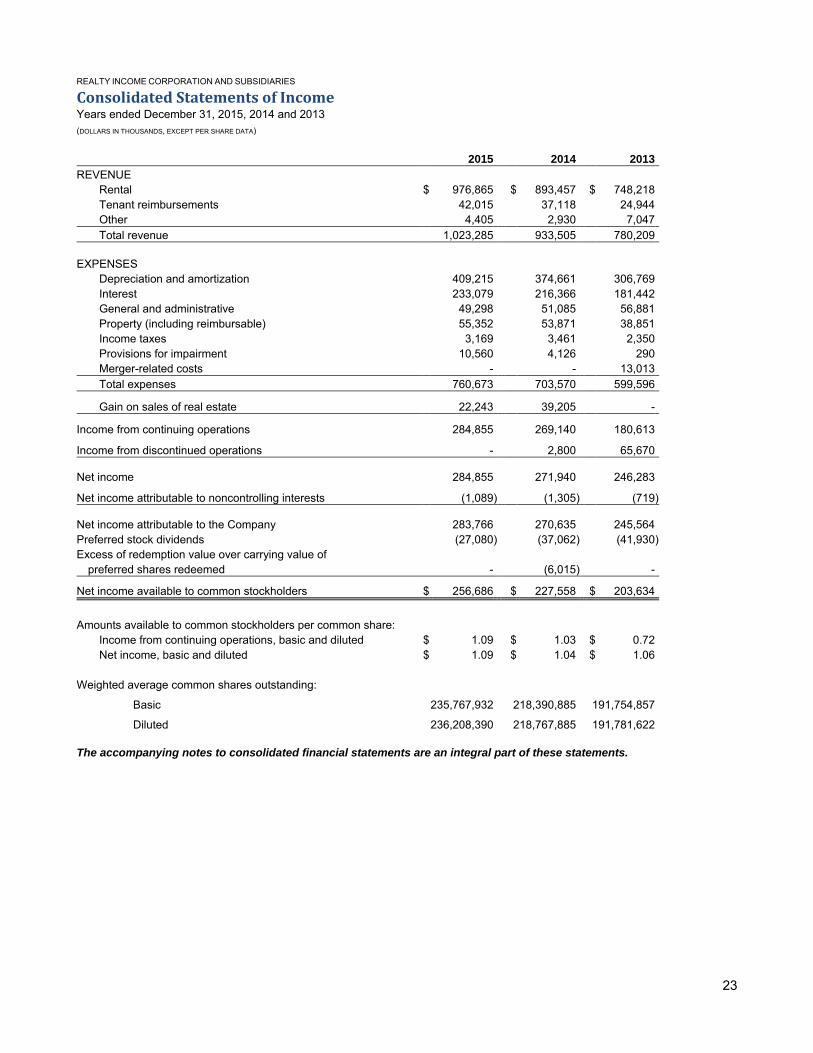
REALTY INCOME CORPORATION AND SUBSIDIARIES
Consolidated Statements of Income Years ended December 31, 2015, 2014 and 2013 (DOLLARS IN THOUSANDS, EXCEPT PER SHARE DATA)
2015 2014 2013 REVENUE
Rental $ 976,865 $ 893,457 $ 748,218 Tenant reimbursements 42,015 37,118 24,944 Other 4,405 2,930 7,047 Total revenue 1,023,285 933,505 780,209
EXPENSES
Depreciation and amortization 409,215 374,661 306,769 Interest 233,079 216,366 181,442 General and administrative 49,298 51,085 56,881 Property (including reimbursable) 55,352 53,871 38,851 Income taxes 3,169 3,461 2,350 Provisions for impairment 10,560 4,126 290 Merger-related costs - - 13,013 Total expenses 760,673 703,570 599,596
Gain on sales of real estate 22,243 39,205 -
Income from continuing operations 284,855 269,140 180,613
Income from discontinued operations - 2,800 65,670
Net income 284,855 271,940 246,283
Net income attributable to noncontrolling interests (1,089 ) (1,305 ) (719 )
Net income attributable to the Company 283,766 270,635 245,564 Preferred stock dividends (27,080 ) (37,062 ) (41,930 ) Excess of redemption value over carrying value of
preferred shares redeemed - (6,015 ) -
Net income available to common stockholders $ 256,686 $ 227,558 $ 203,634
Amounts available to common stockholders per common share:
Income from continuing operations, basic and diluted $ 1.09 $ 1.03 $ 0.72 Net income, basic and diluted $ 1.09 $ 1.04 $ 1.06
Weighted average common shares outstanding:
Basic 235,767,932 218,390,885 191,754,857
Diluted 236,208,390 218,767,885 191,781,622
The accompanying notes to consolidated financial statements are an integral part of these statements.
23

REALTY INCOME CORPORATION AND SUBSIDIARIES
Consolidated Statements of Equity Years Ended December 31, 2015, 2014, and 2013 (DOLLARS IN THOUSANDS) Preferred Common Shares of Shares of stock and stock and Distributions Total preferred common paid in paid in in excess of stockholders' Noncontrolling Total stock stock capital capital net income equity interests equity Balance, December 31, 2012 25,150,000 133,452,411 609,363 2,572,092 (768,661 ) 2,412,794 - 2,412,794 Net income - - - - 245,564 245,564 719 246,283 Distributions paid and payable - - - - (468,697 ) (468,697 ) (1,371 ) (470,068 ) Shares issued in stock offerings,
net of offering costs - 27,025,000 - 1,133,574 - 1,133,574 - 1,133,574 Shares issued in conjunction with
acquisition of ARCT, net of our shares owned by ARCT - 45,364,435 - 1,997,850 - 1,997,850 - 1,997,850
Issuance of preferred and common units - - - - - - 36,563 36,563 Shares issued pursuant to
dividend reinvestment and stock purchase plan, net - 1,449,139 - 55,244 - 55,244 - 55,244
Share-based compensation, net - 194,088 - 9,118 - 9,118 - 9,118 Balance, December 31, 2013 25,150,000 207,485,073 609,363 5,767,878 (991,794 ) 5,385,447 35,911 5,421,358 Net income - - - - 270,635 270,635 1,305 271,940 Distributions paid and payable - - - - (519,790 ) (519,790 ) (1,839 ) (521,629 ) Shares issued in stock offerings,
net of offering costs - 13,800,000 - 528,592 - 528,592 - 528,592 Redemption of common units - 35,000 - 1,032 - 1,032 (1,032 ) - Reallocation of equity - - - 6,647 - 6,647 (6,647 ) - Shares issued pursuant to
dividend reinvestment and stock purchase plan, net - 3,527,166 - 157,285 - 157,285 - 157,285
Preferred shares redeemed (8,800,000 ) - (213,985 ) - (6,015 ) (220,000 ) - (220,000 ) Share-based compensation, net - 33,953 - 3,553 - 3,553 - 3,553
Balance, December 31, 2014 16,350,000 224,881,192 $ 395,378 $ 6,464,987 $ (1,246,964 ) $ 5,613,401 $ 27,698 $ 5,641,099 Net income - - - - 283,766 283,766 1,089 284,855 Distributions paid and payable - - - - (567,012 ) (567,012 ) (1,652 ) (568,664 ) Shares issued in stock offerings,
net of offering costs - 17,000,000 - 793,559 - 793,559 - 793,559 Redemption of common units - 168,182 - 4,347 - 4,347 (4,347 ) - Reallocation of equity - - - 1,051 - 1,051 (1,051 ) - Shares issued pursuant to
dividend reinvestment and stock purchase plan, net - 7,608,354 - 360,700 - 360,700 - 360,700
Shares issued pursuant to at-the-market program, net - 714,301 - 35,747 - 35,747 - 35,747
Share-based compensation, net - 44,728 - 6,037 - 6,037 - 6,037
Balance, December 31, 2015 16,350,000 250,416,757 $ 395,378 $ 7,666,428 $ (1,530,210 ) $ 6,531,596 $ 21,737 $ 6,553,333
The accompanying notes to consolidated financial statements are an integral part of these statements.
24

REALTY INCOME CORPORATION AND SUBSIDIARIES
Consolidated Statements of Cash Flows Years ended December 31, 2015, 2014 and 2013 (DOLLARS IN THOUSANDS) 2015 2014 2013 CASH FLOWS FROM OPERATING ACTIVITIES Net income $ 284,855 $ 271,940 $ 246,283 Adjustments to net income:
Depreciation and amortization 409,215 374,661 306,769 Income from discontinued operations - (2,800 ) (65,670 ) Amortization of share-based compensation 10,391 11,959 20,785 Non-cash rental adjustments (8,607 ) (6,848 ) (5,554 ) Amortization of net premiums on mortgages payable (7,482 ) (12,891 ) (9,481 ) Amortization of deferred financing costs 9,044 8,335 9,364 Loss (gain) on interest rate swaps 3,043 1,349 (878 ) Gain on sales of real estate (22,243 ) (39,205 ) - Provisions for impairment on real estate 10,560 4,126 290 Change in assets and liabilities
Accounts receivable and other assets (2,641 ) (3,064 ) (2,116 ) Accounts payable, accrued expenses and other liabilities 6,168 20,130 19,114
Net cash provided by operating activities 692,303 627,692 518,906 CASH FLOWS FROM INVESTING ACTIVITIES Investment in real estate (1,266,885 ) (1,228,243 ) (1,429,483 ) Improvements to real estate, including leasing costs (11,541 ) (6,032 ) (8,507 ) Proceeds from sales of real estate:
Continuing operations 65,817 88,688 8 Discontinued operations - 6,918 126,785
Collection (issuance) of loans receivable - 350 (10,656 ) Restricted escrow deposits for Section 1031 tax-deferred exchanges
and pending acquisitions 33,554 (36,540 ) (10,158 ) Net cash used in investing activities (1,179,055 ) (1,174,859 ) (1,332,011 )
CASH FLOWS FROM FINANCING ACTIVITIES Cash distributions to common stockholders (533,238 ) (479,256 ) (409,222 ) Cash dividends to preferred stockholders (27,080 ) (38,300 ) (41,930 ) Borrowings on line of credit 1,448,000 1,672,321 2,624,700 Payments on line of credit (1,433,000 ) (1,577,321 ) (2,654,700 ) Proceeds from notes and bonds payable issued - 598,594 750,000 Principal payment on notes payable (150,000 ) - (100,000 ) Principal payments on mortgages payable (198,353 ) (85,208 ) (32,603 ) Proceeds from term loans 250,000 - 70,000 Repayment of American Realty Capital Trust, Inc., or ARCT, line of credit - - (317,207 ) Repayment of ARCT term loan - - (235,000 ) Proceeds from common stock offerings, net 793,559 528,615 1,133,574 Redemption of preferred units (6,750 ) - - Redemption of preferred stock - (220,000 ) - Distributions to noncontrolling interests (1,679 ) (1,844 ) (1,216 ) Debt issuance costs (10,259 ) (5,505 ) (10,666 ) Proceeds from dividend reinvestment and stock purchase plan 363,029 158,462 55,806 Proceeds from At-the-Market (ATM) program 36,348 - - Other items, including shares withheld upon vesting (7,383 ) (9,796 ) (13,422 )
Net cash provided by financing activities 523,194 540,762 818,114 Net increase (decrease) in cash and cash equivalents 36,442 (6,405 ) 5,009 Cash and cash equivalents, beginning of period 3,852 10,257 5,248 Cash and cash equivalents, end of period $ 40,294 $ 3,852 $ 10,257 For supplemental disclosures, see note 16. The accompanying notes to consolidated financial statements are an integral part of these statements.
25

REALTY INCOME CORPORATION AND SUBSIDIARIES
Notes to Consolidated Financial Statements December 31, 2015, 2014 and 2013
1. Organization and Operation
Realty Income Corporation ("Realty Income," the "Company," "we," "our" or "us") is organized as a Maryland corporation. We invest in commercial real estate and have elected to be taxed as a real estate investment trust, or REIT. At December 31, 2015, we owned 4,538 properties, located in 49 states and Puerto Rico, containing over 76.0 million leasable square feet. Information with respect to number of properties, square feet, average initial lease term and weighted average contractual lease rate is unaudited. 2. Summary of Significant Accounting Policies
Federal Income Taxes. We have elected to be taxed as a REIT under the Internal Revenue Code of 1986, as amended, or the Code. We believe we have qualified and continue to qualify as a REIT. Under the REIT operating structure, we are permitted to deduct dividends paid to our stockholders in determining our taxable income. Assuming our dividends equal or exceed our taxable net income, we generally will not be required to pay federal corporate income taxes on such income. Accordingly, no provision has been made for federal income taxes in the accompanying consolidated financial statements, except for the federal income taxes of our taxable REIT subsidiaries. The income taxes recorded on our consolidated statements of income represent amounts paid by Realty Income for city and state income and franchise taxes. Earnings and profits that determine the taxability of distributions to stockholders differ from net income reported for financial reporting purposes due to differences in the estimated useful lives and methods used to compute depreciation and the carrying value (basis) of the investments in properties for tax purposes, among other things. We regularly analyze our various federal and state filing positions and only recognize the income tax effect in our financial statements when certain criteria regarding uncertain income tax positions have been met. We believe that our income tax positions would more likely than not be sustained upon examination by all relevant taxing authorities. Therefore, no provisions for uncertain income tax positions have been recorded in our financial statements. Net Income per Common Share. Basic net income per common share is computed by dividing net income available to common stockholders by the weighted average number of common shares outstanding during each period. Diluted net income per common share is computed by dividing net income available to common stockholders, plus income attributable to dilutive shares and convertible common units, for the period by the weighted average number of common shares that would have been outstanding assuming the issuance of common shares for all potentially dilutive common shares outstanding during the reporting period.
26

The following is a reconciliation of the denominator of the basic net income per common share computation to the denominator of the diluted net income per common share computation.
2015 2014 2013 Weighted average shares used for the basic net income
per share computation 235,767,932 218,390,885 191,754,857 Incremental shares from share-based compensation 123,436 59,978 26,765 Weighted average partnership common units convertible
to common shares that were dilutive 317,022 317,022 - Weighted average shares used for diluted net
income per share computation 236,208,390 218,767,885 191,781,622
Unvested shares from share-based compensation that were anti-dilutive 106,103 51,749 59,629
Weighted average partnership common units convertible to common shares that were anti-dilutive 417,060 523,847 851,568
Discontinued Operations. During the first quarter of 2014, the Financial Accounting Standards Board issued guidance that changed the definition of discontinued operations by limiting discontinued operations reporting to disposals of components of an entity that represent strategic shifts that have, or will have, a major effect on an entity’s operations and financial results. We early adopted the requirements of this accounting pronouncement in the first quarter of 2014. Starting with the first quarter of 2014, the results of operations for all qualifying disposals and properties classified as held for sale that were not previously reported in discontinued operations in our 2013 Annual Report on Form 10-K are presented within income from continuing operations on our consolidated statements of income. Prior to the date of adoption of Accounting Standards Update 2014-08 (ASU 2014-08), which amends Topic 205, Presentation of Financial Statements, and Topic 360, Property, Plant, and Equipment, we reported, in discontinued operations, the results of operations of properties that had either been disposed of or classified as held for sale in financial statements issued. Operations from ten properties were classified as held for sale at December 31, 2015, and are included in income from continuing operations. We do not depreciate properties that are classified as held for sale.
If the property was previously reclassified as held for sale but the applicable criteria for this classification are no longer met, the property is reclassified to real estate held for investment. A property that is reclassified to held for investment is measured and recorded at the lower of (i) its carrying amount before the property was classified as held for sale, adjusted for any depreciation expense that would have been recognized had the property been continuously classified as held for investment, or (ii) the fair value at the date of the subsequent decision not to sell. No debt was assumed by buyers of our properties, or repaid as a result of our property sales. For the year ended December 31, 2014, we recorded income from discontinued operations of $2.8 million, or $0.01 per common share, basic and diluted. For the year ended December 31, 2013, we recorded income from discontinued operations of $65.7 million, or $0.34 per common share, basic and diluted. Revenue Recognition and Accounts Receivable. All leases are accounted for as operating leases. Under this method, leases that have fixed and determinable rent increases are recognized on a straight-line basis over the lease term. Any rental revenue contingent upon a tenant's sales is recognized only after the tenant exceeds their sales breakpoint. Rental increases based upon changes in the consumer price indexes are recognized only after the changes in the indexes have occurred and are then applied according to the lease agreements. Contractually obligated reimbursements from tenants for recoverable real estate taxes and operating expenses are included in tenant reimbursements in the period when such costs are incurred.
We recognize an allowance for doubtful accounts relating to accounts receivable for amounts deemed uncollectible. We consider tenant specific issues, such as financial stability and ability to pay, when determining collectability of accounts receivable and appropriate allowances to record. The allowance for doubtful accounts was $429,000 at December 31, 2015 and $765,000 at December 31, 2014.
27

Other revenue, which comprises property-related revenue not included in rental revenue or tenant reimbursements, was $4.4 million in 2015, $2.9 million in 2014 and $7.0 million in 2013. Principles of Consolidation. The accompanying consolidated financial statements include the accounts of Realty Income and other entities for which we make operating and financial decisions (i.e. control), after elimination of all material intercompany balances and transactions. We consolidate entities that we control and record a noncontrolling interest for the portion that we do not own. Noncontrolling interest that was created or assumed as part of a business combination was recognized at fair value as of the date of the transaction (see note 11). We have no unconsolidated investments. Cash Equivalents. We consider all short-term, highly liquid investments that are readily convertible to cash and have an original maturity of three months or less at the time of purchase to be cash equivalents. Our cash equivalents are primarily investments in United States government money market funds. Gain on Sales of Properties. When real estate is sold, the related net book value of the applicable assets is removed and a gain from the sale is recognized in our consolidated statements of income. We record a gain from the sale of real estate provided that various criteria, relating to the terms of the sale and any subsequent involvement by us with the real estate, have been met. Allocation of the Purchase Price of Real Estate Acquisitions. When acquiring a property for investment purposes, we typically allocate the fair value of real estate acquired to: (1) land, (2) building and improvements, and (3) identified intangible assets and liabilities, based in each case on their estimated fair values. Intangible assets and liabilities consist of above-market or below-market lease value of in-place leases, the value of in-place leases, and tenant relationships, as applicable. In an acquisition of multiple properties, we must also allocate the purchase price among the properties. The allocation of the purchase price is based on our assessment of estimated fair value and is often based upon the expected future cash flows of the property and various characteristics of the markets where the property is located. In addition, any assumed mortgages receivable or payable and any assumed or issued noncontrolling interests are recorded at their estimated fair values. The estimated fair values of our mortgages payable have been calculated by discounting the future cash flows using applicable interest rates that have been adjusted for factors, such as industry type, tenant investment grade, maturity date, and comparable borrowings for similar assets. The initial allocation of the purchase price is based on management’s preliminary assessment, which may differ when final information becomes available. Subsequent adjustments made to the initial purchase price allocation are made within the allocation period, which does not exceed one year. The use of different assumptions in the allocation of the purchase price of the acquired properties and liabilities assumed could affect the timing of recognition of the related revenue and expenses. Our estimated fair value determinations are based on management’s judgment, utilizing various factors, including: (1) market conditions, (2) industry that the tenant operates in, (3) characteristics of the real estate, i.e.: location, size, demographics, value and comparative rental rates, (4) tenant credit profile, (5) store profitability and the importance of the location of the real estate to the operations of the tenant’s business, and/or (6) real estate valuations, prepared either internally or by an independent valuation firm. Our methodologies for measuring fair value related to the allocation of the purchase price of real estate acquisitions include both observable market data (and thus should be categorized as level 2 on FASB’s three-level valuation hierarchy) and unobservable inputs that reflect our own internal assumptions and calculations (and thus should be categorized as level 3 on FASB’s three-level valuation hierarchy). The fair value of the tangible assets of an acquired property with an in-place operating lease (which includes land and buildings/improvements) is determined by valuing the property as if it were vacant, and the "as-if-vacant" value is then allocated to land and buildings/improvements based on our determination of the fair value of these assets. Our fair value determinations are based on a real estate valuation for each property, prepared either internally or by an independent valuation firm, and consider estimates of carrying costs during the expected lease-up periods, current market conditions, as well as costs to execute similar leases. In allocating the fair value to identified intangibles for above-market or below-market leases, an amount is recorded based on the present value of the difference between (i) the contractual amount to be paid pursuant to the in-place lease and (ii) our estimate of fair market lease rate for the corresponding in-place lease, measured over the remaining term of the lease.
28

The values of the above-market and below-market leases are amortized over the term of the respective leases, including any bargain renewal options, as an adjustment to rental revenue on our consolidated statements of income. The aggregate value of other acquired intangible assets consists of the fair value of in-place leases and tenant relationships, as applicable. The value of in-place leases, exclusive of the value of above-market and below-market in-place leases, is amortized to depreciation and amortization expense over the remaining periods of the respective leases. If a lease was terminated prior to its stated expiration, all unamortized amounts relating to that lease would be recorded to revenue or expense as appropriate. In allocating the fair value to assumed mortgages, amounts are recorded to debt premiums or discounts based on the present value of the estimated cash flows, which is calculated to account for either above or below-market interest rates. Our assumed net debt premiums are amortized as a reduction to interest expense over the remaining term of the respective mortgages. In allocating noncontrolling interests, amounts are recorded based on the fair value of units issued at the date of acquisition, as determined by the terms of the applicable agreement. Depreciation and Amortization. Land, buildings and improvements are recorded and stated at cost. Major replacements and betterments, which improve or extend the life of the asset, are capitalized and depreciated over their estimated useful lives, while ordinary repairs and maintenance are expensed as incurred. Buildings and improvements that are under redevelopment, or are being developed, are carried at cost and no depreciation is recorded on these assets. Additionally, amounts essential to the development of the property, such as pre-construction, development, construction, interest and other costs incurred during the period of development are capitalized. We cease capitalization when the property is available for occupancy upon substantial completion of tenant improvements, but in any event no later than one year from the completion of major construction activity. Properties are depreciated using the straight-line method over the estimated useful lives of the assets. The estimated useful lives are as follows:
Buildings 25 years or 35 years Building improvements 4 to 20 years Tenant improvements and lease commissions The shorter of the term of the related lease or useful life Acquired in-place leases Remaining terms of the respective leases Provision for Impairment. We review long-lived assets for impairment whenever events or changes in circumstances indicate that the carrying amount of an asset may not be recoverable. A provision is made for impairment if estimated future operating cash flows (undiscounted and without interest charges) plus estimated disposition proceeds (undiscounted) are less than the current book value of the property. Key factors that we utilize in this analysis include projected rental rates, estimated holding periods, historical sales and releases, capital expenditures and property sales capitalization rates. If a property is classified as held for sale, it is carried at the lower of carrying cost or estimated fair value, less estimated cost to sell, and depreciation of the property ceases. In 2015, we recorded total provisions for impairment of $10.6 million on three properties classified as held for sale, four properties classified as held for investment, seven sold properties, and one property disposed of other than by sale in the following industries: one in the convenience stores industry, one in the health and fitness industry, one in the pet supplies and services industry, eleven in the restaurant-casual dining industry, and one among the industry we classify as “other.” These properties were not previously classified as held for sale in financial statements issued prior to the date of adoption of ASU 2014-08; accordingly, the provisions for impairment are included in income from continuing operations on our consolidated statement of income for the year ended December 31, 2015. In 2014, Realty Income recorded total provisions for impairment of $4.6 million. Provisions for impairment of $4.1 million are included in income from continuing operations on nine sold properties and two properties classified as held for investment in the following industries: one in the consumer electronics industry, one in the
29

convenience stores industry, one in the home furnishings industry, two in the home improvement industry, and six in the restaurant-casual dining industry. These properties were not previously classified as held for sale in financial statements issued prior to the date of adoption of ASU 2014-08; accordingly, these provisions for impairment are included in income from continuing operations on our consolidated statements of income. Additionally during 2014, a provision for impairment of $510,000 is included in income from discontinued operations on one sold property in the grocery store industry that was classified as held for sale as of December 31, 2013. In 2013, Realty Income recorded total provisions for impairment of $3.0 million. Realty Income recorded provisions for impairment of $2.7 million in income from discontinued operations on seven sold properties in the following industries: one in the automotive parts industry, two in the child care industry, one in the grocery store industry, one in the pet supplies and services industry, and two in the restaurant casual dining industry. Except for a provision for impairment of $290,000 that was recorded in income from continuing operations for one property in the auto service industry that was not previously classified as held for sale as of December 31, 2013, the remaining provisions for impairment are included in income from discontinued operations on our consolidated statement of income. In 2013, Crest also recorded a provision for impairment of $308,000 on one sold property in the restaurant-casual dining industry, which is included in income from discontinued operations. Asset Retirement Obligations. We analyze our future legal obligations associated with the other-than-temporary removal of tangible long-lived assets, also referred to as asset retirement obligations. When we determine that we have a legal obligation to provide services upon the retirement of a tangible long-lived asset, we record a liability for this obligation based on the estimated fair value of this obligation and adjust the carrying amount of the related long-lived asset by the same amount. This asset is amortized over its estimated useful life. The estimated fair value of the asset retirement obligation is calculated by discounting the future cash flows using a credit-adjusted risk-free interest rate. Goodwill. Goodwill is tested for impairment during the second quarter of each year as well as when events or circumstances occur indicating that our goodwill might be impaired. Under the amendments issued in conjunction with ASU No. 2011-08, Intangibles – Goodwill and Other (Topic 350), an entity, through an assessment of qualitative factors, is not required to calculate the estimated fair value of a reporting unit, in connection with the two-step goodwill impairment test, unless the entity determines that it is more likely than not that its fair value is less than its carrying amount. We elected to continue testing goodwill for impairment during the second quarter of each year as well as when events or circumstances occur, indicating that our goodwill might be impaired. During our tests for impairment of goodwill during the second quarters of 2015, 2014 and 2013, we determined that the estimated fair values of our reporting units exceeded their carrying values. We did not record any impairment on our existing goodwill during 2015, 2014 or 2013. Equity Offering Costs. Underwriting commissions and offering costs have been reflected as a reduction of additional paid-in-capital on our consolidated balance sheets. Noncontrolling Interests. Noncontrolling interests are reflected on our consolidated balance sheets as a component of equity. Noncontrolling interests are recorded initially at fair value based on the price of the applicable units issued, and subsequently adjusted each period for distributions, contributions and the allocation of net income attributable to the noncontrolling interests. As consideration for two separate acquisitions during 2013, partnership units of Tau Operating Partnership, L.P. and Realty Income, L.P. were issued to third parties. These common units (discussed in footnote 11) do not have voting rights, are entitled to monthly distributions equal to the amount paid to our common stockholders, and are redeemable in cash or our common stock, at our option and at a conversion ratio of one to one, subject to certain exceptions. As the general partner for each of these partnerships, we have operating and financial control over these entities, consolidate them in our financial statements, and record the partnership units held by third parties as noncontrolling interests. Use of Estimates. The consolidated financial statements were prepared in conformity with U.S. generally accepted accounting principles, or GAAP, which requires management to make estimates and assumptions that affect the reported amounts of assets and liabilities, the disclosure of contingent assets and liabilities at the date
30
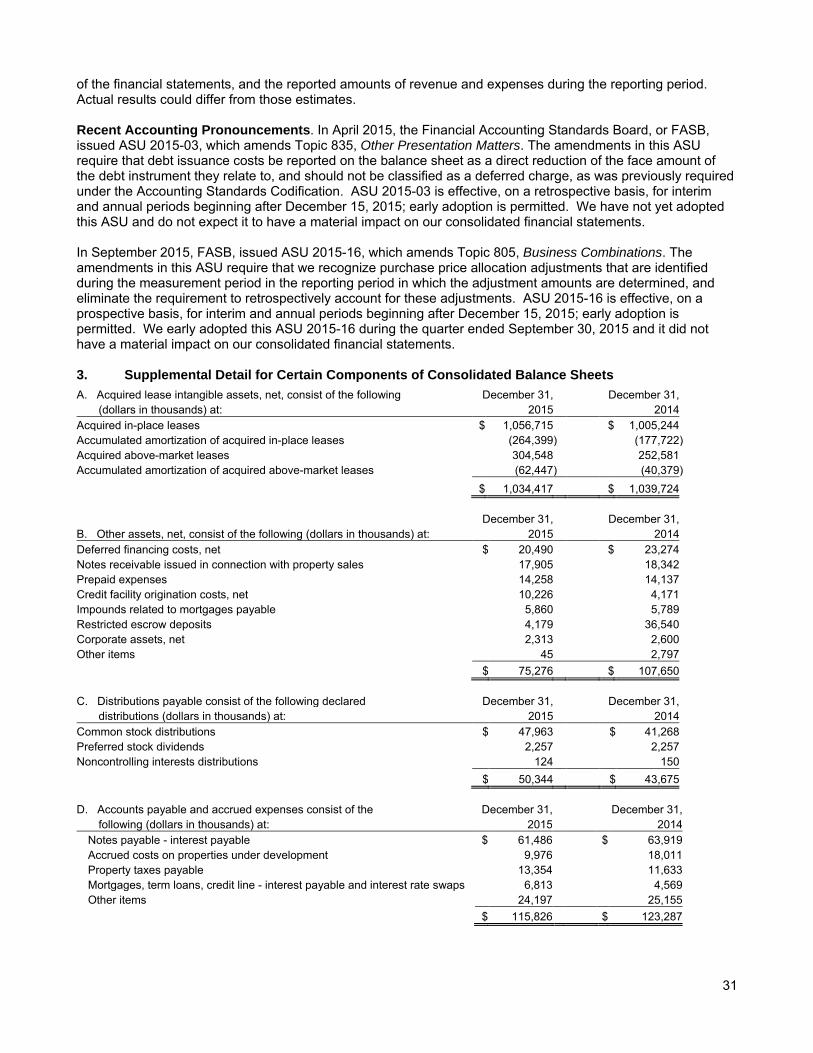
of the financial statements, and the reported amounts of revenue and expenses during the reporting period. Actual results could differ from those estimates. Recent Accounting Pronouncements. In April 2015, the Financial Accounting Standards Board, or FASB, issued ASU 2015-03, which amends Topic 835, Other Presentation Matters. The amendments in this ASU require that debt issuance costs be reported on the balance sheet as a direct reduction of the face amount of the debt instrument they relate to, and should not be classified as a deferred charge, as was previously required under the Accounting Standards Codification. ASU 2015-03 is effective, on a retrospective basis, for interim and annual periods beginning after December 15, 2015; early adoption is permitted. We have not yet adopted this ASU and do not expect it to have a material impact on our consolidated financial statements. In September 2015, FASB, issued ASU 2015-16, which amends Topic 805, Business Combinations. The amendments in this ASU require that we recognize purchase price allocation adjustments that are identified during the measurement period in the reporting period in which the adjustment amounts are determined, and eliminate the requirement to retrospectively account for these adjustments. ASU 2015-16 is effective, on a prospective basis, for interim and annual periods beginning after December 15, 2015; early adoption is permitted. We early adopted this ASU 2015-16 during the quarter ended September 30, 2015 and it did not have a material impact on our consolidated financial statements. 3. Supplemental Detail for Certain Components of Consolidated Balance Sheets A. Acquired lease intangible assets, net, consist of the following December 31, December 31, (dollars in thousands) at: 2015 2014 Acquired in-place leases $ 1,056,715 $ 1,005,244 Accumulated amortization of acquired in-place leases (264,399 ) (177,722 ) Acquired above-market leases 304,548 252,581 Accumulated amortization of acquired above-market leases (62,447 ) (40,379 ) $ 1,034,417 $ 1,039,724 December 31, December 31, B. Other assets, net, consist of the following (dollars in thousands) at: 2015 2014 Deferred financing costs, net $ 20,490 $ 23,274 Notes receivable issued in connection with property sales 17,905 18,342 Prepaid expenses 14,258 14,137 Credit facility origination costs, net 10,226 4,171 Impounds related to mortgages payable 5,860 5,789 Restricted escrow deposits 4,179 36,540 Corporate assets, net 2,313 2,600 Other items 45 2,797 $ 75,276 $ 107,650 C. Distributions payable consist of the following declared December 31, December 31, distributions (dollars in thousands) at: 2015 2014 Common stock distributions $ 47,963 $ 41,268 Preferred stock dividends 2,257 2,257 Noncontrolling interests distributions 124 150 $ 50,344 $ 43,675 D. Accounts payable and accrued expenses consist of the December 31, December 31, following (dollars in thousands) at: 2015 2014
Notes payable - interest payable $ 61,486 $ 63,919 Accrued costs on properties under development 9,976 18,011 Property taxes payable 13,354 11,633 Mortgages, term loans, credit line - interest payable and interest rate swaps 6,813 4,569 Other items 24,197 25,155
$ 115,826 $ 123,287
31

E. Acquired lease intangible liabilities, net, consist of the December 31, December 31, following (dollars in thousands) at: 2015 2014
Acquired below-market leases $ 288,412 $ 243,025 Accumulated amortization of acquired below-market leases (37,496 ) (22,556 )
$ 250,916 $ 220,469 F. Other liabilities consist of the following December 31, December 31, (dollars in thousands) at: 2015 2014
Rent received in advance $ 42,840 $ 36,122 Security deposits 6,418 5,876 Capital lease obligations 4,707 4,397 Preferred units issued upon acquisition of ARCT - 6,750
$ 53,965 $ 53,145 4. Investments in Real Estate We acquire land, buildings and improvements necessary for the successful operations of commercial tenants.
A. Acquisitions during 2015 and 2014 During 2015, we invested $1.26 billion in 286 new properties and properties under development or expansion with an initial weighted average contractual lease rate of 6.6%. The 286 new properties and properties under development or expansion are located in 40 states, will contain approximately 6.2 million leasable square feet, and are 100% leased with a weighted average lease term of 16.5 years. The tenants occupying the new properties operate in 21 industries and the property types consist of 87.3% retail and 12.7% industrial, based on rental revenue. None of our investments during 2015 caused any one tenant to be 10% or more of our total assets at December 31, 2015. The $1.26 billion invested during 2015 was allocated as follows: $257.1 million to land, $937.1 million to buildings and improvements, $105.8 million to intangible assets related to leases, and $40.9 million to intangible liabilities related to leases and other assumed liabilities. There was no contingent consideration associated with these acquisitions. The properties acquired during 2015 generated total revenues of $43.4 million and income from continuing operations of $21.1 million. Of the $1.26 billion we invested during 2015, $195.4 million of the purchase price allocation is based on a preliminary measurement of fair value that is subject to change. The allocation for these properties represents our current best estimate of fair value, and we expect to finalize the valuations and complete the purchase price allocations in 2016. During 2015, we finalized the purchase price allocations for $147.1 million invested in the fourth quarter of 2014. There were no material changes to our consolidated balance sheets or income statements as a result of these purchase price allocations being finalized. In comparison, during 2014, we invested $1.4 billion in 506 new properties and properties under development or expansion with an initial weighted average contractual lease rate of 7.1%. The 506 new properties and properties under development or expansion are located in 42 states, contain approximately 9.8 million leasable square feet, and are 100% leased with a weighted average lease term of 12.8 years. The tenants occupying the new properties operate in 32 industries and the property types consist of 85.7% retail, 6.6% industrial, 6.4% office, and 1.3% manufacturing, based on rental revenue. The $1.4 billion invested during 2014 was allocated as follows: $295.6 million to land, $984.1 million to buildings and improvements, $209.4 million to intangible assets related to leases, $901,000 to other assets, net, and $87.4 million to intangible liabilities related to leases and other assumed liabilities. We also recorded mortgage premiums of $604,000 associated with the mortgages acquired. There was no contingent consideration associated with these acquisitions. The properties acquired during 2014 generated total revenues of $75.1 million and income from continuing operations of $27.8 million for year ended December 31, 2014.
32

The estimated initial weighted average contractual lease rate for a property is generally computed as estimated contractual net operating income, which, in the case of a net leased property, is equal to the aggregate base rent for the first full year of each lease, divided by the total cost of the property. Since it is possible that a tenant could default on the payment of contractual rent, we cannot provide assurance that the actual return on the funds invested will remain at the percentages listed above. In the case of a property under development or expansion, the contractual lease rate is generally fixed such that rent varies based on the actual total investment in order to provide a fixed rate of return. When the lease does not provide for a fixed rate of return on a property under development or expansion, the estimated initial weighted average contractual lease rate is computed as follows: estimated net operating income (determined by the lease) for the first full year of each lease, divided by our projected total investment in the property, including land, construction and capitalized interest costs. Of the $1.26 billion we invested during 2015, $45.8 million was invested in 35 properties under development or expansion with an estimated initial weighted average contractual lease rate of 9.7%. Of the $1.4 billion we invested during 2014, $81.9 million was invested in 40 properties under development or expansion with an estimated initial weighted average contractual lease rate of 8.4%. B. Acquisition Transaction Costs Acquisition transaction costs of $913,000 and $453,000 were recorded to general and administrative expense on our consolidated statements of income during 2015 and 2014, respectively. C. Investments in Existing Properties During 2015, we capitalized costs of $11.5 million on existing properties in our portfolio, consisting of $748,000 for re-leasing costs, $7.6 million for recurring capital expenditures and $3.2 million for non-recurring building improvements. In comparison, during 2014, we capitalized costs of $6.0 million on existing properties in our portfolio. D. Properties with Existing Leases Of the $1.26 billion we invested during 2015, approximately $391.4 million was used to acquire 86 properties with existing leases. In comparison, of the $1.4 billion we invested during 2014, approximately $957.4 million was used to acquire 201 properties with existing leases. The value of the in-place and above-market leases is recorded to acquired lease intangible assets, net on our consolidated balance sheets, and the value of the below-market leases is recorded to acquired lease intangible liabilities, net on our consolidated balance sheets. The values of the in-place leases are amortized as depreciation and amortization expense. The amounts amortized to expense for all of our in-place leases, for 2015, 2014, and 2013 were $87.9 million, $83.6 million, and $65.5 million, respectively. The values of the above-market and below-market leases are amortized over the term of the respective leases, including any bargain renewal options, as an adjustment to rental revenue on our consolidated statements of income. The amounts amortized as a net decrease to rental revenue for capitalized above-market and below-market leases for 2015, 2014, and 2013 were $7.9 million, $8.0 million, and $8.2 million, respectively. If a lease were to be terminated prior to its stated expiration, all unamortized amounts relating to that lease would be recorded to revenue or expense as appropriate. The following table presents the estimated impact during the next five years and thereafter related to the amortization of the acquired above-market and below-market lease intangibles and the amortization of the in-place lease intangibles for properties held for investment at December 31, 2015 (in thousands):
Net increase Increase to (decrease) to amortization rental revenue expense 2016 $ (8,075 ) $ 89,858 2017 (8,019 ) 88,669 2018 (7,771 ) 86,174 2019 (6,781 ) 76,109 2020 (6,108 ) 70,915 Thereafter 45,569 380,591 Totals $ 8,815 $ 792,316
33

5. Credit Facility
In June 2015, we entered into a new $2.0 billion unsecured revolving credit facility, or our new credit facility, which replaced our $1.5 billion credit facility that was scheduled to expire in May 2016. The initial term of our new credit facility expires in June 2019 and includes, at our option, two six-month extensions. Our new credit facility has a $1.0 billion accordion expansion option. Under our new credit facility, our current investment grade credit ratings provide for financing at the London Interbank Offered Rate, commonly referred to as LIBOR, plus 0.90% with a facility commitment fee of 0.15%, for all-in drawn pricing of 1.05% over LIBOR. The borrowing rate is subject to an interest rate floor. We also have other interest rate options available to us under our new credit facility. Our new credit facility is unsecured and, accordingly, we have not pledged any assets as collateral for this obligation. At December 31, 2015, credit facility origination costs of $10.2 million are included in other assets, net on our consolidated balance sheet. This balance includes $9.1 million of new credit facility origination costs incurred during 2015 as a result of entering into our new credit facility. These costs, as well as a portion of the costs incurred as a result of entering into our previous credit facilities, are being amortized over the remaining term of our new credit facility. At December 31, 2015, we had a borrowing capacity of $1.76 billion available on our new credit facility (subject to customary conditions to borrowing) and an outstanding balance of $238.0 million, as compared to an outstanding balance of $223.0 million at December 31, 2014. The weighted average interest rate on outstanding borrowings under our credit facilities was 1.2% during 2015 and 2014. At December 31, 2015, the effective interest rate was 1.2%. Our new and previous credit facilities are and were subject to various leverage and interest coverage ratio limitations, and at December 31, 2015, we remain in compliance with the covenants on our new credit facility. 6. Mortgages Payable
During 2015, we made $198.4 million in principal payments, including the repayment of 13 mortgages in full for $191.0 million. No mortgages were assumed during 2015. During 2014, we made $85.2 million in principal payments, including the repayment of six mortgages in full for $77.8 million. Additionally, during 2014 we assumed mortgages totaling $166.7 million, excluding net premiums. The mortgages are secured by the properties on which the debt was placed. We expect to pay off the mortgages as soon as prepayment penalties make it economically feasible to do so. During 2014, aggregate net premiums totaling $604,000 were recorded upon assumption of the mortgages for above-market interest rates. Amortization of our net premiums is recorded as a reduction to interest expense over the remaining term of the respective mortgages, using a method that approximates the effective-interest method. These mortgages contain customary covenants, such as limiting our ability to further mortgage each applicable property or to discontinue insurance coverage without the prior consent of the lender. At December 31, 2015, we remain in compliance with these covenants. We did not incur any deferred financing costs on our mortgages assumed in 2014. The balance of our deferred financing costs, which are classified as part of other assets, net, on our consolidated balance sheets, was $553,000 at December 31, 2015 and $827,000 at December 31, 2014. These costs are being amortized over the remaining term of each mortgage.
34

The following is a summary of all our mortgages payable as of December 31, 2015 and December 31, 2014, respectively (dollars in thousands): Weighted Weighted Weighted Average Average Average Stated Effective Remaining Remaining Unamortized Mortgage Number of Interest Interest Years Until Principal Premium Payable
As Of Properties(1) Rate(2) Rate(3) Maturity Balance Balance, net Balance
12/31/15 183 4.9% 4.1% 3.6 $ 637,658 $ 9,082 $ 646,740 12/31/14 241 5.0% 4.0% 3.7 $ 836,011 $ 16,564 $ 852,575
(1) At December 31, 2015, there were 44 mortgages on 183 properties, while at December 31, 2014, there were 57 mortgages on 241
properties. The mortgages require monthly payments, with principal payments due at maturity. The mortgages are at fixed interest rates, except for four mortgages on 13 properties totaling $51.1 million at December 31, 2015, including net unamortized discounts. At December 31, 2014, five mortgages on 14 properties totaling $74.5 million, including net unamortized discounts, were at variable interest rates. After factoring in arrangements which limit our exposure to interest rate risk and effectively fix our per annum interest rates, our variable rate mortgage debt includes two mortgages totaling $15.5 million at December 31, 2015, and three mortgages totaling
$39.1 million at December 31, 2014. (2) Stated interest rates ranged from 2.0% to 6.9% at December 31, 2015 and December 31, 2014. (3) Effective interest rates ranged from 2.2% to 8.9% at December 31, 2015, while effective interest rates ranged from 2.2% to 9.0% at
December 31, 2014. The following table summarizes the maturity of mortgages payable, excluding net premiums of $9.1 million, as of December 31, 2015 (dollars in millions): Year of Maturity 2016 $ 170.1 2017 142.9 2018 15.5 2019 26.3 2020 82.4 Thereafter 200.5
Totals $ 637.7 7. Term Loans In June 2015, in conjunction with entering into our new credit facility, we entered into a $250 million senior unsecured term loan maturing on June 30, 2020. Borrowing under this term loan bears interest at the current one month LIBOR, plus 0.95%. In conjunction with this term loan, we also entered into an interest rate swap which effectively fixes our per annum interest rate on this term loan at 2.67%. In January 2013, in conjunction with our acquisition of American Realty Capital Trust, Inc., or ARCT, we entered into a $70 million senior unsecured term loan maturing January 21, 2018. Borrowing under this term loan bears interest at the current one month LIBOR, plus 1.2%. In conjunction with this term loan, we also entered into an interest rate swap which effectively fixes our per annum interest rate on this term loan at 2.15%. Deferred financing costs of $1.2 million incurred in conjunction with the $250 million term loan and $303,000 incurred in conjunction with the $70 million term loan are being amortized over the remaining terms of each term loan. The net balance of these deferred financing costs, which was $1.2 million at December 31, 2015, and $187,000 at December 31, 2014, is included in other assets, net on our consolidated balance sheets.
35

8. Notes Payable
A. General Our senior unsecured notes and bonds consisted of the following, sorted by maturity date (dollars in millions): December 31, December 31, 2015 2014 5.5% notes, issued in November 2003 and due in November 2015 $ - $ 150 5.95% notes, issued in September 2006 and due in September 2016 275 275 5.375% notes, issued in September 2005 and due in September 2017 175 175 2.0% notes, issued in October 2012 and due in January 2018 350 350 6.75% notes, issued in September 2007 and due in August 2019 550 550 5.75% notes, issued in June 2010 and due in January 2021 250 250 3.25% notes, issued in October 2012 and due in October 2022 450 450 4.65% notes, issued in July 2013 and due in August 2023 750 750 3.875% notes, issued in June 2014 and due in July 2024 350 350 4.125% notes, issued in September 2014 and due in October 2026 250 250 5.875% bonds, $100 issued in March 2005 and $150 issued in
June 2011, both due in March 2035 250 250 Total principal amount 3,650 3,800 Unamortized original issuance discounts (13 ) (15 ) $ 3,637 $ 3,785 The following table summarizes the maturity of our notes and bonds payable as of December 31, 2015, excluding unamortized original issuance discounts (dollars in millions): Year of Maturity Principal 2016 $ 275 2017 175 2018 350 2019 550 2020 - Thereafter 2,300
Totals $ 3,650 As of December 31, 2015, the weighted average interest rate on our notes and bonds payable was 4.7% and the weighted average remaining years until maturity was 6.5 years. Interest incurred on all of the notes and bonds was $179.5 million for 2015, $166.5 million for 2014 and $138.9 million for 2013. The interest rate on each of these notes and bonds is fixed. Our outstanding notes and bonds are unsecured; accordingly, we have not pledged any assets as collateral for these or any other obligations. Interest on all of the senior note and bond obligations is paid semiannually. All of these notes and bonds contain various covenants, including: (i) a limitation on incurrence of any debt which would cause our debt to total adjusted assets ratio to exceed 60%; (ii) a limitation on incurrence of any secured debt which would cause our secured debt to total adjusted assets ratio to exceed 40%; (iii) a limitation on incurrence of any debt which would cause our debt service coverage ratio to be less than 1.5 times; and (iv) the maintenance at all times of total unencumbered assets not less than 150% of our outstanding unsecured debt. At December 31, 2015, we remain in compliance with these covenants. B. Note Issuances In September 2014, we issued $250 million of 4.125% senior unsecured notes due October 2026, or the 2026 Notes. The price to the investors for the 2026 Notes was 99.499% of the principal amount for an effective yield of 4.178% per annum. A portion of the total net proceeds of approximately $246.4 million from this offering were used to repay all outstanding borrowings under our credit facility, and the remaining proceeds were used for other general corporate purposes, including additional property acquisitions.
36

In June 2014, we issued $350 million of 3.875% senior unsecured notes due July 2024, or the 2024 Notes. The price to the investors for the 2024 Notes was 99.956% of the principal amount for an effective yield of 3.88% per annum. The total net proceeds of approximately $346.7 million from these offerings were used to repay a portion of the outstanding borrowings under our previous credit facility. C. Note Repayment In November 2015, we repaid $150 million of outstanding 5.5% notes, plus accrued and unpaid interest, using proceeds from our October 2015 common stock offering and our new credit facility. 9. Redemption of Preferred Stock
In September 2014, we issued an irrevocable notice of redemption for all 8.8 million shares of our 6.75% Monthly Income Class E Preferred Stock for $25 per share, plus accrued dividends. The redemption occurred in October 2014. We incurred a charge of $6.0 million, representing the Class E preferred stock original issuance costs that we paid in 2006.
10. Issuance of Common Stock
In October 2015, we issued 11,500,000 shares of common stock, including 1,500,000 shares purchased by the underwriters upon the exercise of their option to purchase additional shares. After underwriting discounts and other offering costs of $22.0 million, a portion of the net proceeds of $517.1 million was used to repay borrowings under our new credit facility and the remaining portion was used for other general corporate purposes, including acquisitions. In April 2015, we issued 5,500,000 shares of common stock. After underwriting discounts and other offering costs of $1.4 million, the net proceeds of $276.4 million were used to repay borrowings under our previous $1.5 billion unsecured credit facility. In April 2014, we issued 13,800,000 shares of common stock, including 1,800,000 shares purchased by the underwriters upon the exercise of their option to purchase additional shares. After underwriting discounts and other offering costs of $22.8 million, the net proceeds of $528.6 million were used to repay borrowings under our previous credit facility. 11. Noncontrolling Interests
In January 2013, we completed our acquisition of ARCT. We issued a total of 45,573,144 shares of our common stock to ARCT shareholders and we received 208,709 shares of our common stock that were previously held by ARCT. The total value of the 45,573,144 common shares was approximately $2 billion. Equity issued as consideration for this transaction included common and preferred partnership units issued by Tau Operating Partnership, L.P., or Tau Operating Partnership, the consolidated subsidiary which owns properties acquired through the ARCT acquisition. Realty Income and its subsidiaries hold a 99.4% interest in Tau Operating Partnership, and consolidate the entity. In June 2013, we completed the acquisition of a portfolio of properties by issuing common partnership units in a newly formed entity, Realty Income, L.P. The units were issued as consideration for the acquisition. At December 31, 2015, the remaining units from this issuance represent a 1.4% ownership in Realty Income, L.P. Realty Income holds the remaining 98.6% interests in this entity and consolidates the entity. A. Neither of the common partnership units have voting rights. Both common partnership units are entitled to monthly distributions equal to the amount paid to common stockholders of Realty Income, and are redeemable in cash or Realty Income common stock, at our option, and at a conversion ratio of one to one, subject to certain exceptions. Noncontrolling interests with redemption provisions that permit the issuer to settle in either cash or common stock, at the option of the issuer, were evaluated to determine whether temporary or permanent equity classification on the balance sheet was appropriate. We determined that the units meet the requirements to qualify for presentation as permanent equity.
37
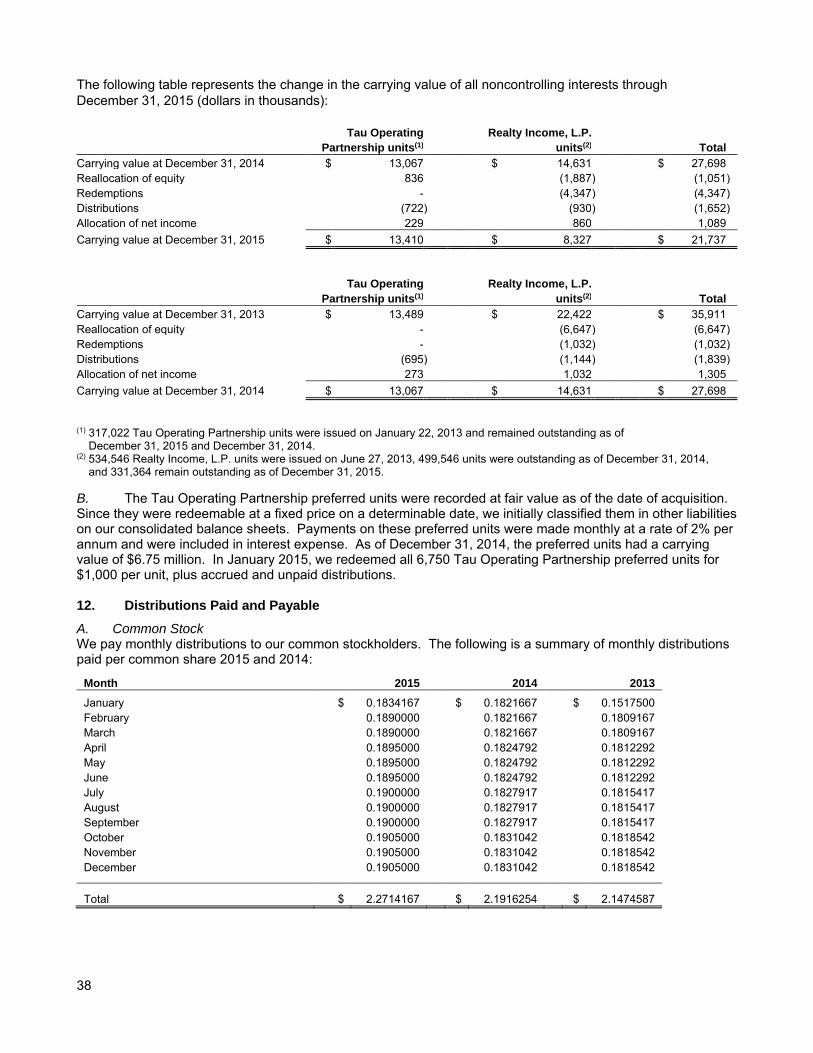
The following table represents the change in the carrying value of all noncontrolling interests through December 31, 2015 (dollars in thousands): Tau Operating Realty Income, L.P. Partnership units(1) units(2) Total Carrying value at December 31, 2014 $ 13,067 $ 14,631 $ 27,698 Reallocation of equity 836 (1,887 ) (1,051 ) Redemptions - (4,347 ) (4,347 ) Distributions (722 ) (930 ) (1,652 ) Allocation of net income 229 860 1,089 Carrying value at December 31, 2015 $ 13,410 $ 8,327 $ 21,737 Tau Operating Realty Income, L.P. Partnership units(1) units(2) Total Carrying value at December 31, 2013 $ 13,489 $ 22,422 $ 35,911 Reallocation of equity - (6,647 ) (6,647 ) Redemptions - (1,032 ) (1,032 ) Distributions (695 ) (1,144 ) (1,839 ) Allocation of net income 273 1,032 1,305 Carrying value at December 31, 2014 $ 13,067 $ 14,631 $ 27,698 (1) 317,022 Tau Operating Partnership units were issued on January 22, 2013 and remained outstanding as of
December 31, 2015 and December 31, 2014. (2) 534,546 Realty Income, L.P. units were issued on June 27, 2013, 499,546 units were outstanding as of December 31, 2014,
and 331,364 remain outstanding as of December 31, 2015. B. The Tau Operating Partnership preferred units were recorded at fair value as of the date of acquisition. Since they were redeemable at a fixed price on a determinable date, we initially classified them in other liabilities on our consolidated balance sheets. Payments on these preferred units were made monthly at a rate of 2% per annum and were included in interest expense. As of December 31, 2014, the preferred units had a carrying value of $6.75 million. In January 2015, we redeemed all 6,750 Tau Operating Partnership preferred units for $1,000 per unit, plus accrued and unpaid distributions. 12. Distributions Paid and Payable
A. Common Stock We pay monthly distributions to our common stockholders. The following is a summary of monthly distributions paid per common share 2015 and 2014:
Month 2015 2014 2013 January $ 0.1834167 $ 0.1821667 $ 0.1517500 February 0.1890000 0.1821667 0.1809167 March 0.1890000 0.1821667 0.1809167 April 0.1895000 0.1824792 0.1812292 May 0.1895000 0.1824792 0.1812292 June 0.1895000 0.1824792 0.1812292 July 0.1900000 0.1827917 0.1815417 August 0.1900000 0.1827917 0.1815417 September 0.1900000 0.1827917 0.1815417 October 0.1905000 0.1831042 0.1818542 November 0.1905000 0.1831042 0.1818542 December 0.1905000 0.1831042 0.1818542
Total $ 2.2714167 $ 2.1916254 $ 2.1474587
38

The following presents the federal income tax characterization of distributions paid or deemed to be paid per common share for the years: 2015 2014 2013 Ordinary income $ 1.7307023 $ 1.6483522 $ 1.3153791 Nontaxable distributions 0.5407144 0.5432732 0.8320796 Totals $ 2.2714167 $ 2.1916254 $ 2.1474587 At December 31, 2015, a distribution of $0.191 per common share was payable and was paid in January 2016. At December 31, 2014, a distribution of $0.1834167 per common share was payable and was paid in January 2015. B. Class E Preferred Stock Prior to the redemption of the Class E preferred stock in October 2014, dividends of $0.140625 per share were paid monthly in arrears on the Class E preferred stock. We paid distributions to holders of our Class E preferred stock totaling $12.7 million in 2014 and $14.9 million in 2013. For 2014, dividends paid per share in the amount of $1.4484375 were characterized as ordinary income for federal income tax purposes, while in 2013, dividends paid per share in the amount of $1.6875 were characterized as ordinary income for federal income tax purposes. C. Class F Preferred Stock Dividends of $0.138021 per share are paid monthly in arrears on the Class F preferred stock. We declared dividends to holders of our Class F preferred stock totaling $27.1 million in 2015, 2014 and 2013. For 2015, 2014 and 2013, dividends paid per share of $1.656252 were characterized as ordinary income for federal income tax purposes. At December 31, 2015, a monthly dividend of $0.138021 per share was payable and was paid in January 2016. We are current in our obligations to pay dividends on our Class F preferred stock. 13. Operating Leases
A. At December 31, 2015, we owned 4,538 properties in 49 states and Puerto Rico, plus an additional eight properties owned by Crest. Of the 4,538 properties, 4,519, or 99.6%, are single-tenant properties, and the remaining are multi-tenant properties. At December 31, 2015, 71 properties were available for lease or sale. Substantially all leases are net leases where the tenant pays property taxes and assessments, maintains the interior and exterior of the building and leased premises, and carries insurance coverage for public liability, property damage, fire and extended coverage. Rent based on a percentage of a tenants' gross sales (percentage rents) was $4.5 million for 2015, $3.6 million for 2014 and $2.9 million for 2013. At December 31, 2015, minimum future annual rents to be received on the operating leases for the next five years and thereafter are as follows (dollars in thousands):
2016 $ 998,632 2017 984,748 2018 960,857 2019 906,498 2020 857,543
Thereafter 5,539,698 Total $ 10,247,976
B. Major Tenants - No individual tenant's rental revenue, including percentage rents, represented more than 10% of our total revenue for each of the years ended December 31, 2015, 2014 or 2013. 14. Gain on Sales of Real Estate
During 2015, we sold 38 investment properties for $65.8 million, which resulted in a gain of $22.2 million. The results of operations for these properties are presented within continuing operations.
39

During 2014, we sold 46 investment properties for $107.2 million, which resulted in a gain of $42.1 million. Only the results of operations specifically related to the properties classified as held for sale at December 31, 2013 and sold during the year were reclassified as discontinued operations. During 2013, we sold 75 investment properties for $134.2 million, which resulted in a gain of $64.7 million. The results of operations for these properties were reclassified as discontinued operations for all periods presented. During 2015, Crest did not sell any properties. Crest sold one property for $820,000 and one property for $597,000 during 2014 and 2013, respectively. Neither of these sales resulted in a gain. The results of operations for these properties have been reclassified as discontinued operations. 15. Fair Value of Financial Instruments
Fair value is defined as the price that would be received from the sale of an asset or paid to transfer a liability in an orderly transaction between market participants at the measurement date. The disclosure for assets and liabilities measured at fair value requires allocation to a three-level valuation hierarchy. This valuation hierarchy is based upon the transparency of inputs to the valuation of an asset or liability as of the measurement date. Categorization within this hierarchy is based upon the lowest level of input that is significant to the fair value measurement. We believe that the carrying values reflected in our consolidated balance sheets reasonably approximate the fair values for cash and cash equivalents, accounts receivable, escrow deposits, loans receivable, line of credit payable, term loans and all other liabilities, due to their short-term nature or interest rates and terms that are consistent with market, except for our notes receivable issued in connection with property sales, mortgages payable and our senior notes and bonds payable, which are disclosed below (dollars in millions):
Carrying value per Estimated fair At December 31, 2015 balance sheet value Notes receivable issued in connection with property sales $ 17.9 $ 19.4 Mortgages payable assumed in connection with acquisitions, net 646.7 651.5 Notes and bonds payable, net of unamortized original issuance discounts 3,636.7 3,828.1
Carrying value per Estimated fair At December 31, 2014 balance sheet value Notes receivable issued in connection with property sales $ 18.3 $ 20.1 Mortgages payable assumed in connection with acquisitions, net 852.6 857.9 Notes and bonds payable, net of unamortized original issuance discounts 3,785.4 4,092.8 The estimated fair values of our notes receivable issued in connection with property sales and our mortgages payable have been calculated by discounting the future cash flows using an interest rate based upon the relevant Treasury yield curve, plus an applicable credit-adjusted spread. Because this methodology includes unobservable inputs that reflect our own internal assumptions and calculations, the measurement of estimated fair values related to our notes receivable and mortgages payable is categorized as level three on the three-level valuation hierarchy. The estimated fair values of our senior notes and bonds payable are based upon indicative market prices and recent trading activity of our senior notes and bonds payable. Because this methodology includes inputs that are less observable by the public and are not necessarily reflected in active markets, the measurement of the estimated fair values, related to our notes and bonds payable, is categorized as level two on the three-level valuation hierarchy. We record interest rate swaps on the consolidated balance sheet at fair value. The fair value of our interest rate swaps are based on valuation techniques including discounted cash flow analysis on the expected cash flows of each swap, using both observable and unobservable market-based inputs, including interest rate curves. Because this methodology uses observable and unobservable inputs, the measurement of interest rate swaps is categorized as level two on the three-level valuation hierarchy.
40

16. Supplemental Disclosures of Cash Flow Information
Cash paid for interest was $229.5 million in 2015, $207.3 million in 2014, and $166.1 million in 2013.
Interest capitalized to properties under development was $594,000 in 2015, $444,000 in 2014, and $537,000 in 2013.
Cash paid for income taxes was $3.1 million in 2015, $3.7 million in 2014, and $2.1 million in 2013.
The following non-cash activities are included in the accompanying consolidated financial statements: A. See “Provisions for Impairment” in note 2 for a discussion of provisions for impairments recorded by Realty
Income and Crest.
B. See note 9 for a discussion of the $6.0 million excess of redemption value over carrying value of preferred shares subject to redemption charge recorded by Realty Income during 2014.
C. During 2014, we assumed mortgages payable to third-party lenders of $166.7 million, recorded $604,000 of net premiums, and recorded $901,000 of interest rate swap value to other assets, net, related to property acquisitions. During 2013, we assumed mortgages payable (excluding the mortgages payable discussed in items D and E) of $81.3 million to third-party lenders and recorded $6.1 million of net premiums related to property acquisitions.
D. During 2013, the following components were acquired in connection with our acquisition of ARCT: (1) real estate investments and related intangible assets of $3.2 billion, (2) other assets of $19.5 million, (3) lines of credit payable of $317.2 million, (4) a term loan for $235.0 million, (5) mortgages payable of $539.0 million, (6) intangible liabilities of $79.7 million, (7) other liabilities of $29.0 million, and (8) noncontrolling interests of $14.0 million.
E. During 2013, we acquired $55.9 million of real estate through the assumption of a $32.4 million mortgage payable, the issuance of 534,546 units by Realty Income, L.P. and cash of $1.0 million.
F. During 2014, we applied $48.9 million of loans receivable to the purchase price of five acquired properties.
G. During 2014, we acquired real estate for $11.6 million via exchanges of our properties. During 2013, we acquired real estate for $7.4 million via exchanges of our properties.
H. During 2013, we recorded receivables of $1.9 million for the taking of two investment properties as a result of an eminent domain action.
I. Accrued costs on properties under development resulted in an increase in buildings and improvements and accounts payable of $4.0 million and $5.5 million at December 31, 2014 and 2013, respectively.
17. Employee Benefit Plan
We have a 401(k) plan covering substantially all of our employees. Under our 401(k) plan, employees may elect to make contributions to the plan up to a maximum of 60% of their compensation, subject to limits under the Code. We match 50% of each of our employee's salary deferrals up to the first 6% of the employee's eligible compensation. Our aggregate matching contributions each year have been immaterial to our results of operations. 18. Common Stock Incentive Plan In 2012, our Board of Directors adopted and stockholders approved the Realty Income Corporation 2012 Incentive Award Plan, or the 2012 Plan, to enable us to motivate, attract and retain the services of directors and employees considered essential to our long-term success. The 2012 Plan offers our directors and employees an opportunity to own stock in Realty Income or rights that will reflect our growth, development and financial success. Under the terms of the 2012 plan, the aggregate number of shares of our common stock subject to options, restricted stock, stock appreciation rights, restricted stock units and other awards, will be no more than 3,985,734 shares. The 2012 Plan has a term of ten years from the date it was adopted by our Board of Directors. The amount of share-based compensation costs recognized in general and administrative expense on our consolidated statements of income was $10.4 million during 2015, $12.0 million during 2014, and $20.8 million during 2013.
41

A. Restricted Stock
The following table summarizes our common stock grant activity under our 2012 Plan. Our outstanding restricted stock vests over periods ranging from immediately to five years.
2015 2014 2013 Number of Weighted Number of Weighted Number of Weighted
shares average
price(1) shares average
price(1) shares average
price(1) Outstanding nonvested
shares, beginning of year 527,176 $ 29.02 722,263 $ 23.37 895,550 $ 19.94 Shares granted 161,949 $ 50.87 262,655 $ 39.87 484,060 $ 41.13 Shares vested (205,248 ) $ 37.70 (440,348 ) $ 36.88 (654,650 ) $ 30.91 Shares forfeited (27,595 ) $ 45.58 (17,394 ) $ 39.07 (2,697 ) $ 37.30 Outstanding nonvested
shares, end of each period 456,282 $ 30.46 527,176 $ 29.02 722,263 $ 23.37
(1) Grant date fair value.
During 2015, we issued 161,949 shares of common stock under the 2012 Plan. These shares generally vest over a five- year service period. However, one grant of 4,964 shares vested immediately, and of the 28,000 shares which are granted annually to our Board of Directors, 12,000 shares vested immediately, 8,000 shares vest in one year following the grant (assuming continued service), and 8,000 shares vest over a three year service period. Not included in the table above are 10,269 restricted stock units granted during 2015 that vest over a five year service period and have the same economic rights as shares of restricted stock.
The vesting schedule for shares granted to non-employee directors is as follows: − For directors with less than six years of service at the date of grant, shares vest in 33.33% increments on
each of the first three anniversaries of the date the shares of stock are granted; − For directors with six years of service at the date of grant, shares vest in 50% increments on each of the first
two anniversaries of the date the shares of stock are granted; − For directors with seven years of service at the date of grant, shares are 100% vested on the first
anniversary of the date the shares of stock are granted; and − For directors with eight or more years of service at the date of grant, there is immediate vesting as of the
date the shares of stock are granted. For shares granted on or after January 1, 2015, shares granted to employees typically vest in 20% increments on each of the first five anniversaries of the grant date. For shares granted prior to December 2014, the typical vesting schedule for shares granted to employees was as follows: − For employees age 55 and below at the grant date, shares vest in 20% increments on each of the first five
anniversaries of the grant date; − For employees age 56 at the grant date, shares vest in 25% increments on each of the first four
anniversaries of the grant date; − For employees age 57 at the grant date, shares vest in 33.33% increments on each of the first three
anniversaries of the grant date; − For employees age 58 at the grant date, shares vest in 50% increments on each of the first two
anniversaries of the grant date; − For employees age 59 at the grant date, shares are 100% vested on the first anniversary of the grant date;
and − For employees age 60 and above at the grant date, shares vest immediately on the grant date.
After being employed for six full months, all non-executive employees receive approximately 200 shares of restricted stock which vests over a five year period. Additionally, depending on certain company performance metrics or attainment of individual achievements, non-executive employees may receive grants of restricted stock which vests over a five year period. 42
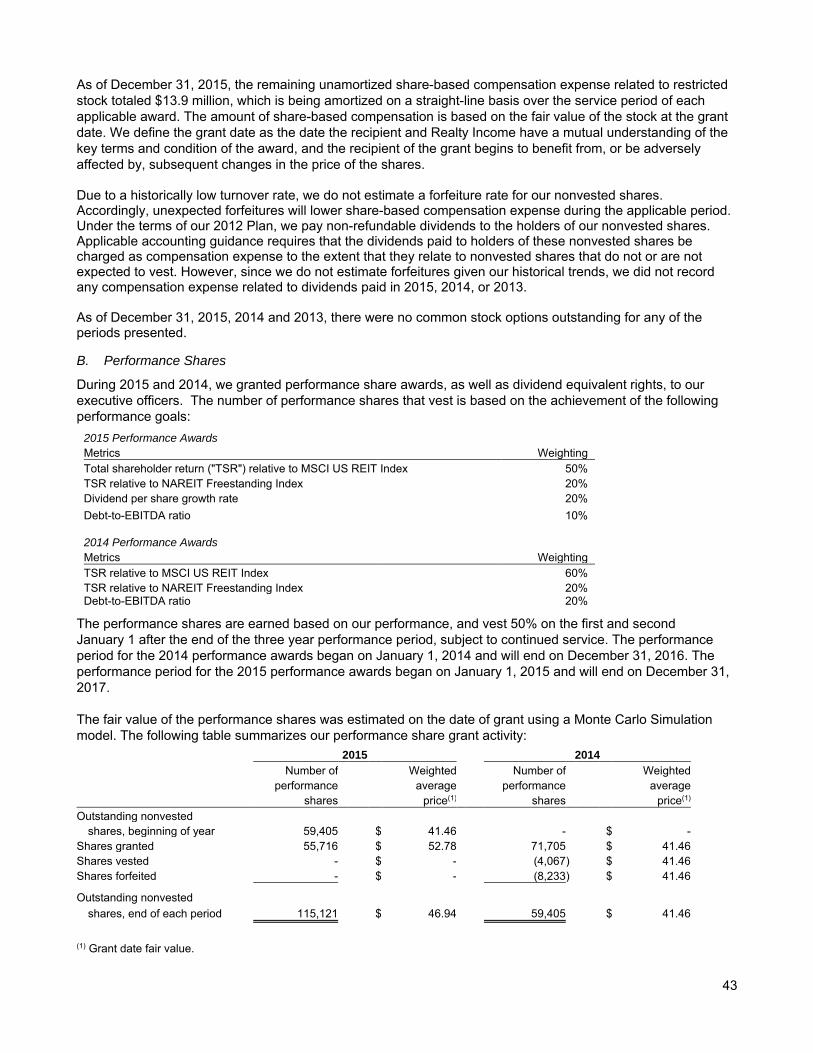
As of December 31, 2015, the remaining unamortized share-based compensation expense related to restricted stock totaled $13.9 million, which is being amortized on a straight-line basis over the service period of each applicable award. The amount of share-based compensation is based on the fair value of the stock at the grant date. We define the grant date as the date the recipient and Realty Income have a mutual understanding of the key terms and condition of the award, and the recipient of the grant begins to benefit from, or be adversely affected by, subsequent changes in the price of the shares. Due to a historically low turnover rate, we do not estimate a forfeiture rate for our nonvested shares. Accordingly, unexpected forfeitures will lower share-based compensation expense during the applicable period. Under the terms of our 2012 Plan, we pay non-refundable dividends to the holders of our nonvested shares. Applicable accounting guidance requires that the dividends paid to holders of these nonvested shares be charged as compensation expense to the extent that they relate to nonvested shares that do not or are not expected to vest. However, since we do not estimate forfeitures given our historical trends, we did not record any compensation expense related to dividends paid in 2015, 2014, or 2013. As of December 31, 2015, 2014 and 2013, there were no common stock options outstanding for any of the periods presented. B. Performance Shares
During 2015 and 2014, we granted performance share awards, as well as dividend equivalent rights, to our executive officers. The number of performance shares that vest is based on the achievement of the following performance goals:
2015 Performance Awards Metrics Weighting Total shareholder return ("TSR") relative to MSCI US REIT Index 50% TSR relative to NAREIT Freestanding Index 20% Dividend per share growth rate 20% Debt-to-EBITDA ratio 10%
2014 Performance Awards Metrics Weighting TSR relative to MSCI US REIT Index 60% TSR relative to NAREIT Freestanding Index 20% Debt-to-EBITDA ratio 20%
The performance shares are earned based on our performance, and vest 50% on the first and second January 1 after the end of the three year performance period, subject to continued service. The performance period for the 2014 performance awards began on January 1, 2014 and will end on December 31, 2016. The performance period for the 2015 performance awards began on January 1, 2015 and will end on December 31, 2017. The fair value of the performance shares was estimated on the date of grant using a Monte Carlo Simulation model. The following table summarizes our performance share grant activity: 2015 2014
Number of Weighted Number of Weighted performance average performance average
shares price(1) shares price(1) Outstanding nonvested
shares, beginning of year 59,405 $ 41.46 - $ - Shares granted 55,716 $ 52.78 71,705 $ 41.46 Shares vested - $ - (4,067 ) $ 41.46 Shares forfeited - $ - (8,233 ) $ 41.46
Outstanding nonvested shares, end of each period 115,121 $ 46.94 59,405 $ 41.46
(1) Grant date fair value.
43

As of December 31, 2015, the remaining share-based compensation expense related to the performance shares totaled $3.2 million. The portion related to the market-based awards is being recognized on a straight-line basis over the service period, and the portion related to the performance-based awards is being recognized on a tranche-by-tranche basis over the service period.
19. Dividend Reinvestment and Stock Purchase Plan Our Dividend Reinvestment and Stock Purchase Plan, or the DRSPP, provides our common stockholders, as well as new investors, with a convenient and economical method of purchasing our common stock and reinvesting their distributions. The DRSPP also allows our current stockholders to buy additional shares of common stock by reinvesting all or a portion of their distributions. The DRSPP authorizes up to 26,000,000 common shares to be issued. During 2015, we issued 7,608,354 shares and raised approximately $363.0 million under the DRSPP. During 2014, we issued 3,527,166 shares and raised approximately $158.5 million under the DRSPP. During 2013, we issued 1,449,139 shares and raised approximately $55.6 million under the DRSPP. From the inception of the DRSPP through December 31, 2015, we have issued 12,699,862 shares and raised approximately $581.6 million. In 2013, we revised our DRSPP so that we would pay for a majority of the plan-related fees, which were previously paid by investors, and to institute a waiver approval process, allowing larger investors or institutions, per a formal approval process, to purchase shares at a small discount, if approved by us. During 2015, we issued 7,413,207 shares and raised $353.7 million under the waiver approval process. In 2014, we issued 3,330,556 shares and raised $150.0 million under the waiver approval process. In 2013, we issued 1,308,490 shares and raised $50.0 million under the waiver approval process. These shares are included in the total activity noted in the preceding paragraph. 20. At-the-Market (ATM) Program In September 2015, we established an “at the market” equity distribution program, or our ATM program, pursuant to which we can offer and sell up to 12,000,000 shares of common stock to, or through a consortium of banks acting as our sales agents by means of ordinary brokers’ transactions on the NYSE or otherwise at market prices prevailing at the time of sale, at prices related to prevailing market prices or at negotiated prices. During 2015, we issued 714,301 shares and raised approximately $36.3 million under the ATM program. 21. Segment Information
We evaluate performance and make resource allocation decisions on an industry by industry basis. For financial reporting purposes, we have grouped our tenants into 48 activity segments. All of the properties are incorporated into one of the applicable segments. Because almost all of our leases require the tenant to pay operating expenses, rental revenue is the only component of segment profit and loss we measure. The following tables set forth certain information regarding the properties owned by us, classified according to the business of the respective tenants (dollars in thousands):
44

Assets, as of December 31: 2015 2014 Segment net real estate:
Apparel $ 180,175 $ 185,237 Automotive service 129,328 120,660 Automotive tire services 247,200 255,447 Beverages 297,724 302,001 Child care 52,392 54,194 Convenience stores 724,972 752,047 Dollar stores 1,158,948 1,165,560 Drug stores 1,384,506 1,036,697 Financial services 254,022 262,095 Grocery stores 331,565 341,773 Health and fitness 839,872 546,583 Health care 220,018 227,084 Home improvement 268,974 227,733 Restaurants-casual dining 419,455 449,211 Restaurants-quick service 467,643 336,753 Theaters 371,617 375,982 Transportation services 686,041 661,053 Wholesale club 452,563 465,569 30 other non-reportable segments 2,131,869 2,015,861
Total segment net real estate 10,618,884 9,781,540
Intangible assets: Apparel 48,116 52,444 Automotive service 19,131 2,909 Automotive tire services 13,202 14,871 Beverages 2,538 2,797 Convenience stores 16,040 17,535 Dollar stores 56,420 58,691 Drug stores 189,433 194,905 Financial services 34,626 39,564 Grocery stores 42,823 46,964 Health and fitness 65,037 66,460 Health care 29,950 35,017 Home improvement 42,630 35,726 Restaurants-casual dining 9,392 10,649 Restaurants-quick service 32,612 16,415 Theaters 17,673 21,601 Transportation services 92,602 101,040 Wholesale club 36,215 39,707 Other non-reportable segments 285,977 282,429
Goodwill:
Automotive service 448 451 Automotive tire services 865 865 Child care 5,034 5,095 Convenience stores 2,009 2,023 Restaurants-casual dining 2,215 2,279 Restaurants-quick service 1,082 1,085 Other non-reportable segments 3,668 3,672
Other corporate assets 197,248 175,888 Total assets $ 11,865,870 $ 11,012,622
45

Revenue for the years ended December 31, 2015 2014 2013 Segment rental revenue:
Apparel $ 19,819 $ 17,674 $ 13,851 Automotive service 18,632 16,548 15,606 Automotive tire services 28,627 28,222 27,002 Beverages 25,451 25,147 24,848 Child care 19,949 20,022 20,705 Convenience stores 90,093 89,754 83,973 Dollar stores 88,126 85,049 46,742 Drug stores 103,324 84,625 60,529 Financial services 17,044 16,828 14,904 Grocery stores 29,506 27,270 22,317 Health and fitness 75,881 62,086 46,979 Health care 16,057 16,039 14,358 Home improvement 23,112 15,593 11,456 Restaurants-casual dining 37,645 38,473 38,149 Restaurants-quick service 41,407 33,388 32,340 Theaters 49,456 47,102 46,122 Transportation services 51,745 46,287 40,552 Wholesale club 37,391 36,588 29,448 30 other non-reportable segments 203,600 186,762 158,337
Total rental revenue 976,865 893,457 748,218 Tenant reimbursements 42,015 37,118 24,944 Other revenue 4,405 2,930 7,047 Total revenue $ 1,023,285 $ 933,505 $ 780,209
22. Commitments and Contingencies
In the ordinary course of business, we are party to various legal actions which we believe are routine in nature and incidental to the operation of our business. We believe that the outcome of the proceedings will not have a material adverse effect upon our consolidated financial position or results of operations. At December 31, 2015, we had commitments of $714,000 for re-leasing costs, recurring capital expenditures, and non-recurring building improvements. In addition, as of December 31, 2015, we had committed $70.6 million under construction contracts, which is expected to be paid in the next twelve months. We have certain properties that are subject to ground leases which are accounted for as operating leases. At December 31, 2015, minimum future rental payments for the next five years and thereafter are as follows (dollars in millions):
Ground Leases
Ground Leases
Paid by Paid by
Realty
Income (1) Our
Tenants (2) Total 2016 $ 1.5 $ 13.3 $ 14.8 2017 1.5 13.3 14.8 2018 1.6 13.3 14.9 2019 1.4 13.2 14.6 2020 1.4 13.0 14.4 Thereafter 23.3 119.0 142.3
Total $ 30.7 $ 185.1 $ 215.8
(1) Realty Income currently pays the ground lessors directly for the rent under the ground leases. (2) Our tenants, who are generally sub-tenants under the ground leases, are responsible for paying the rent under
these ground leases. In the event a tenant fails to pay the ground lease rent, we are primarily responsible.
46

23. Subsequent Events
In January 2016 and February 2016, we declared the following dividends, which will be paid in February 2016 and March 2016, respectively:
• $0.1985 per share to our common stockholders and • $0.138021 per share to our Class F preferred stockholders. During January and February of 2016, we repaid five mortgages in full for $129.6 million. REALTY INCOME CORPORATION AND SUBSIDIARIES
Consolidated Quarterly Financial Data (DOLLARS IN THOUSANDS, EXCEPT PER SHARE DATA) (NOT COVERED BY REPORT OF INDEPENDENT REGISTERED PUBLIC ACCOUNTING FIRM) First Second Third Fourth
Quarter Quarter Quarter Quarter Year (2)
2015 (1) Total revenue $ 246,867 $ 253,860 $ 258,889 $ 263,668 $ 1,023,285
Depreciation and amortization expense 98,037 101,101 104,338 105,739 409,215 Interest expense 58,468 58,680 63,950 51,982 233,079 Other expenses 29,999 31,404 29,012 27,962 118,379 Income from continuing operations 67,581 66,350 67,813 83,111 284,855 Income from discontinued operations - - - - - Net income 67,581 66,350 67,813 83,111 284,855 Net income available to common stockholders 60,494 59,317 60,705 76,171 256,686 Net income per common share
Basic 0.27 0.26 0.26 0.31 1.09 Diluted 0.27 0.25 0.26 0.31 1.09 Dividends paid per common share 0.5614167 0.5685000 0.5700000 0.5715000 2.2714167
2014 (1) Total revenue $ 221,572 $ 228,646 $ 235,713 $ 247,573 $ 933,505
Depreciation and amortization expense 89,970 92,894 95,260 96,537 374,661 Interest expense 51,720 52,712 52,814 59,120 216,366 Other expenses 26,237 22,783 24,987 38,536 112,543 Income from continuing operations 54,916 62,221 73,627 78,374 269,140 Income from discontinued operations 3,077 20 - (297 ) 2,800 Net income 57,993 62,241 73,627 78,077 271,940 Net income available to common stockholders 47,179 51,420 57,941 71,018 227,558 Net income per common share
Basic 0.23 0.23 0.26 0.32 1.04 Diluted 0.23 0.23 0.26 0.32 1.04
Dividends paid per common share 0.5614167 0.5685000 0.5700000 0.5715000 2.1916254
(1) The consolidated quarterly financial data includes revenues and expenses from our continuing and discontinued operations. The
results of operations related to certain properties, classified as held for sale or disposed of, have been reclassified to income from discontinued operations. Additionally, tenant reimbursements have been reported as a component of total revenue and reimbursable property expense have been reported as a component of total expenses. Therefore, some of the information may not agree to our previously filed 10-Qs.
(2) Amounts for each period are calculated independently. The sum of the quarters may differ from the annual amount.
47
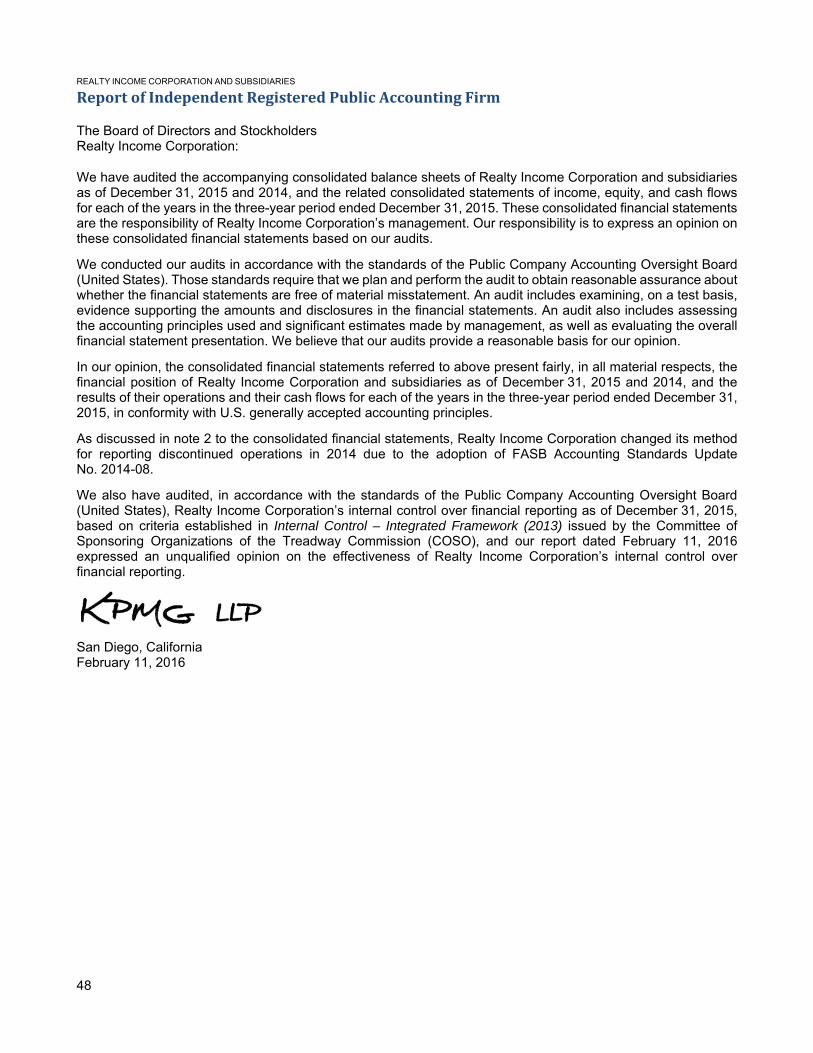
REALTY INCOME CORPORATION AND SUBSIDIARIES
Report of Independent Registered Public Accounting Firm The Board of Directors and Stockholders Realty Income Corporation:
We have audited the accompanying consolidated balance sheets of Realty Income Corporation and subsidiaries as of December 31, 2015 and 2014, and the related consolidated statements of income, equity, and cash flows for each of the years in the three-year period ended December 31, 2015. These consolidated financial statements are the responsibility of Realty Income Corporation’s management. Our responsibility is to express an opinion on these consolidated financial statements based on our audits.
We conducted our audits in accordance with the standards of the Public Company Accounting Oversight Board (United States). Those standards require that we plan and perform the audit to obtain reasonable assurance about whether the financial statements are free of material misstatement. An audit includes examining, on a test basis, evidence supporting the amounts and disclosures in the financial statements. An audit also includes assessing the accounting principles used and significant estimates made by management, as well as evaluating the overall financial statement presentation. We believe that our audits provide a reasonable basis for our opinion.
In our opinion, the consolidated financial statements referred to above present fairly, in all material respects, the financial position of Realty Income Corporation and subsidiaries as of December 31, 2015 and 2014, and the results of their operations and their cash flows for each of the years in the three-year period ended December 31, 2015, in conformity with U.S. generally accepted accounting principles.
As discussed in note 2 to the consolidated financial statements, Realty Income Corporation changed its method for reporting discontinued operations in 2014 due to the adoption of FASB Accounting Standards Update No. 2014-08.
We also have audited, in accordance with the standards of the Public Company Accounting Oversight Board (United States), Realty Income Corporation’s internal control over financial reporting as of December 31, 2015, based on criteria established in Internal Control – Integrated Framework (2013) issued by the Committee of Sponsoring Organizations of the Treadway Commission (COSO), and our report dated February 11, 2016 expressed an unqualified opinion on the effectiveness of Realty Income Corporation’s internal control over financial reporting.
San Diego, California February 11, 2016
48

REALTY INCOME CORPORATION AND SUBSIDIARIES
Report of Independent Registered Public Accounting Firm, Continued The Board of Directors and Stockholders Realty Income Corporation:
We have audited Realty Income Corporation’s internal control over financial reporting as of December 31, 2015, based on criteria established in Internal Control – Integrated Framework (2013) issued by the Committee of Sponsoring Organizations of the Treadway Commission (COSO). Realty Income Corporation’s management is responsible for maintaining effective internal control over financial reporting and for its assessment of the effectiveness of internal control over financial reporting, included in the accompanying Management’s Report on Internal Control over Financial Reporting. Our responsibility is to express an opinion on Realty Income Corporation’s internal control over financial reporting based on our audit.
We conducted our audit in accordance with the standards of the Public Company Accounting Oversight Board (United States). Those standards require that we plan and perform the audit to obtain reasonable assurance about whether effective internal control over financial reporting was maintained in all material respects. Our audit included obtaining an understanding of internal control over financial reporting, assessing the risk that a material weakness exists, and testing and evaluating the design and operating effectiveness of internal control based on the assessed risk. Our audit also included performing such other procedures as we considered necessary in the circumstances. We believe that our audit provides a reasonable basis for our opinion.
A company’s internal control over financial reporting is a process designed to provide reasonable assurance regarding the reliability of financial reporting and the preparation of financial statements for external purposes in accordance with generally accepted accounting principles. A company’s internal control over financial reporting includes those policies and procedures that (1) pertain to the maintenance of records that, in reasonable detail, accurately and fairly reflect the transactions and dispositions of the assets of the company; (2) provide reasonable assurance that transactions are recorded as necessary to permit preparation of financial statements in accordance with generally accepted accounting principles, and that receipts and expenditures of the company are being made only in accordance with authorizations of management and directors of the company; and (3) provide reasonable assurance regarding prevention or timely detection of unauthorized acquisition, use, or disposition of the company’s assets that could have a material effect on the financial statements.
Because of its inherent limitations, internal control over financial reporting may not prevent or detect misstatements. Also, projections of any evaluation of effectiveness to future periods are subject to the risk that controls may become inadequate because of changes in conditions, or that the degree of compliance with the policies or procedures may deteriorate.
In our opinion, Realty Income Corporation maintained, in all material respects, effective internal control over financial reporting as of December 31, 2015, based on Internal Control – Integrated Framework (2013) issued by the Committee of Sponsoring Organizations of the Treadway Commission (COSO).
We also have audited, in accordance with the standards of the Public Company Accounting Oversight Board (United States), the consolidated balance sheets of Realty Income Corporation and subsidiaries as of December 31, 2015 and 2014, and the related consolidated statements of income, equity and cash flows for each of the years in the three-year period ended December 31, 2015, and our report dated February 11, 2016 expressed an unqualified opinion on those consolidated financial statements.
San Diego, California February 11, 2016
49

REALTY INCOME CORPORATION AND SUBSIDIARIES
Business Description
THE COMPANY Realty Income, The Monthly Dividend Company®, is an S&P 500 real estate company with the primary business objective of generating dependable monthly cash dividends from a consistent and predictable level of cash flow from operations. Our monthly dividends are supported by the cash flow from our property portfolio. We have in-house acquisition, portfolio management, asset management, credit research, real estate research, legal, finance and accounting, information technology, and capital markets capabilities. Over the past 47 years, Realty Income has been acquiring and managing freestanding commercial properties that generate rental revenue under long-term net lease agreements. Realty Income (NYSE: O) was founded in 1969, and listed on the New York Stock Exchange, or NYSE, in 1994. We elected to be taxed as a real estate investment trust, or REIT, requiring us to distribute dividends to our stockholders aggregating at least 90% of our taxable income (excluding net capital gains). We seek to increase earnings and distributions to stockholders through active portfolio management, asset management and the acquisition of additional properties. Generally, our portfolio and asset management efforts seek to achieve:
• Contractual rent increases on existing leases; • Rent increases at the termination of existing leases, when market conditions permit; • Optimum exposure to certain tenants and markets through re-leasing vacant properties and selectively
selling properties; • Maximum asset-level returns on properties re-leased and/or sold; • Optimum value of the existing portfolio by enhancing individual properties, pursuing alternative uses, and
deriving ancillary revenue; and • Investment opportunities in new asset classes for the portfolio. At December 31, 2015, we owned a diversified portfolio:
• Of 4,538 properties; • With an occupancy rate of 98.4%, or 4,467 properties leased and 71 properties available for lease; • Leased to 240 different commercial tenants doing business in 47 separate industries; • Located in 49 states and Puerto Rico; • With over 76.0 million square feet of leasable space; and • With an average leasable space per property of approximately 16,750 square feet; approximately 11,550
square feet per retail property and 216,550 square feet per industrial property. Of the 4,538 properties in the portfolio, 4,519, or 99.6%, are single-tenant properties, and the remaining are multi-tenant properties. At December 31, 2015, of the 4,519 single-tenant properties, 4,448 were leased with a weighted average remaining lease term (excluding rights to extend a lease at the option of the tenant) of approximately 10.0 years. Our ten senior officers owned 0.2% of our outstanding common stock with a market value of $30.6 million at January 29, 2016. Our directors and ten senior officers, as a group, owned 0.3% of our outstanding common stock with a market value of $46.5 million at January 29, 2016. Our common stock is listed on the NYSE under the ticker symbol "O" with a CUSIP number of 756109-104. Our central index key number is 726728. Our 6.625% Monthly Income Class F Cumulative Redeemable Preferred Stock, or the Class F preferred stock, is listed on the NYSE under the ticker symbol “OprF” with a CUSIP number of 756109-807. In January 2016, we had 132 employees, as compared to 125 employees in January 2015.
50
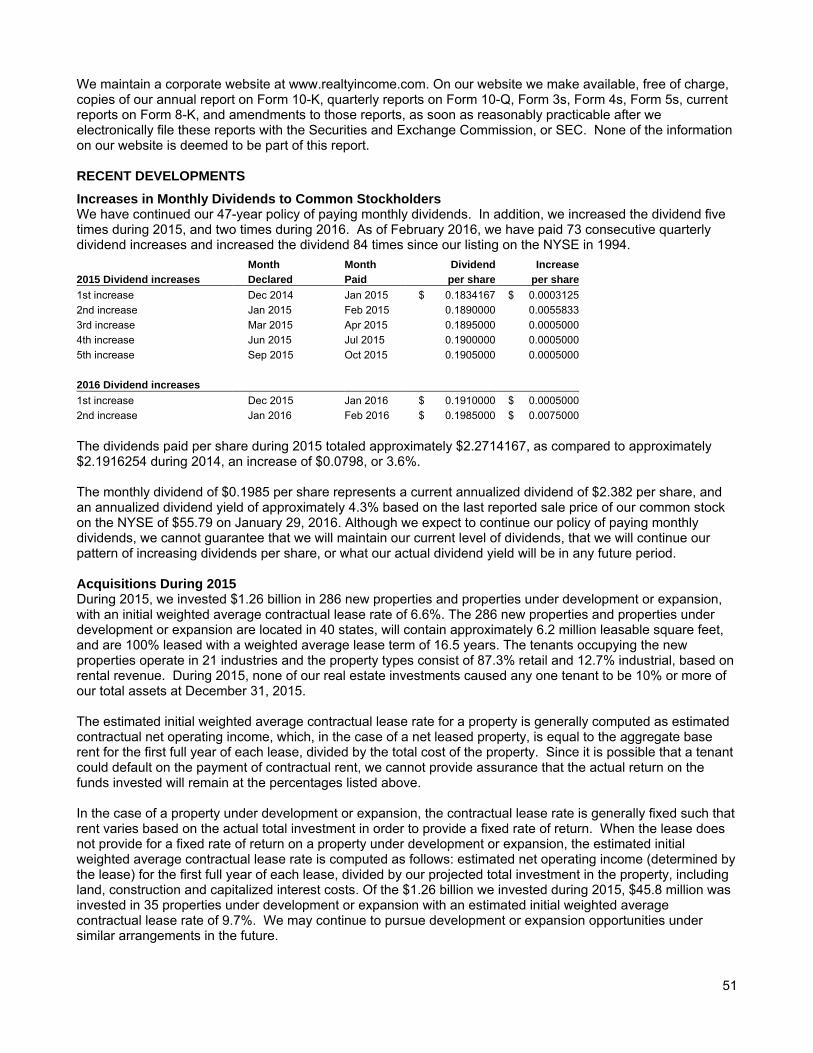
We maintain a corporate website at www.realtyincome.com. On our website we make available, free of charge, copies of our annual report on Form 10-K, quarterly reports on Form 10-Q, Form 3s, Form 4s, Form 5s, current reports on Form 8-K, and amendments to those reports, as soon as reasonably practicable after we electronically file these reports with the Securities and Exchange Commission, or SEC. None of the information on our website is deemed to be part of this report. RECENT DEVELOPMENTS Increases in Monthly Dividends to Common Stockholders We have continued our 47-year policy of paying monthly dividends. In addition, we increased the dividend five times during 2015, and two times during 2016. As of February 2016, we have paid 73 consecutive quarterly dividend increases and increased the dividend 84 times since our listing on the NYSE in 1994. Month Month Dividend Increase 2015 Dividend increases Declared Paid per share per share 1st increase Dec 2014 Jan 2015 $ 0.1834167 $ 0.0003125 2nd increase Jan 2015 Feb 2015 0.1890000 0.0055833 3rd increase Mar 2015 Apr 2015 0.1895000 0.0005000 4th increase Jun 2015 Jul 2015 0.1900000 0.0005000 5th increase Sep 2015 Oct 2015 0.1905000 0.0005000
2016 Dividend increases 1st increase Dec 2015 Jan 2016 $ 0.1910000 $ 0.0005000 2nd increase Jan 2016 Feb 2016 $ 0.1985000 $ 0.0075000 The dividends paid per share during 2015 totaled approximately $2.2714167, as compared to approximately $2.1916254 during 2014, an increase of $0.0798, or 3.6%. The monthly dividend of $0.1985 per share represents a current annualized dividend of $2.382 per share, and an annualized dividend yield of approximately 4.3% based on the last reported sale price of our common stock on the NYSE of $55.79 on January 29, 2016. Although we expect to continue our policy of paying monthly dividends, we cannot guarantee that we will maintain our current level of dividends, that we will continue our pattern of increasing dividends per share, or what our actual dividend yield will be in any future period. Acquisitions During 2015 During 2015, we invested $1.26 billion in 286 new properties and properties under development or expansion, with an initial weighted average contractual lease rate of 6.6%. The 286 new properties and properties under development or expansion are located in 40 states, will contain approximately 6.2 million leasable square feet, and are 100% leased with a weighted average lease term of 16.5 years. The tenants occupying the new properties operate in 21 industries and the property types consist of 87.3% retail and 12.7% industrial, based on rental revenue. During 2015, none of our real estate investments caused any one tenant to be 10% or more of our total assets at December 31, 2015. The estimated initial weighted average contractual lease rate for a property is generally computed as estimated contractual net operating income, which, in the case of a net leased property, is equal to the aggregate base rent for the first full year of each lease, divided by the total cost of the property. Since it is possible that a tenant could default on the payment of contractual rent, we cannot provide assurance that the actual return on the funds invested will remain at the percentages listed above. In the case of a property under development or expansion, the contractual lease rate is generally fixed such that rent varies based on the actual total investment in order to provide a fixed rate of return. When the lease does not provide for a fixed rate of return on a property under development or expansion, the estimated initial weighted average contractual lease rate is computed as follows: estimated net operating income (determined by the lease) for the first full year of each lease, divided by our projected total investment in the property, including land, construction and capitalized interest costs. Of the $1.26 billion we invested during 2015, $45.8 million was invested in 35 properties under development or expansion with an estimated initial weighted average contractual lease rate of 9.7%. We may continue to pursue development or expansion opportunities under similar arrangements in the future.
51

PORTFOLIO DISCUSSION
Leasing Results At December 31, 2015, we had 71 properties available for lease out of 4,538 properties in our portfolio, which represents a 98.4% occupancy rate based on the number of properties in our portfolio. Since December 31, 2014, when we reported 70 properties available for lease out of 4,327 and a 98.4% occupancy rate, we:
• Had 283 lease expirations; • Re-leased 253 properties; and • Sold 29 vacant properties.
Of the 253 properties re-leased during 2015, 216 properties were re-leased to existing tenants, seven were re-leased to new tenants without vacancy, and 30 were re-leased to new tenants after a period of vacancy. The annual rent on these 253 leases was $37.46 million, as compared to the previous rent on these same properties of $37.12 million, which represents a rent recapture rate of 100.9% on the properties re-leased during 2015. At December 31, 2015, our average annualized rental revenue was approximately $13.31 per square foot on the 4,467 leased properties in our portfolio. At December 31, 2015, we classified ten properties with a carrying amount of $9.8 million as held for sale on our balance sheet. The expected disposal of these properties does not represent a strategic shift that will have a major effect on our operations and financial results. Investments in Existing Properties In 2015, we capitalized costs of $11.5 million on existing properties in our portfolio, consisting of $748,000 for re-leasing costs, $7.6 million for recurring capital expenditures and $3.2 million for non-recurring building improvements. In 2014, we capitalized costs of $6.0 million on existing properties in our portfolio. As part of our re-leasing costs, we typically pay leasing commissions and sometimes provide tenant rent concessions. Leasing commissions are paid based on the commercial real estate industry standard and any rent concessions provided are minimal. We do not consider the collective impact of the leasing commissions or tenant rent concessions to be material to our financial position or results of operations. The majority of our building improvements relate to roof repairs, HVAC improvements, and parking lot resurfacing and replacements. It is not customary for us to offer significant tenant improvements on our properties as tenant incentives. The amounts of our capital expenditures can vary significantly, depending on the rental market, tenant credit worthiness, the lease term and the willingness of tenants to pay higher rents over the terms of the leases. At-the-Market (ATM) Program In September 2015, we established an “at the market” equity distribution program, or our ATM program, pursuant to which we can offer and sell up to 12,000,000 shares of common stock to, or through a consortium of banks acting as our sales agents by means of ordinary brokers’ transactions on the NYSE or otherwise at market prices prevailing at the time of sale, at prices related to prevailing market prices or at negotiated prices. During 2015, we issued 714,301 shares and raised approximately $36.3 million under the ATM program. New Credit Facility In June 2015, we closed on a $2.25 billion unsecured credit facility, or our new credit facility. Our new credit facility is comprised of a $2.0 billion revolving credit facility and a $250 million five-year unsecured term loan. As of December 31, 2015, $1.76 billion was available on our new credit facility to fund additional acquisitions and for other general corporate purposes. Inclusion in S&P Indices In January 2015, we were added to the S&P High Yield Dividend Aristocrats® index. In April 2015, we were added to the S&P 500 index and are one of 26 REITs, and the only net lease REIT included in this index. Issuance of Common Stock In April 2015, we issued 5,500,000 shares of common stock. After underwriting discounts and other offering costs of $1.4 million, the net proceeds of $276.4 million were used to repay borrowings under our previous $1.5 billion unsecured credit facility.
52

In October 2015, we issued 11,500,000 shares of common stock, including 1,500,000 shares purchased by the underwriters upon the exercise of their option to purchase additional shares. After underwriting discounts and other offering costs of $22.0 million, a portion of the net proceeds of $517.1 million was used to repay borrowings under our new credit facility and the remaining portion was used for other general corporate purposes, including acquisitions. Dividend Reinvestment and Stock Purchase Plan Our Dividend Reinvestment and Stock Purchase Plan, or the DRSPP, provides our common stockholders, as well as new investors, with a convenient and economical method of purchasing our common stock and reinvesting their distributions. The DRSPP also allows our current stockholders to buy additional shares of common stock by reinvesting all or a portion of their distributions. The DRSPP authorizes up to 26,000,000 common shares to be issued. In 2013, we revised our DRSPP so that we would pay for a majority of the plan-related fees, which were previously paid by investors, and to institute a waiver approval process, allowing larger investors or institutions, per a formal approval process, to purchase shares at a small discount, if approved by us. During 2015, we issued 7,608,354 shares and raised approximately $363.0 million under the DRSPP, of which 7,413,207 shares and $353.7 million was raised under the waiver approval process. Net Income Available to Common Stockholders Net income available to common stockholders was $256.7 million in 2015, compared to $227.6 million in 2014, an increase of $29.1 million. On a diluted per common share basis, net income was $1.09 in 2015, as compared to $1.04 in 2014, an increase of $0.05, or 4.8%. Net income available to common stockholders for 2014 includes a non-cash redemption charge of $6.0 million on the shares of Class E preferred stock that were redeemed in October 2014, which represents $0.03 on a diluted per common share basis. This charge is for the excess of redemption value over the carrying value of the Class E preferred stock and represents the original issuance cost that was paid in 2006. The calculation to determine net income available to common stockholders includes impairments and/or gains from the sale of properties. The amount of impairments and/or gains varies from period to period based on the timing of property sales and can significantly impact net income available to common stockholders. Gains from the sale of properties during 2015 were $22.2 million, as compared to gains from the sale of properties of $42.1 million during 2014. Funds from Operations (FFO) Available to Common Stockholders In 2015, our FFO increased by $89.5 million, or 15.9%, to $652.4 million, compared to $562.9 million in 2014. On a diluted per common share basis, FFO was $2.77 in 2015, compared to $2.58 in 2014, an increase of $0.19, or 7.4%. Our FFO in 2014 included a non-cash redemption charge of $6.0 million on the shares of Class E preferred stock that were redeemed in October 2014, which represents $0.03 on a diluted per common share basis. Adjusted Funds from Operations (AFFO) Available to Common Stockholders In 2015, our AFFO increased by $85.3 million, or 15.2%, to $647.0 million versus $561.7 million in 2014. On a diluted per common share basis, AFFO was $2.74 in 2015, compared to $2.57 in 2014, an increase of $0.17, or 6.6%. See our discussion of FFO and AFFO (which are not financial measures under generally accepted accounting principles, or GAAP), later in the section entitled “Management’s Discussion and Analysis of Financial Condition and Results of Operations,” in this annual report, which includes a reconciliation of net income available to common stockholders to FFO and AFFO. DIVIDEND POLICY Distributions are paid monthly to holders of shares of our common stock and Class F preferred stock if, and when, declared by our Board of Directors. Distributions are paid monthly to the limited partners holding common units of Tau Operating Partnership, L.P. and Realty Income, L.P., each on a per unit basis that is generally equal to the amount paid per share to our common stockholders.
53

In order to maintain our status as a REIT for federal income tax purposes, we generally are required to distribute dividends to our stockholders aggregating annually at least 90% of our taxable income (excluding net capital gains), and we are subject to income tax to the extent we distribute less than 100% of our taxable income (including net capital gains). In 2015, our cash distributions to preferred and common stockholders totaled $560.3 million, or approximately 136.9% of our estimated taxable income of $409.4 million. Our estimated taxable income reflects non-cash deductions for depreciation and amortization. Our estimated taxable income is presented to show our compliance with REIT dividend requirements and is not a measure of our liquidity or operating performance. We intend to continue to make distributions to our stockholders that are sufficient to meet this dividend requirement and that will reduce or eliminate our exposure to income taxes. Furthermore, we believe our funds from operations are sufficient to support our current level of cash distributions to our stockholders. Our cash distributions to common stockholders in 2015 totaled $533.2 million, representing 82.4% of our adjusted funds from operations available to common stockholders of $647.0 million. In comparison, our 2014 cash distributions to common stockholders totaled $479.3 million, representing 85.3% of our adjusted funds from operations available to common stockholders of $561.7 million. The Class F preferred stockholders receive cumulative distributions at a rate of 6.625% per annum on the $25.00 per share liquidation preference (equivalent to $1.65625 per annum per share). Dividends on our Class F preferred stock are current. Future distributions will be at the discretion of our Board of Directors and will depend on, among other things, our results of operations, FFO, AFFO, cash flow from operations, financial condition, capital requirements, the annual distribution requirements under the REIT provisions of the Internal Revenue Code of 1986, as amended, or the Code, our debt service requirements, and any other factors the Board of Directors may deem relevant. In addition, our new credit facility contains financial covenants that could limit the amount of distributions payable by us in the event of a default, and which prohibit the payment of distributions on the common or preferred stock in the event that we fail to pay when due (subject to any applicable grace period) any principal or interest on borrowings under our new credit facility. Distributions of our current and accumulated earnings and profits for federal income tax purposes generally will be taxable to stockholders as ordinary income, except to the extent that we recognize capital gains and declare a capital gains dividend, or that such amounts constitute "qualified dividend income" subject to a reduced rate of tax. The maximum tax rate of non-corporate taxpayers for "qualified dividend income" is generally 20%. In general, dividends payable by REITs are not eligible for the reduced tax rate on qualified dividend income, except to the extent that certain holding requirements have been met with respect to the REIT’s stock and the REIT’s dividends are attributable to dividends received from certain taxable corporations (such as our taxable REIT subsidiaries) or to income that was subject to tax at the corporate or REIT level (for example, if we distribute taxable income that we retained and paid tax on in the prior taxable year). Distributions in excess of earnings and profits generally will first be treated as a non-taxable reduction in the stockholders' basis in their stock, but not below zero. Distributions in excess of that basis generally will be taxable as a capital gain to stockholders who hold their shares as a capital asset. Approximately 23.8% of the distributions to our common stockholders, made or deemed to have been made in 2015, were classified as a return of capital for federal income tax purposes. We estimate that in 2016, between 20% and 35% of the distributions may be classified as a return of capital. BUSINESS PHILOSOPHY AND STRATEGY Investment Philosophy We believe that owning an actively managed, diversified portfolio of commercial properties under long-term, net leases produces consistent and predictable income. A net lease typically requires the tenant to be responsible for monthly rent and certain property operating expenses including property taxes, insurance, and maintenance. In addition, tenants of our properties typically pay rent increases based on: (1) increases in the consumer price index (typically subject to ceilings), (2) fixed increases, or (3) additional rent calculated as a percentage of the tenants' gross sales above a specified level. We believe that a portfolio of properties under long-term, net leases generally produces a more predictable income stream than many other types of real estate portfolios, while continuing to offer the potential for growth in rental income. Diversification is also a key component of our investment philosophy. We believe that diversification of the portfolio by tenant, industry, geography, and, to a certain extent, property type leads to more predictable 54

investment results for our shareholders by reducing vulnerability that can come with any single concentration. Our investment efforts have led to a diversified property portfolio that, as of December 31, 2015, consisted of 4,538 properties located in 49 states and Puerto Rico, leased to 240 different commercial tenants doing business in 47 industries. Each of the 47 industries represented in our property portfolio individually accounted for no more than 10.9% of our rental revenue for the quarter ended December 31, 2015. Since 1970, our occupancy rate at the end of each year has never been below 96%. However, we cannot assure you that our future occupancy levels will continue to equal or exceed 96%. Investment Strategy Our investment strategy is to act as a source of capital to regional and national tenants by acquiring and leasing back their real estate locations. When identifying new properties for investment, we generally focus on acquiring the real estate tenants consider important to the successful operation of their business. We generally seek to acquire real estate that has the following characteristics:
• Properties that are freestanding, commercially-zoned with a single tenant; • Properties that are in significant markets or strategic locations critical to generating revenue for regional and
national tenants (i.e. they need the property in which they operate in order to conduct their business); • Properties that we deem to be profitable for the tenants and/or can generally be characterized as important
to the successful operations of the company’s business; • Properties that are located within attractive demographic areas relative to the business of our tenants, and
have good visibility and easy access to major thoroughfares; • Properties with real estate valuations that approximate replacement costs; • Properties with rental or lease payments that approximate market rents; and • Properties that can be purchased with the simultaneous execution or assumption of long-term, net lease
agreements, offering both current income and the potential for future rent increases. We seek to invest in industries in which several, well-organized, regional and national tenants are capturing market share through the selection of prime locations, service, quality control, economies of scale, strong consumer brands, and advertising. In addition, we frequently acquire large portfolios of single-tenant properties net leased to different tenants operating in a variety of industries. We have an internal team dedicated to sourcing such opportunities, often using our relationships with various tenants, owners/developers, and advisers to uncover and secure transactions. We also undertake thorough research and analysis to identify what we consider to be appropriate property locations, tenants, and industries for investment. This research expertise is instrumental to uncovering net lease opportunities in markets where we believe we can add value. In selecting potential investments, we look for tenants with the following attributes:
• Tenants with reliable and sustainable cash flow; • Tenants with revenue and cash flow from multiple sources; • Tenants that are willing to sign a long-term lease (10 or more years); and • Tenants that are large owners and users of real estate. From a retail perspective, our investment strategy is to target tenants that have a service, non-discretionary, and/or low-price-point component to their business. We believe these characteristics better position tenants to operate in a variety of economic conditions and to compete more effectively with internet retailers. As a result of the execution of this strategy, over 90% of our annualized retail rental revenue is derived from tenants with a service, non-discretionary, and/or low price point component to their business. From a non-retail perspective, we target industrial properties leased to Fortune 1000, primarily investment grade rated companies. We believe rental revenue generated from businesses with these characteristics is generally more durable and stable. After applying this investment strategy, we pursue those transactions where we can achieve an attractive investment spread over our cost of capital and favorable risk-adjusted returns. Underwriting Strategy We believe the principal financial obligations for most of our tenants typically include their bank and other debt, payment obligations to suppliers, and real estate lease obligations. Because we typically own the land and building in which a tenant conducts its business or which are critical to the tenant’s ability to generate revenue, we believe the risk of default on a tenant’s lease obligation is less than the tenant’s unsecured general
55

obligations. It has been our experience that tenants must retain their profitable and critical locations in order to survive. Therefore, in the event of reorganization, they are less likely to reject a lease of a profitable or critical location because this would terminate their right to use the property. Thus, as the property owner, we believe that we will fare better than unsecured creditors of the same tenant in the event of reorganization. If a property is rejected by the tenant during reorganization, we own the property and can either lease it to a new tenant or sell the property. In addition, we believe that the risk of default on real estate leases can be further mitigated by monitoring the performance of the tenants' individual locations and considering whether to proactively sell locations that are weaker performers. In order to be considered for acquisition, properties must meet stringent investment and credit requirements. The properties must generate attractive current yields and the tenant must meet our credit criteria. We have established a four-part analysis that examines each potential investment based on:
• Overall real estate characteristics, including property value and comparative rental rates; • Industry, company, market conditions, and credit profile; • Store profitability for retail locations, if profitability data is available; and • The importance of the real estate location to the operations of the tenants’ business. Prior to entering into any transaction, our research department conducts a review of a tenant’s credit quality. The information reviewed may include reports and filings, including any public credit ratings, financial statements, debt and equity analyst reports, and reviews of corporate credit spreads, stock prices, market capitalization, and other financial metrics. We conduct additional due diligence, including additional financial reviews of the tenant and a more comprehensive review of the business segment and industry in which the tenant operates. We continue to monitor our tenants’ credit quality on an ongoing basis by reviewing the available information previously discussed, and providing summaries of these findings to management. We estimate that approximately 44% of our annualized rental revenue comes from properties leased to investment grade rated companies or their subsidiaries. At December 31, 2015, our top 20 tenants represent approximately 55% of our annualized revenue and eight of these tenants have investment grade credit ratings or are subsidiaries of investment grade companies. Asset Management Strategy The active management of the property portfolio is an essential component of our long-term strategy. We continually monitor our portfolio for any changes that could affect the performance of our tenants, our tenants’ industries and the locations in which we have invested. We also regularly analyze our portfolio with a view towards optimizing its returns and enhancing its overall credit quality.
We regularly review and analyze:
• The quality of the underlying real estate locations; • The performance of the various industries of our tenants; and • The operation, management, business planning, and financial condition of our tenants.
We have an active asset management program that incorporates the sale of assets when we believe the reinvestment of the sale proceeds will: • Generate higher returns; • Enhance the credit quality of our real estate portfolio; • Extend our average remaining lease term; or • Decrease tenant or industry concentration.
At December 31, 2015, we classified ten properties with a carrying amount of $9.8 million as held for sale on our balance sheet. For 2016, we intend to continue our active disposition efforts to further enhance our real estate portfolio and anticipate $50 to $75 million in property sales in 2016. We intend to invest these proceeds into new property acquisitions, if there are attractive opportunities available. However, we cannot guarantee that we will sell properties during 2016 at our estimated values or be able to invest the property sale proceeds in new properties. Capital Philosophy Historically, we have met our long term capital needs by issuing common stock, preferred stock and long-term unsecured notes and bonds. Over the long-term, we believe that common stock should be the majority of our capital structure; however, we may issue additional preferred stock or debt securities. We may issue common 56

stock when we believe that our share price is at a level that allows for the proceeds of any offering to be accretively invested into additional properties. In addition, we may issue common stock to permanently finance properties that were financed by our new credit facility or debt securities. However, we cannot assure you that we will have access to the capital markets at times and at terms that are acceptable to us. Our primary cash obligations, for the current year and subsequent years, are included in the “Table of Obligations,” which is presented later in this section. We expect to fund our operating expenses and other short-term liquidity requirements, including property acquisitions and development costs, payment of principal and interest on our outstanding indebtedness, property improvements, re-leasing costs and cash distributions to common and preferred stockholders, primarily through cash provided by operating activities, borrowing on our new credit facility and periodically through public securities offerings. Conservative Capital Structure We believe that our stockholders are best served by a conservative capital structure. Therefore, we seek to maintain a conservative debt level on our balance sheet and solid interest and fixed charge coverage ratios. At December 31, 2015, our total outstanding borrowings of senior unsecured notes and bonds, term loans, mortgages payable and credit facility borrowings were $4.85 billion, or approximately 26.6% of our total market capitalization of $18.22 billion. We define our total market capitalization at December 31, 2015 as the sum of: • Shares of our common stock outstanding of 250,416,757, plus total common units outstanding of 648,386,
multiplied by the last reported sales price of our common stock on the NYSE of $51.63 per share on December 31, 2015, or $12.96 billion;
• Aggregate liquidation value (par value of $25.00 per share) of the Class F preferred stock of $408.8 million; • Outstanding borrowings of $238.0 million on our new credit facility; • Outstanding mortgages payable of $637.7 million, excluding net mortgage premiums of $9.1 million; • Outstanding borrowings of $320.0 million on our term loans; and • Outstanding senior unsecured notes and bonds of $3.65 billion, excluding unamortized original issuance
discounts of $13.3 million.
Impact of Real Estate and Credit Markets In the commercial real estate market, property prices generally continue to fluctuate. Likewise, during certain periods, the U.S. credit markets have experienced significant price volatility, dislocations, and liquidity disruptions, which may impact our access to and cost of capital. We continually monitor the commercial real estate and U.S. credit markets carefully and, if required, will make decisions to adjust our business strategy accordingly. Universal Shelf Registration In December 2015, we filed a shelf registration statement with the SEC, which is effective for a term of three years and will expire in December 2018. This replaced our prior shelf registration statement. In accordance with SEC rules, the amount of securities to be issued pursuant to this shelf registration statement was not specified when it was filed and there is no specific dollar limit. The securities covered by this registration statement include (1) common stock, (2) preferred stock, (3) debt securities, (4) depositary shares representing fractional interests in shares of preferred stock, (5) warrants to purchase debt securities, common stock, preferred stock, or depositary shares, and (6) any combination of these securities. We may periodically offer one or more of these securities in amounts, prices and on terms to be announced when and if these securities are offered. The specifics of any future offerings, along with the use of proceeds of any securities offered, will be described in detail in a prospectus supplement, or other offering materials, at the time of any offering. $2.0 Billion Revolving Credit Facility In June 2015, we entered into a new $2 billion unsecured revolving credit facility, which replaced our $1.5 billion credit facility that was scheduled to expire in May 2016. The initial term of our new credit facility expires in June 2019 and includes, at our option, two six-month extensions. Our new credit facility has a $1.0 billion accordion expansion option. Under our new credit facility, our current investment grade credit ratings provide for financing at the London Interbank Offered Rate, commonly referred to as LIBOR, plus 0.9%, with a facility commitment fee of 0.15%, for all-in drawn pricing of 1.05% over LIBOR. The borrowing rate is subject to an interest rate floor. We also have other interest rate options available to us under our new credit facility. Our new credit facility is unsecured and, accordingly, we have not pledged any assets as collateral for this obligation.
57

At December 31, 2015, we had a borrowing capacity of $1.76 billion available on our new credit facility and an outstanding balance of $238.0 million. The interest rate on borrowings outstanding under our new credit facility, at December 31, 2015, was 1.2% per annum. We must comply with various financial and other covenants in our credit facility. At December 31, 2015, we remain in compliance with these covenants. We expect to use our new credit facility to acquire additional properties and for other general corporate purposes. Any additional borrowings will increase our exposure to interest rate risk. We generally use our credit facility for the short-term financing of new property acquisitions. Thereafter, we generally seek to refinance those borrowings with the net proceeds of long-term or permanent financing, which may include the issuance of common stock, preferred stock or debt securities. We cannot assure you, however, that we will be able to obtain any such refinancing, or that market conditions prevailing at the time of the refinancing will enable us to issue equity or debt securities at acceptable terms. Cash Reserves We are organized to operate as an equity REIT that acquires and leases properties and distributes to stockholders, in the form of monthly cash distributions, a substantial portion of our net cash flow generated from leases on our properties. We intend to retain an appropriate amount of cash as working capital. At December 31, 2015, we had cash and cash equivalents totaling $40.3 million. We believe that our cash and cash equivalents on hand, cash provided from operating activities, and borrowing capacity is sufficient to meet our liquidity needs for the next twelve months. We intend, however, to use permanent or long-term capital to fund property acquisitions and to repay future borrowings under our new credit facility. Credit Agency Ratings The borrowing interest rates under our new credit facility are based upon our ratings assigned by credit rating agencies. We are currently assigned the following investment grade corporate credit ratings on our senior unsecured notes and bonds: Moody’s Investors Service has assigned a rating of Baa1 with a “stable” outlook, Standard & Poor’s Ratings Group has assigned a rating of BBB+ with a “stable” outlook to our senior notes, and Fitch Ratings has assigned a rating of BBB+ with a “stable” outlook. Based on our current ratings, the current facility interest rate is LIBOR plus 0.9% with a facility commitment fee of 0.15%, for all-in drawn pricing of 1.05% over LIBOR. Our new credit facility provides that the interest rate can range between: (i) LIBOR plus 1.55% if our credit rating is lower than BBB-/Baa3 or unrated and (ii) LIBOR plus 0.85% if our credit rating is A-/A3 or higher. In addition, our credit facility provides for a facility commitment fee based on our credit ratings, which range from: (i) 0.3% for a rating lower than BBB-/Baa3 or unrated, and (ii) 0.125% for a credit rating of A-/A3 or higher. We also issue senior debt securities from time to time and our credit ratings can impact the interest rates charged in those transactions. If our credit ratings or ratings outlook change, our cost to obtain debt financing could increase or decrease. The credit ratings assigned to us could change based upon, among other things, our results of operations and financial condition. These ratings are subject to ongoing evaluation by credit rating agencies and we cannot assure you that our ratings will not be changed or withdrawn by a rating agency in the future if, in its judgment, circumstances warrant. Moreover, a rating is not a recommendation to buy, sell or hold our debt securities, preferred stock or common stock. Notes Outstanding As of December 31, 2015, we had $3.65 billion of senior unsecured note and bond obligations, excluding unamortized original issuance discounts of $13.3 million. All of our outstanding notes and bonds have fixed interest rates. Interest on all of our senior note and bond obligations is paid semiannually. Mortgage Debt As of December 31, 2015, we had $637.7 million of mortgages payable, all of which were assumed in connection with our property acquisitions. Additionally, at December 31, 2015, we had net premiums totaling $9.1 million on these mortgages. We expect to pay off the mortgages payable as soon as prepayment penalties have declined to a level that would make it economically feasible to do so. During 2015, we made $198.4 million of principal payments, including the repayment of 13 mortgages in full for $191.0 million.
58

Term Loans In June 2015, in conjunction with entering into our new credit facility, we entered into a $250 million senior unsecured term loan maturing June 30, 2020. Borrowing under this term loan bears interest at LIBOR, plus 0.95%. In conjunction with this term loan, we also entered into an interest rate swap which effectively fixes our per annum interest rate on this term loan at 2.67%.
In January 2013, in conjunction with our acquisition of American Realty Capital Trust, ARCT, we entered into a $70 million senior unsecured term loan maturing in January 2018. Borrowing under the term loan bears interest at LIBOR, plus 1.20%. In conjunction with this term loan, we also acquired an interest rate swap which effectively fixes our per annum interest rate on this term loan at 2.15%. No Unconsolidated Investments We have no unconsolidated investments, nor do we engage in trading activities involving energy or commodity contracts. Corporate Responsibility We are committed to providing an engaging, diverse, and safe work environment for our employees, to upholding our corporate responsibilities as a public company operating for the benefit of our shareholders, and to operating our company in an environmentally conscious manner. As The Monthly Dividend Company®, our mission is to provide monthly dividends to our shareholders that increase over time. How we manage and use the physical, financial and talent resources that enable us to achieve this mission, demonstrates our commitment to corporate responsibility. Social Responsibility and Ethics. An extension of our mission is our commitment to being socially responsible and conducting our business according to the highest ethical standards. Our employees are awarded compensation that is in line with those of our peers and competitors, including generous healthcare benefits for employees and their families; participation in a 401(k) plan with a matching contribution by Realty Income; competitive paid time-off benefits; and an infant-at-work program for new parents. Our employees have access to members of our Board of Directors to report anonymously, if desired, any suspicion of misconduct by any member of our senior management or executive team. We also have a longstanding commitment to equal employment opportunity and adhere to all Equal Employer Opportunity Policy guidelines. We apply the principles of full and fair disclosure in all of our business dealings, as outlined in our Corporate Code of Business Ethics. We are also committed to dealing fairly with all of our customers, suppliers, and competitors. Realty Income and our employees have taken an active role in supporting our communities through civic involvement with charitable organizations and corporate donation. Focusing our impact on social and environmentally sustainable areas our non-profit partnerships have resulted in 600 employee volunteer hours, employee and corporate donations to fund local affordable housing, educations services to at-risk youth, funding local foodbanks, and toys for under-served children. Our dedication to be a responsible corporate citizen has a direct and positive impact in the communities in which we operate and contributes to the strength of our reputation and our financial performance. Corporate Governance. We believe that a company’s reputation for integrity and serving its shareholders responsibly is of utmost importance. We are committed to managing the company for the benefit of our shareholders and are focused on maintaining good corporate governance. Practices that illustrate this commitment include: • Our Board of Directors is comprised of eight directors, seven of which are independent, non-employee
directors; • Our Board of Directors is elected on an annual basis; • We employ a majority vote standard for uncontested elections; • Our Compensation Committee of the Board of Directors works with independent consultants in conducting
annual compensation reviews for our key executives, and compensates each individual based on primarily reaching certain performance metrics that determine the success of our company; and
• We adhere to all other corporate governance principles outlined in our “Corporate Governance Guidelines” document on our website.
59

Environmental Practices. Our focus on conservationism is demonstrated by how we manage our day-to-day activities at our corporate headquarters. At our headquarters, we promote energy efficiency and encourage practices such as powering down office equipment at the end of the day, implementing file-sharing technology and automatic “duplex mode” to limit paper use, adopting an electronic approval system, and carpooling to our headquarters. With respect to technology, recycling and reuse practices, we encourage the use of recycled products and the recycling of materials during our operations. Cell phones, wireless devices and office equipment are recycled or donated whenever possible. In addition, our headquarters was constructed according to the State of California energy efficiency standards (specifically following California Green Building Standards Code and Title 24 of the California Code of Regulations), with features such as an automatic lighting control system with light-harvesting technology, a Building Management System that monitors and controls energy use, an energy-efficient PVC roof and heating and cooling system, and drought-tolerant landscaping with recycled materials. The properties in our portfolio are net leased to our tenants who are responsible for maintaining the buildings and are in control of their energy usage and environmental sustainability practices. We remain active in working with our tenants to promote environmental responsibility at the properties we own. REALTY INCOME CORPORATION AND SUBSIDIARIES
Property Portfolio Information At December 31, 2015, we owned a diversified portfolio:
• Of 4,538 properties; • With an occupancy rate of 98.4%, or 4,467 properties leased and 71 properties available for lease; • Leased to 240 different commercial tenants doing business in 47 separate industries; • Located in 49 states and Puerto Rico; • With over 76.0 million square feet of leasable space; and • With an average leasable space per property of approximately 16,750 square feet; approximately 11,550
square feet per retail property and 216,550 square feet per industrial property. At December 31, 2015, of our 4,538 properties, 4,467 were leased under net lease agreements. A net lease typically requires the tenant to be responsible for monthly rent and certain property operating expenses including property taxes, insurance, and maintenance. In addition, our tenants are typically subject to future rent increases based on increases in the consumer price index (typically subject to ceilings), additional rent calculated as a percentage of the tenants' gross sales above a specified level, or fixed increases. At December 31, 2015, our 240 commercial tenants, which we define as retailers with over 50 locations and non-retailers with over $500 million in annual revenues, represented approximately 95% of our annualized revenue. We had 279 additional tenants, representing approximately 5% of our annualized revenue at December 31, 2015, which brings our total tenant count to 519 tenants.
60

Industry Diversification The following table sets forth certain information regarding Realty Income's property portfolio classified according to the business of the respective tenants, expressed as a percentage of our total rental revenue:
Percentage of Rental Revenue(1) For the Quarter Ended For the Years Ended December 31, Dec 31, Dec 31, Dec 31, Dec 31, Dec 31,
2015 2015 2014 2013 2012 2011 Retail industries
Apparel stores 2.0 % 2.0 % 2.0 % 1.9 % 1.7 % 1.4 % Automotive collision services 0.9 1.0 0.8 0.8 1.1 0.9 Automotive parts 1.5 1.4 1.3 1.2 1.0 1.2 Automotive service 1.9 1.9 1.8 2.1 3.1 3.7 Automotive tire services 2.8 2.9 3.2 3.6 4.7 5.6 Book stores * * * * 0.1 0.1 Child care 2.0 2.0 2.2 2.8 4.5 5.2 Consumer electronics 0.3 0.3 0.3 0.3 0.5 0.5 Convenience stores 8.8 9.2 10.1 11.2 16.3 18.5 Crafts and novelties 0.5 0.5 0.5 0.5 0.3 0.2 Dollar stores 8.8 8.9 9.6 6.2 2.2 - Drug stores 10.9 10.6 9.5 8.1 3.5 3.8 Education 0.3 0.3 0.4 0.4 0.7 0.7 Entertainment 0.5 0.5 0.5 0.6 0.9 1.0 Equipment services 0.1 0.1 0.1 0.1 0.1 0.2 Financial services 1.3 1.3 1.4 1.5 0.2 0.2 General merchandise 1.5 1.4 1.2 1.1 0.6 0.6 Grocery stores 2.8 3.0 3.0 2.9 3.7 1.6 Health and fitness 8.4 7.7 7.0 6.3 6.8 6.4 Health care 1.0 1.0 1.1 1.1 - - Home furnishings 0.7 0.7 0.7 0.9 1.0 1.1 Home improvement 2.5 2.4 1.7 1.6 1.5 1.7 Jewelry 0.1 0.1 0.1 0.1 - - Motor vehicle dealerships 1.6 1.6 1.6 1.6 2.1 2.2 Office supplies 0.3 0.3 0.4 0.5 0.8 0.9 Pet supplies and services 0.7 0.7 0.7 0.8 0.6 0.7 Restaurants - casual dining 3.7 3.8 4.3 5.1 7.3 10.9 Restaurants - quick service 4.5 4.2 3.7 4.4 5.9 6.6 Shoe stores 0.5 0.5 0.1 0.1 0.1 0.2 Sporting goods 1.7 1.8 1.6 1.7 2.5 2.7 Theaters 5.0 5.1 5.3 6.2 9.4 8.8 Transportation services 0.1 0.1 0.1 0.1 0.2 0.2 Wholesale clubs 3.7 3.8 4.1 3.9 3.2 0.7 Other * * * 0.1 0.1 0.1
Retail industries 81.4 % 81.1 % 80.4 % 79.8 % 86.7 % 88.6 %
61
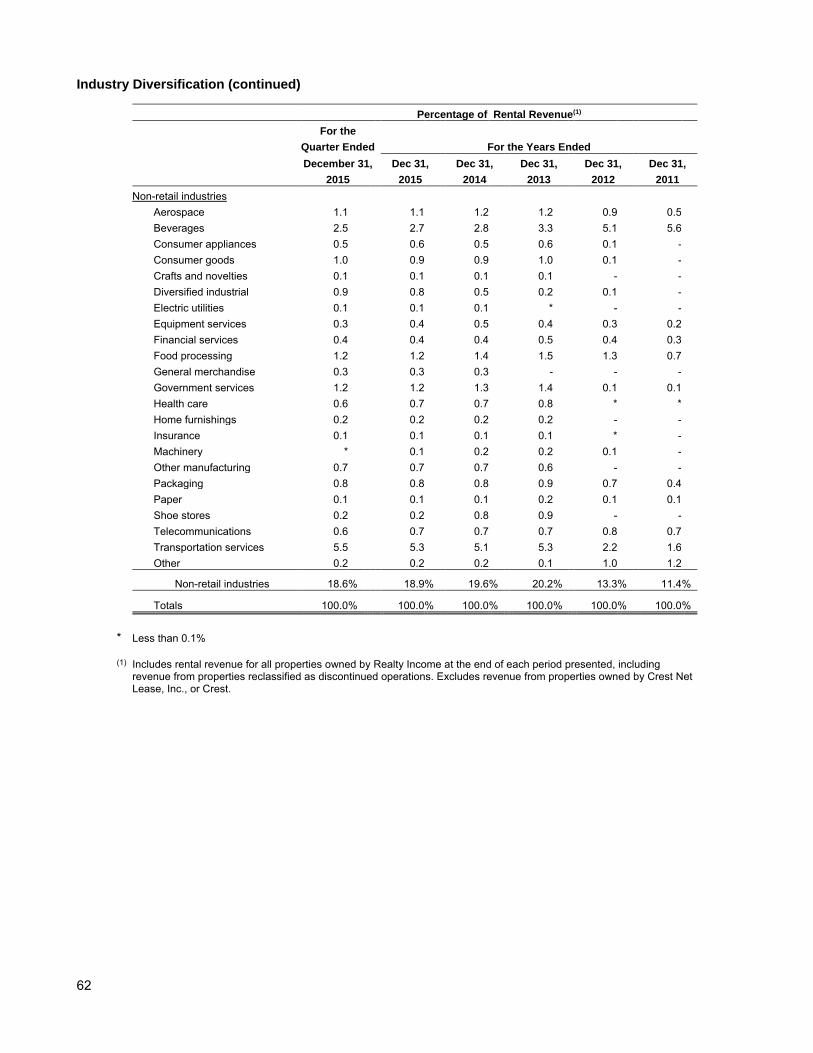
Industry Diversification (continued)
Percentage of Rental Revenue(1) For the Quarter Ended For the Years Ended December 31, Dec 31, Dec 31, Dec 31, Dec 31, Dec 31, 2015 2015 2014 2013 2012 2011 Non-retail industries
Aerospace 1.1 1.1 1.2 1.2 0.9 0.5 Beverages 2.5 2.7 2.8 3.3 5.1 5.6 Consumer appliances 0.5 0.6 0.5 0.6 0.1 - Consumer goods 1.0 0.9 0.9 1.0 0.1 - Crafts and novelties 0.1 0.1 0.1 0.1 - - Diversified industrial 0.9 0.8 0.5 0.2 0.1 - Electric utilities 0.1 0.1 0.1 * - - Equipment services 0.3 0.4 0.5 0.4 0.3 0.2 Financial services 0.4 0.4 0.4 0.5 0.4 0.3 Food processing 1.2 1.2 1.4 1.5 1.3 0.7 General merchandise 0.3 0.3 0.3 - - - Government services 1.2 1.2 1.3 1.4 0.1 0.1 Health care 0.6 0.7 0.7 0.8 * * Home furnishings 0.2 0.2 0.2 0.2 - - Insurance 0.1 0.1 0.1 0.1 * - Machinery * 0.1 0.2 0.2 0.1 - Other manufacturing 0.7 0.7 0.7 0.6 - - Packaging 0.8 0.8 0.8 0.9 0.7 0.4 Paper 0.1 0.1 0.1 0.2 0.1 0.1 Shoe stores 0.2 0.2 0.8 0.9 - - Telecommunications 0.6 0.7 0.7 0.7 0.8 0.7 Transportation services 5.5 5.3 5.1 5.3 2.2 1.6 Other 0.2 0.2 0.2 0.1 1.0 1.2
Non-retail industries 18.6 % 18.9 % 19.6 % 20.2 % 13.3 % 11.4 %
Totals 100.0 % 100.0 % 100.0 % 100.0 % 100.0 % 100.0 % * Less than 0.1% (1) Includes rental revenue for all properties owned by Realty Income at the end of each period presented, including
revenue from properties reclassified as discontinued operations. Excludes revenue from properties owned by Crest Net Lease, Inc., or Crest.
62

Property Type Composition The following table sets forth certain property type information regarding Realty Income’s property portfolio as of December 31, 2015 (dollars in thousands):
Approximate Rental Revenue for Percentage of Number of Leasable the Quarter Ended Rental Property Type Properties Square Feet December 31, 2015 (1) Revenue Retail 4,378 50,592,800 $ 199,518 79.0 % Industrial (2) 101 21,871,200 32,423 12.8 Office 44 3,403,200 15,329 6.1 Agriculture 15 184,500 5,330 2.1
Totals 4,538 76,051,700 $ 252,600 100.0 % (1) Includes rental revenue for all properties owned by Realty Income at December 31, 2015. Excludes revenue of $63
from properties owned by Crest and $68 from sold properties that were included in continuing operations. (2) Includes 14 Industrial properties formerly classified as Manufacturing properties which represent approximately 2%
of rental revenue for the quarter ended December 31, 2015. These properties are principally distribution facilities used for light assemblage, processing, and/or storage. We re-classified these properties to our Industrial category to better reflect their use and to clarify the categorization of our properties.
Tenant Diversification The following table sets forth the largest tenants in Realty Income’s property portfolio, expressed as a percentage of total rental revenue at December 31, 2015: Tenant Number of Properties % of Rental Revenue Walgreens 176 6.9 % FedEx 39 5.2 % Dollar General 524 4.6 % LA Fitness 46 4.2 % Dollar Tree / Family Dollar 457 4.2 % Circle K / The Pantry 302 3.0 % AMC Theaters 20 2.7 % BJ's Wholesale Clubs 15 2.6 % Diageo 17 2.4 % Regal Cinemas 23 2.1 % GPM Investments / Fas Mart 217 2.1 % Rite Aid 68 2.0 % Northern Tier Retail / SuperAmerica 134 2.0 % Life Time Fitness 9 2.0 % CVS Pharmacy 56 1.9 % TBC Corporation 149 1.7 % Walmart / Sam's Club 19 1.3 % NPC International 202 1.3 % FreedomRoads / Camping World 18 1.2 % Smart & Final 36 1.1 %
63

Service Category Diversification for our Retail Properties The following table sets forth certain information regarding the 4,378 retail properties included in the 4,538 total properties owned by Realty Income at December 31, 2015, classified according to the business types and the level of services they provide at the property level (dollars in thousands): Number of Retail Rental Revenue Percentage of Retail for the Quarter Ended Retail Rental Properties December 31, 2015 (1) Revenue Tenants Providing Services Automotive collision services 49 $ 2,367 1.2 % Automotive service 236 4,826 2.4 Child care 206 5,040 2.5 Education 15 863 0.4 Entertainment 10 1,188 0.6 Equipment services 2 310 0.2 Financial services 118 3,256 1.6 Health and fitness 87 21,232 10.7 Health care 26 1,093 0.6 Theaters 45 12,691 6.4 Transportation services 2 229 0.1 Other 8 70 * 804 53,165 26.7 Tenants Selling Goods and Services Automotive parts (with installation) 63 1,504 0.8 Automotive tire services 186 7,124 3.6 Convenience stores 762 22,210 11.1 Motor vehicle dealerships 22 4,047 2.0 Pet supplies and services 13 735 0.4 Restaurants - casual dining 298 8,714 4.4 Restaurants - quick service 498 11,463 5.7 1,842 55,797 28.0 Tenants Selling Goods Apparel stores 28 5,067 2.5 Automotive parts 78 2,170 1.1 Book stores 1 104 * Consumer electronics 7 803 0.4 Crafts and novelties 11 1,175 0.6 Dollar stores 981 22,120 11.1 Drug stores 293 26,119 13.1 General merchandise 71 3,666 1.8 Grocery stores 70 7,110 3.5 Home furnishings 59 1,744 0.9 Home improvement 54 5,605 2.8 Jewelry 4 175 0.1 Office supplies 9 765 0.4 Shoe stores 2 176 0.1 Sporting goods 32 4,390 2.2 Wholesale clubs 32 9,367 4.7 1,732 90,556 45.3 Total Retail Properties 4,378 $ 199,518 100.0 %
* Less than 0.1%
(1) Includes rental revenue for all retail properties owned by Realty Income at December 31, 2015. Excludes revenue of $53,085 from non-retail properties, $63 from properties owned by Crest and $68 from sold properties that were included in continuing operations.
64

Lease Expirations The following table sets forth certain information regarding Realty Income's property portfolio regarding the timing of the lease term expirations (excluding rights to extend a lease at the option of the tenant) on our 4,448 net leased, single-tenant properties as of December 31, 2015 (dollars in thousands):
Total Portfolio(1) Initial Expirations(3) Subsequent Expirations(4) Rental Rental Rental Revenue Revenue Revenue for the for the for the Number Quarter % of Quarter % of Quarter % of of Leases Approx. Ended Total Number Ended Total Number Ended Total Expiring Leasable Dec 31, Rental of Leases Dec 31, Rental of Leases Dec 31, Rental
Year Retail Non-Retail Sq. Feet 2015 (2) Revenue Expiring 2015 Revenue Expiring 2015 Revenue
2016 146 - 913,200 $ 3,315 1.3 % 63 $ 1,295 0.5 % 83 $ 2,020 0.8 % 2017 202 1 2,040,400 5,987 2.4 54 2,559 1.0 149 3,428 1.4 2018 298 9 3,892,100 12,182 4.9 170 8,431 3.4 137 3,751 1.5 2019 248 10 3,878,400 13,359 5.4 174 11,143 4.5 84 2,216 0.9 2020 184 12 4,180,700 13,110 5.3 114 10,709 4.3 82 2,401 1.0 2021 252 13 5,579,900 15,849 6.3 184 13,933 5.6 81 1,916 0.7 2022 233 17 7,456,000 15,104 6.0 220 14,308 5.7 30 796 0.3 2023 353 20 6,458,700 21,920 8.8 358 21,028 8.4 15 892 0.4 2024 193 12 4,168,500 11,504 4.6 195 11,222 4.5 10 282 0.1 2025 322 16 5,556,000 20,347 8.2 311 19,595 7.9 27 752 0.3 2026 243 3 3,141,500 11,469 4.6 234 11,124 4.5 12 345 0.1 2027 491 3 5,443,000 20,453 8.2 460 19,064 7.6 34 1,389 0.6 2028 287 5 5,986,900 16,193 6.5 283 15,930 6.5 9 263 * 2029 396 4 6,488,200 19,469 7.8 371 19,193 7.7 29 276 0.1 2030 80 11 1,703,100 11,474 4.6 80 11,319 4.5 11 155 0.1
2031 - 2043 361 23 7,467,400 37,706 15.1 342 37,216 14.9 42 490 0.2
Totals 4,289 159 74,354,000 $ 249,441 100.0 % 3,613 $ 228,069 91.5 % 835 $ 21,372 8.5 %
* Less than 0.1% (1) Excludes 19 multi-tenant properties and 71 vacant properties. The lease expirations for properties under construction are based on the estimated date of
completion of those properties. (2) Excludes revenue of $3,160 from 19 multi-tenant properties and from 71 vacant properties at December 31, 2015, $68 from sold properties included in
continuing operations and $63 from properties owned by Crest. (3) Represents leases to the initial tenant of the property that are expiring for the first time. (4) Represents lease expirations on properties in the portfolio, which have previously been renewed, extended or re-tenanted.
65

Geographic Diversification The following table sets forth certain state-by-state information regarding Realty Income's property portfolio as of December 31, 2015 (dollars in thousands):
Approximate Rental Revenue for Percentage of Number of Percent Leasable the Quarter Ended Rental State Properties Leased Square Feet December 31, 2015 (1) Revenue Alabama 149 99 % 1,220,600 $ 4,093 1.6 % Alaska 3 100 275,900 681 0.3 Arizona 109 98 1,611,600 6,227 2.5 Arkansas 54 100 797,400 1,749 0.7 California 167 100 5,273,700 24,773 9.8 Colorado 70 99 1,003,000 3,999 1.6 Connecticut 24 91 534,900 2,502 1.0 Delaware 18 100 93,000 495 0.2 Florida 329 99 3,976,700 14,693 5.8 Georgia 239 99 3,348,000 10,396 4.1 Hawaii -- -- -- -- -- Idaho 12 100 87,000 739 0.3 Illinois 161 99 4,578,500 13,337 5.3 Indiana 145 100 1,456,700 6,955 2.8 Iowa 38 95 2,936,000 4,004 1.6 Kansas 90 98 1,643,400 4,166 1.6 Kentucky 61 98 1,023,000 3,744 1.5 Louisiana 91 99 1,029,500 3,098 1.2 Maine 10 90 145,300 889 0.4 Maryland 35 100 861,300 4,485 1.8 Massachusetts 82 96 760,400 3,482 1.4 Michigan 148 99 1,537,200 5,797 2.3 Minnesota 155 99 1,376,800 8,215 3.3 Mississippi 132 98 1,608,200 4,116 1.6 Missouri 139 96 2,810,000 8,621 3.4 Montana 4 100 67,100 190 0.1 Nebraska 37 100 780,400 2,815 1.1 Nevada 22 100 413,000 773 0.3 New Hampshire 19 100 315,800 1,475 0.6 New Jersey 70 99 697,400 4,339 1.7 New Mexico 30 100 293,200 883 0.3 New York 90 99 2,422,600 12,310 4.9 North Carolina 155 99 2,120,900 6,778 2.7 North Dakota 7 100 66,000 136 0.1 Ohio 235 97 6,013,000 13,711 5.4 Oklahoma 128 99 1,532,100 4,015 1.6 Oregon 27 100 593,400 2,040 0.8 Pennsylvania 148 99 1,854,500 7,332 2.9 Rhode Island 4 100 157,200 809 0.3 South Carolina 137 99 996,000 4,659 1.8 South Dakota 13 100 152,100 274 0.1 Tennessee 221 96 2,769,700 7,538 3.0 Texas 449 98 8,298,200 23,401 9.1 Utah 17 100 890,500 1,975 0.8 Vermont 5 100 98,000 482 0.2 Virginia 143 98 2,893,300 7,543 3.0 Washington 42 98 690,800 2,882 1.1 West Virginia 13 100 272,500 979 0.4 Wisconsin 53 100 1,598,000 3,635 1.4 Wyoming 4 100 49,600 221 0.1 Puerto Rico 4 100 28,300 149 0.1
Totals\Average 4,538 98 % 76,051,700 $ 252,600 100.0 %
(1) Includes rental revenue for all properties owned by Realty Income at December 31, 2015. Excludes revenue of $63 from properties owned by Crest and $68 from sold properties that were included in continuing operations.
66

REALTY INCOME CORPORATION AND SUBSIDIARIES
Forward-Looking Statements This Annual Report on Form 10-K, including the documents incorporated by reference, contains forward-looking statements within the meaning of the Private Securities Litigation Reform Act of 1995, Section 27A of the Securities Act of 1933, as amended, and Section 21E of the Exchange Act of 1934, as amended. When used in this annual report, the words “estimated”, “anticipated”, “expect”, “believe”, “intend” and similar expressions are intended to identify forward-looking statements. Forward-looking statements include discussions of strategy, plans, or intentions of management. Forward-looking statements are subject to risks, uncertainties, and assumptions about Realty Income Corporation, including, among other things: • Our anticipated growth strategies; • Our intention to acquire additional properties and the timing of these acquisitions; • Our intention to sell properties and the timing of these property sales; • Our intention to re-lease vacant properties; • Anticipated trends in our business, including trends in the market for long-term, net leases of freestanding,
single-tenant properties; and • Future expenditures for development projects. Future events and actual results, financial and otherwise, may differ materially from the results discussed in the forward-looking statements. In particular, some of the factors that could cause actual results to differ materially are: • Our continued qualification as a real estate investment trust; • General business and economic conditions; • Competition; • Fluctuating interest rates; • Access to debt and equity capital markets; • Continued volatility and uncertainty in the credit markets and broader financial markets; • Other risks inherent in the real estate business including tenant defaults, potential liability relating to
environmental matters, illiquidity of real estate investments, and potential damages from natural disasters; • Impairments in the value of our real estate assets; • Changes in the tax laws of the United States of America; • The outcome of any legal proceedings to which we are a party or which may occur in the future; and • Acts of terrorism and war.
Additional factors that may cause risks and uncertainties include those discussed in the sections entitled “Business”, “Risk Factors” and “Management’s Discussion and Analysis of Financial Condition and Results of Operations” in this Annual Report. Readers are cautioned not to place undue reliance on forward-looking statements, which speak only as of the date that this annual report was filed with the Securities and Exchange Commission, or SEC. While forward-looking statements reflect our good faith beliefs, they are not guarantees of future performance. We undertake no obligation to publicly release the results of any revisions to these forward-looking statements that may be made to reflect events or circumstances after the date of this annual report or to reflect the occurrence of unanticipated events. In light of these risks and uncertainties, the forward-looking events discussed in this annual report might not occur.
67
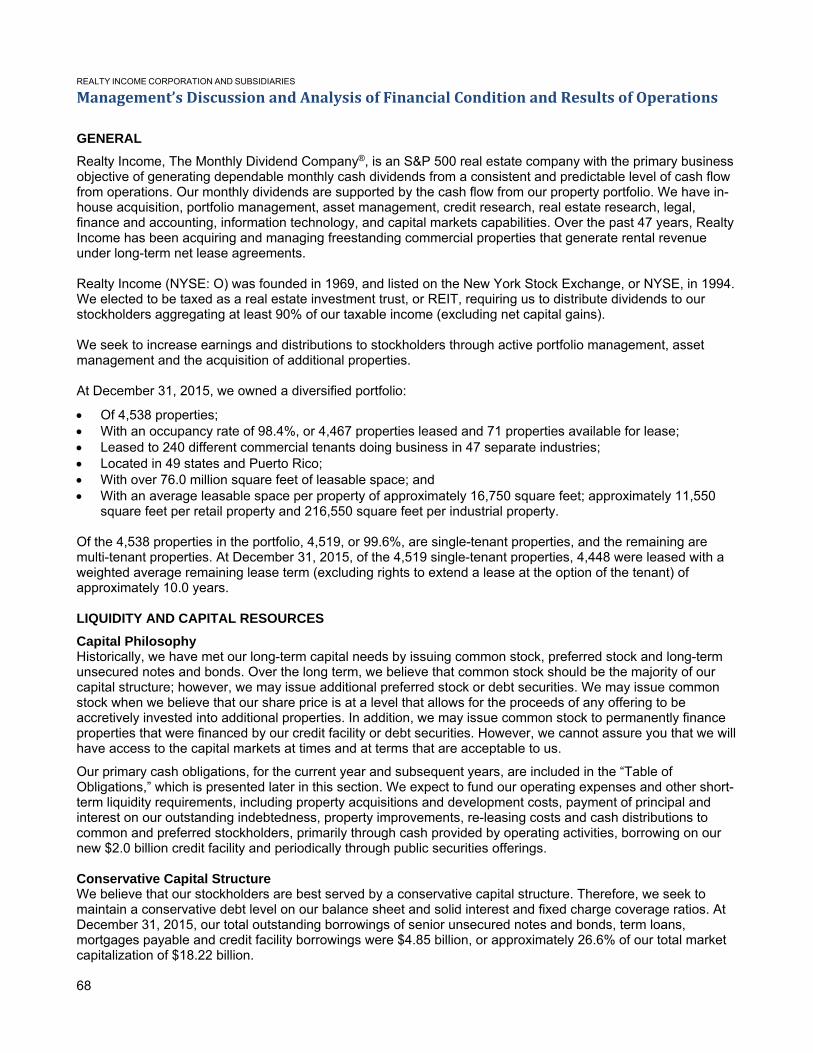
REALTY INCOME CORPORATION AND SUBSIDIARIES
Management’s Discussion and Analysis of Financial Condition and Results of Operations GENERAL Realty Income, The Monthly Dividend Company®, is an S&P 500 real estate company with the primary business objective of generating dependable monthly cash dividends from a consistent and predictable level of cash flow from operations. Our monthly dividends are supported by the cash flow from our property portfolio. We have in-house acquisition, portfolio management, asset management, credit research, real estate research, legal, finance and accounting, information technology, and capital markets capabilities. Over the past 47 years, Realty Income has been acquiring and managing freestanding commercial properties that generate rental revenue under long-term net lease agreements. Realty Income (NYSE: O) was founded in 1969, and listed on the New York Stock Exchange, or NYSE, in 1994. We elected to be taxed as a real estate investment trust, or REIT, requiring us to distribute dividends to our stockholders aggregating at least 90% of our taxable income (excluding net capital gains). We seek to increase earnings and distributions to stockholders through active portfolio management, asset management and the acquisition of additional properties. At December 31, 2015, we owned a diversified portfolio:
• Of 4,538 properties; • With an occupancy rate of 98.4%, or 4,467 properties leased and 71 properties available for lease; • Leased to 240 different commercial tenants doing business in 47 separate industries; • Located in 49 states and Puerto Rico; • With over 76.0 million square feet of leasable space; and • With an average leasable space per property of approximately 16,750 square feet; approximately 11,550
square feet per retail property and 216,550 square feet per industrial property. Of the 4,538 properties in the portfolio, 4,519, or 99.6%, are single-tenant properties, and the remaining are multi-tenant properties. At December 31, 2015, of the 4,519 single-tenant properties, 4,448 were leased with a weighted average remaining lease term (excluding rights to extend a lease at the option of the tenant) of approximately 10.0 years. LIQUIDITY AND CAPITAL RESOURCES Capital Philosophy Historically, we have met our long-term capital needs by issuing common stock, preferred stock and long-term unsecured notes and bonds. Over the long term, we believe that common stock should be the majority of our capital structure; however, we may issue additional preferred stock or debt securities. We may issue common stock when we believe that our share price is at a level that allows for the proceeds of any offering to be accretively invested into additional properties. In addition, we may issue common stock to permanently finance properties that were financed by our credit facility or debt securities. However, we cannot assure you that we will have access to the capital markets at times and at terms that are acceptable to us.
Our primary cash obligations, for the current year and subsequent years, are included in the “Table of Obligations,” which is presented later in this section. We expect to fund our operating expenses and other short-term liquidity requirements, including property acquisitions and development costs, payment of principal and interest on our outstanding indebtedness, property improvements, re-leasing costs and cash distributions to common and preferred stockholders, primarily through cash provided by operating activities, borrowing on our new $2.0 billion credit facility and periodically through public securities offerings. Conservative Capital Structure We believe that our stockholders are best served by a conservative capital structure. Therefore, we seek to maintain a conservative debt level on our balance sheet and solid interest and fixed charge coverage ratios. At December 31, 2015, our total outstanding borrowings of senior unsecured notes and bonds, term loans, mortgages payable and credit facility borrowings were $4.85 billion, or approximately 26.6% of our total market capitalization of $18.22 billion.
68

We define our total market capitalization at December 31, 2015 as the sum of: • Shares of our common stock outstanding of 250,416,757, plus total common units outstanding of 648,386,
multiplied by the last reported sales price of our common stock on the NYSE of $51.63 per share on December 31, 2015, or $12.96 billion;
• Aggregate liquidation value (par value of $25.00 per share) of the Class F preferred stock of $408.8 million; • Outstanding borrowings of $238.0 million on our new credit facility; • Outstanding mortgages payable of $637.7 million, excluding net mortgage premiums of $9.1 million; • Outstanding borrowings of $320.0 million on our term loans; and • Outstanding senior unsecured notes and bonds of $3.65 billion, excluding unamortized original issuance
discounts of $13.3 million. Mortgage Debt As of December 31, 2015, we had $637.7 million of mortgages payable, all of which were assumed in connection with our property acquisitions. Additionally, at December 31, 2015, we had net premiums totaling $9.1 million on these mortgages. We expect to pay off the mortgages payable as soon as prepayment penalties have declined to a level that will make it economically feasible to do so. During 2015, we made $198.4 million of principal payments, including the repayment of 13 mortgages in full for $191.0 million. Term Loans In June 2015, in conjunction with entering into our new credit facility, we entered into a $250 million senior unsecured term loan maturing June 30, 2020. Borrowing under this term loan bears interest at the current one month LIBOR, plus 0.95%. In conjunction with this term loan, we also entered into an interest rate swap which effectively fixes our per annum interest rate on this term loan at 2.67%.
In January 2013, in conjunction with our acquisition of ARCT, we entered into a $70 million senior unsecured term loan maturing in January 2018. Borrowing under the term loan bears interest at LIBOR, plus 1.20%. In conjunction with this term loan, we also acquired an interest rate swap which effectively fixes our per annum interest rate on this term loan at 2.15%. $2.0 Billion Revolving Credit Facility In June 2015, we entered into a new $2 billion unsecured revolving credit facility, or our new credit facility, which replaced our $1.5 billion credit facility that was scheduled to expire in May 2016. The initial term of our new credit facility expires in June 2019 and includes, at our option, two six-month extensions. Our new credit facility has a $1.0 billion accordion expansion option. Under our new credit facility, our current investment grade credit ratings provide for financing at LIBOR, plus 0.9% with a facility commitment fee of 0.15%, for all-in drawn pricing of 1.05% over LIBOR. The borrowing rate is subject to an interest rate floor. We also have other interest rate options available to us under our new credit facility. Our new credit facility is unsecured and, accordingly, we have not pledged any assets as collateral for this obligation. At December 31, 2015, we had a borrowing capacity of $1.76 billion available on our new credit facility and an outstanding balance of $238.0 million. The interest rate on borrowings outstanding under our new credit facility, at December 31, 2015, was 1.2% per annum. We must comply with various financial and other covenants in our credit facility. At December 31, 2015, we remain in compliance with these covenants. We expect to use our new credit facility to acquire additional properties and for other general corporate purposes. Any additional borrowings will increase our exposure to interest rate risk. We generally use our credit facility for the short-term financing of new property acquisitions. Thereafter, we generally seek to refinance those borrowings with the net proceeds of long-term or permanent financing, which may include the issuance of common stock, preferred stock or debt securities. We cannot assure you, however, that we will be able to obtain any such refinancing, or that market conditions prevailing at the time of the refinancing will enable us to issue equity or debt securities at acceptable terms. Notes Outstanding As of December 31, 2015, we had $3.65 billion of senior unsecured note and bond obligations, excluding unamortized original issuance discounts of $13.3 million. All of our outstanding notes and bonds have fixed interest rates. Interest on all of our senior note and bond obligations is paid semiannually.
69
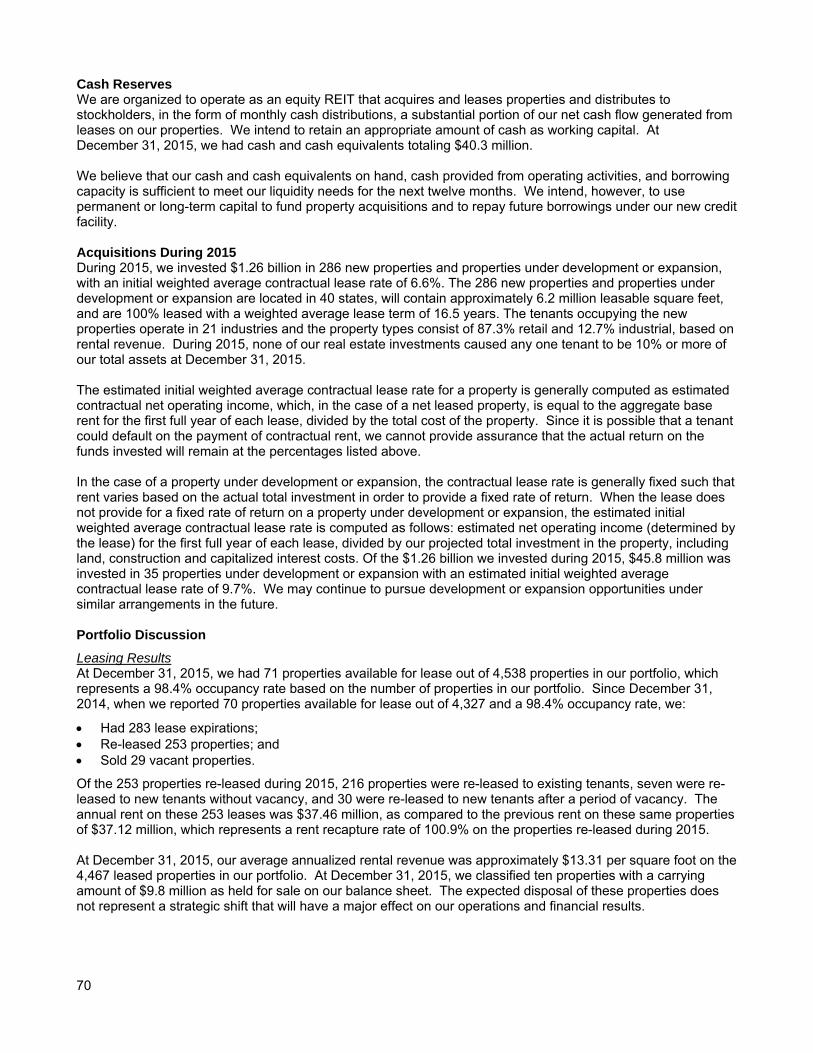
Cash Reserves We are organized to operate as an equity REIT that acquires and leases properties and distributes to stockholders, in the form of monthly cash distributions, a substantial portion of our net cash flow generated from leases on our properties. We intend to retain an appropriate amount of cash as working capital. At December 31, 2015, we had cash and cash equivalents totaling $40.3 million. We believe that our cash and cash equivalents on hand, cash provided from operating activities, and borrowing capacity is sufficient to meet our liquidity needs for the next twelve months. We intend, however, to use permanent or long-term capital to fund property acquisitions and to repay future borrowings under our new credit facility. Acquisitions During 2015 During 2015, we invested $1.26 billion in 286 new properties and properties under development or expansion, with an initial weighted average contractual lease rate of 6.6%. The 286 new properties and properties under development or expansion are located in 40 states, will contain approximately 6.2 million leasable square feet, and are 100% leased with a weighted average lease term of 16.5 years. The tenants occupying the new properties operate in 21 industries and the property types consist of 87.3% retail and 12.7% industrial, based on rental revenue. During 2015, none of our real estate investments caused any one tenant to be 10% or more of our total assets at December 31, 2015. The estimated initial weighted average contractual lease rate for a property is generally computed as estimated contractual net operating income, which, in the case of a net leased property, is equal to the aggregate base rent for the first full year of each lease, divided by the total cost of the property. Since it is possible that a tenant could default on the payment of contractual rent, we cannot provide assurance that the actual return on the funds invested will remain at the percentages listed above. In the case of a property under development or expansion, the contractual lease rate is generally fixed such that rent varies based on the actual total investment in order to provide a fixed rate of return. When the lease does not provide for a fixed rate of return on a property under development or expansion, the estimated initial weighted average contractual lease rate is computed as follows: estimated net operating income (determined by the lease) for the first full year of each lease, divided by our projected total investment in the property, including land, construction and capitalized interest costs. Of the $1.26 billion we invested during 2015, $45.8 million was invested in 35 properties under development or expansion with an estimated initial weighted average contractual lease rate of 9.7%. We may continue to pursue development or expansion opportunities under similar arrangements in the future. Portfolio Discussion Leasing Results At December 31, 2015, we had 71 properties available for lease out of 4,538 properties in our portfolio, which represents a 98.4% occupancy rate based on the number of properties in our portfolio. Since December 31, 2014, when we reported 70 properties available for lease out of 4,327 and a 98.4% occupancy rate, we:
• Had 283 lease expirations; • Re-leased 253 properties; and • Sold 29 vacant properties.
Of the 253 properties re-leased during 2015, 216 properties were re-leased to existing tenants, seven were re-leased to new tenants without vacancy, and 30 were re-leased to new tenants after a period of vacancy. The annual rent on these 253 leases was $37.46 million, as compared to the previous rent on these same properties of $37.12 million, which represents a rent recapture rate of 100.9% on the properties re-leased during 2015. At December 31, 2015, our average annualized rental revenue was approximately $13.31 per square foot on the 4,467 leased properties in our portfolio. At December 31, 2015, we classified ten properties with a carrying amount of $9.8 million as held for sale on our balance sheet. The expected disposal of these properties does not represent a strategic shift that will have a major effect on our operations and financial results. 70

Investments in Existing Properties In 2015, we capitalized costs of $11.5 million on existing properties in our portfolio, consisting of $748,000 for re-leasing costs, $7.6 million for recurring capital expenditures and $3.2 million for non-recurring building improvements. In 2014, we capitalized costs of $6.0 million on existing properties in our portfolio. As part of our re-leasing costs, we typically pay leasing commissions and sometimes provide tenant rent concessions. Leasing commissions are paid based on the commercial real estate industry standard and any rent concessions provided are minimal. We do not consider the collective impact of the leasing commissions or tenant rent concessions to be material to our financial position or results of operations. The majority of our building improvements relate to roof repairs, HVAC improvements, and parking lot resurfacing and replacements. It is not customary for us to offer significant tenant improvements on our properties as tenant incentives. The amounts of our capital expenditures can vary significantly, depending on the rental market, tenant credit worthiness, the lease term and the willingness of tenants to pay higher rents over the terms of the leases. Impact of Real Estate and Credit Markets In the commercial real estate market, property prices generally continue to fluctuate. Likewise, during certain periods, the U.S. credit markets have experienced significant price volatility, dislocations, and liquidity disruptions, which may impact our access to and cost of capital. We continually monitor the commercial real estate and U.S. credit markets carefully and, if required, will make decisions to adjust our business strategy accordingly. Increases in Monthly Dividends to Common Stockholders We have continued our 47-year policy of paying monthly dividends. In addition, we increased the dividend five times during 2015, and two times during 2016. As of February 2016, we have paid 73 consecutive quarterly dividend increases and increased the dividend 84 times since our listing on the NYSE in 1994. Month Month Dividend Increase 2015 Dividend increases Declared Paid per share per share 1st increase Dec 2014 Jan 2015 $ 0.1834167 $ 0.0003125 2nd increase Jan 2015 Feb 2015 0.1890000 0.0055833 3rd increase Mar 2015 Apr 2015 0.1895000 0.0005000 4th increase Jun 2015 Jul 2015 0.1900000 0.0005000 5th increase Sep 2015 Oct 2015 0.1905000 0.0005000
2016 Dividend increases 1st increase Dec 2015 Jan 2016 $ 0.1910000 $ 0.0005000 2nd increase Jan 2016 Feb 2016 $ 0.1985000 $ 0.0075000 The dividends paid per share during 2015 totaled approximately $2.2714167, as compared to approximately $2.1916254 during 2014, an increase of $0.0798, or 3.6%. The monthly dividend of $0.1985 per share represents a current annualized dividend of $2.382 per share, and an annualized dividend yield of approximately 4.3% based on the last reported sale price of our common stock on the NYSE of $55.79 on January 29, 2016. Although we expect to continue our policy of paying monthly dividends, we cannot guarantee that we will maintain our current level of dividends, that we will continue our pattern of increasing dividends per share, or what our actual dividend yield will be in any future period. Universal Shelf Registration In December 2015, we filed a shelf registration statement with the SEC, which is effective for a term of three years and will expire in December 2018. This replaced our prior shelf registration statement. In accordance with SEC rules, the amount of securities to be issued pursuant to this shelf registration statement was not specified when it was filed and there is no specific dollar limit. The securities covered by this registration statement include (1) common stock, (2) preferred stock, (3) debt securities, (4) depositary shares representing fractional interests in shares of preferred stock, (5) warrants to purchase debt securities, common stock, preferred stock, or depositary shares, and (6) any combination of these securities. We may periodically offer one or more of these securities in amounts, prices and on terms to be announced when and if these securities are offered. The
71

specifics of any future offerings, along with the use of proceeds of any securities offered, will be described in detail in a prospectus supplement, or other offering materials, at the time of any offering. Issuance of Common Stock In October 2015, we issued 11,500,000 shares of common stock, including 1,500,000 shares purchased by the underwriters upon the exercise of their option to purchase additional shares. After underwriting discounts and other offering costs of $22.0 million, a portion of the net proceeds of $517.1 million was used to repay borrowings under our new credit facility and the remaining portion was used for other general corporate purposes, including acquisitions. In April 2015, we issued 5,500,000 shares of common stock. After underwriting discounts and other offering costs of $1.4 million, the net proceeds of $276.4 million were used to repay borrowings under our previous $1.5 billion unsecured credit facility. Dividend Reinvestment and Stock Purchase Plan Our Dividend Reinvestment and Stock Purchase Plan, or the DRSPP, provides our common stockholders, as well as new investors, with a convenient and economical method of purchasing our common stock and reinvesting their distributions. The DRSPP also allows our current stockholders to buy additional shares of common stock by reinvesting all or a portion of their distributions. The DRSPP authorizes up to 26,000,000 common shares to be issued. In 2013, we revised our DRSPP so that we would pay for a majority of the plan-related fees, which were previously paid by investors, and to institute a waiver approval process, allowing larger investors or institutions, per a formal approval process, to purchase shares at a small discount, if approved by us. During 2015, we issued 7,608,354 shares and raised approximately $363.0 million under the DRSPP, of which 7,413,207 shares and $353.7 million was raised under the waiver approval process. At-the-Market (ATM) Program In September 2015, we established an “at the market” equity distribution program, or our ATM program, pursuant to which we can offer and sell up to 12,000,000 shares of common stock to, or through a consortium of banks acting as our sales agents by means of ordinary brokers’ transactions on the NYSE or otherwise at market prices prevailing at the time of sale, at prices related to prevailing market prices or at negotiated prices. During 2015, we issued 714,301 shares and raised approximately $36.3 million under the ATM program. Credit Agency Ratings The borrowing interest rates under our new credit facility are based upon our ratings assigned by credit rating agencies. We are currently assigned the following investment grade corporate credit ratings on our senior unsecured notes and bonds: Moody’s Investors Service has assigned a rating of Baa1 with a “stable” outlook, Standard & Poor’s Ratings Group has assigned a rating of BBB+ with a “stable” outlook to our senior notes, and Fitch Ratings has assigned a rating of BBB+ with a “stable” outlook. Based on our current ratings, the current facility interest rate is LIBOR plus 0.9% with a facility commitment fee of 0.15%, for all-in drawn pricing of 1.05% over LIBOR. Our new credit facility provides that the interest rate can range between: (i) LIBOR plus 1.55% if our credit rating is lower than BBB-/Baa3 or unrated and (ii) LIBOR plus 0.85% if our credit rating is A-/A3 or higher. In addition, our credit facility provides for a facility commitment fee based on our credit ratings, which range from: (i) 0.3% for a rating lower than BBB-/Baa3 or unrated, and (ii) 0.125% for a credit rating of A-/A3 or higher. We also issue senior debt securities from time to time and our credit ratings can impact the interest rates charged in those transactions. If our credit ratings or ratings outlook change, our cost to obtain debt financing could increase or decrease. The credit ratings assigned to us could change based upon, among other things, our results of operations and financial condition. These ratings are subject to ongoing evaluation by credit rating agencies and we cannot assure you that our ratings will not be changed or withdrawn by a rating agency in the future if, in its judgment, circumstances warrant. Moreover, a rating is not a recommendation to buy, sell or hold our debt securities, preferred stock or common stock.
72

Notes Outstanding Our senior unsecured note and bond obligations consist of the following as of December 31, 2015, sorted by maturity date (dollars in millions): 5.95% notes, issued in September 2006 and due in September 2016 $ 275 5.375% notes, issued in September 2005 and due in September 2017 175 2.0% notes, issued in October 2012 and due in January 2018 350 6.75% notes, issued in September 2007 and due in August 2019 550 5.75% notes, issued in June 2010 and due in January 2021 250 3.25% notes, issued in October 2012 and due in October 2022 450 4.65% notes, issued in July 2013 and due in August 2023 750 3.875% notes, issued in June 2014 and due in July 2024 350 4.125% notes, issued in September 2014 and due in October 2026 250 5.875% bonds, $100 issued in March 2005 and $150 issued in
June 2011, both due in March 2035 250 Total principal amount $ 3,650 Unamortized original issuance discounts (13 ) $ 3,637 All of our outstanding notes and bonds have fixed interest rates and contain various covenants, which we remain in compliance with at December 31, 2015. Additionally, interest on all of our senior note and bond obligations is paid semiannually. The following is a summary of the key financial covenants for our senior unsecured notes, as defined and calculated per the terms of our senior notes and bonds. These calculations, which are not based on U.S. GAAP measurements, are presented to investors to show our ability to incur additional debt under the terms of our senior notes and bonds as well as to disclose our current compliance with such covenants, and are not measures of our liquidity or performance. The actual amounts as of December 31, 2015 are:
Note Covenants Required Actual Limitation on incurrence of total debt ≤ 60% of adjusted assets 39.0% Limitation on incurrence of secured debt ≤ 40% of adjusted assets 5.2% Debt service coverage (trailing 12 months)(1) ≥ 1.5 x 4.5x Maintenance of total unencumbered assets ≥ 150% of unsecured debt 266.8%
(1) This covenant is calculated on a pro forma basis for the preceding four-quarter period on the assumptions that: (i) the incurrence of any Debt (as defined in the covenants) incurred by us since the first day of such four-quarter period and the application of the proceeds therefrom (including to refinance other Debt since the first day of such four-quarter period), (ii) the repayment or retirement of any of our Debt since the first day of such four-quarter period, and (iii) any acquisition or disposition by us of any asset or group since the first day of such four quarters had in each case occurred on January 1, 2015, and subject to certain additional adjustments. Such pro forma ratio has been prepared on the basis required by that debt service covenant, reflects various estimates and assumptions and is subject to other uncertainties, and therefore does not purport to reflect what our actual debt service coverage ratio would have been had transactions referred to in clauses (i), (ii) and (iii) of the preceding sentence occurred as of January 1, 2015, nor does it purport to reflect our debt service coverage ratio for any future period. The following is our calculation of debt service coverage at December 31, 2015 (in thousands, for trailing twelve months):
Net income attributable to the Company $ 283,766 Plus: interest expense 224,344 Plus: provision for taxes 3,169 Plus: depreciation and amortization 409,215 Plus: provisions for impairment 10,560 Plus: pro forma adjustments 35,457 Less: gain on sales of real estate (22,243 )
Income available for debt service, as defined $ 944,268
Total pro forma debt service charge $ 211,384
Debt service coverage ratio 4.5
73

Fixed Charge Coverage Ratio Fixed charge coverage ratio is calculated in exactly the same manner as the debt service coverage ratio, except that preferred stock dividends are also added to the denominator. Similar to debt service coverage ratio, we consider fixed charge coverage ratio to be an appropriate supplemental measure of a company’s ability to make its interest and preferred stock dividend payments. Our calculations of both debt service and fixed charge coverage ratios may be different from the calculations used by other companies and, therefore, comparability may be limited. The presentation of debt service and fixed charge coverage ratios should not be considered as alternatives to any U.S. GAAP operating performance measures. Below is our calculation of fixed charges at December 31, 2015 (in thousands, for the trailing twelve months):
Income available for debt service, as defined $ 944,268 Pro forma debt service charge plus preferred stock dividends $ 238,464 Fixed charge coverage ratio 4.0
Table of Obligations The following table summarizes the maturity of each of our obligations as of December 31, 2015 (dollars in millions): Ground Ground Leases Leases Notes Paid by Paid by
Year of Credit and Term Mortgages Realty Our Maturity Facility (1) Bonds (2) Loan Payable (3) Interest (4) Income (5) Tenants (6) Other (7) Totals
2016 $ - $ 275.0 $ - $ 170.1 $ 205.1 $ 1.5 $ 13.3 $ 71.4 $ 736.4 2017 - 175.0 - 142.9 180.1 1.5 13.3 512.8 2018 - 350.0 70.0 15.5 161.7 1.6 13.3 - 612.1 2019 238.0 550.0 - 26.3 145.0 1.4 13.2 - 973.9 2020 - - 250.0 82.4 117.5 1.4 13.0 - 464.3
Thereafter - 2,300.0 - 200.5 451.8 23.3 119.0 - 3,094.6
Totals $ 238.0 $ 3,650.0 $ 320.0 $ 637.7 $ 1,261.2 $ 30.7 $ 185.1 $ 71.4 $ 6,394.1
(1) The initial term of the credit facility expires in June 2019 and includes, at our option, two six-month extensions. (2) Excludes non-cash original issuance discounts recorded on the notes payable. The unamortized balance of the original issuance
discounts at December 31, 2015, is $13.3 million. (3) Excludes non-cash net premiums recorded on the mortgages payable. The unamortized balance of these net premiums at
December 31, 2015, is $9.1 million. (4) Interest on the term loans, notes, bonds, mortgages payable, and credit facility has been calculated based on outstanding balances as
of December 31, 2015 through their respective maturity dates. (5) Realty Income currently pays the ground lessors directly for the rent under the ground leases. (6) Our tenants, who are generally sub-tenants under ground leases, are responsible for paying the rent under these ground leases. In the
event a tenant fails to pay the ground lease rent, we are primarily responsible. (7) “Other” consists of $70.6 million of commitments under construction contracts and $714,000 of commitments for tenant improvements
and leasing costs. Our new credit facility, term loans, and notes payable obligations are unsecured. Accordingly, we have not pledged any assets as collateral for these obligations. Preferred Stock and Preferred Units Outstanding In 2006, we issued 8,800,000 shares of Class E preferred stock at a price of $25.00 per share. In October 2014, we redeemed all of the 8,800,000 shares of our Class E preferred stock for $25.00 per share, plus accrued dividends. In the third quarter of 2014, we incurred a charge of $6.0 million, representing the Class E preferred stock original issuance costs that we paid in 2006. In February 2012, we issued 14,950,000 shares of our Class F preferred stock at $25.00 per share. In April 2012, we issued an additional 1,400,000 shares of Class F preferred stock at $25.2863 per share. Beginning February 15, 2017, shares of our Class F preferred stock are redeemable at our option for $25.00 per share, plus any accrued and unpaid dividends. Dividends on the shares of our Class F preferred stock are paid monthly in arrears. We are current on our obligations to pay dividends on our Class F preferred stock.
74

No Unconsolidated Investments We have no unconsolidated investments, nor do we engage in trading activities involving energy or commodity contracts. RESULTS OF OPERATIONS Critical Accounting Policies Our consolidated financial statements have been prepared in accordance with GAAP, and are the basis for our discussion and analysis of financial condition and results of operations. Preparing our consolidated financial statements requires us to make a number of estimates and assumptions that affect the reported amounts and disclosures in the consolidated financial statements. We believe that we have made these estimates and assumptions in an appropriate manner and in a way that accurately reflects our financial condition. We continually test and evaluate these estimates and assumptions using our historical knowledge of the business, as well as other factors, to ensure that they are reasonable for reporting purposes. However, actual results may differ from these estimates and assumptions. This summary should be read in conjunction with the more complete discussion of our accounting policies and procedures included in note 2 to our consolidated financial statements. In order to prepare our consolidated financial statements according to the rules and guidelines set forth by GAAP, many subjective judgments must be made with regard to critical accounting policies. One of these judgments is our estimate for useful lives in determining depreciation expense for our properties. Depreciation on a majority of our buildings and improvements is computed using the straight-line method over an estimated useful life of 25 to 35 years for buildings and 4 to 20 years for improvements, which we believe are appropriate estimates of useful life. If we use a shorter or longer estimated useful life, it could have a material impact on our results of operations. Management must make significant assumptions in determining the fair value of assets acquired and liabilities assumed. When acquiring a property for investment purposes, we typically allocate the fair value of real estate acquired to: (1) land, (2) building and improvements, and (3) identified intangible assets and liabilities, based in each case on their estimated fair values. Intangible assets and liabilities consist of above-market or below-market lease value of in-place leases, the value of in-place leases, and tenant relationships, as applicable. In an acquisition of multiple properties, we must also allocate the purchase price among the properties. The allocation of the purchase price is based on our assessment of estimated fair value and is often based upon the expected future cash flows of the property and various characteristics of the market where the property is located. In addition, any assumed mortgages receivable or payable and any assumed or issued noncontrolling interests are recorded at their estimated fair values. The estimated fair values of our mortgages payable have been calculated by discounting the future cash flows using applicable interest rates that have been adjusted for factors, such as industry type, tenant investment grade, maturity date, and comparable borrowings for similar assets. The initial allocation of the purchase price is based on management’s preliminary assessment, which may differ when final information becomes available. Subsequent adjustments made to the initial purchase price allocation are made within the allocation period, which does not exceed one year. The use of different assumptions in the allocation of the purchase price of the acquired properties and liabilities assumed could affect the timing of recognition of the related revenue and expenses. Another significant judgment must be made as to if, and when, impairment losses should be taken on our properties when events or a change in circumstances indicate that the carrying amount of the asset may not be recoverable. A provision is made for impairment if estimated future operating cash flows (undiscounted and without interest charges) plus estimated disposition proceeds (undiscounted) are less than the current book value of the property. Key inputs that we utilize in this analysis include projected rental rates, estimated holding periods, historical sales and releases, capital expenditures, and property sales capitalization rates. If a property is held for sale, it is carried at the lower of carrying cost or estimated fair value, less estimated cost to sell. The carrying value of our real estate is the largest component of our consolidated balance sheets. Our strategy of primarily holding properties, long-term, directly decreases the likelihood of their carrying values not being recoverable, thus requiring the recognition of an impairment. However, if our strategy, or one or more of the above assumptions were to change in the future, an impairment may need to be recognized. If events should occur that require us to reduce the carrying value of our real estate by recording provisions for impairment, they could have a material impact on our results of operations.
75

The following is a comparison of our results of operations for the years ended December 31, 2015, 2014 and 2013. Rental Revenue Rental revenue was $976.9 million for 2015, as compared to $893.5 million for 2014, an increase of $83.4 million, or 9.3%. Rental revenue was $748.2 million for 2013. The increase in rental revenue in 2015 compared to 2014 is primarily attributable to:
• The 248 properties (5.6 million square feet) we acquired in 2015, which generated $41.9 million of rent in 2015;
• The 479 properties (9.3 million square feet) we acquired in 2014, which generated $99.3 million of rent in 2015, compared to $65.9 million in 2014, an increase of $33.4 million;
• Same store rents generated on 3,636 properties (58.1 million square feet) during 2015 and 2014, increased by $10.2 million, or 1.3%, to $794.4 million from $784.2 million;
• A net increase in straight-line rent and other non-cash adjustments to rent of $4.0 million in 2015 as compared to 2014;
• A net decrease of $8.4 million relating to properties sold in 2015 and during 2014 that were reported in continuing operations; and
• A net increase of $2.3 million relating to the aggregate of (i) rental revenue from properties (137 properties comprising 1.2 million square feet) that were available for lease during part of 2015 or 2014, (ii) rental revenue for 22 properties under development, and (iii) lease termination settlements. In aggregate, the revenues for these items totaled $26.5 million in 2015, compared to $24.2 million in 2014.
For purposes of determining the same store rent property pool, we include all properties that were owned for the entire year-to-date period, for both the current and prior year, except for properties during the current or prior year that; (i) were vacant at any time, (ii) were under development or redevelopment, and (iii) were involved in eminent domain and rent was reduced. Each of the exclusions from the same store pool are separately addressed within the applicable sentences above, explaining the changes in rental revenue for the period. Of the 4,538 properties in the portfolio at December 31, 2015, 4,519, or 99.6%, are single-tenant properties and the remaining are multi-tenant properties. Of the 4,519 single-tenant properties, 4,448, or 98.4%, were net leased with a weighted average remaining lease term (excluding rights to extend a lease at the option of the tenant) of approximately 10.0 years at December 31, 2015. Of our 4,448 leased single-tenant properties, 3,938 or 88.5% were under leases that provide for increases in rents through:
• Base rent increases tied to a consumer price index (typically subject to ceilings); • Percentage rent based on a percentage of the tenants' gross sales; • Fixed increases; or • A combination of two or more of the above rent provisions.
Percentage rent, which is included in rental revenue, was $4.5 million in 2015, $3.6 million in 2014, and $2.9 million in 2013. Percentage rent in 2015 was less than 1% of rental revenue and we anticipate percentage rent to be less than 1% of rental revenue in 2016. Our portfolio of real estate, leased primarily to regional and national tenants under net leases, continues to perform well and provides dependable lease revenue supporting the payment of monthly dividends to our stockholders. At December 31, 2015, our portfolio of 4,538 properties was 98.4% leased with 71 properties available for lease, as compared to 98.4% leased, with 70 properties available for lease at December 31, 2014. It has been our experience that approximately 1% to 4% of our property portfolio will be unleased at any given time; however, it is possible that the number of properties available for lease could exceed these levels in the future. Tenant Reimbursements Contractually obligated reimbursements from tenants for recoverable real estate taxes and operating expenses were $42.0 million in 2015, compared to $37.1 million in 2014 and $24.9 million in 2013. The increase in tenant reimbursements is primarily due to our acquisitions during 2014 and 2015. Our tenant reimbursements approximate our reimbursable property expenses for any given period. 76
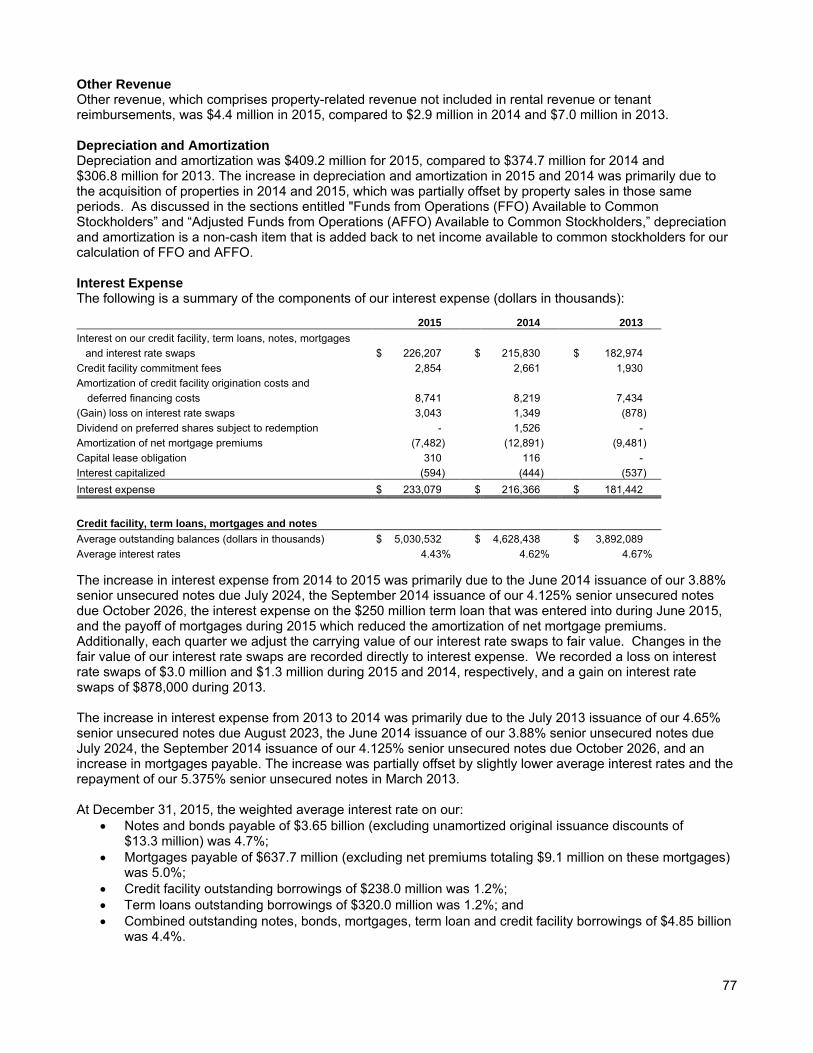
Other Revenue Other revenue, which comprises property-related revenue not included in rental revenue or tenant reimbursements, was $4.4 million in 2015, compared to $2.9 million in 2014 and $7.0 million in 2013. Depreciation and Amortization Depreciation and amortization was $409.2 million for 2015, compared to $374.7 million for 2014 and $306.8 million for 2013. The increase in depreciation and amortization in 2015 and 2014 was primarily due to the acquisition of properties in 2014 and 2015, which was partially offset by property sales in those same periods. As discussed in the sections entitled "Funds from Operations (FFO) Available to Common Stockholders” and “Adjusted Funds from Operations (AFFO) Available to Common Stockholders,” depreciation and amortization is a non-cash item that is added back to net income available to common stockholders for our calculation of FFO and AFFO. Interest Expense The following is a summary of the components of our interest expense (dollars in thousands):
2015 2014 2013 Interest on our credit facility, term loans, notes, mortgages and interest rate swaps $ 226,207 $ 215,830 $ 182,974 Credit facility commitment fees 2,854 2,661 1,930 Amortization of credit facility origination costs and
deferred financing costs 8,741 8,219 7,434 (Gain) loss on interest rate swaps 3,043 1,349 (878 ) Dividend on preferred shares subject to redemption - 1,526 - Amortization of net mortgage premiums (7,482 ) (12,891 ) (9,481 ) Capital lease obligation 310 116 - Interest capitalized (594 ) (444 ) (537 ) Interest expense $ 233,079 $ 216,366 $ 181,442
Credit facility, term loans, mortgages and notes Average outstanding balances (dollars in thousands) $ 5,030,532 $ 4,628,438 $ 3,892,089 Average interest rates 4.43 % 4.62 % 4.67 % The increase in interest expense from 2014 to 2015 was primarily due to the June 2014 issuance of our 3.88% senior unsecured notes due July 2024, the September 2014 issuance of our 4.125% senior unsecured notes due October 2026, the interest expense on the $250 million term loan that was entered into during June 2015, and the payoff of mortgages during 2015 which reduced the amortization of net mortgage premiums. Additionally, each quarter we adjust the carrying value of our interest rate swaps to fair value. Changes in the fair value of our interest rate swaps are recorded directly to interest expense. We recorded a loss on interest rate swaps of $3.0 million and $1.3 million during 2015 and 2014, respectively, and a gain on interest rate swaps of $878,000 during 2013. The increase in interest expense from 2013 to 2014 was primarily due to the July 2013 issuance of our 4.65% senior unsecured notes due August 2023, the June 2014 issuance of our 3.88% senior unsecured notes due July 2024, the September 2014 issuance of our 4.125% senior unsecured notes due October 2026, and an increase in mortgages payable. The increase was partially offset by slightly lower average interest rates and the repayment of our 5.375% senior unsecured notes in March 2013. At December 31, 2015, the weighted average interest rate on our:
• Notes and bonds payable of $3.65 billion (excluding unamortized original issuance discounts of $13.3 million) was 4.7%;
• Mortgages payable of $637.7 million (excluding net premiums totaling $9.1 million on these mortgages) was 5.0%;
• Credit facility outstanding borrowings of $238.0 million was 1.2%; • Term loans outstanding borrowings of $320.0 million was 1.2%; and • Combined outstanding notes, bonds, mortgages, term loan and credit facility borrowings of $4.85 billion
was 4.4%.
77
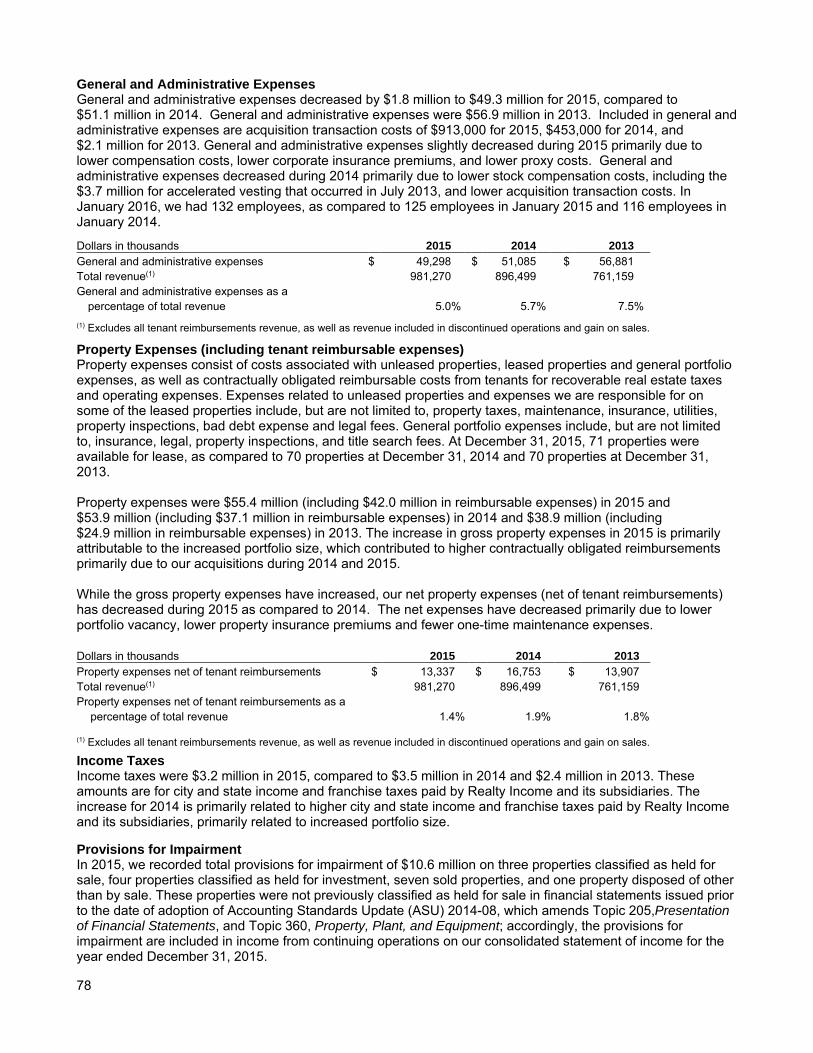
General and Administrative Expenses General and administrative expenses decreased by $1.8 million to $49.3 million for 2015, compared to $51.1 million in 2014. General and administrative expenses were $56.9 million in 2013. Included in general and administrative expenses are acquisition transaction costs of $913,000 for 2015, $453,000 for 2014, and $2.1 million for 2013. General and administrative expenses slightly decreased during 2015 primarily due to lower compensation costs, lower corporate insurance premiums, and lower proxy costs. General and administrative expenses decreased during 2014 primarily due to lower stock compensation costs, including the $3.7 million for accelerated vesting that occurred in July 2013, and lower acquisition transaction costs. In January 2016, we had 132 employees, as compared to 125 employees in January 2015 and 116 employees in January 2014.
Dollars in thousands 2015 2014 2013 General and administrative expenses $ 49,298 $ 51,085 $ 56,881 Total revenue(1) 981,270 896,499 761,159 General and administrative expenses as a
percentage of total revenue 5.0 % 5.7 % 7.5 %
(1) Excludes all tenant reimbursements revenue, as well as revenue included in discontinued operations and gain on sales.
Property Expenses (including tenant reimbursable expenses) Property expenses consist of costs associated with unleased properties, leased properties and general portfolio expenses, as well as contractually obligated reimbursable costs from tenants for recoverable real estate taxes and operating expenses. Expenses related to unleased properties and expenses we are responsible for on some of the leased properties include, but are not limited to, property taxes, maintenance, insurance, utilities, property inspections, bad debt expense and legal fees. General portfolio expenses include, but are not limited to, insurance, legal, property inspections, and title search fees. At December 31, 2015, 71 properties were available for lease, as compared to 70 properties at December 31, 2014 and 70 properties at December 31, 2013. Property expenses were $55.4 million (including $42.0 million in reimbursable expenses) in 2015 and $53.9 million (including $37.1 million in reimbursable expenses) in 2014 and $38.9 million (including $24.9 million in reimbursable expenses) in 2013. The increase in gross property expenses in 2015 is primarily attributable to the increased portfolio size, which contributed to higher contractually obligated reimbursements primarily due to our acquisitions during 2014 and 2015. While the gross property expenses have increased, our net property expenses (net of tenant reimbursements) has decreased during 2015 as compared to 2014. The net expenses have decreased primarily due to lower portfolio vacancy, lower property insurance premiums and fewer one-time maintenance expenses. Dollars in thousands 2015 2014 2013 Property expenses net of tenant reimbursements $ 13,337 $ 16,753 $ 13,907 Total revenue(1) 981,270 896,499 761,159 Property expenses net of tenant reimbursements as a percentage of total revenue 1.4 % 1.9 % 1.8 %
(1) Excludes all tenant reimbursements revenue, as well as revenue included in discontinued operations and gain on sales.
Income Taxes Income taxes were $3.2 million in 2015, compared to $3.5 million in 2014 and $2.4 million in 2013. These amounts are for city and state income and franchise taxes paid by Realty Income and its subsidiaries. The increase for 2014 is primarily related to higher city and state income and franchise taxes paid by Realty Income and its subsidiaries, primarily related to increased portfolio size. Provisions for Impairment In 2015, we recorded total provisions for impairment of $10.6 million on three properties classified as held for sale, four properties classified as held for investment, seven sold properties, and one property disposed of other than by sale. These properties were not previously classified as held for sale in financial statements issued prior to the date of adoption of Accounting Standards Update (ASU) 2014-08, which amends Topic 205,Presentation of Financial Statements, and Topic 360, Property, Plant, and Equipment; accordingly, the provisions for impairment are included in income from continuing operations on our consolidated statement of income for the year ended December 31, 2015.
78

In 2014, Realty Income recorded total provisions for impairment of $4.6 million. Provisions for impairment of $4.1 million are included in income from continuing operations on nine sold properties and two properties classified as held for investment. These properties were not previously classified as held for sale in financial statements issued prior to the date of adoption of ASU 2014-08; accordingly, these provisions for impairment are included in income from continuing operations on our consolidated statements of income. Additionally, a provision for impairment of $510,000 is included in income from discontinued operations on one sold property that was classified as held for sale as of December 31, 2013. In 2013, Realty Income recorded total provisions for impairment of $3.0 million. Realty Income recorded provisions for impairment of $2.7 million in income from discontinued operations on seven sold properties. Except for a provision for impairment of $290,000 that was recorded in income from continuing operations for one property that was not previously classified as held for sale as of December 31, 2013, the remaining provisions for impairment are included in income from discontinued operations on our consolidated statement of income. In 2013, Crest also recorded a provision for impairment of $308,000 on one sold property which is included in income from discontinued operations. Merger-Related Costs Merger-related costs include, but are not limited to, advisor fees, legal fees, accounting fees, printing fees and transfer taxes related to our acquisition of ARCT. Merger-related costs were $13.0 million in 2013. On a diluted per common share basis, these expenses represented $0.07 for 2013. No merger-related costs were incurred in 2014 or 2015. Gain on Sales of Real Estate During 2015, we sold 38 investment properties for $65.8 million, which resulted in a gain of $22.2 million. The results of operations for these properties are presented within continuing operations. During 2014, we sold 46 investment properties for $107.2 million, which resulted in a gain of $42.1 million. Only the results of operations specifically related to the properties classified as held for sale at December 31, 2013 and sold during 2014 were reclassified as discontinued operations. During 2013, we sold 75 investment properties for $134.2 million, which resulted in a gain of $64.7 million. The results of operations for these properties were reclassified as discontinued operations for all periods presented. During 2015, Crest did not sell any properties. Crest sold one property for $820,000 and one property for $597,000 during 2014 and 2013, respectively. Neither of these sales resulted in a gain. The results of operations for these properties were reclassified as discontinued operations. We have an active portfolio management program that incorporates the sale of assets when we believe the reinvestment of the sale proceeds will: • Generate higher returns; • Enhance the credit quality of our real estate portfolio; • Extend our average remaining lease term; or • Decrease tenant or industry concentration. At December 31, 2015, we classified real estate with a carrying amount of $9.8 million as held for sale on our balance sheet. In 2016, we intend to continue our active disposition efforts to further enhance our real estate portfolio and anticipate approximately $50 to $75 million in yet to be identified property sales for all of 2016. We intend to invest these proceeds into new property acquisitions, if there are attractive opportunities available. However, we cannot guarantee that we will sell properties during the next 12 months at our estimated values or be able to invest the property sale proceeds in new properties. Preferred Stock Dividends Preferred stock dividends totaled $27.1 million in 2015, $37.1 million in 2014, and $41.9 million in 2013.
79

Excess of Redemption Value over Carrying Value of Preferred Shares Redeemed In October 2014, we redeemed all 8,800,000 shares of our 6.75% Monthly Income Class E Cumulative Redeemable Preferred Stock, or the Class E preferred stock, for $25.00 per share, plus accrued dividends. We incurred a non-cash charge of $6.0 million. This charge is for the excess of redemption value over the carrying value of the Class E preferred stock and represents the original issuance cost that was paid in 2006. Net Income Available to Common Stockholders Net income available to common stockholders was $256.7 million in 2015, compared to $227.6 million in 2014, an increase of $29.1 million. On a diluted per common share basis, net income was $1.09 in 2015, as compared to $1.04 in 2014, an increase of $0.05, or 4.8%. Net income available to common stockholders was $203.6 million in 2013, or $1.06 on a diluted per common share basis. Net income available to common stockholders for 2014 includes a non-cash redemption charge of $6.0 million on the shares of Class E preferred stock that were redeemed in October 2014, which represents $0.03 on a diluted per common share basis. This charge is for the excess of redemption value over the carrying value of the Class E preferred stock and represents the original issuance cost that was paid in 2006. Net income available to common stockholders for 2013 was impacted by an unusually large gain on property sales, which represents $0.18 on a diluted per common share basis. Additionally, net income available to common stockholders for 2013 includes $13.0 million of merger-related costs for the acquisition of ARCT, which represents $0.07 on a diluted per common share basis, and $3.7 million for accelerated vesting of restricted shares that occurred in July 2013 from ten-year vesting to five years, which represents $0.02 on a diluted per common share basis. The calculation to determine net income available to common stockholders includes impairments and/or gains from the sale of properties. The amount of impairments and/or gains varies from period to period based on the timing of property sales and can significantly impact net income available to common stockholders. Gains from the sale of properties during 2015 were $22.2 million, as compared to gains from the sale of properties of $42.1 million during 2014. Discontinued Operations During the first quarter of 2014, the Financial Accounting Standards Board issued guidance that changed the definition of discontinued operations by limiting discontinued operations reporting to disposals of components of an entity that represent strategic shifts that have, or will have, a major effect on an entity’s operations and financial results. We early adopted the requirements of this accounting pronouncement in the first quarter of 2014. Starting with the first quarter of 2014, the results of operations for all qualifying disposals and properties classified as held for sale that were not previously reported in discontinued operations in our 2013 Annual Report on Form 10-K are presented within income from continuing operations on our consolidated statements of income. For 2014, we recorded income from discontinued operations of $2.8 million, or $0.01 per common share, basic and diluted. For 2013, we recorded income from discontinued operations of $65.7 million, or $0.34 per common share, basic and diluted. FUNDS FROM OPERATIONS AVAILABLE TO COMMON STOCKHOLDERS (FFO) In 2015, our FFO increased by $89.5 million, or 15.9%, to $652.4 million, compared to $562.9 million in 2014. On a diluted per common share basis, FFO was $2.77 in 2015, compared to $2.58 in 2014, an increase of $0.19, or 7.4%. In 2013, FFO was $462.0 million, or $2.41 on a diluted per common share basis. Our FFO in 2014 included a non-cash redemption charge of $6.0 million on the shares of Class E preferred stock that were redeemed in October 2014, which represents $0.03 on a diluted per common share basis. This charge is for the excess of redemption value over the carrying value of the Class E preferred stock and represents the original issuance cost that was paid in 2006. FFO in 2013 was normalized to exclude $13.0 million of merger-related costs, which represents $0.07 on a diluted per common share basis for 2013. FFO for 2013 includes $3.7 million for accelerated vesting of restricted shares that occurred in July 2013 from ten-year vesting to five years, which represents $0.02 on a diluted per common share basis. All references to FFO for 2013 reflect the adjustments for merger-related costs for the acquisition of ARCT. 80

The following is a reconciliation of net income available to common stockholders (which we believe is the most comparable GAAP measure) to FFO. Also presented is information regarding distributions paid to common stockholders and the weighted average number of common shares used for the basic and diluted computation per share (dollars in thousands, except per share amounts): 2015 2014 2013 Net income available to common stockholders $ 256,686 $ 227,558 $ 203,634 Depreciation and amortization:
Continuing operations 409,215 374,661 306,769 Discontinued operations - - 1,626
Depreciation of furniture, fixtures and equipment (811 ) (482 ) (288 ) Provisions for impairment on investment properties:
Continuing operations 10,560 4,126 290 Discontinued operations - 510 2,738
Gain on sales of investment properties: Continuing operations (22,243 ) (39,205 ) - Discontinued operations - (2,883 ) (64,743 )
Merger-related costs (1) - - 13,013 FFO adjustments allocable to noncontrolling interests (970 ) (1,396 ) (1,009 )
FFO available to common stockholders $ 652,437 $ 562,889 $ 462,030
FFO per common share, basic and diluted (2) $ 2.77 $ 2.58 $ 2.41 Distributions paid to common stockholders $ 533,238 $ 479,256 $ 409,222 FFO in excess of distributions paid to
common stockholders $ 119,199 $ 83,633 $ 52,808 Weighted average number of common shares
used for computation per share:
Basic 235,767,932 218,390,885 191,754,857
Diluted (2) 235,891,368 218,450,863 191,781,622 (1) FFO for 2013 has been normalized to exclude ARCT merger-related costs.
(2) The computation of diluted FFO does not assume conversion of securities that are convertible to common
shares if the conversion of those securities would increase diluted FFO per share in a given period. We define FFO, a non-GAAP measure, consistent with the National Association of Real Estate Investment Trusts’ definition, as net income available to common stockholders, plus depreciation and amortization of real estate assets, plus impairments of depreciable real estate assets, reduced by gains on property sales and extraordinary items. We consider FFO to be an appropriate supplemental measure of a REIT’s operating performance as it is based on a net income analysis of property portfolio performance that adds back items such as depreciation and impairments for FFO. The historical accounting convention used for real estate assets requires straight-line depreciation of buildings and improvements, which implies that the value of real estate assets diminishes predictably over time. Since real estate values historically rise and fall with market conditions, presentations of operating results for a REIT, using historical accounting for depreciation, could be less informative. The use of FFO is recommended by the REIT industry as a supplemental performance measure. In addition, FFO is used as a measure of our compliance with the financial covenants of our new credit facility. ADJUSTED FUNDS FROM OPERATIONS AVAILABLE TO COMMON STOCKHOLDERS (AFFO) In 2015, our AFFO increased by $85.3 million, or 15.2%, to $647.0 million, compared to $561.7 million in 2014. On a diluted per common share basis, AFFO was $2.74 in 2015, compared to $2.57 in 2014, an increase of $0.17, or 6.6%. In 2013, AFFO was $463.1 million, or $2.41 on a diluted per common share basis. We consider AFFO to be an appropriate supplemental measure of our performance. Most companies in our industry use a similar measurement, but they may use the term "CAD" (for Cash Available for Distribution), "FAD" (for Funds Available for Distribution) or other terms.
81

The following is a reconciliation of net income available to common stockholders (which we believe is the most comparable GAAP measure) to FFO and AFFO. Also presented is information regarding distributions paid to common stockholders and the weighted average number of common shares used for the basic and diluted computation per share (dollars in thousands, except per share amounts):
2015 2014 2013 Net income available to common stockholders $ 256,686 $ 227,558 $ 203,634 Cumulative adjustments to calculate FFO (1) 395,751 335,331 258,396 FFO available to common stockholders 652,437 562,889 462,030 Provisions for impairment on Crest properties - - 308 Excess of redemption value over carrying value
of preferred share redemptions - 6,015 - Amortization of share-based compensation 10,391 11,959 20,785 Amortization of deferred financing costs (2) 5,294 4,804 4,436 Amortization of net mortgage premiums (6,978 ) (9,208 ) (9,481 ) Gain on early extinguishment of debt (504 ) (3,428 ) - (Gain) loss on interest rate swaps 3,043 1,349 (878 ) Leasing costs and commissions (748 ) (821 ) (1,280 ) Recurring capital expenditures (7,606 ) (5,210 ) (7,227 ) Straight-line rent (16,468 ) (14,872 ) (13,742 ) Amortization of above and below-market leases 7,861 8,024 8,188 Other adjustments (3) 306 160 -
Total AFFO available to common stockholders (4) $ 647,028 $ 561,661 $ 463,139 AFFO per common share: Basic $ 2.74 $ 2.57 $ 2.42 Diluted $ 2.74 $ 2.57 $ 2.41 Distributions paid to common stockholders $ 533,238 $ 479,256 $ 409,222 AFFO in excess of distributions paid to common stockholders $ 113,790 $ 82,405 $ 53,917 Weighted average number of common shares used for computation per share:
Basic 235,767,932 218,390,885 191,754,857
Diluted (4) 235,891,368 218,450,863 191,781,622 (1) See reconciling items for FFO presented under "Funds from Operations (FFO) Available to Common Stockholders."
(2) Includes the amortization of costs incurred and capitalized upon issuance of our notes payable, assumption of our mortgages payable and upon issuance of our term loans. The deferred financing costs are being amortized over the lives of the respective mortgages and term loans. No costs associated with our credit facility agreements or annual fees paid to credit rating agencies have been included.
(3) Includes adjustments allocable to both non-controlling interests and capital lease obligations.
(4) The computation of diluted AFFO does not assume conversion of securities that are convertible to common shares if the conversion of those securities would increase diluted AFFO per share in a given period.
We believe the non-GAAP financial measure AFFO provides useful information to investors because it is a widely accepted industry measure of the operating performance of real estate companies that is used by industry analysts and investors who look at and compare those companies. In particular, AFFO provides an additional measure to compare the operating performance of different REITs without having to account for differing depreciation assumptions and other unique revenue and expense items which are not pertinent to measuring a particular company’s on-going operating performance. Therefore, we believe that AFFO is an appropriate supplemental performance metric, and that the most appropriate GAAP performance metric to which AFFO should be reconciled is net income available to common stockholders.
82
Presentation of the information regarding FFO and AFFO is intended to assist the reader in comparing the operating performance of different REITs, although it should be noted that not all REITs calculate FFO and AFFO in the same way, so comparisons with other REITs may not be meaningful. Furthermore, FFO and AFFO are not necessarily indicative of cash flow available to fund cash needs and should not be considered as alternatives to net income as an indication of our performance. FFO and AFFO should not be considered as alternatives to reviewing our cash flows from operating, investing, and financing activities. In addition, FFO and AFFO should not be considered as measures of liquidity, of our ability to make cash distributions, or of our ability to pay interest payments. IMPACT OF INFLATION Tenant leases generally provide for limited increases in rent as a result of increases in the tenants' sales volumes, increases in the consumer price index (typically subject to ceilings), or fixed increases. We expect that inflation will cause these lease provisions to result in rent increases over time. During times when inflation is greater than increases in rent, as provided for in the leases, rent increases may not keep up with the rate of inflation. Of our 4,538 properties in our portfolio, approximately 98.0% or 4,467 are leased to tenants under net leases where the tenant is responsible for property expenses. Net leases tend to reduce our exposure to rising property expenses due to inflation. Inflation and increased costs may have an adverse impact on our tenants if increases in their operating expenses exceed increases in revenue. IMPACT OF RECENT ACCOUNTING PRONOUNCEMENTS For information on the impact of recent accounting pronouncements on our business, see note 2 of the Notes to the Consolidated Financial Statements. QUANTITATIVE AND QUALITATIVE DISCLOSURES ABOUT MARKET RISK
We are exposed to interest rate changes primarily as a result of our new credit facility, term loans, mortgages payable, and long-term notes and bonds used to maintain liquidity and expand our real estate investment portfolio and operations. Our interest rate risk management objective is to limit the impact of interest rate changes on earnings and cash flow and to lower our overall borrowing costs. To achieve these objectives we issue long-term notes and bonds, primarily at fixed rates. In order to mitigate and manage the effects of interest rate risks on our operations, we may utilize a variety of financial instruments, including interest rate swaps and caps. The use of these types of instruments to hedge our exposure to changes in interest rates carries additional risks, including counterparty credit risk, the enforceability of hedging contracts and the risk that unanticipated and significant changes in interest rates will cause a significant loss of basis in the contract. To limit counterparty credit risk we will seek to enter into such agreements with major financial institutions with favorable credit ratings. There can be no assurance that we will be able to adequately protect against the foregoing risks or realize an economic benefit that exceeds the related amounts incurred in connection with engaging in such hedging activities. We do not enter into any derivative transactions for speculative or trading purposes. The following table presents by year of expected maturity, the principal amounts, average interest rates and estimated fair values of our fixed and variable rate debt as of December 31, 2015. This information is presented to evaluate the expected cash flows and sensitivity to interest rate changes (dollars in millions):
83
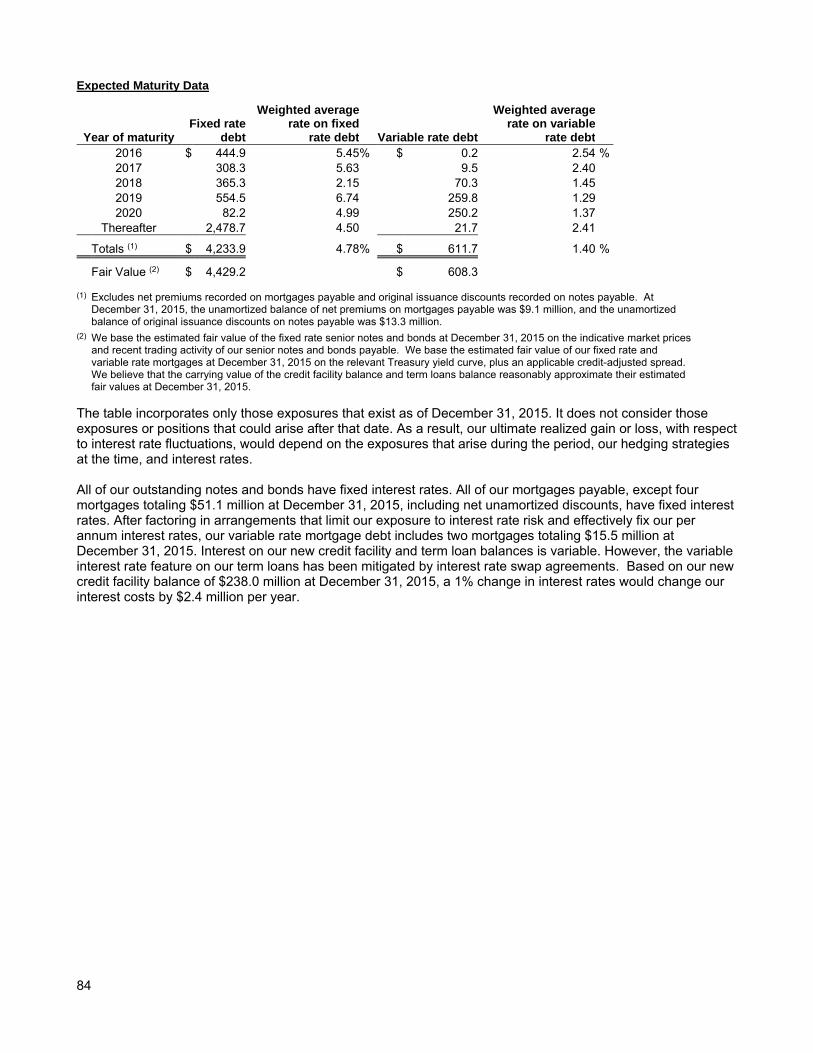
Expected Maturity Data
Year of maturity Fixed rate
debt
Weighted average rate on fixed
rate debt Variable rate debt
Weighted average rate on variable
rate debt 2016 $ 444.9 5.45 % $ 0.2 2.54 % 2017 308.3 5.63 9.5 2.40 2018 365.3 2.15 70.3 1.45 2019 554.5 6.74 259.8 1.29 2020 82.2 4.99 250.2 1.37
Thereafter 2,478.7 4.50 21.7 2.41
Totals (1) $ 4,233.9 4.78 % $ 611.7 1.40 %
Fair Value (2) $ 4,429.2 $ 608.3 (1) Excludes net premiums recorded on mortgages payable and original issuance discounts recorded on notes payable. At
December 31, 2015, the unamortized balance of net premiums on mortgages payable was $9.1 million, and the unamortized balance of original issuance discounts on notes payable was $13.3 million.
(2) We base the estimated fair value of the fixed rate senior notes and bonds at December 31, 2015 on the indicative market prices and recent trading activity of our senior notes and bonds payable. We base the estimated fair value of our fixed rate and variable rate mortgages at December 31, 2015 on the relevant Treasury yield curve, plus an applicable credit-adjusted spread. We believe that the carrying value of the credit facility balance and term loans balance reasonably approximate their estimated fair values at December 31, 2015.
The table incorporates only those exposures that exist as of December 31, 2015. It does not consider those exposures or positions that could arise after that date. As a result, our ultimate realized gain or loss, with respect to interest rate fluctuations, would depend on the exposures that arise during the period, our hedging strategies at the time, and interest rates. All of our outstanding notes and bonds have fixed interest rates. All of our mortgages payable, except four mortgages totaling $51.1 million at December 31, 2015, including net unamortized discounts, have fixed interest rates. After factoring in arrangements that limit our exposure to interest rate risk and effectively fix our per annum interest rates, our variable rate mortgage debt includes two mortgages totaling $15.5 million at December 31, 2015. Interest on our new credit facility and term loan balances is variable. However, the variable interest rate feature on our term loans has been mitigated by interest rate swap agreements. Based on our new credit facility balance of $238.0 million at December 31, 2015, a 1% change in interest rates would change our interest costs by $2.4 million per year.
84
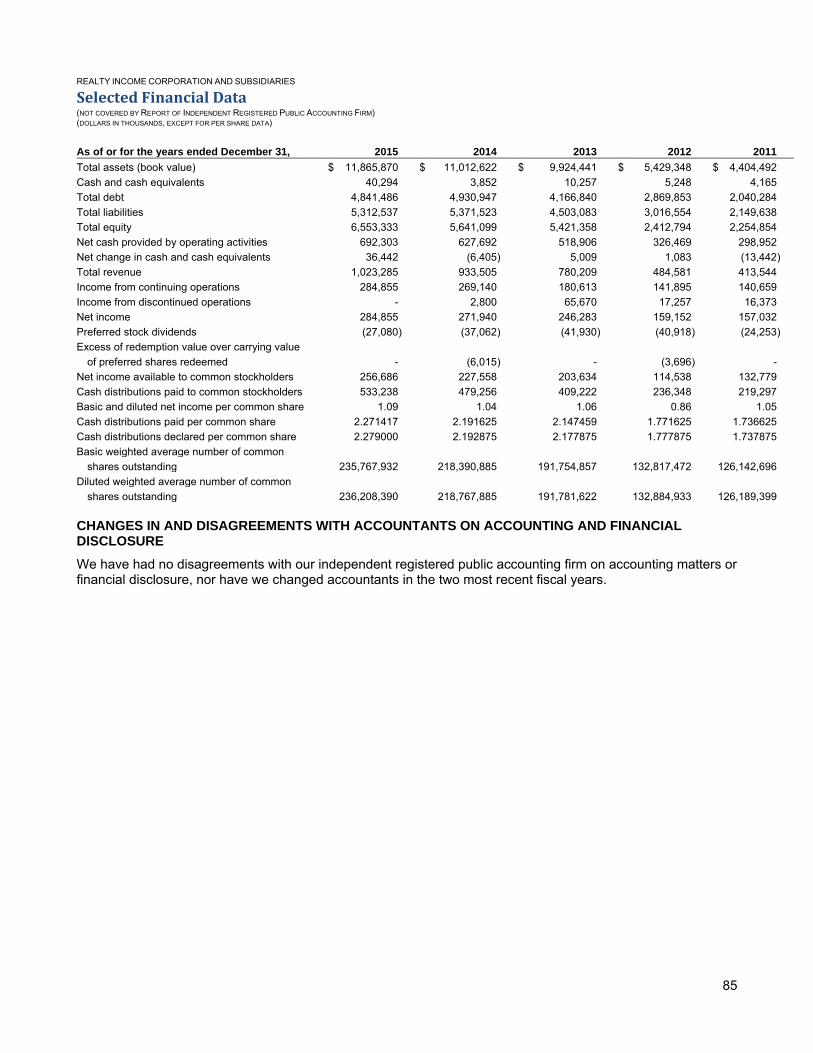
REALTY INCOME CORPORATION AND SUBSIDIARIES
Selected Financial Data (NOT COVERED BY REPORT OF INDEPENDENT REGISTERED PUBLIC ACCOUNTING FIRM) (DOLLARS IN THOUSANDS, EXCEPT FOR PER SHARE DATA) As of or for the years ended December 31, 2015 2014 2013 2012 2011 Total assets (book value) $ 11,865,870 $ 11,012,622 $ 9,924,441 $ 5,429,348 $ 4,404,492 Cash and cash equivalents 40,294 3,852 10,257 5,248 4,165 Total debt 4,841,486 4,930,947 4,166,840 2,869,853 2,040,284 Total liabilities 5,312,537 5,371,523 4,503,083 3,016,554 2,149,638 Total equity 6,553,333 5,641,099 5,421,358 2,412,794 2,254,854 Net cash provided by operating activities 692,303 627,692 518,906 326,469 298,952 Net change in cash and cash equivalents 36,442 (6,405 ) 5,009 1,083 (13,442 ) Total revenue 1,023,285 933,505 780,209 484,581 413,544 Income from continuing operations 284,855 269,140 180,613 141,895 140,659 Income from discontinued operations - 2,800 65,670 17,257 16,373 Net income 284,855 271,940 246,283 159,152 157,032 Preferred stock dividends (27,080 ) (37,062 ) (41,930 ) (40,918 ) (24,253 ) Excess of redemption value over carrying value
of preferred shares redeemed - (6,015 ) - (3,696 ) - Net income available to common stockholders 256,686 227,558 203,634 114,538 132,779 Cash distributions paid to common stockholders 533,238 479,256 409,222 236,348 219,297 Basic and diluted net income per common share 1.09 1.04 1.06 0.86 1.05 Cash distributions paid per common share 2.271417 2.191625 2.147459 1.771625 1.736625 Cash distributions declared per common share 2.279000 2.192875 2.177875 1.777875 1.737875 Basic weighted average number of common
shares outstanding 235,767,932 218,390,885 191,754,857 132,817,472 126,142,696 Diluted weighted average number of common
shares outstanding 236,208,390 218,767,885 191,781,622 132,884,933 126,189,399 CHANGES IN AND DISAGREEMENTS WITH ACCOUNTANTS ON ACCOUNTING AND FINANCIAL DISCLOSURE We have had no disagreements with our independent registered public accounting firm on accounting matters or financial disclosure, nor have we changed accountants in the two most recent fiscal years.
85
REALTY INCOME CORPORATION AND SUBSIDIARIES
Controls and Procedures Evaluation of Disclosure Controls and Procedures We maintain disclosure controls and procedures (as defined in Rules 13a-15(e) and 15d-15(e) of the Securities Exchange Act of 1934, as amended) that are designed to ensure that information required to be disclosed in our Exchange Act reports is recorded, processed, summarized and reported within the time periods specified in the Securities and Exchange Commission’s rules and forms, and that such information is accumulated and communicated to our management, including our Chief Executive Officer and Chief Financial Officer, as appropriate, to allow timely decisions regarding required disclosure. In designing and evaluating the disclosure controls and procedures, management recognizes that any controls and procedures, no matter how well designed and operated, can provide only reasonable assurance of achieving the desired control objectives, and management necessarily was required to apply its judgment in evaluating the cost-benefit relationship of possible controls and procedures. As of and for the year ended December 31, 2015, we carried out an evaluation of the effectiveness of the design and operation of our disclosure controls and procedures, under the supervision and with the participation of management, including our Chief Executive Officer and Chief Financial Officer. Based on the foregoing, our Chief Executive Officer and Chief Financial Officer concluded that our disclosure controls and procedures were effective and were operating at a reasonable assurance level. Management's Report on Internal Control Over Financial Reporting Internal control over financial reporting refers to the process designed by, or under the supervision of, our Chief Executive Officer and Chief Financial Officer, and effected by our Board of Directors, management and other personnel, to provide reasonable assurance regarding the reliability of financial reporting and the preparation of financial statements for external purposes in accordance with generally accepted accounting principles, and includes those policies and procedures that:
(1) Pertain to the maintenance of records that in reasonable detail accurately and fairly reflect the transactions and dispositions of the assets of the Company;
(2) Provide reasonable assurance that transactions are recorded as necessary to permit preparation of
financial statements in accordance with generally accepted accounting principles, and that receipts and expenditures of the Company are being made only in accordance with authorizations of management and directors of the Company; and
(3) Provide reasonable assurance regarding prevention or timely detection of unauthorized acquisition,
use or disposition of the Company's assets that could have a material effect on the financial statements. Management is responsible for establishing and maintaining adequate internal control over financial reporting for the Company. Management has used the framework set forth in the report entitled "Internal Control--Integrated Framework (2013)" published by the Committee of Sponsoring Organizations of the Treadway Commission to evaluate the effectiveness of the Company's internal control over financial reporting. Management has concluded that the Company's internal control over financial reporting was effective as of the end of the most recent fiscal year. KPMG LLP has issued an attestation report on the effectiveness of the Company's internal control over financial reporting. Submitted on February 11, 2016 by,
John P. Case, Chief Executive Officer Paul M. Meurer, Executive Vice President, Chief Financial Officer, and Treasurer
86

Changes in Internal Controls There were no changes to our internal control over financial reporting that occurred during the quarter ended December 31, 2015 that have materially affected, or are reasonably likely to material affect, our internal control over financial reporting. As of December 31, 2015, there were no material weaknesses in our internal controls, and therefore, no corrective actions were taken. Limitations on the Effectiveness of Controls Internal control over financial reporting cannot provide absolute assurance of achieving financial reporting objectives because of its inherent limitations. Internal control over financial reporting is a process that involves human diligence and compliance and is subject to lapses in judgment and breakdowns resulting from human failures. Internal control over financial reporting also can be circumvented by collusion or improper management override. Because of such limitations, there is a risk that material misstatements may not be prevented or detected on a timely basis by internal control over financial reporting. However, these inherent limitations are known features of the financial reporting process. Therefore, it is possible to design into the process safeguards to reduce, though not eliminate, this risk. Certifications John Case, Realty Income’s Chief Executive Officer, certified to the NYSE in 2015, pursuant to Section 303A.12(a) of the NYSE’s Listing Standards, that he was not aware of any violation of the NYSE corporate governance listing standards by Realty Income. Furthermore, Realty Income filed with the SEC as exhibits to its Annual Report on Form 10-K for the year ended December 31, 2015, the certifications by John Case and Paul M. Meurer, Realty Income’s Chief Executive Officer and Chief Financial Officer, respectively, required under Section 302 of the Sarbanes-Oxley Act. REALTY INCOME CORPORATION AND SUBSIDIARIES
Market for Registrant’s Common Equity, Related Stockholder Matters and Issuer Purchases of Equity Securities A. Our common stock is traded on the NYSE under the ticker symbol “O.” The following table shows the high and low sales prices per share for our common stock as reported by the NYSE, and distributions declared per share of common stock for the periods indicated. Price Per Share of Common Stock Distributions High Low Declared (1)
2015 First Quarter $ 52.41 $ 45.65 $ 0.5675000 Second Quarter 48.88 43.15 0.5690000 Third Quarter 52.66 44.23 0.5705000 Fourth Quarter 55.54 47.95 0.5720000
Total $ 2.2790000
2014 First Quarter $ 45.11 $ 37.01 $ 0.5468126 Second Quarter 44.98 40.21 0.5477501 Third Quarter 45.83 40.56 0.5486876 Fourth Quarter 49.65 40.71 0.5496251
Total $ 2.1928754
(1) Common stock cash distributions are declared monthly by us based on financial results for the prior months. At December 31, 2015, a distribution of $0.191 per common share had been declared and was paid in January 2016.
B. There were 10,051 registered holders of record of our common stock as of December 31, 2015. We estimate that our total number of shareholders is over 354,000 when we include both registered and beneficial holders of our common stock.
87

C. During the fourth quarter of 2015, 225 shares of stock, at a price of $49.61, and 18,645 shares of stock, at a price of $51.63, were withheld for state and federal payroll taxes on the vesting of employee stock awards, as permitted under the 2012 Incentive Award Plan of Realty Income Corporation.
80
100
120
140
160
180
200
12/31/10 12/31/11 12/31/12 12/31/13 12/31/14 12/31/15
Inde
x Va
lue
Total Return Performance
Realty Income CorporationRussell 2000S&P 500Realty Income Peer Group index*SNL Triplenet REIT index
Period Ending
Index 12/31/10 12/31/11 12/31/12 12/31/13 12/31/14 12/31/15
Realty Income Corporation 100.00 107.53 129.38 126.38 169.78 192.51
Russell 2000 100.00 95.82 111.49 154.78 162.35 155.18
S&P 500 100.00 102.11 118.45 156.82 178.28 180.75
Realty Income Peer Group index* 100.00 107.69 124.50 123.83 167.97 167.77
SNL Triplenet REIT index 100.00 103.31 124.01 125.92 157.36 148.73 * Realty Income Peer Group index consists of 17 companies with an implied market capitalization between $2.7 billion and $23.9 billion as of September 30, 2015.
88

R E A L T Y I N C O M E 2 0 1 5 A N N U A L R E P O R T 8 9
COMPANY INFORMATION
Transfer AgentWells Fargo Shareowner ServicesP.O. Box 64873St. Paul, MN 55164
For shareholder administration and account information please visit Wells Fargo’s website at www.shareowneronline.com, call toll-free at 1-877-218-2434, or email your questions to [email protected]
Independent Registered Public Accounting FirmKPMG LLP San Diego, CA
For Additional Corporate Information Visit the Realty Income corporate website at www.realtyincome.com
Contact your financial advisor, or contact Realty Income at: Telephone: 858-284-5000, Email: [email protected]
Copies of Realty Income’s Annual Report on Form 10-K are available upon written request to: REALTY INCOME CORPORATION Attention: Investor Relations 11995 El Camino Real San Diego, CA 92130
EXECUTIVE OFFICERS
DIRECTORS
Top row left to right: Neil Abraham, John Case, Michael Pfeiffer | Bottom row left to right: Sumit Roy, Paul Meurer
Michael D. McKeeChairman of the Board of Directors Chief Executive Officer, Bentall Kennedy
John P. CaseChief Executive Officer
Kathleen R. Allen, Ph.D.Director, Center for Technology Commercialization, Marshall School of Business University of Southern California
A. Larry ChapmanRetired, Executive Vice President, Head of Commercial Real Estate, Wells Fargo Bank
Priya Cherian HuskinsPartner, Woodruff-Sawyer & Co.
Gregory T. McLaughlinPresident, PGA TOUR-Champions Tour
Ronald L. MerrimanRetired Vice Chair, KPMG LLP
Stephen E. SterrettRetired, Senior Executive Vice President, Chief Financial Officer, Simon Property Group, Inc.
Top row left to right: Gregory McLaughlin, Kathleen Allen, Ronald Merriman, Priya Cherian Huskins, Larry Chapman | Bottom row left to right: Michael McKee, John Case, Stephen Sterrett
ADDITIONAL OFFICERS
Robert J. IsraelSenior Vice President, Research
Elizabeth CateVice President, Portfolio Management
Benjamin N. FoxSenior Vice President,Asset and Portfolio Management
Dawn NguyenSenior Vice President, Portfolio Management
Theresa M. CaseyVice President, IT Enterprise Software
Janeen S. BedardVice President, Administration
Stephen D. BurchettVice President, Senior Legal Counsel
Shannon C. JensenVice President,Associate General Counseland Assistant Secretary
Sean P. NugentVice President,Controller
Clint SchmuckerVice President, Information Technology
Joel TomlinsonSenior Vice President, Acquisitions
Cary J. WenthurSenior Vice President, Acquisitions
Jill M. CossaboomAssociate Vice President, Assistant Controller
Kristin K. FerrellVice President, Head of Lease Administration
Teresa M. GlennAssociate Vice President,Human Resources and Operations
Scott A. KohnenVice President,Research
Jenette S. O’BrienVice President, Asset Management
Gregory M. LibbyAssociate Vice President, Property Management
Shannon KehleVice President, Human Resources
Lori SatterfieldVice President, Senior Legal Counsel
Ashley N. WellsVice President, Research
Kyle B. CampbellAssociate Vice President,Senior Legal Counsel, Risk Management
Jonathan PongVice President, Head of Capital Markets and Investor Relations
Ross EdwardsVice President, Corporate Leasing
T.J. ChunVice President, Investments
Nicole A. CarrAssociate Vice President, Director of Financial Reporting
John P. CaseChief Executive Officer
Sumit RoyPresident and Chief Operating Officer
Paul M. MeurerExecutive Vice President, Chief Financial Officer and Treasurer
Michael R. PfeifferExecutive Vice President, General Counsel and Secretary
Neil AbrahamExecutive Vice President, Chief Investment Officer
REALTY INCOME
NASDAQ COMPOSITE
EQUITY REIT INDEX
S&P 500
DOW JONES INDUSTRIAL AVERAGE
1.4%
2.8%
5.7%
13.0%
0.2%
TABLE OF CONTENTSHISTORICAL FINANCIAL PERFORMANCE 2LETTER TO SHAREHOLDERS 4HIGH-QUALITY PORTFOLIO 12DISCIPLINED INVESTMENT PROCESS 16CONSERVATIVE CAPITAL STRUCTURE 18MONTHLY DIVIDENDS 192015 ANNUAL REPORT: FORM 10-K 20COMPANY INFORMATION 89
2015 TOTAL SHAREHOLDER RETURN
STRONG PERFORMANCE

RE
AL
TY
INC
OM
E 2
015
AN
NU
AL
RE
PO
RT
2015 ANNUAL REPORT
G E N E R A T I N G S H A R E H O L D E R V A L U EFSCLOGO
FOR POSITION ONLY
1 1 9 9 5 E L C A M I N O R E A L
S A N D I E G O , C A 9 2 1 3 0
w w w . r e a l t y i n c o m e . c o m