realty income investor presentation 3q 2016
TRANSCRIPT

INVESTOR PRESENTATION3Q 2016
1
ContentsCompany Overview & Stock Performance 3
Investment Thesis 8
Portfolio Diversification 13
Asset and Portfolio Management 18
Investment Strategy 21
Capital Structure and Scalability 28
Dependable Dividends 32
Guidance 36
Summary 37
All data as of September 30, 2016 unless otherwise specified

2
Safe Harbor For Forward-Looking Statement
Statements in this investor presentation that are not strictly historical are "forward-looking" statements.Forward-looking statements involve known and unknown risks, which may cause the company‘s actual futureresults to differ materially from expected results. These risks include, among others, general economicconditions, local real estate conditions, tenant financial health, the availability of capital to finance plannedgrowth, continued volatility and uncertainty in the credit markets and broader financial markets, propertyacquisitions and the timing of these acquisitions, charges for property impairments, and the outcome of anylegal proceedings to which the company is a party, as described in the company's filings with the Securitiesand Exchange Commission. Consequently, forward-looking statements should be regarded solely asreflections of the company's current operating plans and estimates. Actual operating results may differmaterially from what is expressed or forecast in this investor presentation. The company undertakes noobligation to publicly release the results of any revisions to these forward-looking statements that may bemade to reflect events or circumstances after the date these statements were made.

3
S&P 500 Real Estate Investment Trust with Proven Track Record of Strong Total Returns Company Overview & Stock Performance
Leading real estate company: Equity market cap of $17.3 billion and EV of $23.0 billion Largest net lease REIT by equity market cap and enterprise value Member of S&P 500 index Member of S&P High-Yield Dividend Aristocrats® index 1
Strong returns with low volatility: 17.9% compound average annual return since NYSE listing in 1994 3.6% dividend yield, paid monthly 76 consecutive quarters of dividend increases
Conservative capital structure: Investment grade credit ratings
Moody’s: Baa1 / Positive S&P: BBB+ / Positive Fitch: BBB+ / Stable
22.9% debt to total market capitalization 5.3x debt to EBITDA 6.8-year weighted average duration of unsecured notes and bonds 2
1 The S&P High Yield Dividend Aristocrats® index is designed to measure the performance of companies within the S&P Composite 1500® that have followed a managed-dividends policy of consistently increasing dividends every year for at least 20 years.
2 As of October 12, 2016

4
Our Approach as “The Monthly Dividend Company®”Generate lease revenue to support the payment of growing monthly dividends
Support and grow monthly dividends for shareholders
Target well-located,Freestanding,single-tenant,
commercialproperties
Remain disciplinedin our acquisition
underwriting
Execute long-termnet lease
agreementsActively manage the portfolio to maintain
high occupancy
Maintain a conservative
balance sheet

5
Attractive Risk/Reward vs. S&P 500 Companies
-20%
0%
20%
40%
60%
80%
100%
0.00.20.40.60.81.01.21.41.61.82.0
Tota
l Ret
urn C
AGR
Sinc
e 10/
18/9
4 (N
YSE
Listin
g)
(1) n=346 / Excludes companies without trading histories dating to 1994
Beta measured using monthly frequencySource: FactSet
Higher returns and lower volatility than majority of S&P 500 companies since 1994 NYSE listing
Beta vs. S&P 500 Since 10/18/1994 (NYSE Listing)
Realty Income return per unit of market risk in the 98th percentile
of all S&P 500 companies(1):
Beta: 0.39Return: 17.9%
Current S&P 500 Companies
Lower volatility correlated with higher returns over the long-term

6
Attractive Risk/Reward vs. Blue Chip S&P 500 Equities
GE
WFC
T
PG
JNJ
XOM
AAPL
WMTREITs
MSFT
S&P 500
JPM
0%
5%
10%
15%
20%
25%
30%
0.00.51.01.52.0
Greater return per unit of market risk than
each of top 10 largest S&P constituents(1)
since 1994 NYSE listing
O
Proven long-term investment provides an attractive risk/reward
(1) Excludes companies without trading histories since 10/18/1994Beta measured using monthly frequencySource: FactSet
Tota
l Ret
urn C
AGR
Sinc
e 10/
18/9
4
Beta vs. S&P 500 Since 10/18/1994 7%
8%
9%
11%
12%
13%
14%
18%
18%
21%
24%
28%
46%
GE
JPM
S&P 500
T
MSFT
WFC
REITs
AAPL
WMT
XOM
JNJ
PG
O
Average Annual Compound Growth per Unit of Market Risk
O
7
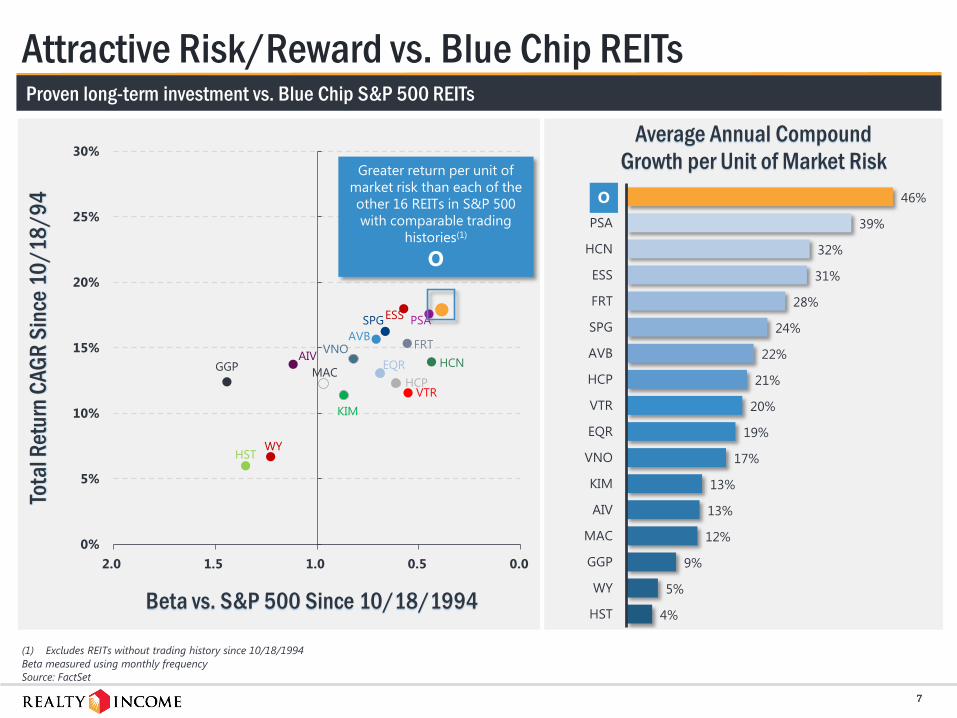
Attractive Risk/Reward vs. Blue Chip REITsTo
tal R
etur
n CAG
R Si
nce 1
0/18
/94
AIVGGP
WYHST
PSA
HCN
ESS
FRT
SPGAVB
VTRHCP
EQRVNO
KIM
MAC
0%
5%
10%
15%
20%
25%
30%
0.00.51.01.52.0
Greater return per unit of market risk than each of the other 16 REITs in S&P 500 with comparable trading
histories(1)
O
4%
5%
9%
12%
13%
13%
17%
19%
20%
21%
22%
24%
28%
31%
32%
39%
46%
HST
WY
GGP
MAC
AIV
KIM
VNO
EQR
VTR
HCP
AVB
SPG
FRT
ESS
HCN
PSA
O
Average Annual Compound Growth per Unit of Market Risk
O
Proven long-term investment vs. Blue Chip S&P 500 REITs
Beta vs. S&P 500 Since 10/18/1994
(1) Excludes REITs without trading history since 10/18/1994Beta measured using monthly frequencySource: FactSet

8
INVESTMENT THESIS:Earnings Growth OutperformanceConsistency

9
356670
500337
9 140 228 254
800 909
65
-670
1,649
12712
2001 2002 2003 2004 2005 2006 2007 2008 2009 2010 2011 2012 2013 2014 2015
Realty Income Annual FFO/sh Growth Outperformance vs. REIT Median (in bps)
Consistent Earnings Growth Outperformance vs. REITs
5.4% 5.4% 5.4% 5.5% 5.5% 5.4% 4.9%6.1% 7.1%
8.6% 8.8%
12.2%
1.0% 1.3% 1.2%
-0.1%
1.0%
-0.1% -0.2%
0.5%3.5%
6.1% 6.6% 7.1%
2001 2002 2003 2004 2005 2006 2007 2008 2009 2010 2011 2012
Realty Income FFO/sh CAGR1 Outpaces REIT Median Throughout All CyclesRealty Income FFO/sh CAGR REIT Median FFO/sh CAGR
Annual FFO/sh growth has exceeded REIT median in 14 of the last 15 years
FFO/sh CAGR since:
1 Reflects FFO/sh growth CAGR through 2015Source: SNL, FactSet

10
$0.34
$0.43
$0.00
$0.10
$0.20
$0.30
$0.40
$0.50
$0.60
1Q00
3Q00
1Q01
3Q01
1Q02
3Q02
1Q03
3Q03
1Q04
3Q04
1Q05
3Q05
1Q06
3Q06
1Q07
Realty Income FFO/sh
Spread investing dynamics persistthroughout the cycle
• During prior cycle era of rising rates (Q2 2003 trough through Q2 2006 peak), Realty Income earnings grew faster than most REITs
• Realty Income FFO/sh CAGR: 8.1%• REIT Median FFO/sh CAGR: 4.4%
• Acquisition cap rates adjust to rising interest rates, preserving attractive investment spreads
• Acquisition spreads vs. WACC did moderate (from ~250bps in 2003 to ~150bps in 2006), but less than the increase in interest rates (~170bps in comparable time period)
• Nominal cost of equity declined despite rising interest rates, offsetting increase in debt costs
• Dividend CAGR during this period was 5.9%
• Success of business objective (growing dividend payments to shareholders) can persevere throughout all interest rate environments
Interest Rate Sensitivity: Earnings Growth Undeterred by Rising Rates
Source: SNL
• Realty Income FFO/sh CAGR: 8.1%• REIT Median FFO/sh CAGR: 4.4%
3.5%
5.1%
3.0%
3.5%
4.0%
4.5%
5.0%
5.5%
6.0%
6.5%
7.0%
Dec
-99
Jul-0
0
Feb-
01
Sep-
01
Apr-
02
Nov
-02
Jun-
03
Jan-
04
Aug-
04
Mar
-05
Oct
-05
May
-06
Dec
-06
Jul-0
7
10-year US Treasu r y Y ie ld
During the prior cycle period of steadilyrising interest rates,
Realty Income FFO/sh CAGR was in the 63rd percentile of all REITs
Realty Income earnings growth outperformed other REITs during last rising rate era
10-year US Treasury Yield
8.1% FFO/sh CAGR during
period of rising rates

11
99.1% 99.2% 99.5% 98.4% 97.7% 98.2% 97.7% 98.1% 97.9% 98.5% 98.7% 97.9% 97.0% 96.8% 96.6% 96.7% 97.2% 98.2% 98.4% 98.4% 98.3%
1996 1997 1998 1999 2000 2001 2002 2003 2004 2005 2006 2007 2008 2009 2010 2011 2012 2013 2014 2015 3Q16
Based on % of properties occupied
Consistency: Steady Portfolio, Solid Fundamentals
• Careful underwriting at acquisition
• Solid retail store performance
• Strong underlying real estate quality
• Favorable tenant industries
• Prudent disposition activity• Proactive management of rollover
Steady Same-Store Rent Growth
Consistent occupancy, same-store rent growth reflect limited operational volatility
Consistent Occupancy Levels, Never Below 96%
1.1%1.3%
1.8%1.5% 1.4% 1.4%
1.7%1.4% 1.5%
1.1%1.3% 1.3% 1.4%1.1%
Annual same-store rent growth run rate of 1.3% Long lease terms limit annual volatility
Sustained High Occupancy Rates

12
Safety: Lowest Volatility, Highest Return Relative to Market IndicesLong-term performance exceeds widely followed benchmark indices
Since 1994 NYSE listing, Realty
Income shares have outperformed
benchmark indices while exhibiting lower volatility
O Equity REIT Index DJIA S&P 500 Nasdaq
Annualized Total Return Since '94
Standard Deviation of Total Returns Since '94
OStandard deviation of total returns measures deviation from average annual total returns since 1994
13
PORTFOLIODIVERSIFICATION
14
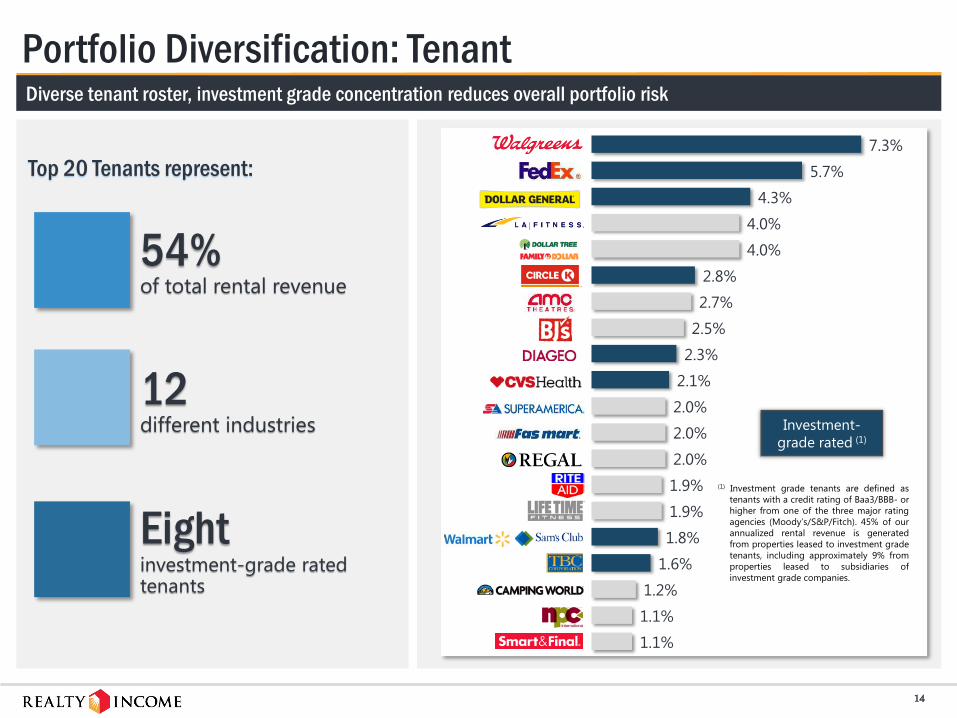
Portfolio Diversification: Tenant
12different industries
54%of total rental revenue
Eightinvestment-grade rated tenants
7.3%
5.7%
4.3%
4.0%
4.0%
2.8%
2.7%
2.5%
2.3%
2.1%
2.0%
2.0%
2.0%
1.9%
1.9%
1.8%
1.6%
1.2%
1.1%
1.1%
(1) Investment grade tenants are defined astenants with a credit rating of Baa3/BBB- orhigher from one of the three major ratingagencies (Moody’s/S&P/Fitch). 45% of ourannualized rental revenue is generatedfrom properties leased to investment gradetenants, including approximately 9% fromproperties leased to subsidiaries ofinvestment grade companies.
Top 20 Tenants represent:
Diverse tenant roster, investment grade concentration reduces overall portfolio risk
Investment-grade rated (1)

15
Portfolio Diversification: Industry
2.9%
3.5%
4.2%
4.8%
4.8%
5.7%
8.1%
8.6%
8.6%
11.0%
Grocery Stores
Wholesale Clubs
Casual Dining Restaurants
Quick-Service Restaurants
Theaters
Transportation Services
Health and Fitness
Dollar Stores
Convenience Stores
Drug Stores
Exposure to defensive industries:Top 10 industries represent strong diversification, significant exposure to non-discretionary, low price-point, service-oriented industries
No industry represents more than 11% of rent
Non-Discretionary
Service-Oriented
Non-Discretionary, Low Price Point
Non-Discretionary, Service-Oriented
Low Price Point, Service-Oriented
N/A (Non-Retail Exposure)
Low Price Point, Service-Oriented
Service-Oriented
Low Price Point
Non-Discretionary
Industry Retail Characteristics

16
Portfolio Diversification: GeographyBalanced presence in 49 states and Puerto Rico
PUERTO RICO
Represents percentage of rental revenue %
California 9.6%
Texas 9.3%
Florida 5.5%
Ohio 5.5%
Illinois 5.2%
New York 4.7%
% of Rental Revenue
1.0
<1
<1
<1
<1<1
<1
<1
<1
<19.6 1.5 1.8
<12.4
9.3
1.6
3.2
3.7
1.5
<1
1.41.7
3.2
5.2
1.5
2.9 5.5
2.3
1.4
1.9 4.3
5.5
1.9
2.8
2.8
<1
2.8
4.7
<1<1
1.3
<1
1.0
1.7
1.7<1
<1
<1
<1

17
Portfolio Diversification: Property TypeRoots in retail with growing exposure to mission-critical industrial properties
78.7% 13.4% 5.7% 2.2%
Number of Properties
Percentage of Rental Revenue
RETAIL INDUSTRIAL OFFICE AGRICULTURE
4,536 108 44 15
Average Leasable Square Feet11,671 222,633 77,345 12,300
Percentage of Rental Revenue from Investment Grade Tenants33.7% 83.3% 91.3% 100%

18
ASSET ANDPORTFOLIO MANAGEMENT

19
Strong Track Record of Leasing Results
Active Management: Significant Re-leasing ExperienceSince 1996, Realty Income has achieved 98% recapture of prior rent on leases re-leased to the same or new tenants
102.0%
100.4%
100.3%
2013 - Present
2006 - 2012
1996 - 2005
1 Includes re-lease to same or new tenant spreads vs. prior rent
Since 1996:
• Re-leased 1,964 out of 2,243 lease expirations (88%), recapturing 98% of expiring rent
• Sold the remaining 279 properties and recycled capital into properties that better fit our investment strategy
Reflects “net” leasing spreads:
• Associated tenant improvement costs have been immaterial ($2.9mm on $88.4mm of new cash rents signed since end of 2013)
• Protection of cash flow is paramount (properties do not require ongoing maintenance capex; leasing efforts focus on maximizing net effective leasing spreads and return on invested capital)
• Recurring maintenance capex and leasing costs can represent 10%+ of net operating income for strip centers and malls, < 1% for Realty Income historically
Recapture vs. Prior Rent: (Renewal Activity)(101.3% Since 1996)
Recapture vs. Prior Rent: (All Re-Leasing Activity)(98.1% Since 1996)
100.3%
95.6%
95.9%
2013 - Present
2006 - 2012
1996 - 2005

20
Active Management: Leasing and DispositionsProven track record of value creation, cash flow preservation and risk mitigation
Portfolio Management Largest department in the company Distinct management verticals
Retail Non-Retail
Leasing & dispositions
Healthy Leasing Results~98% recapture of expiring rents since 1996
• Over 2,200 rollovers• Includes renewals and re-leases to new tenants
YTD 2016 lease rollover activity • Re-leased 122 properties with expiring leases
– 96 re-leased to same tenant (79%)– 26 re-leased to new tenant (21%)– Recaptured 104% of expiring rent
Asset Management Maximizing value of real estate Strategic and opportunistic dispositions Value-creating development Risk mitigation
Favorable Returns, Lower Portfolio Risk$464 million of dispositions since 2010• 2014: 6.9% cap rate / 11.6% unlevered IRR• 2015: 7.6% cap rate / 12.1% unlevered IRR• YTD 2016: 7.7% cap rate / 8.6% unlevered IRR

21
INVESTMENT STRATEGY

22
Investment Strategy: Underwriting ApproachGranular, asset-by-asset approach, focus on risk-adjusted returns
• Property attributes – Quality of real estate, age, size, fungibility
• Market review – Strategic locations critical to generating revenue
• Demographic analysis – Five-mile population density, household income, unemployment trends
• Valuation – Replacement cost, market rents, initial cash yield, IRR over initial lease term
• Property due diligence – Site visits, vehicle traffic, industry, property type, title, environmental, etc.
REAL ESTATE ANALYSIS
CREDIT ANALYSIS
• Financial review and analysis
• Tenant research – Reliable, sustainable cash flow
• Industry research – Defensive, resilient to macroeconomic volatility
• Discussion with key management representatives
Strong unit-level cash flow coverage (specific to each industry)
Tenants with service, non-discretionary, and/or low pricepoint component to their business
Favorable sales and demographic trends
Significant markets (generally MSAsof ≥350,000 people) and/or mission critical locations
Primarily industrial and distribution properties leased to Fortune 1000, investment-grade rated tenants
Long lease duration
Retail Non-Retail(principally Industrial)

23
Investment Strategy: Key ConsiderationsCost of capital advantage, size, track record: Supports investment selectivity, strong risk-adjusted spreads
Lowest cost of capital among net lease peers• Lower cost of capital supports investment selectivity • Minimizes need for investment volume to drive earnings growth• Realty Income has traded at median NAV premium of 20%+ since
2009
Size and track record
• Ability to buy in “bulk” without creating tenant concentration issues• $1+ billion annualized cash rent
• Portfolios currently trade at discount to single-asset transactions• Certainty of close ($2 billion revolving line of credit)• Track record and relationships developed since 1969
Focus on credit and real estate quality• Rely on more than just credit rating as part of underwriting• IG ratings more important for non-retail than retail properties
• 34% of retail rent from IG-rated tenants• 87% of non-retail rent from IG-rated tenants
• In-house research team independently evaluates tenant creditMarket for quality net lease assets is efficient• Very little relationship “discount” – reputable sellers have
fiduciary responsibility to extract competitive pricing• Higher yields reflect greater investment risk
Other considerations• Rents vs. market, pricing vs. replacement cost, cash flow
coverage volatility, age, size, lease term, operator track record
Competitive Advantages
Investment Approach is Holistic (More than simply the pursuit of investment grade credits)

24
Investment Strategy: Results of Conservative Underwriting
Over 91% of retail portfolio:Has service, non-discretionary and/or low price point component
Top non-retail tenants:Comprised primarily of investment-grade tenants such as FedEx, Boeing, GE, Diageo, Walgreens
CONSUMER RESILIENT
• Dollar Stores
• Wholesale Clubs
• Quick Service Restaurants
E-COMMERCE RESILIENT
• Health & Fitness
• Theaters
• Convenience Stores
DEFENSIVE
• Drug Stores
• Grocery Stores
• Automotive Services
Industry exposure reflects defensive, cycle-resilient business models
Service-Oriented Non-Discretionary Low Price Point

25
Investment Strategy: Disciplined ExecutionConsistent, selective underwriting philosophy on strong sourced volume
2010 2011 2012 2013 (Ex-ARCT) 2014 2015 2016 YTD
Investment Volume $714 mil $1.02 bil $1.16 bil $1.51 bil $1.40 bil $1.26 bil $1.07 bil
# of Properties 186 164 423 459 507 286 236
Initial Avg. Cap Rate 7.9% 7.8% 7.2% 7.1% 7.1% 6.6% 6.4%
Initial Avg. Lease Term (yrs) 15.7 13.4 14.6 14.0 12.8 16.5 15.0
% Investment Grade 46% 40% 64% 65% 66% 46% 51%
% Retail 57% 60% 78% 84% 86% 87% 81%
Sourced Volume $6 bil $13 bil $17 bil $39 bil $24 bil $32 bil $23 bil
Selectivity 12% 8% 7% 4% 6% 4% 5%
Relationship Driven 76% 96% 78% 66% 86% 94% 81%
$8.1 billionin property-level acquisition volume
$3.3 billionin non-investment grade retail acquisitions
78%of volume associated withretail properties
55%of volume leased to investment-grade tenants
Broad blendof one-off, portfolio and entity-level deals
Relationship-driven>80% of closed volume since 2010
Key Metrics Since 2010 (Excluding $3.2 billion ARCT transaction):

26
73%64%
19%
34%
Investment Strategy: ARCT Example (M&A Activity)Cost of capital advantage drives ability to source, fund, close on accretive M&A deals
Historical M&A activity represented both financially accretive and strategic benefits
Wtd. Avg. Lease Term Investment Grade %
ARCT Transaction (2013)Increased Quality
Decreased Concentration Risks
Before Acquisition After Acquisition
SIZE, QUALITY, DIVERSIFICATION
$3.2billion
515properties
75%investment grade
54%retail properties
100%Occupied
12.8 year weighted average
lease term
IMMEDIATE ACCRETION
~5x AFFOmultiple spread
~7-9%AFFO/shaccretion
LeverageNeutral
5.9%initial cash yield
Catalyst of 7.1% dividend increase
11.1 11.4
49%42%
Rental Revenue From Top 10 Industries
Rental Revenue From Top 15 Tenants

27
SIZE, QUALITY, DIVERSIFICATIONImproved portfolio diversification, credit
quality, occupancy, lease term
$503million
84properties
68%investment grade
70%retail properties
100% occupied
STRONG RISK-ADJUSTED RETURNS
Highly accretive Leverage neutral
6.9%initial cash yield
Investment Strategy: Inland Diversified Example (Portfolio Activity)
Portfolio-level acquisition flow supplements“organic” acquisition activity
Large, diversified portfolio offers capacity to absorb co-mingled portfolio opportunities
Inland Diversified was a non-traded REIT seeking a liquidity event in 2H13 – motivation to minimize counter-party risk on single-tenant liquidation accrued to Realty Income’s benefit
In addition to the sale of its single-tenant portfolio to Realty Income, Inland divested its multi-tenant portfolio to Kite Realty
Disciplined growth -- Portfolio acquisitions must be financially accretive and qualitatively additive
Realty Income’s property diversification, cost of capital, and willingness to acquire $250mm+ transactions with diverse property types provides unique growth opportunities in addition to traditional single-asset or retail sale-leaseback pipeline
1Q2014
$274mm (Tranche I)
$383mm
2Q2014
$229mm (Tranche II)
$176mm
Inland Acquisition Volume
Non-Inland Acquisition Volume
Inland Transaction (1H 2014)

28
CAPITAL STRUCTURE AND SCALABILITY

29
Conservative Capital Structure
Common Stock: $17.3 billion – 75%
• Shares/Units outstanding – 259.0 million
Debt: $5.3 billion – 23%
• Unsecured Notes/Bonds - $4.0 billion 1
• Unsecured Term Loans - $320 million• Unsecured Ratings - BBB+/Baa1/BBB+ • Mortgages - $496 million• Revolving Credit Facility - $470 million 1
Preferred Stock: $409 million – 2%
• Series F - 6.625%, Callable Feb 2017
Modest leverage, low cost of capital, ample liquidity provides financial flexibility
Debt 23%
Preferred Stock2%
CommonStock 75%
Total Capitalization: $23.0 billion
1 As of October 12, 2016

30
Well-Laddered Debt Maturity Schedule
Key Metrics 1
•90% fixed rate debt
• Weighted average rate of 4.1% on debt
• Staggered, 6.8-year weighted average term for notes/bonds
• Ample liquidity with ~$1.5B available on revolver (L+90bps)
• Free cash flow of ~$110mm/yr
Limited re-financing and variable interest rate risk throughout debt maturity schedule
5.7%
5.4%
2.1%
4.2%
3.2% 5.7%
3.6%
4.6%
3.9%
5.8%
4.1%
3.9%
$0
$200
$400
$600
$800
$1,000
$1,200
2016 2017 2018 2019 2020 2021 2022 2023 2024 2025 2026 2027+
Unsecured Notes Mortgages Revolver Term Loan
Weighted average interest rate
Laddered Maturity Schedule with Primarily Unsecured Investment-Grade Rated Debt
Debt
Mat
uriti
es ($
mm
)
Weighted average interest rates reflect variable-to-fixed interest rate swaps on term loans
1 As of October 12, 2016

31
5.8%4.9%
G&A as % of Rental Revenue1
$2,211
$7,199Adjusted EBITDA per Employee ($000s)
59 bps22 bps
G&A as % of EV (bps)
Scalability of Costs Contributes to Higher Relative Valuation
• Efficiency and scalability of business model leads net lease industry
• G&A expense should be treated the same as dollar of property-level cash flow
• Consensus NAV estimates generally exclude impact of G&A expenses, thus no explicit “credit” for G&A efficiencies is recognized
• Capping G&A with real estate multiple degrades NAV/sh more for smaller portfolios with less scalability
Relative NAV valuation comparisons should consider G&A efficiencies
Source: FactSet
103 bps29 bps
G&A as % of Equity Mkt Cap
~94% EBITDA margins, never below 90% since 2000
1 G&A includes acquisition transaction costs; percentage of rental revenue calculation excludes tenant reimbursements from denominator YTD figures represent MRQ annualized, where applicable
64 bps39 bps
G&A as % of Gross RE Book Value (bps)

32
DEPENDABLEDIVIDENDS

33
1994 1995 1996 1997 1998 1999 2000 2001 2002 2003 2004 2005 2006 2007 2008 2009 2010 2011 2012 2013 2014 2015 2016YTD
$0.90 $0.93 $0.945 $0.96 $1.02
$1.08 $1.11 $1.14 $1.17 $1.20 $1.32
$1.40
$1.52 $1.64
$1.70 $1.72 $1.73 $1.75 $1.82
$2.19 $2.20
$2.29
$2.424
Consistent Dividends That Grow Over Time Steady dividend track record supported by inherently stable business model, disciplined execution
Strong Dividend Track Record76 consecutive quarterly increases
88 total increases since 1994 NYSE listing
~84% AFFO payout (midpoint of 2016 guidance)
4.6% compound average annualized growth rate since NYSE listing
One of only six REITs included in S&P High Yield Dividend Aristocrats® index
As of October 2016 dividend declarationAnnualized dividend amount reflects the December declared dividend per share annualized, with the exception of 2016, which reflects the October 2016 declared dividend annualized
34
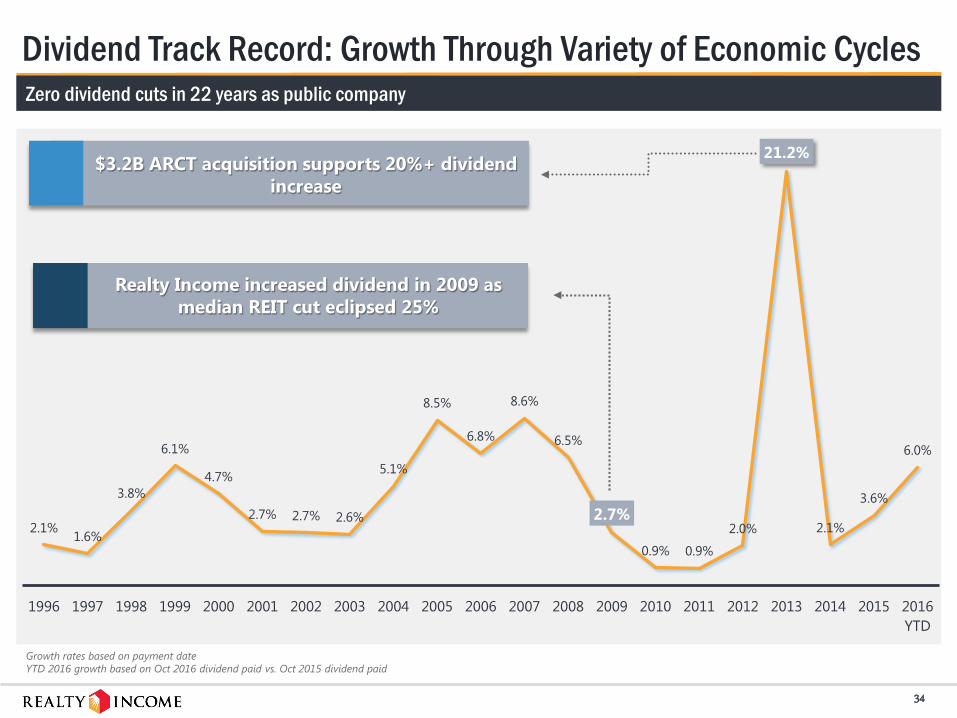
2.1%1.6%
3.8%
6.1%
4.7%
2.7% 2.7% 2.6%
5.1%
8.5%
6.8%
8.6%
6.5%
2.7%
0.9% 0.9%
2.0%
21.2%
2.1%
3.6%
6.0%
1996 1997 1998 1999 2000 2001 2002 2003 2004 2005 2006 2007 2008 2009 2010 2011 2012 2013 2014 2015 2016YTD
Dividend Track Record: Growth Through Variety of Economic CyclesZero dividend cuts in 22 years as public company
$3.2B ARCT acquisition supports 20%+ dividend increase
Realty Income increased dividend in 2009 as median REIT cut eclipsed 25%
Growth rates based on payment dateYTD 2016 growth based on Oct 2016 dividend paid vs. Oct 2015 dividend paid

35
404%374%
277%252%
229% 226%263%
209%169%
136%113%
84% 92%67% 63% 66% 53% 35% 29% 21% 17% 9% 3%
Reflects percentage of original investment made at each corresponding year-end period paid back through dividends (as of 9/30/2016)
Dividend Payback
30.3%28.3%
21.5% 20.3% 19.1% 19.5%23.5%
19.5%16.5%
13.9%12.1%
9.6% 11.2%8.8% 9.0%
10.5% 9.4%7.1% 6.9% 6.0% 6.5% 5.1% 4.7%
Reflects yield on cost as of 9/30/2016 assuming shareholder bought shares at end of each corresponding year
Yield on Cost
The “Magic” of Rising Dividends: Yield on Cost, Dividend PaybackLong-term, yield-oriented investors have been rewarded with consistent income

36
2016
Consistent earnings growth while maintaining conservative leverage metrics
Guidance
Key Assumptions
FFO/sh $2.83 - $2.88(2.2% - 4.0% growth)
AFFO/sh (proxy for cash earnings) $2.87 - $2.89(4.7% - 5.5% growth)
Acquisitions ~$1.5 billion
Dispositions $75 million - $100 million
Occupancy ~98%
Same-store revenue growth ~1.3%
Target capital structure 65% common equity 35% debt & preferred equity
Earnings

37
Summary• Long term-focused business strategy• Diversified and actively managed portfolio• Proven and disciplined relationship-driven acquisition strategy• Conservative capital structure able to withstand economic volatility• Precedent of outperforming S&P 500 and REITs since 1994 listing• Attractive risk/reward vs. other REITs and blue chip equities• Dependable monthly dividends with long track record of growth