realview developer suite v2.1 dsp user guide and...
TRANSCRIPT

RealView Developer Suite v2.1 DSP User Guide and Release Notes
For best results, please read this guide using a web browser, e.g. Windows Internet Explorer. Simply open the readme.html file located at the root of your installation media, e.g. the top level of your CD-ROM.
Contents Obtaining and Installing Your License Installation Information
DSP Debug Support
Connecting to target hardware
DSP debugging resources
DSP Memory Spaces
Processor execution synchronization
About execution synchronization Terms Synchronization and cross-triggering Synchronization, stepping and skid
Synchronization facilities The Synch tab Execution controls Synchronizing processors Cross-triggering controls Working with synchronized processors
Synchronization and cross-triggering behavior
RealView Debugger v1.7 DSP Release Notes
Go to Top

Support Information Obtaining and Installing Your License Before you can use RealView Developer Suite, you must obtain a valid license file using one of the serial numbers supplied in the Welcome Letter. Windows users can choose either a Floating or a Node-Locked serial number. As part of obtaining and installing the license, you will also need the Host ID of the machine that your license for RealView Developer Suite will be installed on. For details of how to find this, see the following FAQ entry: http://www.arm.com/support/faqdev/1380.html
When you have selected which serial number you are going to use and found your Host ID, you can obtain your license directly from our web licensing system at https://license.arm.com/ and, if you have not already registered, follow the instructions for new users to register. Following registration, you may log in, and use your product serial number to generate your license file.
Once you have retrieved your license, follow the instructions from the appropriate FAQ entry:
"How do I install my node locked license?" http://www.arm.com/support/faqdev/1184.html or "How do I install my floating license?" http://www.arm.com/support/faqdev/3898.html For more assistance with the installation of your license, please consult our License Management FAQ within the Technical Support area of the ARM web site at http://www.arm.com/support/licensemanagement.html. If you need additional help with registering or with obtaining your license, please contact us at [email protected] with a detailed description of your problem. Please make sure that you provide your product serial number, plus your ARM web licensing system username and password.

Installation Information This release has been tested on the following list of platforms and service packs.
• Windows 2000 - Service Pack 3 • Windows XP - Service Pack 1a
Installing On Windows Please be aware of the following before starting the installation process:
• You must first install the RealView Developer Suite v2.1 and RealView ICE 1.1 or RealView ICE 1.2 products. You cannot use RealView Developer Suite v2.1 Add-On for DSP Debug with any other version of RealView Developer Suite other than v2.1.
• You must use RealView Developer Suite v2.1 Add-On for DSP Debug only with RealView Developer Suite v2.1 and no later version of RealView Developer Suite.
• The CEVA-Oak, CEVA-TeakLite, CEVA-Teak and LSI Logic ZSP400 debug add-ons for use with RealView ICE or a DSP simulator require no custom installation. The necessary files are in the base RealView RVD Debugger v1.7 DSP installation.
• The RealView LSI Logic ZSP400 debug add-on is qualified to work with the LSI Logic ZSP Software Development Kit (SDK) v5.0.1. The ZSP SDK must be installed on the same machine as RealView Developer Suite v2.1 Add-On for DSP debug in order to use the RealView LSI Logic ZSP400 debug add-on. The ZSP SDK provides shared libraries that are used by the RealView RVD debugger ZSP debug. If the ZSP SDK is not installed and a connection to a ZSP400 target is attempted, error messages will be displayed about missing ZSP libraries.
Note A separate license for the LSI Logic ZSP Software Development Kit is not necessary to use the RealView LSI Logic ZSP400 debug add-on.
The installation of the RealView Developer Suite v2.1 Add-On for DSP Debug consists of two steps: 1) Install RealView RVD Debugger v1.7 DSP.
Open the Setup application on your RealView Developer Suite v2.1 Add-On for DSP Debug CD and follow the directions for a Typical installation. The ARM License Wizard will be launched during the installation and you can then specify your license file or, if you do not yet have your license file, simply cancel the License Wizard.
Note If you were using any custom BCD files with a previous installation of RealView RVD Debugger, please be sure to copy those BCD files from the etc directory of the previous installation into the new RealView RVD Debugger 1.7 DSP installation. For example,
Previous installation path .\RVD\Core\1.7\283\win_32-pentium\etc
New installation path .\RVD\Core\1.7DSP\<build number>\win_32-pentium\etc

2) Install the RVI 1.1.1 firmware on your RealView ICE run control unit.
Following the directions for “Installing an update or patch” in the RealView ICE User Guide please do the following. 1. Check the software version number of the components installed on your RealView ICE unit. 2. If you do not have RVI 1.1.0 build 148 firmware installed on your unit, install RVI 1.1.0 build
148 first. When prompted for the Component File name, choose the file name ARM-RVI-1.1.0-148-base.rvi, which can be found at the root of your RealView Developer Suite v2.1 Add-On for DSP Debug CD.
3. Install the RVI 1.1.1 component file, which can be found at the root of your RealView Developer Suite v2.1 Add-On for DSP Debug CD. The file is named ARM-RVI-1.1.1-175-patch.rvi.

DSP Debug Support
This chapter describes the Digital Signal Processor (DSP) support that is available in the RealView® RVD Debugger and expands on the information provided in Chapter 3 of the RealView RVD Debugger v1.7 Extensions Guide. It contains the following sections:
• About DSPs and RealView RVD Debugger DSP support • Using the DSP
About DSPs and RealView RVD Debugger DSP support RealView RVD Debugger DSP includes support for:
• CEVA-Oak, CEVA-TeakLite, and CEVA-Teak processors from CEVA, Inc. • Motorola M56621 • ZSP400 processor from the ZSP division of LSI Logic • COFF image file format for the CEVA, Inc. toolchain • COFF image file format for the Motorola/Freescale toolchain • ELF/DWARF image file format for the ZSP toolchain • Register definitions for the DSP processors • JTAG debug of DSP processors.
RealView RVD Debugger supports the CEVA, Inc. CEVA-Oak, CEVA-TeakLite, and CEVA-Teak DSPs, and the ZSP ZSP400 DSP. These are processors designed to be integrated into custom or semi-custom silicon designs to provide extra signal processing performance.
You make a connection to a DSP processor, or to a simulated target, using RealView RVD Debugger in exactly the same way as you make a connection to an ARM® processor. If the vehicle you are using supports the processor, it appears in the device list in the Connection Control window. See Using the DSP for more details.
For more information on managing your connections, see the chapter describing connecting to targets in RealView RVD Debugger v1.7 Target Configuration Guide.

Using the DSP The DSP support in RealView RVD Debugger is invoked by connecting the debugger to a suitable processor. This can be a simulated target or target hardware.
This section describes: • Connecting to a simulator • Connecting to target hardware • DSP debugging resources • DSP Memory Spaces
Connecting to a simulator This example uses the MaxSim SoC simulator to model multiprocessor debugging with an ARM920T™ core and a DSP (CEVA-TeakLite), but the procedure for connecting is the same for any simulator.
If you are not licensed to use the multiprocessor facilities provided by RealView RVD Debugger, you can still follow the simulator example but you can only make a single connection.
To access the DSP simulator with RealView RVD Debugger:
1. Start the simulator and configure the processor model as required. 2. Start RealView RVD Debugger to load the application files. 3. Select Target → Connect to Target... to display the Connection Control window. 4. Expand the entry Server Connection Broker to display the available connections, shown below.

5. Connect to the simulated targets by selecting the check box associated with each entry so that it is ticked, shown below.
6. Click the Synch tab to set up processor synchronization if required, shown below.
For more details on using the synchronization facilities in RealView RVD Debugger, see Processor execution synchronization.
7. Select View → New Code Window to open a second Code window (RVDEBUG_1).
8. Click on the drop-down arrow on the Connection button and attach each window: • Attach the default Code window (RVDEBUG) to the simulated ARM core • Attach the second Code window (RVDEBUG_1) to the simulated DSP.
9. Click Target → Load Image... to load an executable file to each of your targets, for example load:
• ...\demo_DSPG\ARM_Oak\ARM_iface\Debug\iface.axf to the ARM core • ...\demo_DSPG\ARM_Oak\Oak_dtmf\Debug\dtmf.a to the DSP.
If you run the custom installation and install OakDSP/TeakLite DSP support, examples images are supplied as part of the base product. By default, these are located in:
install_directory\RVD\Tools\...
10. Click Go to start both processors. 11. See the simulation running by switching between the available windows on your desktop.
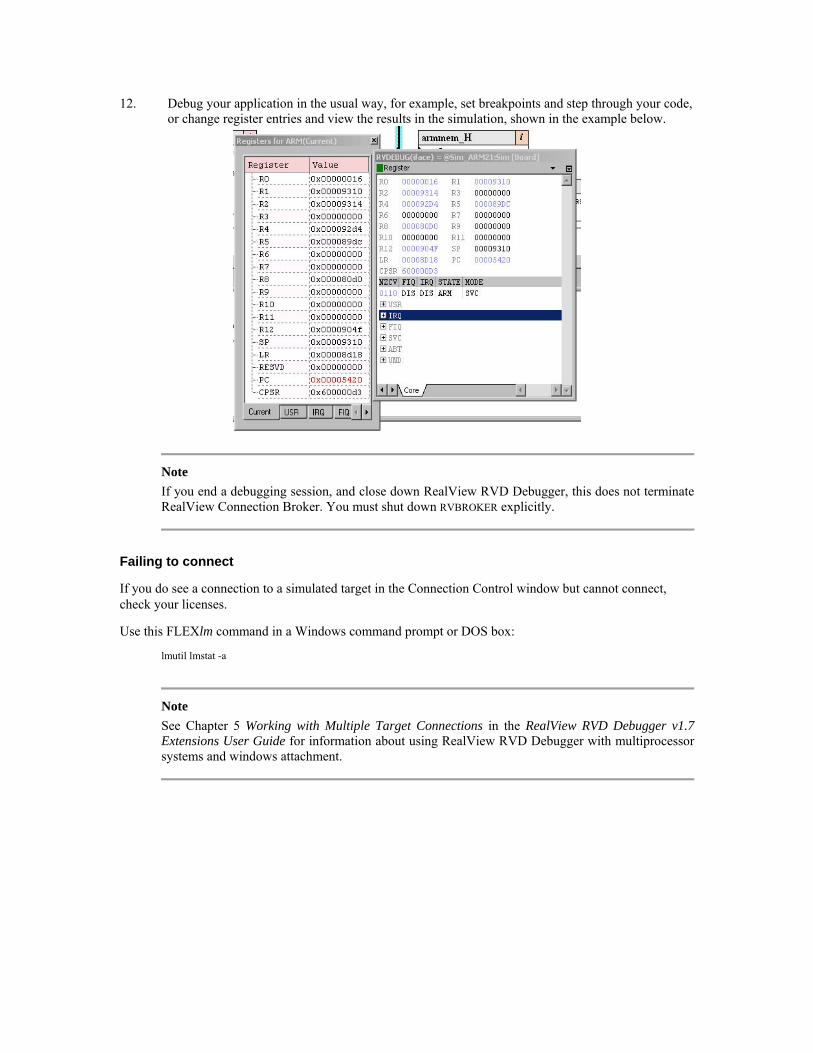
12. Debug your application in the usual way, for example, set breakpoints and step through your code, or change register entries and view the results in the simulation, shown in the example below.
Note If you end a debugging session, and close down RealView RVD Debugger, this does not terminate RealView Connection Broker. You must shut down RVBROKER explicitly.
Failing to connect
If you do see a connection to a simulated target in the Connection Control window but cannot connect, check your licenses.
Use this FLEXlm command in a Windows command prompt or DOS box:
lmutil lmstat -a
Note See Chapter 5 Working with Multiple Target Connections in the RealView RVD Debugger v1.7 Extensions User Guide for information about using RealView RVD Debugger with multiprocessor systems and windows attachment.

Connecting to target hardware You connect to DSP target hardware in the same way as other hardware targets. However, you must use a suitable JTAG interface unit such as ARM RealView ICE.
RealView ICE You can use RealView ICE to connect to a target that incorporates DSP hardware with a suitable JTAG configuration file. For example, suppose that your target contains an ARM core and a DSP core. You can use RealView ICE to connect to the ARM core and the DSP core simultaneously.
For full details on how to configure a connection this way, see Chapter 4 Configuring Custom Connections in RealView RVD Debugger v1.7 Target Configuration Guide.
RealView ICE Cannot Auto Configure with CEVA and ZSP DSPs Due to limitations of the JTAG device ID implementations for many CEVA and ZSP DSPs, auto-configuring a scan chain which contains CEVA or ZSP processors is not possible. The CEVA and ZSP devices must be manually added to the scan chain configuration using the RVConfig dialog.
RealView ICE Device Properties for CEVA and ZSP DSPs There are no Device Properties for the CEVA or ZSP processors that can or need to be configured with the RVConfig dialog.
JTAG Clock Speed Because DSPs typically run at much lower CPU clock speeds than the ARM core, the JTAG clock speed for a multi-core ARM+DSP system may be lower than what an ARM-only system uses. In systems with an RTCK (Returned TCK signal) or a system which needs internal JTAG clock synchronization, the JTAG clock speed over the 20 pin JTAG connection can be set no more than 1/8 of the slowest CPU on the JTAG scan chain in the multi-core system. For example, if the target hardware scan chain contains an ARM running at 150MHz and a DSP running at 40MHz, then the max JTAG clock speed would be 1/8 of 40MHz or 5MHz.
DSP debugging resources This section describes the debugging resources available in the DSP processors, and how RealView RVD Debugger uses those resources.
CEVA-Oak, CEVA-TeakLite, CEVA-Teak This section describes the debugging resources for the CEVA-Oak, CEVA-TeakLite, and CEVA-Teak DSPs.
Debug Monitor Reserved Memory The CEVA DSP debug interface is controlled with the assistance of a debug monitor program when debugging with target hardware. The debug monitor runs in the DSP. In order to keep the debug session alive and working properly, it is essential that the DSP program loaded by the debugger into the DSP does not overwrite the debug monitor. The RealView RVD debugger loads a default monitor into the CEVA program memory when connecting to any of the CEVA processors. Please set the CEVA linker settings to prevent code from being loaded into the debug monitor memory spaces. Please consult the CEVA SDT and SmartNCode guides for further details.
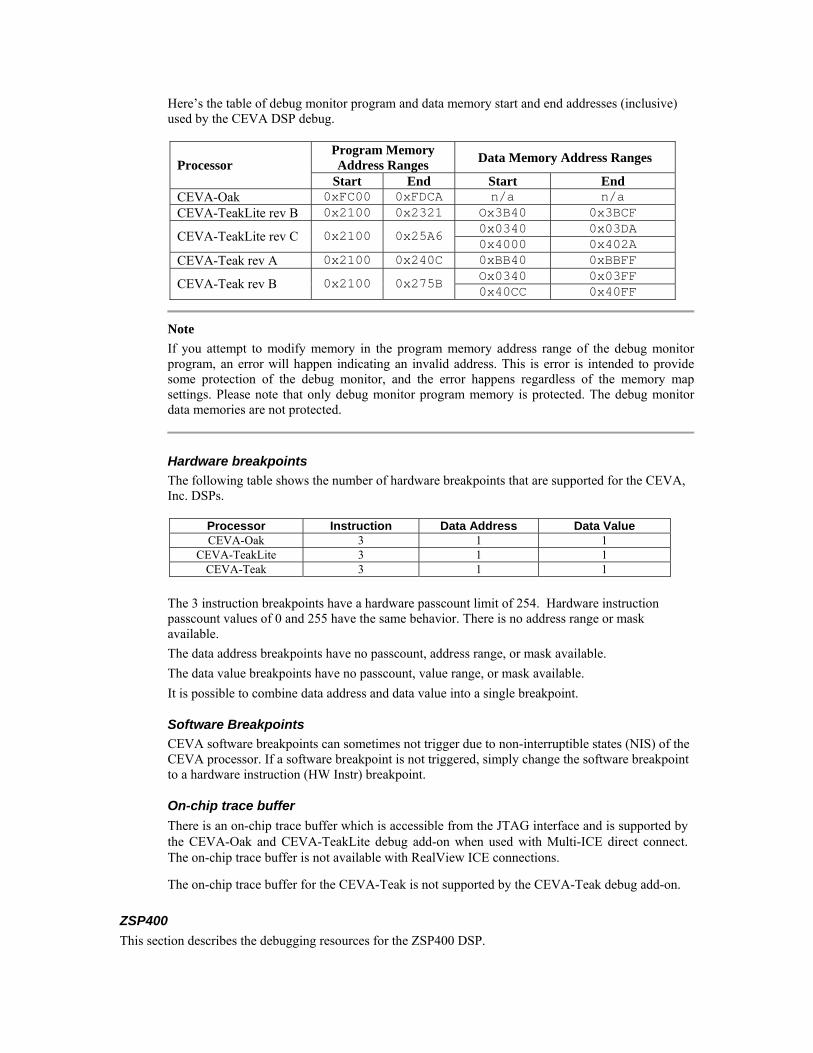
Here’s the table of debug monitor program and data memory start and end addresses (inclusive) used by the CEVA DSP debug.
Program Memory Address Ranges Data Memory Address Ranges Processor
Start End Start End CEVA-Oak 0xFC00 0xFDCA n/a n/a CEVA-TeakLite rev B 0x2100 0x2321 Ox3B40 0x3BCF
0x0340 0x03DA CEVA-TeakLite rev C 0x2100 0x25A6 0x4000 0x402A
CEVA-Teak rev A 0x2100 0x240C 0xBB40 0xBBFF Ox0340 0x03FF CEVA-Teak rev B 0x2100 0x275B 0x40CC 0x40FF
Note If you attempt to modify memory in the program memory address range of the debug monitor program, an error will happen indicating an invalid address. This is error is intended to provide some protection of the debug monitor, and the error happens regardless of the memory map settings. Please note that only debug monitor program memory is protected. The debug monitor data memories are not protected.
Hardware breakpoints The following table shows the number of hardware breakpoints that are supported for the CEVA, Inc. DSPs.
Processor Instruction Data Address Data Value CEVA-Oak 3 1 1
CEVA-TeakLite 3 1 1 CEVA-Teak 3 1 1
The 3 instruction breakpoints have a hardware passcount limit of 254. Hardware instruction passcount values of 0 and 255 have the same behavior. There is no address range or mask available. The data address breakpoints have no passcount, address range, or mask available. The data value breakpoints have no passcount, value range, or mask available. It is possible to combine data address and data value into a single breakpoint.
Software Breakpoints CEVA software breakpoints can sometimes not trigger due to non-interruptible states (NIS) of the CEVA processor. If a software breakpoint is not triggered, simply change the software breakpoint to a hardware instruction (HW Instr) breakpoint.
On-chip trace buffer There is an on-chip trace buffer which is accessible from the JTAG interface and is supported by the CEVA-Oak and CEVA-TeakLite debug add-on when used with Multi-ICE direct connect. The on-chip trace buffer is not available with RealView ICE connections.
The on-chip trace buffer for the CEVA-Teak is not supported by the CEVA-Teak debug add-on.
ZSP400 This section describes the debugging resources for the ZSP400 DSP.

Debug Monitor Reserved Memory The ZSP400 DSP debug interface is controlled with the assistance of a debug monitor program when debugging with target hardware. The debug monitor runs in the DSP. In order to keep the debug session alive and working properly, it is essential that the DSP program loaded by the debugger into the DSP does not overwrite the debug monitor.
The RealView RVD Debugger establishes communication with the ZSP debug monitor when connecting to the ZSP400 processor. The ZSP400 debug monitor is typically running from boot-up code in the ZSP400 target processor and is not loaded into the target by RVD. Please set the ZSP linker settings to prevent code from being loaded into the debug monitor memory spaces. Please consult the LSI Logic ZSP Software Development Kit user guides for further details.
Hardware breakpoints and on-chip trace There are no hardware debug features including breakpoints available with the ZSP400. There are no on-chip trace facilities in the ZSP400.
DSP Memory Spaces Memory spaces are a common feature of DSPs which allow multiple memory busses for instructions and data. The RealView RVD Debugger shows the memory spaces relevant to each processor. Memory spaces are displayed as part of the memory address in all memory display windows.
Memory Space Designator The memory space designator can be used when entering memory addresses. If a designator is not used for a memory address, data memory is usually assumed. The only exception is program memory is assumed for the disassembly command.
The program memory designator is “P:” and the data memory designator is “D:”. For example, to show program memory at address 0x1000, enter P:0x1000 and to show data memory at 0x200, enter D:0x200.
CEVA-Oak, CEVA-TeakLite, CEVA-Teak Memory Spaces The CEVA-Oak and CEVA-TeakLite have up to 64K word program and data memories. The CEVA-Teak program memory space can be as large as 512K words and the CEVA-Teak data memory may be as large as 64K words.
The minimum access size for CEVA memories is a 16 bit word.
In addition to the “D:” data memory designator, CEVA-TeakLite and CEVA-Teak also have “X:”, “Y:”, and “Z:” data memory designators.
The CEVA-Teak program memory addresses always shows five hexadecimal digits in the memory window even if the CEVA-Teak program address space are only configured for 16 bits.
ZSP400 Memory Spaces The ZSP400 has up to 64K word program and data memories.
The minimum access size for ZSP400 memories is a 16 bit word.

Processor execution synchronization
When you have multiple processors that are cooperating within a single application, it is sometimes useful to be able to start all processors or to stop all processors with a single debugger command. RealView RVD Debugger includes facilities for cross triggering and synchronizing processors:
• Start execution • Stop execution • Single-stepping.
This section describes how you can do this and what limitations exist:
• About execution synchronization • Synchronization facilities • Synchronization and cross-triggering behavior.
About execution synchronization When several processors are operating as part of a system, you might want to examine the state of all processors at one point. RealView RVD Debugger does not synchronize processor activity unless it is told to do so. A processor only stops because you told the debugger to stop it, or because it triggered a breakpoint, or because the target operating environment stopped it. This section describes:
• Terms • Synchronization and cross-triggering • Synchronization, stepping and skid.
Terms The following terms are used in this section:
Processor group Within this section, the term processor group is used to refer to the set of processors that are configured to operate in a synchronized way.
Skid For a processor group, skid is the time delay between the first processor stopping and the last processor stopping. A processor group skids if one processor stops earlier than one or more of the others. This can result from differences in the way the processors are connected, different processor architectures, different instructions being executed, or because the debugger cannot issue the stop request concurrently.

Figure 1 shows three processors stopping in response to an external event, such as clicking a stop button.
Figure 1 User Halt Stopping Skid
Skid means that, although stopping the processors is synchronized, they never stop at the same time. Table 1 shows typical values for the example shown above.
In any multiprocessor system, the communication protocols between the processors must allow for differences in execution speed, and so this type of skid is not normally a problem.
Table 1 Key of delay times for a user halt
Name Duration Description
t1 1ms approx Time for the debugger to process the user request.
t2 1ns...10ms approx Time for the interface hardware to action the request, either in parallel or in sequence. The speed depends on whether this is performed using hardware or software.
t3 1...10 clocks Time for the processor to stop (normally, time for processor to reach next instruction boundary).
Loose synchronization
In both hardware and software environments, RealView RVD Debugger can synchronize processors loosely. This is characterized by a large skid, of as much as several seconds (many million instructions), because of the way the debugger is connected to the processors. A large skid might also arise because there is no hardware synchronization control, so the debugger must issue stop commands manually.
Tight synchronization In a hardware environment, RealView RVD Debugger uses a closely synchronized system where this is supported by the underlying processor or emulator. This has a very short skid, usually a few microseconds or less, and perhaps only a single instruction.
Cross-triggering Cross-triggering occurs when one processor in a group stops because of an internal or an external event, and this then causes other processors to stop. Cross-triggering differs from synchronization: • Cross-triggering means that, if CPU1 hits an undefined instruction or triggers a

breakpoint that causes it to stop, CPU0 and CPU2 also stop as a result. • Synchronization means that clicking the Stop button causes this action to be applied
to all processors in the processor group.
See Synchronization and cross-triggering for more details. The processor that initiated the stop, stops almost immediately, but others can take longer. If there is cross-triggering hardware on the target, a sequence similar to Figure 2 occurs.
Figure 2 Breakpoint stopping skid using hardware synchronization
The initial stop activates an external signal on the processor, for example DBGACK, that causes the cross-triggering hardware to generate an input signal to the other processors, for example CPU0 stop, that stops the processors. Each of these other processors skids as it stops, as for a single processor system.
For a target system that does not have hardware cross-triggering, the debugger can perform a similar function in software. However, the processes involved are more complex, and the skid time is much longer. For example, hardware cross-triggering might be able to stop all processors five target instructions after the initial breakpoint. A software solution might take a million target instructions.
The sequence required for software cross-triggering is shown in Figure 3.
Figure 3 Breakpoint stopping skid using software synchronization

The delays involved in this sequence are explained in Table 2. The figures for duration are for general guidance only.
Table 2 Key of delay times for software cross-trigger
Name Duration Description
t1 0...3 instructions Time for breakpoint to stop processor
t2 25...100ms approx Time for debugger to notice processor stopped
t3 50ns approx Time for debugger to react to CPU1 stopping
t4 50ns approx Time to work out that a cross-triggering event occurred and which group of processors must be stopped
t5 1...1000ms approx Time for debugger to use the target debug interface to request the processors to stop, either in parallel or in sequence
t6 1..10 instructions Time for processor to stop (normally, time for processor to reach next instruction boundary)
Synchronization and cross-triggering Synchronization applies equally to starting processor groups and stopping them, although starting a processor is easier to arrange and faster to do.
Having a target with closely synchronized processors and a short skid enables you to stop the system and be fairly sure that the overall state is as consistent as it was when you requested the stop. For a loosely synchronized system, whether the overall state is consistent when it has stopped is more dependent on the software and hardware architecture.
The actual length of skid varies and depends on many conditions. For example:
• If the stop request happens because one of the processors cross-triggers another, then the breakpointed processor has already stopped, but the debugger might not have registered that it must stop the other processors. This form of skid can be reduced by linking the processors together directly in hardware, so that one processor hitting a breakpoint stops other processors without debugger intervention.
• If one or more processors are controlled using debug monitor software, then the skid of that processor depends on whether the current task is interruptible or not.
• If one or more processors in the group share a memory bus, for example with a DMA controller, then another bus master can claim the bus and prevent the processor completing an instruction, so preventing it entering debug state.
• If the debugger must issue separate stop requests to each processor, then the host operating system might deschedule the debugger task between two of the stop requests and so introduce a significant extra delay.
It is normal that a multithreaded application is designed to be tolerant of differing execution speeds and differing execution orders for each of the constituent processes. In this case, communication attempts between processors are guarded to ensure data consistency. This is particularly true when the processors in a group run at differing clock speeds or using differing memory subsystems.
If communication guarding is not done, normal perturbations in the execution order might cause the application to fail. In communication systems that do not include very short communication timeouts, it is often possible to stop only one processor in a group. The other processors come to a halt through lack of, or excess of, data. Alternatively, you can let them continue to write to intentionally-overwriting communication buffers while you work.
Note When working with a processor group, RealView RVD Debugger warns you if the synchronization of the processors is loosely coupled by displaying the message: Synchronization will be loose (intrusive) for some or all connections in the synch group.
Synchronization, stepping and skid Synchronization applies equally to stepping processor groups, stopping them, and starting them. Having a target with closely synchronized processors enables you to step through the code to examine, for example, memory or registers on different processors.
Be aware, however, skid means that synchronized stepping might not behave in a predictable, or expected, way. Even where the code on the processors is identical, stepping moves to different locations on each core. If you are stepping at the disassembly level, RealView RVD Debugger executes a single instruction and so, with short skid, the processors are more closely synchronized, However, stepping behavior is still unpredictable. Even where the processors are synchronized in hardware, there is a discrepancy of a few instructions. When synchronized stepping at the assembler or source level, a temporary breakpoint is used. Therefore, only one instruction is run at a time on each processor.
Synchronized stepping is also affected if the clock speeds of the processors are different. At best, RealView RVD Debugger can only be accurate to within a single instruction, and not within CPU cycles.
Synchronization facilities The synchronization facilities of RealView RVD Debugger are accessed using the Synch tab on the Connection Control window. For full details see:
• The Synch tab • Execution controls • Synchronizing processors • Cross-triggering controls • Working with synchronized processors.
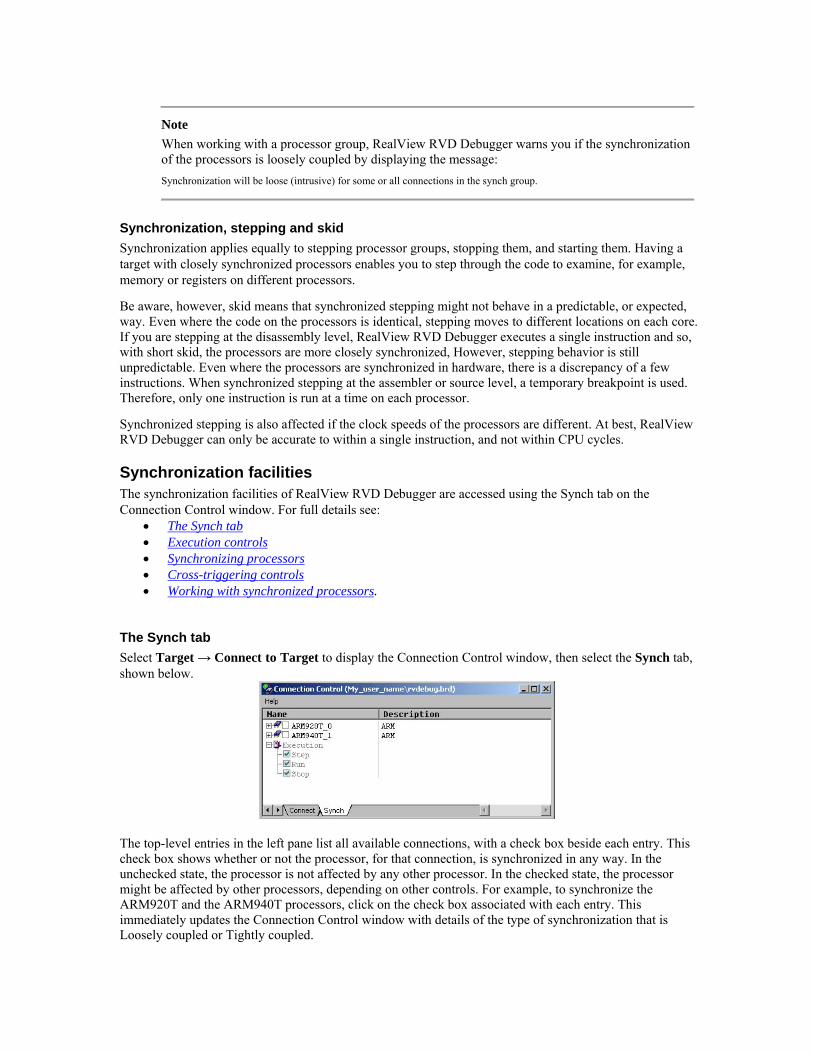
The Synch tab Select Target → Connect to Target to display the Connection Control window, then select the Synch tab, shown below.
The top-level entries in the left pane list all available connections, with a check box beside each entry. This check box shows whether or not the processor, for that connection, is synchronized in any way. In the unchecked state, the processor is not affected by any other processor. In the checked state, the processor might be affected by other processors, depending on other controls. For example, to synchronize the ARM920T and the ARM940T processors, click on the check box associated with each entry. This immediately updates the Connection Control window with details of the type of synchronization that is Loosely coupled or Tightly coupled.

Execution controls Beneath the processor connection entries, the Execution controls define which operations are synchronized. On first opening the window, these are all checked by default. Execution controls can be set singly or in combination:
Step The processor group is synchronized on step instructions, that is single stepping one processor also steps all other processors in the group.
Note See Synchronization, stepping and skid for more details on using this
control.
Run The processor group is synchronized on run instructions, that is starting one processor also runs all other processors in the group.
Stop The processor group is synchronized on stop instructions, that is stopping one processor also stops all other processors in the group.
For example, if you want to stop and start your processors together, but are content to single-step each processor individually, you would check Stop and Run but not Step.
Synchronizing processors Figure 4 shows an example Connection Control window with a group of two synchronized processors and their controls. Click the check box associated with each entry to synchronize the group on step, run, and stop instructions, that is all the processors start together and each processor stops all the others if it hits a breakpoint. Also, if you click the Stop button all the processors stop.
Note See Synchronization, stepping and skid for more details on synchronizing a processor group on step instructions.
Figure 4 Connection Control window Synch tab showing synchronized processors
Here, the processor group is synchronized on run instructions only, that is all processors in the processor group start together when any one processor is started by a run instruction or the Run button. All the processors start together, but if you click the Stop button only one processor stops.
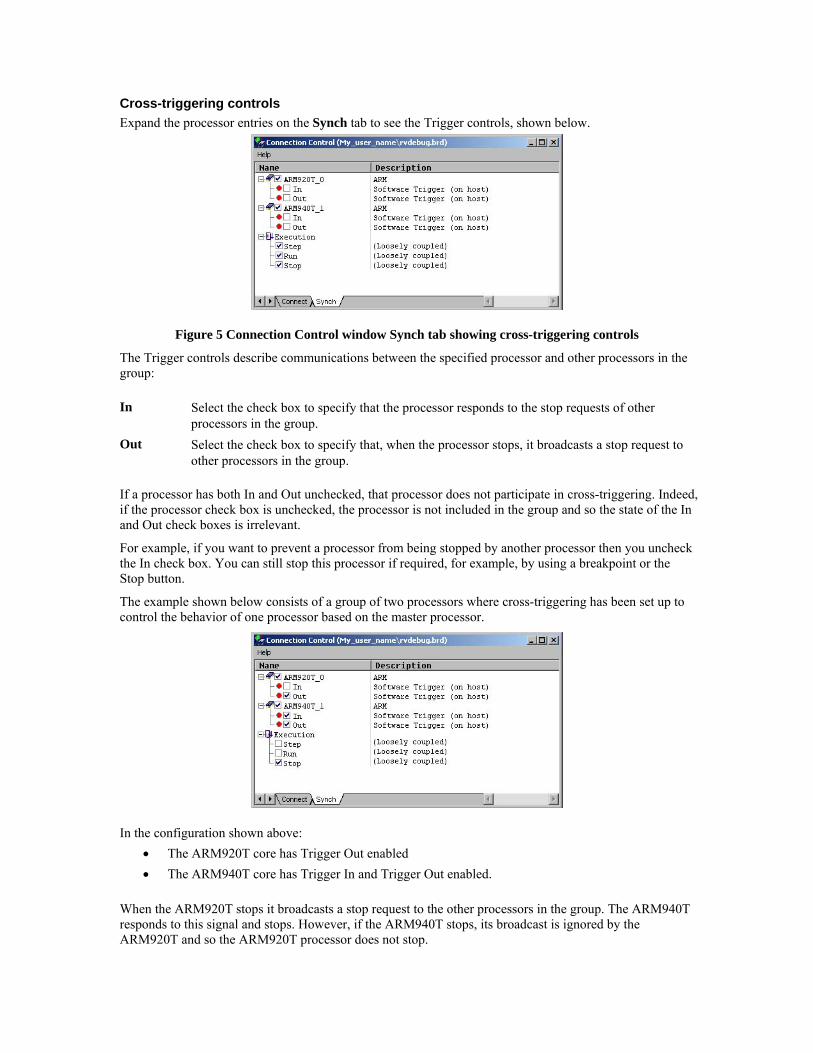
Cross-triggering controls Expand the processor entries on the Synch tab to see the Trigger controls, shown below.
Figure 5 Connection Control window Synch tab showing cross-triggering controls
The Trigger controls describe communications between the specified processor and other processors in the group:
In Select the check box to specify that the processor responds to the stop requests of other processors in the group.
Out Select the check box to specify that, when the processor stops, it broadcasts a stop request to other processors in the group.
If a processor has both In and Out unchecked, that processor does not participate in cross-triggering. Indeed, if the processor check box is unchecked, the processor is not included in the group and so the state of the In and Out check boxes is irrelevant.
For example, if you want to prevent a processor from being stopped by another processor then you uncheck the In check box. You can still stop this processor if required, for example, by using a breakpoint or the Stop button.
The example shown below consists of a group of two processors where cross-triggering has been set up to control the behavior of one processor based on the master processor.
In the configuration shown above: • The ARM920T core has Trigger Out enabled • The ARM940T core has Trigger In and Trigger Out enabled.
When the ARM920T stops it broadcasts a stop request to the other processors in the group. The ARM940T responds to this signal and stops. However, if the ARM940T stops, its broadcast is ignored by the ARM920T and so the ARM920T processor does not stop.

With this system of controlling synchronization you can create both master-slave and peer-to-peer synchronization groups. However, you cannot create multiple independent processor groups, that is where two sets of processors are synchronized within the group but not between the two groups.
Working with synchronized processors With the processor group controls set in the Synch tab, you can use a single, unattached Code window to view the connections, or set up multiple Code windows, and begin the debugging session.
If you are using multiple Code windows, it is recommended that you make one of the synchronized processors the current connection and that you attach a Code window to this connection as the first-choice window for displaying debugger messages.
Remember the following when working with synchronized processors:
• There is no difference in behavior when hardware cross-triggering or synchronization is available, although there is a large reduction in skid.
• There is no difference in behavior between simulators and other hard targets (boards) although a suitable bridging product is required to synchronize simulators.
Synchronization and cross-triggering behavior If you are running images on multiple processors that are synchronized, any actions performed on one image might affect the running state of the images on the other processors. The running state depends on:
• How you have set up synchronization and cross-triggering for the different processors (see Behavior of synchronized processors)
• Whether an RTOS image is running on the current connection. See o Synchronization behavior when running an RTOS image o Controlling connections running in RSD mode.
The processors that are synchronized are collectively referred to as a processor group.
Behavior of synchronized processors The behavior of synchronized processors depends on the synchronization and cross-triggering settings you have applied to each processor.
Setting synchronization Synchronization enables you to synchronize the following operations across processors: • Step • Run • Stop
To apply these synchronization operations to the processors in the processor group, use the SYNCHEXEC command described in RealView RVD Debugger v1.7 Command Line Reference Guide. For example, to synchronize processors on connections 6 and 7 on run and stop, enter the command:
synchexec,run,stop 6,7
Setting cross-triggering Cross-triggering enables you to define how one processor communicates with other processors. A processor can: • Initiate a stop request (Output triggering) • Respond to a stop request (Input triggering).

To apply cross-triggering to the processors in the processor group, use the XTRIGGER command described in RealView RVD Debugger v1.7 Command Line Reference Guide. For example, you might have processors on connections 6, 7, and 8. The processor on connection 6 is to initiate a stop request, and the processors on connections 7 and 8 are to respond to stop requests. In this case, enter the commands:
synchexec,run,stop 6,7,8 xtrigger,out_enable 6 xtrigger,in_enable 7,8
Note When using hardware cross triggering and synchronized start be aware that each processor will begin execution at its own speed. A hardware cross trigger may appear to not trigger if the trigger is generated by a processor which starts much quicker than other processors in the processor group.
Synchronization behavior when running an RTOS image If you are running multiple images, and an RTOS image is running on the current connection, the behavior of the HALT, GO and STOP commands can affect the running state of your other images. The behavior depends on whether or not the connections are configured to run and stop synchronously, and whether or not Running System Debug (RSD) is active on one or more of the connections. Connections that are not configured to be synchronous must be started and stopped independently.
Synchronization setup The descriptions in the following sections assume that synchronization is configured as: • Processors synchronized, without cross-triggering • Run and stop operations enabled, step operation disabled.
RSD is active on the current connection This section assumes you have configured synchronization as described in Synchronization setup. If RSD is active on the current connection:
• Entering the HALT command halts a thread in the current image but has no effect on the images of other connections.
• Entering the GO command starts a thread in the current image but has no effect on the images of other connections.
• Entering the STOP command affects the other connections. For the current connection, and any other connections that are running in RSD mode, the action depends on the System_Stop setting in the Connection Properties of those connections. This setting enables you to control what happens to the RSD connections. See Controlling connections running in RSD mode for details.

RSD is not active on the current connection This section assumes you have configured synchronization as described in Synchronization setup. If RSD is not active on the current connection:
• Entering the HALT command stops the processor running on the current connection, and affects the other connections. However, the effect depends on the System_Stop setting in the Connection Properties of any connection that is running in RSD mode. This setting enables you to control what happens to the RSD connections. See Controlling connections running in RSD mode for details.
• Entering the GO command starts the processors on all connections. • Entering the STOP command stops the processor running on the current connection, and
affects the other connections. However, the effect depends on the System_Stop setting in the Connection Properties of any connection that is running in RSD mode. This setting enables you to control what happens to the RSD connections. See Controlling connections running in RSD mode for details.
Controlling connections running in RSD mode You can use the System_Stop setting in Connection Properties to control what happens when a stop request is received on a connection running in RSD mode: Never The processor never stops, and the request is ignored. Don’t prompt The processor stops. Prompt The following prompt is displayed:
The operation will stop the processor! You will fall back into HSD mode! Are you sure you want to proceed? If you answer:
Yes This causes the processor on the connection to drop back into Halted System Debug (HSD) mode, and the processor on that connection stops running.
No This causes the processor on the connection to remain running.
Note When a successful stop is issued, RSD mode is not active any more.

Processor state after a STOP command The following table summarizes what happens when you enter a STOP command on a connection that is part of a processor group containing three processors. For clarity, the processors are identified in the table as HSD, RSD 1, and RSD 2, to show the RTOS debugging mode for each processor. The bold text in parentheses is the user response to the prompt.
Note These actions also occur if you enter the HALT command on the HSD-mode connection.
System_Stop setting Processor state after a STOP command
RSD 1 RSD 2 HSD RSD 1 RSD 2
Prompt (Yes) Prompt (No) stopped stopped running
Prompt (No) Prompt (No) stopped running running
Prompt (Yes) Prompt (Yes) stopped stopped stopped
Never Don’t_Prompt stopped running stopped
Never Prompt (Yes) stopped running stopped
Never Prompt (No) stopped running running
Never Never stopped running running
Don’t_Prompt Don’t_Prompt stopped stopped stopped

RealView Debugger v1.7 DSP Release Notes
1. ZSP DSP Debug User Notes 1.1. ZSP400 Technology Transfer Packages
ZSP400 debug support is intended to support all released ZSP400 Technology Transfer Packages (TTP).
1.2. Variables on frame pointer not recognized on ZSP400
In several, but not all, cases, variables on the frame pointer are not being recognized in the ZSP code window. This will be fixed in a future release.
2. CEVA DSP Debug User Notes 2.1. CEVA-Teak Memory Map
Due to restrictions accessing the MMIO registers in the CEVA-Teak, the automatically generated memory map for the CEVA-Teak processor is not accurate. There are two ways to work around this limitation.
2.1.1. Define a Custom CEVA-Teak Memory Map
Create a custom target debugger configuration (a .bcd file) for the Program and Data memories of your CEVA-Teak target. Follow the directions in the RealView RVD Debugger Target Configuration Guide and define the Memory_Block in a CEVA-Teak Advanced_Information block.
For example, the following are screenshots of the BCD definitions for the CEVA-Teak core module.


2.1.2. Disable memory mapping for the CEVA-Teak connection
Use the “mmap, disable” command to disable the CEVA-Teak memory map. The “mmap,disable” can be added to the Connection Properties->Advanced Information->CEVA-Teak->Commands list so that the CEVA-Teak memory map is disabled each time connecting to the CEVA-Teak.
2.2. CEVA-Teak Function Prototype argument list
The CEVA-Teak function prototypes displayed in RealView RVD Debugger using the printtype command will not show function arguments. This is due to limitations of the COFF debug information for CEVA-Teak. This is not a limitation with CEVA-TeakLite function prototypes.
2.3. CEVA-Teak call stack does not work for Teak program memory above 64K
If the CEVA-Teak call stack contains function addresses higher than the 64K word (0x10000 – 0x3FFFF), they will not be displayed properly in the call stack. An improper call stack will make high level step out a function and the command “go @ <stack level>” fail. This is only a limitation for CEVA-Teak implementations which use CEVA-Teak 18 bit program memory addresses. This will be fixed in a future release.
3. Known Issues with Multi-Core Debug 3.1. Software Cross trigger on some host systems may miss triggers
During testing of RealView RVD Debugger it was found that software cross triggering would not work reliably on some Windows XP systems. The symptom of the problem is that the triggered processors would stop and then immediately resume running. After being triggered and continuing to run, the triggered processor could not be stopped under debugger control. This problem only happens with software cross triggering and does not happen when hardware cross triggering is in use. Given the long skid time associated with software cross triggering, please use breakpoints on both processors as a workaround if you experience this problem. This will be fixed in an upcoming release.
3.2. Misleading error message regarding ARM line number information
A fix for stepping inlined ARM source code has the side effect of the following error message, which is displayed once after loading an ARM image and executing a debugger command which uses line number information.
Error: Unable to load line number information in module XXX
where XXX is the name of the module. This error message is misleading and there are no restrictions on the ARM line number information. A future release of RealView RVD Debugger will correct this minor defect.
3.3. Step instruction with value
There are two known issues with using a value with the step commands stepoinstr and stepinstr. See the RVD Command Line Reference Guide for details on the step instruction command syntax. A future release of RealView RVD Debugger will correct these defects.
3.3.1. Stepoi value
The stepoi command with a value will terminate after stepping over a function. For example if the first instruction to be executed using stepoi is a function call, then no more instructions will be stepped after the function returns. This case behaves the same as stepoi without a value or a value of 1.
3.3.2. Step with value and synchronized stepping
The step, stepo, and stepi commands with a value will behave inconsistently when running with Step synchronization turned on. Each processor will not end up in the correct location as if the step command with a value were run without step synchronization.
4. Known Issues with CEVA DSP Debug
4.1. Setting More than One CEVA Data Breakpoint
There is one CEVA hardware Data Address and one CEVA hardware Data Value breakpoint. If more than one Data Address or Value breakpoint is set, the RealView RVD Debugger will incorrectly create a hardware Instruction breakpoint rather than reporting a limit of one Data Address or one Data Value breakpoint. The RealView RVD Debugger properly reports a warning about a lack of hardware resource when attempting to create more than five hardware breakpoints for a CEVA processor. This will be fixed in a future release.

4.2. CEVA Hardware Instruction Breakpoint Passcount Limit
The CEVA OCEM passcount is an 8 bit value providing a hardware instruction passcount limit of 1-254. Passcount values of 0 and 255 result in an effective passcount of zero. The RealView RVD Debugger passcount dialog accessed from the Breakpoint dialog will allow the passcount to be set to any number, and only the lower 8 bits of the number are used.
4.3. CEVA-Teak Hardware Instruction Breakpoint and Disconnect
Any CEVA-Teak hardware instruction breakpoints that are cleared immediately before disconnecting the debugger will remain active due to an artifact of the debug monitor running on the CEVA core. The workaround is simple. After clearing a CEVA-Teak hardware instruction breakpoint, single step or run the CEVA-Teak before disconnecting the debugger.
4.4. CEVA-Teak Hardware Instruction Breakpoint followed by Single Step
Stepping at high level from a hardware breakpoint while the breakpoint is enabled will result in some inconsistent behavior. High level step sometimes only does a single instruction step. At a call statement a high level step will not step into the function until the step is executed again. At a simple assignment statement, the high level step will appear not to move to the next line function until the step is executed again. Simply repeating the step function works the second time.
5. Other Known Issues
5.1. Overlapping module errors when loading ARM images created by gcc
You may experience an error message when loading ARM images created by gcc tools regarding overlapping modules. The following is an example message, which appears after the image load completes.
Error: Module UNNAMED_2 section 0x1031251 overlaps another.
This message could indicate only a warning or could be a real error that code was loaded into the same address region for more than one module. Most, but not all, of the overlapping modules errors will be fixed in an upcoming release. Some messages will still remain, for example the use of exceptions in gcc images will still produce overlapping error message, as these all map different code into the same address and therefore generates overlapping module messages.

5.2. Downloading “raw” binary file into memory
In order to assume that all bytes of a raw binary are loaded, be sure to specify readfile,rawb in the command or use rawb for the type of file in the Upload/Download file from/to Memory dialog.
Go to Top