reardon massachusetts housing institute
TRANSCRIPT

We’re Not as Young as We Used to Be
Tim Reardon
Metropolitan Area Planning Council
Massachusetts Housing Institute
June 14, 2016
And other less self-evident
Observations and Projections
of Demographics and Housing
in Metro Boston

Housing demand:
Population growth is only
half the equation (or less)

Mary’s Household
2000 - 2040
2000,
age 45
2020,
age 65
2040,
age 85
2010,
age 55

3.22
2.84
2.69
2.532.50
2.38
2.31
2.282.20
2.30
2.40
2.50
2.60
2.70
2.80
2.90
3.00
3.10
3.20
3.30
1970 1980 1990 2000 2010 2020 2030 2040
Avera
ge N
um
ber
of
Peop
le p
er
Hou
sehold
Average Household Size, Metro Boston, 1970 - 2040
1990 - 2010 Status Quo Projections
10% drop
projected
2010 - 2040
23% decline
since 1970
Source: Decennial Census,
MAPC Population Projections 2014www.mapc.org/projections

Same number of residents form more
households, need more housing units
2010
2040
250 people =
250 people =

Dozens of communities may see
housing growth + population decline

Housing production is a
prerequisite to long-term
economic growth in Massachusetts

-
50,000
100,000
150,000
200,000
250,000
300,000
350,000
15 -19
20 -24
25 -29
30 -34
35 -39
40 -44
45 -49
50 -54
55 -59
60 -64
65 -69
70 -74
75 -79
80 -84
85plus
Age
2040, Status Quo
Baby Boomers
comprise 49% of
MA labor force
1.4 million workers
born before 1970
will retire by 2030
(39% of labor force)
State is not producing
or importing enough
young workers to fill
vacant positions
-
50,000
100,000
150,000
200,000
250,000
300,000
350,000
2010
In Labor Force Not In Labor Force
-
50,000
100,000
150,000
200,000
250,000
300,000
350,000
2020, Status Quo
Baby
Boomers
Baby
Boomers
Baby
Boomers
Source: MAPC Population Projections 2014

A Stronger Region is Possible
Continued
outmigration
=
no labor force
growth2,543,000
2,509,000
2,526,000
2,400,000
2,450,000
2,500,000
2,550,000
2,600,000
2,650,000
2,700,000
2,750,000
2010 2020 2030 2040
Population in the Labor Force, Metro Boston, 2010 - 2040,
Status Quo vs. Stronger Region
Status Quo
2,543,000
2,509,000
2,526,000
2,515,500
2,616,000
2,643,000
2,690,000
2,400,000
2,450,000
2,500,000
2,550,000
2,600,000
2,650,000
2,700,000
2,750,000
2010 2020 2030 2040
Population in the Labor Force, Metro Boston, 2010 - 2040,
Status Quo vs. Stronger Region
Status Quo
Stronger Region
Net in-migration of
10,000 per year
=
+175,000 workers
by 2040
(7% increase)

Long-term economic growth requires 435,000 new units in Metro Boston,
~500,000 units statewide, by 2040
139,000 155,000
11,000 6,000
53,000
91,000
95,000
178,000
-
50,000
100,000
150,000
200,000
250,000
300,000
350,000
400,000
450,000
Status Quo Stronger Region
Total Net Housing Demand, by Type, Metro Boston, 2010 - 2040
Multi-Family -Rent
Multi-Family -Own
Single Family -Rent
Single Family -Own
Source: MAPC Population Projections, 2014

Baby Boomers will supply more
housing than they demand

Baby Boomers are occupying as many
housing units as they ever will
318,000 383,000 352,000
282,000
165,000
95,000
120,000 132,000
117,000
73,000
140,000
171,000 166,000
170,000
130,000
-
100,000
200,000
300,000
400,000
500,000
600,000
700,000
800,000
2000 2010 2020 2030 2040
Hou
sing U
nit D
em
and
Baby Boomer (1946 - 1965) Housing Demand, Metro Boston, 2010 - 2040, Stronger Region Scenario
Multifamily Rent
Multifamily Own
Single FamilyRent
Single FamilyOwn
Source: 2000 Census ,
2006 – 2010 American Community Survey,
MAPC Population Projections 2014
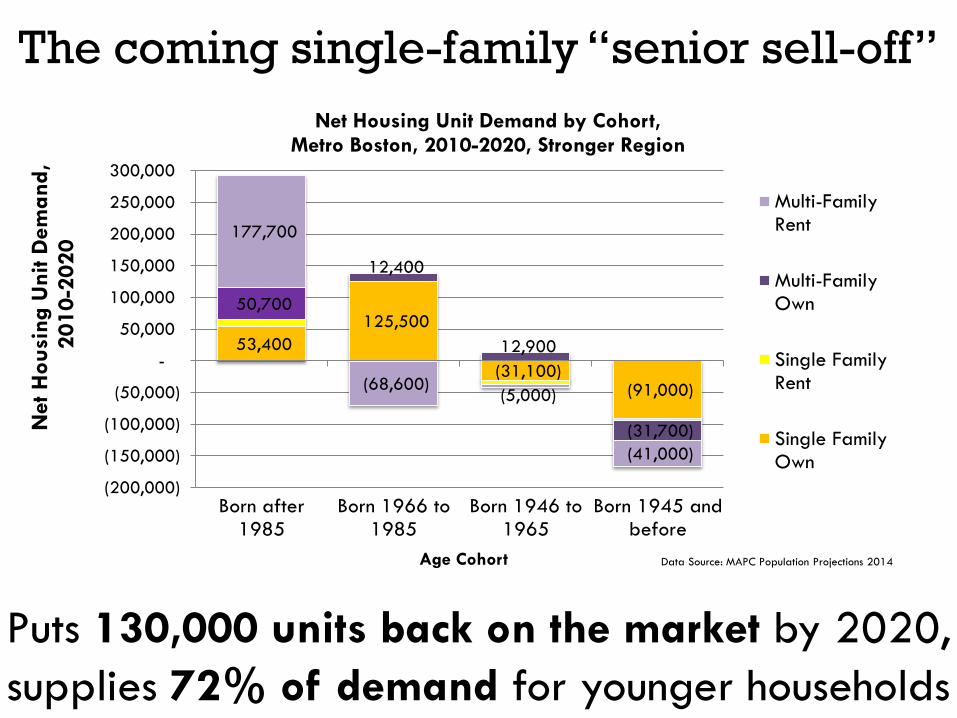
The coming single-family “senior sell-off”
53,400
125,500
(31,100)(91,000)
50,700
12,400
12,900
(31,700)
177,700
(68,600)(5,000)
(41,000)
(200,000)
(150,000)
(100,000)
(50,000)
-
50,000
100,000
150,000
200,000
250,000
300,000
Born after1985
Born 1966 to1985
Born 1946 to1965
Born 1945 andbefore
Net H
ou
sing U
nit D
em
and
,2
01
0-2
02
0
Age Cohort
Net Housing Unit Demand by Cohort, Metro Boston, 2010-2020, Stronger Region
Multi-FamilyRent
Multi-FamilyOwn
Single FamilyRent
Single FamilyOwn
Data Source: MAPC Population Projections 2014
Puts 130,000 units back on the market by 2020,
supplies 72% of demand for younger households

Tastes Are Changing,
Or Are They?

Multifamily occupancy increased for all age groups
Steepest increases among Millennials and Baby BoomersSource: 2006 – 2010 American Community Survey, 2000 Census
Multifamily Occupancy is Growing
0.2%
7.0%
4.5%
0.8%
2.4% 2.5%
3.8%
0.8% 0.7%
0%
1%
2%
3%
4%
5%
6%
7%
8%
15-24 25-34 35-44 45-54 55-59 60-64 65-69 70-74 75 plus
Ch
an
ge in
Perc
en
t o
f H
ou
seh
old
s in
Multif
am
ily H
ou
sing
Age of Householder
Change in Multifamily Occupancy Rates, 2000 to 2010, Metro Boston

An Urban Resurgence is Underway
-80,000
-60,000
-40,000
-20,000
0
20,000
40,000
60,000
80,000
100,000
0 -4
5 -9
10 -14
15 -19
20 -24
25 -29
30 -34
35 -39
40 -44
45 -49
50 -54
55 -59
60 -64
65 -69
70 -74
75 -79
80 -84
85plus
Net M
igra
nts
in
/(ou
t) in
Pre
vio
us
Deca
de
Age at End of Decade
Net Migration by Age, 1990s and 2000s, Inner Core and Regional Urban Centers
1990 - 2000
2000 - 2010
Source: U.S. Census, MassCHIP, MAPC Analysis
Urban municipalities attracted/retained 30,000
additional residents as compared to the 1990s

A New Lanscape of Housing Demand
Metro Boston will need 435,000 new units by 2040
Most housing demand will be in urban communities
Two-thirds of demand will be for multifamily
21%42%
60% 64%
24%21%
18%
16%
55%
38% 23%
18%
-
20,000
40,000
60,000
80,000
100,000
120,000
Inner Core Regional UrbanCenters
MaturingSuburbs
DevelopingSuburbs
Pro
ject
ed
Hou
sing U
nit D
em
and
, 2
01
0 -
20
30
Housing Unit Demand by Type and Tenure, 2010 - 2030, Stronger Region Scenario
Metro Boston Community Types
Multifamily -Rent
Multifamily -Own
Single Family -Own
75,900
63,201
80,600
108,800

It’s not just a housing problem

25 years of wage polarization
Data Sources: U.S. Census Public Use Microdata Sample 1990 and 2010-14
-100,000-80,000 -60,000 -40,000 -20,000 0 20,000 40,000 60,000 80,000 100,000
Healthcare Practitioners and Technical
Management, Business, Science, and Arts
Education, Training, and Library
Computer and Mathematical
Community and Social Services
Life, Physical, and Social Science
Legal
Protective Service
Personal Care and Service
Food Preparation and Serving
Transportation and Material Moving
Production
Construction and Extraction
Sales and Related
Building and Grounds Maintenance
Healthcare Support
Office and Administrative Support
Farming, Fishing, and Forestry
Architecture and Engineering
Business Operations Specialists
Installation, Maintenance, and Repair
Occupational Group Change by Household Income Category; Metro Boston, 1990 to 2014
Extremely Low-Income Very Low-Income Low-Income Lower Middle-Income Upper Middle-Income High-Income
Decline in “core”
middle income
occupations
Low-income growth,
middle income
decline
Disproportionate
low-income growth
Disproportionate
high-income growth

The Incredible Shrinking Middle Class
126%46%
15%
-1% -4%
33%
(20,000)
-
20,000
40,000
60,000
80,000
100,000
120,000
140,000
160,000
Working Households by Income CategoryMetro Boston, 1990 - 2014
Extremely Low-Income
Very Low-Income
Low-Income
Lower Middle-Income
Upper Middle-Income
High-Income
Change in number of households
Percent growth
Data Sources: U.S. Census Public Use Microdata Sample 1990 and 2010-14
Middle-Income Working
Households down 3%

Projected New Worker Households
8%
11%
13%
14%
9%
44%
-
50,000
100,000
150,000
200,000
250,000
300,000
350,000
400,000
450,000
500,000
Projected New Worker Households
Metro Boston, 2015 - 2030
High-Income
Upper Middle-Income
Lower Middle-Income
Low-Income
Very Low-Income
Extremely Low-Income
Data Sources: U.S. Census Public Use Microdata Sample 1990 and 2010-14
Over 800,000+ new workers needed by 2030
to fill vacancies left by
retiring Baby Boomers.
These workers will likely
form 492,000 new working
households.
Almost one-third of new
working households will
be low income.

Housing production is an economic imperative for
Massachusetts and its communities
The calculus for assessing the impacts of housing
production is changing radically and rapidly
Boomer downsizing satisfies only a portion of
demand created by younger households
Long-term trends will drive continued demand
for urban & multifamily housing
Sustainable solutions to the affordable housing
crisis require economic policy interventions

Tim Reardon, Director of Data Services
Metropolitan Area Planning Council
www.mapc.org/projections
www.housing.ma