reasons for poor production among the emerging …
TRANSCRIPT

REASONS FOR POOR PRODUCTION AMONG THE EMERGING SMALL‐SCALE PIG FARMERS
OF THE LIMPOPO PROVINCE OF THE REPUBLIC OF SOUTH AFRICA.
by
Japhta Molatelo Mokoele
Submitted in partial fulfilment of the requirements of
the degree
MMed Vet (Suil)
IN THE DEPARTMENT OF PRODUCTION ANIMAL STUDIES
FACULTY OF VETERINARY SCIENCE
UNIVERSITY OF PRETORIA
PRETORIA
Supervisor: Dr Spencer B T
Co‐supervisor: Dr Fasina F O
November 2015

2
TABLE OF CONTENTS
DECLARATION 5
ABSTRACT 6
ABSTRAK 7
ACKNOWLEDGEMENT 8
KEYWORDS 9
LIST OF ABBREVIATIONS 10
LIST OF FIGURES 11
LIST OF TABLES 12
CHAPTER 1: INTRODUCTION AND OBJECTIVES 13
1. Pig farm production system 13
1.1 Definition and introduction of the ESSPF 13
1.2 Challenges faced by ESSPF 13
1.3 Government programmes to assist ESSPF 14
1.4 The general importance of pig farming 15
1.5 The relevance of the Limpopo province in pig production in South Africa 15
1.6 The important control zone of ASF diseases in the province 16
1.7 Risks related to market opportunities outside the province 17
2. Hypothesis 18
3. Objectives 18

3
CHAPTER 2: LITERATURE REVIEW 19
2.1 Categories of pig farmers in South Africa 19
2.2 Factors affecting productivity of ESSPF 19
2.2.1 Record keeping 19
2.2.2 Biosecurity on a pig farm 20
2.2.3 Markets and related challenges 21
2.2.4 Extension and training services for farmers 22
2.2.5 Water 22
2.2.6 Nutrition 23
2.2.7 Management of the sows and boars 23
2.2.8 Housing 24
2.2.9 Diseases and pre‐weaning losses 24
CHAPTER 3: MATERIALS AND METHODS 26
3.1 Pig farm production systems constraints and challenges 26
3.1.1 Introduction to material and methods 26
3.1.2 Study area 26
3.1.3 Sampling methods 27
3.1.4 Data collection 29
3.1.5 Sampling frame and strategy 29
3.1.6 Data management and analyses 30
3.2 Spatio‐temporal analyses of movement variables 31
3.2.1 Geo‐coordinates data collection 31
3.2.2 Cartography, point mapping and one‐way linkages 31
3.2.3 Social network analyses 33

4
CHAPTER 4: RESULTS 34
4.1 Pig farm production systems constraints and challenges 34
4.1.1 Production system challenges or constraints results 34
4.2 Spatio‐temporal analyses of movement variables 43
4.2.1 ASF as model of risk factors during movement of pigs to market 43
CHAPTER 5: DISCUSSIONS 48
5.1 Pig farm production systems constraints and challenges 48
5.1.1 Production system challenges or constraints evaluated 48
5.2 Spatio‐temporal analyses of movement variables 54
5.2.1 ASF as model of risk factors during movement of pigs to market 54
CHAPTER 6: SUMMARY AND FUTURE RESEARCH 57
CHAPTER 7: REFERENCES 61
CHAPTER 8: LIST OF APPENDECISES 69
8.1 Appendix 1: Consent form and questionnaire 69
8.2 Appendix 2: Distance to slaughter 75
8.3 Appendix 3: Connectivity between municipalities 80

5
DECLARATION
I declare that this work hereby submitted to the University of Pretoria for the degree of
MMed Vet (Suil) has not been previously submitted by me for a degree at this or any other
university, and the materials contained therein have been duly acknowledged.
‐‐‐‐‐‐‐‐‐‐‐‐‐‐‐‐‐‐‐‐‐‐‐‐‐‐‐‐‐‐‐‐‐‐‐‐‐
Mokoele J M (NOVEMBER 2015)

6
ABSTRACT
Emerging small‐scale pig farmers in Limpopo province perceive pig production and
management as an important means of improving their livelihood and alternative
investment option for the future. Their performance has not been optimal due to the lack of
practical understanding of the basics of animal production, biosecurity and efficient
production system.
Thus, an attempt was made to evaluate the challenges and constrains of pig farm
production systems identified and reported by emerging small scale pig farmers (ESSPF) in
the province. In addition, the risk factors associated with pig movement by ESSPF by means
of spatio‐temporal analysis was evaluated.
The study revealed that the average number of sows/farm was 7.4, while the number of
boars/farm was 1.7. On average, the number of days that the sows take to return to oestrus
from weaning was 42.9 days while the number of piglet’s weaned/sow/year was 4.85 pigs.
Also the study showed that 98.77% of ESSPF don’t vaccinate their breeding stock against
major pig diseases and only 2.47% ESSPF farmers had previously benefited from the
infrastructure programme of the department referred to as Comprehensive Agricultural
Support Programme (CASP). The majority of the respondents (82.61%) will prefer to sell
their pigs at local points and within communities and only 9.32% and 14.09% will sell at the
auctions or formal abattoir/supermarkets respectively.
It is therefore recommended CASP be evaluated to reach and impact more pig farmers
positively. Good animal husbandry and transfer of knowledge by the veterinary officials is
central to the growth of farmers and their productivity. The provision of regional slaughter
facilities will reduce the travelling costs to Bronkhorstspruit and Belfast, but also reduce the
likelihood of the disease spread within or outside the province.
The involvement of different stakeholders should be encouraged to ensure ESSPF are
trained, mentored, coached, with the aim of improving their livelihood, food security and
safety.

7
ABSTRAK
Limpopo provinsie is ‘n belangrike vark produseerende gebied met ‘n groot populasie van
huishoudelike en wilde diere. Om die rede dien dit as ‘n interfase tussen huishoudelike
diere, mense en wilde diere.Alhoewel opkomende varkboere in die provinsie die produksie
en bestuur as ‘n belangrike verbetering in hul lewensbestaan asook alternatiewe finansiële
beleggingsopsies vir die toekoms beskou, is hul prestasie nie optimaal nie as gevolg van die
gebrek aan praktiese begrip van die basiese beginsels van diereproduksie, biosekuriteit en
doeltreffende produksie stelsels. Dus, is 'n poging aangewend om die uitdagings en
beperkings van varkplaas produksiestelsels te ïdentifiseer en die opkomende kleinskaalse
varkboere (ESSPF) in die provinsie te evalueer. Bykomend is die risikofaktore wat verband
hou met vark beweging deur ESSPF deur middel van tydruimtelike analise ontleed.
Die studie het getoon dat die gemiddelde aantal sôe per plaas was 7,4 terwyl die aantal bere
per plaas 1,7 was. Die sôe neem gemiddeld 42,9 dae om terug te keer na estrus vanaf
speen, terwyl die aantal varkies gespeen / sog / jaar is 4,85 varkies. Die studie het ook
getoon dat 98,77% van ESSPF nie hul teeldiere ent teen die hoof vark siektes en slegs 2,47%
ESSPF boere het voorheen voordeel getrek uit die program infrastruktuur van die
departement verwys na as omvattende landbou‐ondersteuningsprogram (CASP). Die
meerderheid van die respondente (82,61%) verkies om hul varke by plaaslike punte binne
gemeenskappe te verkoop en slegs 9,32% en 14,09% onderskeidelik verkoop by veilings of
formele slagpale/ supermarkte.
Dit word dus aanbeveel dat CASP herevalueer om ‘n positiewe impak te bereik by meer
varkboere. Goeie veeteelt en die oordrag van kennis deur die veeartseny‐amptenare is
sentraal tot die groei van die boere en hul produktiwiteit. Die voorsiening van plaaslike
slaggeriewe sal die reiskoste na Bronkhorstspruit en Belfast (beide buite die provinsie en
tans gekiesde slagpale van die ESSPF) verminder, maar ook die waarskynlikheid van die
verspreiding van siektes binne of buite die provinsie verminder.
Die betrokkenheid van die verskillende belanghebbendes moet aangemoedig word om te
verseker ESSPF opgelei word, gementor, afgerig, met die doel om van die verbetering van
hul lewensbestaan, voedselsekuriteit en veiligheid.

8
ACKNOWLEDGEMENT
I wish to express my unreserved gratitude and appreciation to the following:
Dr Tom Spencer for his confidence in me, advice, patience, love, guidance and support
through the duration of this project.
Special thanks to Dr Fasina for helping with data analysis, and also for his tireless support
and mentoring throughout this process. I want to express my sincere gratitude to Ms Botha
for translating my abstract into the Afrikaans. Also sincere gratitude to Mrs J M Anderson
for editing, printing and binding of this dissertation.
I also want to acknowledge the Limpopo Department of Agriculture (LDA) for providing
funds for this survey as part of a postgraduate programme, the Director of Veterinary
Services of Limpopo Province (LP), Dr Mampane and his team of veterinary managers in
various districts and all the veterinary officials for their moral support and assistance in the
collection of data in their respective districts.
I also appreciate the University of Pretoria, Faculty of Veterinary Science for partially
funding this work and also providing resources for postgraduate training.
I wish to thank all the pig farmers of Limpopo for taking their time to fill in the
questionnaire, and also to everyone that contributed to the success of this project
financially and otherwise.
I also want to thank the most important people in my life; my children Tshegofatso
Mphasha and Japhta Junior Khumo Mokoele, and most importantly my wife Vuyelwa
Mokoele for all the support, love and care during this period of my life.
Ultimately, I thank God for the opportunity granted to me to do this work (He indeed takes
pleasure in the prosperity of his people).

9
KEYWORDS
Emerging small‐scale pig farmers, pig industry, efficiency index, poor performance, markets,
movement control, African swine fever, biosecurity

10
LIST OF ABBREVIATIONS
AHT Animal Health Technicians
ASF African Swine Fever
CASP Comprehensive Agricultural Support Programme
CSF Classical Swine Fever
DAFF Department of Agriculture, Forestry and Fisheries
ESSPF Emerging Small‐Scale Pig Farmers
LP Limpopo Province
LDA Limpopo Department of Agriculture
LSCPF Large‐Scale Commercial Pig Farmers
PRRS Porcine Reproductive and Respiratory System
RSA Republic of South Africa
SAPPO South African Pork Producers Organisation
SV State Veterinarian

11
LIST OF FIGURES
Figure 1: (a) Map of South Africa showing the ASF control zone (Red Line); and (b) Reported
outbreaks in Limpopo between 1993 and 2010. 17
Figure 2: Map of Limpopo province showing study site between the years 2012‐2013 27
Figure 3: Map of surveyed locations of ESSPF in Limpopo 2012 32
Figure 4: Distance analysis of movement from major slaughter and marketing points 39
Figure 5: Main source of feed and water for the pigs 40
Figure 6: Evaluation of farm sow population against average number of Piglet’s
weaned/sow/year 41
Figure 7: Evaluation of farm sow population against average number of days to return to
oestrus 42
Figure 8: (a) Links between ESSPF and destinations of final products, (b) Links between ESSPF
and their preferred auction points 45
Figure 9: Distribution of location of surveyed farms based on preferred slaughter
location/auction market and the national and secondary road networks 46
Figure 10: Network map of connected locations for ESSPF in Limpopo province 47

12
LIST OF TABLES
Table 1 Characteristics of ESSPF in Limpopo 35
Table 2 Characteristics of ESSPF in Limpopo, South Africa 36
Table 3 Management and health parameters of ESSPF in Limpopo, South Africa 37
Table 4 Market related characteristics of ESSPF in Limpopo South Africa 38
Table 5 Efficiency index of piglets weaned per sow 41
Table 6 Efficiency index of return to oestrus per sow 42
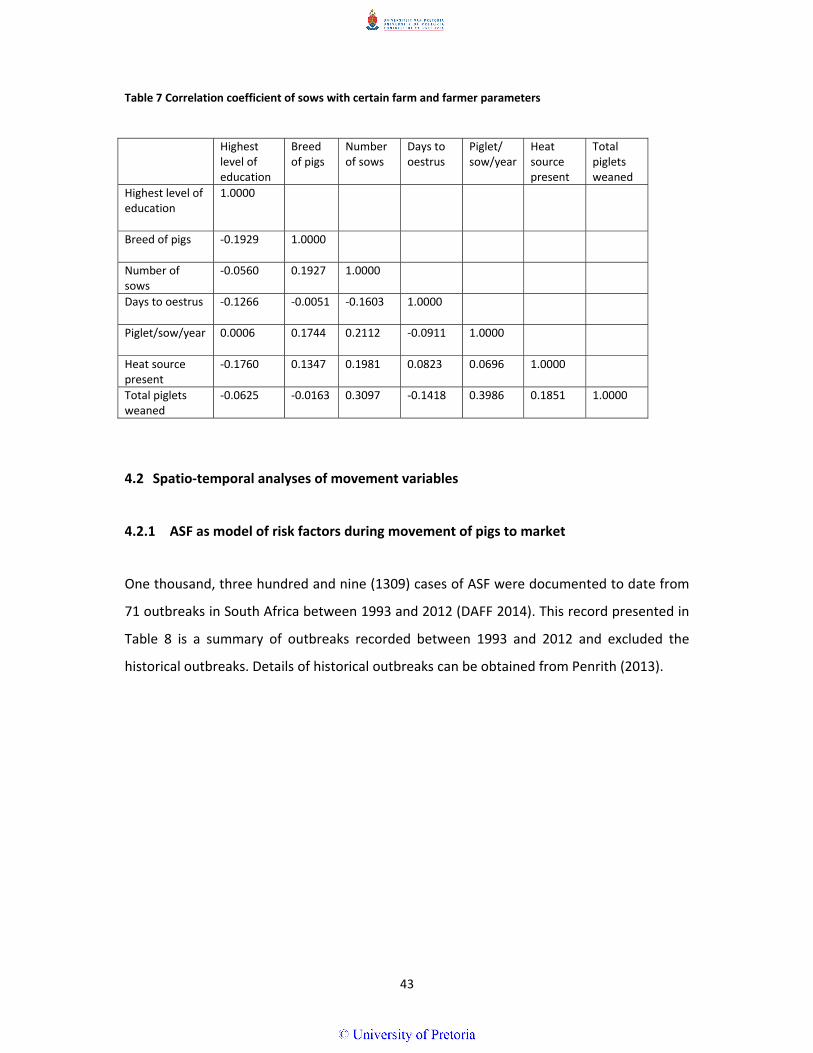
Table 7 Correlation coefficient of sows with certain farm and farmer parameters 43
Table 8 Reported outbreaks of ASF 1903‐2012 in South Africa. 44
Table 9 Showing details of outbreaks originating from Limpopo between 1993 and 2012 45

13
CHAPTER 1: INTRODUCTION AND OBJECTIVES
1. Pig farm production system
1.1 Definition and introduction of the ESSPF
Emerging Small‐Scale Pig Farmers (ESSPF) are persons who are starting with a pig farming
business venture. Since they are new entrants, they are learning to practice agrarian
operations. Therefore an extension service is imperative to these group of farmers to teach
them knowledge and skills in agricultural project operation (Sekokotla 2012).
According to the National Department of Agriculture (2006), Emerging Small‐Scale Farmers
(ESSF) is a relatively new term used to define previously underprivileged / disadvantaged
farmers who are determined to become semi‐commercial / commercial; these farmers have
the potential to achieve this feat if they are offered adequate support. Chikazunga et al.
(2007) assert that although this group of farmers consumes a portion of its produce, they
produce mainly for commercialization. In South Africa, this group of farmers is comprised
mainly of black farmers who were previously deprived of the opportunity to farm on a
commercial scale during the previous era of governance.
1.2 Challenges faced by ESSPF
Emerging Small‐Scale Pig Farmers still face difficulties of penetrating the already established
markets and have limited resources for production. Kirsten et al. (1998) asserted that the
challenges faced by ESSPF are likely to persist because the sector is not very well supported.
With limited policy support, these farmers still face difficulties in both production and
marketing of agricultural produce. Their main challenge is the land tenure, where they have
permission to occupy the land, but they do not own the land (Chikazunga et al. 2007). Thus
emerging farmers find it challenging to use their land as means of security for finance,
resulting in hindered productivity and growth. They also face difficulties in accessing the

14
commercial formal markets because these markets don’t serve their interests and therefore
they use their different methods to sell their products (Chikazunga et al. 2007).
In South Africa, especially in the less developed rural areas, smallholder or emerging
farmers have difficulty in participating in the commercial markets due to a range of
technical and institutional constraints (Chikazunga et al. 2007). Factors such as poor
infrastructure, lack of transport, lack of market information, insufficient expertise on
product grading, poor farmer organization, inability to solicit contractual agreements, and
poor organizational support, have led to inefficient use of markets by emerging farmers with
resultant commercialization bottlenecks according to Chikazunga et al. (2007).
1.3 Government programmes to assist ESSPF
Some pig farmers in the province have been assisted by government in the recent past and
this assistance has come in the form of access to information and markets, production
inputs, infrastructure development, finance, prioritizing support and help associated with
responses to natural disasters.
Department of Agriculture Forestry and Fishery (DAFF) in its strategic plan document
2014/2018 has developed food security programme which seeks to address infrastructure
development, production interventions and improved market access to attain food security.
This department allocated 2.9 billion rand in the medium term through CASP to provide for
the infrastructure needs of 220 000 existing, 80 000 new smallholder producers and 380 000
subsistence producers (DAFF 2013).
The support provided, includes a mechanisation support programme that targets the
subsistence and smallholder producers in order to increase their production, also pays for
engineering consultants who give advice to farmer on proper usage of machinery and
equipment’s and offers engineering services.
This fund will also assist with the establishment and filling of posts that were vacant due to
natural attrition. An additional 152.2 million rand was allocated to help with upgrading and

15
strengthening of provincial and rural agricultural colleges and additional 197 million rand
was allocated for research, facilities, equipment and also increase student intake in the
colleges (DAFF 2013).
Although this is a good initiative to have a one stop shop for smallholder farmers, focus has
moved away from livestock production to crop farming through fetsa‐tlala initiative. Fetsa
tlala (eradicate hunger) is a government initiative that seeks to push back frontiers of
hunger inadvertently working towards the elimination of the triple challenges of poverty,
inequality and hunger, this is done by means of ensuring that fields are planted through the
help of government tractors or private owned tractors and supply of farming inputs e.g.
manure, seeds. This programme indeed has a great positive impact in the lives of crop
farmers but however, this may cause some challenges in the future as livestock farmers will
start complaining about neglect, because in this medium term fetsa‐tlala was not budgeted
for and as such 70% of CASP budget needs to cover fetsa‐tlala expenditure.
1.4 The general importance of pig farming
Emerging Small‐Scale Pig Farmers perceive pig production and management as an important
means of improving their livelihood and as well as an alternative investment option for the
future, pigs also contribute to human nutrition, food security, poverty alleviation, and
creation of employment for the rural community (Mergenthaler, Weinberger & Qaim 2009;
Dietze 2011; Antwi & Seahlodi 2011). In addition, pigs provide a less expensive source of
animal protein compared with cattle, sheep and goats for urban consumers. While pig
farming as part of animal agriculture is central to the development of rural farmers; the real
contribution of ESSPF to the sectoral economy is not well assessed and somewhat doubtful.
These economic contributions by this group of farmers are faced with management, health,
housing, feeding and marketing constraints (Ironkwe & Amefule 2008).
1.5 The relevance of the Limpopo province in pig production in South Africa
In South Africa, it is further suggested that there are approximately 125 000 production
sows in 2010 / 2011 with approximately 100 000 sows being held commercially while the

16
remaining 25 000 are kept by small‐scale farmers. Approximately 1 200 ESSPF exist country
wide with the mean sow units consisting of 10‐20 sows (DAFF 2012; Mashala 2012). The
South African pork industry contributes around 2.15% to the primary agricultural sector, and
over 2.4 million pigs were slaughtered during 2011, the total pork production was put at 203
375 tonnes in cold dressed mass (DAFF 2014). Although South Africa is regarded as self‐
sufficient in pork production, the country still imports more pork than it exports because of
the high need for processed pork products like ribs (Mashala 2012).
Limpopo is the leading commercial pig producing province in South Africa contributing
approximately 24% of the total pig production in 2011 (DAFF 2012), however, only about
11 700 of all the sows in the province are registered as commercial sows with a widespread
distribution of non‐registered and unorganised small to medium‐scale pig farms. Previous
studies have indicated that Limpopo played a key role in some transboundary animal
disease disseminations in view of its location and contiguous boundaries with other
countries and is responsible almost exclusively for outbreaks of African Swine Fever (ASF)
into South Africa (Boschoff 2007). Since all the index cases to date of outbreaks of ASF in
South Africa have originated from Limpopo province and the majority of these outbreaks
were linked with small‐scale pig farms, it is critical to understand the management and
production systems of this category of farms in order to effectively carry out proactive
disease prevention and management.
1.6 The important control zone of ASF diseases in the province
Globally, infectious and zoonotic disease outbreaks have particularly intensified in past
decades at a rapid pace in view of more intense interconnectedness, rapid transport,
opening‐up of borders and increasing volumes of legal and illegal trades (Perry, Grace &
Sones 2013; Jones et al. 2013). Spatio‐temporal analyses including social network analyses
are disciplines traditionally entrenched in the field of geography and geo‐informatics but
have in recent times found relevance in the field of medicine, veterinary medicine,
infectious diseases and microbiology just to mention a few (Jiang, Ediger & Bader 2009;
Rivas et al. 2012; Paul & Dasgupta 2012). Specifically, geographic factors such as roads,
water bodies, distances from other outbreaks and markets among others have been found

17
to play important roles in disease transmission and spread (Jori et al. 2009; Rivas et al. 2010;
Rivas et al. 2012; Sanchez‐Vizcaino et al. 2012, FAO 2013; Pastrana et al. 2014; Korennoy et
al. 2014).
The province of Limpopo is regarded as a control zone for ASF alongside with parts of the
North West and Mpumalanga and Kwazulu‐Natal (Penrith 2013) (Figures 1a & b).
Furthermore, the province serves as an interface where activities between the domestic
animal‐human‐wildlife interfaces are very common, making it a peculiar location for studies
involving one‐health, zoonoses or wildlife‐domestic animal diseases.
Figure 1(a) Map of South Africa showing the ASF control zone (red‐line) and (b) Reported outbreaks in
Limpopo between the year 1993 and 2010.
1.7 Risks related to market opportunities outside the province
Pig production systems and the particular contributions of the ESSPF in the province have
been described recently (Mokoele et al. 2014). However, the presence of a deep‐rooted
dual‐market structure remains a major challenge facing small‐scale pig producers in the
province (Antwi & Seahlodi 2011). While the commercial pig farmers utilize the formal
markets (standard abattoirs, processors and supermarkets), the ESSP farmers mainly access
the informal markets (local auctions, backyard slaughters, pension sale points and local
abattoirs/slaughter slabs) as asserted by Antwi & Seahlodi (2011).
The most popular auction point and abattoir used by the ESSPF from Limpopo are Belfast
(Mpumalanga) and Bronkhorstspruit (Gauteng). These locations present the ESSPF with

18
better marketing opportunities and higher incomes for their products. However, although
the commercial interests of the ESSPF are being secured, breach of biosecurity remains
evident and the risk of introduction of infectious pathogens to non‐endemic areas are high
and these pose imminent threats to the pig industry nationally. Martinez‐Lopez, Perez &
Sanchez‐Vizcaino (2009) and Lindstrom et al. (2009) have previously identified shipment of
pigs from one area into another as a major risk that may result in diseases outbreaks.
2. Hypothesis
Certain factors limit production, marketing of pigs and present health challenges to the
emerging small scale pig farming units in Limpopo, South Africa.
3. Objectives
The objectives are to:
3.1 To describe the pig farm production systems, determine constraints/challenges
identified and reported by ESSPF in Limpopo Province.
3.2 To use spatio‐temporal analyses to determine the geographic and other risk factors
associated with the movement of pigs by ESSPF in Limpopo Province.

19
CHAPTER 2: LITERATURE REVIEW
2.1 Categories of pig farmers in South Africa
The South African pig farming communities are categorized into the following:
Back‐yard pig farmers are subsistence farmers who keep indigenous breeds and feed
pigs mainly on swill, sometimes with little or no supplementation.
Emerging Small‐Scale Pig Farmers (ESSPF) or Emerging Small‐Holder Pig Farmers
(ESHPF) are basically farmers who keep pigs for both subsistence and commercial
purposes, with more emphasis on the latter (FAO 2010). They breed a specific type of
pig and have greater abilities to grow than the group above; in South Africa ESSPF may
have 1 to 50 sow units. Pork is supplied to local markets and to more distant urban
markets, through a multifaceted transport and marketing system.
Medium‐Scale Commercial Pig Farmers (MSCPF) is commercial farmers, who are breed‐
specific and have greater than 50 and up to 250 sows as a barrier concern.
Large‐Scale Commercial Pig Farmers (LSCPF) operates on a contract basis with abattoirs
and has greater than 250 sows on the unit (SAPPO 2012).
2.2 Factors affecting productivity of ESSPF
2.2.1 Record keeping:
South African’s ESSF are notorious for their poor record keeping practices as emphasized by
Groenewald (2004). This attitude towards record keeping and a lack of professional business
practices has led many researchers to presume these farmers to be illiterate or semi‐
illiterate. These challenges impact negatively on the assessment of business viability
because it may be quite difficult if not impossible to objectively determine the actual profit
of the enterprises (Groenewald 2003).

20
2.2.2 Biosecurity on a pig farm:
This practice is very poor among the majority of the ESSPF and its non‐adherence usually
leads to the introduction of disease in ESSP farms (Fasina et al. 2012a). Biosecurity measures
applicable to pig farms are classified into three steps:
Segregation is the first and most important element of biosecurity. It involves keeping
potentially infected animals and materials away from uninfected animals. It is also regarded
as the most effective step in achieving the required levels of biosecurity; if a pathogen does
not enter a property or piggery, no infection can take place. No animals or materials should
enter or leave a piggery unless absolutely necessary: this includes not only pigs, but also
other species (including humans) that may be infected or contaminated with pathogens and
that can also infect pigs. Segregation includes the enforcement of the change of footwear
and clothing for all people that cross the barrier, and restricting the entry of vehicles, by
erection of fences and gate. It is therefore the basis of most biosecurity measures, from the
farm‐gate to the individual pig pen (FAO 2010).
Cleaning is the second most important step of biosecurity, which includes sweeping daily,
washing of the empty pen with a copious amount of water, thorough washing with soap,
water and a brush to ensure that there is no visible dirt on the surface of buildings and
materials, and the pens should be allowed to dry after this important step (FAO 2010; Fasina
et al. 2012a).
It is important that disinfection be performed consistently and accurately, but should be
regarded as a final “polishing” step in biosecurity and it is used after effective and
comprehensive cleaning. Disinfectants will not necessarily penetrate dirt in sufficiently high
concentrations, nor will they be present for sufficient time to be effective. They are
inactivated by organic materials such as wood or faecal material. Thus, although this is the
final important step, it can be regarded as the least effective step in biosecurity (FAO 2010).

21
2.2.3 Markets and related challenges
Marketing is a business activity associated with a flow of goods and services from producers
to consumers (Antwi & Seahlodi 2011). The marketing of agricultural products in particular
begins on the farm, with planning of production to meet specific demand and market
prospects.
The South African Government’s agricultural marketing policies play a fundamental role in
promoting pig enterprises for ESSPF. Marketing of agricultural products (especially pigs and
their products) is important among the ESSPF, due to benefits such as food security, income
and rural employment (Ngqangweni 2000).
Antwi & Seahlodi (2011) asserted that the South African pig industry currently has a dual
market structure: formal markets (processors and abattoirs) for commercial pig farmers and
informal markets (local auctions, pension point sales and supermarkets) for the ESSPF.
Formal markets have clearly defined grades, quality standards, safety regulations and prices
are formally set (Antwi & Seahlodi 2011). Thus formal markets pay premium price for quality
products and are accessed by big commercial farmers, while ESSPF find it difficult, but must
in the medium term penetrate these formal markets. The major issues with regard to the
ESSPF in accessing or penetrating the formal markets include: (Antwi & Seahlodi 2011).
Lack of knowledge and use of market information
Lack of access to high‐value reliable markets and high transactional costs
Long distance from the markets which tends to influence transactional costs, high feed
costs, price and competition
Lack of appropriate and affordable means of transport
Lack of storage facilities
Adverse effects of culture and socio‐economic factors
Low educational levels of small‐scale and emerging farmers
Imposed agricultural marketing policies
Poor agricultural extension services

22
Lack of financial support.
2.2.4 Extension and training services for farmers
Communication of new technologies, ideas and practices is the primary role of extension
agents. Most of the time ESSPF are not involved with extension agents and are therefore
deficient in acquiring the necessary information about new technology, skills, innovations
and production advice (Chaminuka et al. 2008). Although the services of the extension
agents are available in South Africa, their use by ESSPF is poor due to cost and sometimes
the technicalities involved (Chaminuka et al. 2008). At the same time Montshwe (2006) has
emphasized that ESSF have difficulties in accessing market information, and are thus
exposed to a marketing disadvantage. They rely on informal networks (traders, friends and
relatives) for market information due to weak public information systems, which may
expose them to biased information due to opportunistic behaviours of the informed group
(Mabuza & Ngubane 2010).
2.2.5 Water
Water is a critical resource in any pig production unit, as it is required for cleaning the pens,
drinking purposes and cooling of the pigs. In most of these units, pigs get water only twice a
day, in the morning and in the afternoon. In certain piggeries they are supplied with water
every other day. Limited water accessibility has negative effects on the pig as it retards their
growth potential and affects many other biochemical process (Manchidi 2009). The
increased the distance between the household / production site from the water source
results in a lower probability of the household being involved in pig farming activity, and if
they do engage in farming activity, this will translate into higher capital cost for that
particular farmer (Mabuza & Ngubane 2010).

23
2.2.6 Nutrition
Generally feed accounts for up to 70% of production cost in the piggery. The quality of feed
determines the productivity of the entire herd. Pigs require the six general classes of
nutrients: carbohydrates, fats, protein (amino acids), minerals, vitamins and water. Energy is
an important nutrient for the body’s fuel and is crucial for growth and important for
movement such as walking, eating and for engaging in all the energy‐intensive activities of
the pigs. Fats and oils can also be fed to supply energy, to increase palatability and also to
improve feed efficiency and as wellbeing a source of essential fatty acids (linolenic acid,
linoleic acid and arachidonic acid), but they only add to the value of energy from
carbohydrate and should not be the main source (Pretorius 2007).
Proteins provide the material from which pigs produce lean muscle, reproductive cells and
also repair body tissue. Each protein is made up of several simpler compounds called amino
acids. Lysine is the essential amino acid in swine rations. Vitamins and minerals are
important for other physio‐biochemical and metabolic process in the body of a pig
(Carrington 2004).
The main challenge facing ESSPF is that feed suppliers are mostly located around peri‐urban
areas whereas ESSPF are mainly located in the rural areas where they do not have good
means of transport to collect feed and in addition, the high cost of these feeds acts as a
disadvantage for the emerging farmers. No uniform template is available for the feeding of
pigs in and around rural areas. Pigs are only fed based on availability of resources (kitchen
and hospital wastes, and other such remnants). These remnants may be substituted at times
with wheaten bran, maize, concentrates and vegetables (Manchidi 2009).
2.2.7 Management of the sows and boars
Small‐scale piggeries don’t have formal management programmes. This is partly due to
inadequate advice from government extension services as well as from inadequate
infrastructure. The boars and the sows are normally housed together most of the time

24
resulting in loss of interest due to a reduced level of libido or exhaustion (Manchidi 2009).
There is a lack of proper weaning and breeding strategy, to the extent that this results in a
number of undesirable consequences which may include amongst others, increased
weaning to service interval, increased empty days/sow/annum, reduced number of mating’s
per week, less number piglets born and most importantly this will affect the total number of
piglets weaned/sow/year (Fasina 2012).
2.2.8 Housing
Housing often becomes a major challenge in ESSPF as most of them are still starting‐up and
therefore lack enough funds to invest in good infrastructure. These farmers are forced to
house pigs of different production stages together with limited feeding space and poor
drinking facilities, resulting in frequent fights during feeding and other behavioural
problems (Manchidi 2009).
These fights normally result in injuries and wounds. The pigs compete for feed and water,
which will result in the young pigs getting inadequate / less feed and water. Smaller pigs
under this circumstance will grow slower than normal and therefore reach marketable stage
after a prolonged period, which results in this farming endeavour becoming very costly and
unsustainable (Manchidi 2009).
2.2.9 Diseases and pre‐weaning losses
Emerging Small‐Scale Pig Farmers face challenges of piglet mortalities as are present in
commercial pig farms, but ESSPF are customarily affected by this situation. The piglet
mortalities are mainly caused by lack of colostrum in the first 24 hours after birth. The other
very critical factor is hypothermia. These farms lack heating facilities resulting in greater
challenges during the cold winter months of the country. The lack of a proper farrowing
house and proper amenities result in increased mortalities due to crushing of the piglets
(Shankar et al. 2009; Mokoele et al. 2014).

25
Mange and lice infestation are important conditions that cause considerable losses because
of the extreme itching and continuous scratching of the skin (Ironkwe & Amefule 2008). The
other diseases of importance to the pigs of the ESSPF are Escherichia coli diarrhoea and
coccidiosis caused by Isospora suis (Kammersgaard et al. 2011). Escherichia coli is a very
important bacterium that causes diarrhoea in piglets. Diarrhoea can occur at any age during
suckling but there are often two peak periods, before 5 days and between 7 and 14 days.
Coccidia‐affected faeces caused by Isospora suis vary in consistency and colour from yellow
to green, or bloody according to the severity of the condition (Kammersgaard et al. 2011;
Fasina 2012).

26
CHAPTER 3: MATERIALS AND METHODS
3.1 Pig farm production systems constraints and challenges
3.1.1 Introduction to material and methods
According to Thrusfield (1995), a scientific study ought to be an investigative process that
employs the right research methodologies. Steyn et al. (1994) affirm that survey research is
to be initiated by selecting the proper sampling method, followed by the design of the
questionnaire and data collection through interviews of respondents by field workers who
are trained at a workshop to do the interview.
3.1.2 Study area
The study was conducted in the five districts of Limpopo Province of the Republic of South
Africa (RSA), namely Sekhukhune, Capricorn, Waterberg, Vhembe and Mopani districts. This
province serves as an interface where activities between the domestic animal‐human‐
wildlife interfaces are very common and most importantly is an ASF control zone and also
very important in terms of pig populations with regards to other provinces for both
commercial and emerging small scale pig farms.

27
Figure 2: Map of Limpopo province showing study site between the year 2012‐2013.
3.1.3 Sampling methods
The research was divided into the following phases:
Planning of the study
Planning and compilation of the questionnaire
Once the questionnaire was decided upon then phases include:
Phase 1: Initial plenary meetings
Meetings were convened and held to discuss research plan and its benefit with the
veterinary and extension officers and also to enlighten them about the list of ESSPF to be
involved in the study and also conducted training for interviewers in this phase.

28
Phase 2: Farmer interview
Selected farmers were interviewed (face‐to‐face) using a semi‐structured questionnaire for
data collection in their preferred language. The semi‐structured questionnaire was to collect
both qualitative and quantitative data. Bless & Smith (2000) asserted that an interviewer‐
administered interview is an important tool of data collection because it reduces the
problems of words or the question of misinterpretation (misunderstanding) by respondents
and can be administered to farmers who can neither read nor write. In addition, the
presence of the interviewer increases the quality of the response since the interviewer can
probe for more specific answers (Leedy et al. 2004). However, efforts were made to reduce
courtesy and opinion biases on the part of interviewer by allowing farmers opportunity to
give their answers freely and the prior training of the interviewers became important to
ensure that interviews are done effectively and efficiently.
Phase 3: Analysis of farmers’ questionnaires
Analysis of farmer’s questionnaires was conducted in phase 3 with the help of a pig
veterinarian with knowledge of Microsoft Excel®. Descriptive statistics as well as students’ T
test, Chi square, ANOVA and other appropriate analytic methods were used.
Phase 4: Report Compilation
In phase 4 a research study report will be synthesized and be submitted to the Faculty of
Veterinary Sciences, University of Pretoria and other applicable organizations.
Phase 5: Report back to stakeholders
A feedback session on veterinary extension, best practices of pig production systems to
farmers, veterinary and extension officials was done at various platforms including
workshops, meetings, farmers days, agricultural and veterinary conferences.

29
3.1.4 Data collection
A semi‐structured questionnaire (Appendix 1) was designed at the Department of
Production Animal Studies, University of Pretoria based on available literature, expert
opinions and fitting primary objectives of the study. This was pilot tested amongst
veterinary students (n=12) and was later reviewed and validated by selected pig
veterinarians in the field, the Research Committees of Limpopo Department of Agriculture
and the Faculty of Veterinary Science, University of Pretoria as well as State Veterinarians
(SV) and Animal Health Technicians (AHT) of the department during organised districts
consultative forums. The questionnaire was used to collect data from the selected
participants using participatory method as described by Thrusfield (1995).
This instrument was designed to capture data on factors that affect production performance
of the ESSPF with particular reference to the province. The data collected includes:
(Appendix 1)
Biographical information data (name, age, sex, highest educational level attained,
family size and the vision of the farm / production unit);
Production and marketing factors (management of the production, marketing strategy,
health plan, housing, and feeding strategy);
Perceived problems.
All questions were prepared in English and translated / administered in the farmers’ home
language and in a semi structured manner through the help veterinary and extension official
employed by Limpopo Department of Agriculture.
3.1.5 Sampling frame and strategy
The LDA have partially documented records (n = 85) of ESSPF and this department is on the
drive to fully document the records of these pig farmers so that targeted interventions in

30
terms of infrastructure development, veterinary extension services, production and
marketing inputs can be carefully planned to assist these farmers.
A purposive sampling method was used to select ESSPF (n=185) from the study sites
including the 85 small scale pig farmers enlisted on the Province’s Department of
Agriculture list and an additional 100 farms that fall within this category but were not listed.
The expansion of the list beyond the Department list became necessary because the
preliminary data from the field had suggested that there were many unlisted ESSPF in the
province (Steyn et al. 1994) and observation from the field proves the sentiment to be true.
The inclusion criteria was pig farms with ≤50 sow‐unit located within the five districts of
Limpopo that have been active in pig production for at least one year. A participatory
research model approach was used (Chambers et al. 1993; Thrusfield 1995).
3.1.6 Data management and analyses
A total of 185 questionnaires were collected from the field but 20 were filtered out due to
missing values and inconsistent data. Another respondent was removed since he had
increased his herd size to a 150 sow unit. A total of 164 respondents (88.65%) were included
in the analysis. The data from completed questionnaires were coded, captured and filtered
using Microsoft Excel® spreadsheet and descriptive statistics were performed. The analyses
performed include proportional percentages, measures of central tendencies, percentiles,
and graphs of farm characteristics, production parameters, management and health
parameters and operational efficiencies using STATA v9.0 (Stata Corporation, Lakeway
Drive, College Station, Texas, USA). Efficiency indices for piglets weaned per sow and for
average days to oestrus were calculated by dividing the category mean by mean total
number of sows for the category. Correlation coefficients were calculated for farm
parameters that were thought to influence one another in the analyzed data.

31
3.2 Spatio‐temporal analyses of movement variables
3.2.1 Geo‐coordinates data collection
The geo‐coordinates of all surveyed ESSPF were obtained and entered into a Microsoft
Excel® spreadsheet using the Garmin Nuvi® or the Nokia Lumia 635®. All data were entered
into Microsoft Excel® and checked for consistency, correctness and validity. A preliminary
map was drawn to check that all places surveyed fall within the correct locations within
Limpopo based on the data obtained. Data were formatted to meet the need for
cartography software in ESRI’s ArcGIS/ArcView and the NodeXL software and exported
appropriately.
3.2.2 Cartography, point mapping and one‐way linkages
ESRI’s ArcGIS 10.1 software was used to add all specified geographic coordinates of the ESSP
farmers as XY coordinate data into the GIS.

32
Figure 3: Map of surveyed locations of ESSPF in Limpopo 2012
The smaller map indicates Limpopo with contiguous provinces of North‐West, Gauteng, Mpumalanga, and
some other provinces (Northern Cape, Free State and Kwazulu‐Natal). The call‐out map clearly indicates the
districts and municipalities within Limpopo and the spread of sampled sites
The resulting event layer was then displayed as a point symbol (red dot) portraying the
locations of the small‐scale pig farmers on an administrative map of Limpopo (Fig 3).
Additional fields were added to the initial attribute table of the feature to enable selection
of farms by their designated abattoir of choice. Thereafter the ‘XY To Line’ feature tool was
used to construct geodetic lines/linkages [(Figure 8 (a) & (b)] representing the shortest
distance between the farm and the destination point (the abattoir or auction point). Pig
farmers who used local slaughtering points are represented by a symbol (red dot) on these
two maps.

33
3.2.3 Social network analyses
Filtered data was imported from the open Microsoft Excel® workbook into the NodeXL
environment and manipulated appropriately for analyses based on software manufacturer’s
instructions (NodeXL Version: 1.0.1.326, Connected Action). The graphs produced were
unidirectional with 28 vertices. The graph's vertices were grouped by cluster using the
Clauset‐Newman‐Moore cluster algorithm and laid out using the Harel‐Koren Fast
Multiscale layout algorithm. The edge colours, widths and opacity were based on edge
weight values. The vertex sizes were based on betweenness centrality values. For emphasis,
graph/network is a set of vertices and edges connected together [G = (V, E)], edge [E] is an
association linking two vertices and vertices [V] are points/locations joined by edges (Jiang,
Ediger & Bader 2009).

34
CHAPTER 4: RESULTS
4.1 Pig farm production systems constraints and challenges
4.1.1 Production system challenges or constraints results
In this study, it has been proved that male farmers represented the majority of the
participating respondents (76.83%), a reflection of the population structure amongst the
ESSPF in the province (Table 1). Similarly, farmers whose age falls in ≥ 46 years old were
78.53% of the total respondents and only 5.52% were ≤ 35 and 15.95% were 36‐45 years
old. In addition, a total of 77.78% of the respondents were married (Table 1). The majority
of the farmers interviewed (63.80%) were engaged fulltime in their pig farming activities
while only 26.90% were involved part‐time. It was further noted that 26.54% of the total
respondents have post‐matriculation qualifications. In this study, the definition of breeds
were based on phenotypic characteristics of the pigs observed on the farm, therefore,
61.18% of the breeds used were indigenous/undefined, 28.29% were Large White, 10.53%
were Landrace and only 7.24% were Duroc breeds (Table 1). Only 2.47% ESSPF farmers had
previously benefited from the infrastructure programme of the department referred to as
CASP.

35
Table 1 Characteristics of ESSPF in Limpopo
Characteristics (number of respondents) Variables % of respondents
Gender (164) Male 76.83
Female 23.17
Age category in years (163) < 25 2.45
26‐35 3.07
36‐45 15.95
46‐55 33.13
56‐65 32.52
>65 12.88
Marital status (162) Single 11.73
Married 77.78
Divorced 2.47
Widow 5.56
Not specified 2.47
District Municipalities (161) Sekhukhune 27.95
Capricorn 30.43
Mopani 26.71
Vhembe 4.35
Waterberg 10.56
Land ownership (163) Own 50.31
Lease 7.36
Communal 39.26
Others 3.68
Highest level of education (162) Primary school 13.58
High school 27.16
Completed grade 12 17.90
Post‐secondary 26.54
Others/informal education 14.81
Participation in farming (163) Full time 63.80
Part time 26.99
Not defined 9.20
Breeds of pigs kept (152) Large White* 28.29
Landrace* 10.53
Duroc* 7.24
Indigenous/undefined 61.18
Received financial assistance or inputs from government (162)
No 97.53
Yes 2.47
*Pig breeds were based only on phenotypic characteristics of the breed types. E.g. erect ears, long body,
compact shape, brown colour, droopy ears.
The average number of sow/farm is 7.4, while the number of boars/farm is 1.7. On average,
the number of days that the sows take to return to oestrus from weaning was 42.9 days
while the number of piglet’s weaned/sows/year is 4.85 pigs (Table 2).

36
Table 2 Characteristics of ESSPF in Limpopo, South Africa
Mean±SD Median 1
percentile 25
percentile 75
percentile 95
percentile 99
percentile
Number of sows/farm (151)
7.4±7.8 5 1 3 8 25 40
Number of boars/farm (133)
1.7±1.4 1 0 1 2 5 7
Number of days to return to oestrus (sows) (112)
42.9±46.1 21 3 14 60 180 210
Average number of piglets weaned/ sow/year (115)
4.85±4.6 3.4 <1 1.67 6 15.88 18
The majority of the respondents (92.36 %) did not provide a heat source for their piglets
especially in the cold winter months and this has greatly impacted on increased levels of
mortality. In addition, 44.0% lost piglets primarily due to overlay and hypothermia while
62.67% claimed that piglets were lost principally due to other causes e.g diarrhoea, thieves
and cannibalism (Table 3). The interviewed farmers complained about skin conditions in
their herds and approximately 46.84% of the respondents identified skin diseases (primarily
mange) as the most important disease complex in their farms (Table 3). Other disease
complexes that were rated low by the farmers included reproductive (12.66%), enteric
(8.86%), respiratory (6.33%), musculo‐skeletal (5.06%) and mixed infections (39.87%) (Table
3).

37
Table 3 Management and health parameters of ESSPF in Limpopo, South Africa
Characteristics (number of respondents) % of respondents
Provide heat source for piglets (157) No 92.36
Yes 7.64
Lead reason for pre‐weaning mortality of piglets based on farmer’s responses (150)
Overlay 31.33
Hypothermia 12.67
Diarrhoea 2.67
Cannibalism 2.67
Multiple causes 62.67
Disease complex observed in the farm based on syndrome (158)
Respiratory 6.33
Enteric 8.86
Skin/integument 46.84
Musculo‐skeletal 5.06
Reproductive 12.66
Others/mixed infections 39.87
Officials contacted in animal disease situation (162)
Veterinarians 20.37
Animal health technicians 52.47
Extension officers 17.28
Cooperative department office 2.47
Community leaders 0.62
Others 14.81
Basic hygienic measures implemented on farms (161)
Hand wash 8.07
Fence 65.84
Foot bath 1.24
Change of cloth 0.62
Other measures 24.22
Vaccination of pigs (162) No 98.77
Yes 1.23
Medicine frequently used in the farm (158) Penicillin 5.70
Oxytetracyclines 30.38
Ivermectin 22.15
Sulpha medicines 1.27
Others (Iron, vitamins, other antibiotics etc.)
56.33
A total of 52.47% of the ESSPF prefer to report to and use the service of (AHT). State
Veterinarians are the first point of contact by one out of five farmers (20.37%) and 17.28%
will prefer to contact the extension officers first. The knowledge and implementation of
biosecurity is poor amongst the surveyed farmers as only 8.07% will wash hands and only
1.24% utilise footbaths in their farms. Although 65.84% indicated that they have built
fences, it is noted that these fences were not purpose built for biosecurity but were only
extensions of the human accommodations.

38
Most importantly, 98, 77% of the farmers do not vaccinate their breeding herd against
major pig diseases including Parvovirus infection, Leptospirosis and Erysipelas.
Oxytetracyclines (30.38%) were the most abused drug used by ESSPF since no diagnosis was
reached before treatment was implemented in most cases.
The majority of the respondents (82.61%) will prefer to or are obligated to sell their pigs at
local points and within communities and only 9.32% and 14.09% will sell at the auctions or
formal abattoir/supermarkets respectively. A total of 40.67% of the farmers do transport
the pigs to the slaughter facilities and only 1.33% of these farmers will transport live pigs
from different sources in the same vehicle (Table 4).
Table 4 Market related characteristics of ESSPF in Limpopo, South Africa
Characteristics (number of respondents) Variables Percentages of respondents
Where pigs are sold? (161) Abattoir 13.04
Supermarket/butchery 1.86
Auction 9.32
Pension points/local markets 45.96
Within communities and others 36.65
Source of transport to market (150) Own 34.00
Hired 5.33
Shared 1.33
Don’t transport 59.33
Mean distance from farm to market (151) <50km 20.00
51‐150km 18.71
151‐250km 7.10
251‐500km 3.87
>500km 0.65
Not applicable 49.68
The distance covered to go to Belfast auction may be as low as ≤50km but can be as far as
≤400km. The distance travelled to go to abattoir or slaughter points may be as low as ≤5km
for local slaughter points, ≤150km for Phalaborwa abattoir, ≤200km for Thabazimbi abattoir
but can be as far as ≤400km for Bronkhorspruit abattoir (Figure 4).

39
Figure 4: Distance analysis of movement from major slaughter and marketing points
An evaluation of the price the farmers received per pig sold revealed that there’s a great
lack of coordination in pricing and no template exist to standardize sales. For example, a 32
week old pig (50‐70kg) sells for approximately R500.00 compared with about R1200.00 for a
20 week old pig (≈ 70kg) in a formal market. It should however be emphasised that these
pigs often have high bone to meat ratio when compared with those originating from a
commercial operation.

40
Although a good proportion (41.25%) of the farmers claimed to use concentrates in feeding
their pigs, evidence based on checklist contradicted this assertion. It will appear that most
of the farmers use kitchen remnants, while others mix concentrates and kitchen remnants
(mixed portions) and only supplement with vegetables and concentrate feeds (Figure 5). A
total of 43.83 % use borehole as source of water for their piggery but a proportion (32.10%)
used village streams and other water sources like river (9.26%) and municipal water (6.78%)
(Figure 5).
Figure 5: Main source of feed and water for the pigs
The majority of the farmers (81.76%) have less than 10 sows (Figure 6, Table 5) and this
category of farmers appeared to have the best efficiency index compared to other
categories in terms of number of piglets weaned per sow per year (5.19). It is shown that
the higher the number of sows per ESSPF, the lesser the efficiency of weaning per individual
sow in the farm (Table 5).
0%
5%
10%
15%
20%
25%
30%
35%
40%
45%
50%
Concentrate
Vegetab
les
Mixed portions
Kitchen
rem
nants
Other sources
Borehole
River/dam
Municipal
Village stream
Others
Main feed source Main water source

41
Figure 6: Evaluation of farm sow population against average number of piglet's weaned/sow/year
Table 5 Efficiency index of piglets weaned per sow
Sow number (frequency)
Mean number of sows/farm
Mean piglets weaned/year
Efficiency index of weaning/sow
1‐10 (121) 5.12 26.59 5.19
11‐20 (17) 15.46 60.2 3.89
21‐30 (7) 27.4 90 3.28
31‐40 (2) 37.5 39 1.04
41‐50 (1) 50 100 2
The average number of days for sows to return to oestrus in the ESSP farms was 42.9 days
(Table 6) but there was a significant difference amongst the different categories (1‐10, 11‐
20, 21‐30, 31‐40, 41‐50, P< 0.0001). Sows of those farmers with between 1‐10 sows will take
approximately 49.9 days to return to oestrus while those with between 21 and 30 sows will
return on oestrus within 16 days (Table 6, Figure 7). However, some farms with less than 10
sows took up to 210 days for their sows to return on oestrus (Figure 7).
0
100
200
300
0 10 20 30 40 50
Number weaned

42
Figure 7: Evaluation of farm sow population against average number of days to return to oestrus
Table 6 Efficiency index of return to oestrus per sow
Sow number (frequency)
Mean number of days to return on oestrus/ sow ±SE (days)
95% Confidence interval (days)
1‐10 (86) 49.9±5.4 38.4; 59.8
11‐20 (15) 27.47±6.2 14.2; 40.8
21‐30 (6) 16.0±2.6 9.30; 22.7
31‐40 (2) 17.5±3.5 ‐27.0; 62.0
41‐50 (1) 21
Total 42.9±4.4 34.3; 51.6
Overall, the level of education was negatively correlated with all of the farm parameters
assessed except the piglets per sow per year where it has a very poor correlation. The total
piglets weaned was positively correlated with the total number of piglets born per sow per
year (39.86%) and the number of sows in the farm was positively correlated with the total
piglets weaned (30.97%) (Table 7).
0
50
100
150
200
0 10 20 30 40 50
Number of sows in the farm
43
Table 7 Correlation coefficient of sows with certain farm and farmer parameters
Highest level of education
Breed of pigs
Number of sows
Days to oestrus
Piglet/sow/year
Heat source present
Total piglets weaned
Highest level of education
1.0000
Breed of pigs ‐0.1929 1.0000
Number of sows
‐0.0560
0.1927 1.0000
Days to oestrus ‐0.1266 ‐0.0051 ‐0.1603
1.0000
Piglet/sow/year 0.0006 0.1744 0.2112
‐0.0911 1.0000
Heat source present
‐0.1760 0.1347 0.1981 0.0823 0.0696 1.0000
Total piglets weaned
‐0.0625 ‐0.0163 0.3097 ‐0.1418 0.3986 0.1851 1.0000
4.2 Spatio‐temporal analyses of movement variables
4.2.1 ASF as model of risk factors during movement of pigs to market
One thousand, three hundred and nine (1309) cases of ASF were documented to date from
71 outbreaks in South Africa between 1993 and 2012 (DAFF 2014). This record presented in
Table 8 is a summary of outbreaks recorded between 1993 and 2012 and excluded the
historical outbreaks. Details of historical outbreaks can be obtained from Penrith (2013).

44
Table 8 Reported outbreaks of ASF 1903‐2012 in South Africa
Timeline Years Province Outbreaks Cases Dead/euthanized References
Historical 1903‐ 1939
Cape Town and the Transvaal (1903)*, Krugersdorp and Johannesburg (1901‐03)*, Western Cape (1905, 1910, 1912, 1917, 1918), Transvaal, Pretoria and Krugersdorp (1904‐06), Potgietersrus (1926‐1930), Western Cape (1933‐1936), Piquetberg* (1934‐1939), North‐eastern South Africa (1935).
De Kock, Robinson & Keppel (1940); Penrith & Vosloo 2009; Penrith (2013)
Recent 1993‐2012
Limpopo 54 (76.1) 1040 (79.4)
1258 (64.1)
Evans 2012; Spencer 2012; Penrith, & Spencer 2014; DAFF 2014
Mpumalanga 9 (12.7) 133 (10.2)
585 (29.8)
Gauteng 6 (8.4) 132 (10.1)
116 (5.9)
Kruger National Park
2 (2.8) 4 (0.3) 4 (0.2)
National 71 1309 1963
*Cases may have been CSF or ASF. No clear distinction was established between the two diseases in earlier
years. A comprehensive review has been produced by Penrith (2013)
A huge 76.1% of all outbreaks within the reviewed period originated from Limpopo while a
large proportion of the other provincial outbreaks have links with the province (Table 8).
Mpumalanga and Gauteng provinces only recorded outbreaks in late 2011/early 2012. A
total of about 54 years of quiescence existed wherein no outbreaks were recorded (Table 8).
In addition, with regards to the districts under the province, no outbreaks were reported
from Capricorn and Greater Sekhukhune, while all outbreaks in Limpopo were reported
from Waterberg, Vhembe and Mopani districts. These three districts serve as interface
locations between domestic and wildlife activities in the province or have links with
international boundaries as seen in Table 9.
The results show that ESSPF are dispersed diffusely throughout Limpopo with a tendency for
greater farm concentrations around Capricorn, Mopani and Greater Sekhukhune districts
(Figure 3).

45
Table 9 Showing details of outbreaks originating from Limpopo between 1993 and 2012
S/no. District Preferred abattoir/slaughter point
Relative number of outbreaks originating from each district
Notes
1 Capricorn Local 0 Religious forbiddance, local pig trade
2 Waterberg Thabazimbi 19 Many wildlife conservancies/parks
3 Vhembe Bronkhorstspruit, local
4 Boundaries with KNP
4 G. Sekhukhune Bronkhorstspruit 0 Landlocked, External pig trade
5 Mopani Phalaborwa 4 Boundaries with KNP
6 Kruger National Park#
2 Operate separately under the national government
Table was prepared based on outbreak data from 1993 to 2012. All index cases originate from small to
medium scale farms. All data were retrieved from DAFF records (DAFF 2014). ESSP farmers from all the
districts patronise the Belfast Auction in Mpumalanga. #KNP is not part of LP
The preferred abattoir for the ESSPF from Limpopo province is Bronkhorspruit (Gauteng)
while 99.4% of the ESSPF will also preferentially choose Belfast Auction in Mpumalanga to
source their pigs or sell whole animals. Other abattoirs mainly used are the Thabazimbi and
Ba‐Phalaborwa abattoirs. Importantly, some ESSPF especially from Capricorn district will
prefer to slaughter pigs within the communities (Figures 8a&b).
Figure 8: (a) Links between ESSPF and destinations of final products, (b) Links between ESSPF and their
preferred auction points

46
However, no specific pattern exists with regards to the farm distributions or choice of
slaughter/sale facility and the distances from the closest secondary or national road(s) to
the farms (see Appendix 3 and Figure 9).
Figure 9: Distribution of location of surveyed farms based on preferred slaughter location/auction market
and the national and secondary road networks

47
While relationships with wildlife parks, conservancies and sharing of borders with the
Kruger National Park was associated with the risk of outbreaks, the slaughtering points
(local, Phalaborwa, Bronkhorstpruit and Thabazimbi) appeared to have the greatest
influences on further disease dispersal following potential outbreaks (Figures 8a&b, 10).
Figure10: Network map of connected locations for ESSPF in Limpopo province
The slaughtering points (local, Phalaborwa, Bronkhorstpruit and Thabazimbi) appeared to have the greatest
influences on disease dispersal. Following infections through contacts networks, these points will rapidly serve
to disperse new infections. The edge colours, edge widths and edge opacities are based on edge weight values.
The vertex sizes are based on betweenness centrality values)
Overall, the graph has 28 vertices and 2 unique edges with total edges of 161. There were 4
connected components with an average geodesic distance of 1.48. The graph density had a
value of 0.0634920634920635 and a modularity value of 0.143359 (Appendix 3). The top ten
vertices ranked by between centrality were the local slaughter points, Phalaborwa,
Thabazimbi, Bronkhorstspruit, but also Molemole, Ephraim Mogale, Letaba, Tzaaneen,
Makhado and Blouberg (See Figure 10 & Appendix 3).

48
CHAPTER 5: DISCUSSIONS
5.1 Pig farm production systems constraints and challenges
5.1.1 Production system challenges or constraints evaluated
This work and analyses revealed some deficiencies with regards to record keeping. It
becomes a difficult task to collect critical production parameters where no records exist to
validate the collected information and the farmers’ perception and recall were the only
forms of validation. In this study, an effort was made to use check questions and
interviewees’ observational analyses to validate some of the collected data from the
farmers. Despite this challenge, the study has revealed that most of the ESSPF in the
province are males (77%), a fact that put to question the issue of women in agriculture and
economic empowerment in this sector. It will appear that the pig industry is largely
imbalanced in terms of ownership and gender, and there may be a need to transform this
industry and provide more opportunities with critical focus on the rural women. It should be
understood though that pig farming is labour intensive in terms of inputs and only few
women are ready to be involved in such activities. While gender equity is one of the major
standpoints of the land reform policies, to date, women ownership of land and other means
of agricultural production, especially in the rural areas are still viewed with some degree of
abhorrence (Cross & Hornby 2002; Kalabamu 2006; Anon 2014).
The majority of the farmers were older than 45 years of age, an indication that the younger
generation prefer not to get involved in agriculture but will rather migrate to urban areas in
search of salaried jobs. This observation may also be an indication of late entry into pig
production and this is a challenge in terms of skill transfer from elderly to the youth. A
similar trend has been observed in other studies (Oladele et al. 2013; Schembri et al. 2013).
Currently, it is widely perceived that only the poor get involved in rural farming and it is not
a financially rewarding activity. Policies that will encourage the younger individuals to be
retained in the rural areas will need to be implemented at all levels to reduce gross
emigration to the city while boosting agricultural productivity in the rural areas.

49
Since pig farming in the rural areas involves the service of many individuals, larger families
and married persons are at advantage since two or more persons are involved. The outcome
of our analysis indicated that 78% of all respondents were married. The majority of the
farmers were also educated up to the end of high school (58.64%). Lubungu et al. (2012)
confirmed that the level of education will have a positive relationship with market access.
Since farmers with post‐secondary education are just above a quarter of the total
respondents, it is expected that these enlightened farmers will positively influence the
market and open access for the less educated ones and based on the field observations,
more enlightened farmers use their knowledge to practice the latest farming methods more
easily than their counter parts. It is important to emphasise that the majority of the
respondents still kept indigenous and crossbred pigs. These results are comparable with the
data from India (70%) (Nath et al. 2013). These indigenous and undefined pigs have been
known to underperform compared with the exotic breeds in terms of litter size, litter
weight, birth weight, weaning weight and average daily weight gain; and they often enjoy
poor veterinary services (Halimani et al. 2010). Veterinary extension services must be
targeted towards encouraging farmers to adopt the improved breeds of pigs in rural farm
operations.
Although LDA has made available certain provision for funding of livestock infrastructure in
terms of CASP, only 2.47% of the respondents have benefited. It will be necessary for DAFF
to fine tune its agricultural policies and remove unnecessary bottlenecks that impede the
development of ESSPF in order that planned programmes and policies can reach the
targeted beneficiaries. In the current programme, the farmers were supported in terms of
provision of 10 sows or a housing unit for 10 ‐ 50 sows. A realistic economic model has
indicated that farmers need between 150 and 250 sows to be commercially viable. While
the government may not be able to provide this level of support for all the ESSPF, the
options of forming them into smaller cooperatives to benefit from economies of scale and
become more competitive in terms of input supplies and marketing should be explored
(Mashala 2012). Farmers should be encouraged to have specialised units like having
breeding herds, selling weaners and other farmers having growing units selling porkers, this
will encourage them to sell more pigs and also buy cheaper in bulk as a group.

50
It has been noted through observation that farmers supported by government had better
infrastructure, facilities, and better or improved breeding stock. It is important to note that
if these farmers were supported enough financially and properly mentored they will be able
to produce optimally. Any form of government support should encourage sustainable
prosperity other than that government will be creating dependent and unsustainable
farmers. There should be a means to ensure that these farmers have a level of
accountability to government. In addition, financial institutions should be encouraged to
provide low‐interest agricultural financing to farmers with viable projects.
With regards to productivity, the analysis indicated that the ESSPF are poorly productive
compared with the commercial operations. They weaned an average of 4.85 pig/sow/year, a
mere 19% of the standard for the South African pig industry (26 piglets/sow/year) and it
took much longer for the sows to return on oestrus (42.9 days compared with 4‐6 days)
(Fasina 2012; Spencer 2014). The statistics generated in this study are incompatible with
economically feasible and viable pig production and there will be need for a major shift if
the ESSP farms are to be commercially viable and sustainable in South Africa. At the same
time consideration is given to these statistics, it should also be carefully viewed since large
variations exist between the farmer’s operational efficiencies in each category.
Hypothermia is a major cause of neonatal piglet mortality and it predisposes piglets to other
aggravating causes of mortalities including diseases, crushing and starvation (Kammersgaard
et al. 2011; Pedersen et al. 2012). Hypothermia significantly reduces the ability of piglets to
access the sow’s udder and get colostrum within the first 6 ‐ 12 hours after birth to meet
their nutritional requirements in order to stimulate maternal immunity and protection
against diseases. Though regular supervision in the farrowing house will help to reduce the
levels of mortalities in terms of prevention of hypothermia, regular feeding, reducing
illnesses and maintaining sow’s udder health (Shankar, Madhusudhan & Harish 2009), such
were basically lacking in the surveyed farms. The huge majority of the respondents (92.36%)
did not provide a heat source for pre‐weaning piglets and the high level of pre‐weaning
mortality observed in the farms of ESSPF in Limpopo can be attributed to this situation.
Pedersen et al. (2012) has confirmed that mortality associated with hypothermia can be

51
seven times more severe in piglet subjected to suboptimal environmental and floor
temperature in the first week of birth (Kammersgaard et al. 2011).
Pigs are exposed to a variety of predisposing factors and pathogens causing diseases.
Primary diseases and conditions of concern in the industry include the production limiting
diseases, respiratory complexes and lameness‐associated problems amongst others
(Mokoele et al. 2014; Spencer 2014). In this analysis, disease complexes were grouped as
syndromes for ease of recognition by the ESSPF as they are non‐professional and may not
be able to identify specific disease pathologies. The disease conditions were grouped as
respiratory, enteric, skin/integumentary, musculo‐skeletal and reproductive syndromes.
Over forty‐six percent (46.84%) of the respondents indicated that a skin condition was a
major challenge in their farms. Further enquiries from respondents confirmed that the
conditions on pigs were observed as scratching, with discoloured or thickened skin, scabs
and hair loss among others, an indication of sarcoptic mange (Turton 2001). Mange
significantly depresses growth rate and feed efficiency and it is expected that a huge loss in
days‐to‐market prevailed amongst the pigs from these farms due to the above reason. Many
of the farmers sell their pigs at an average of eight months, a loss of about 90 days
compared to commercial operations. Unfortunately, only 22.15% of the respondents
mentioned ivermectin (macrocytic lactones) as a frequently used medicine in the farm.
It is particularly concerning that oxytetracyclines is used routinely by about 30% of the
farmers most of the time without proper diagnosis and consideration for its proper use and
consequences. Community‐specific farm health plans will need to be made to target this
group using state veterinary officials at their nearest state vet offices (Arends et al. 1990).
Such health plans must include messages on importance of vaccination programme, proper
use of antibiotics and biosecurity, areas where huge deficiencies were observed amongst
the respondents (FAO. 2010; Fasina et al. 2012 a&b). Vaccination of the breeding herd
against very important production limiting diseases in South Africa (Parvovirus,
Leptospirosis and Erysipelosis, as well as E.coli) must necessarily be included in such a
protocol (Mokoele et al. 2014).

52
Since the farmers will prefer to use the services of state veterinary officials and local
agricultural extension officials, there will be a need for coordination of efforts among these
professionals to maximise the impact of state veterinary extension services and block
loopholes that may exist with individual efforts. Data comparable to our statistics, more
reliance on animal health technicians rather than the veterinarians by ESSPF has been
reported elsewhere (Alawneh et al. 2014). It should be emphasised that disease complexes
among the ESSP farms pose huge risks to the commercial operations, and therefore the
inclusion of private veterinarians and large commercial farms in sponsoring veterinary
extension services amongst these individuals while serving the role of mentors and patrons
must be critically evaluated (Hernández‐Jover et al. 2012; Wilk et al. 2013). The extension
messages must also target how market access can be created for these farmers as well as a
suitable grading system that will encourage them to maximise productivity and move
towards good farming practices. The role of veterinary extension and the usage of multiple
professionals to meet the challenges of animal health services have been emphasised
previously (Turton 1999; Hernández‐Jover et al. 2012; Mockshell et al. 2014). The
determinants of cooperation and referrals between para‐professionals and veterinarians
have been previously identified to include mobile phone ownership, training, cumulative
annual assessment and membership of para‐professional bodies and association among
others (Ilukor et al. 2014). It will therefore become necessary to facilitate inter‐professional
relationship amongst animal health service providers in rural South Africa by provision of
the identified facilities.
Nutrition and feeding are very important components of animal production and health; in
this study, it is been established that the ESSPF are more likely to swill‐feed the pigs with
potential consequence of spread of exotic pig diseases like Classical Swine Fever (CSF) and
Porcine Reproductive and Respiratory Syndrome (PRRS) (Penrith et al. 2011). Similarly, since
the various swills are not evaluated for their nutritional qualities, it becomes difficult to
assess whether this feed will meet the nutritional requirement of the different classes of
pigs in the farm. It is probable that the weaners and grower pigs were underfed and this was
the main reason why they took longer to reach appropriate market weights, and it is also
possible that they had conditions such as gastric ulcers and other related diseases
(Carrington 2004; Manchidi 2009). It is also probable that sows that are fed swill will also

53
contribute to poor performance in terms of taking longer to return to oestrus and weaning
less piglets/sow/year (Mokoele et al. 2014).
Water is a critical resource in any pig production unit, as it is required for cleaning the pens,
drinking purposes and cooling of the pigs (Carrington 2004; Manchidi 2009). In many of the
farm units included in this study, pigs received water only twice a day, while certain
piggeries only supplied water every other day. Limited access to water has negative effects
on the pig as it retards their growth potential and affects many other biochemical processes
resulting in conditions such as salt toxicity (Manchidi 2009). The greater the distance
between the household / production site and water source, the higher the probability of not
serving water regularly based on our estimation. Since about 45.06% of the farmers depend
on village streams or other distant sources for water, pigs reared under these conditions are
likely to suffer degrees of water deprivations. However, if a farmer will want to proceed
with regular supply of feed and water despite the distance between the farm and sources of
supplies, a higher capital cost will be incurred and realistic profitable operation will become
more difficult (Mabuza & Ngubane 2010).
Indeed, the South Africa pig industry is broadly classified into a dual market structure: the
high‐value markets (processors and supermarkets) for commercial pig farmers and the low‐
value markets (local auctions, pension point sales for the ESSPF). While the high‐value
markets pay premium price for quality products, the ESSPF get paid below the market
values for their pigs (Antwi & Seahlodi 2011). Study findings confirmed this assertion since
no coordinated pricing and standardized sale template exists for this category of farmers.
The use of extension services to improve sectoral marketing and possible formation into
cooperatives will be critical.

54
5.2 Spatio‐temporal analyses of movement variables
5.2.1 ASF as model of risk factors during movement of pigs to market
The results revealed interesting and important insights into the outbreak of pig diseases in
South Africa. Using ASF as a model, approximately 76.1% of all outbreaks originated from
Limpopo with direct links to another 21.1% of other outbreaks from Mpumalanga and
Gauteng. As seen in the 2012 ASF outbreak in Sundra (Mpumalanga) and the ASF spilling
over to Gauteng (Spencer 2012; Penrith et al 2014).This is indicative of the role that
Limpopo as an important disease node for pig diseases and it remains a huge vertex for
national dispersal of infections thus it should demand utmost attention. Due to economic
reasons, farmers will preferably market their pigs in Bronkhorstspruit abattoir and the
auction in Belfast (locations that were almost 400km away from certain farms); the
potential long distant spread of infection becomes real in an outbreak situation. These
should particularly appeal to national and provincial veterinary authorities to prioritize and
refocus surveillance and diagnostic efforts in the province with the aim of ensuring early
disease detection and implementation of control and eradication methods. It should be
noted that movement control policy exist and is maintained in South Africa but emergency
situations often challenge such policies.
There is a need for standing local emergency response teams in Limpopo that can readily
conduct active surveillance and do participatory epidemiology amongst the ESSPF. Since it
will appear that economic values of final products and not the distance to the nearest
abattoir are the main drivers for movement of pigs (see figure 8a & b, and 9 above), it would
be worthwhile to create suitable abattoirs and meat processing facilities within a 100km
radius of every district in Limpopo. This will reduce the risk of distant spread of infection
should there be an outbreak and aid in rapid disease control within a single province. It will
also become advantageous as the profit margins for farmer will increase by reducing the
cost of transportation. Motivation for good farming practice amongst the ESSPF may be
enhanced by the offer of valued pricing for pigs produced under an improved management
and biosecurity measure and certificated by the local veterinarians in such abattoirs as well
55
as government support system to enhance their operations (Fasina et al. 2010; Fasina et al
2012b; Logar 2014).
With regards to the districts under the province, certain patterns became evident;
Waterberg district have a total of 19/27 outbreaks (70.1%) reported from Limpopo. Since
the district is rich in private wildlife farms and conservation areas, it is expected that more
domestic animal‐wildlife interactions will exist and the tick host of the ASF virus,
Ornithodoros moubata porcinus may be present in abundance in the district (Arnot et al.
2009). There will be a need to do careful survey(s) of the district to confirm or disprove this
hypothesis as well as a need to maintain strict movement control and ensure double fencing
for all pig farms located within the district. Lephalale municipality contributed the majority
of the outbreaks in the district and historically this same municipality have made major
contributions to pig disease outbreaks in South Africa since the late 1920s. Another major
contributor to outbreaks is the Thabazimbi municipality (a major abattoir location).
Similarly, Musina municipality in Vhembe district as well as Phalaborwa (a town with an
abattoir) in Mopani district both contributed 75% of outbreaks arising from each districts.
Both locations share borders with the Kruger National Park. While ensuring continued
monitoring and effective surveillance in these locations, it will be critical to re‐evaluate the
role of the wildlife‐domestic animal interphase and its contribution to disease dynamics
within the border towns (Arnot et al. 2009).
Interestingly, no outbreak was reported from Capricorn and Greater Sekhukhune. In
Capricorn, local slaughter predominates and religious activities that shift preference away
from pork are keenly practised. This may have had some inadvertent degree of influence on
the control and circulation of pork products within the district with a consequent positive
outcome on disease control. The majority of the farmers within the district prefer local
slaughter and the fact that they can source a market in Polokwane, a major city within the
district, obviate the need to travel the long distances to other provinces. This becomes
beneficial in limiting the geographic dispersal of rapidly spreading transboundary animal
disease outbreaks since pork distribution is localised. Both Capricorn and Greater
Sekhukhune districts are also landlocked districts away from the parks and potentially they

56
may benefit from some degree of freedom from tick hosts and wildlife‐domestic animal
interactions. However, should there be an outbreak; potential local spread is a real
possibility for these districts.
The movement of pigs between farms and social interactions between contact networks
associated with pig farms are important factors in the transmission of infectious diseases
(Kao et al. 2007). This model has identified local slaughtering points and other abattoirs as
potential points with the greatest influence on disease dispersal. Strict anticipatory planning
should be implemented for these locations and supervised slaughtering should be
encouraged (Kao et al. 2007; Lindström et al. 2010).

57
CHAPTER 6: SUMMARY AND FUTURE RESEARCH
The Limpopo province is an important pig production area in terms of animal population
compared to other provinces and its involvement to transboundary animal diseases. It also
plays an important role in diseases associated with the domestic animal, human and wildlife
interface. Emerging Small‐Scale Pig Farmers in this province perceived pig production and
management as an important means of improving their livelihood and also as an alternative
investment option for the future. However, for these farmers to perform optimally, they
need to understand the basics of animal production, biosecurity and efficient production. In
this study, some factors that limit improvement in the efficiency of small‐scale pig farmers
have been identified and these include a lack of, or inadequate relevant pig farming
knowledge, finance and also a lack of proper records. Without records, it is difficult to
collect and evaluate critical production parameters and critically evaluate the financial
health of the farm.
Men dominate the pig farming activities in the province, while women and the youth are
under‐represented. Rural women are still faced with severe constraints in terms of access to
productive resources e.g access to land and funding. It is important for LDA to have a
strategy in place to alleviate constraints faced by women, as they make important
contributions to the livestock production and rural economies of this country. At the
moment, more research is still needed to determine the level and the nature the
contribution made by women. Empowerment of women in animal production still needs to
be evaluated and put high on government implementation agenda.
The youth prefer to look for salaried jobs in the urban areas. As we know South Africa at
large has more young people that are un‐employed, the intervention geared on helping
young people to farm effectively and profitably is encouraged, this will reduce youth
unemployment rate and also promotes rural development. Generational mix will ensure
coaching and mentoring by the older generation. Pig farming should be made fashionable to
be able to attract the youth, formation of youth cooperatives is imperative. The initiatives
like young female farmer awards as are reportedly implemented in the province should be a
model of success. Most of the farmers are married and are involved in farming activities as a

58
family; this is a very good model as pig production is very labour intensive. This has the
ability to encourage mentoring of the youth by family members involved in pig farming. It is
always better to be involved fulltime in farming, in that way monitoring and evaluation is
ensured. Generally most farmers are involved in more than one farming commodity but this
has a negative result as some commodities will suffer neglects and fail to perform
efficiently.
In the study, the majority of the farmers’ uses indigenous breeds, although these are
tolerant to the local environment, they are known to have difficulties in terms of reaching
production targets. The use exotic breeds are encouraged, there is literature to prove their
ability to reproduce and produce better although the cost of acquiring these breeds is a
drawback to most of emerging farmers. More research work is needed to evaluate the
production parameters of the indigenous breeds in South Africa.
Pigs need a proper housing infrastructure and facilities like proper farrowing crates and
heating facilities for the piglets without compromising the micro‐environment of the sow. It
is shown that the farrowing crate primarily reduces preweaning mortality by reducing the
sows’ ability to lie down quickly thereby crushing the piglets. Pig housing facilities is the
biggest expenditure of the whole operation and most of the time serves as a deterrent for
the farmers to start farming. The 2.47% of farmers that had received help from government
through CASP don’t have challenges with regards to facilities because their facilities are of a
high standard. CASP has also addressed production inputs in terms of acquiring exotic
breeds and some basic veterinary medicines for the supported units. The farmers who
received help need to be seen as a success model for the other pig farmers, being
independent and sustainable. However, the percentage of farmers that received support is
very small. It is recommended that good programmes like this be encouraged to reach more
committed farmers in the rural areas. The selection model also needs to be transparent and
address the needs of the farmers who have already started with their farming operation.
Good husbandry is central to improved production and profitability as most of the farmers
had between 1‐10 sows producing 4.8 litters/sow/year. Most of the farmers deliberately
reduced their sow numbers due to challenges related to acquiring feed in terms of their

59
inability to afford commercial feed. The rural pig farmers need to start taking responsibility
for their farming business ventures to ensure that it thrives despite all known difficulties.
They need to start putting basics together like proper biosecurity measures, vaccination of
their breeding stock against major reproductive diseases and reporting diseases to their
nearest State veterinary offices in their district municipalities. The veterinarians play an
important role in advising on issues of pig herd health, production and management.
Knowledge has been identified as one of the essential factors causing ESSPF to
underperform and therefore a well‐coordinated veterinary extension service is of
paramount importance to the success of these farmers. The veterinary services should
prioritise pig farm production by having a plan and strategies in place to ensure that
veterinarians and para‐veterinarians are a part of a strategy to grow farmers and also help
reduce the impact of pig diseases. Adoption of this key result area should be measurable
and also evaluated all the time.
Resources in terms of transport and equipped personnel need to be channelled to this
purpose and the veterinary officials need regular specialised training on pig production to
be able to deliver a quality veterinary extension service. This involvement and participation
of veterinary officials will help to reduce the outbreaks of transboundary diseases which
threaten food security, food safety, and mostly affect the livelihood of rural communities
with a more damaging effect on local and international trade. The outbreak of
transboundary diseases threaten the pig industry and can cause huge economic losses to
both producers and the economy.
The veterinary officials should share practical knowledge and train farmers to raise their pigs
successfully and to apply simple processing techniques to produce various pork products.
This increases the value of the commodity and enables small‐scale farmers to sell pig
products within a reasonable time. They also need to transfer knowledge on how to reduce
pre‐weaning mortalities that is associated with crushing and chilling and also encourage
provision of heating facilities to allow piglets to use their energy to grow rather than using
energy to heat up their bodies.

60
Feeding of kitchen remnants from hospitals, schools and public gathering is an issue of
concern and calls for research on how best rural pigs could be fed within minimum costs
and also ensuring that basic nutrient requirements are met. This kind of feed is assumed to
have a negative effect on reproduction and production targets of the piggery, and also can
predispose pigs to exotic diseases like ASF and PRRS. South African regulations stipulates
that all swill feed needs to be adequately heat treated but experience has shown that this is
not done, hence the risk of spreading diseases.
A lack of pricing models is still a concern as this is tantamount to manipulation, and
economic inefficiency. These farmers need to travel long distances to transport their pigs,
increasing their transport costs but also reducing their profit margins. Those farmers failing
to sell pigs at abattoirs and auctions resort to local pension points, with some allowing
buyers to come collect pigs on their properties, consequently predisposing them to
biosecurity and theft risk. Prices depend on age or size, time or situation of the farmer and
this means small‐scale pig farmers have little say on the price of their product, basically
being price takers. Based on the above information, government and industry are urged to
help facilitate creation of pig slaughter facilities within the province as this will be an aid to
reduce transport costs and also encourage the farmers participation in the pig industry,
dealing with the triple challenges of poverty, unemployment and inequality. It will be
advisable to have affordable slaughter facilities within a 100km radius of the districts or
major towns to cater for the needs of ESSPF in Limpopo. These will assist in the slaughter of
other species as well.
The veterinary services in the province, South African Pork Producers Organisation (SAPPO),
the industry, teaching and research institutions need to engage each other on how to train,
mentor, coach and support ESSPF in the province, with the aim of improving their livelihood,
food security and safety. This dream of ensuring that emerging farmers become
commercially viable is attainable through unity, moral responsibility and scientific research.

61
CHAPTER7:REFERENCES
1. Alawneh, J.I., Barnes, T.S., Parke, C., Lapuz, E., David, E., Basinang, V., Baluyut, A., Villar, E.,
Lopez, E.L. & blackall, P.J., 2014, ´ Description of the pig production systems, biosecurity
practices and herd health providers in two provinces with high swine density in the
Philippines`. Preventive Veterinary Medicine, 114:73‐87.
2. Anon, 2014, ´Women, patriarchy and land reform in South Africa`. Chapter 10. Available
at: http://wiredspace.wits.ac.za/bitstream/handle/10539/275/22_chapter10.pdf?
Sequence=22. Accessed on 06 March 2014.
3. Antwi, M. & Seahlodi, P., 2011, 'Marketing constraints facing emerging small‐scale pig
farmers in Gauteng Province', South Africa Journal of Human Ecology 36, 37‐42.
4. Arends, J.J., Stanislaw, C.M. & Gerdon, D., 1990, ´Effects of sarcoptic mange on lactating
swine and growing pigs`. Journal of Animal Science, 68:1495‐1499.
5. Arnot, L.F., Toit, J.T.D. & Bastos, A.D.S., 2009, 'Molecular monitoring of African swine
fever virus using surveys targeted at adult Ornithodoros ticks: a re‐evaluation of Mkuze
game reserve, South Africa', Onderstepoort Journal of Veterinary Research 76, 385‐392.
6. Bless, C. & Higson‐Smith, C., 2000, ´Fundamentals of social research methods: An
African Perspective`, 3rd ed. Cape Town: Juta.
7. Boshoff, C.I., Bastos, A.D.S., Gerber, L.J. & Vosloo, W., 2007, 'Genetic characterisation of
African swine fever viruses from outbreaks in Southern Africa (1973–1999)', Veterinary
Microbiology 121, 45‐55.
8. Carrington, C. A. P., 2004, ´Applied Ethology of Pigs`. Department of Production Animal
Studies, Faculty of Veterinary Science Onderstepoort, University of Pretoria lecture
note.
9. Chambers, R., Pacey. A. & Thrupp, L, A., 1993, ´Farmer first: Farmer Innovation and
Agricultural Research`, 4:1989 ‐ 218.
10. Chaminuka, P., Senyolo, G.M., Makhura, M.N. & Belete, A., 2008, ´A factor analysis of
access to and use of service infrastructure amongst emerging in South Africa,
http://dx.doi.org/10.1080/03031853.2008.9523805 ed. agrekon: agrekon: Agricultural
Economics Research, policy and practice in Southern Africa.
11. Chikazunga, D., Joordan, D., Biénabe E. & Louw A., 2007, ´Patterns of restructuring food
markets in South Africa: the case of fresh produce supply chains`, Ghana ed. Pretoria,

62
South Africa: Department of Agricultural Economics, Extension and Rural development,
University of Pretoria, South Africa.
12. Cross C. & Hornby D., 2002, ´Opportunities and obstacles to women’s land access in
South Africa’, Available at: file:///c:/users/user/downloads/landgender.pdf accessed on
06 March 2014.
13. DAFF, 2012. A profile of the South African pork market value chain.
14. DAFF, 2013.Strategic Plan 2013/14–2017/18, accessed on the 2014/09/28.
www.daff.gov.za/doadev/daff%20strategic%20plan%202013.pdf.
15. DAFF, 2014, 'Data on African swine fever outbreaks in South Africa from Jan 1993 to
April 2014', available at: http://www.nda.agric.za/ vetweb/epidemiology/
disease%20database/oiedata/oie_query.asp?cmbfromyear=1993&cmbfrommonth=01
&cmbtoyear=2012&cmbtomonth=01&sprovince=&sdistrict=&sdisease=a120&sspecies=
accessed on 10 April 2014.
16. De Kock, G., Robinson, E.M. & Keppel, J.J.G., 1940, 'Swine fever in South Africa',
Onderstepoort Journal of Veterinary Science and Animal Industry, 14, 31‐93.
17. Dietze, K., 2011, Pigs for prosperity, in diversification booklet number 15 Rome: Food
and Agriculture Organization of the United Nations: 58.
18. Evans, P., 2012, 'African swine fever: Sundra outbreak update', 6 May 2012, Porcus
April/May 2012, pp9.
19. Fasina, F.O., Shamaki, D., Makinde, A.A., Lombin, L.H., Lazarus, D.D., Rufai, S.A., Adamu,
S.S., Agom, D., Pelayo, V., Soler, A., Simón, A., Adedeji, A.J., Yakubu, M.B., Mantip, S.,
Benshak, A.J., Okeke, I., Anagor, P., Mandeng, D.C., Akanbi, B.O., Ajibade, A.A.,
Faramade, I., Kazeem, M.M., Enurah, L.U., Bishop, R., Anchuelo, R., Martin, J.H.,
Gallardo, C., 2010, 'Surveillance For African Swine Fever In Nigeria, 2006–2009',
Transboundary and Emerging Diseases 57, 244–253.
20. Fasina, F.O., Lazarus, D.D., Spencer, B.T., Makinde, A.A. & Bastos, A.D.S., 2012a, 'Cost
implications of African swine fever in smallholder farrow‐to‐finish units: economic
benefits of disease prevention through biosecurity', Transboundary and Emerging
Diseases 59, 244‐255.
21. Fasina, F.O., Agbaje, M., Ajani, F.L., Talabi, O.A., Lazarus, D.D., Gallardo, C., Thompson,
P.N. & Bastos, A.D.S., 2012b, 'Risk factors for farm‐level African swine fever infection in

63
major pig‐producing areas in Nigeria, 1997–2011', Preventive Veterinary Medicine 107,
65‐75.
22. Fasina, F.O., 2012, ´Personal communication. Onderstepoort`.
23. Food and Agriculture Organisation, 2010, ´Good practices for biosecurity in the pig
sector ‐ issues and options in developing and transition countries`. Rome, FAO Animal
Production and Health Paper
24. Food and Agriculture Organisation, 2013, 'African swine fever in the Russian federation:
risk factors for Europe and beyond`. Empress Watch, vol. 28 may 2013, available at:
www.fao.org/ag/empres.html, accessed on 27 April 2014.
25. Groenewald, J.A., 2003, ´Conditions for successful land reform in Africa`, Paper
presented at Pre‐IAAE Conference on African, Agricultural Economics, Bloemfontein,
South Africa, August 13‐14, 2003.
26. Groenewald, T., 2004, ´Towards a definition fro cooperative education`, in R.K. Coll & C.
Eames, C. (eds.), in international handbook for cooperative education: an international
perspective of the theory, research and practice of work‐integrated learning, edited by
in R.K. Coll & C. Eames, C. (eds.), Boston: ma: world association for cooperative
education.: 17‐25.
27. Halimani, T.E., Muchadeyi, F.C., Chimonyo, M. & Dzama, K., 2010, ´Pig genetic resource
conservation: the Southern African perspective`. Ecological Economics, 69:944‐951.
28. Hernández‐Jover, M., Gilmour, J., Schembri, N., Sysak, T., Holyoake, P.K., Beilin, R. &
Toribio, J.L.M.L., 2012, ´Use of stakeholder analysis to inform risk communication and
extension strategies for improved biosecurity amongst small‐scale pig producers`.
Preventive Veterinary Medicine, 104:258‐270.
29. Ilukor, J., Nielsen, T. & Birner, R., 2014, Determinants of referrals from
paraprofessionals to veterinarians in Uganda and Kenya`. Preventive Veterinary
Medicine, http://dx.doi.org/doi:10.1016/j.prevetmed.2014.02.009
30. Ironkwe, M.O. & Amefule. K.U., 2008, ´Appraisal of indigenous pig production and
management practices in rivers State`, Nigeria, 8:1‐7.
31. Jiang, K., Ediger, D. & Bader, D. A., 2009, 'Generalising k‐betweeness centrality using
short paths and a parallel multithreaded implementation', available at: Error! Hyperlink
reference not valid.. Proceedings of the international conference on parallel processing,
Vienna, Austria, September 22‐ 25.

64
32. Jones, B. A., Grace, D., Kock, R., Alonso, S., Rushton, J., Said, M.Y., Mckeever, D., Mutua,
F., Young, J., Mcdermott, J. & Pfeiffer, D.U., 2013, ´Zoonotic emergence linked to
agricultural intensification and environmental change`. Proceedings of the national
academy of science of the USA 110 (21), 8399‐8404.
33. Jori, F., Vosloo, W., Plessis, B.D., Bengis, R., Brahmbhatt, D., Gummow, B. & Thomson
GR., 2009, 'A qualitative risk assessment of factors contributing to foot and mouth
disease outbreaks in cattle along the western boundary of the Kruger national park',
Revue Scientifique Et Technique ‐ Office International Des Epizooties 28, 917‐931. doi:
10.1111/j.1865‐1682.2008.01059.x. ... 17: Perry BD, Gleeson LJ, Khounsey S, Bounma P,
Blacksell
34. Kalabamu, F., 2006, ´ Patriarchy and women's land rights in Botswana`. Land Use Policy,
23:237‐246.
35. Kammersgaard, T.S., Pedersen, L.J. & Jorgensen, E., 2011, ´Hypothermia in neonatal
piglets: interactions and causes of individual differences`. Journal of Animal Science,
89:2073‐2085.
36. Kao, R.R., Green, D.M., Johnson, J. & Kiss, I. Z., 2007, ‘Disease dynamics over very
different time‐scales: foot‐and‐mouth disease and scrapie on the network of livestock
movements in the UK’, Journal of the Royal Society Interface 4, 907‐916.
37. Kirsten, J.F. & Van Zyl, J., 1998, ´Defining small scale farmers in South African context`,
ageconsearch.umn.edu/.../26%20kirsten%20%26%20van%20zyl%2 ed. Agrekon.
38. Korennoy, F.I., Gulenkin, V.M., Malone, J.B., Mores, C.N., Dudnikov, S.A. & Stevenson,
M.A., 2014, 'Spatio‐temporal modeling of the African swine fever epidemic in the
Russian Federation, 2007–2012', Spatial and Spatio‐Temporal Epidemiology,
doi:10.1016/j.sste.2014.04.002.
39. Leedy, P. & Ormrod, J., 2004, ´ Practical research: planning and design`, 8th ed. New
York: Prentice hall.
40. Lindström, T., Sisson, S.A., Nöremark, M., Jonsson, A. & Wennergren, U., 2009,
'Estimation of distance related probability of animal movements between holdings and
implications for disease spread modelling', Preventive Veterinary Medicine 91, 85‐94.
41. Lindström, T., Sisson, S.A., Lewerin, S.S. & Wennergren, U., 2010, 'Estimating animal
movement contacts between holdings of different production types', Preventive
Veterinary Medicine 95, 23‐31.

65
42. Logar, B., 2014, 'Future animal health regulation: a step forward to a better
biosecurity`, A presentation at the nordic‐baltic veterinary contingency group
"biosecurity, experiences, training, motivation and economic aspects". 6‐8 may, 2014,
Johannesbergs Castle, Sweden. Available at: http://www.jordbruksverket.se/download/
18.37e9ac46144f41921cdeb57/1399627544437/i+2,+barbara+logar,+kom.pdf.
43. Lubungu, M , Chapoto, A., Tembo, G., 2012, ´Smallholder farmers participation in
livestock markets: the case of Zambian farmers`. 26a Middleway, Kabulonga, Lusaka,
Zambia.
44. Mabuza, M.L. & Ngubane, T.P., 2010, ´Factors influencing investment in commercial pig
production on Swazi nation land`. Bulletin of Animal Health and Production in Africa,
58:79‐87.
45. Manchidi, M.J., 2009, ´An evaluation of small‐scale piggeries in Limpopo province,
South Africa`, unpublished thesis for Master of Philosophy University of Stellenbosch:
Stellenbosch.
46. Martinez‐Lopez, B., Perez, A.M. & Sanchez‐Vizcaino, J.M., 2009, 'Combined application
of social network and cluster detection analyses for temporal‐spatial characterization of
animal movements in Salamanca, Spain', Preventive Veterinary Medicine 91, 29‐38.
47. Mashala, P., 2012, ´Helping small‐scale pig farmers in farmers weekly`.
48. Mergenthaler, M., Weinberger, K. & Qaim, M., 2009,´ The food system transformation
in developing countries: a disaggregate demand analysis for fruits and vegetables in
Vietnam,` Food Policy, 34:426‐436.
49. Mockshell J, Ilukor J, Birner R., 2014, ´Providing animal health services to the poor in
Northern Ghana: Rethinking the role of community animal health workers`. Tropical
Animal Health and Production, 46:475‐480.
50. Mokoele, J.M., Spencer, B.T., van Leengoed, L.A.M.G. Fasina, F.O., 2014, 'Efficiency
indices and indicators of poor performance among emerging small scale pig farmers,
Limpopo, South Africa', Onderstepoort Journal of Veterinary Research 81(1), Art. #774,
9 pages. http:// dx.doi.org/10.4102/ojvr.v81i1.774
51. Montshwe, B.D., 2006, ´Factors affecting participation in the mainstream cattle markets
by small scale cattle farmers in South Africa`, unpublished MSc Agric Thesis: University
of Free State, Bloemfontein.

66
52. Nath, B.G., Pathak, P.K., Ngachan, S.V., Tripathi, A.K. & Mohanty, A.K., 2013,
´Characterization of smallholder pig production system: productive and reproductive
performances of local and crossbred pigs in Sikkim Himalayan region`, Tropical Animal
Health and Production, 45:1513‐1518.
53. National Department of Agriculture, 2006, ´Crops and markets, Pretoria: Directorate
Agricultural Information Services. https://www.senwes.co.za/Crops_and_Markets_
4th_Quarter_2011.pdf Jan 24, 2012 ‐ Issued by the Directorate Statistics and Economic
Analysis.
54. Ngqangweni, S.S., 2000, ´Promoting income and employment growth in the rural
economy of the Eastern Cape through smallholder agriculture`, unpublished PhD thesis
University of Pretoria, Pretoria.
55. Oladele, O.I., Antwi, M.A. & Kolawole, A.E., 2013, ´Knowledge of biosecurity among
livestock farmers along border villages of South Africa and Namibia`. International
Journal of Applied Research in Veterinary Medicine, 11:123‐129.
56. Pastrana, M.E.O., Brito, R.L., Nicolino, R.R., De Oliveira, C.S.F. & Haddad, J.P.A., 2014,
'Spatial and statistical methodologies to determine the distribution of dengue in
Brazilian municipalities and relate incidence with the health vulnerability index', Spatial
and Spatio‐Temporal Epidemiology, doi:10.1016/j.sste.2014.04.001.
57. Paul, S. & Dasgupta, A., 2012, 'Spatio‐temporal analysis to quantify urban sprawl using
Geoinformatics', International Journal of Advances in Remote Sensing and Gis 1, 234‐
248. www.jrsgis.com/articlefiles/vol1issue32013/JRSGIS12023.pdf.
58. Pedersen, L.J., Malmkvist, J., Kammersgaard, T. & Jogensen, E., 2012, ´Avoiding
hypothermia in neonatal pigs: effect of duration of floor heating at different room
temperature`, Journal of Animal Science, 91(1):425‐432.
59. Penrith, M‐L. & Vosloo, W., 2009, 'Review of African swine fever: transmission, spread
and control', Journal of the South African Veterinary Association 80(2), 58–62.
http://dx.doi.org/10.4102/jsava.v80i2.172.
60. Penrith, M.L., Voslo, W. & Mather, C., 2011, Classical swine fever (hog cholera): review
of aspects relevant to control. Transboundary and Emerging Diseases, 58:187‐196.

67
61. Penrith, M‐L., 2013, 'History of "swine fever" in Southern Africa', Journal of the South
African Veterinary Association 84(1), 1106, 6. http://dx.doi.org/
10.4102/jsava.v84i1.1106.
62. Penrith, M‐L. & Spencer, B T., 2014, 'The South African way of dealing with ASF' Pig
Progress 30(3), (March 7) 2014.
63. Perry, B.D., Grace, D., Sones, K., 2013, 'Current drivers and future directions of global
livestock disease dynamics', Proceedings of the National Academy of Science of the USA
110(52), 20871‐20877. doi: www.pnas.org/cgi/doi/10.1073/pnas.1012953108.
64. Pretorius, G., 2007, Meadow feeds,´ factors influencing nutrient requirements in pigs `,
65. Rivas, A.L., Chowell, G., Schwager, S.J., Fasina, F.O., Hoogesteijn, A.L., Smith, S.D.,
Bisschop, S.P.R., Anderson, K.L. & Hyman, J.M., 2010, 'Lessons from Nigeria: the role of
roads in the geo‐ temporal progression of the avian influenza (h5n1)', Epidemiology and
Infection 138, 192–198. doi: 10.1017/s0950268809990495.
66. Rivas, A.L., Fasina, F.O., Hoogesteyn, A.L., Konah, S.N., Febles, J.L., Perkins, D.J., Hyman,
J.M., Fair, J.M., Hittner, J.B.S & Mith, S.D., 2012, 'Connecting network properties of
rapidly disseminating epizootics', plos one, 7(6): e39778.
doi:10.1371/journal.pone.0039778.
67. Sanchez‐Vizcaino, J.M., Mur, L. & Martinez‐Lopez, B., 2012, 'African swine fever: an
epidemiological update', Transboundary and Emerging Diseases 59(1), 27‐35.
68. SAPPO, 2011, Personal communication, Pretoria. Schembri, N., Hernandez‐Jover, M.,
Toribio, J.A.L.M.L. & Holyoake, P.K., 2013, ´Demographic and production practices of pig
producers trading at saleyards in Eastern Australia`, Australian Veterinary Journal,
91:507‐516.
69. Schembri, N., Hernandez‐Jover, M., Toribio, J.A.L.M.L. & Holyoake, P.K., 2013,
‘Demographic and production practices of pig producers trading at saleyards in eastern
Australia’, Australian Veterinary Journal 91, 507–516. http://dx.Doi.org/10.
1111/avj.12131.
70. Sekokotla M.J., 2012, ´Personal communication`, Nebo.Shankar, B. P., Madhusudhan, H.
S. & Harish. D. B., 2009. Pre‐weaning mortality in pig‐causes and management.
Veterinary World. 2(6): 236‐239.

68
71. Spencer, B.T., 2012, 'Rapid control of an 'abnormal' outbreak of African swine fever
outside the controlled ASF area', article eo‐222. Proceedings of the 22nd International
Pig Veterinary Society Congress, Jeju, Korea. pp296.
72. Spencer, B.T., 2014, ´Personal communication`, Onderstepoort, Pretoria.
73. Steyn, A.G.W., Smit, C.F., Du Toit S. H. C. & Strasheim. C., 1994, ´Modern statistics in
practice`, 1064 Acadia Street Hatfield Pretoria South Africa: van Schaik publishers.
74. Thrusfield, M., 1995, ´Veterinary epidemiology`, 2nd ed. London: Blackwell science
ltd.Turton, J., 1999, ´Assisting small‐scale farmers to produce healthy animals`,
Mpumalanga, South Africa ed. Onderstepoort: proceedings of an ATNESA workshop.
75. Turton, J., 2001, ´Skin condition in pigs. Directorate of communication`, Department of
Agriculture in cooperation with the ARC Onderstepoort Veterinary Institute.
76. Wilk, J., Andersson, L. & Warburton, M., 2013, ´Adaptation to climate change and other
Stressors among commercial and small‐scale South African farmers`, Regional
Environmental Change, 13:273‐286.

69
CHAPTER 8: LIST OF APPENDECISES
8.1 Appendix 1: Consent form and questionnaire
An investigation into the reasons resulting in poor production among the ESSPF of the
Limpopo Province of the Republic of South Africa
The University of Pretoria, Faculty of Veterinary Science is conducting an investigation into
the reasons resulting in poor production among the ESSPF of the Limpopo province of the
RSA.
You have been selected as one of our respondent to kindly answer the questions with your
consent and personal experience. The answers provided will be kept strictly confidential and
will be used for research and planning purposes. No personal details will be revealed.
Thank you for your cooperation.
Name and surname ……………………………………………………….……………….
Signature ………………………………………………………………………………………..
Date ……………………………………………………………………………………………...

70
A. Personal Information
1. Name and surname.........................................................................................................
2. Gender □ M □ F
3. Age category
A □ < 25 Years B □ 25 ‐ 35 Years C □ 35 ‐ 45 Years D □ 45 ‐ 55 Years
E □ 55‐65 Years F □ Other (specify)……………….……………………………………..
4. Marital status □ Single □ Married □ Divorced □ Widow
5. District municipality........................................................................................................
6. Local municipality............................................................................................................
7. Farm name…………….........................................................................................................
8. Farm geographic location and coordinates…………………………..…………………………..….…….
9. Do you own this land that you use for farming?
A □ Own land B □ Lease C □ Communal D □ Other (specify)………
……………………………………………………………………………………………………………………….………....
10. What is your level of participation in pig farming?
A □ Full‐time pig farmer B □ Part me pig farmer C □ Other (specify)
……………………………………………………………………………………………………………………………......
11. Do you have other people involved in farming?
A □ Son B □ Daughter C □ Family D □ Coopera ve E □ Employees
F □ Other (specify) ………...…………………………………………………………………………………………
12. What is your highest level of education?
A □ Primary school B □ High school C □ Matric D □ Graduate
E □ Other (specify) …………………………………………………………………………………….………….……

71
B. Management or Production
1. What kind of pigs do you have in your farm? A □ Duroc B □ Landrace
C □ Large White D □ Other (specify) ………………………….....................................……
2. How many sows do you have in your farm? ………….......................................................
3. What is the average number of days taken for the sows to return to heat after
weaning?
................................................................................................................................
4. How do you know that the sows are ready for mating? …………………………………..……….
5. How many boars do you have in your farm? .................................................................
6. How many female pigs did you replace in 2012? ……..………..........................................
7. What is the average number of piglets born per sow per year in 2012?
........................................................................................................................................
8. What is the average number of piglets born dead in 2012? ………...............................
9. What is the average number of piglets that died before weaning in 2012?
…………………………………………………………………………………………………….…………..………….......
10. Why did these piglets die before weaning?
A □ Laid on B □ Coldness C □ Diarrhoea D □ Dog eat
them E □ Other (specify) ……………………………………….………….……………………….…………..
11. Do you have a heat source for your piglets □ Yes □ No
12. If yes, how do you keep the piglets warm? A □ Infra ‐ red lamps B □ Heaters
C □ fire or coal D □ Other (specify) ……………………………………………………….…….
13. What is the average number of piglets weaned in 2012? ...........................................
14. What is the average number of pigs did you sell, slaughter or give away in 2012?
........................................................................................................................................
C. Health plan
1. Indicate disease complex experienced in your farm?
A □ Respiratory diseases complex B □ Enteric diseases or diarrhea C □ Skin
diseases D □ Lameness or muscular problems E □ Reproduc ve disease
F □ Other (specify) ………..……………………………………………………………………………………….…

72
2. Who do you contact in case of disease complex in your farm?
A □ Veterinarian B □ Animal Health Technician C □ Extension officers
D □ Coopera on E □ community leaders F □ Other (specify)……………………
3. What are the biosecurity measures that you have in your farm presently?
A □ Hand‐washing B □ Fence C □ Footbath D □ Change
overalls E □ Other (specify) ……………………………………………………………………….……..
4. Do you vaccinate your pigs? A □ Yes B □ No
5. If yes, which vaccines do you use in your farm? ……………...............................................
6. What medicine do you use to treat diseases in your farm?
A □ Penicillin B □ Teramycin C □ Ivermec n D □ Sulpha‐drugs
E □ Other (specify)….…………..…………………………………………………………………………………..…

73
D. Housing
1. Did you receive any financial help to build these pig houses?
A □ Yes B □ No
2. If yes, what kind of help did you receive? …………………………….…..……………………………….
3. How many farrowing pens do have in your farm? .........................................................
4. How many pens do you have for the boars? ..................................................................
5. How many pens do you have for the weaners? ………………………….……………………………..
6. How many pens do you have for the growers? …………………………..…………………………....
E. Feeding strategies
1. What type of feed do you feed your pigs?
A □ Bought feed B □ Vegetables C □ Mixed (Dry meal and Kitchen
food) D □ Kitchen food E □ Other (specify) ……………………………………..…..
2. Where do you buy your feed? ………………………………………………………………………………...…
3. What is the average amount of feed in Kilograms do you feed or give your pigs every
day?
3.1 Sows……………………………………………………………………………………………….……………….……
3.2 Boars ……………………………………………………………..………….…………………………………………
3.3 Weaners…………………………………………………………………….………………………………………...
3.4 Growers………………………………………………………………….…..………………………………………..
4. Where do you get water for the pigs?
A □ Own borehole B □ River or dam C □ Municipality water D □ Village
water E □ Other (specify) ………………………………………………………………………………......

74
F. Marketing strategy
1. Where did you sell the pigs in 2012?
A □ Aba oir B □ Supermarket or Butchery C □ Auc ons D □ Pension
points or local‐ market E □ other (specify) …………………………………………..……...…
2. How many pigs did you sell in 2012? .............................................................................
3. At which average age did you sell your pigs in 2012? ……….………………………………………
4. What was the average cost per pig at the market?
A □ R200‐R300 B □ R300‐R500 C □ R500‐R800 D□ R800‐R1200
E □ Other (specify) ……………………………………………………………..………………..……………………
5. How did you transport your pigs to the market? …………….………………………...………….….
A □ Own transport B □ Hired transport C □ Shared transport
D □ Other (specify) …………………………………………...……………………………………………………....
6. What is the distance between your piggery and the market?
A □ Less than 50 KM B □ 50‐150 KM C □ 150‐250 KM D □ 250‐500KM
E □ >500 KM F □ Other (specify) ……………………….……………………………………………………..
7. What was the average market transport cost in 2012? …………………………….……………….
Thank you for taking your time to fill this questionnaire. We rely on your feedback to help us identify the
challenges of ESSPF.

75
8.2 Appendix 2: Distance to slaughter
Distance to nearest road from farms that use local slaughter points
local sl Sec local sl natl
Farm number
Distance to nearest secondary road (m)
Distance to nearest national road (m)
67.67873 747.5419
2 67.678733 747.541916 629.4748 27284.16
5 629.474811 27284.16014 629.4748 27284.16
6 629.474811 27284.16014 814.7498 65702.15
15 814.749761 65702.14697 297.1282 9029.567
16 297.128215 9029.566705 862.6653 10896.09
25 862.665331 10896.09152 90.83715 40827.07
34 90.837154 40827.06681 6686.614 42148.32
35 6686.613834 42148.32094 90.83715 40827.07
36 90.837154 40827.06681 90.83715 40827.07
37 90.837154 40827.06681 6686.614 42148.32
39 6686.613834 42148.32094 6433.862 47274.59
40 6433.86201 47274.58987 6686.614 42148.32
41 6686.613834 42148.32094 3337.219 49779.79
48 3337.218713 49779.7898 4202.412 13649
49 4202.411605 13649.00256 2080.675 193.4174
52 2080.674934 193.417395 2080.675 193.4174
53 2080.674934 193.417395 67.69784 747.5316
54 67.697837 747.531597 4113.198 26097.44
66 4113.198022 26097.43876 1997.752 32301.71
67 1997.7519 32301.7088 2183.798 32239.39
69 2183.798408 32239.39371 1942.612 32425.06
70 1942.612273 32425.05527 2541.131 51636.09
74 2541.131155 51636.08994 416.3275 47500.08
75 416.32748 47500.08018 158.9503 56286.21
76 158.95026 56286.21351 158.9503 56286.21
77 158.95026 56286.21351 46.2614 52413.42
107 46.261395 52413.4176 1421.892 49271.7
108 1421.892149 49271.69661 147.1012 8888.587
109 147.101226 8888.58678 1456.753 57627.29
110 1456.752929 57627.28974 344.6611 9169.09
111 344.661093 9169.089983 175.2439 1317.889
112 175.243938 1317.888629 128.5551 9825.19
113 128.555131 9825.190457 697.7921 8547.521
114 697.792099 8547.520812 1361.727 6800.862
115 1361.727184 6800.861752 796.2758 670.6384
130 796.27575 670.638374 793.3888 13664.99
142 793.388789 13664.98985 1376.012 25805.3
143 1376.011759 25805.2955 1454.841 26273.17
144 1454.841259 26273.16507 1371.02 26530.44
145 1371.020331 26530.4373 1291.479 26242.28

76
146 1291.478745 26242.27697 1633.003 25872.72
147 1633.003489 25872.71817 629.4748 27284.16
148 629.474811 27284.16014 479.0285 54339.86
149 479.028491 54339.85879 305.6447 52835.13
150 305.644676 52835.13188 422.105 42394.43
151 422.105048 42394.42897 4109.656 36978.92
152 4109.656363 36978.92282 4639.029 23267.04
153 4639.028973 23267.03777 4292.259 3829.481
155 4292.259208 3829.480833 777.7755 28521.69
156 777.775506 28521.68773 422.105 42394.43
157 422.105048 42394.42897 422.105 42394.43
158 422.105048 42394.42897 422.105 42394.43
159 422.105048 42394.42897 1242.438 26670.24
160 1242.438396 26670.24328 1316.974 26283.17
161 1316.974256 26283.16919 1624.1 29727.06 m
1.6241 29.72706 km
Distance to nearest road from farms that use Bronkhorstspruit abattoir
Farm number
Distance to nearest secondary road (m)
Distance to nearest national road (m)
5449.517 74903.97
1 5449.517077 74903.97067 78.89617 37884.89
3 78.89617 37884.89158 1132.952 37605.4
4 1132.95248 37605.39598 3531.045 17232.44
17 3531.045028 17232.43711 887.4898 27051.16
18 887.489836 27051.1608 654.5293 13120.28
19 654.52933 13120.27582 887.4898 27051.16
20 887.489836 27051.1608 887.4898 27051.16
21 887.489836 27051.1608 887.4898 27051.16
22 887.489836 27051.1608 774.8494 26340.81
23 774.849381 26340.80756 654.5293 13120.28
24 654.52933 13120.27582 813.006 63920.85
26 813.006037 63920.8542 3838.499 51572.27
27 3838.498671 51572.26598 6712.298 143930.4
28 6712.297956 143930.4173 77.79852 79885.12
29 77.798522 79885.11566 6712.298 143930.4
30 6712.297956 143930.4173 6712.298 143930.4
31 6712.297956 143930.4173 241.0462 90088.97
32 241.04618 90088.96689 75.05403 90075.37
33 75.05403 90075.36586 871.7607 20539.67
38 871.760684 20539.66583 492.384 75310.44
42 492.383983 75310.43522 470.2078 53550.33
43 470.207821 53550.33057 1579.57 75130.89
44 1579.569732 75130.88973 133.1456 22767.43
45 133.145624 22767.4275 108.0866 137282.9
46 108.086636 137282.9032 871.7607 20539.67
47 871.760684 20539.66583 35.42302 13695.52
50 35.423023 13695.52125 35.42302 13695.52

77
51 35.423023 13695.52125 2207.149 109392.2
55 2207.148956 109392.231 2207.149 109392.2
56 2207.148956 109392.231 2207.149 109392.2
57 2207.148956 109392.231 2207.149 109392.2
58 2207.148956 109392.231 148.4575 85965.09
59 148.457464 85965.09218 492.384 75310.44
60 492.383983 75310.43522 2914.968 2676.227
61 2914.968318 2676.227371 378.9652 78958.46
62 378.965247 78958.45825 702.9361 73653.42
63 702.936076 73653.41551 79.19299 76876.95
64 79.192989 76876.94571 1171.922 77759.98
65 1171.921703 77759.97547 2680.629 3101.28
68 2680.629264 3101.280283 871.7607 20539.67
71 871.760684 20539.66583 1544.225 14949.83
72 1544.225338 14949.82871 8604.836 90712.11
73 8604.836499 90712.10814 823.4069 201289.1
78 823.406879 201289.1182 338.5437 69279.51
79 338.543738 69279.51359 338.5437 69279.51
80 338.543738 69279.51359 338.5437 69279.51
81 338.543738 69279.51359 3419.771 67966.61
82 3419.771036 67966.61492 1743.326 62785.08
83 1743.326129 62785.08162 6026.68 93156.67
84 6026.680328 93156.66835 220.4716 77607.47
85 220.471604 77607.46808 1743.326 62785.08
86 1743.326129 62785.08162 13492.46 115188.3
87 13492.45759 115188.3014 9007.328 124461.8
88 9007.328418 124461.832 13961.58 118950.8
89 13961.58379 118950.8248 9007.328 124461.8
91 9007.328418 124461.832 3518.888 49919.45
92 3518.88802 49919.44592 3518.888 49919.45
93 3518.88802 49919.44592 8188.648 82741.87
94 8188.648077 82741.874 669.6519 64063.11
95 669.651918 64063.10818 9007.328 124461.8
96 9007.328418 124461.832 4257.124 112453.7
97 4257.124499 112453.6849 1201.065 111592.5
98 1201.065313 111592.5454 1660.72 97092.12
99 1660.719902 97092.11647 358.1994 95598.16
100 358.199354 95598.16101 2876.103 48839.11
101 2876.10334 48839.11353 4120.3 105887.4
102 4120.300442 105887.3649 2010.727 100184.9
103 2010.726601 100184.867 90.93129 111558.2
104 90.931292 111558.2313 4120.3 105887.4
105 4120.300442 105887.3649 424.7023 112155.4
106 424.70226 112155.4328 796.6414 57930.03
116 796.641417 57930.02961 1052.35 60623.6
117 1052.349999 60623.6011 35.42302 13695.52

78
118 35.423023 13695.52125 783.898 112575.8
119 783.897988 112575.7869 4266.299 92942.84
120 4266.299428 92942.84409 2765.871 79722.45
122 2765.870887 79722.45236 2796.635 79758.61
123 2796.635165 79758.60558 10936.99 91707.97
124 10936.98784 91707.96778 265.3772 65081.52
133 265.377239 65081.5239 265.3772 65081.52
134 265.377239 65081.5239 10936.99 91707.97
136 10936.98784 91707.96778 10936.99 91707.97
137 10936.98784 91707.96778 10936.99 91707.97
138 10936.98784 91707.96778 13008.79 89360.11
139 13008.78815 89360.11486 10936.99 91707.97
140 10936.98784 91707.96778 8037.777 55705.78
162 8037.776586 55705.78051 2789.525 79762.28
163 2789.524669 79762.27766 3091.58 74385.88 m
3.09158 74.38588 km
Distance to nearest road from farms that use Phalaborwa abattoir
Farm number
Distance to nearest secondary road (m)
Distance to nearest national road (m)
813.006 63920.85
26 813.006037 63920.8542 3838.499 51572.27
27 3838.498671 51572.26598 6712.298 143930.4
28 6712.297956 143930.4173 77.79852 79885.12
29 77.798522 79885.11566 6712.298 143930.4
30 6712.297956 143930.4173 6712.298 143930.4
31 6712.297956 143930.4173 241.0462 90088.97
32 241.04618 90088.96689 75.05403 90075.37
33 75.05403 90075.36586 108.0866 137282.9
46 108.086636 137282.9032 8604.836 90712.11
73 8604.836499 90712.10814 823.4069 201289.1
78 823.406879 201289.1182 338.5437 69279.51
79 338.543738 69279.51359 338.5437 69279.51
80 338.543738 69279.51359 338.5437 69279.51
81 338.543738 69279.51359 3419.771 67966.61
82 3419.771036 67966.61492 1743.326 62785.08
83 1743.326129 62785.08162 6026.68 93156.67
84 6026.680328 93156.66835 220.4716 77607.47
85 220.471604 77607.46808 1743.326 62785.08
86 1743.326129 62785.08162 13492.46 115188.3
87 13492.45759 115188.3014 9007.328 124461.8
88 9007.328418 124461.832 13961.58 118950.8
89 13961.58379 118950.8248 9007.328 124461.8
91 9007.328418 124461.832 3518.888 49919.45
92 3518.88802 49919.44592 3518.888 49919.45
93 3518.88802 49919.44592 8188.648 82741.87
94 8188.648077 82741.874 669.6519 64063.11
95 669.651918 64063.10818 9007.328 124461.8

79
96 9007.328418 124461.832 4257.124 112453.7
97 4257.124499 112453.6849 1201.065 111592.5
98 1201.065313 111592.5454 1660.72 97092.12
99 1660.719902 97092.11647 358.1994 95598.16
100 358.199354 95598.16101 2765.871 79722.45
122 2765.870887 79722.45236 2796.635 79758.61
123 2796.635165 79758.60558 10936.99 91707.97
124 10936.98784 91707.96778 265.3772 65081.52
133 265.377239 65081.5239 265.3772 65081.52
134 265.377239 65081.5239 10936.99 91707.97
136 10936.98784 91707.96778 10936.99 91707.97
137 10936.98784 91707.96778 10936.99 91707.97
138 10936.98784 91707.96778 13008.79 89360.11
139 13008.78815 89360.11486 10936.99 91707.97
140 10936.98784 91707.96778 2789.525 79762.28
163 2789.524669 79762.27766 4728.222 92952.76 m
4.728222 92.95276 km
Distance to nearest road from farms that use Thabazimbi abattoir
Farm number
Distance to nearest secondary road (m)
Distance to nearest national road (m)
4.97732 67090.22
8 4.97732 67090.21782 1372.15 5525.898
9 1372.150383 5525.898142 292.102 67577.39
10 292.10204 67577.39292 292.102 67577.39
11 292.10204 67577.39292 5096.994 1485.268
12 5096.99393 1485.26761 155.2738 10019.87
13 155.273788 10019.87438 31.99545 3497.135
14 31.995453 3497.135174 7713.113 5540.085
125 7713.113247 5540.08531 3807.584 1221.212
126 3807.584009 1221.211977 38.09664 11310.41
127 38.096637 11310.40616 105.7052 12037.47
128 105.705208 12037.46843 378.6247 31800.94
129 378.624747 31800.94075 239.1469 31540.28
131 239.146878 31540.27882 1450.477 116209.3
132 1450.476736 116209.2907 506.733 115360.3
154 506.733043 115360.252 1450.477 116209.3
164 1450.476736 116209.2907 1450.477 116209.3
165 1450.476736 116209.2907 1434.472 45894.81 m
1.434472 45.89481 km

80
8.3 Appendix 3: Connectivity between municipalities
Graph Metrics
Other Columns
Vertex Subgraph
Degree
In‐Degree
Out‐Degree
Betweenness Centrality
Closeness Centrality
Eigenvector Centrality
PageRank
Clustering Coefficient
Reciprocated Vertex Pair Ratio
Add Your Own Columns Here
geographic (latitude) South
geographic ( longitude) East
To Auction Market (Entity 1)
To Slaughter Market 2 (Entity 3)
aganang 1 0.000
0.077
0.063
0.606
0.000
‐23.5913
29.1088
local slaughter points
7 21.000
0.143
0.063
3.757
0.000
diffuse around 5km radius
diffuse around 5km radius
Belfast
tzaneen 1 0.000
0.077
0.063
0.606
0.000
‐23.92722222
30.25263889
Phalaborwa
7 21.000
0.143
0.063
3.757
0.000
‐25.805
28.74638889
Belfast
Bronkhorstspruit
thabazimbi
1 0.000
0.111
0.000
0.632
0.000
‐24.61888889
27.38527778
Thabazimbi
5 10.000
0.200
0.000
2.838
0.000
‐24.6 27.4 Belfast
mokopane
1 0.000
0.111
0.000
0.632
0.000
‐23.5923
28.387
mogalakwena
1 0.000
0.111
0.000
0.632
0.000
‐23.6634
28.7195
giyani 1 0.000
0.077
0.063
0.606
0.000
‐23.31
30.70638889
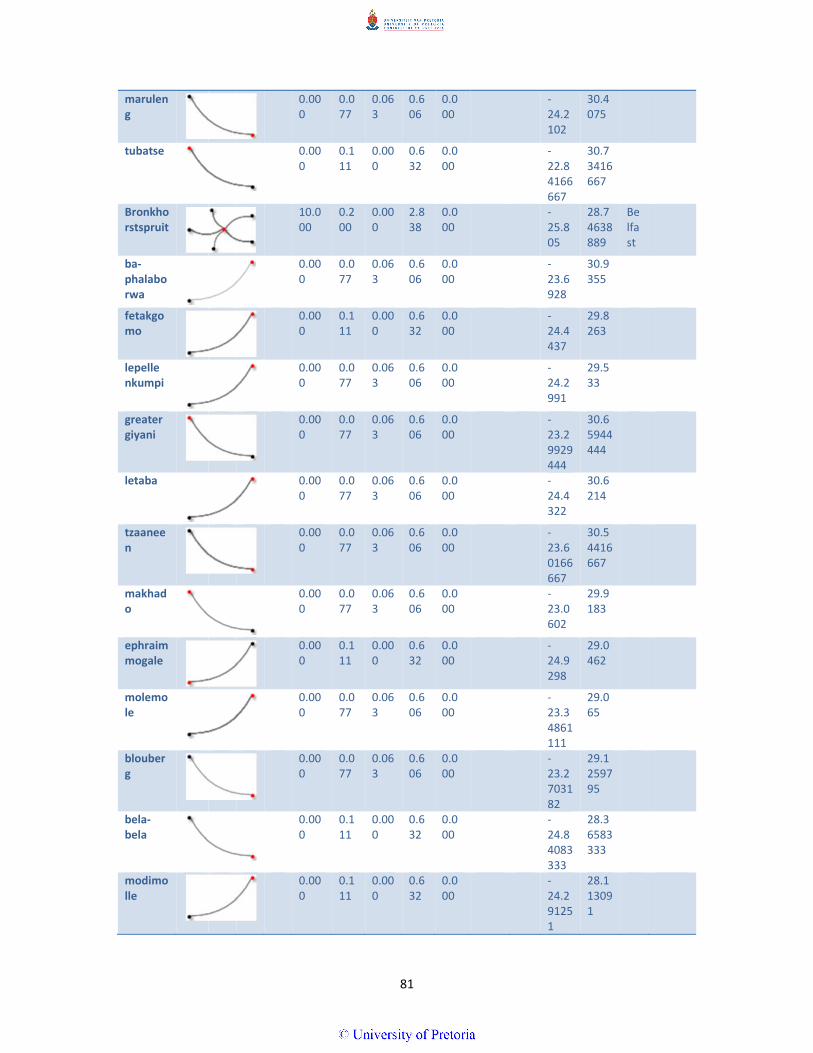
81
maruleng
1 0.000
0.077
0.063
0.606
0.000
‐24.2102
30.4075
tubatse 1 0.000
0.111
0.000
0.632
0.000
‐22.84166667
30.73416667
Bronkhorstspruit
5 10.000
0.200
0.000
2.838
0.000
‐25.805
28.74638889
Belfast
ba‐phalaborwa
1 0.000
0.077
0.063
0.606
0.000
‐23.6928
30.9355
fetakgomo
1 0.000
0.111
0.000
0.632
0.000
‐24.4437
29.8263
lepelle nkumpi
1 0.000
0.077
0.063
0.606
0.000
‐24.2991
29.533
greater giyani
1 0.000
0.077
0.063
0.606
0.000
‐23.29929444
30.65944444
letaba 1 0.000
0.077
0.063
0.606
0.000
‐24.4322
30.6214
tzaaneen
1 0.000
0.077
0.063
0.606
0.000
‐23.60166667
30.54416667
makhado
1 0.000
0.077
0.063
0.606
0.000
‐23.0602
29.9183
ephraim mogale
1 0.000
0.111
0.000
0.632
0.000
‐24.9298
29.0462
molemole
1 0.000
0.077
0.063
0.606
0.000
‐23.34861111
29.065
blouberg
1 0.000
0.077
0.063
0.606
0.000
‐23.2703182
29.1259795
bela‐bela
1 0.000
0.111
0.000
0.632
0.000
‐24.84083333
28.36583333
modimolle
1 0.000
0.111
0.000
0.632
0.000
‐24.291251
28.113091

82
polokwane
1 0.000
0.077
0.063
0.606
0.000
‐24.17611111
29.47236111
elias motsoaledi
1 0.000
0.111
0.000
0.632
0.000
‐24.30694444
29.70236111
musina 1 0.000
0.077
0.063
0.606
0.000
‐22.33805556
30.04166667
makhukhuduthamaga
1 0.000
0.111
0.000
0.632
0.000
‐24.6956
29.7321