rebuilding for our future
TRANSCRIPT
2022 BUDGET PROPOSAL City of Saint Paul Mayor Melvin Carter
REBUILDING FOR OUR FUTUREREVITALIZATION AND SUSTAINABILITY FOR ALL OF US
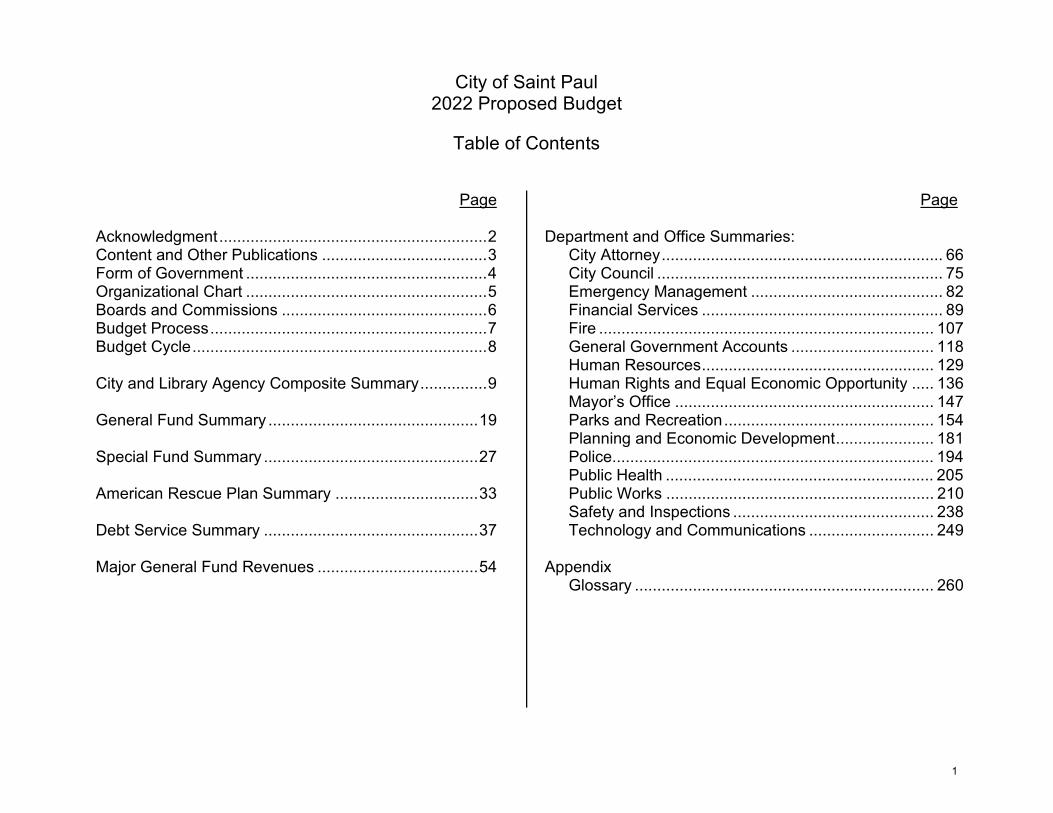
City of Saint Paul 2022 Proposed Budget
Table of Contents
Page
Acknowledgment ............................................................ 2 Content and Other Publications ..................................... 3 Form of Government ...................................................... 4 Organizational Chart ...................................................... 5 Boards and Commissions .............................................. 6 Budget Process .............................................................. 7 Budget Cycle .................................................................. 8
City and Library Agency Composite Summary ............... 9
General Fund Summary ............................................... 19
Special Fund Summary ................................................ 27
American Rescue Plan Summary ................................ 33
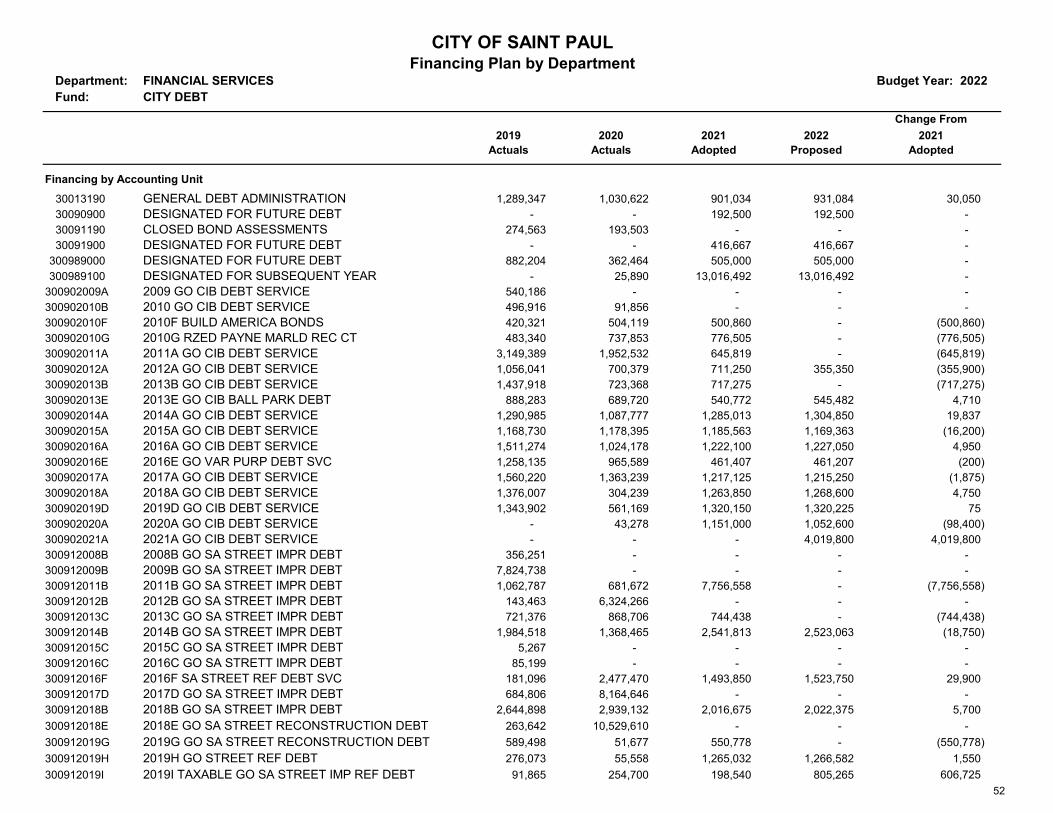
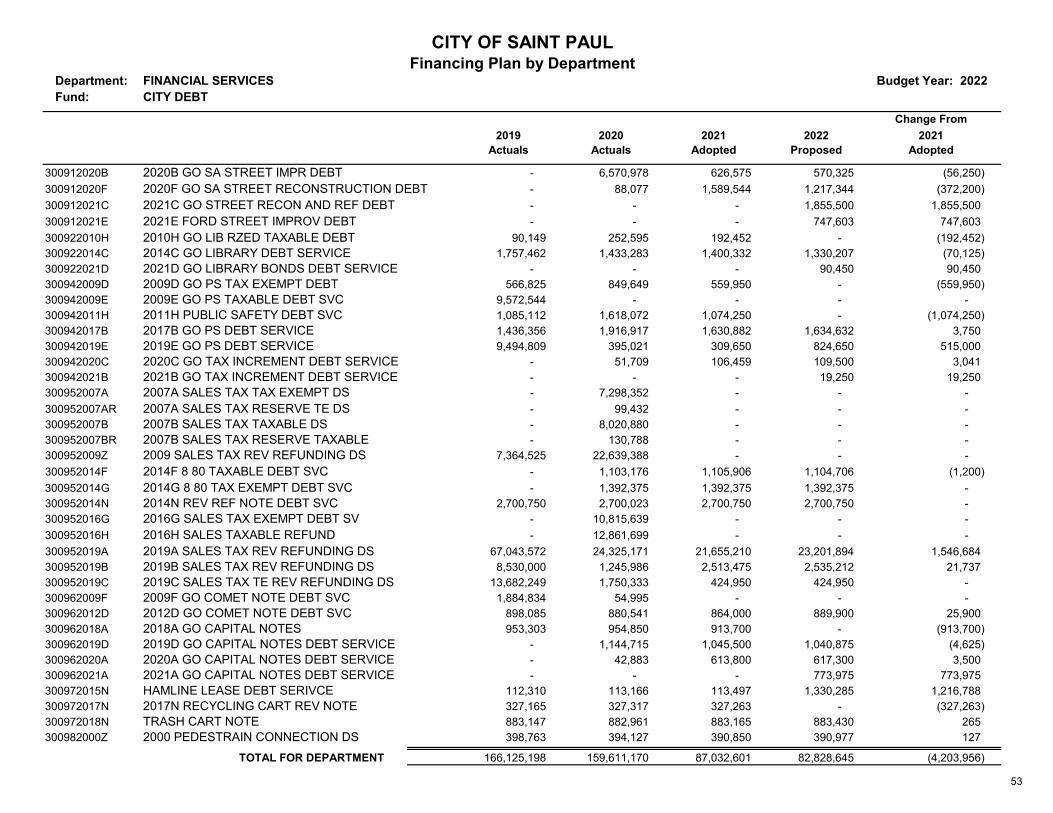
Debt Service Summary ................................................ 37
Major General Fund Revenues .................................... 54
Page
Department and Office Summaries: City Attorney ............................................................... 66 City Council ................................................................ 75 Emergency Management ........................................... 82 Financial Services ...................................................... 89 Fire ........................................................................... 107 General Government Accounts ................................ 118 Human Resources .................................................... 129 Human Rights and Equal Economic Opportunity ..... 136 Mayor’s Office .......................................................... 147 Parks and Recreation ............................................... 154 Planning and Economic Development ...................... 181 Police ........................................................................ 194 Public Health ............................................................ 205 Public Works ............................................................ 210 Safety and Inspections ............................................. 238 Technology and Communications ............................ 249
Appendix Glossary ................................................................... 260
1
Prepared by:
Office of Financial Services 700 City Hall
15 West Kellogg Boulevard Saint Paul, MN 55102-1658
(651) 266-8797Website: www.stpaul.gov
John McCarthy, Finance Director
Tara Barenok, Budget Manager Mary Guerra, Senior Budget Analyst
Madeline Mitchell, Senior Budget Analyst Laura Logsdon, Senior Budget Analyst
Mark Strom, Budget Analyst Bryan George, Budget Analyst
Mandelina Li, Right Track Budget Intern
2
Content and Other Publications Information Included This publication contains information on City of Saint Paul operating and debt service budgets. Operating budgets include the General Fund and special funds. The capital improvement budget (CIB) is included in a separate document. The Housing and Redevelopment Authority (HRA), Water Utility, RiverCentre, Library Agency and Port Authority budgets are not included because they are separate entities.
Purpose The goal of this report is to provide taxpayers with an easy-to-use guide to City spending. We have tried to answer the question “Where does the money go?” by providing tables and graphs to display this information. As a staff, we always struggle with what level of detail to show. If we show too little detail, our publications will not answer the questions people most commonly ask. If we show too much detail, the budget documents become extremely large and expensive to print. Poring through them can be daunting, tedious and time consuming.
We hope that this summary will help make taxpayers aware of where the City’s resources come from and where they go. We hope this information will help taxpayers see how state revenues and decisions on property tax classification affect local property taxes, and that they will understand better how the property tax base affects property taxes.
They will also see how difficult it is for decision makers to cut the budget without including some of the services taxpayers tell us they hold most dear, such as police, fire, libraries, and parks. These services are such a large portion of the budget, they are difficult to ignore.
We believe heightened taxpayer awareness of City programs will increase the quality of public debates on spending and taxes and, ultimately, the quality of public policy.
Budgets, Not Spending Unless otherwise noted, the numbers in this document are budget amounts, not actual spending. Actual spending amounts for past years can be found in a publication called the Annual Comprehensive Financial Report. See the following information.
Other Publications and Information The Office of Financial Services (OFS) publishes this document each year to display the Mayor’s proposed budget. Our website is www.stpaul.gov.
Saint Paul’s budget is also available as part of the Open Budget initiative. Open Budget Saint Paul provides a guided view through the budget and provides a transparent look at how public fuds are allocated. The Open Budget Saint Paul website is www.budget.stpaul.gov.
Other publications are listed below. Most of them are available in Saint Paul Public Libraries. We encourage you to use library copies whenever possible to obtain information, but if you cannot, we have listed publications and contact persons for you. We have also added links to the pages where these documents are posted on the City’s website each year:
Annual Comprehensive Financial ReportContact Lori Lee at 651-266-6454https://www.stpaul.gov/departments/financial-services/comprehensive-annual-financial-report
Joint Debt Advisory Committee: Impact of General Obligation Debt onSaint Paul Tax BaseContact Sarah Brown at 651-266-8813https://www.stpaul.gov/departments/financial-services/treasury/debt-management
Housing and Redevelopment Authority (HRA) Annual Budget and theAnnual Comprehensive Financial ReportContact Rhonda Gillquist at 651-266-6631https://www.stpaul.gov/departments/planning-and-economic-development/housing-and-redevelopment-authority-hra
Public Library AgencyContact Catherine Penkert at 651-266-7070https://sppl.org/library-budget/
Port Authority Financial Statements and the Report of IndependentPublic AccountantsContact Todd Hurley at 651-204-6215
Regional Water ServicesContact Connie Garrahy at 651-266-6291
RiverCentreContact Cindy Dupont at 651-265-4916
3
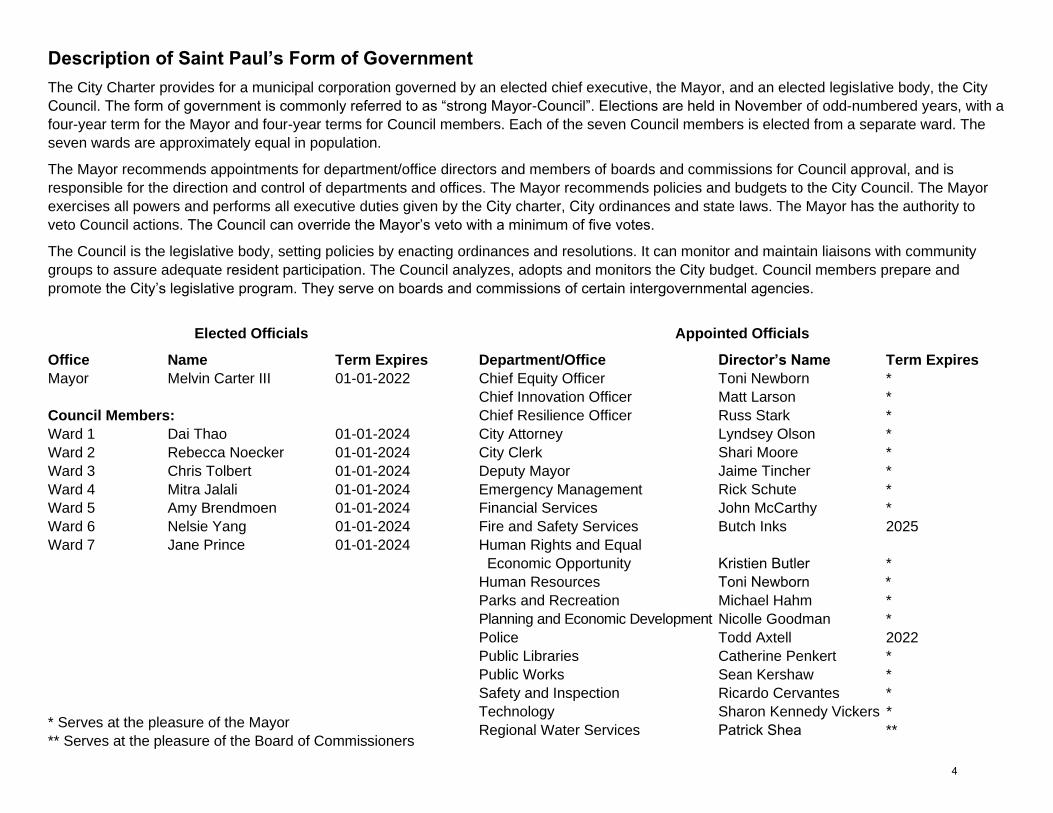
Description of Saint Paul’s Form of Government
The City Charter provides for a municipal corporation governed by an elected chief executive, the Mayor, and an elected legislative body, the City
Council. The form of government is commonly referred to as “strong Mayor-Council”. Elections are held in November of odd-numbered years, with a
four-year term for the Mayor and four-year terms for Council members. Each of the seven Council members is elected from a separate ward. The
seven wards are approximately equal in population.
The Mayor recommends appointments for department/office directors and members of boards and commissions for Council approval, and is
responsible for the direction and control of departments and offices. The Mayor recommends policies and budgets to the City Council. The Mayor
exercises all powers and performs all executive duties given by the City charter, City ordinances and state laws. The Mayor has the authority to
veto Council actions. The Council can override the Mayor’s veto with a minimum of five votes.
The Council is the legislative body, setting policies by enacting ordinances and resolutions. It can monitor and maintain liaisons with community
groups to assure adequate resident participation. The Council analyzes, adopts and monitors the City budget. Council members prepare and
promote the City’s legislative program. They serve on boards and commissions of certain intergovernmental agencies.
Elected Officials
Office Name Term Expires
Mayor Melvin Carter III 01-01-2022
Council Members:
Ward 1 Dai Thao 01-01-2024
Ward 2 Rebecca Noecker 01-01-2024
Ward 3 Chris Tolbert 01-01-2024
Ward 4 Mitra Jalali 01-01-2024
Ward 5 Amy Brendmoen 01-01-2024
Ward 6 Nelsie Yang 01-01-2024
Ward 7 Jane Prince 01-01-2024
* Serves at the pleasure of the Mayor
** Serves at the pleasure of the Board of Commissioners
Appointed Officials
Department/Office Term Expires
Chief Equity Officer *
Chief Innovation Officer *
Chief Resilience Officer *
City Attorney *
City Clerk *
Deputy Mayor *
Emergency Management *
Financial Services *
Fire and Safety Services 2025
Human Rights and Equal
Economic Opportunity *
Human Resources
Parks and Recreation
Director’s Name
Toni Newborn
Matt Larson
Russ Stark
Lyndsey Olson
Shari Moore
Jaime Tincher
Rick Schute
John McCarthy
Butch Inks
Kristien ButlerToni Newborn *
Michael Hahm *
Planning and Economic Development Nicolle Goodman *
Police Todd Axtell 2022
Public Libraries Catherine Penkert *
Public Works Sean Kershaw *
Safety and Inspection Ricardo Cervantes *
Technology
Regional Water Services
Sharon Kennedy Vickers *
Patrick Shea **
4
Electorate
City CouncilHRA Board
Library Board
Council Research City Clerk ‐ Records
Saint Paul Regional Water
Services
Port Authority
RiverCentre Convention and Visitors Authority
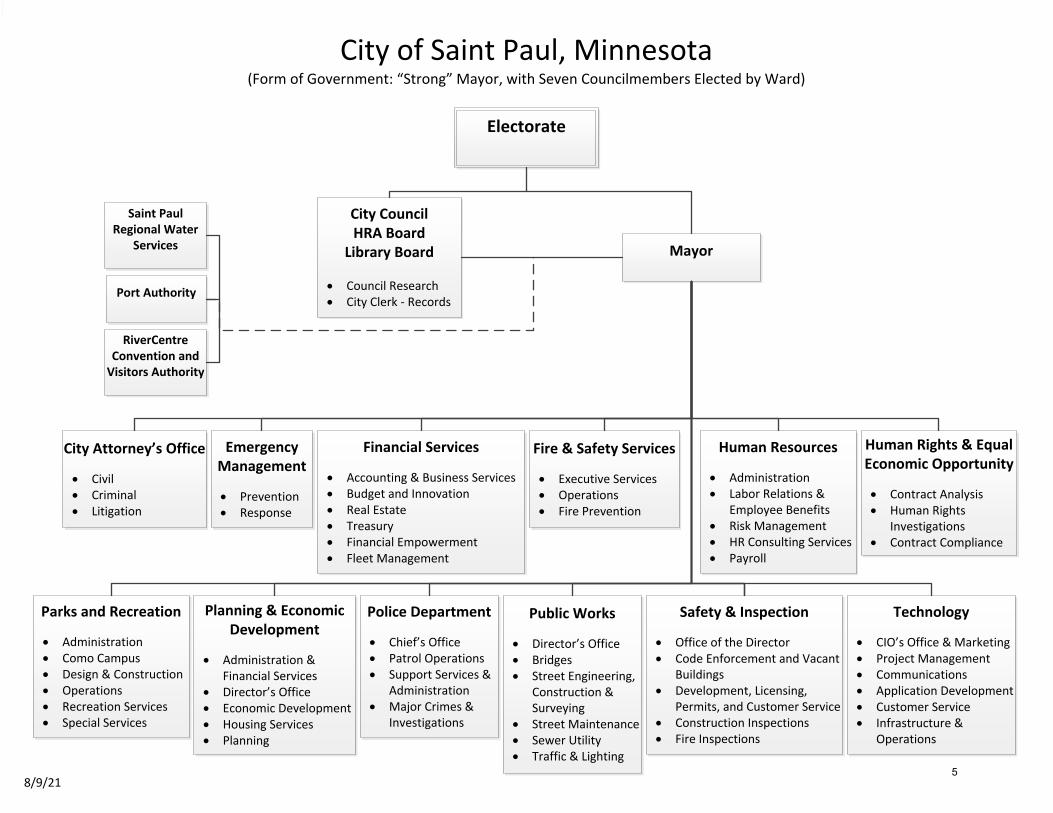
City of Saint Paul, Minnesota(Form of Government: “Strong” Mayor, with Seven Councilmembers Elected by Ward)
8/9/21
City Attorney’s Office
Civil Criminal Litigation
Emergency Management
Prevention Response
Financial Services
Accounting & Business Services Budget and Innovation Real Estate Treasury Financial Empowerment Fleet Management
Fire & Safety Services
Executive Services Operations Fire Prevention
Human Resources
Administration Labor Relations &
Employee Benefits Risk Management HR Consulting Services Payroll
Human Rights & Equal Economic Opportunity
Contract Analysis Human Rights
Investigations Contract Compliance
Parks and Recreation
Administration Como Campus Design & Construction Operations Recreation Services Special Services
Planning & Economic Development
Administration &Financial Services
Director’s Office Economic Development Housing Services Planning
Police Department
Chief’s Office Patrol Operations Support Services &
Administration Major Crimes &
Investigations
Public Works
Director’s Office Bridges Street Engineering,
Construction &Surveying
Street Maintenance Sewer Utility Traffic & Lighting
Safety & Inspection
Office of the Director Code Enforcement and Vacant
Buildings Development, Licensing,
Permits, and Customer Service Construction Inspections Fire Inspections
Technology
CIO’s Office & Marketing Project Management Communications Application Development Customer Service Infrastructure &
Operations
Mayor
5
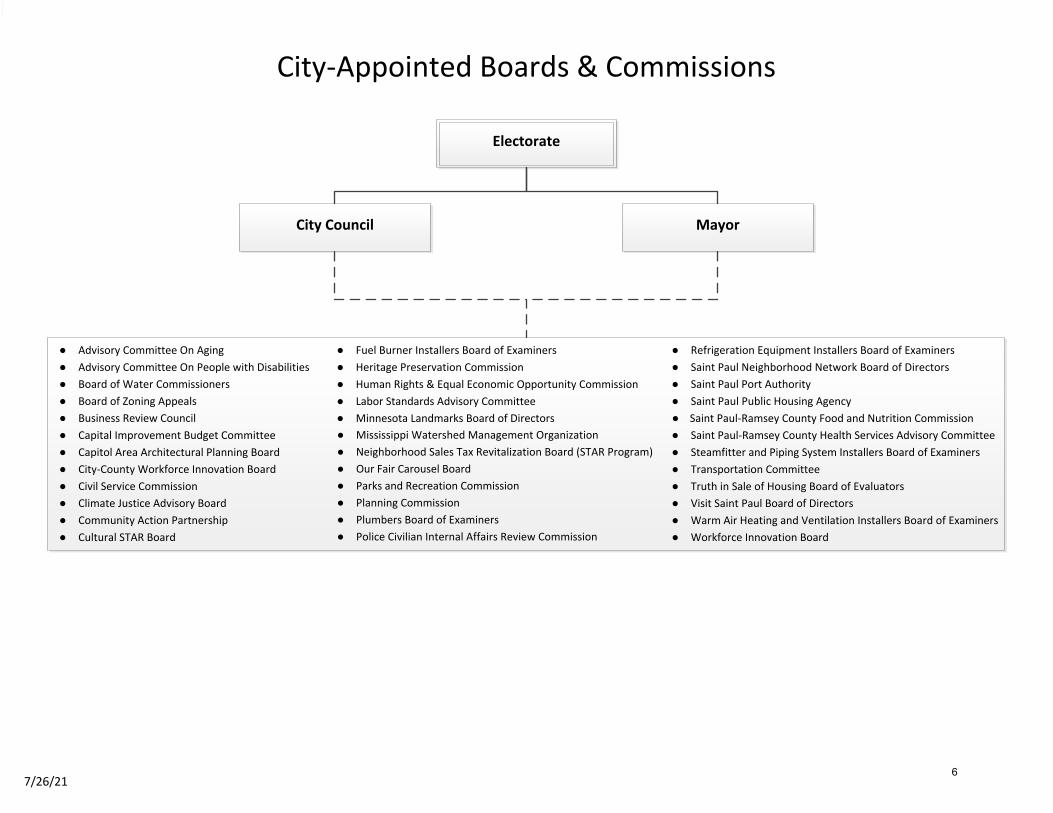
City‐Appointed Boards & Commissions
Electorate
● Fuel Burner Installers Board of Examiners● Heritage Preservation Commission● Human Rights & Equal Economic Opportunity Commission● Labor Standards Advisory Committee● Minnesota Landmarks Board of Directors ● Saint Paul-Ramsey County Food and Nutrition Commission
● Refrigeration Equipment Installers Board of Examiners● Saint Paul Neighborhood Network Board of Directors● Saint Paul Port Authority ● Saint Paul Public Housing Agency
● Saint Paul-Ramsey County Health Services Advisory Committee● Steamfitter and Piping System Installers Board of Examiners● Transportation Committee● Truth in Sale of Housing Board of Evaluators● Visit Saint Paul Board of Directors● Warm Air Heating and Ventilation Installers Board of Examiners● Workforce Innovation Board
● Advisory Committee On Aging● Advisory Committee On People with Disabilities● Board of Water Commissioners● Board of Zoning Appeals● Business Review Council● Capital Improvement Budget Committee● Capitol Area Architectural Planning Board● City‐County Workforce Innovation Board● Civil Service Commission● Climate Justice Advisory Board● Community Action Partnership● Cultural STAR Board
● Mississippi Watershed Management Organization● Neighborhood Sales Tax Revitalization Board (STAR Program)● Our Fair Carousel Board● Parks and Recreation Commission● Planning Commission● Plumbers Board of Examiners● Police Civilian Internal Affairs Review Commission
City Council Mayor
7/26/216
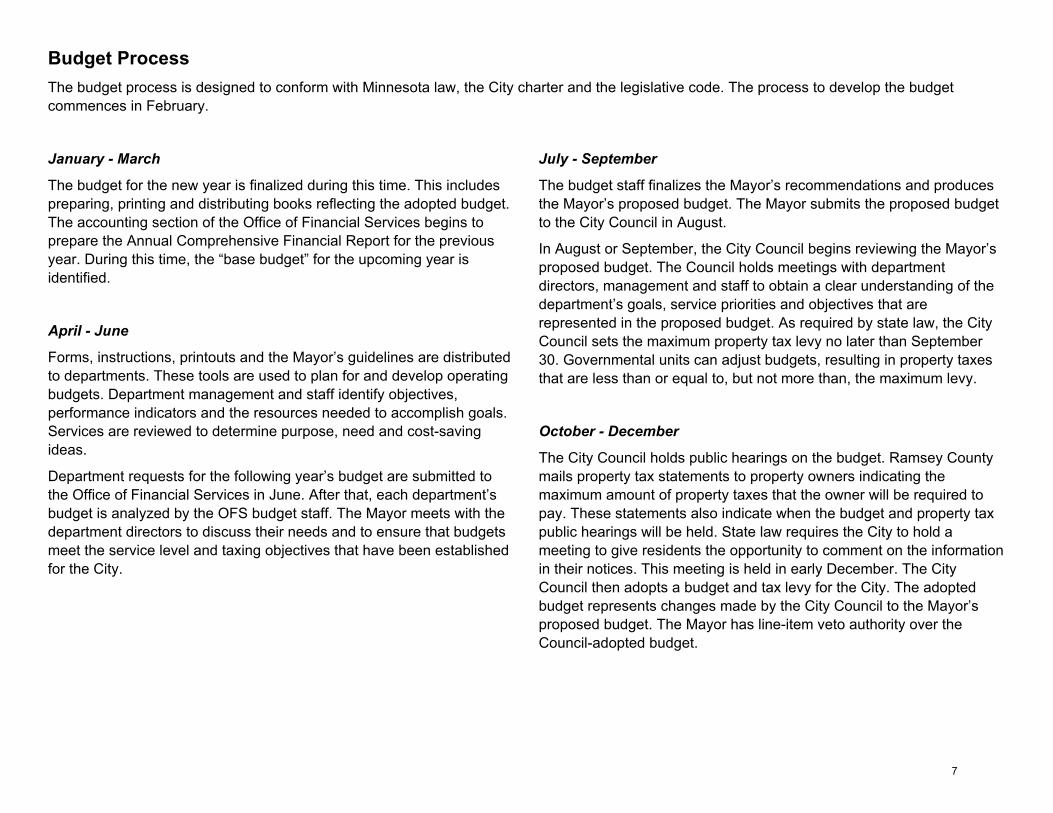
Budget Process The budget process is designed to conform with Minnesota law, the City charter and the legislative code. The process to develop the budget commences in February.
January - March
The budget for the new year is finalized during this time. This includes preparing, printing and distributing books reflecting the adopted budget. The accounting section of the Office of Financial Services begins to prepare the Annual Comprehensive Financial Report for the previous year. During this time, the “base budget” for the upcoming year is identified.
April - June
Forms, instructions, printouts and the Mayor’s guidelines are distributed to departments. These tools are used to plan for and develop operating budgets. Department management and staff identify objectives, performance indicators and the resources needed to accomplish goals. Services are reviewed to determine purpose, need and cost-saving ideas.
Department requests for the following year’s budget are submitted to the Office of Financial Services in June. After that, each department’s budget is analyzed by the OFS budget staff. The Mayor meets with the department directors to discuss their needs and to ensure that budgets meet the service level and taxing objectives that have been established for the City.
July - September
The budget staff finalizes the Mayor’s recommendations and produces the Mayor’s proposed budget. The Mayor submits the proposed budget to the City Council in August.
In August or September, the City Council begins reviewing the Mayor’s proposed budget. The Council holds meetings with department directors, management and staff to obtain a clear understanding of the department’s goals, service priorities and objectives that are represented in the proposed budget. As required by state law, the City Council sets the maximum property tax levy no later than September 30. Governmental units can adjust budgets, resulting in property taxes that are less than or equal to, but not more than, the maximum levy.
October - December
The City Council holds public hearings on the budget. Ramsey County mails property tax statements to property owners indicating the maximum amount of property taxes that the owner will be required to pay. These statements also indicate when the budget and property tax public hearings will be held. State law requires the City to hold a meeting to give residents the opportunity to comment on the information in their notices. This meeting is held in early December. The City Council then adopts a budget and tax levy for the City. The adopted budget represents changes made by the City Council to the Mayor’s proposed budget. The Mayor has line-item veto authority over the Council-adopted budget.
7
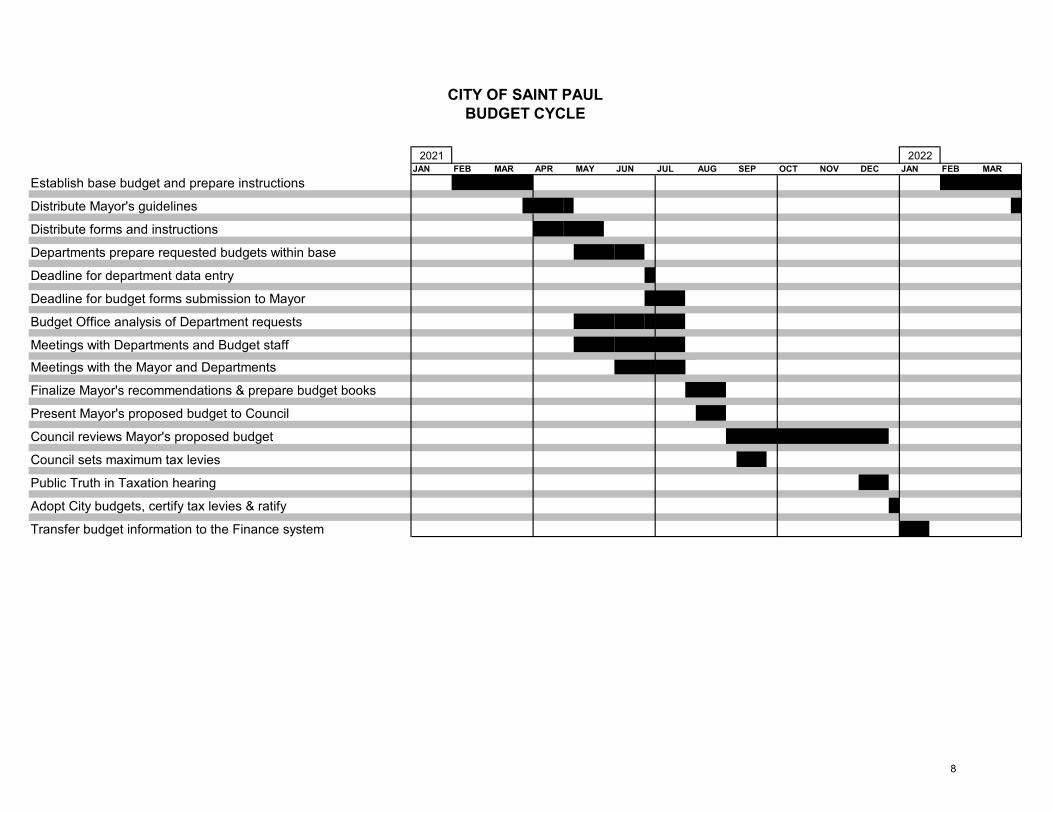
CITY OF SAINT PAULBUDGET CYCLE
JAN FEB MAR APR MAY JUN JUL AUG SEP OCT NOV DEC JAN FEB MAREstablish base budget and prepare instructions
Distribute Mayor's guidelines
Distribute forms and instructions
Departments prepare requested budgets within base
Deadline for department data entry
Deadline for budget forms submission to Mayor
Budget Office analysis of Department requests
Meetings with Departments and Budget staffMeetings with the Mayor and Departments
Finalize Mayor's recommendations & prepare budget books
Present Mayor's proposed budget to Council
Council reviews Mayor's proposed budget
Council sets maximum tax levies
Public Truth in Taxation hearing
Adopt City budgets, certify tax levies & ratify
Transfer budget information to the Finance system
2021 2022
8
City and Library Agency Composite Summary
9
Overview of Combined City and Library Agency Budgets
With the creation of the independent Saint Paul Public Library Agency beginning with the 2004 budget year, detailed information about library budgets and activities is now presented in a separate document, and is generally excluded from the City budget information contained in this publication. The information provided in this section is intended to give a high-level overview of the combined City and Library Agency budgets and permit overall year-to-year comparisons to be made more easily. Detailed information about the Library Agency budget will be made available in a separate publication published by the Agency.
10
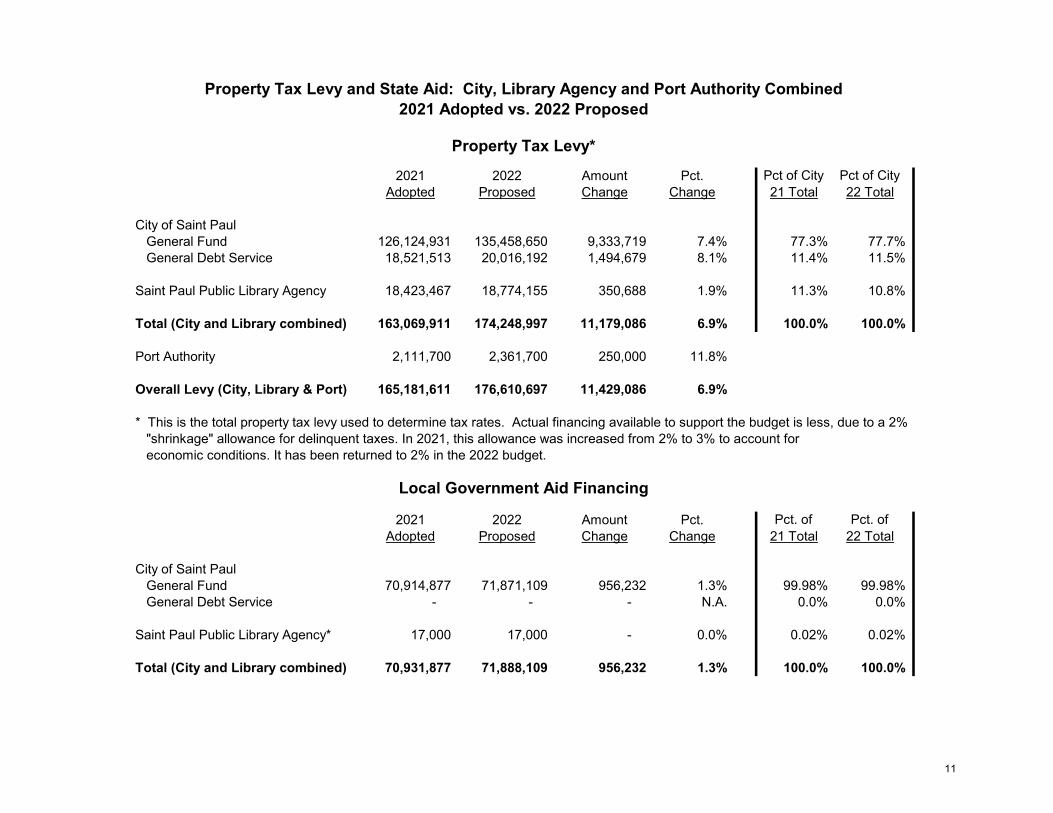
Property Tax Levy and State Aid: City, Library Agency and Port Authority Combined2021 Adopted vs. 2022 Proposed
2021 2022 Amount Pct. Pct of City Pct of City Adopted Proposed Change Change 21 Total 22 Total
City of Saint PaulGeneral Fund 126,124,931 135,458,650 9,333,719 7.4% 77.3% 77.7%General Debt Service 18,521,513 20,016,192 1,494,679 8.1% 11.4% 11.5%
Saint Paul Public Library Agency 18,423,467 18,774,155 350,688 1.9% 11.3% 10.8%
Total (City and Library combined) 163,069,911 174,248,997 11,179,086 6.9% 100.0% 100.0%
Port Authority 2,111,700 2,361,700 250,000 11.8%
Overall Levy (City, Library & Port) 165,181,611 176,610,697 11,429,086 6.9%
* This is the total property tax levy used to determine tax rates. Actual financing available to support the budget is less, due to a 2%"shrinkage" allowance for delinquent taxes. In 2021, this allowance was increased from 2% to 3% to account for economic conditions. It has been returned to 2% in the 2022 budget.
2021 2022 Amount Pct. Pct. of Pct. ofAdopted Proposed Change Change 21 Total 22 Total
City of Saint PaulGeneral Fund 70,914,877 71,871,109 956,232 1.3% 99.98% 99.98%General Debt Service - - - N.A. 0.0% 0.0%
Saint Paul Public Library Agency* 17,000 17,000 - 0.0% 0.02% 0.02%
Total (City and Library combined) 70,931,877 71,888,109 956,232 1.3% 100.0% 100.0%
Property Tax Levy*
Local Government Aid Financing
11
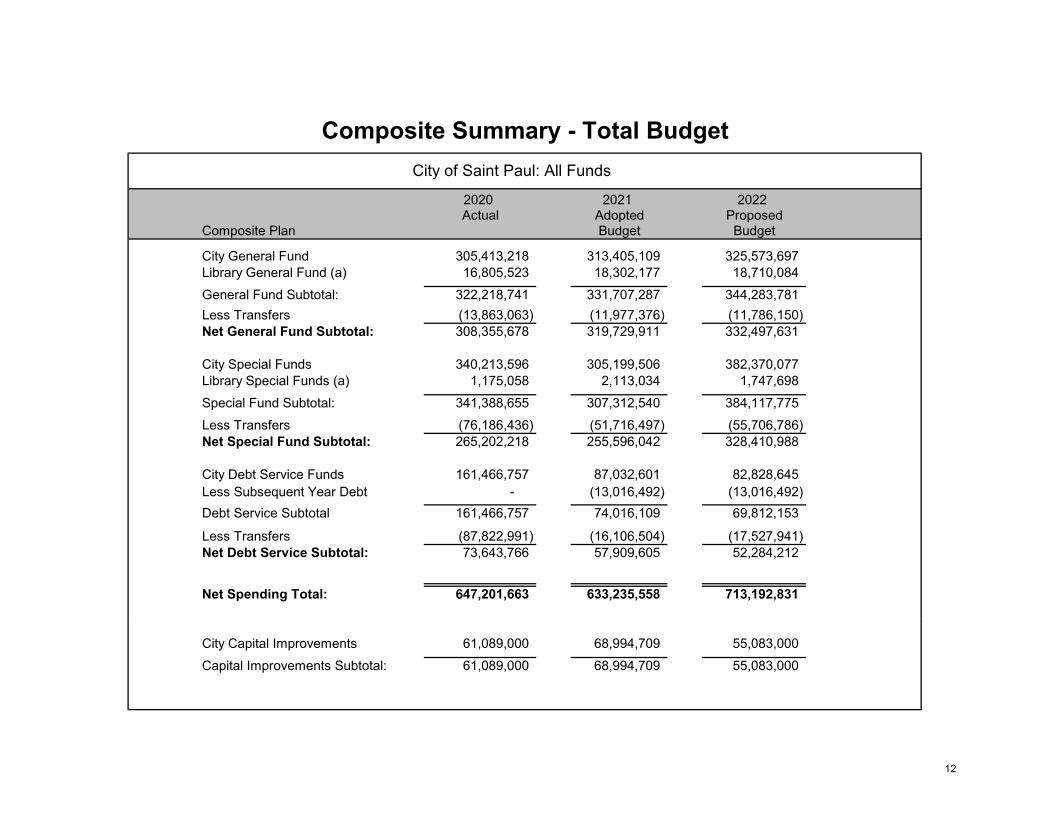
2020 2021 2022Actual Adopted Proposed
Composite Plan Budget Budget
City General Fund 305,413,218 313,405,109 325,573,697Library General Fund (a) 16,805,523 18,302,177 18,710,084General Fund Subtotal: 322,218,741 331,707,287 344,283,781Less Transfers (13,863,063) (11,977,376) (11,786,150)Net General Fund Subtotal: 308,355,678 319,729,911 332,497,631
City Special Funds 340,213,596 305,199,506 382,370,077Library Special Funds (a) 1,175,058 2,113,034 1,747,698Special Fund Subtotal: 341,388,655 307,312,540 384,117,775Less Transfers (76,186,436) (51,716,497) (55,706,786)Net Special Fund Subtotal: 265,202,218 255,596,042 328,410,988
City Debt Service Funds 161,466,757 87,032,601 82,828,645Less Subsequent Year Debt - (13,016,492) (13,016,492)Debt Service Subtotal 161,466,757 74,016,109 69,812,153
Less Transfers (87,822,991) (16,106,504) (17,527,941)Net Debt Service Subtotal: 73,643,766 57,909,605 52,284,212
Net Spending Total: 647,201,663 633,235,558 713,192,831
City Capital Improvements 61,089,000 68,994,709 55,083,000Capital Improvements Subtotal: 61,089,000 68,994,709 55,083,000
City of Saint Paul: All Funds
Composite Summary - Total Budget
12
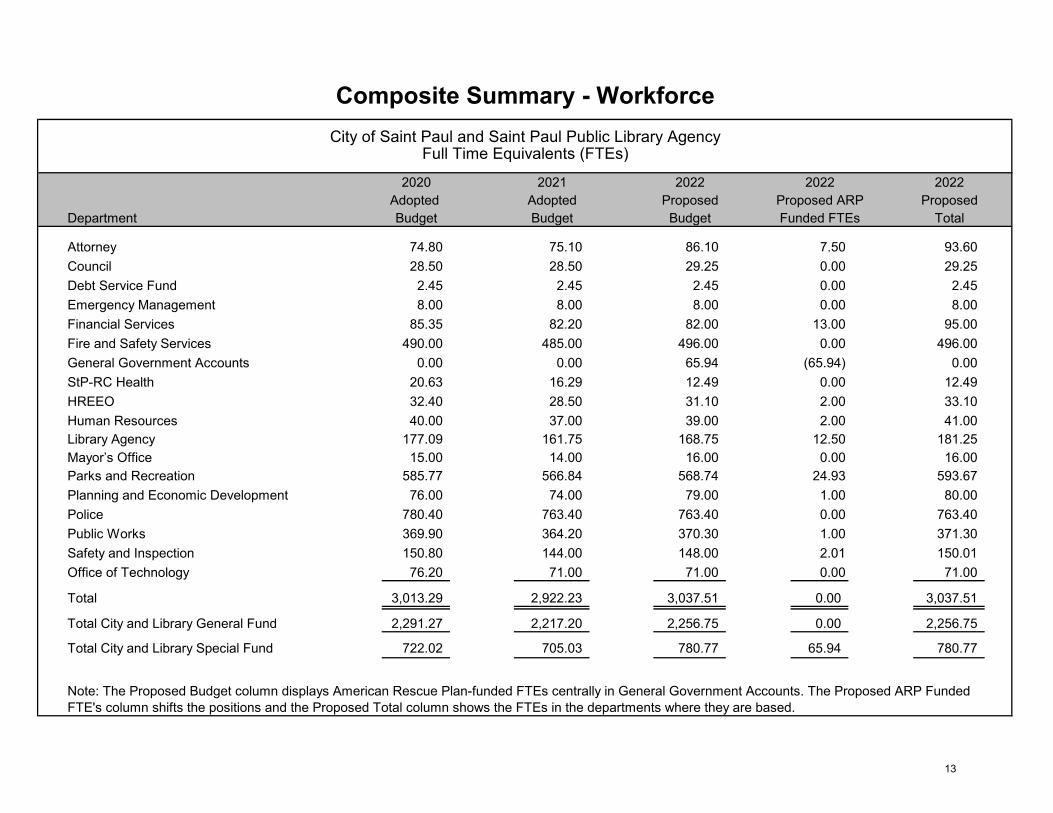
Composite Summary - Workforce
Full Time Equivalents (FTEs)
2020 2021 2022 2022 2022Adopted Adopted Proposed Proposed ARP Proposed
Department Budget Budget Budget Funded FTEs Total
Attorney 74.80 75.10 86.10 7.50 93.60Council 28.50 28.50 29.25 0.00 29.25Debt Service Fund 2.45 2.45 2.45 0.00 2.45Emergency Management 8.00 8.00 8.00 0.00 8.00 Financial Services 85.35 82.20 82.00 13.00 95.00 Fire and Safety Services 490.00 485.00 496.00 0.00 496.00General Government Accounts 0.00 0.00 65.94 (65.94) 0.00StP-RC Health 20.63 16.29 12.49 0.00 12.49HREEO 32.40 28.50 31.10 2.00 33.10Human Resources 40.00 37.00 39.00 2.00 41.00 Library Agency 177.09 161.75 168.75 12.50 181.25Mayor’s Office 15.00 14.00 16.00 0.00 16.00Parks and Recreation 585.77 566.84 568.74 24.93 593.67Planning and Economic Development 76.00 74.00 79.00 1.00 80.00Police 780.40 763.40 763.40 0.00 763.40Public Works 369.90 364.20 370.30 1.00 371.30Safety and Inspection 150.80 144.00 148.00 2.01 150.01Office of Technology 76.20 71.00 71.00 0.00 71.00 Total 3,013.29 2,922.23 3,037.51 0.00 3,037.51
Total City and Library General Fund 2,291.27 2,217.20 2,256.75 0.00 2,256.75
Total City and Library Special Fund 722.02 705.03 780.77 65.94 780.77
City of Saint Paul and Saint Paul Public Library Agency
Note: The Proposed Budget column displays American Rescue Plan-funded FTEs centrally in General Government Accounts. The Proposed ARP Funded FTE's column shifts the positions and the Proposed Total column shows the FTEs in the departments where they are based.
13
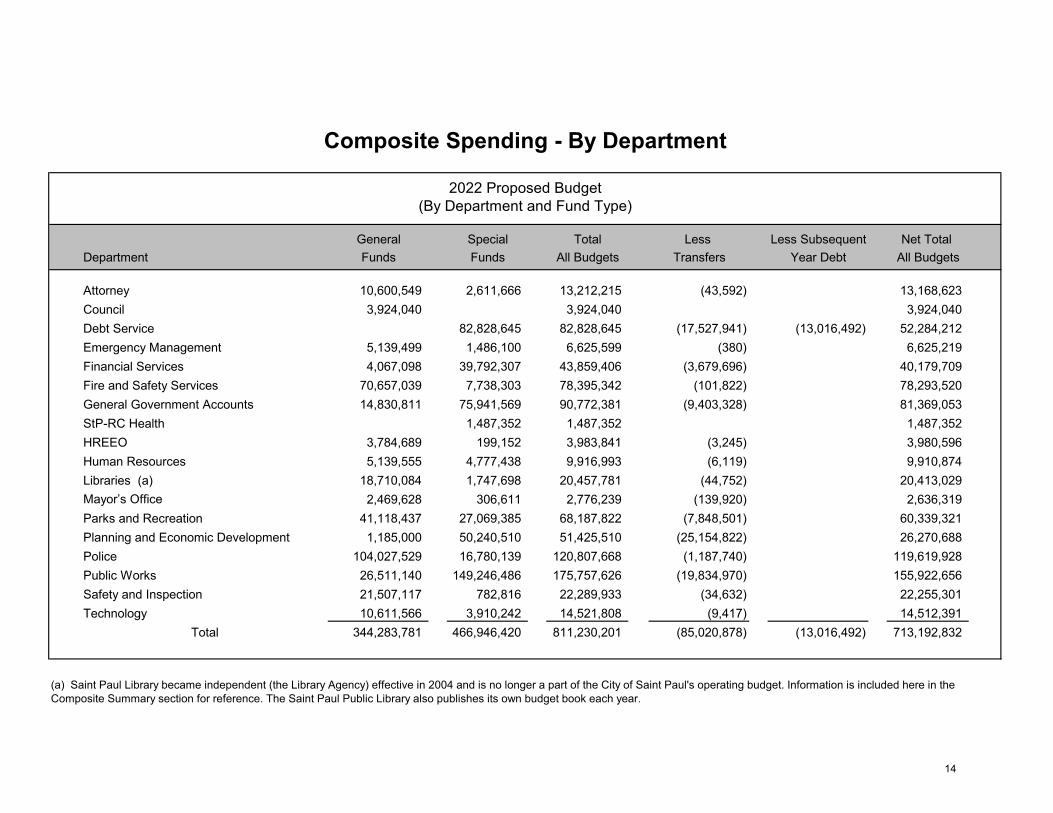
General Special Total Less Less Subsequent Net Total Department Funds Funds All Budgets Transfers Year Debt All Budgets
Attorney 10,600,549 2,611,666 13,212,215 (43,592) 13,168,623Council 3,924,040 3,924,040 3,924,040Debt Service 82,828,645 82,828,645 (17,527,941) (13,016,492) 52,284,212Emergency Management 5,139,499 1,486,100 6,625,599 (380) 6,625,219Financial Services 4,067,098 39,792,307 43,859,406 (3,679,696) 40,179,709Fire and Safety Services 70,657,039 7,738,303 78,395,342 (101,822) 78,293,520General Government Accounts 14,830,811 75,941,569 90,772,381 (9,403,328) 81,369,053StP-RC Health 1,487,352 1,487,352 1,487,352HREEO 3,784,689 199,152 3,983,841 (3,245) 3,980,596Human Resources 5,139,555 4,777,438 9,916,993 (6,119) 9,910,874Libraries (a) 18,710,084 1,747,698 20,457,781 (44,752) 20,413,029Mayor’s Office 2,469,628 306,611 2,776,239 (139,920) 2,636,319Parks and Recreation 41,118,437 27,069,385 68,187,822 (7,848,501) 60,339,321Planning and Economic Development 1,185,000 50,240,510 51,425,510 (25,154,822) 26,270,688Police 104,027,529 16,780,139 120,807,668 (1,187,740) 119,619,928Public Works 26,511,140 149,246,486 175,757,626 (19,834,970) 155,922,656Safety and Inspection 21,507,117 782,816 22,289,933 (34,632) 22,255,301Technology 10,611,566 3,910,242 14,521,808 (9,417) 14,512,391
Total 344,283,781 466,946,420 811,230,201 (85,020,878) (13,016,492) 713,192,832
Composite Spending - By Department
(a) Saint Paul Library became independent (the Library Agency) effective in 2004 and is no longer a part of the City of Saint Paul's operating budget. Information is included here in the Composite Summary section for reference. The Saint Paul Public Library also publishes its own budget book each year.
2022 Proposed Budget(By Department and Fund Type)
14
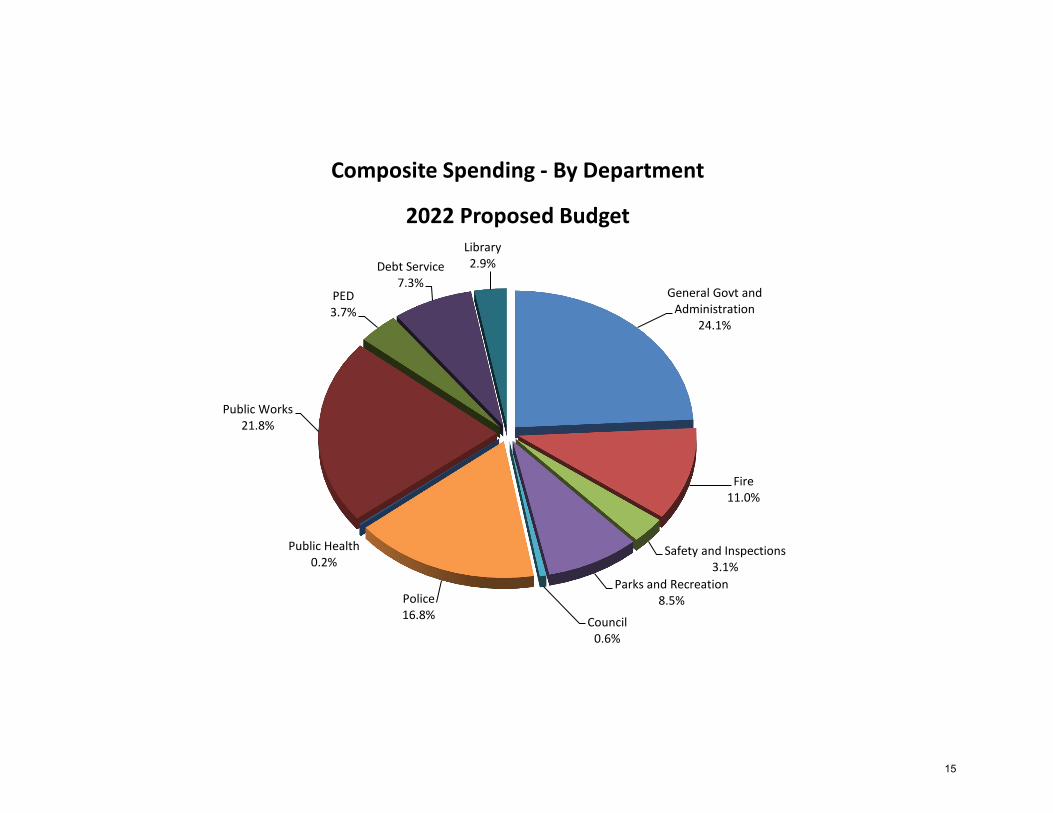
HREEO
General Govt and Administration
24.1%
Fire11.0%
Safety and Inspections3.1%
Parks and Recreation8.5%
Council0.6%
Police16.8%
Public Health0.2%
Public Works21.8%
PED3.7%
Debt Service7.3%
Library2.9%
Composite Spending - By Department
2022 Proposed Budget
15
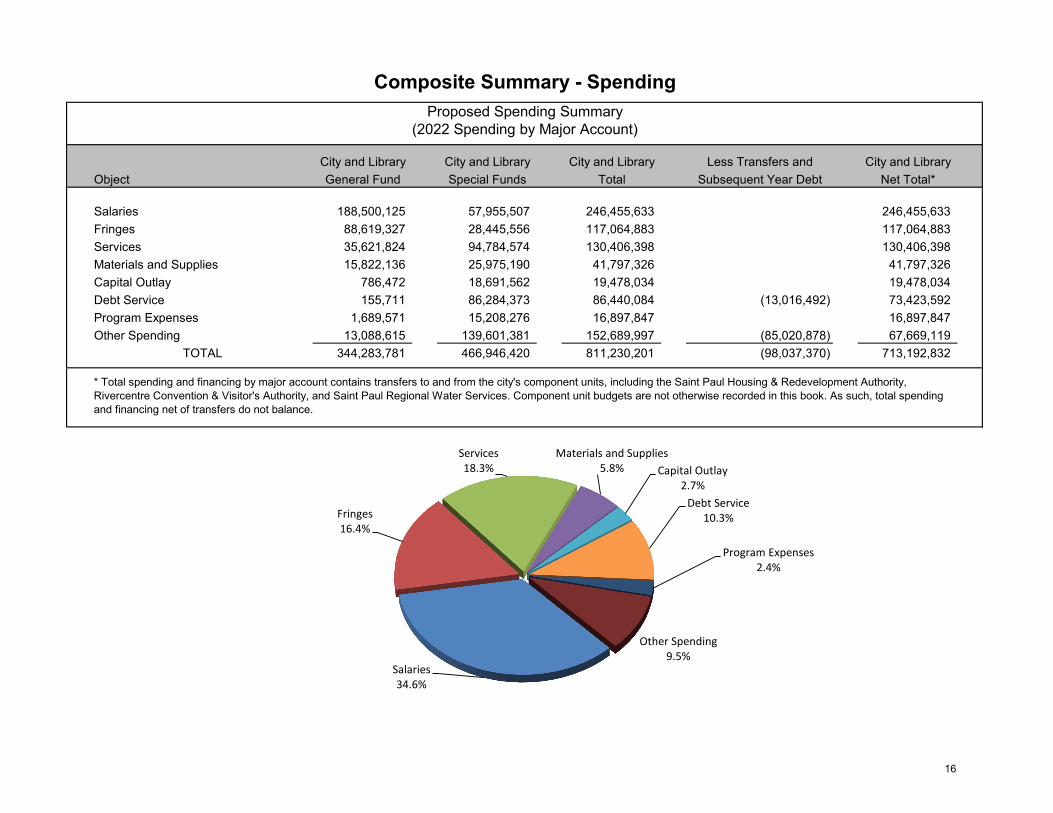
Composite Summary - SpendingProposed Spending Summary
(2022 Spending by Major Account)
City and Library City and Library City and Library Less Transfers and City and LibraryObject General Fund Special Funds Total Subsequent Year Debt Net Total*
Salaries 188,500,125 57,955,507 246,455,633 246,455,633Fringes 88,619,327 28,445,556 117,064,883 117,064,883Services 35,621,824 94,784,574 130,406,398 130,406,398Materials and Supplies 15,822,136 25,975,190 41,797,326 41,797,326Capital Outlay 786,472 18,691,562 19,478,034 19,478,034Debt Service 155,711 86,284,373 86,440,084 (13,016,492) 73,423,592Program Expenses 1,689,571 15,208,276 16,897,847 16,897,847Other Spending 13,088,615 139,601,381 152,689,997 (85,020,878) 67,669,119
TOTAL 344,283,781 466,946,420 811,230,201 (98,037,370) 713,192,832
* Total spending and financing by major account contains transfers to and from the city's component units, including the Saint Paul Housing & Redevelopment Authority, Rivercentre Convention & Visitor's Authority, and Saint Paul Regional Water Services. Component unit budgets are not otherwise recorded in this book. As such, total spending and financing net of transfers do not balance.
Salaries34.6%
Fringes16.4%
Services18.3%
Materials and Supplies5.8% Capital Outlay
2.7%Debt Service
10.3%
Program Expenses2.4%
Other Spending9.5%
16
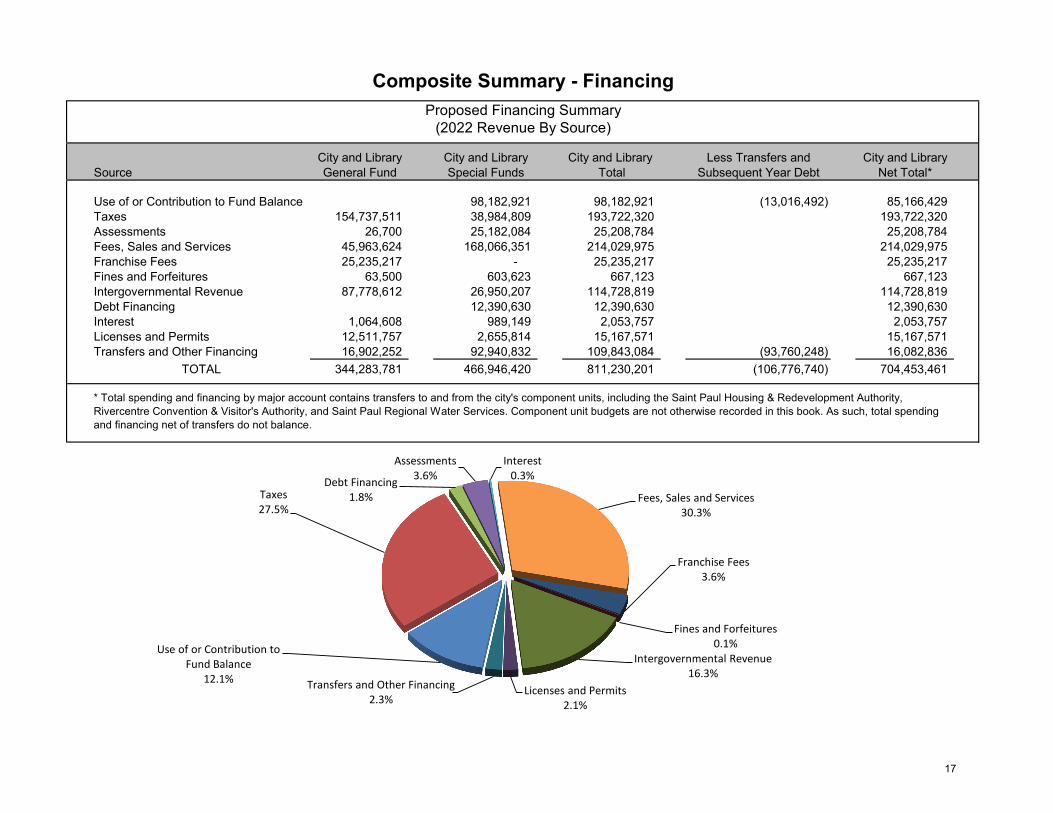
Composite Summary - FinancingProposed Financing Summary
(2022 Revenue By Source)
City and Library City and Library City and Library Less Transfers and City and LibrarySource General Fund Special Funds Total Subsequent Year Debt Net Total*
Use of or Contribution to Fund Balance 98,182,921 98,182,921 (13,016,492) 85,166,429Taxes 154,737,511 38,984,809 193,722,320 193,722,320Assessments 26,700 25,182,084 25,208,784 25,208,784Fees, Sales and Services 45,963,624 168,066,351 214,029,975 214,029,975Franchise Fees 25,235,217 - 25,235,217 25,235,217Fines and Forfeitures 63,500 603,623 667,123 667,123Intergovernmental Revenue 87,778,612 26,950,207 114,728,819 114,728,819Debt Financing 12,390,630 12,390,630 12,390,630Interest 1,064,608 989,149 2,053,757 2,053,757Licenses and Permits 12,511,757 2,655,814 15,167,571 15,167,571Transfers and Other Financing 16,902,252 92,940,832 109,843,084 (93,760,248) 16,082,836
TOTAL 344,283,781 466,946,420 811,230,201 (106,776,740) 704,453,461
* Total spending and financing by major account contains transfers to and from the city's component units, including the Saint Paul Housing & Redevelopment Authority, Rivercentre Convention & Visitor's Authority, and Saint Paul Regional Water Services. Component unit budgets are not otherwise recorded in this book. As such, total spending and financing net of transfers do not balance.
Use of or Contribution to Fund Balance
12.1%
Taxes27.5%
Debt Financing1.8%
Assessments3.6%
Interest0.3%
Fees, Sales and Services30.3%
Franchise Fees3.6%
Fines and Forfeitures0.1%
Intergovernmental Revenue16.3%
Licenses and Permits2.1%
Transfers and Other Financing2.3%
17

�
18
City General Fund
19
General Fund – 2022 Mayor’s Proposed Budget
Purpose: The General Fund is the principal financial support for such basic services as the police and fire departments, parks and recreation, and general government operations (e.g., Mayor and City Council, human resources, finance, and other internal services). The major revenue sources for this fund are property taxes, local government aid (LGA), franchise fees, and other general revenues. The tables and graphs on the following pages detail the General Fund’s proposed 2022 spending and revenue plan.
Budget Highlights, Issues, and Challenges
COVID-19 Pandemic: The COVID-19 pandemic continues to impact many aspects of daily life. The impacts on the City of Saint Paul budget linger. The pandemic prompted changes to behavior and spending patterns, significantly reducing City revenues in 2020 and 2021.
This budget assumes many of these impacts will continue into 2022. Projections reflect declines in major General Fund revenues compared to pre-pandemic levels. Revenue uncertainty remains around the impacts stemming from hybrid work and emerging variants of the virus.
As a result of these revenue impacts, the 2021 budget included $8 million in spending reductions. In 2022, American Rescue Plan (ARP) Act funding allowed for the restoration of $2.2 million in Library and Parks and Recreation services. The 2022 budget also adds $3.3 million in ARP funds for financial stabilization in the General Fund.
Current Service Level Adjustments: Summary sections for each department indicate current service level adjustments, including spending and revenue to maintain a department’s same services as the previous year. Inflationary pressures including cost of living allowances built into union contracts and rising employee health care costs drive the increased cost of service delivery.
The City must continue to find ways to manage these costs prudently and responsibly to maintain service delivery, as well as ensure the integrity of the City’s finances. The largest
General Fund expense is employee wages and benefits – over 80% of all City General Fund spending is for personnel costs.
The cost of other goods and services also continues to rise, putting pressure on department budgets.
Property Tax Base and Levy: Over 80% of Saint Paul’s local property tax base consists of residential properties, including both owner-occupied and rental units. Historically, as the home to many tax-exempt educational, medical, and state government institutions, about 20% of the City’s property has been exempted entirely from paying property taxes.
The proposed budget includes a 6.9% increase in the property tax levy. The total 2022 proposed levy is $176.6 million. The General Fund receives 77% of the levy. The Library Agency receives 11% of the levy. City debt service accounts for 11% of the levy, with the remainder levied on behalf of the Saint Paul Port Authority.
The 2022 proposed budget assumes 2% property tax non-payment, returning to the assumption in the 2020 adopted budget. The 2021 adopted budget assumed 3% non-payment due to economic conditions.
Property taxes in the General Fund make up 41.5% of the fund’s total revenue.
2020
General Fund – 2022 Mayor’s Proposed Budget
State Budget Decisions and LGA: The future of state Local Government Aid (LGA) remains a key variable in the City’s ability to provide basic services. LGA represents a significant revenue source for the City’s General Fund, accounting for over 22% of general fund revenues.
Two significant sets of reductions to LGA in 2003 and 2008-09 resulted in a series of reductions to City services. The lack of predictability negatively challenged the City’s ability to plan from year to year. The anticipated LGA in 2003 for Saint Paul was over $76 million. LGA received by the City fell to its lowest point in 2010 at around $50 million.
The 2022 budget anticipates nearly $72 million in LGA, about a $1 million increase compared to 2021. If the LGA amount in 2003 had grown by the rate of inflation, the 2022 LGA amount would be nearly $127 million.
Recent increases in LGA renew the state and local fiscal relationship, helping to make local budget planning and service delivery more predictable for the residents of Saint Paul.
Other Major General Fund Revenues:
In addition to property taxes and LGA, major revenue sources for this fund are:
❖ Franchise fees – 8%❖ Other revenues, aids, and user fees – 28.5%
Maintaining Adequate Financial Reserves: From 1994 to 2005, the City spent from its General Fund balance to finance a share of the annual operating budget. These actions decreased the fund balance from its peak in 1998 of 31% of subsequent year spending to just under 15% in 2005.
In 2006, the City enacted a fund balance policy mandating that the General Fund’s balance be at least 15% of combined General Fund and Library operating spending. Despite significant mid-year LGA cuts in 2008 through 2011, the City continued to comply with the adopted fund balance policy. For example, in 2020, the City resolved a mid-year COVID-related budget deficit of over $22 million without using fund balance.
The 2022 proposed budget maintains compliance with the City fund balance policy. The 2021 adopted and 2022 proposed budgets use a combination of ongoing and one-time solutions to balance the budget.
The City assumes over the long-term that the impacted revenues will start to see a slow recovery starting in 2021 continuing in 2022.
2121
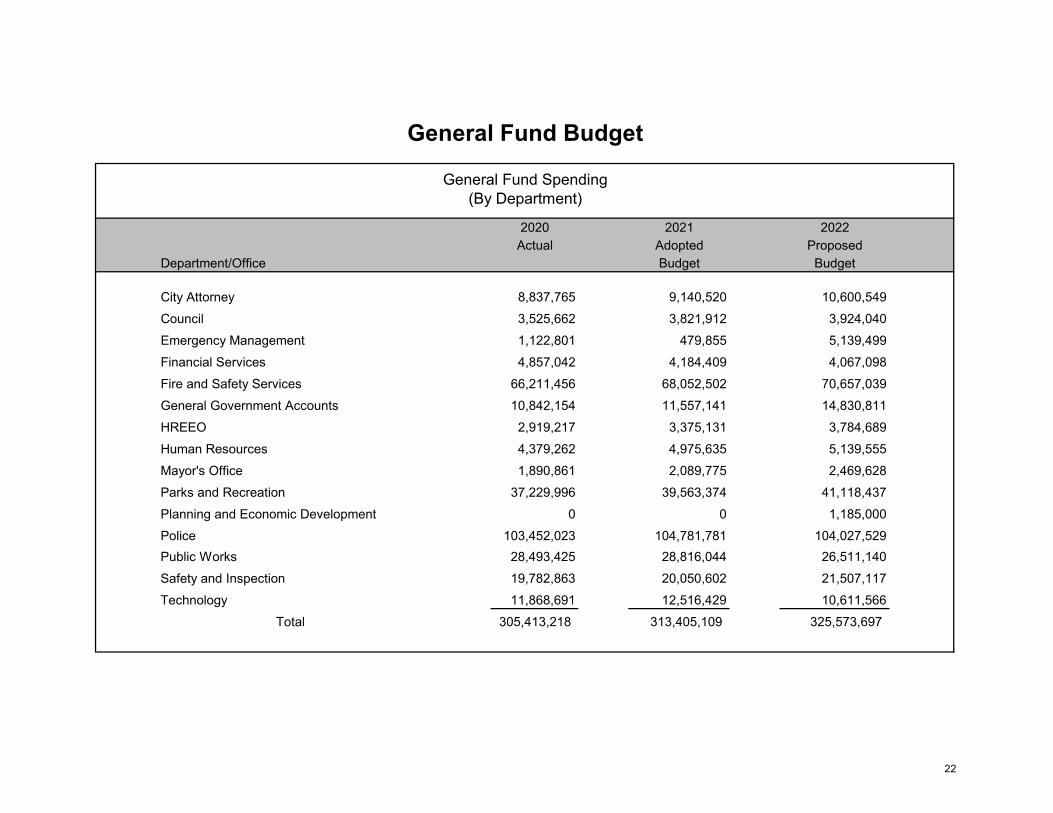
2020 2021 2022Actual Adopted Proposed
Department/Office Budget Budget
City Attorney 8,837,765 9,140,520 10,600,549Council 3,525,662 3,821,912 3,924,040Emergency Management 1,122,801 479,855 5,139,499Financial Services 4,857,042 4,184,409 4,067,098Fire and Safety Services 66,211,456 68,052,502 70,657,039General Government Accounts 10,842,154 11,557,141 14,830,811HREEO 2,919,217 3,375,131 3,784,689Human Resources 4,379,262 4,975,635 5,139,555Mayor's Office 1,890,861 2,089,775 2,469,628Parks and Recreation 37,229,996 39,563,374 41,118,437Planning and Economic Development 0 0 1,185,000Police 103,452,023 104,781,781 104,027,529Public Works 28,493,425 28,816,044 26,511,140Safety and Inspection 19,782,863 20,050,602 21,507,117Technology 11,868,691 12,516,429 10,611,566
Total 305,413,218 313,405,109 325,573,697
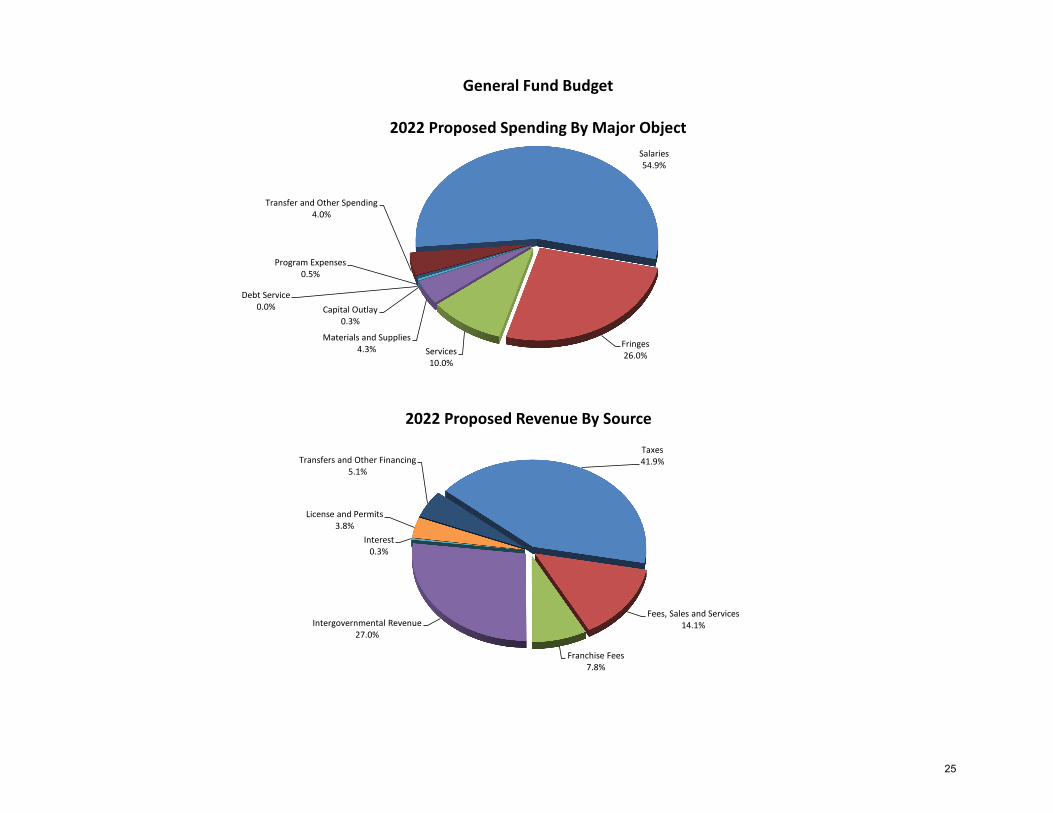
General Fund Budget
General Fund Spending(By Department)
22
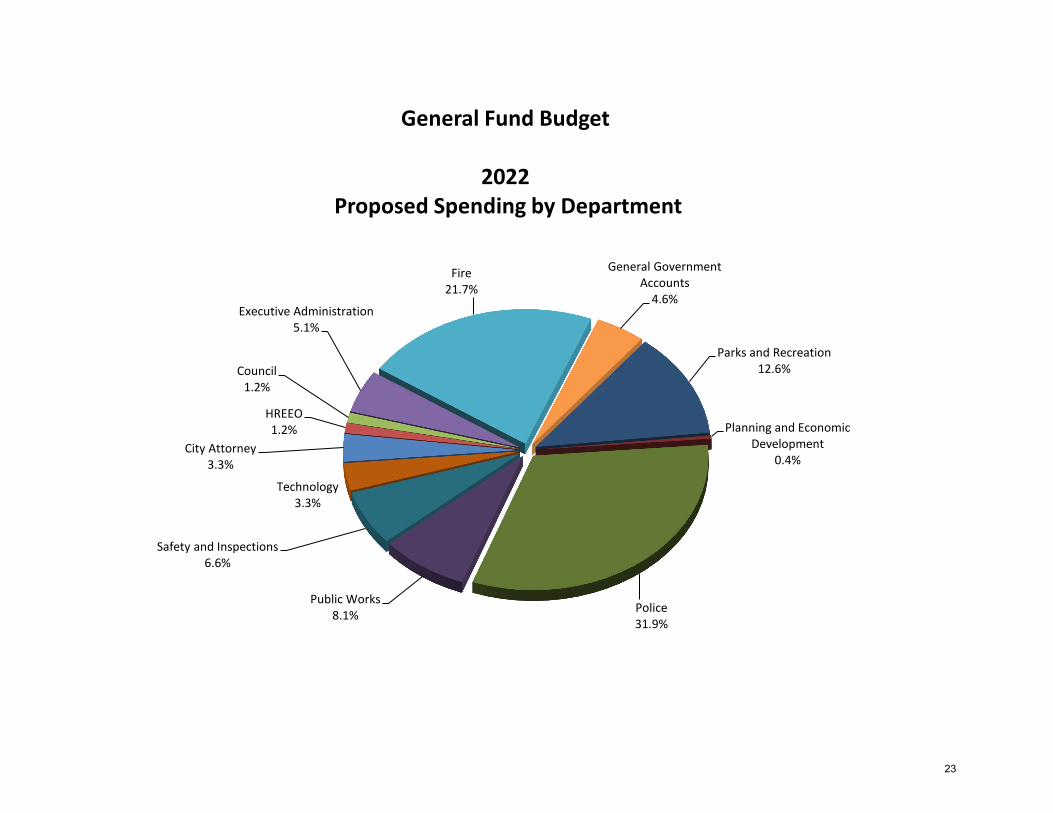
City Attorney3.3%
HREEO1.2%
Council1.2%
Executive Administration5.1%
Fire21.7%
General Government Accounts
4.6%
Parks and Recreation12.6%
Planning and Economic Development
0.4%
Police31.9%
Public Works8.1%
Safety and Inspections6.6%
Technology3.3%
General Fund Budget
2022Proposed Spending by Department
23
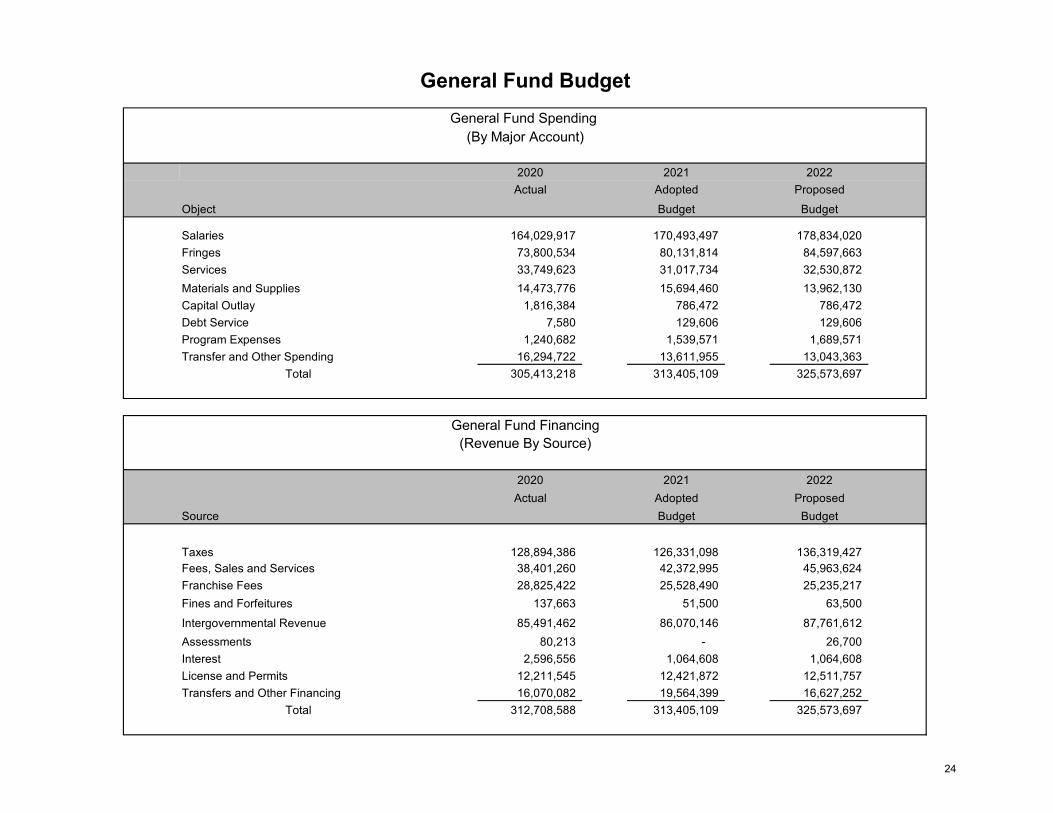
2020 2021 2022Actual Adopted Proposed
Object Budget Budget
Salaries 164,029,917 170,493,497 178,834,020Fringes 73,800,534 80,131,814 84,597,663Services 33,749,623 31,017,734 32,530,872Materials and Supplies 14,473,776 15,694,460 13,962,130Capital Outlay 1,816,384 786,472 786,472Debt Service 7,580 129,606 129,606Program Expenses 1,240,682 1,539,571 1,689,571Transfer and Other Spending 16,294,722 13,611,955 13,043,363
Total 305,413,218 313,405,109 325,573,697
2020 2021 2022Actual Adopted Proposed
Source Budget Budget
Taxes 128,894,386 126,331,098 136,319,427Fees, Sales and Services 38,401,260 42,372,995 45,963,624Franchise Fees 28,825,422 25,528,490 25,235,217Fines and Forfeitures 137,663 51,500 63,500Intergovernmental Revenue 85,491,462 86,070,146 87,761,612Assessments 80,213 - 26,700Interest 2,596,556 1,064,608 1,064,608License and Permits 12,211,545 12,421,872 12,511,757Transfers and Other Financing 16,070,082 19,564,399 16,627,252
Total 312,708,588 313,405,109 325,573,697
General Fund BudgetGeneral Fund Spending
(By Major Account)
General Fund Financing(Revenue By Source)
24
from a special fund to the general fund.
Salaries54.9%
Fringes26.0%Services
10.0%
Materials and Supplies4.3%
Capital Outlay0.3%
Debt Service0.0%
Program Expenses0.5%
Transfer and Other Spending4.0%
General Fund Budget
2022 Proposed Spending By Major Object
Taxes41.9%
Fees, Sales and Services14.1%
Franchise Fees7.8%
Intergovernmental Revenue27.0%
Interest0.3%
License and Permits3.8%
Transfers and Other Financing5.1%
2022 Proposed Revenue By Source
25

�
26

City Special Funds
27

2020 2021 2022Actual Adopted Proposed
Department Budget Budget
City Attorney 2,126,427 2,739,931 2,611,666Council 20,669 0 0Emergency Management 956,766 1,503,901 1,486,100Financial Services 23,600,615 40,337,280 39,792,307Fire and Safety Services 7,732,904 9,192,891 7,738,303General Government Accounts 28,726,893 3,009,995 75,941,569StP-RC Health 1,815,784 1,886,093 1,487,352HREEO 1,418,178 730,334 199,152Human Resources 3,638,284 4,913,570 4,777,438Mayor’s Office 270,422 354,770 306,611Parks and Recreation 19,681,136 27,130,271 27,069,385Planning and Economic Development 64,998,301 48,785,992 50,240,510Police 19,106,164 17,277,885 16,780,139Public Works 164,838,845 145,456,842 149,246,486Safety and Inspection 321,233 826,624 782,816Technology 960,976 1,053,128 3,910,242
Total 340,213,596 305,199,507 382,370,077
Special Fund BudgetsSpecial Fund Spending
(By Department)
Special fund budgets are designed to track revenues and expenditures for specific designated purposes. Special fund budgets are not supported by property taxes. Rather, special fund spending is supported by user fees, assessments and grants, which are typically restricted in some way. The restrictions require accounting in separate funds, which include operating funds, project funds, debt service funds and trust funds.
28
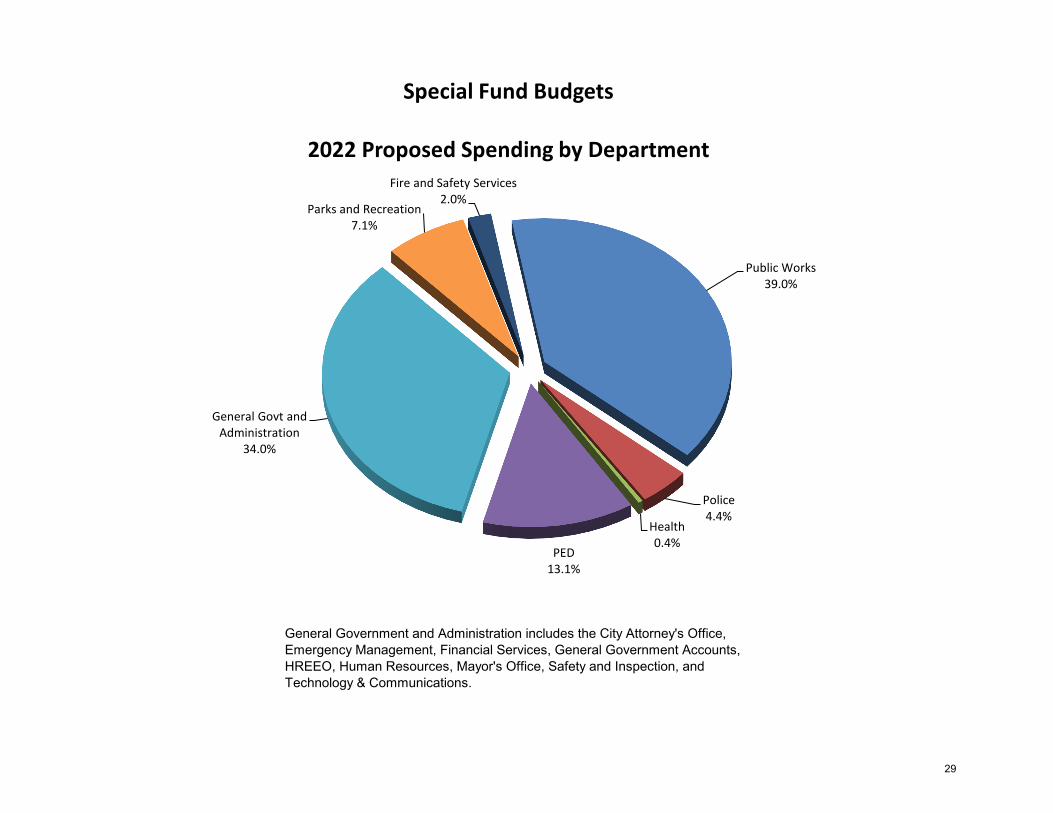
General Government and Administration includes the City Attorney's Office, Emergency Management, Financial Services, General Government Accounts, HREEO, Human Resources, Mayor's Office, Safety and Inspection, and Technology & Communications.
Public Works39.0%
Police4.4%
Health0.4%
PED13.1%
General Govt and Administration
34.0%
Parks and Recreation7.1%
Fire and Safety Services 2.0%
Special Fund Budgets
2022 Proposed Spending by Department
29
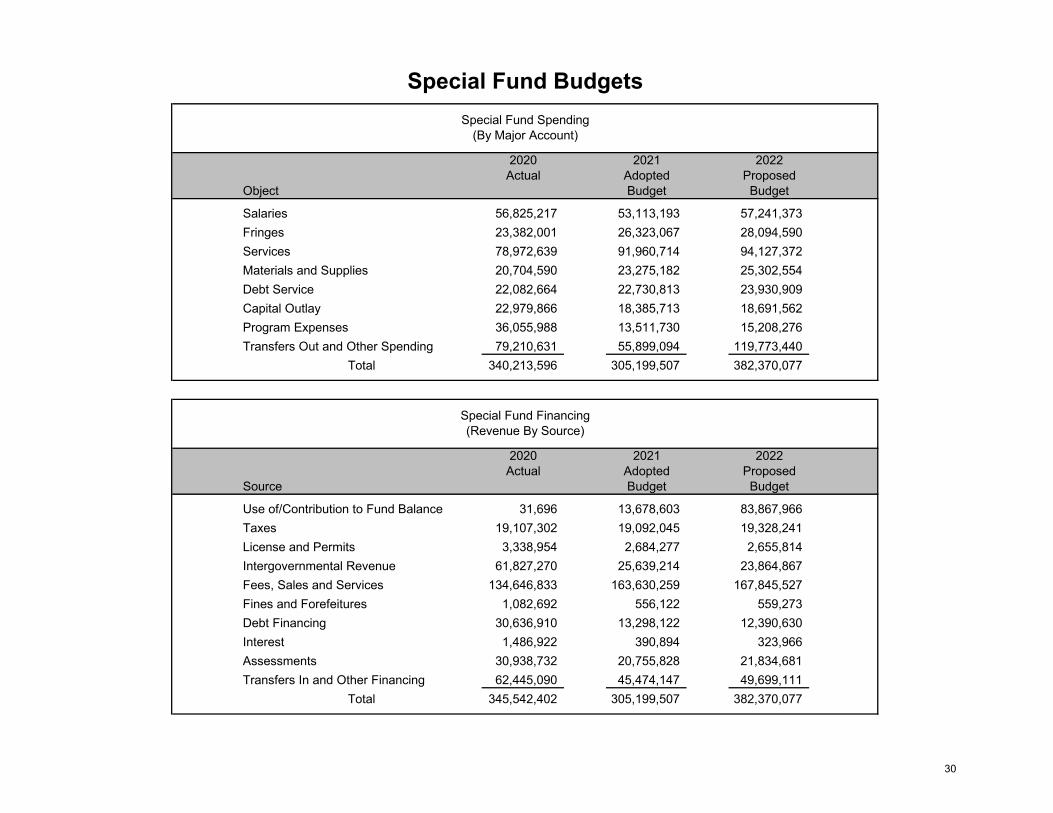
2020 2021 2022Actual Adopted Proposed
Object Budget Budget
Salaries 56,825,217 53,113,193 57,241,373Fringes 23,382,001 26,323,067 28,094,590Services 78,972,639 91,960,714 94,127,372Materials and Supplies 20,704,590 23,275,182 25,302,554Debt Service 22,082,664 22,730,813 23,930,909Capital Outlay 22,979,866 18,385,713 18,691,562Program Expenses 36,055,988 13,511,730 15,208,276Transfers Out and Other Spending 79,210,631 55,899,094 119,773,440
Total 340,213,596 305,199,507 382,370,077
2020 2021 2022Actual Adopted Proposed
Source Budget Budget
Use of/Contribution to Fund Balance 31,696 13,678,603 83,867,966Taxes 19,107,302 19,092,045 19,328,241License and Permits 3,338,954 2,684,277 2,655,814Intergovernmental Revenue 61,827,270 25,639,214 23,864,867Fees, Sales and Services 134,646,833 163,630,259 167,845,527Fines and Forefeitures 1,082,692 556,122 559,273Debt Financing 30,636,910 13,298,122 12,390,630Interest 1,486,922 390,894 323,966Assessments 30,938,732 20,755,828 21,834,681Transfers In and Other Financing 62,445,090 45,474,147 49,699,111
Total 345,542,402 305,199,507 382,370,077
(Revenue By Source)
Special Fund BudgetsSpecial Fund Spending
(By Major Account)
Special Fund Financing
30
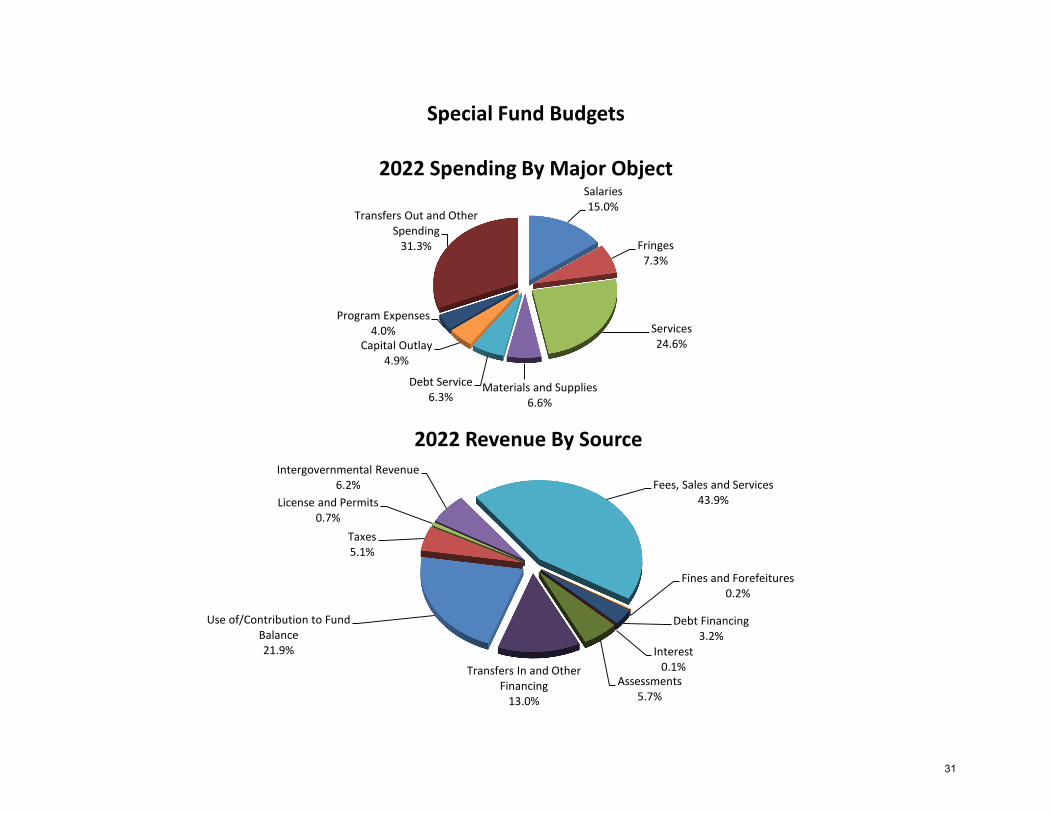
Use of/Contribution to Fund Balance21.9%
Taxes5.1%
License and Permits0.7%
Intergovernmental Revenue6.2% Fees, Sales and Services
43.9%
Fines and Forefeitures0.2%
Debt Financing3.2%
Interest0.1%
Assessments5.7%
Transfers In and Other Financing
13.0%
2022 Revenue By Source
Salaries15.0%
Fringes7.3%
Services24.6%
Materials and Supplies6.6%
Debt Service6.3%
Capital Outlay4.9%
Program Expenses4.0%
Transfers Out and Other Spending
31.3%
Special Fund Budgets
2022 Spending By Major Object
31

�
32
American Rescue Plan Act
33
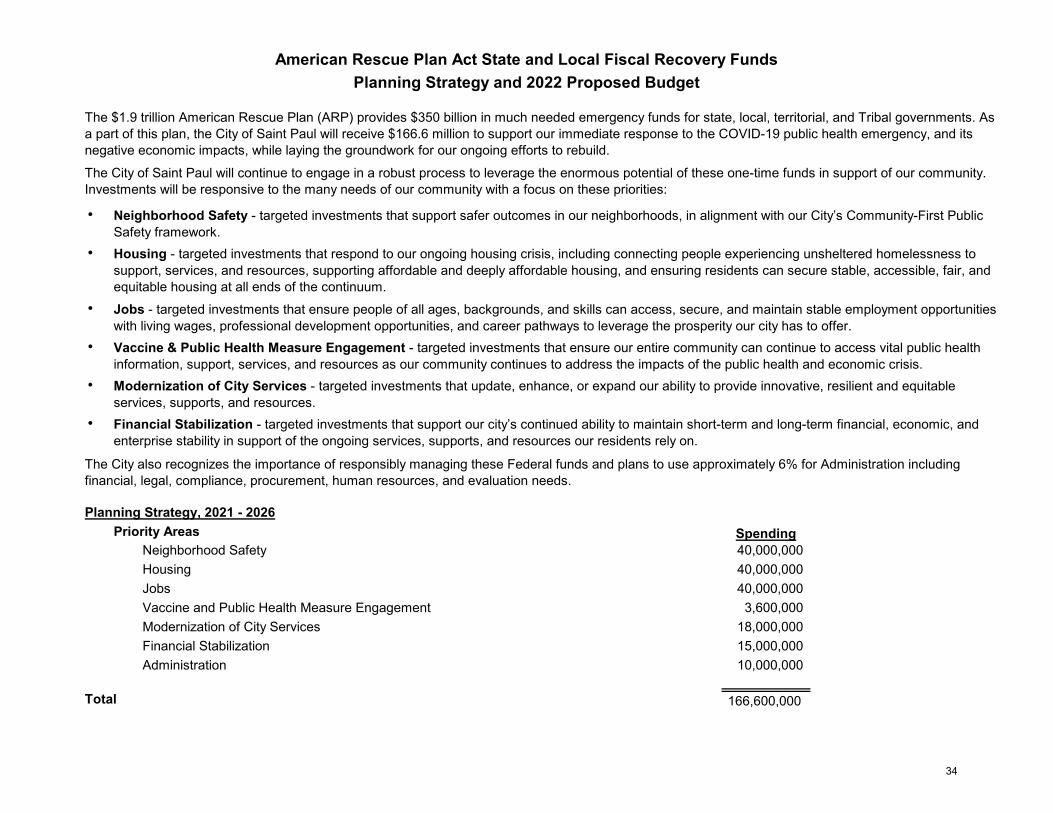
Planning Strategy, 2021 - 2026Priority Areas Spending
Neighborhood Safety 40,000,000 Housing 40,000,000 Jobs 40,000,000 Vaccine and Public Health Measure Engagement 3,600,000 Modernization of City Services 18,000,000 Financial Stabilization 15,000,000 Administration 10,000,000
Total 166,600,000
American Rescue Plan Act State and Local Fiscal Recovery FundsPlanning Strategy and 2022 Proposed Budget
The $1.9 trillion American Rescue Plan (ARP) provides $350 billion in much needed emergency funds for state, local, territorial, and Tribal governments. As a part of this plan, the City of Saint Paul will receive $166.6 million to support our immediate response to the COVID-19 public health emergency, and its negative economic impacts, while laying the groundwork for our ongoing efforts to rebuild.
The City of Saint Paul will continue to engage in a robust process to leverage the enormous potential of these one-time funds in support of our community. Investments will be responsive to the many needs of our community with a focus on these priorities:
Vaccine & Public Health Measure Engagement - targeted investments that ensure our entire community can continue to access vital public health information, support, services, and resources as our community continues to address the impacts of the public health and economic crisis. Modernization of City Services - targeted investments that update, enhance, or expand our ability to provide innovative, resilient and equitable services, supports, and resources. Financial Stabilization - targeted investments that support our city’s continued ability to maintain short-term and long-term financial, economic, and enterprise stability in support of the ongoing services, supports, and resources our residents rely on.
Neighborhood Safety - targeted investments that support safer outcomes in our neighborhoods, in alignment with our City’s Community-First Public Safety framework. Housing - targeted investments that respond to our ongoing housing crisis, including connecting people experiencing unsheltered homelessness to support, services, and resources, supporting affordable and deeply affordable housing, and ensuring residents can secure stable, accessible, fair, and equitable housing at all ends of the continuum. Jobs - targeted investments that ensure people of all ages, backgrounds, and skills can access, secure, and maintain stable employment opportunities with living wages, professional development opportunities, and career pathways to leverage the prosperity our city has to offer.
The City also recognizes the importance of responsibly managing these Federal funds and plans to use approximately 6% for Administration including financial, legal, compliance, procurement, human resources, and evaluation needs.
34
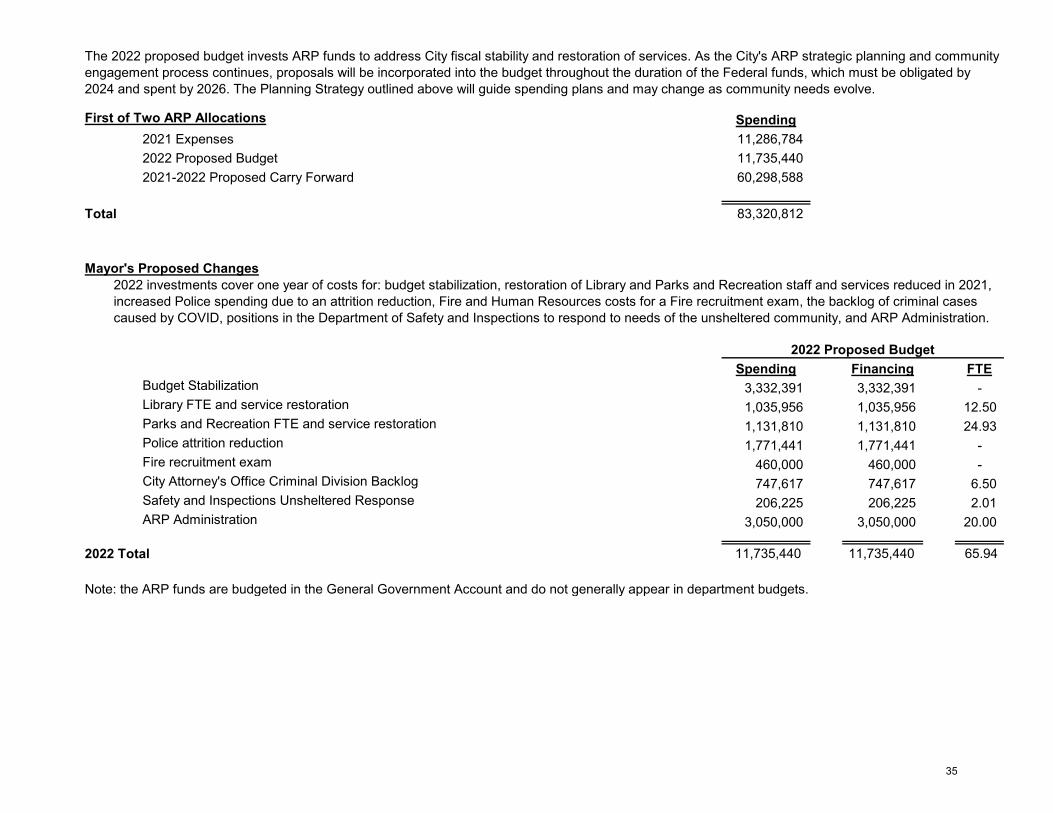
First of Two ARP Allocations Spending2021 Expenses 11,286,784 2022 Proposed Budget 11,735,440 2021-2022 Proposed Carry Forward 60,298,588
Total 83,320,812
Mayor's Proposed Changes
Spending Financing FTEBudget Stabilization 3,332,391 3,332,391 - Library FTE and service restoration 1,035,956 1,035,956 12.50 Parks and Recreation FTE and service restoration 1,131,810 1,131,810 24.93 Police attrition reduction 1,771,441 1,771,441 - Fire recruitment exam 460,000 460,000 - City Attorney's Office Criminal Division Backlog 747,617 747,617 6.50 Safety and Inspections Unsheltered Response 206,225 206,225 2.01 ARP Administration 3,050,000 3,050,000 20.00
2022 Total 11,735,440 11,735,440 65.94
Note: the ARP funds are budgeted in the General Government Account and do not generally appear in department budgets.
2022 investments cover one year of costs for: budget stabilization, restoration of Library and Parks and Recreation staff and services reduced in 2021, increased Police spending due to an attrition reduction, Fire and Human Resources costs for a Fire recruitment exam, the backlog of criminal cases caused by COVID, positions in the Department of Safety and Inspections to respond to needs of the unsheltered community, and ARP Administration.
2022 Proposed Budget
The 2022 proposed budget invests ARP funds to address City fiscal stability and restoration of services. As the City's ARP strategic planning and community engagement process continues, proposals will be incorporated into the budget throughout the duration of the Federal funds, which must be obligated by 2024 and spent by 2026. The Planning Strategy outlined above will guide spending plans and may change as community needs evolve.
35

�
36
City Debt Service
37
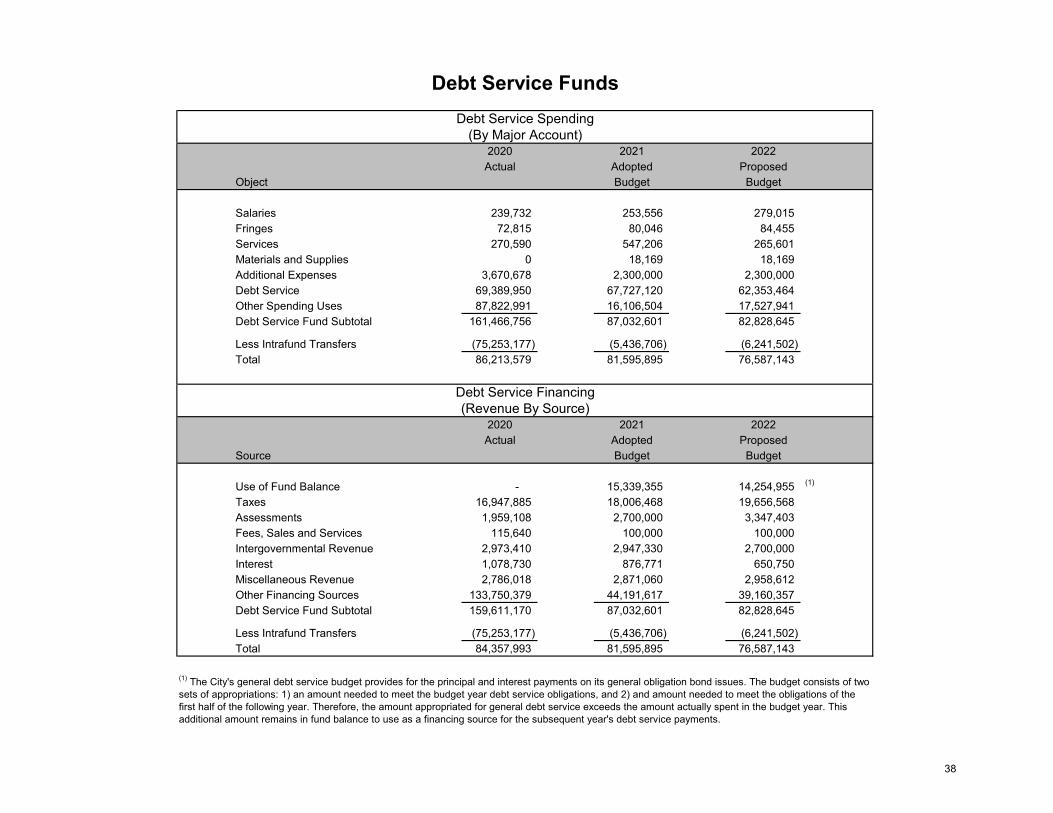
2020 2021 2022Actual Adopted Proposed
Object Budget Budget
Salaries 239,732 253,556 279,015Fringes 72,815 80,046 84,455Services 270,590 547,206 265,601Materials and Supplies 0 18,169 18,169Additional Expenses 3,670,678 2,300,000 2,300,000Debt Service 69,389,950 67,727,120 62,353,464Other Spending Uses 87,822,991 16,106,504 17,527,941Debt Service Fund Subtotal 161,466,756 87,032,601 82,828,645
Less Intrafund Transfers (75,253,177) (5,436,706) (6,241,502)Total 86,213,579 81,595,895 76,587,143
2020 2021 2022Actual Adopted Proposed
Source Budget Budget
Use of Fund Balance - 15,339,355 14,254,955 (1)
Taxes 16,947,885 18,006,468 19,656,568Assessments 1,959,108 2,700,000 3,347,403Fees, Sales and Services 115,640 100,000 100,000Intergovernmental Revenue 2,973,410 2,947,330 2,700,000Interest 1,078,730 876,771 650,750Miscellaneous Revenue 2,786,018 2,871,060 2,958,612Other Financing Sources 133,750,379 44,191,617 39,160,357Debt Service Fund Subtotal 159,611,170 87,032,601 82,828,645
Less Intrafund Transfers (75,253,177) (5,436,706) (6,241,502)Total 84,357,993 81,595,895 76,587,143
Debt Service FundsDebt Service Spending
(By Major Account)
Debt Service Financing(Revenue By Source)
(1) The City's general debt service budget provides for the principal and interest payments on its general obligation bond issues. The budget consists of two sets of appropriations: 1) an amount needed to meet the budget year debt service obligations, and 2) and amount needed to meet the obligations of the first half of the following year. Therefore, the amount appropriated for general debt service exceeds the amount actually spent in the budget year. This additional amount remains in fund balance to use as a financing source for the subsequent year's debt service payments.
38
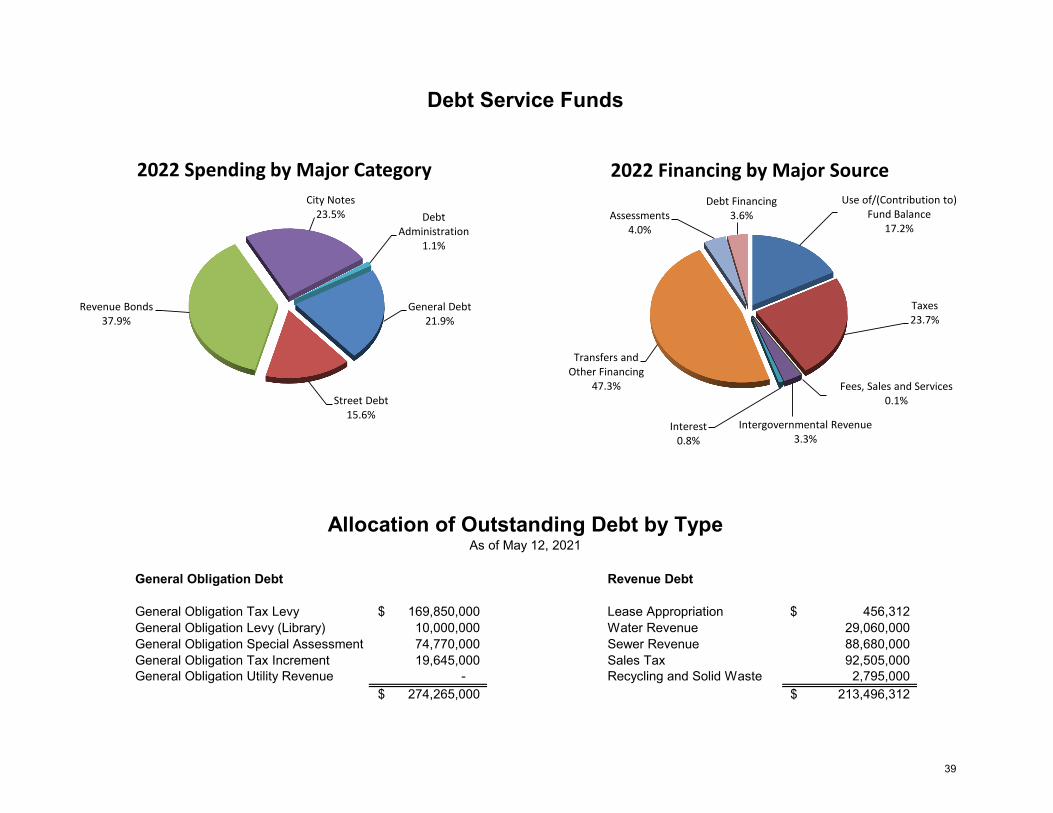
General Obligation Debt Revenue Debt
General Obligation Tax Levy Lease AppropriationGeneral Obligation Levy (Library) Water RevenueGeneral Obligation Special Assessment Sewer RevenueGeneral Obligation Tax Increment Sales TaxGeneral Obligation Utility Revenue Recycling and Solid Waste 2,795,000
74,770,000 19,645,000
- 274,265,000$
Debt Service Funds
Allocation of Outstanding Debt by TypeAs of May 12, 2021
169,850,000$ 10,000,000
213,496,312$
456,312$ 29,060,000 88,680,000 92,505,000
Use of/(Contribution to) Fund Balance
17.2%
Taxes23.7%
Fees, Sales and Services0.1%
Intergovernmental Revenue3.3%
Interest0.8%
Transfers and Other Financing
47.3%
Assessments4.0%
Debt Financing3.6%
2022 Financing by Major Source
General Debt21.9%
Street Debt15.6%
Revenue Bonds37.9%
City Notes23.5% Debt
Administration1.1%
2022 Spending by Major Category
39
Spending Reports 40

CITY OF SAINT PAULSpending Plan by Department
Department:Fund: Budget Year: 2022
FINANCIAL SERVICES GENERAL DEBT ADMINISTRATION
2019Actuals
Change From
2020Actuals
2021Adopted
2022Mayor's
Proposed
2021Adopted
Spending by Major Account
252,574 312,547 333,602 363,471 EMPLOYEE EXPENSE 29,868 161,667 213,505 236,356 236,451 SERVICES 95
2,150 18,169 18,169 MATERIALS AND SUPPLIES 5,503 312,500 312,500 DEBT SERVICE
8,671,743 882,725 407 494 OTHER FINANCING USES 87
30,050 931,084 901,034 1,408,777 9,093,637 Total Spending by Major Account
Spending by Accounting UnitGENERAL DEBT ADMINISTRATION 9,093,637 931,084 901,034 1,408,777 30013190 30,050
Total Spending by Accounting Unit 9,093,637 931,084 30,050 1,408,777 901,034
41
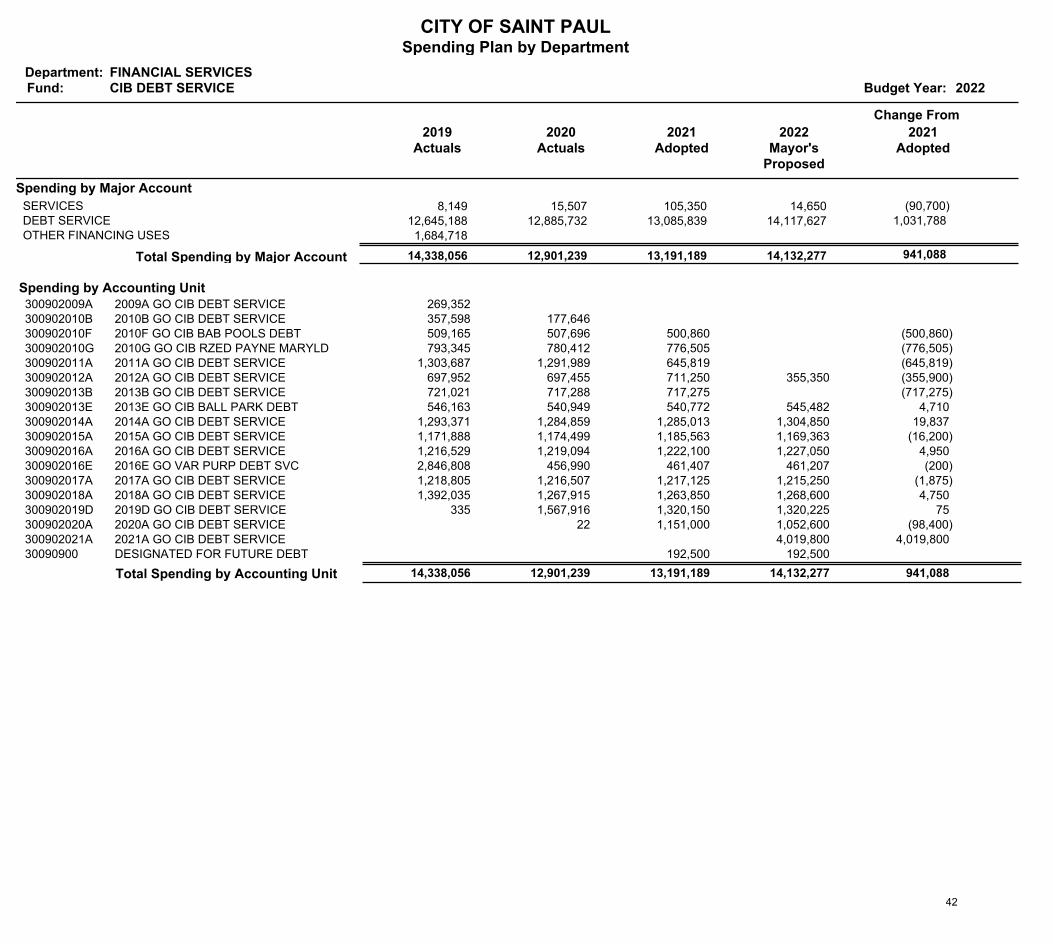
CITY OF SAINT PAULSpending Plan by Department
Department:Fund: Budget Year: 2022
FINANCIAL SERVICES CIB DEBT SERVICE
2019Actuals
Change From
2020Actuals
2021Adopted
2022Mayor's
Proposed
2021Adopted
Spending by Major Account
8,149 15,507 105,350 14,650 SERVICES (90,700) 12,645,188 12,885,732 13,085,839 14,117,627 DEBT SERVICE 1,031,788 1,684,718 OTHER FINANCING USES
941,088 14,132,277 13,191,189 12,901,239 14,338,056 Total Spending by Major Account
Spending by Accounting Unit2009A GO CIB DEBT SERVICE 269,352 300902009A2010B GO CIB DEBT SERVICE 357,598 177,646 300902010B2010F GO CIB BAB POOLS DEBT 509,165 500,860 507,696 300902010F (500,860)2010G GO CIB RZED PAYNE MARYLD 793,345 776,505 780,412 300902010G (776,505)2011A GO CIB DEBT SERVICE 1,303,687 645,819 1,291,989 300902011A (645,819)2012A GO CIB DEBT SERVICE 697,952 355,350 711,250 697,455 300902012A (355,900)2013B GO CIB DEBT SERVICE 721,021 717,275 717,288 300902013B (717,275)2013E GO CIB BALL PARK DEBT 546,163 545,482 540,772 540,949 300902013E 4,710 2014A GO CIB DEBT SERVICE 1,293,371 1,304,850 1,285,013 1,284,859 300902014A 19,837 2015A GO CIB DEBT SERVICE 1,171,888 1,169,363 1,185,563 1,174,499 300902015A (16,200)2016A GO CIB DEBT SERVICE 1,216,529 1,227,050 1,222,100 1,219,094 300902016A 4,950 2016E GO VAR PURP DEBT SVC 2,846,808 461,207 461,407 456,990 300902016E (200)2017A GO CIB DEBT SERVICE 1,218,805 1,215,250 1,217,125 1,216,507 300902017A (1,875)2018A GO CIB DEBT SERVICE 1,392,035 1,268,600 1,263,850 1,267,915 300902018A 4,750 2019D GO CIB DEBT SERVICE 335 1,320,225 1,320,150 1,567,916 300902019D 75 2020A GO CIB DEBT SERVICE 1,052,600 1,151,000 22 300902020A (98,400)2021A GO CIB DEBT SERVICE 4,019,800 300902021A 4,019,800 DESIGNATED FOR FUTURE DEBT 192,500 192,500 30090900
Total Spending by Accounting Unit 14,338,056 14,132,277 941,088 12,901,239 13,191,189
42
CITY OF SAINT PAULSpending Plan by Department
Department:Fund: Budget Year: 2022
FINANCIAL SERVICES GO SA DEBT SERVICE
2019Actuals
Change From
2020Actuals
2021Adopted
2022Mayor's
Proposed
2021Adopted
Spending by Major Account
10,260 22,554 202,850 10,600 SERVICES (192,250) 16,260,194 35,001,892 18,997,620 12,937,874 DEBT SERVICE (6,059,746) 4,423,968 6,275,000 OTHER FINANCING USES
(6,251,996) 12,948,474 19,200,470 41,299,445 20,694,422 Total Spending by Major Account
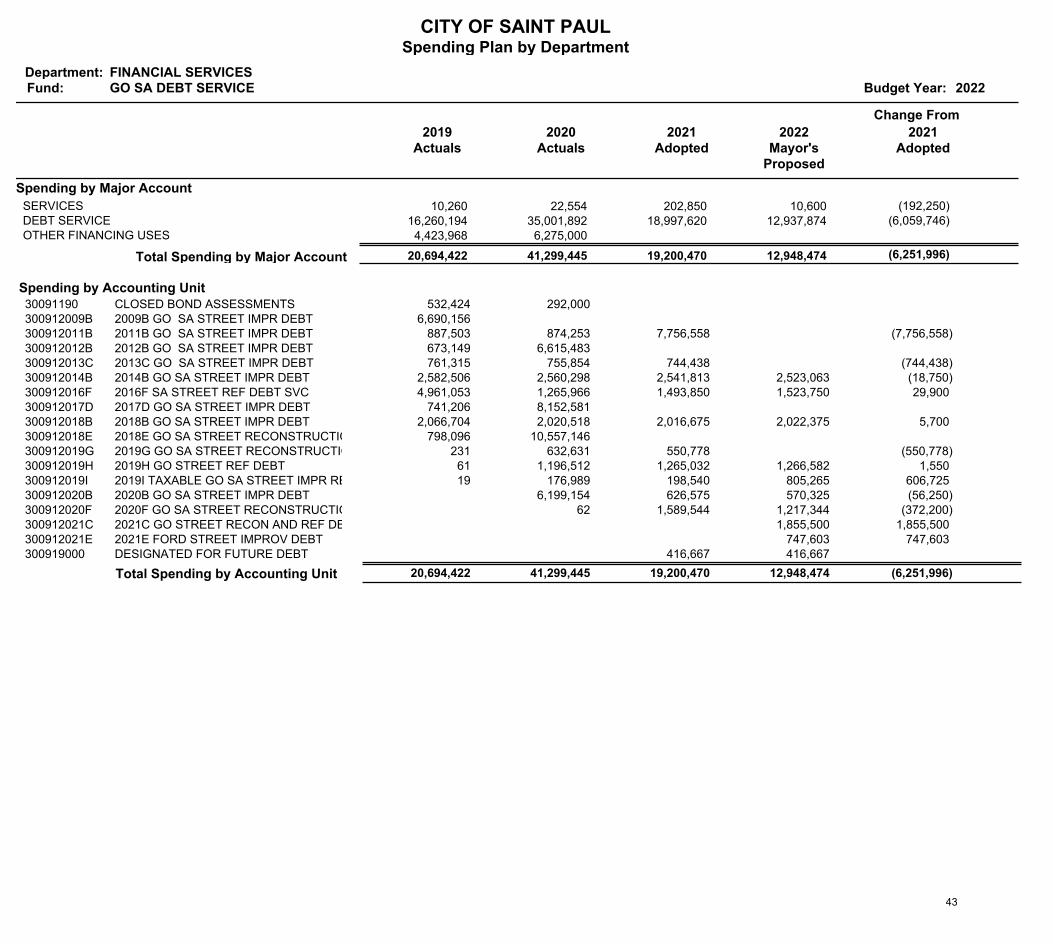
Spending by Accounting UnitCLOSED BOND ASSESSMENTS 532,424 292,000 300911902009B GO SA STREET IMPR DEBT 6,690,156 300912009B2011B GO SA STREET IMPR DEBT 887,503 7,756,558 874,253 300912011B (7,756,558)2012B GO SA STREET IMPR DEBT 673,149 6,615,483 300912012B2013C GO SA STREET IMPR DEBT 761,315 744,438 755,854 300912013C (744,438)2014B GO SA STREET IMPR DEBT 2,582,506 2,523,063 2,541,813 2,560,298 300912014B (18,750)2016F SA STREET REF DEBT SVC 4,961,053 1,523,750 1,493,850 1,265,966 300912016F 29,900 2017D GO SA STREET IMPR DEBT 741,206 8,152,581 300912017D2018B GO SA STREET IMPR DEBT 2,066,704 2,022,375 2,016,675 2,020,518 300912018B 5,700 2018E GO SA STREET RECONSTRUCTION DEBT 798,096 10,557,146 300912018E2019G GO SA STREET RECONSTRUCTION DEBT 231 550,778 632,631 300912019G (550,778)2019H GO STREET REF DEBT 61 1,266,582 1,265,032 1,196,512 300912019H 1,550 2019I TAXABLE GO SA STREET IMPR REF DEBT 19 805,265 198,540 176,989 300912019I 606,725 2020B GO SA STREET IMPR DEBT 570,325 626,575 6,199,154 300912020B (56,250)2020F GO SA STREET RECONSTRUCTION DEBT 1,217,344 1,589,544 62 300912020F (372,200)2021C GO STREET RECON AND REF DEBT 1,855,500 300912021C 1,855,500 2021E FORD STREET IMPROV DEBT 747,603 300912021E 747,603 DESIGNATED FOR FUTURE DEBT 416,667 416,667 300919000
Total Spending by Accounting Unit 20,694,422 12,948,474 (6,251,996) 41,299,445 19,200,470
43
CITY OF SAINT PAULSpending Plan by Department
Department:Fund: Budget Year: 2022
FINANCIAL SERVICES LIBRARY DEBT SERVICE
2019Actuals
Change From
2020Actuals
2021Adopted
2022Mayor's
Proposed
2021Adopted
Spending by Major Account
1,038 1,571 300 150 SERVICES (150) 1,756,733 1,688,983 1,592,484 1,420,507 DEBT SERVICE (171,977)
(172,127) 1,420,657 1,592,784 1,690,554 1,757,771 Total Spending by Major Account
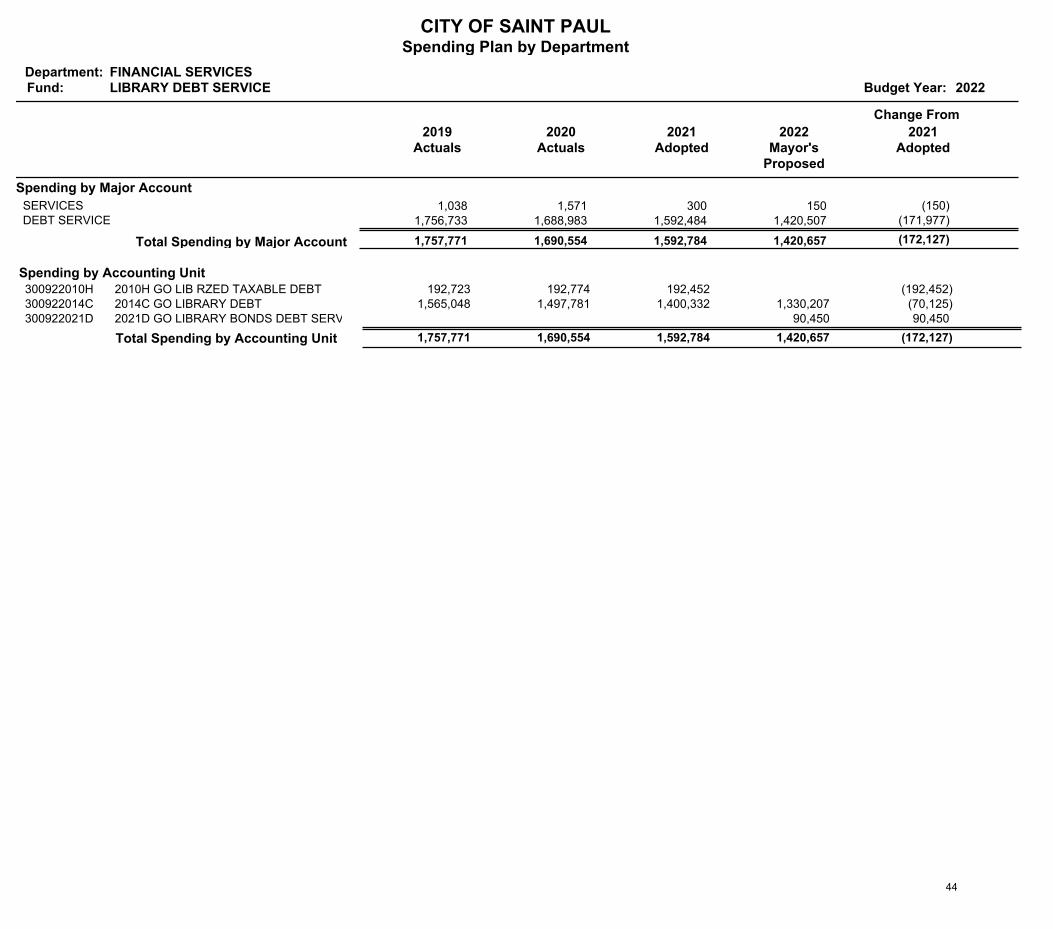
Spending by Accounting Unit2010H GO LIB RZED TAXABLE DEBT 192,723 192,452 192,774 300922010H (192,452)2014C GO LIBRARY DEBT 1,565,048 1,330,207 1,400,332 1,497,781 300922014C (70,125)2021D GO LIBRARY BONDS DEBT SERVICE 90,450 300922021D 90,450
Total Spending by Accounting Unit 1,757,771 1,420,657 (172,127) 1,690,554 1,592,784
44
CITY OF SAINT PAULSpending Plan by Department
Department:Fund: Budget Year: 2022
FINANCIAL SERVICES OTHER GO DEBT SERVICE
2019Actuals
Change From
2020Actuals
2021Adopted
2022Mayor's
Proposed
2021Adopted
Spending by Major Account
1,989 3,334 1,600 600 SERVICES (1,000) 13,064,767 3,638,327 3,679,591 2,587,432 DEBT SERVICE (1,092,159) 9,303,523 OTHER FINANCING USES
(1,093,159) 2,588,032 3,681,191 3,641,661 22,370,279 Total Spending by Major Account
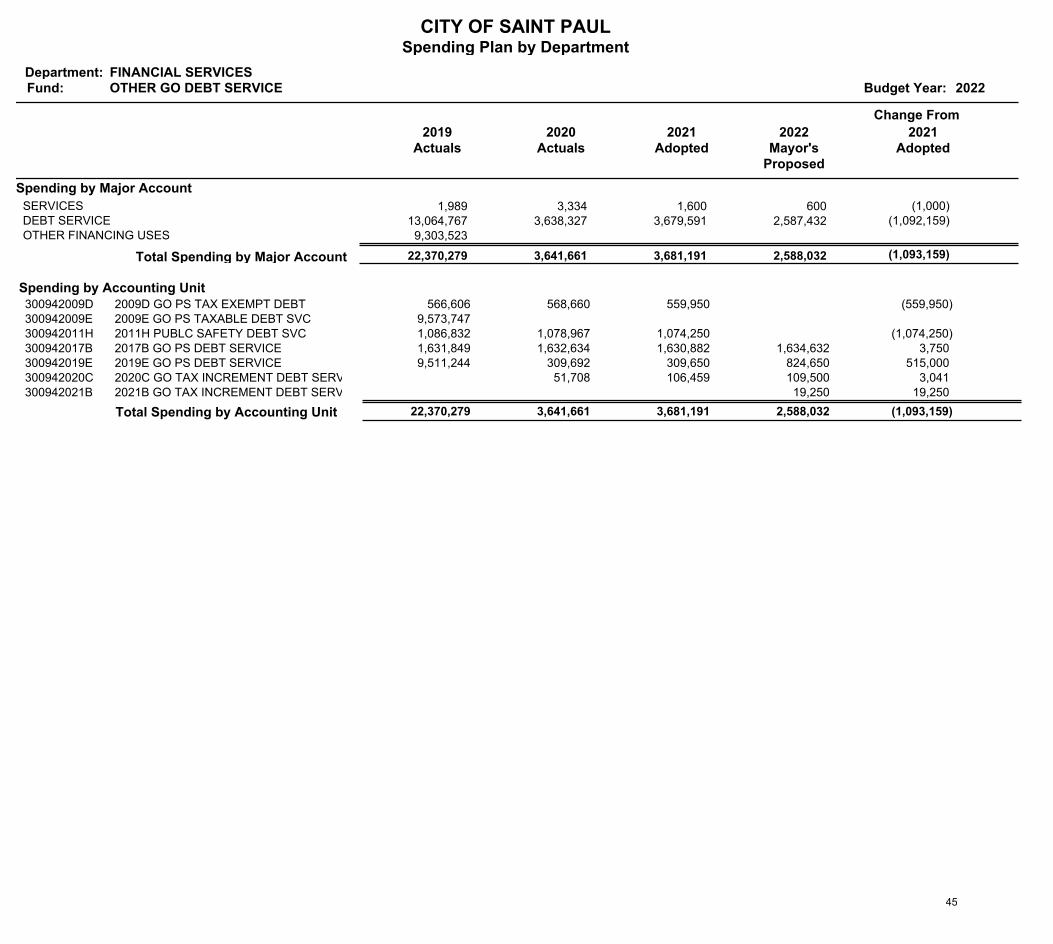
Spending by Accounting Unit2009D GO PS TAX EXEMPT DEBT 566,606 559,950 568,660 300942009D (559,950)2009E GO PS TAXABLE DEBT SVC 9,573,747 300942009E2011H PUBLC SAFETY DEBT SVC 1,086,832 1,074,250 1,078,967 300942011H (1,074,250)2017B GO PS DEBT SERVICE 1,631,849 1,634,632 1,630,882 1,632,634 300942017B 3,750 2019E GO PS DEBT SERVICE 9,511,244 824,650 309,650 309,692 300942019E 515,000 2020C GO TAX INCREMENT DEBT SERVICE 109,500 106,459 51,708 300942020C 3,041 2021B GO TAX INCREMENT DEBT SERVICE 19,250 300942021B 19,250
Total Spending by Accounting Unit 22,370,279 2,588,032 (1,093,159) 3,641,661 3,681,191
45
CITY OF SAINT PAULSpending Plan by Department
Department:Fund: Budget Year: 2022
FINANCIAL SERVICES REVENUE DEBT SERVICE
2019Actuals
Change From
2020Actuals
2021Adopted
2022Mayor's
Proposed
2021Adopted
Spending by Major Account
10,194 SERVICES 3,759,675 3,670,678 2,300,000 2,300,000 ADDITIONAL EXPENSES
73,243,588 11,350,869 11,386,569 11,532,440 DEBT SERVICE 145,871 16,567,566 80,665,266 16,106,097 17,527,447 OTHER FINANCING USES 1,421,350
1,567,221 31,359,887 29,792,666 95,686,814 93,581,023 Total Spending by Major Account
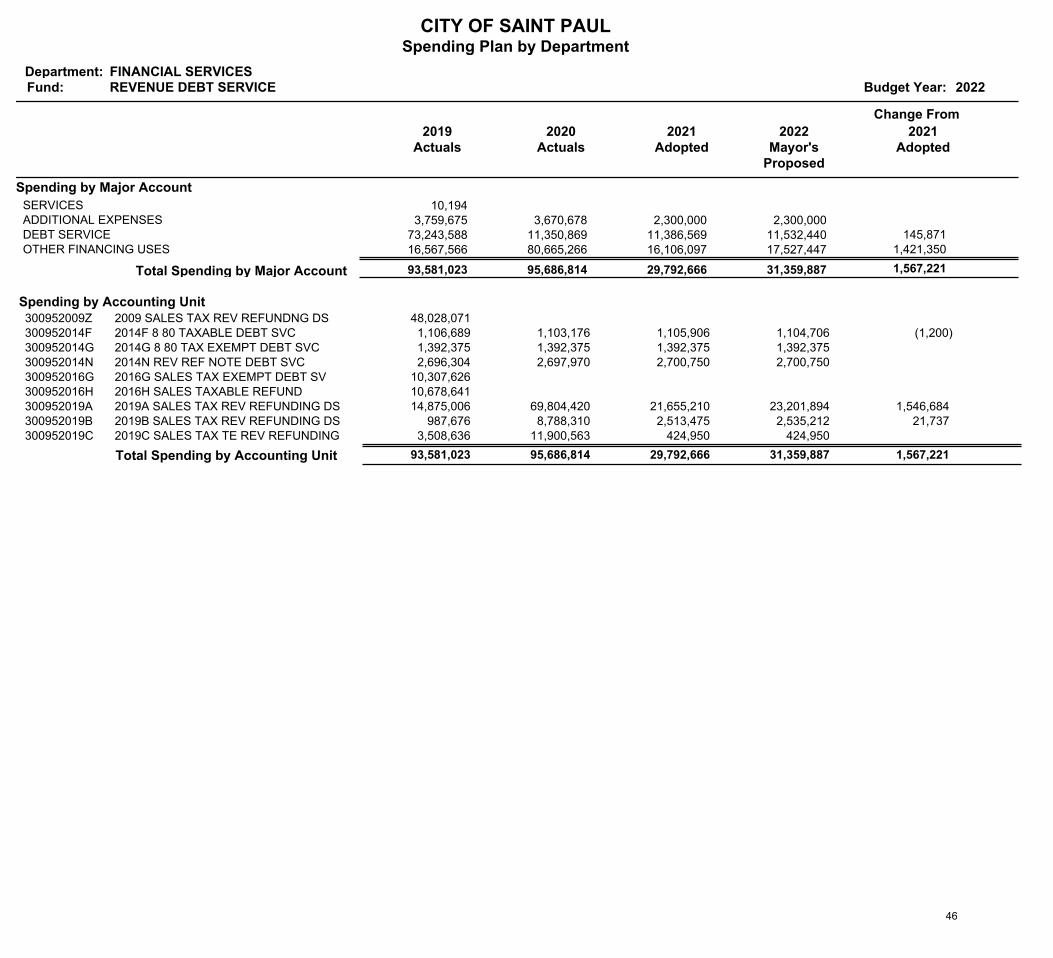
Spending by Accounting Unit2009 SALES TAX REV REFUNDNG DS 48,028,071 300952009Z2014F 8 80 TAXABLE DEBT SVC 1,106,689 1,104,706 1,105,906 1,103,176 300952014F (1,200)2014G 8 80 TAX EXEMPT DEBT SVC 1,392,375 1,392,375 1,392,375 1,392,375 300952014G2014N REV REF NOTE DEBT SVC 2,696,304 2,700,750 2,700,750 2,697,970 300952014N2016G SALES TAX EXEMPT DEBT SV 10,307,626 300952016G2016H SALES TAXABLE REFUND 10,678,641 300952016H2019A SALES TAX REV REFUNDING DS 14,875,006 23,201,894 21,655,210 69,804,420 300952019A 1,546,684 2019B SALES TAX REV REFUNDING DS 987,676 2,535,212 2,513,475 8,788,310 300952019B 21,737 2019C SALES TAX TE REV REFUNDING DS 3,508,636 424,950 424,950 11,900,563 300952019C
Total Spending by Accounting Unit 93,581,023 31,359,887 1,567,221 95,686,814 29,792,666
46
CITY OF SAINT PAULSpending Plan by Department
Department:Fund: Budget Year: 2022
FINANCIAL SERVICES GO NOTES DEBT SERVICE
2019Actuals
Change From
2020Actuals
2021Adopted
2022Mayor's
Proposed
2021Adopted
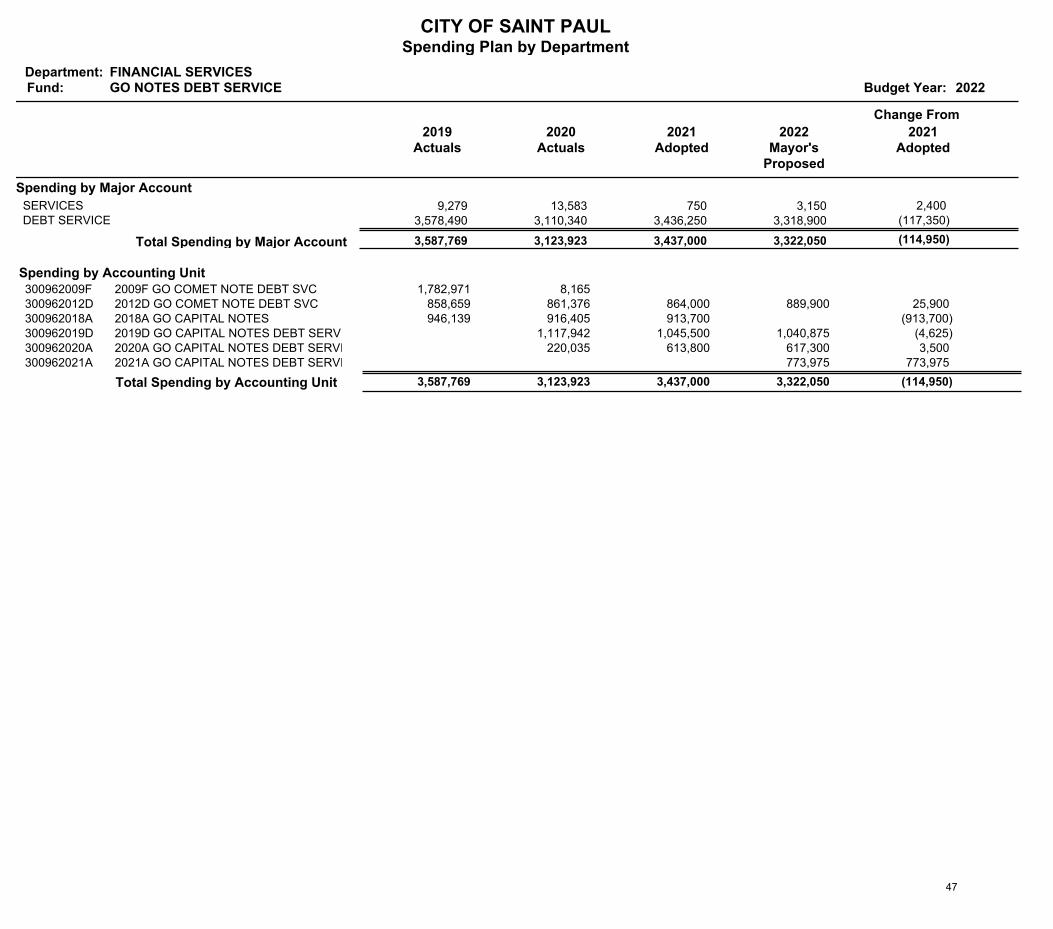
Spending by Major Account
9,279 13,583 750 3,150 SERVICES 2,400 3,578,490 3,110,340 3,436,250 3,318,900 DEBT SERVICE (117,350)
(114,950) 3,322,050 3,437,000 3,123,923 3,587,769 Total Spending by Major Account
Spending by Accounting Unit2009F GO COMET NOTE DEBT SVC 1,782,971 8,165 300962009F2012D GO COMET NOTE DEBT SVC 858,659 889,900 864,000 861,376 300962012D 25,900 2018A GO CAPITAL NOTES 946,139 913,700 916,405 300962018A (913,700)2019D GO CAPITAL NOTES DEBT SERVICE 1,040,875 1,045,500 1,117,942 300962019D (4,625)2020A GO CAPITAL NOTES DEBT SERVICE 617,300 613,800 220,035 300962020A 3,500 2021A GO CAPITAL NOTES DEBT SERVICE 773,975 300962021A 773,975
Total Spending by Accounting Unit 3,587,769 3,322,050 (114,950) 3,123,923 3,437,000
47
CITY OF SAINT PAULSpending Plan by Department
Department:Fund: Budget Year: 2022
FINANCIAL SERVICES REVENUE NOTES DEBT SERVICE
2019Actuals
Change From
2020Actuals
2021Adopted
2022Mayor's
Proposed
2021Adopted
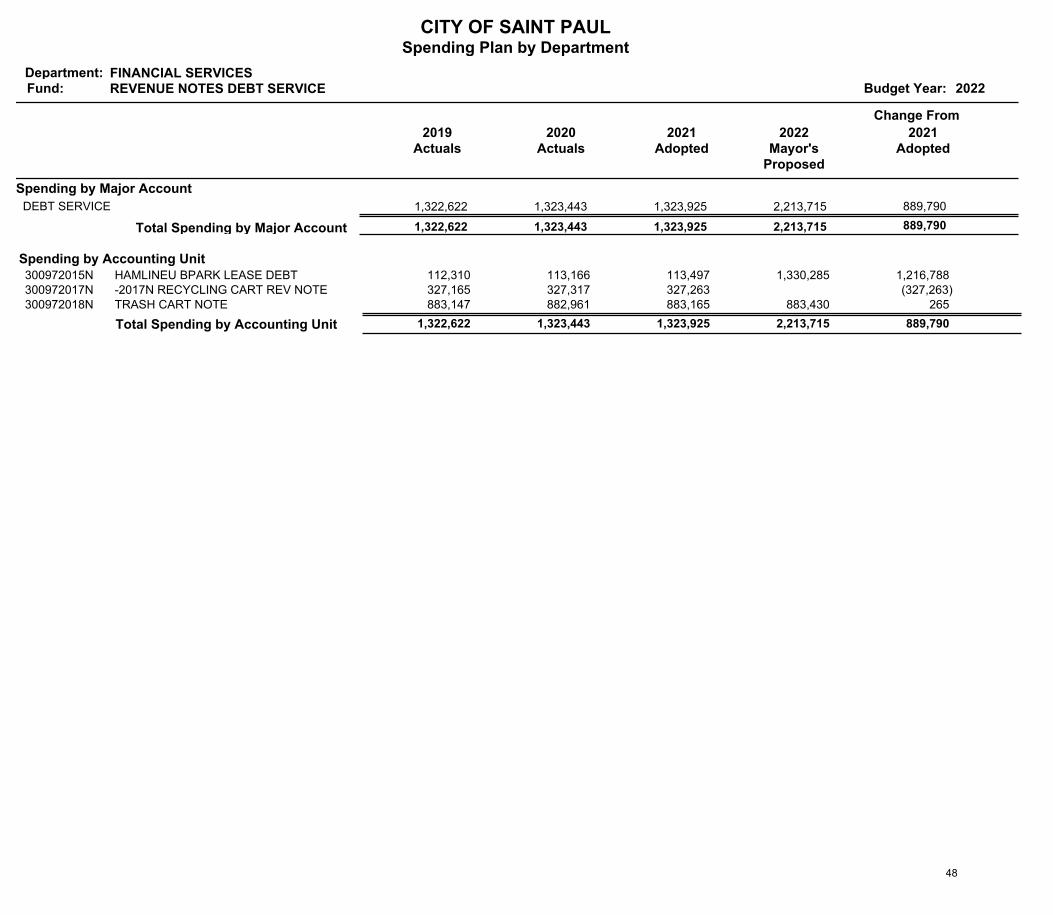
Spending by Major Account
1,322,622 1,323,443 1,323,925 2,213,715 DEBT SERVICE 889,790
889,790 2,213,715 1,323,925 1,323,443 1,322,622 Total Spending by Major Account
Spending by Accounting UnitHAMLINEU BPARK LEASE DEBT 112,310 1,330,285 113,497 113,166 300972015N 1,216,788 -2017N RECYCLING CART REV NOTE 327,165 327,263 327,317 300972017N (327,263)TRASH CART NOTE 883,147 883,430 883,165 882,961 300972018N 265
Total Spending by Accounting Unit 1,322,622 2,213,715 889,790 1,323,443 1,323,925
48
CITY OF SAINT PAULSpending Plan by Department
Department:Fund: Budget Year: 2022
FINANCIAL SERVICES OTHER DEBT SERVICE
2019Actuals
Change From
2020Actuals
2021Adopted
2022Mayor's
Proposed
2021Adopted
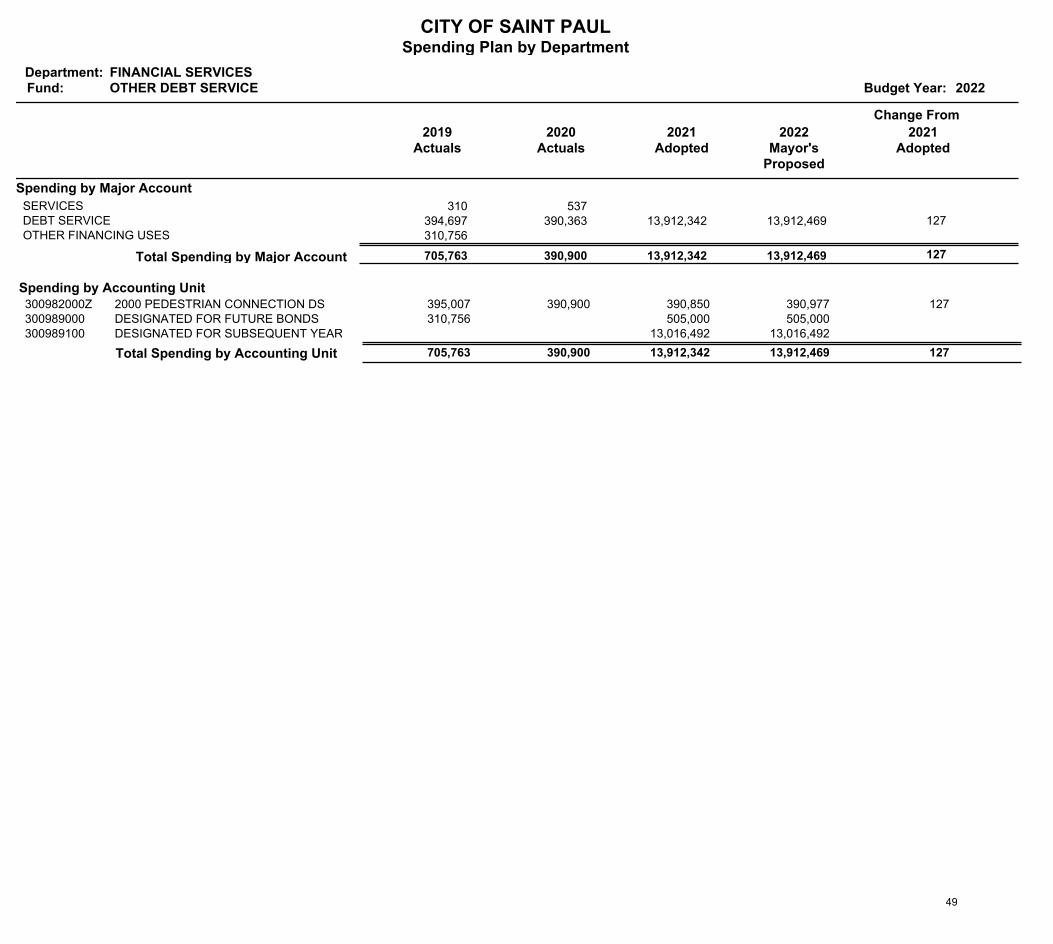
Spending by Major Account
310 537 SERVICES 394,697 390,363 13,912,342 13,912,469 DEBT SERVICE 127 310,756 OTHER FINANCING USES
127 13,912,469 13,912,342 390,900 705,763 Total Spending by Major Account
Spending by Accounting Unit2000 PEDESTRIAN CONNECTION DS 395,007 390,977 390,850 390,900 300982000Z 127 DESIGNATED FOR FUTURE BONDS 310,756 505,000 505,000 300989000DESIGNATED FOR SUBSEQUENT YEAR 13,016,492 13,016,492 300989100
Total Spending by Accounting Unit 705,763 13,912,469 127 390,900 13,912,342
49

Financing Reports 50
Department: FINANCIAL SERVICES Budget Year: 2022Fund: CITY DEBT
Change From2019 2020 2021 2022 2021
Actuals Actuals Adopted Proposed Adopted
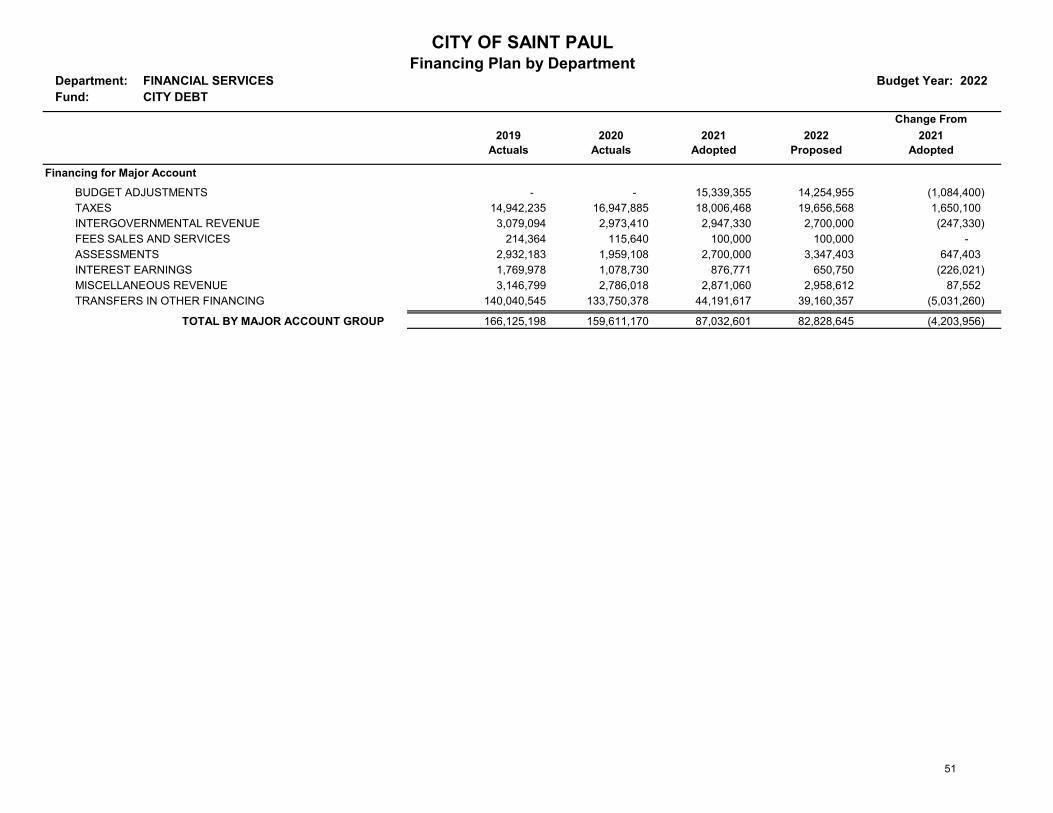
Financing for Major AccountBUDGET ADJUSTMENTS - - 15,339,355 14,254,955 (1,084,400) TAXES 14,942,235 16,947,885 18,006,468 19,656,568 1,650,100 INTERGOVERNMENTAL REVENUE 3,079,094 2,973,410 2,947,330 2,700,000 (247,330) FEES SALES AND SERVICES 214,364 115,640 100,000 100,000 - ASSESSMENTS 2,932,183 1,959,108 2,700,000 3,347,403 647,403 INTEREST EARNINGS 1,769,978 1,078,730 876,771 650,750 (226,021) MISCELLANEOUS REVENUE 3,146,799 2,786,018 2,871,060 2,958,612 87,552 TRANSFERS IN OTHER FINANCING 140,040,545 133,750,378 44,191,617 39,160,357 (5,031,260)
TOTAL BY MAJOR ACCOUNT GROUP 166,125,198 159,611,170 87,032,601 82,828,645 (4,203,956)
CITY OF SAINT PAULFinancing Plan by Department
51
Department: FINANCIAL SERVICES Budget Year: 2022Fund: CITY DEBT
Change From2019 2020 2021 2022 2021
Actuals Actuals Adopted Proposed Adopted
CITY OF SAINT PAULFinancing Plan by Department
Financing by Accounting Unit30013190 GENERAL DEBT ADMINISTRATION 1,289,347 1,030,622 901,034 931,084 30,050 30090900 DESIGNATED FOR FUTURE DEBT - - 192,500 192,500 - 30091190 CLOSED BOND ASSESSMENTS 274,563 193,503 - - - 30091900 DESIGNATED FOR FUTURE DEBT - - 416,667 416,667 -
300989000 DESIGNATED FOR FUTURE DEBT 882,204 362,464 505,000 505,000 - 300989100 DESIGNATED FOR SUBSEQUENT YEAR - 25,890 13,016,492 13,016,492 -
300902009A 2009 GO CIB DEBT SERVICE 540,186 - - - - 300902010B 2010 GO CIB DEBT SERVICE 496,916 91,856 - - - 300902010F 2010F BUILD AMERICA BONDS 420,321 504,119 500,860 - (500,860) 300902010G 2010G RZED PAYNE MARLD REC CT 483,340 737,853 776,505 - (776,505) 300902011A 2011A GO CIB DEBT SERVICE 3,149,389 1,952,532 645,819 - (645,819) 300902012A 2012A GO CIB DEBT SERVICE 1,056,041 700,379 711,250 355,350 (355,900) 300902013B 2013B GO CIB DEBT SERVICE 1,437,918 723,368 717,275 - (717,275) 300902013E 2013E GO CIB BALL PARK DEBT 888,283 689,720 540,772 545,482 4,710 300902014A 2014A GO CIB DEBT SERVICE 1,290,985 1,087,777 1,285,013 1,304,850 19,837 300902015A 2015A GO CIB DEBT SERVICE 1,168,730 1,178,395 1,185,563 1,169,363 (16,200) 300902016A 2016A GO CIB DEBT SERVICE 1,511,274 1,024,178 1,222,100 1,227,050 4,950 300902016E 2016E GO VAR PURP DEBT SVC 1,258,135 965,589 461,407 461,207 (200) 300902017A 2017A GO CIB DEBT SERVICE 1,560,220 1,363,239 1,217,125 1,215,250 (1,875) 300902018A 2018A GO CIB DEBT SERVICE 1,376,007 304,239 1,263,850 1,268,600 4,750 300902019D 2019D GO CIB DEBT SERVICE 1,343,902 561,169 1,320,150 1,320,225 75 300902020A 2020A GO CIB DEBT SERVICE - 43,278 1,151,000 1,052,600 (98,400) 300902021A 2021A GO CIB DEBT SERVICE - - - 4,019,800 4,019,800 300912008B 2008B GO SA STREET IMPR DEBT 356,251 - - - - 300912009B 2009B GO SA STREET IMPR DEBT 7,824,738 - - - - 300912011B 2011B GO SA STREET IMPR DEBT 1,062,787 681,672 7,756,558 - (7,756,558) 300912012B 2012B GO SA STREET IMPR DEBT 143,463 6,324,266 - - - 300912013C 2013C GO SA STREET IMPR DEBT 721,376 868,706 744,438 - (744,438) 300912014B 2014B GO SA STREET IMPR DEBT 1,984,518 1,368,465 2,541,813 2,523,063 (18,750) 300912015C 2015C GO SA STREET IMPR DEBT 5,267 - - - - 300912016C 2016C GO SA STRETT IMPR DEBT 85,199 - - - - 300912016F 2016F SA STREET REF DEBT SVC 181,096 2,477,470 1,493,850 1,523,750 29,900 300912017D 2017D GO SA STREET IMPR DEBT 684,806 8,164,646 - - - 300912018B 2018B GO SA STREET IMPR DEBT 2,644,898 2,939,132 2,016,675 2,022,375 5,700 300912018E 2018E GO SA STREET RECONSTRUCTION DEBT 263,642 10,529,610 - - - 300912019G 2019G GO SA STREET RECONSTRUCTION DEBT 589,498 51,677 550,778 - (550,778) 300912019H 2019H GO STREET REF DEBT 276,073 55,558 1,265,032 1,266,582 1,550 300912019I 2019I TAXABLE GO SA STREET IMP REF DEBT 91,865 254,700 198,540 805,265 606,725
52
Department: FINANCIAL SERVICES Budget Year: 2022Fund: CITY DEBT
Change From2019 2020 2021 2022 2021
Actuals Actuals Adopted Proposed Adopted
CITY OF SAINT PAULFinancing Plan by Department
300912020B 2020B GO SA STREET IMPR DEBT - 6,570,978 626,575 570,325 (56,250) 300912020F 2020F GO SA STREET RECONSTRUCTION DEBT - 88,077 1,589,544 1,217,344 (372,200) 300912021C 2021C GO STREET RECON AND REF DEBT - - - 1,855,500 1,855,500 300912021E 2021E FORD STREET IMPROV DEBT - - - 747,603 747,603 300922010H 2010H GO LIB RZED TAXABLE DEBT 90,149 252,595 192,452 - (192,452) 300922014C 2014C GO LIBRARY DEBT SERVICE 1,757,462 1,433,283 1,400,332 1,330,207 (70,125) 300922021D 2021D GO LIBRARY BONDS DEBT SERVICE - - - 90,450 90,450 300942009D 2009D GO PS TAX EXEMPT DEBT 566,825 849,649 559,950 - (559,950) 300942009E 2009E GO PS TAXABLE DEBT SVC 9,572,544 - - - - 300942011H 2011H PUBLIC SAFETY DEBT SVC 1,085,112 1,618,072 1,074,250 - (1,074,250) 300942017B 2017B GO PS DEBT SERVICE 1,436,356 1,916,917 1,630,882 1,634,632 3,750 300942019E 2019E GO PS DEBT SERVICE 9,494,809 395,021 309,650 824,650 515,000 300942020C 2020C GO TAX INCREMENT DEBT SERVICE - 51,709 106,459 109,500 3,041 300942021B 2021B GO TAX INCREMENT DEBT SERVICE - - - 19,250 19,250 300952007A 2007A SALES TAX TAX EXEMPT DS - 7,298,352 - - - 300952007AR 2007A SALES TAX RESERVE TE DS - 99,432 - - - 300952007B 2007B SALES TAX TAXABLE DS - 8,020,880 - - - 300952007BR 2007B SALES TAX RESERVE TAXABLE - 130,788 - - - 300952009Z 2009 SALES TAX REV REFUNDING DS 7,364,525 22,639,388 - - - 300952014F 2014F 8 80 TAXABLE DEBT SVC - 1,103,176 1,105,906 1,104,706 (1,200) 300952014G 2014G 8 80 TAX EXEMPT DEBT SVC - 1,392,375 1,392,375 1,392,375 - 300952014N 2014N REV REF NOTE DEBT SVC 2,700,750 2,700,023 2,700,750 2,700,750 - 300952016G 2016G SALES TAX EXEMPT DEBT SV - 10,815,639 - - - 300952016H 2016H SALES TAXABLE REFUND - 12,861,699 - - - 300952019A 2019A SALES TAX REV REFUNDING DS 67,043,572 24,325,171 21,655,210 23,201,894 1,546,684 300952019B 2019B SALES TAX REV REFUNDING DS 8,530,000 1,245,986 2,513,475 2,535,212 21,737 300952019C 2019C SALES TAX TE REV REFUNDING DS 13,682,249 1,750,333 424,950 424,950 - 300962009F 2009F GO COMET NOTE DEBT SVC 1,884,834 54,995 - - - 300962012D 2012D GO COMET NOTE DEBT SVC 898,085 880,541 864,000 889,900 25,900 300962018A 2018A GO CAPITAL NOTES 953,303 954,850 913,700 - (913,700) 300962019D 2019D GO CAPITAL NOTES DEBT SERVICE - 1,144,715 1,045,500 1,040,875 (4,625) 300962020A 2020A GO CAPITAL NOTES DEBT SERVICE - 42,883 613,800 617,300 3,500 300962021A 2021A GO CAPITAL NOTES DEBT SERVICE - - - 773,975 773,975 300972015N HAMLINE LEASE DEBT SERIVCE 112,310 113,166 113,497 1,330,285 1,216,788 300972017N 2017N RECYCLING CART REV NOTE 327,165 327,317 327,263 - (327,263) 300972018N TRASH CART NOTE 883,147 882,961 883,165 883,430 265 300982000Z 2000 PEDESTRAIN CONNECTION DS 398,763 394,127 390,850 390,977 127
TOTAL FOR DEPARTMENT 166,125,198 159,611,170 87,032,601 82,828,645 (4,203,956)
53
Major City General Fund Revenues
54
Property Taxes
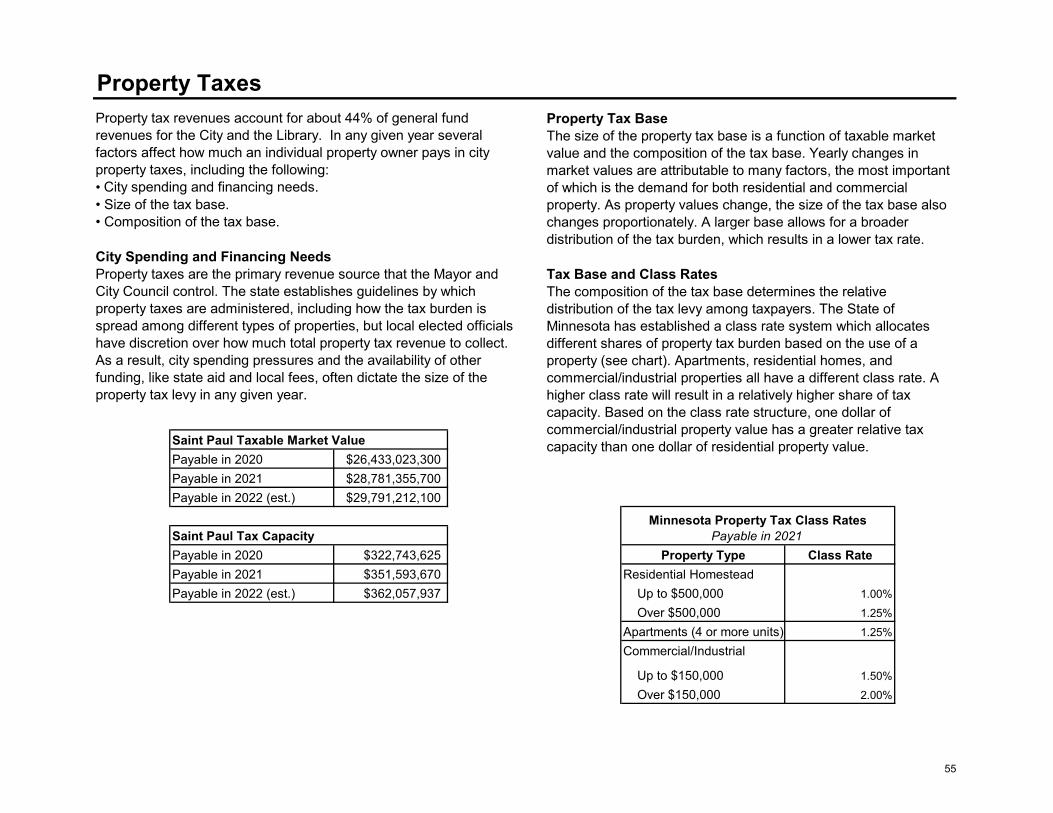
Saint Paul Taxable Market ValuePayable in 2020 $26,433,023,300Payable in 2021 $28,781,355,700Payable in 2022 (est.) $29,791,212,100
Saint Paul Tax CapacityPayable in 2020 $322,743,625 Property Type Class RatePayable in 2021 $351,593,670 Residential HomesteadPayable in 2022 (est.) $362,057,937 Up to $500,000 1.00%
Over $500,000 1.25%Apartments (4 or more units) 1.25%Commercial/Industrial
Up to $150,000 1.50% Over $150,000 2.00%
Minnesota Property Tax Class RatesPayable in 2021
Property Tax BaseThe size of the property tax base is a function of taxable market value and the composition of the tax base. Yearly changes in market values are attributable to many factors, the most important of which is the demand for both residential and commercial property. As property values change, the size of the tax base also changes proportionately. A larger base allows for a broader distribution of the tax burden, which results in a lower tax rate.
Tax Base and Class RatesThe composition of the tax base determines the relative distribution of the tax levy among taxpayers. The State of Minnesota has established a class rate system which allocates different shares of property tax burden based on the use of a property (see chart). Apartments, residential homes, and commercial/industrial properties all have a different class rate. A higher class rate will result in a relatively higher share of tax capacity. Based on the class rate structure, one dollar of commercial/industrial property value has a greater relative tax capacity than one dollar of residential property value.
Property tax revenues account for about 44% of general fund revenues for the City and the Library. In any given year several factors affect how much an individual property owner pays in city property taxes, including the following:• City spending and financing needs.• Size of the tax base.• Composition of the tax base.
City Spending and Financing NeedsProperty taxes are the primary revenue source that the Mayor and City Council control. The state establishes guidelines by which property taxes are administered, including how the tax burden is spread among different types of properties, but local elected officials have discretion over how much total property tax revenue to collect. As a result, city spending pressures and the availability of other funding, like state aid and local fees, often dictate the size of the property tax levy in any given year.
55
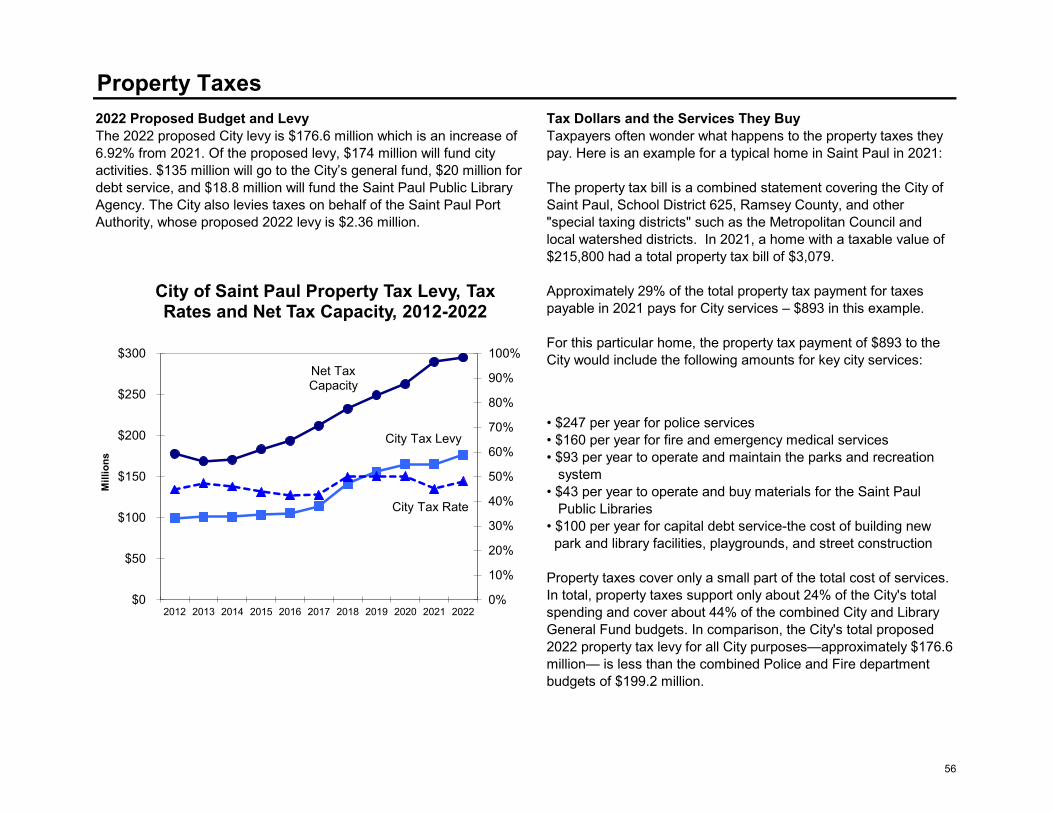
Property Taxes2022 Proposed Budget and LevyThe 2022 proposed City levy is $176.6 million which is an increase of 6.92% from 2021. Of the proposed levy, $174 million will fund city activities. $135 million will go to the City’s general fund, $20 million for debt service, and $18.8 million will fund the Saint Paul Public Library Agency. The City also levies taxes on behalf of the Saint Paul Port Authority, whose proposed 2022 levy is $2.36 million.
Tax Dollars and the Services They BuyTaxpayers often wonder what happens to the property taxes they pay. Here is an example for a typical home in Saint Paul in 2021:
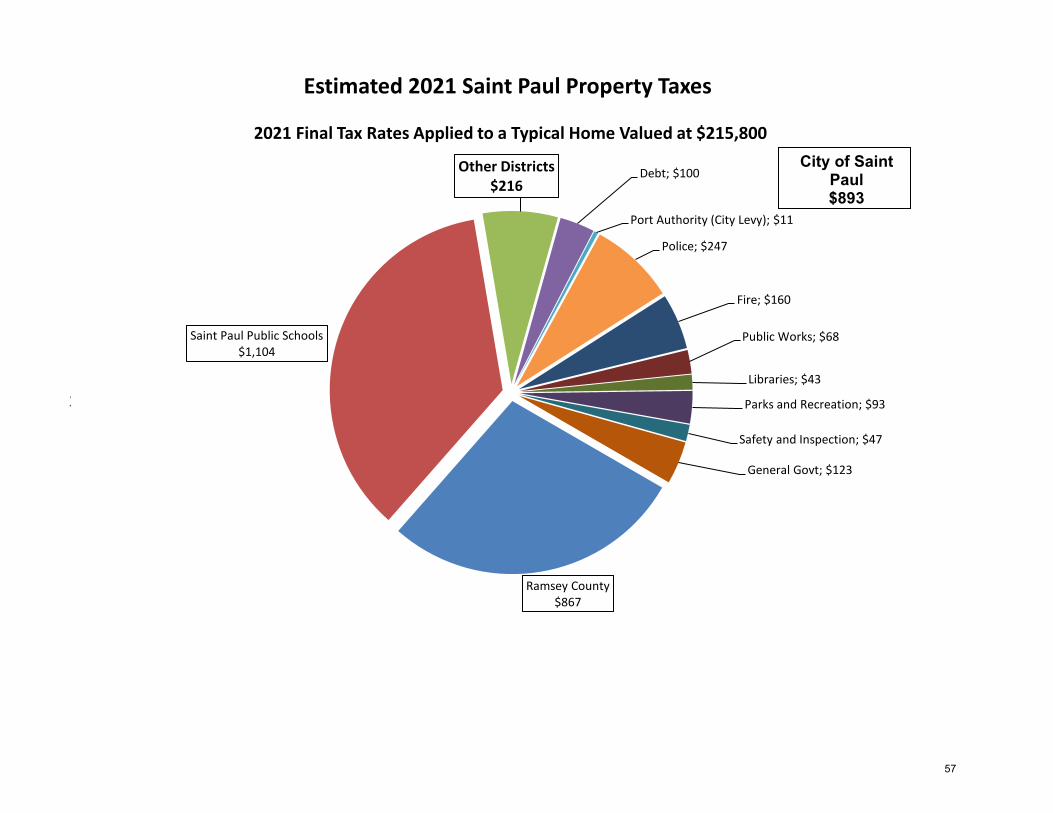
The property tax bill is a combined statement covering the City of Saint Paul, School District 625, Ramsey County, and other "special taxing districts" such as the Metropolitan Council and local watershed districts. In 2021, a home with a taxable value of $215,800 had a total property tax bill of $3,079.
Approximately 29% of the total property tax payment for taxes payable in 2021 pays for City services – $893 in this example.
For this particular home, the property tax payment of $893 to the City would include the following amounts for key city services:
• $247 per year for police services• $160 per year for fire and emergency medical services• $93 per year to operate and maintain the parks and recreation system• $43 per year to operate and buy materials for the Saint Paul Public Libraries• $100 per year for capital debt service-the cost of building new park and library facilities, playgrounds, and street construction
Property taxes cover only a small part of the total cost of services. In total, property taxes support only about 24% of the City's total spending and cover about 44% of the combined City and Library General Fund budgets. In comparison, the City's total proposed 2022 property tax levy for all City purposes—approximately $176.6 million— is less than the combined Police and Fire department budgets of $199.2 million.
City Tax Levy
Net Tax Capacity
City Tax Rate
0%
10%
20%
30%
40%
50%
60%
70%
80%
90%
100%
$0
$50
$100
$150
$200
$250
$300
2012 2013 2014 2015 2016 2017 2018 2019 2020 2021 2022
Mill
ions
City of Saint Paul Property Tax Levy, Tax Rates and Net Tax Capacity, 2012-2022
56
2004-2014
Ramsey County$867
Saint Paul Public Schools$1,104
Other Districts$216
Debt; $100
Port Authority (City Levy); $11
Police; $247
Fire; $160
Public Works; $68
Libraries; $43
Parks and Recreation; $93
Safety and Inspection; $47
General Govt; $123
Estimated 2021 Saint Paul Property Taxes
2021 Final Tax Rates Applied to a Typical Home Valued at $215,800City of Saint
Paul$893
57
Local Government Aid (LGA)
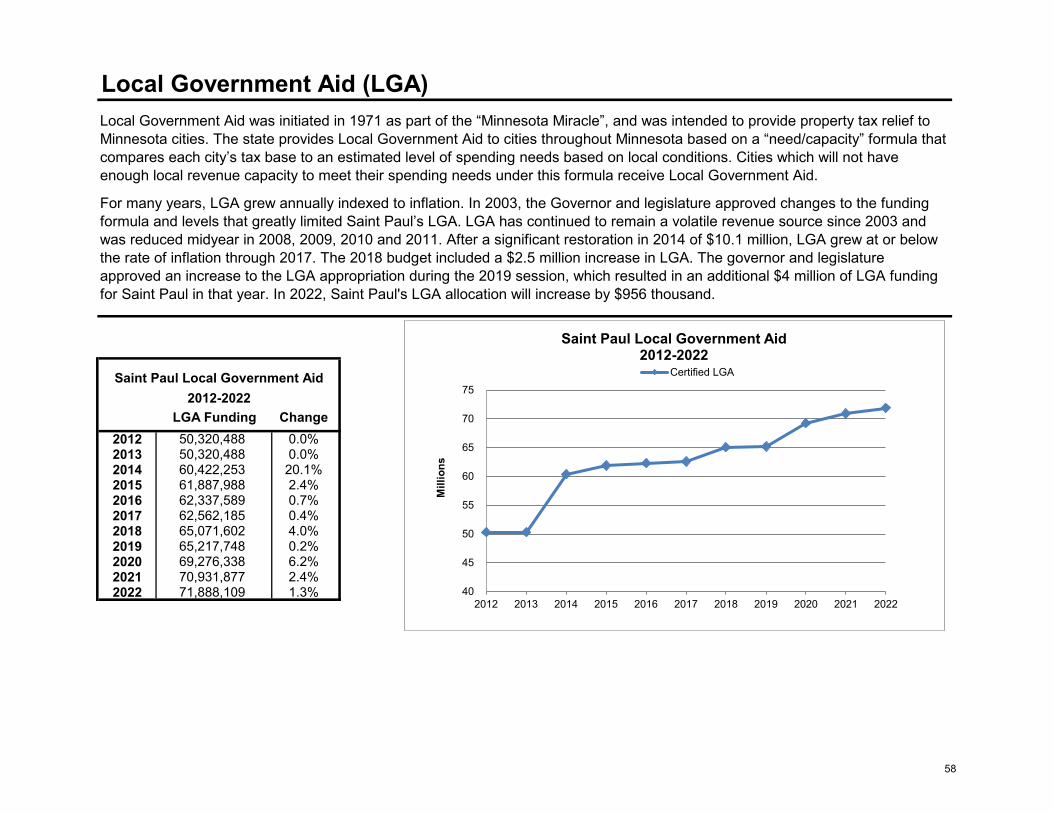
LGA Funding Change2012 50,320,488 0.0%2013 50,320,488 0.0%2014 60,422,253 20.1%2015 61,887,988 2.4%2016 62,337,589 0.7%2017 62,562,185 0.4%2018 65,071,602 4.0%2019 65,217,748 0.2%2020 69,276,338 6.2%2021 70,931,877 2.4%2022 71,888,109 1.3%
2012-2022Saint Paul Local Government Aid
Local Government Aid was initiated in 1971 as part of the “Minnesota Miracle”, and was intended to provide property tax relief to Minnesota cities. The state provides Local Government Aid to cities throughout Minnesota based on a “need/capacity” formula that compares each city’s tax base to an estimated level of spending needs based on local conditions. Cities which will not have enough local revenue capacity to meet their spending needs under this formula receive Local Government Aid.
For many years, LGA grew annually indexed to inflation. In 2003, the Governor and legislature approved changes to the funding formula and levels that greatly limited Saint Paul’s LGA. LGA has continued to remain a volatile revenue source since 2003 and was reduced midyear in 2008, 2009, 2010 and 2011. After a significant restoration in 2014 of $10.1 million, LGA grew at or below the rate of inflation through 2017. The 2018 budget included a $2.5 million increase in LGA. The governor and legislature approved an increase to the LGA appropriation during the 2019 session, which resulted in an additional $4 million of LGA funding for Saint Paul in that year. In 2022, Saint Paul's LGA allocation will increase by $956 thousand.
40
45
50
55
60
65
70
75
2012 2013 2014 2015 2016 2017 2018 2019 2020 2021 2022
Mill
ions
Saint Paul Local Government Aid 2012-2022
Certified LGA
58
Franchise Fees
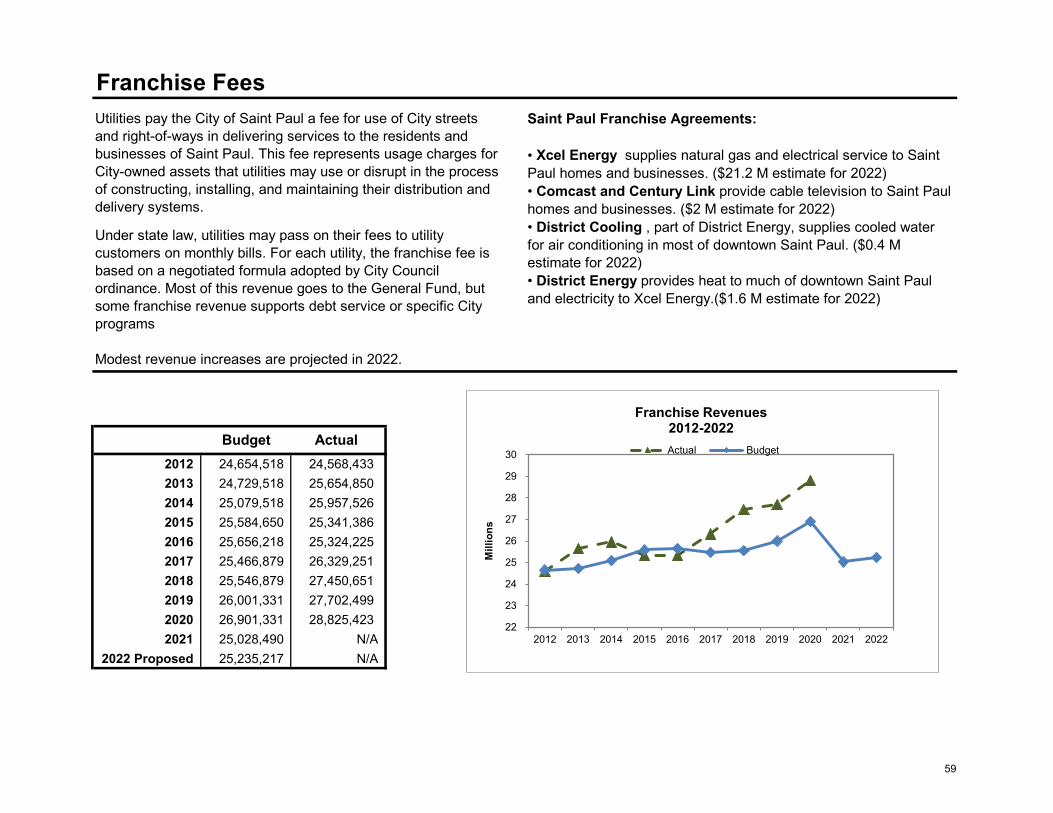
Budget Actual2012 24,654,518 24,568,4332013 24,729,518 25,654,8502014 25,079,518 25,957,5262015 25,584,650 25,341,3862016 25,656,218 25,324,2252017 25,466,879 26,329,2512018 25,546,879 27,450,6512019 26,001,331 27,702,4992020 26,901,331 28,825,4232021 25,028,490 N/A
2022 Proposed 25,235,217 N/A
Saint Paul Franchise Agreements:
• Xcel Energy supplies natural gas and electrical service to Saint Paul homes and businesses. ($21.2 M estimate for 2022)• Comcast and Century Link provide cable television to Saint Paul homes and businesses. ($2 M estimate for 2022)• District Cooling , part of District Energy, supplies cooled water for air conditioning in most of downtown Saint Paul. ($0.4 M estimate for 2022)• District Energy provides heat to much of downtown Saint Paul and electricity to Xcel Energy.($1.6 M estimate for 2022)
Utilities pay the City of Saint Paul a fee for use of City streets and right-of-ways in delivering services to the residents and businesses of Saint Paul. This fee represents usage charges for City-owned assets that utilities may use or disrupt in the process of constructing, installing, and maintaining their distribution and delivery systems.
Under state law, utilities may pass on their fees to utility customers on monthly bills. For each utility, the franchise fee is based on a negotiated formula adopted by City Council ordinance. Most of this revenue goes to the General Fund, but some franchise revenue supports debt service or specific City programs
Modest revenue increases are projected in 2022.
22
23
24
25
26
27
28
29
30
2012 2013 2014 2015 2016 2017 2018 2019 2020 2021 2022
Mill
ions
Franchise Revenues2012-2022Actual Budget
59
Paramedic Fees
2004-2014
Budget Actual2012 10,900,000 11,782,6552013 11,700,000 11,428,6502014 11,694,962 11,449,9632015 11,744,962 11,686,0522016 11,744,962 12,226,9012017 11,844,962 13,209,0332018 12,229,438 13,438,514
2015 Propose 2019 12,779,438 13,042,774
2020 12,779,438 12,244,1862021 11,884,877 N/A
2022 Proposed 14,832,377 N/A
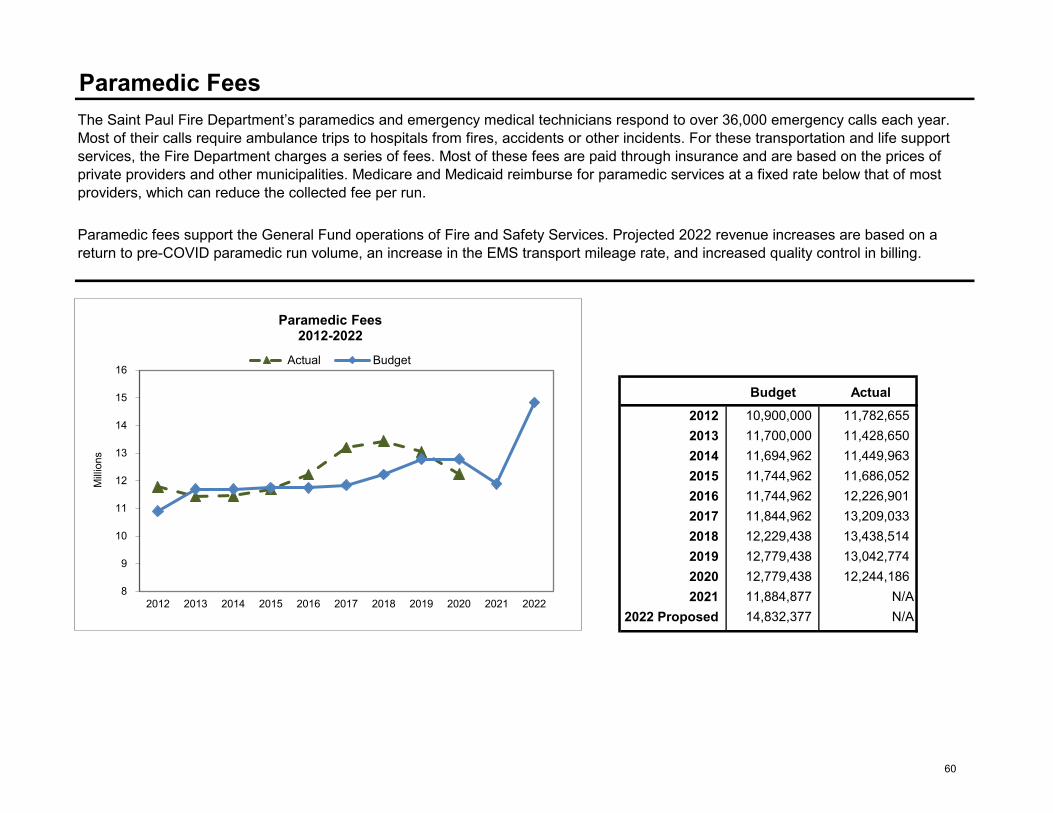
The Saint Paul Fire Department’s paramedics and emergency medical technicians respond to over 36,000 emergency calls each year. Most of their calls require ambulance trips to hospitals from fires, accidents or other incidents. For these transportation and life support services, the Fire Department charges a series of fees. Most of these fees are paid through insurance and are based on the prices of private providers and other municipalities. Medicare and Medicaid reimburse for paramedic services at a fixed rate below that of most providers, which can reduce the collected fee per run.
Paramedic fees support the General Fund operations of Fire and Safety Services. Projected 2022 revenue increases are based on a return to pre-COVID paramedic run volume, an increase in the EMS transport mileage rate, and increased quality control in billing.
8
9
10
11
12
13
14
15
16
2012 2013 2014 2015 2016 2017 2018 2019 2020 2021 2022
Milli
ons
Paramedic Fees 2012-2022
Actual Budget
60
State Pension Aids
Budget Actual
2012 6,333,132 6,338,4572013 6,333,132 6,982,0992014 6,533,134 7,382,7062015 6,982,099 7,527,7382016 7,382,706 7,978,2372017 7,912,706 8,005,3732018 7,978,237 8,276,8382019 8,013,098 8,549,0912020 7,495,586 8,624,9132021 7,495,586 N/A
2022 Proposed 7,495,586 N/A
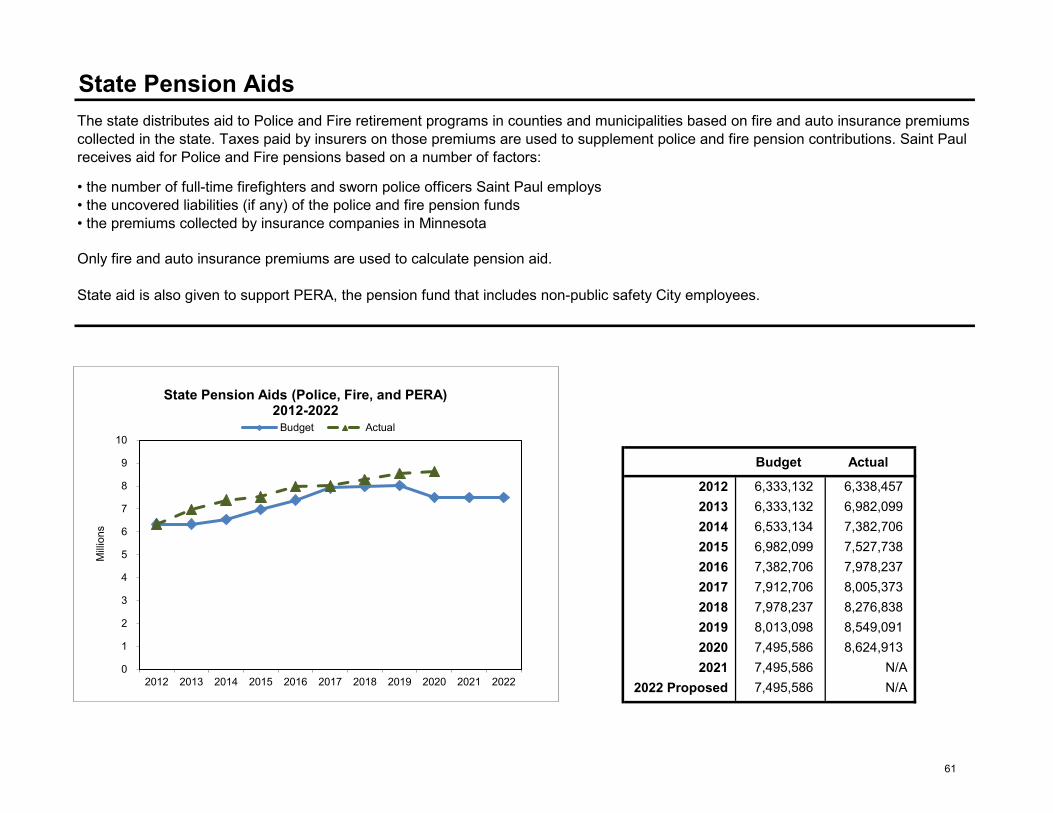
The state distributes aid to Police and Fire retirement programs in counties and municipalities based on fire and auto insurance premiums collected in the state. Taxes paid by insurers on those premiums are used to supplement police and fire pension contributions. Saint Paul receives aid for Police and Fire pensions based on a number of factors:
• the number of full-time firefighters and sworn police officers Saint Paul employs• the uncovered liabilities (if any) of the police and fire pension funds• the premiums collected by insurance companies in Minnesota
Only fire and auto insurance premiums are used to calculate pension aid.
State aid is also given to support PERA, the pension fund that includes non-public safety City employees.
0
1
2
3
4
5
6
7
8
9
10
2012 2013 2014 2015 2016 2017 2018 2019 2020 2021 2022
Milli
ons
State Pension Aids (Police, Fire, and PERA) 2012-2022
Budget Actual
61
Parking Meters and Fines
Budget Actual
2012 6,505,758 6,228,8292013 6,926,580 6,928,7612014 6,943,080 6,293,8142015 6,783,810 5,565,3422016 8,061,794 7,019,1732017 7,907,809 8,418,2932018 7,780,496 7,361,5182019 7,326,646 7,025,1132020 7,176,646 3,424,3072021 5,465,484 N/A
2022 Proposed 5,165,484 N/A
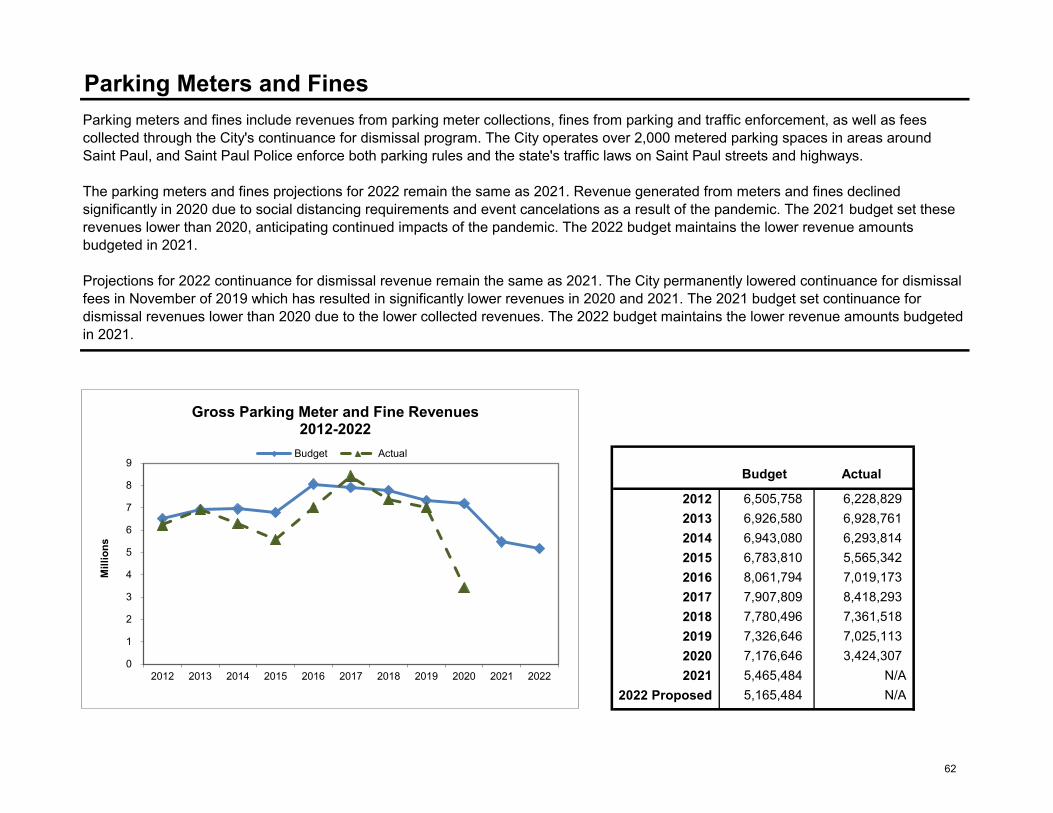
Parking meters and fines include revenues from parking meter collections, fines from parking and traffic enforcement, as well as fees collected through the City's continuance for dismissal program. The City operates over 2,000 metered parking spaces in areas around Saint Paul, and Saint Paul Police enforce both parking rules and the state's traffic laws on Saint Paul streets and highways. The parking meters and fines projections for 2022 remain the same as 2021. Revenue generated from meters and fines declined significantly in 2020 due to social distancing requirements and event cancelations as a result of the pandemic. The 2021 budget set these revenues lower than 2020, anticipating continued impacts of the pandemic. The 2022 budget maintains the lower revenue amounts budgeted in 2021.
Projections for 2022 continuance for dismissal revenue remain the same as 2021. The City permanently lowered continuance for dismissal fees in November of 2019 which has resulted in significantly lower revenues in 2020 and 2021. The 2021 budget set continuance for dismissal revenues lower than 2020 due to the lower collected revenues. The 2022 budget maintains the lower revenue amounts budgeted in 2021.
0
1
2
3
4
5
6
7
8
9
2012 2013 2014 2015 2016 2017 2018 2019 2020 2021 2022
Mill
ions
Gross Parking Meter and Fine Revenues 2012-2022
Budget Actual
62
Interest Earnings
Budget Actual
2012 2,215,034 2,552,1912013 2,215,034 1,752,8402014 2,065,034 1,614,9722015 2,065,034 1,448,1312016 2,165,034 2,264,4812017 2,165,034 2,383,1592018 2,165,034 2,848,0612019 2,065,034 2,836,1272020 2,590,034 2,212,980
2021* 1,064,608 N/A2022 Proposed 1,064,608 N/A
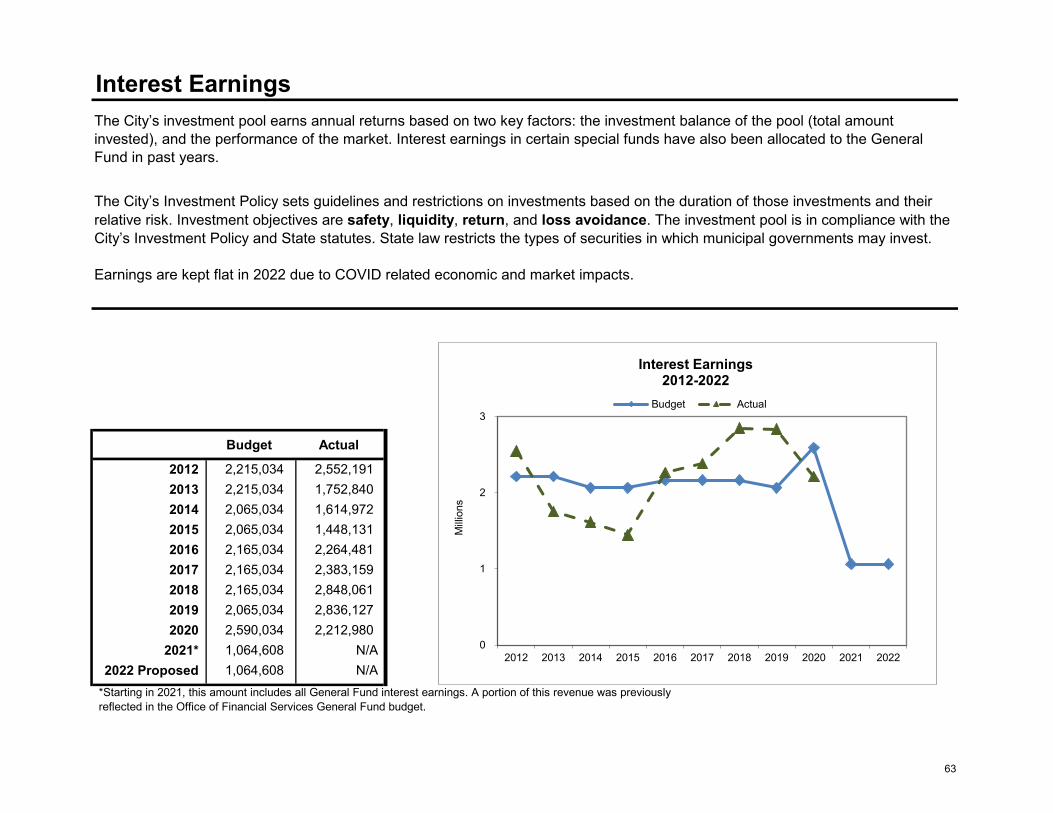
The City’s investment pool earns annual returns based on two key factors: the investment balance of the pool (total amount invested), and the performance of the market. Interest earnings in certain special funds have also been allocated to the General Fund in past years.
The City’s Investment Policy sets guidelines and restrictions on investments based on the duration of those investments and their relative risk. Investment objectives are safety, liquidity, return, and loss avoidance. The investment pool is in compliance with the City’s Investment Policy and State statutes. State law restricts the types of securities in which municipal governments may invest.
Earnings are kept flat in 2022 due to COVID related economic and market impacts.
*Starting in 2021, this amount includes all General Fund interest earnings. A portion of this revenue was previously reflected in the Office of Financial Services General Fund budget.
0
1
2
3
2012 2013 2014 2015 2016 2017 2018 2019 2020 2021 2022
Milli
ons
Interest Earnings2012-2022
Budget Actual
63
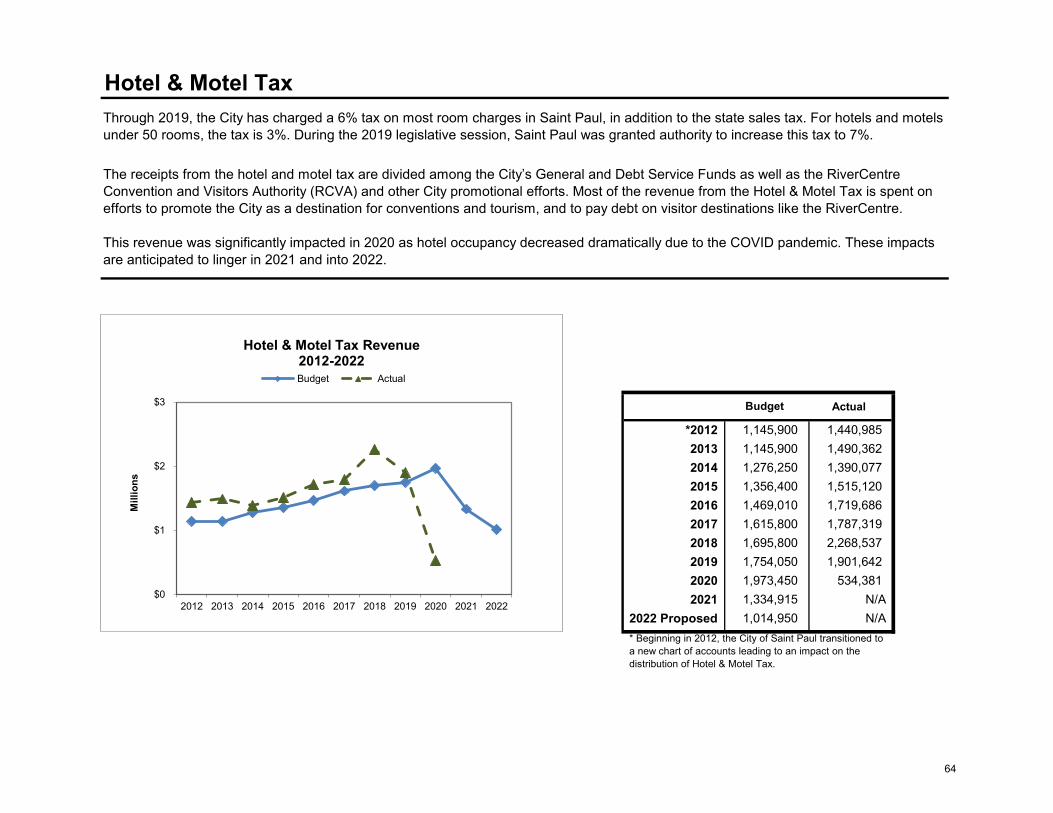
Hotel & Motel Tax
2004-2014Budget Actual
*2012 1,145,900 1,440,9852013 1,145,900 1,490,3622014 1,276,250 1,390,0772015 1,356,400 1,515,1202016 1,469,010 1,719,6862017 1,615,800 1,787,3192018 1,695,800 2,268,5372019 1,754,050 1,901,6422020 1,973,450 534,3812021 1,334,915 N/A
2022 Proposed 1,014,950 N/A
Through 2019, the City has charged a 6% tax on most room charges in Saint Paul, in addition to the state sales tax. For hotels and motels under 50 rooms, the tax is 3%. During the 2019 legislative session, Saint Paul was granted authority to increase this tax to 7%.
The receipts from the hotel and motel tax are divided among the City’s General and Debt Service Funds as well as the RiverCentre Convention and Visitors Authority (RCVA) and other City promotional efforts. Most of the revenue from the Hotel & Motel Tax is spent on efforts to promote the City as a destination for conventions and tourism, and to pay debt on visitor destinations like the RiverCentre.
This revenue was significantly impacted in 2020 as hotel occupancy decreased dramatically due to the COVID pandemic. These impacts are anticipated to linger in 2021 and into 2022.
* Beginning in 2012, the City of Saint Paul transitioned toa new chart of accounts leading to an impact on thedistribution of Hotel & Motel Tax.
$0
$1
$2
$3
2012 2013 2014 2015 2016 2017 2018 2019 2020 2021 2022
Mill
ions
Hotel & Motel Tax Revenue 2012-2022Budget Actual
64
Department Summaries
65
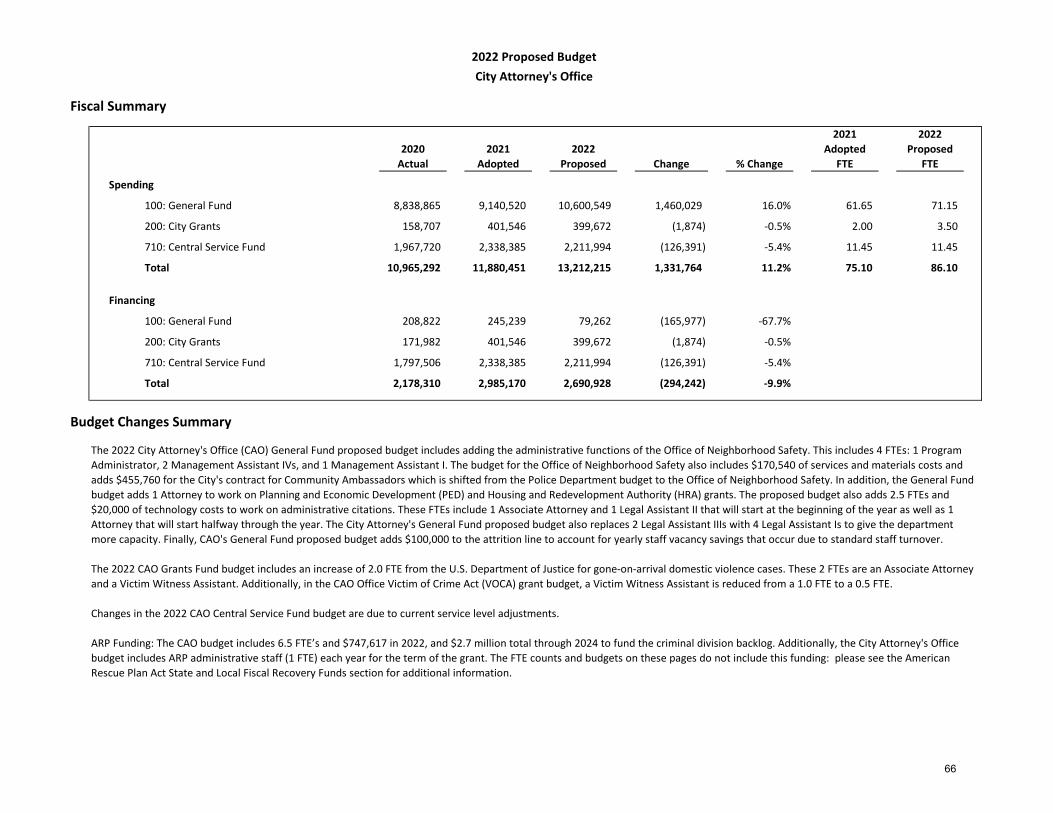
Fiscal Summary
2020Actual
2021Adopted
2022Proposed Change % Change
2021Adopted
FTE
2022Proposed
FTE
Spending
100: General Fund 8,838,865 9,140,520 10,600,549 1,460,029 16.0% 61.65 71.15
200: City Grants 158,707 401,546 399,672 (1,874) -0.5% 2.00 3.50
710: Central Service Fund 1,967,720 2,338,385 2,211,994 (126,391) -5.4% 11.45 11.45
10,965,292 11,880,451 13,212,215 1,331,764 11.2% 75.10 86.10
Financing
100: General Fund 208,822 245,239 79,262 (165,977) -67.7%
200: City Grants 171,982 401,546 399,672 (1,874) -0.5%
710: Central Service Fund 1,797,506 2,338,385 2,211,994 (126,391) -5.4%
Total 2,178,310 2,985,170 2,690,928 (294,242) -9.9%
Budget Changes Summary
2022 Proposed BudgetCity Attorney's Office
The 2022 City Attorney's Office (CAO) General Fund proposed budget includes adding the administrative functions of the Office of Neighborhood Safety. This includes 4 FTEs: 1 Program Administrator, 2 Management Assistant IVs, and 1 Management Assistant I. The budget for the Office of Neighborhood Safety also includes $170,540 of services and materials costs and adds $455,760 for the City's contract for Community Ambassadors which is shifted from the Police Department budget to the Office of Neighborhood Safety. In addition, the General Fund budget adds 1 Attorney to work on Planning and Economic Development (PED) and Housing and Redevelopment Authority (HRA) grants. The proposed budget also adds 2.5 FTEs and $20,000 of technology costs to work on administrative citations. These FTEs include 1 Associate Attorney and 1 Legal Assistant II that will start at the beginning of the year as well as 1 Attorney that will start halfway through the year. The City Attorney's General Fund proposed budget also replaces 2 Legal Assistant IIIs with 4 Legal Assistant Is to give the department more capacity. Finally, CAO's General Fund proposed budget adds $100,000 to the attrition line to account for yearly staff vacancy savings that occur due to standard staff turnover.
The 2022 CAO Grants Fund budget includes an increase of 2.0 FTE from the U.S. Department of Justice for gone-on-arrival domestic violence cases. These 2 FTEs are an Associate Attorney and a Victim Witness Assistant. Additionally, in the CAO Office Victim of Crime Act (VOCA) grant budget, a Victim Witness Assistant is reduced from a 1.0 FTE to a 0.5 FTE.
Changes in the 2022 CAO Central Service Fund budget are due to current service level adjustments.
ARP Funding: The CAO budget includes 6.5 FTE’s and $747,617 in 2022, and $2.7 million total through 2024 to fund the criminal division backlog. Additionally, the City Attorney's Office budget includes ARP administrative staff (1 FTE) each year for the term of the grant. The FTE counts and budgets on these pages do not include this funding: please see the American Rescue Plan Act State and Local Fiscal Recovery Funds section for additional information.
Total
66
Spending Reports 67

CITY OF SAINT PAULSpending Plan by Department
Department:Fund: Budget Year: 2022
CITY ATTORNEYCITY GENERAL FUND
2019Actuals
Change From
2020Actuals
2021Adopted
2022Mayor's
Proposed
2021Adopted
Spending by Major Account
8,312,351 8,545,799 8,669,547 9,545,052 EMPLOYEE EXPENSE 875,506 585,754 234,312 425,793 991,109 SERVICES 565,316 119,808 50,594 38,596 56,833 MATERIALS AND SUPPLIES 18,237
6,720 7,060 6,584 7,555 OTHER FINANCING USES 971
1,460,030 10,600,549 9,140,520 8,837,765 9,024,633 Total Spending by Major Account
Spending by Accounting UnitCITY ATTORNEY GENERAL OPS 9,024,633 9,494,789 9,140,520 8,837,765 10012100 354,269 OFFICE OF NEIGHBORHOOD SAFETY 1,105,760 10012200 1,105,760
Total Spending by Accounting Unit 9,024,633 10,600,549 1,460,030 8,837,765 9,140,520
68

CITY OF SAINT PAULSpending Plan by Department
Department:Fund: Budget Year: 2022
CITY ATTORNEYCITY GRANTS
2019Actuals
Change From
2020Actuals
2021Adopted
2022Mayor's
Proposed
2021Adopted
Spending by Major Account
106,221 124,126 316,147 314,273 EMPLOYEE EXPENSE (1,874) 26,385 31,990 85,399 85,399 SERVICES 24,691 2,592 MATERIALS AND SUPPLIES
(1,874) 399,672 401,546 158,707 157,297 Total Spending by Major Account
Spending by Accounting UnitCRIME VICTIM SERVICES INITIATIVE 157,297 140,487 164,880 130,907 20012800 (24,393)CITY ATTORNEY GRANTS 259,185 236,666 27,800 20012900 22,519
Total Spending by Accounting Unit 157,297 399,672 (1,874) 158,707 401,546
69

CITY OF SAINT PAULSpending Plan by Department
Department:Fund: Budget Year: 2022
CITY ATTORNEYCENTRAL SERVICE FUND
2019Actuals
Change From
2020Actuals
2021Adopted
2022Mayor's
Proposed
2021Adopted
Spending by Major Account
1,582,960 1,705,111 1,989,293 2,025,134 EMPLOYEE EXPENSE 35,841 98,929 86,396 119,886 123,203 SERVICES 3,318 17,996 15,033 27,620 27,620 MATERIALS AND SUPPLIES 45,603 161,180 201,587 36,037 OTHER FINANCING USES (165,550)
(126,391) 2,211,994 2,338,385 1,967,720 1,745,488 Total Spending by Major Account
Spending by Accounting UnitCITY ATTY OUTSIDE SERVICES 1,745,488 2,211,994 2,338,385 1,967,720 71012200 (126,391)
Total Spending by Accounting Unit 1,745,488 2,211,994 (126,391) 1,967,720 2,338,385
70

Financing Reports 71
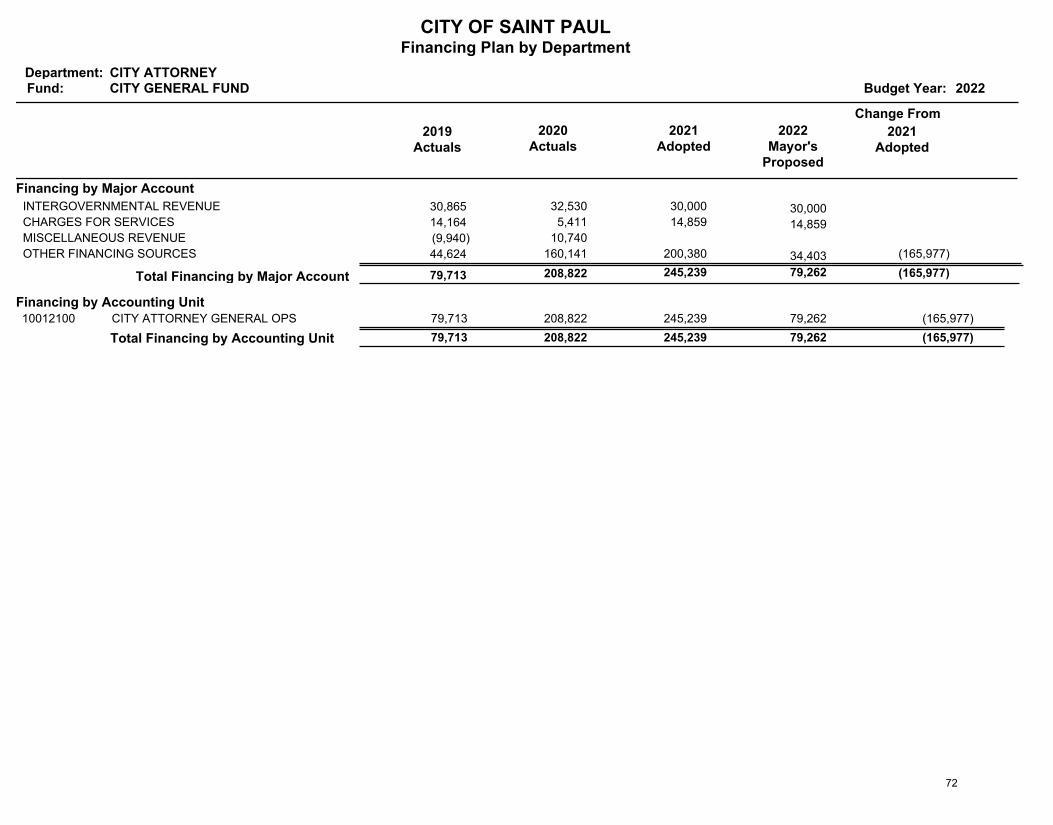
CITY OF SAINT PAULFinancing Plan by Department
Department:Fund: Budget Year: 2022
CITY ATTORNEYCITY GENERAL FUND
2019Actuals
Change From
2020Actuals
2021Adopted
2022Mayor's
Proposed
2021Adopted
Financing by Major Account
30,865 32,530 30,000 30,000 INTERGOVERNMENTAL REVENUE
14,164 5,411 14,859 14,859 CHARGES FOR SERVICES
(9,940) 10,740 MISCELLANEOUS REVENUE
44,624 160,141 200,380 34,403 OTHER FINANCING SOURCES (165,977)
(165,977) 79,262 245,239 208,822 79,713 Total Financing by Major Account
Financing by Accounting UnitCITY ATTORNEY GENERAL OPS 79,713 79,262 245,239 208,822 10012100 (165,977)
Total Financing by Accounting Unit 79,713 79,262 (165,977) 208,822 245,239
72
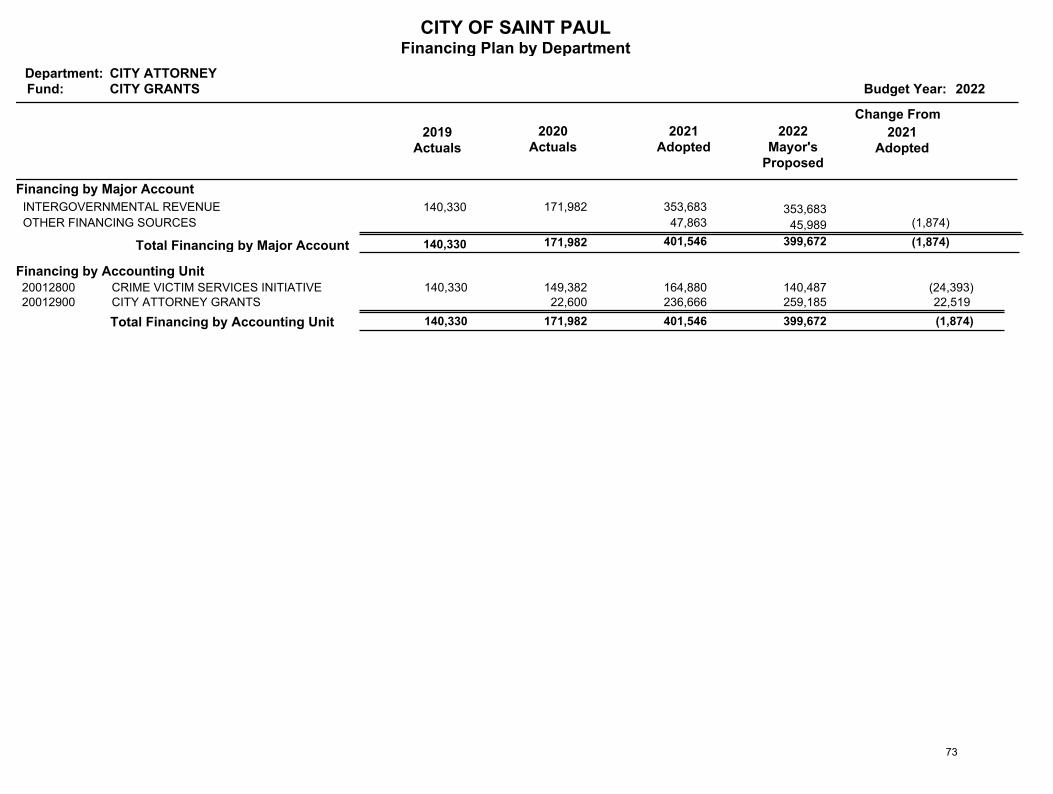
CITY OF SAINT PAULFinancing Plan by Department
Department:Fund: Budget Year: 2022
CITY ATTORNEYCITY GRANTS
2019Actuals
Change From
2020Actuals
2021Adopted
2022Mayor's
Proposed
2021Adopted
Financing by Major Account
140,330 171,982 353,683 353,683 INTERGOVERNMENTAL REVENUE
47,863 45,989 OTHER FINANCING SOURCES (1,874)
(1,874) 399,672 401,546 171,982 140,330 Total Financing by Major Account
Financing by Accounting UnitCRIME VICTIM SERVICES INITIATIVE 140,330 140,487 164,880 149,382 20012800 (24,393)CITY ATTORNEY GRANTS 259,185 236,666 22,600 20012900 22,519
Total Financing by Accounting Unit 140,330 399,672 (1,874) 171,982 401,546
73
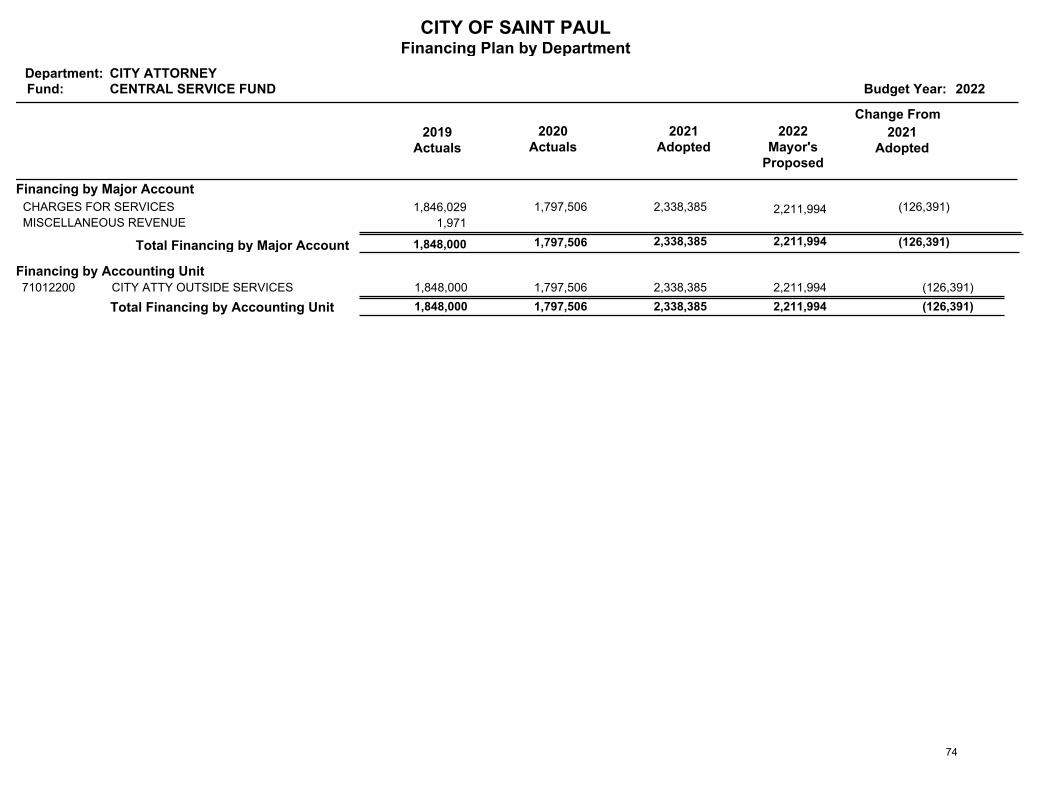
CITY OF SAINT PAULFinancing Plan by Department
Department:Fund: Budget Year: 2022
CITY ATTORNEYCENTRAL SERVICE FUND
2019Actuals
Change From
2020Actuals
2021Adopted
2022Mayor's
Proposed
2021Adopted
Financing by Major Account
1,846,029 1,797,506 2,338,385 2,211,994 CHARGES FOR SERVICES (126,391)
1,971 MISCELLANEOUS REVENUE
(126,391) 2,211,994 2,338,385 1,797,506 1,848,000 Total Financing by Major Account
Financing by Accounting UnitCITY ATTY OUTSIDE SERVICES 1,848,000 2,211,994 2,338,385 1,797,506 71012200 (126,391)
Total Financing by Accounting Unit 1,848,000 2,211,994 (126,391) 1,797,506 2,338,385
74
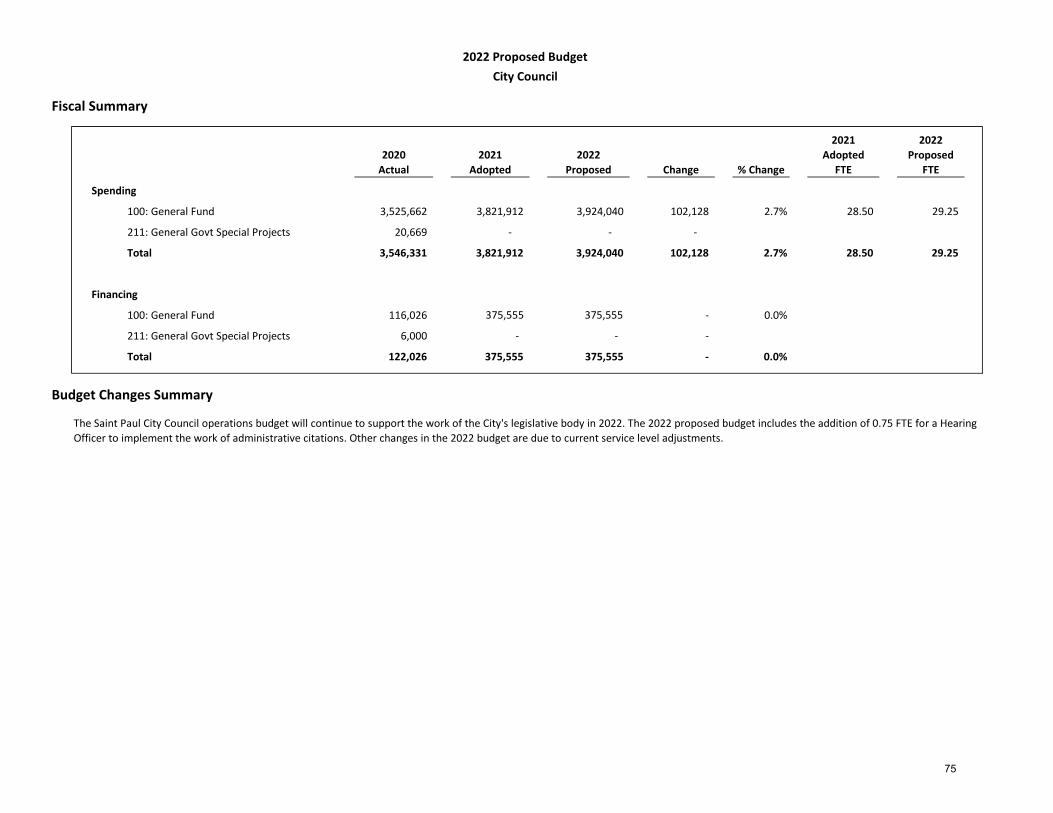
Fiscal Summary
2020Actual
2021Adopted
2022Proposed Change % Change
2021Adopted
FTE
2022Proposed
FTE
Spending
3,525,662 3,821,912 3,924,040 102,128 2.7% 28.50 29.25
211: General Govt Special Projects 20,669 - - -
Total 3,546,331 3,821,912 3,924,040 102,128 2.7% 28.50 29.25
Financing
116,026 375,555 375,555 - 0.0%
211: General Govt Special Projects 6,000 - - -
Total 122,026 375,555 375,555 - 0.0%
Budget Changes Summary
2022 Proposed BudgetCity Council
The Saint Paul City Council operations budget will continue to support the work of the City's legislative body in 2022. The 2022 proposed budget includes the addition of 0.75 FTE for a Hearing Officer to implement the work of administrative citations. Other changes in the 2022 budget are due to current service level adjustments.
100: General Fund
100: General Fund
75

Spending Reports 76
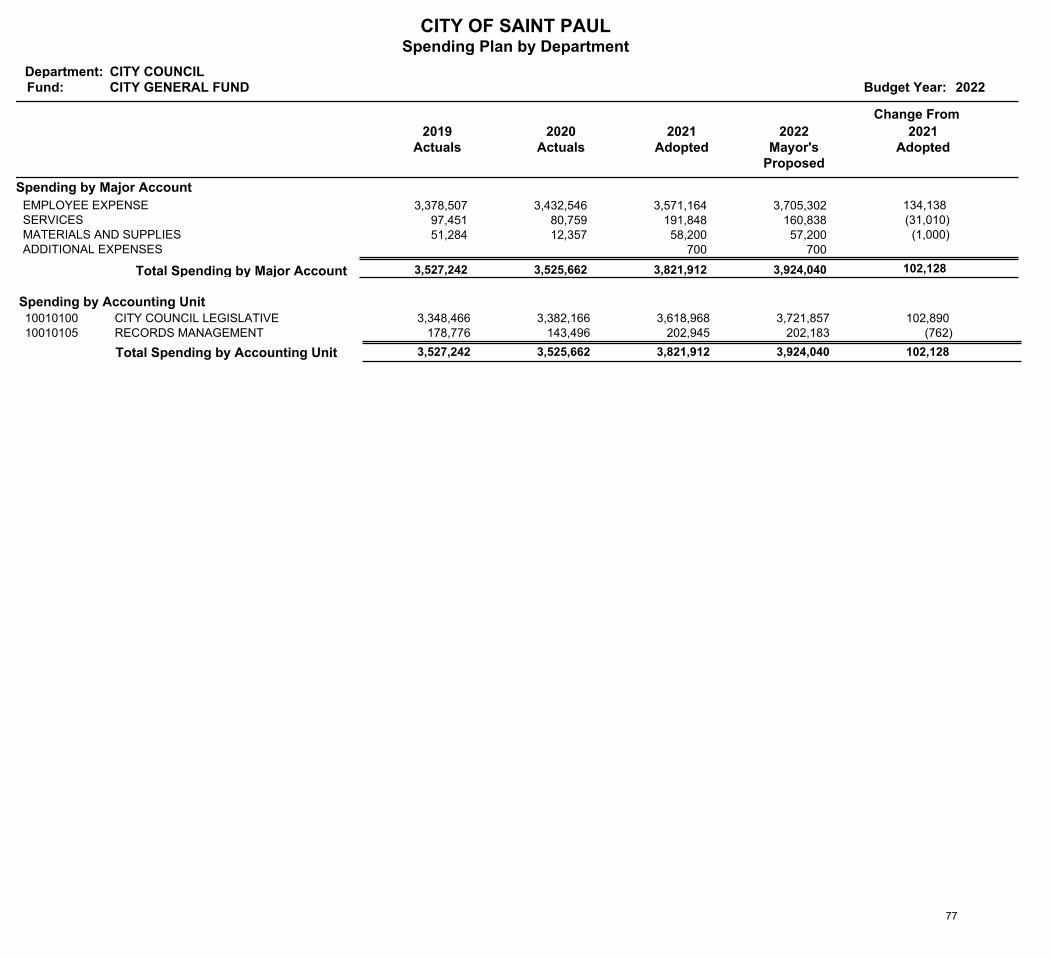
CITY OF SAINT PAULSpending Plan by Department
Department:Fund: Budget Year: 2022
CITY COUNCILCITY GENERAL FUND
2019Actuals
Change From
2020Actuals
2021Adopted
2022Mayor's
Proposed
2021Adopted
Spending by Major Account
3,378,507 3,432,546 3,571,164 3,705,302 EMPLOYEE EXPENSE 134,138 97,451 80,759 191,848 160,838 SERVICES (31,010) 51,284 12,357 58,200 57,200 MATERIALS AND SUPPLIES (1,000)
700 700 ADDITIONAL EXPENSES
102,128 3,924,040 3,821,912 3,525,662 3,527,242 Total Spending by Major Account
Spending by Accounting UnitCITY COUNCIL LEGISLATIVE 3,348,466 3,721,857 3,618,968 3,382,166 10010100 102,890 RECORDS MANAGEMENT 178,776 202,183 202,945 143,496 10010105 (762)
Total Spending by Accounting Unit 3,527,242 3,924,040 102,128 3,525,662 3,821,912
77
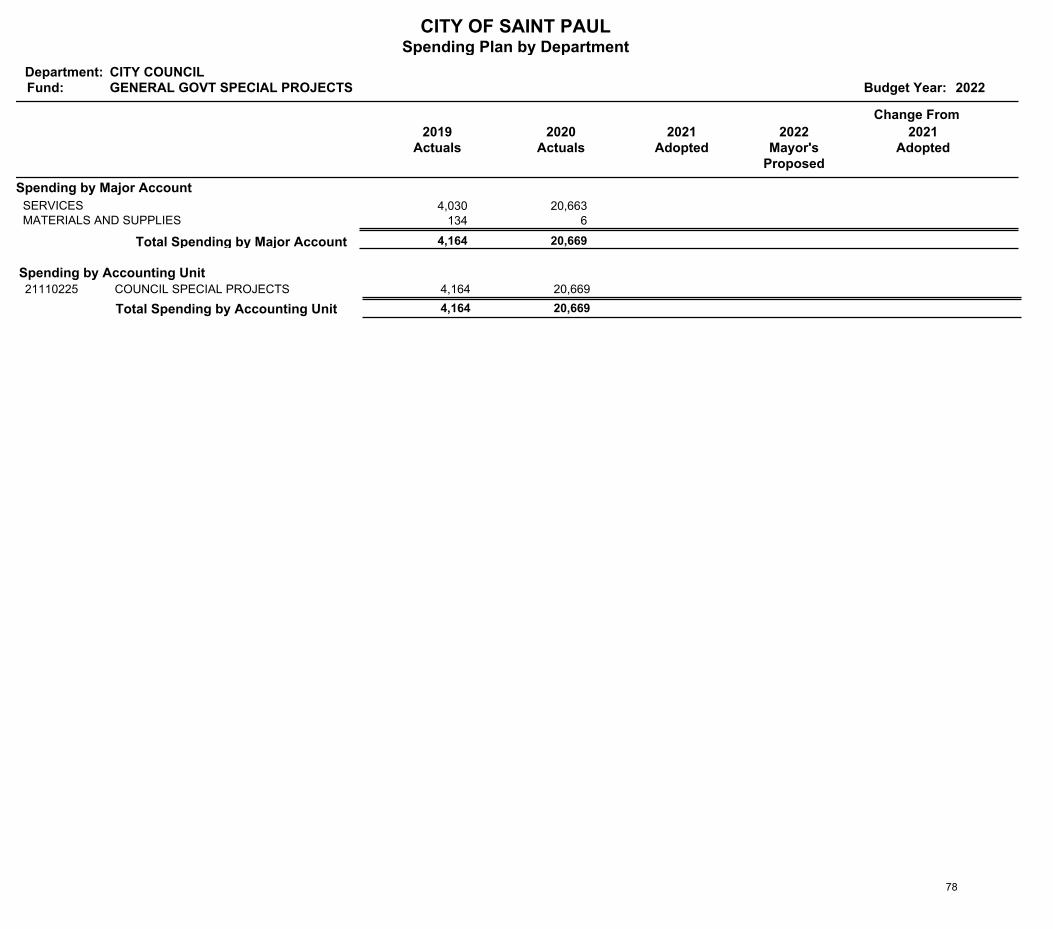
CITY OF SAINT PAULSpending Plan by Department
Department:Fund: Budget Year: 2022
CITY COUNCILGENERAL GOVT SPECIAL PROJECTS
2019Actuals
Change From
2020Actuals
2021Adopted
2022Mayor's
Proposed
2021Adopted
Spending by Major Account
4,030 20,663 SERVICES 134 6 MATERIALS AND SUPPLIES
20,669 4,164 Total Spending by Major Account
Spending by Accounting UnitCOUNCIL SPECIAL PROJECTS 4,164 20,669 21110225
Total Spending by Accounting Unit 4,164 20,669
78

Financing Reports 79

CITY OF SAINT PAULFinancing Plan by Department
Department:Fund: Budget Year: 2022
CITY COUNCILCITY GENERAL FUND
2019Actuals
Change From
2020Actuals
2021Adopted
2022Mayor's
Proposed
2021Adopted
Financing by Major Account
600 1,000 LICENSE AND PERMIT
113,159 115,026 108,000 108,000 CHARGES FOR SERVICES
267,555 267,555 267,555 OTHER FINANCING SOURCES
375,555 375,555 116,026 381,314 Total Financing by Major Account
Financing by Accounting UnitCITY COUNCIL LEGISLATIVE 381,314 375,555 375,555 116,026 10010100
Total Financing by Accounting Unit 381,314 375,555 116,026 375,555
80
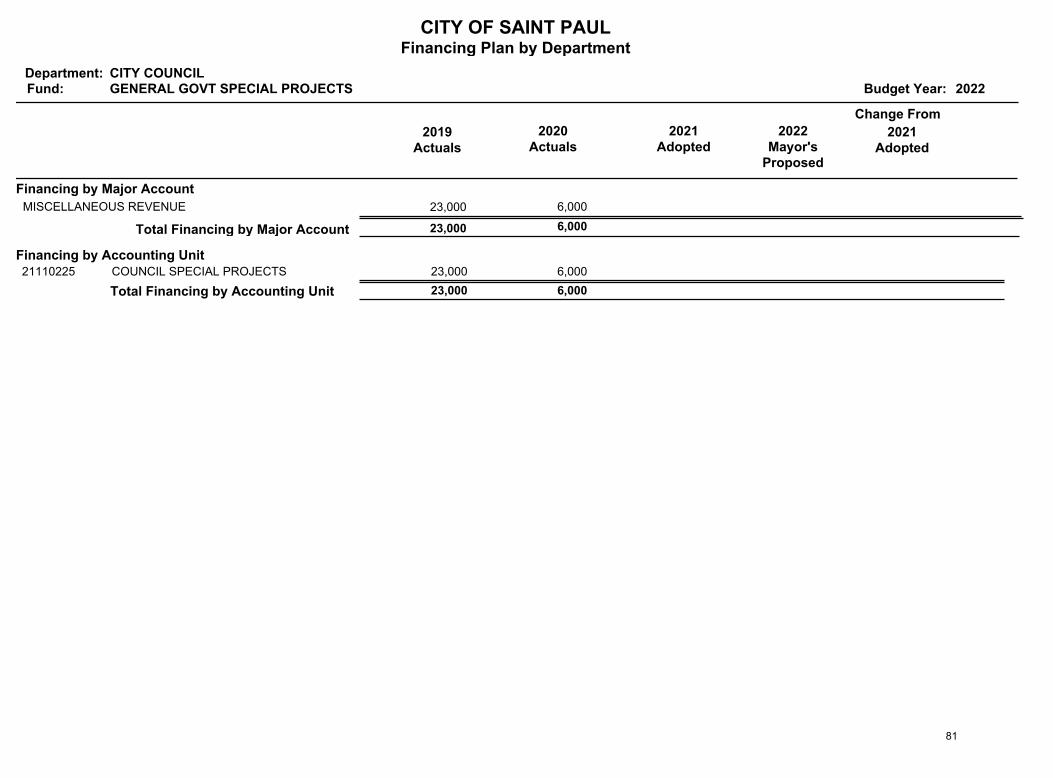
CITY OF SAINT PAULFinancing Plan by Department
Department:Fund: Budget Year: 2022
CITY COUNCILGENERAL GOVT SPECIAL PROJECTS
2019Actuals
Change From
2020Actuals
2021Adopted
2022Mayor's
Proposed
2021Adopted
Financing by Major Account
23,000 6,000 MISCELLANEOUS REVENUE
6,000 23,000 Total Financing by Major Account
Financing by Accounting UnitCOUNCIL SPECIAL PROJECTS 23,000 6,000 21110225
Total Financing by Accounting Unit 23,000 6,000
81
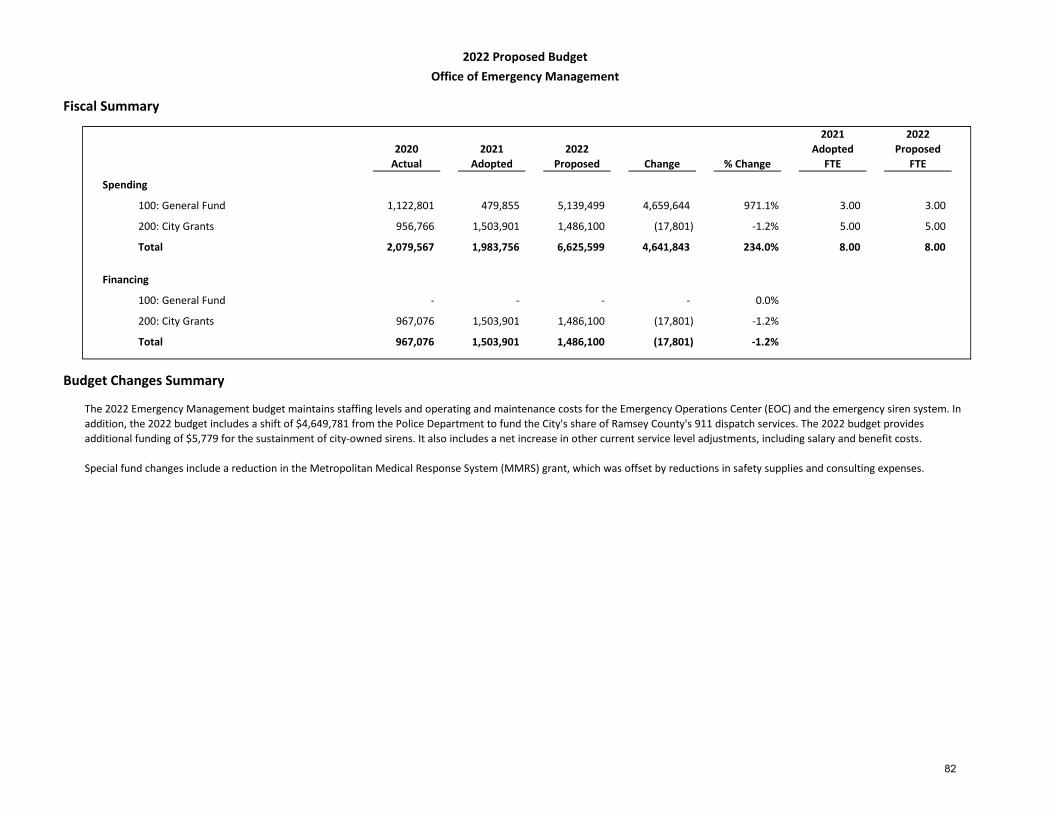
Fiscal Summary
2020Actual
2021Adopted
2022 Proposed Change % Change
2021Adopted
FTE
2022 Proposed
FTE
Spending
1,122,801 479,855 5,139,499 4,659,644 971.1% 3.00 3.00
956,766 1,503,901 1,486,100 (17,801) -1.2% 5.00 5.00
2,079,567 1,983,756 6,625,599 4,641,843 234.0% 8.00 8.00
Financing
- - - - 0.0%
967,076 1,503,901 1,486,100 (17,801) -1.2%
967,076 1,503,901 1,486,100 (17,801) -1.2%
Budget Changes Summary
2022 Proposed BudgetOffice of Emergency Management
200: City Grants
100: General Fund
200: City Grants
100: General Fund
Total
Total
The 2022 Emergency Management budget maintains staffing levels and operating and maintenance costs for the Emergency Operations Center (EOC) and the emergency siren system. In addition, the 2022 budget includes a shift of $4,649,781 from the Police Department to fund the City's share of Ramsey County's 911 dispatch services. The 2022 budget provides additional funding of $5,779 for the sustainment of city-owned sirens. It also includes a net increase in other current service level adjustments, including salary and benefit costs.
Special fund changes include a reduction in the Metropolitan Medical Response System (MMRS) grant, which was offset by reductions in safety supplies and consulting expenses.
82

Spending Reports 83
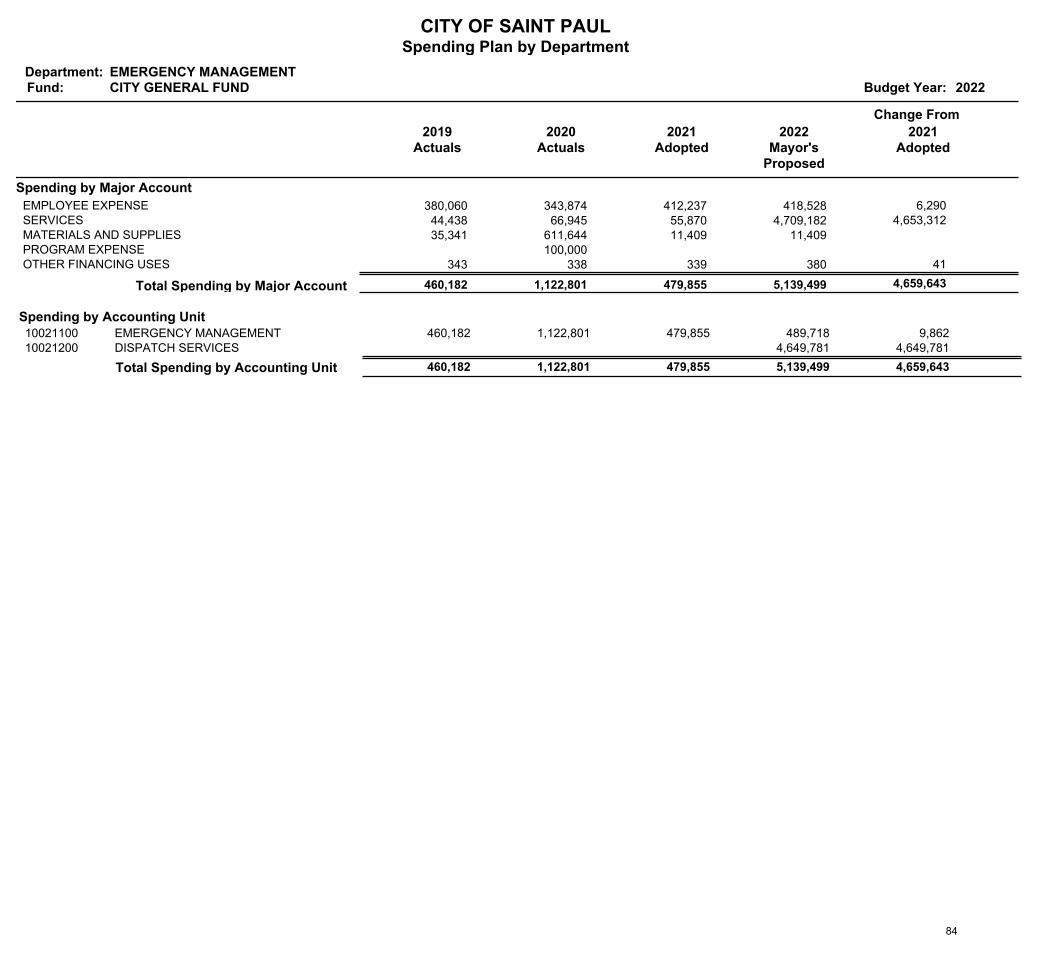
CITY OF SAINT PAULSpending Plan by Department
Department:Fund: Budget Year: 2022
EMERGENCY MANAGEMENTCITY GENERAL FUND
2019Actuals
Change From
2020Actuals
2021Adopted
2022Mayor's
Proposed
2021Adopted
Spending by Major Account
380,060 343,874 412,237 418,528 EMPLOYEE EXPENSE 6,290 44,438 66,945 55,870 4,709,182 SERVICES 4,653,312 35,341 611,644 11,409 11,409 MATERIALS AND SUPPLIES
100,000 PROGRAM EXPENSE 343 338 339 380 OTHER FINANCING USES 41
4,659,643 5,139,499 479,855 1,122,801 460,182 Total Spending by Major Account
Spending by Accounting UnitEMERGENCY MANAGEMENT 460,182 489,718 479,855 1,122,801 10021100 9,862 DISPATCH SERVICES 4,649,781 10021200 4,649,781
Total Spending by Accounting Unit 460,182 5,139,499 4,659,643 1,122,801 479,855
84
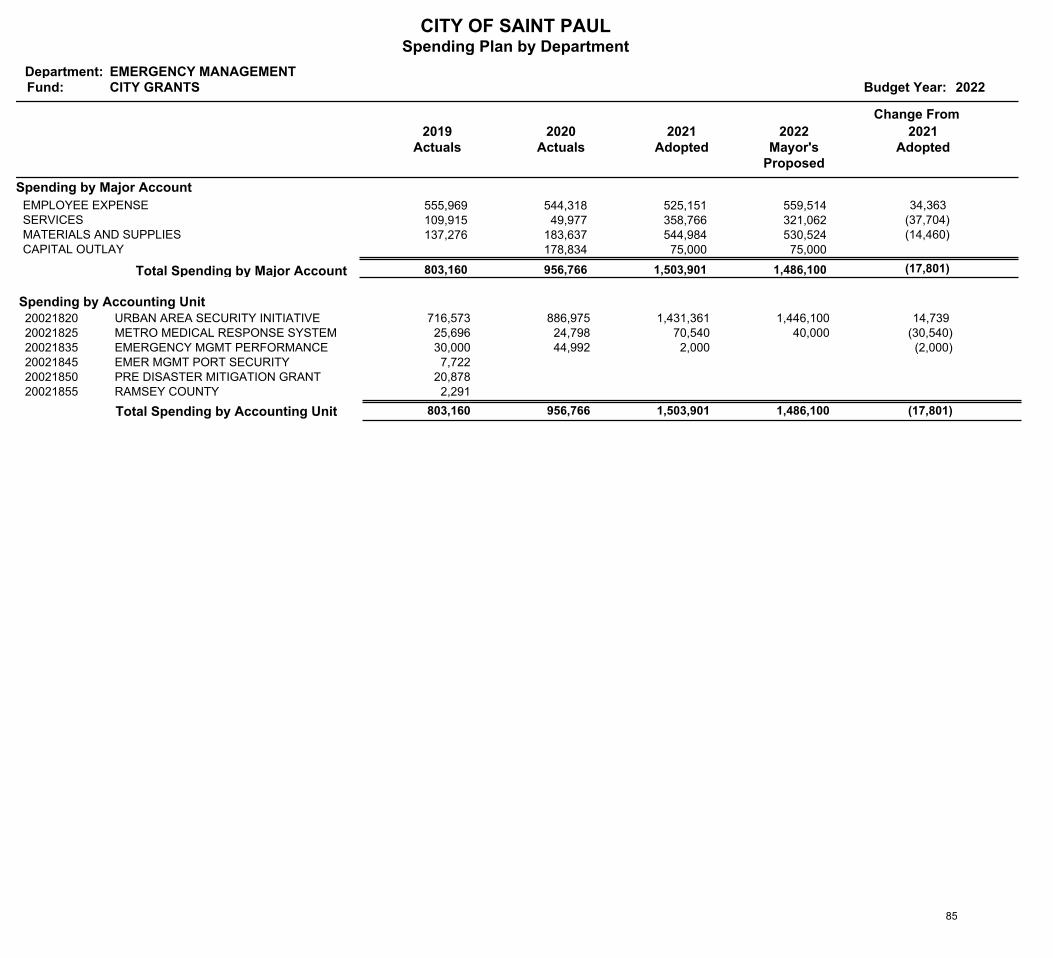
CITY OF SAINT PAULSpending Plan by Department
Department:Fund: Budget Year: 2022
EMERGENCY MANAGEMENTCITY GRANTS
2019Actuals
Change From
2020Actuals
2021Adopted
2022Mayor's
Proposed
2021Adopted
Spending by Major Account
555,969 544,318 525,151 559,514 EMPLOYEE EXPENSE 34,363 109,915 49,977 358,766 321,062 SERVICES (37,704) 137,276 183,637 544,984 530,524 MATERIALS AND SUPPLIES (14,460)
178,834 75,000 75,000 CAPITAL OUTLAY
(17,801) 1,486,100 1,503,901 956,766 803,160 Total Spending by Major Account
Spending by Accounting UnitURBAN AREA SECURITY INITIATIVE 716,573 1,446,100 1,431,361 886,975 20021820 14,739 METRO MEDICAL RESPONSE SYSTEM 25,696 40,000 70,540 24,798 20021825 (30,540)EMERGENCY MGMT PERFORMANCE 30,000 2,000 44,992 20021835 (2,000)EMER MGMT PORT SECURITY 7,722 20021845PRE DISASTER MITIGATION GRANT 20,878 20021850RAMSEY COUNTY 2,291 20021855
Total Spending by Accounting Unit 803,160 1,486,100 (17,801) 956,766 1,503,901
85

Financing Reports 86
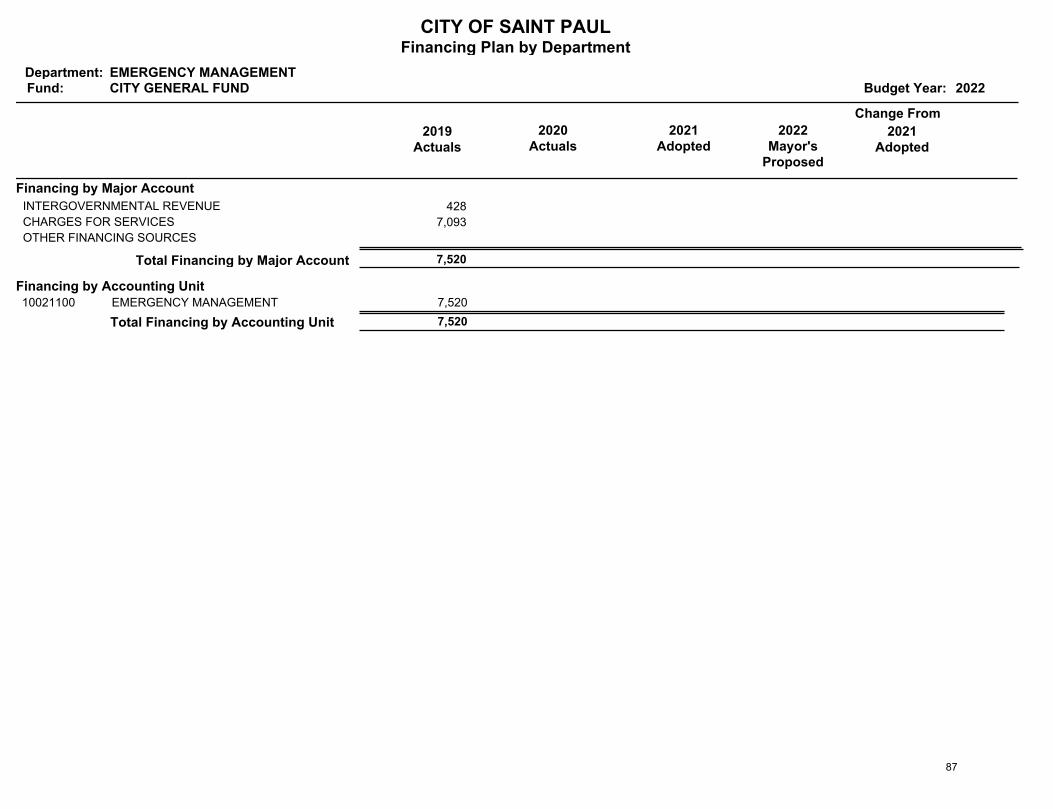
CITY OF SAINT PAULFinancing Plan by Department
Department:Fund: Budget Year: 2022
EMERGENCY MANAGEMENTCITY GENERAL FUND
2019Actuals
Change From
2020Actuals
2021Adopted
2022Mayor's
Proposed
2021Adopted
Financing by Major Account
428 INTERGOVERNMENTAL REVENUE
7,093 CHARGES FOR SERVICES
OTHER FINANCING SOURCES
7,520 Total Financing by Major Account
Financing by Accounting UnitEMERGENCY MANAGEMENT 7,520 10021100
Total Financing by Accounting Unit 7,520
87
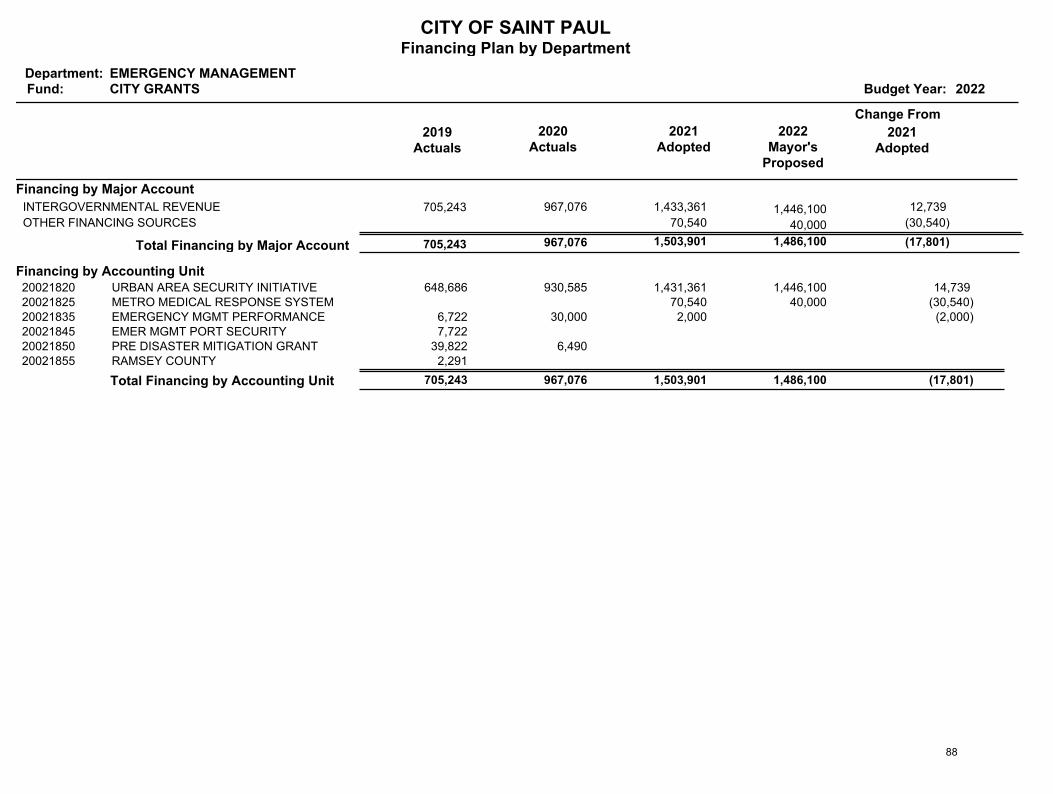
CITY OF SAINT PAULFinancing Plan by Department
Department:Fund: Budget Year: 2022
EMERGENCY MANAGEMENTCITY GRANTS
2019Actuals
Change From
2020Actuals
2021Adopted
2022Mayor's
Proposed
2021Adopted
Financing by Major Account
705,243 967,076 1,433,361 1,446,100 INTERGOVERNMENTAL REVENUE 12,739
70,540 40,000 OTHER FINANCING SOURCES (30,540)
(17,801) 1,486,100 1,503,901 967,076 705,243 Total Financing by Major Account
Financing by Accounting UnitURBAN AREA SECURITY INITIATIVE 648,686 1,446,100 1,431,361 930,585 20021820 14,739 METRO MEDICAL RESPONSE SYSTEM 40,000 70,540 20021825 (30,540)EMERGENCY MGMT PERFORMANCE 6,722 2,000 30,000 20021835 (2,000)EMER MGMT PORT SECURITY 7,722 20021845PRE DISASTER MITIGATION GRANT 39,822 6,490 20021850RAMSEY COUNTY 2,291 20021855
Total Financing by Accounting Unit 705,243 1,486,100 (17,801) 967,076 1,503,901
88
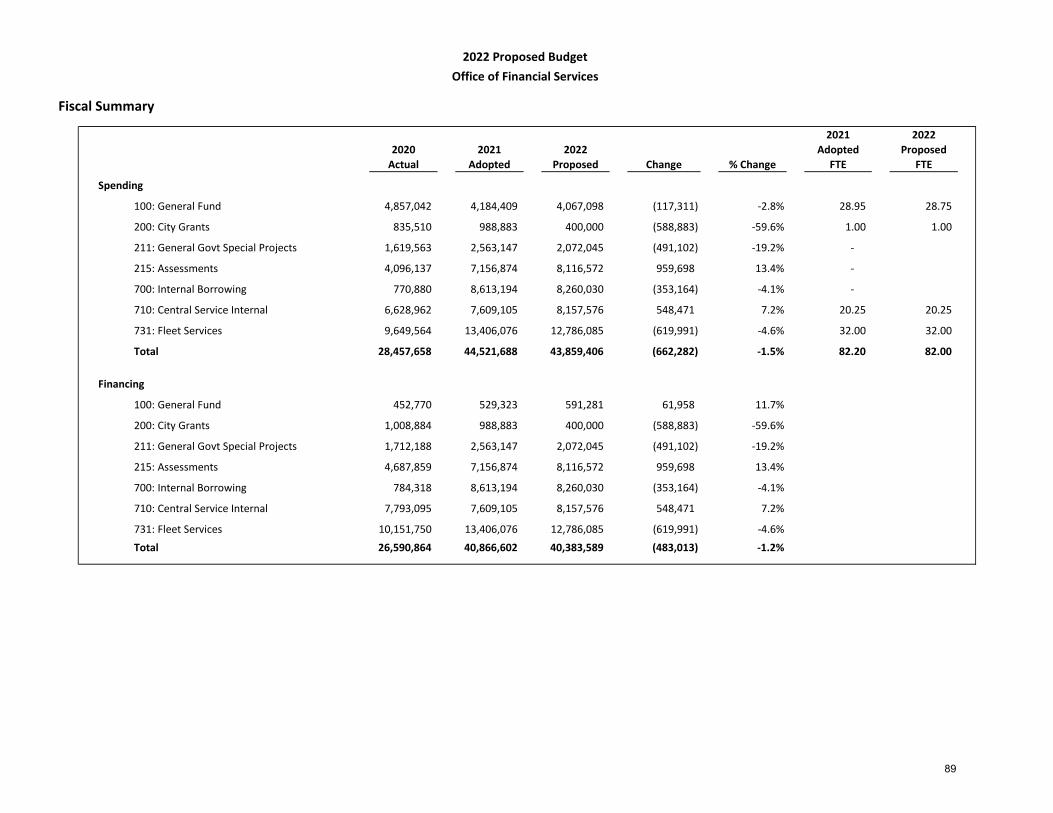
Fiscal Summary
2020Actual
2021Adopted
2022Proposed Change % Change
2021Adopted
FTE
2022 Proposed
FTE
Spending
100: General Fund 4,857,042 4,184,409 4,067,098 (117,311) -2.8% 28.95 28.75
200: City Grants 835,510 988,883 400,000 (588,883) -59.6% 1.00 1.00
211: General Govt Special Projects 1,619,563 2,563,147 2,072,045 (491,102) -19.2% -
215: Assessments 4,096,137 7,156,874 8,116,572 959,698 13.4% -
700: Internal Borrowing 770,880 8,613,194 8,260,030 (353,164) -4.1% -
710: Central Service Internal 6,628,962 7,609,105 8,157,576 548,471 7.2% 20.25 20.25
731: Fleet Services 9,649,564 13,406,076 12,786,085 (619,991) -4.6% 32.00 32.00
Total 28,457,658 44,521,688 43,859,406 (662,282) -1.5% 82.20 82.00
Financing
100: General Fund 452,770 529,323 591,281 61,958 11.7%
200: City Grants 1,008,884 988,883 400,000 (588,883) -59.6%
211: General Govt Special Projects 1,712,188 2,563,147 2,072,045 (491,102) -19.2%
215: Assessments 4,687,859 7,156,874 8,116,572 959,698 13.4%
700: Internal Borrowing 784,318 8,613,194 8,260,030 (353,164) -4.1%
710: Central Service Internal 7,793,095 7,609,105 8,157,576 548,471 7.2%
731: Fleet Services 10,151,750 13,406,076 12,786,085 (619,991) -4.6%Total 26,590,864 40,866,602 40,383,589 (483,013) -1.2%
2022 Proposed BudgetOffice of Financial Services
89
Budget Changes Summary
The 2022 OFS General Fund budget includes adjustments to the personnel budget in the Business Support and Accounting divisions, including the reduction of 0.2 FTE of an existing ERP Business Analyst, and backfilling an Accountant IV position vacancy with an Accountant III position. The General Fund budget also includes new ongoing revenue generated through process improvement in the way the department makes payments. The 2022 General Fund budget also includes a transfer to the Fleet special fund for operations and maintenance for Highland Bridge vehicles. The 2022 budget also includes ongoing maintenance funding for COVID related HVAC upgrades, as well as the planned removal of one-time funding for Tenant Protections in the Office of Financial Empowerment. The 2022 OFS special fund budget includes planned reductions of one-time investments, grant updates, and other current service level adjustments.
ARP Funding: The 2022 OFS budget includes ARP administrative staff (13 FTEs) each year for the term of the grant. The FTE counts and budgets on these pages do not include this funding: please see the American Rescue Plan Act State and Local Fiscal Recovery Funds section for additional information.
90

Spending Reports 91
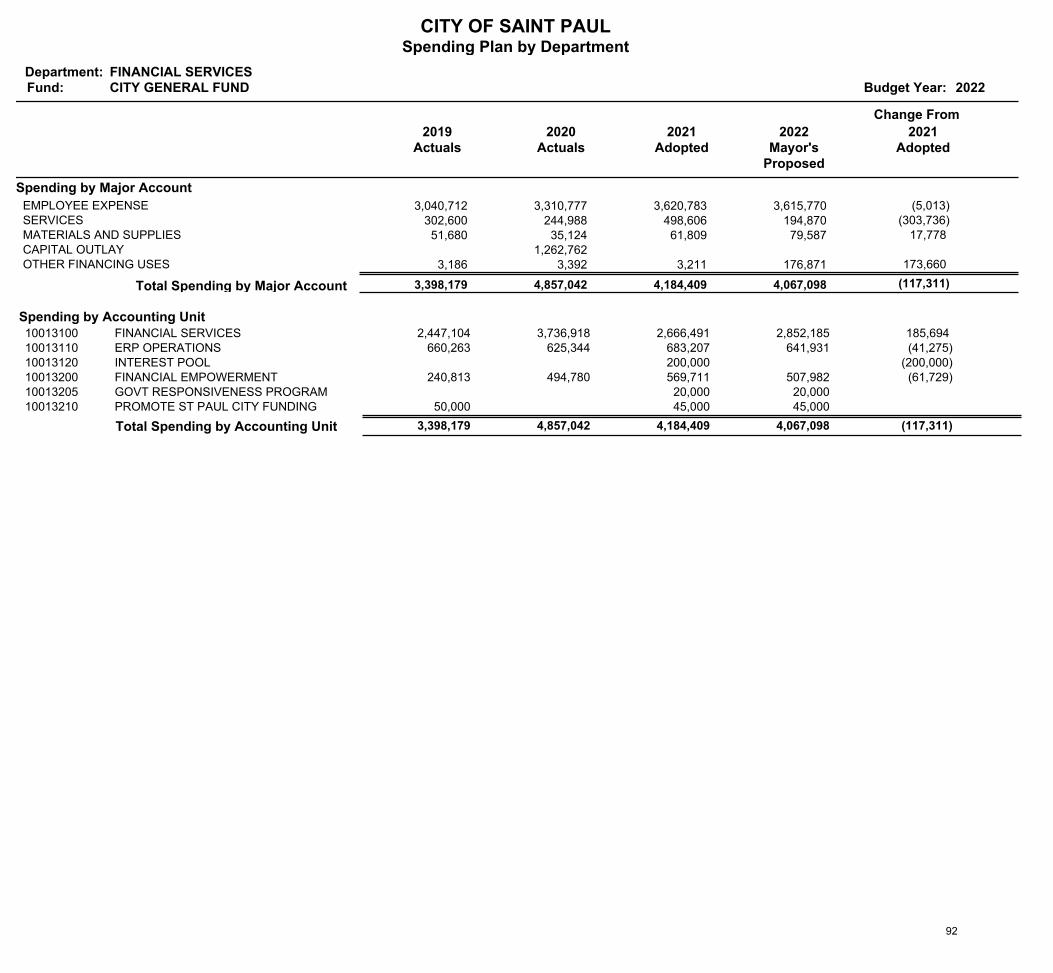
CITY OF SAINT PAULSpending Plan by Department
Department:Fund: Budget Year: 2022
FINANCIAL SERVICESCITY GENERAL FUND
2019Actuals
Change From
2020Actuals
2021Adopted
2022Mayor's
Proposed
2021Adopted
Spending by Major Account
3,040,712 3,310,777 3,620,783 3,615,770 EMPLOYEE EXPENSE (5,013) 302,600 244,988 498,606 194,870 SERVICES (303,736) 51,680 35,124 61,809 79,587 MATERIALS AND SUPPLIES 17,778
1,262,762 CAPITAL OUTLAY 3,186 3,392 3,211 176,871 OTHER FINANCING USES 173,660
(117,311) 4,067,098 4,184,409 4,857,042 3,398,179 Total Spending by Major Account
Spending by Accounting UnitFINANCIAL SERVICES 2,447,104 2,852,185 2,666,491 3,736,918 10013100 185,694 ERP OPERATIONS 660,263 641,931 683,207 625,344 10013110 (41,275)INTEREST POOL 200,000 10013120 (200,000)FINANCIAL EMPOWERMENT 240,813 507,982 569,711 494,780 10013200 (61,729)GOVT RESPONSIVENESS PROGRAM 20,000 20,000 10013205PROMOTE ST PAUL CITY FUNDING 50,000 45,000 45,000 10013210
Total Spending by Accounting Unit 3,398,179 4,067,098 (117,311) 4,857,042 4,184,409
92
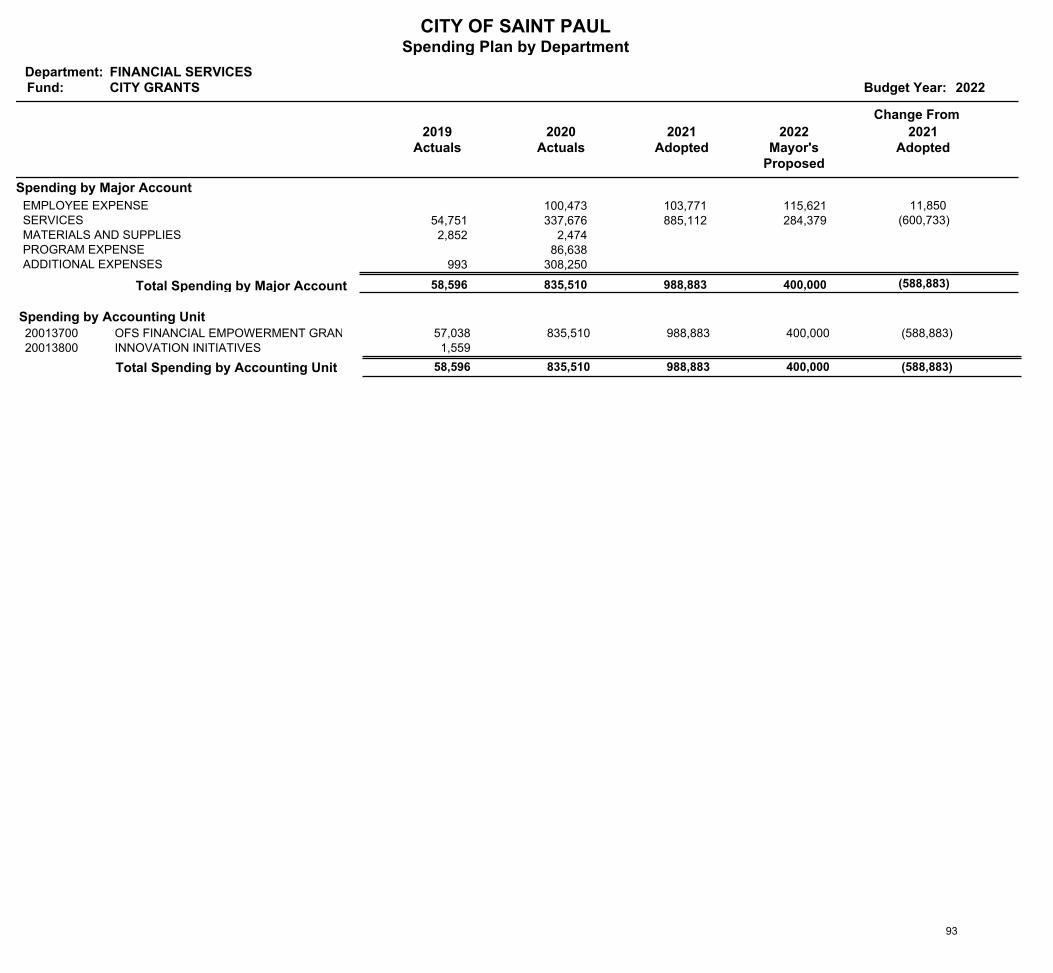
CITY OF SAINT PAULSpending Plan by Department
Department:Fund: Budget Year: 2022
FINANCIAL SERVICESCITY GRANTS
2019Actuals
Change From
2020Actuals
2021Adopted
2022Mayor's
Proposed
2021Adopted
Spending by Major Account
100,473 103,771 115,621 EMPLOYEE EXPENSE 11,850 54,751 337,676 885,112 284,379 SERVICES (600,733) 2,852 2,474 MATERIALS AND SUPPLIES
86,638 PROGRAM EXPENSE 993 308,250 ADDITIONAL EXPENSES
(588,883) 400,000 988,883 835,510 58,596 Total Spending by Major Account
Spending by Accounting UnitOFS FINANCIAL EMPOWERMENT GRANTS 57,038 400,000 988,883 835,510 20013700 (588,883)INNOVATION INITIATIVES 1,559 20013800
Total Spending by Accounting Unit 58,596 400,000 (588,883) 835,510 988,883
93
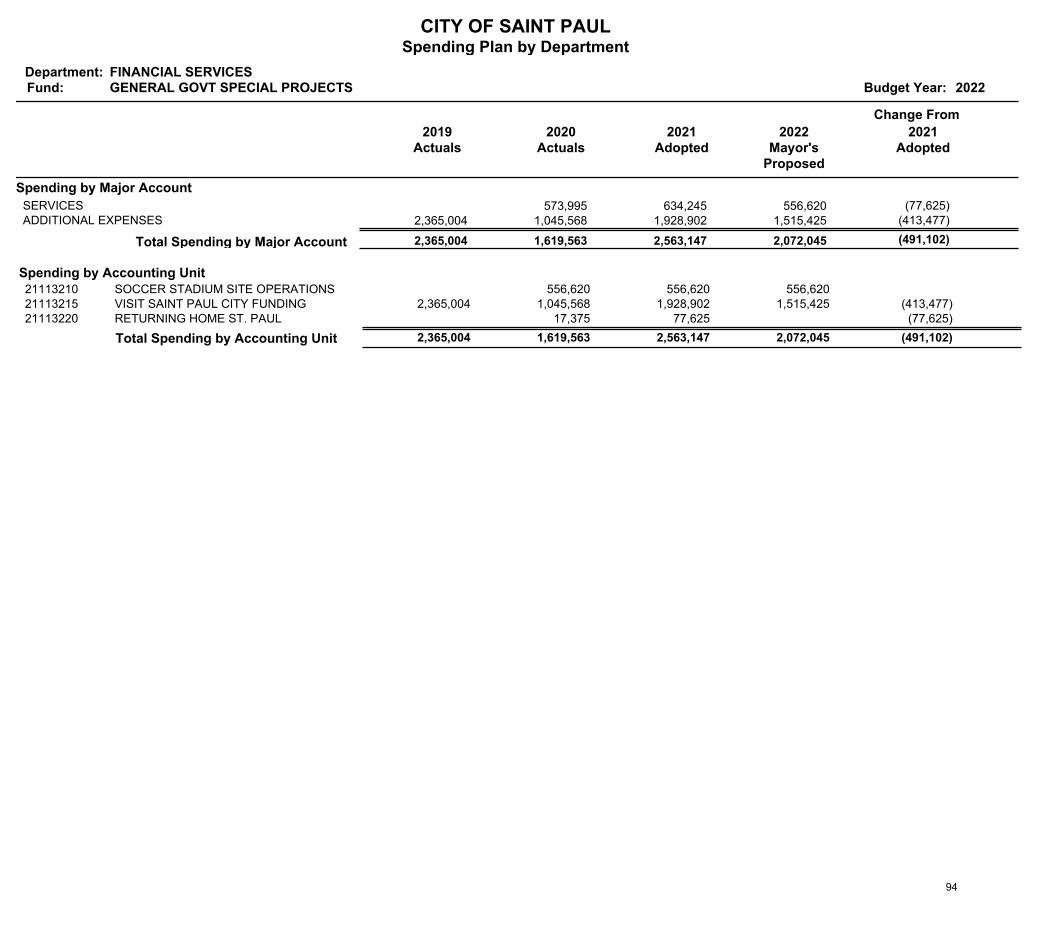
CITY OF SAINT PAULSpending Plan by Department
Department:Fund: Budget Year: 2022
FINANCIAL SERVICESGENERAL GOVT SPECIAL PROJECTS
2019Actuals
Change From
2020Actuals
2021Adopted
2022Mayor's
Proposed
2021Adopted
Spending by Major Account
573,995 634,245 556,620 SERVICES (77,625) 2,365,004 1,045,568 1,928,902 1,515,425 ADDITIONAL EXPENSES (413,477)
(491,102) 2,072,045 2,563,147 1,619,563 2,365,004 Total Spending by Major Account
Spending by Accounting UnitSOCCER STADIUM SITE OPERATIONS 556,620 556,620 556,620 21113210VISIT SAINT PAUL CITY FUNDING 2,365,004 1,515,425 1,928,902 1,045,568 21113215 (413,477)RETURNING HOME ST. PAUL 77,625 17,375 21113220 (77,625)
Total Spending by Accounting Unit 2,365,004 2,072,045 (491,102) 1,619,563 2,563,147
94
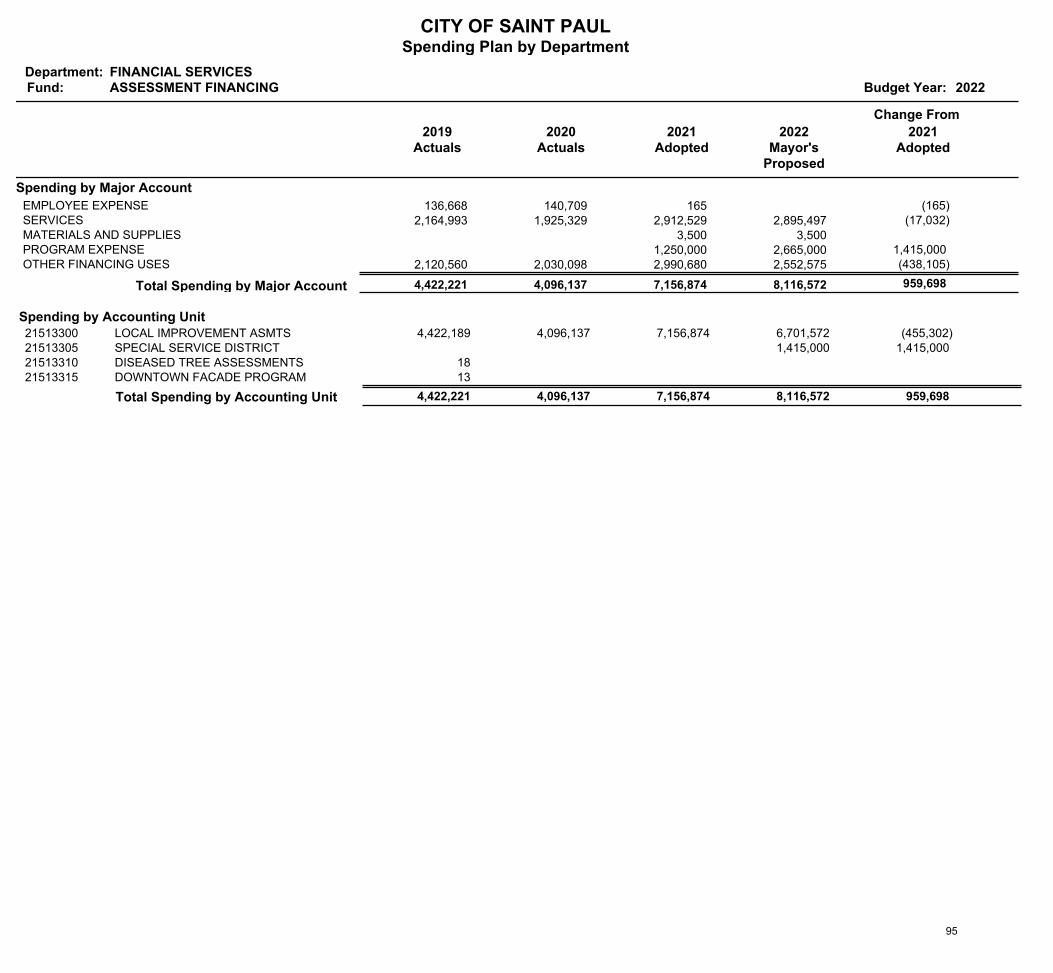
CITY OF SAINT PAULSpending Plan by Department
Department:Fund: Budget Year: 2022
FINANCIAL SERVICESASSESSMENT FINANCING
2019Actuals
Change From
2020Actuals
2021Adopted
2022Mayor's
Proposed
2021Adopted
Spending by Major Account
136,668 140,709 165 EMPLOYEE EXPENSE (165) 2,164,993 1,925,329 2,912,529 2,895,497 SERVICES (17,032)
3,500 3,500 MATERIALS AND SUPPLIES 1,250,000 2,665,000 PROGRAM EXPENSE 1,415,000
2,120,560 2,030,098 2,990,680 2,552,575 OTHER FINANCING USES (438,105)
959,698 8,116,572 7,156,874 4,096,137 4,422,221 Total Spending by Major Account
Spending by Accounting UnitLOCAL IMPROVEMENT ASMTS 4,422,189 6,701,572 7,156,874 4,096,137 21513300 (455,302)SPECIAL SERVICE DISTRICT 1,415,000 21513305 1,415,000 DISEASED TREE ASSESSMENTS 18 21513310DOWNTOWN FACADE PROGRAM 13 21513315
Total Spending by Accounting Unit 4,422,221 8,116,572 959,698 4,096,137 7,156,874
95
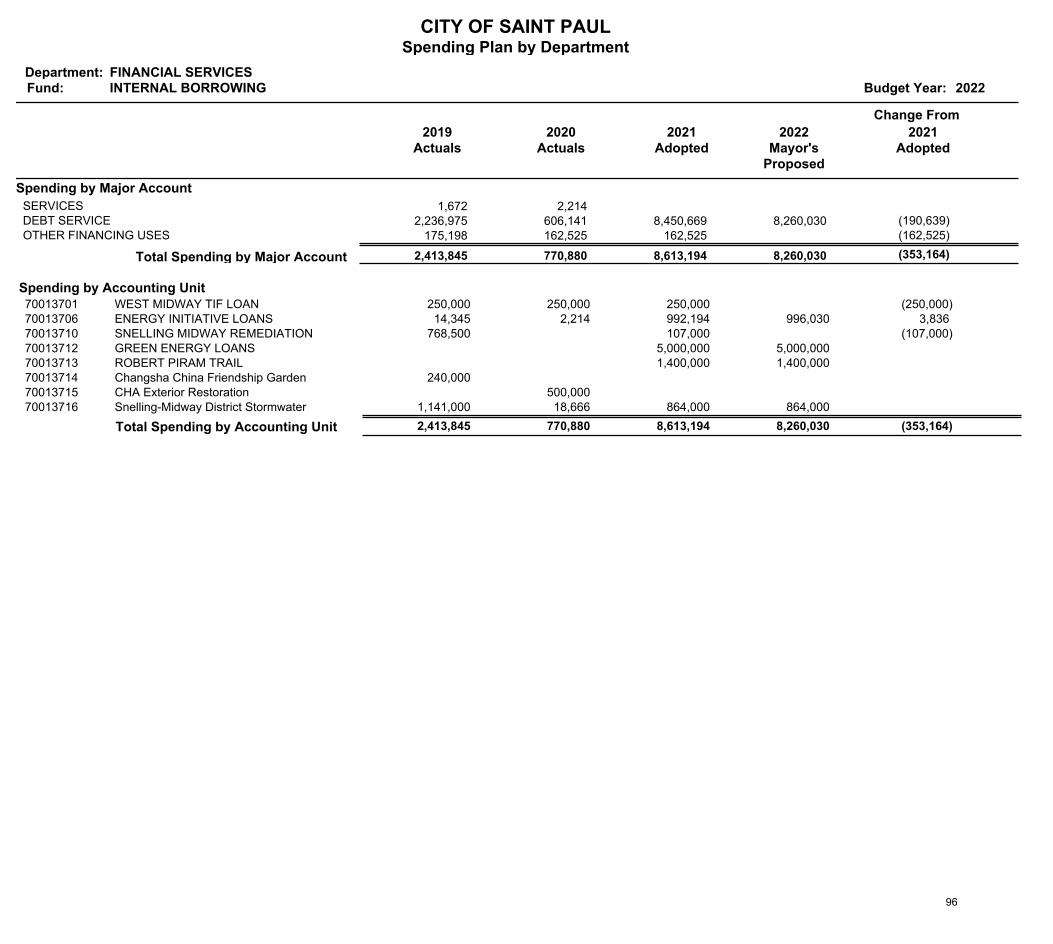
CITY OF SAINT PAULSpending Plan by Department
Department:Fund: Budget Year: 2022
FINANCIAL SERVICESINTERNAL BORROWING
2019Actuals
Change From
2020Actuals
2021Adopted
2022Mayor's
Proposed
2021Adopted
Spending by Major Account
1,672 2,214 SERVICES 2,236,975 606,141 8,450,669 8,260,030 DEBT SERVICE (190,639)
175,198 162,525 162,525 OTHER FINANCING USES (162,525)
(353,164) 8,260,030 8,613,194 770,880 2,413,845 Total Spending by Major Account
Spending by Accounting UnitWEST MIDWAY TIF LOAN 250,000 250,000 250,000 70013701 (250,000)ENERGY INITIATIVE LOANS 14,345 996,030 992,194 2,214 70013706 3,836 SNELLING MIDWAY REMEDIATION 768,500 107,000 70013710 (107,000)GREEN ENERGY LOANS 5,000,000 5,000,000 70013712ROBERT PIRAM TRAIL 1,400,000 1,400,000 70013713Changsha China Friendship Garden 240,000 70013714CHA Exterior Restoration 500,000 70013715Snelling-Midway District Stormwater 1,141,000 864,000 864,000 18,666 70013716
Total Spending by Accounting Unit 2,413,845 8,260,030 (353,164) 770,880 8,613,194
96
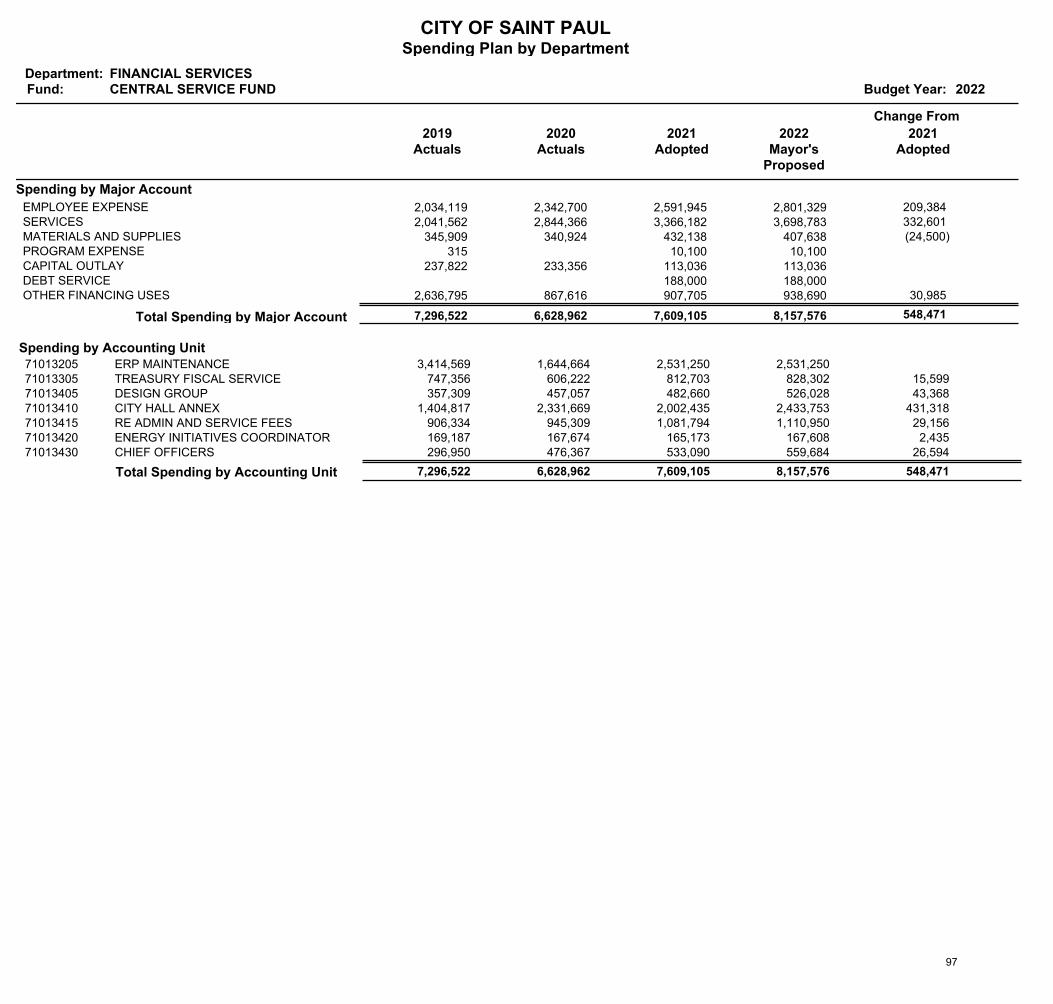
CITY OF SAINT PAULSpending Plan by Department
Department:Fund: Budget Year: 2022
FINANCIAL SERVICESCENTRAL SERVICE FUND
2019Actuals
Change From
2020Actuals
2021Adopted
2022Mayor's
Proposed
2021Adopted
Spending by Major Account
2,034,119 2,342,700 2,591,945 2,801,329 EMPLOYEE EXPENSE 209,384 2,041,562 2,844,366 3,366,182 3,698,783 SERVICES 332,601
345,909 340,924 432,138 407,638 MATERIALS AND SUPPLIES (24,500) 315 10,100 10,100 PROGRAM EXPENSE
237,822 233,356 113,036 113,036 CAPITAL OUTLAY 188,000 188,000 DEBT SERVICE
2,636,795 867,616 907,705 938,690 OTHER FINANCING USES 30,985
548,471 8,157,576 7,609,105 6,628,962 7,296,522 Total Spending by Major Account
Spending by Accounting UnitERP MAINTENANCE 3,414,569 2,531,250 2,531,250 1,644,664 71013205TREASURY FISCAL SERVICE 747,356 828,302 812,703 606,222 71013305 15,599 DESIGN GROUP 357,309 526,028 482,660 457,057 71013405 43,368 CITY HALL ANNEX 1,404,817 2,433,753 2,002,435 2,331,669 71013410 431,318 RE ADMIN AND SERVICE FEES 906,334 1,110,950 1,081,794 945,309 71013415 29,156 ENERGY INITIATIVES COORDINATOR 169,187 167,608 165,173 167,674 71013420 2,435 CHIEF OFFICERS 296,950 559,684 533,090 476,367 71013430 26,594
Total Spending by Accounting Unit 7,296,522 8,157,576 548,471 6,628,962 7,609,105
97
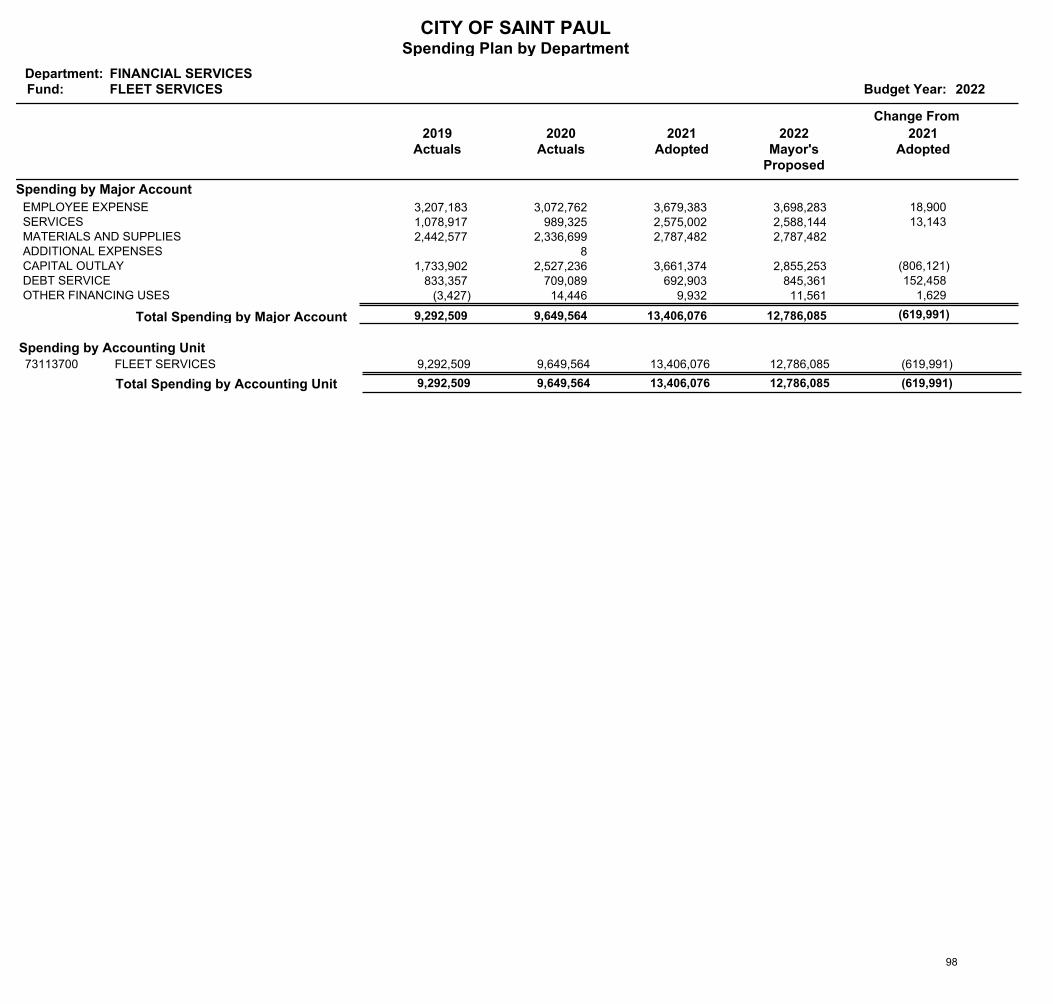
CITY OF SAINT PAULSpending Plan by Department
Department:Fund: Budget Year: 2022
FINANCIAL SERVICESFLEET SERVICES
2019Actuals
Change From
2020Actuals
2021Adopted
2022Mayor's
Proposed
2021Adopted
Spending by Major Account
3,207,183 3,072,762 3,679,383 3,698,283 EMPLOYEE EXPENSE 18,900 1,078,917 989,325 2,575,002 2,588,144 SERVICES 13,143 2,442,577 2,336,699 2,787,482 2,787,482 MATERIALS AND SUPPLIES
8 ADDITIONAL EXPENSES 1,733,902 2,527,236 3,661,374 2,855,253 CAPITAL OUTLAY (806,121)
833,357 709,089 692,903 845,361 DEBT SERVICE 152,458 (3,427) 14,446 9,932 11,561 OTHER FINANCING USES 1,629
(619,991) 12,786,085 13,406,076 9,649,564 9,292,509 Total Spending by Major Account
Spending by Accounting UnitFLEET SERVICES 9,292,509 12,786,085 13,406,076 9,649,564 73113700 (619,991)
Total Spending by Accounting Unit 9,292,509 12,786,085 (619,991) 9,649,564 13,406,076
98

Financing Reports 99
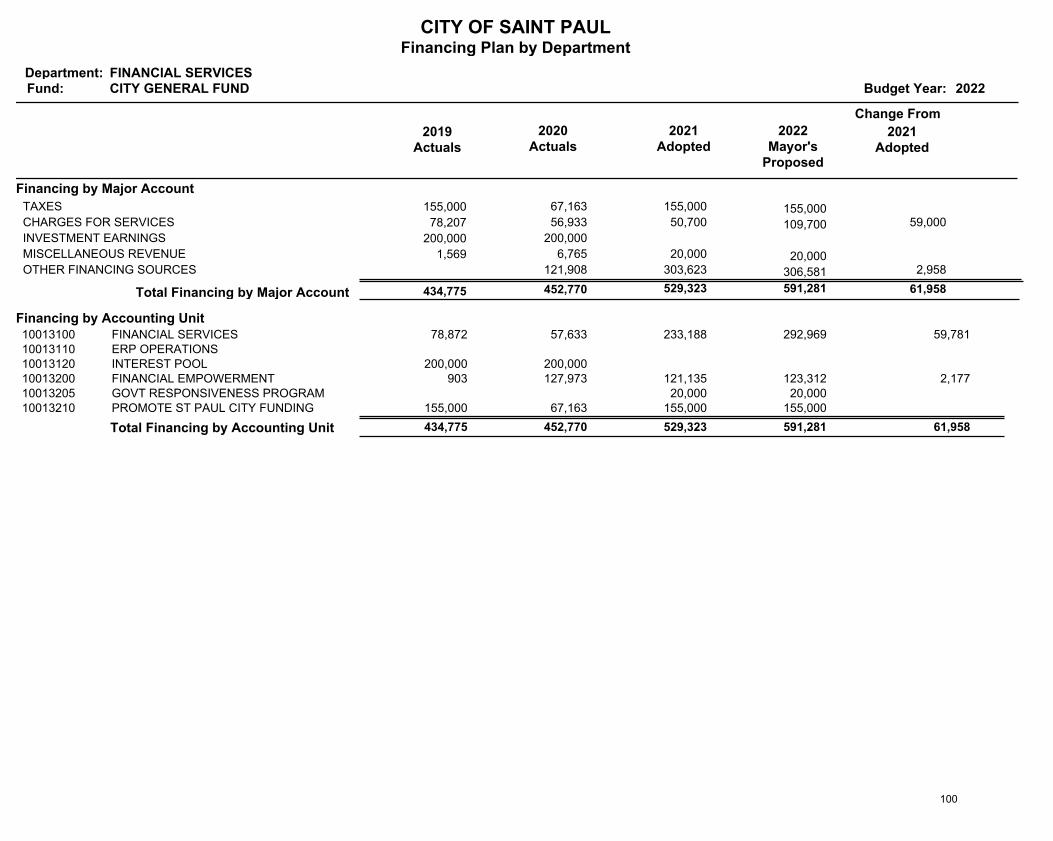
CITY OF SAINT PAULFinancing Plan by Department
Department:Fund: Budget Year: 2022
FINANCIAL SERVICESCITY GENERAL FUND
2019Actuals
Change From
2020Actuals
2021Adopted
2022Mayor's
Proposed
2021Adopted
Financing by Major Account
155,000 67,163 155,000 155,000 TAXES
78,207 56,933 50,700 109,700 CHARGES FOR SERVICES 59,000
200,000 200,000 INVESTMENT EARNINGS
1,569 6,765 20,000 20,000 MISCELLANEOUS REVENUE
121,908 303,623 306,581 OTHER FINANCING SOURCES 2,958
61,958 591,281 529,323 452,770 434,775 Total Financing by Major Account
Financing by Accounting UnitFINANCIAL SERVICES 78,872 292,969 233,188 57,633 10013100 59,781 ERP OPERATIONS10013110INTEREST POOL 200,000 200,000 10013120FINANCIAL EMPOWERMENT 903 123,312 121,135 127,973 10013200 2,177 GOVT RESPONSIVENESS PROGRAM 20,000 20,000 10013205PROMOTE ST PAUL CITY FUNDING 155,000 155,000 155,000 67,163 10013210
Total Financing by Accounting Unit 434,775 591,281 61,958 452,770 529,323
100
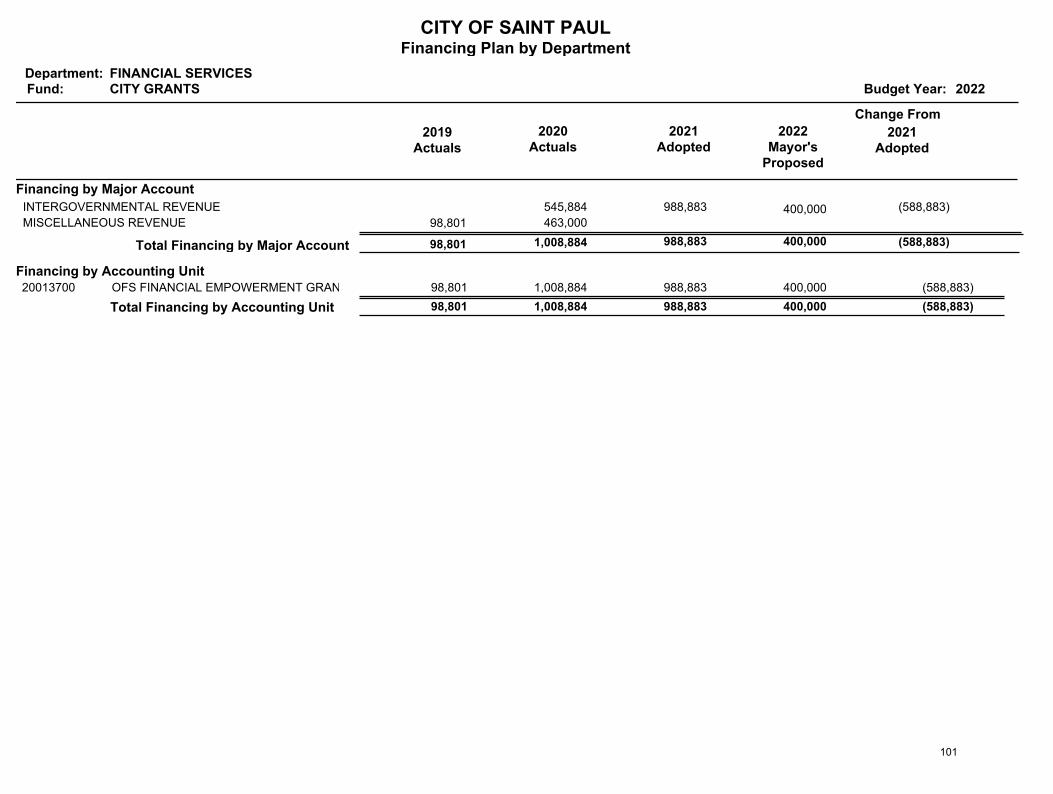
CITY OF SAINT PAULFinancing Plan by Department
Department:Fund: Budget Year: 2022
FINANCIAL SERVICESCITY GRANTS
2019Actuals
Change From
2020Actuals
2021Adopted
2022Mayor's
Proposed
2021Adopted
Financing by Major Account
545,884 988,883 400,000 INTERGOVERNMENTAL REVENUE (588,883)
98,801 463,000 MISCELLANEOUS REVENUE
(588,883) 400,000 988,883 1,008,884 98,801 Total Financing by Major Account
Financing by Accounting UnitOFS FINANCIAL EMPOWERMENT GRANTS 98,801 400,000 988,883 1,008,884 20013700 (588,883)
Total Financing by Accounting Unit 98,801 400,000 (588,883) 1,008,884 988,883
101
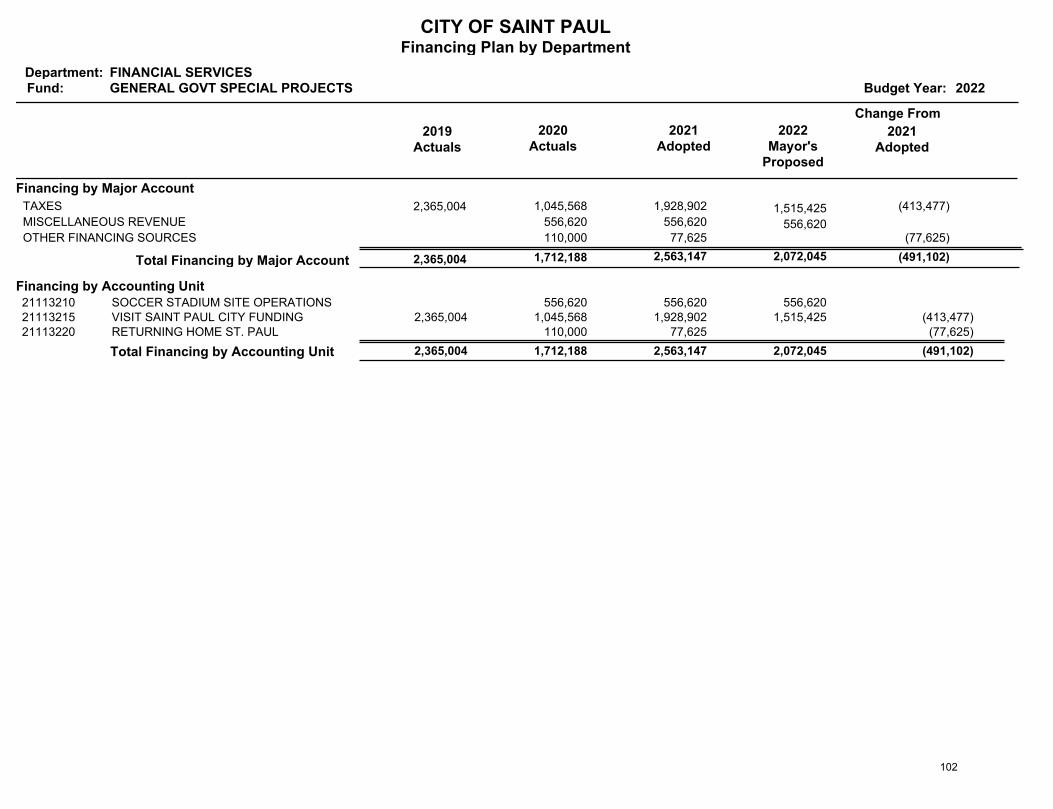
CITY OF SAINT PAULFinancing Plan by Department
Department:Fund: Budget Year: 2022
FINANCIAL SERVICESGENERAL GOVT SPECIAL PROJECTS
2019Actuals
Change From
2020Actuals
2021Adopted
2022Mayor's
Proposed
2021Adopted
Financing by Major Account
2,365,004 1,045,568 1,928,902 1,515,425 TAXES (413,477)
556,620 556,620 556,620 MISCELLANEOUS REVENUE
110,000 77,625 OTHER FINANCING SOURCES (77,625)
(491,102) 2,072,045 2,563,147 1,712,188 2,365,004 Total Financing by Major Account
Financing by Accounting UnitSOCCER STADIUM SITE OPERATIONS 556,620 556,620 556,620 21113210VISIT SAINT PAUL CITY FUNDING 2,365,004 1,515,425 1,928,902 1,045,568 21113215 (413,477)RETURNING HOME ST. PAUL 77,625 110,000 21113220 (77,625)
Total Financing by Accounting Unit 2,365,004 2,072,045 (491,102) 1,712,188 2,563,147
102
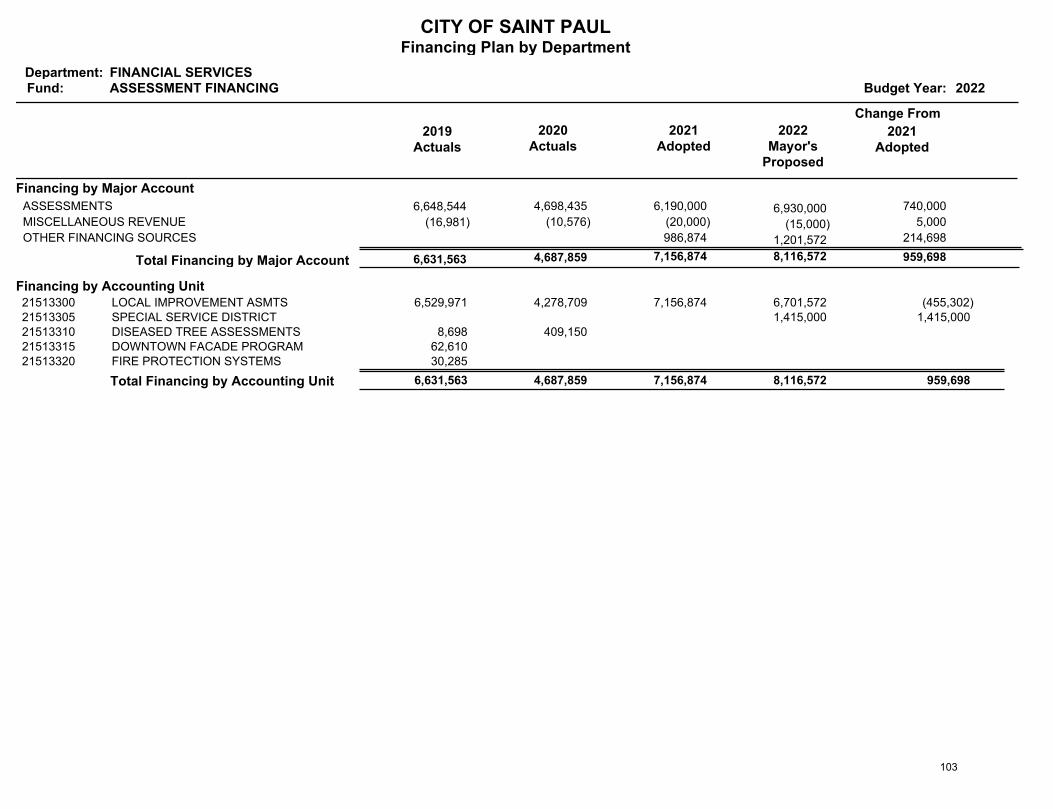
CITY OF SAINT PAULFinancing Plan by Department
Department:Fund: Budget Year: 2022
FINANCIAL SERVICESASSESSMENT FINANCING
2019Actuals
Change From
2020Actuals
2021Adopted
2022Mayor's
Proposed
2021Adopted
Financing by Major Account
6,648,544 4,698,435 6,190,000 6,930,000 ASSESSMENTS 740,000
(16,981) (10,576) (20,000) (15,000)MISCELLANEOUS REVENUE 5,000
986,874 1,201,572 OTHER FINANCING SOURCES 214,698
959,698 8,116,572 7,156,874 4,687,859 6,631,563 Total Financing by Major Account
Financing by Accounting UnitLOCAL IMPROVEMENT ASMTS 6,529,971 6,701,572 7,156,874 4,278,709 21513300 (455,302)SPECIAL SERVICE DISTRICT 1,415,000 21513305 1,415,000 DISEASED TREE ASSESSMENTS 8,698 409,150 21513310DOWNTOWN FACADE PROGRAM 62,610 21513315FIRE PROTECTION SYSTEMS 30,285 21513320
Total Financing by Accounting Unit 6,631,563 8,116,572 959,698 4,687,859 7,156,874
103
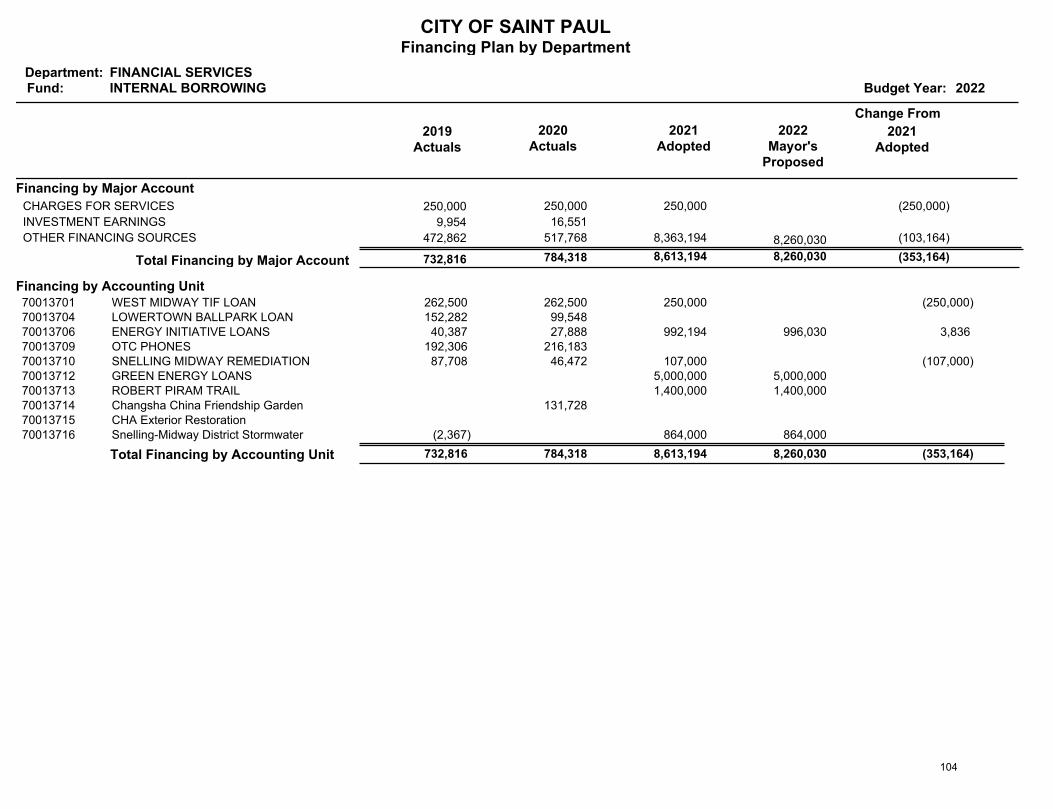
CITY OF SAINT PAULFinancing Plan by Department
Department:Fund: Budget Year: 2022
FINANCIAL SERVICESINTERNAL BORROWING
2019Actuals
Change From
2020Actuals
2021Adopted
2022Mayor's
Proposed
2021Adopted
Financing by Major Account
250,000 250,000 250,000 CHARGES FOR SERVICES (250,000)
9,954 16,551 INVESTMENT EARNINGS
472,862 517,768 8,363,194 8,260,030 OTHER FINANCING SOURCES (103,164)
(353,164) 8,260,030 8,613,194 784,318 732,816 Total Financing by Major Account
Financing by Accounting UnitWEST MIDWAY TIF LOAN 262,500 250,000 262,500 70013701 (250,000)LOWERTOWN BALLPARK LOAN 152,282 99,548 70013704ENERGY INITIATIVE LOANS 40,387 996,030 992,194 27,888 70013706 3,836 OTC PHONES 192,306 216,183 70013709SNELLING MIDWAY REMEDIATION 87,708 107,000 46,472 70013710 (107,000)GREEN ENERGY LOANS 5,000,000 5,000,000 70013712ROBERT PIRAM TRAIL 1,400,000 1,400,000 70013713Changsha China Friendship Garden 131,728 70013714CHA Exterior Restoration70013715Snelling-Midway District Stormwater (2,367) 864,000 864,000 70013716
Total Financing by Accounting Unit 732,816 8,260,030 (353,164) 784,318 8,613,194
104
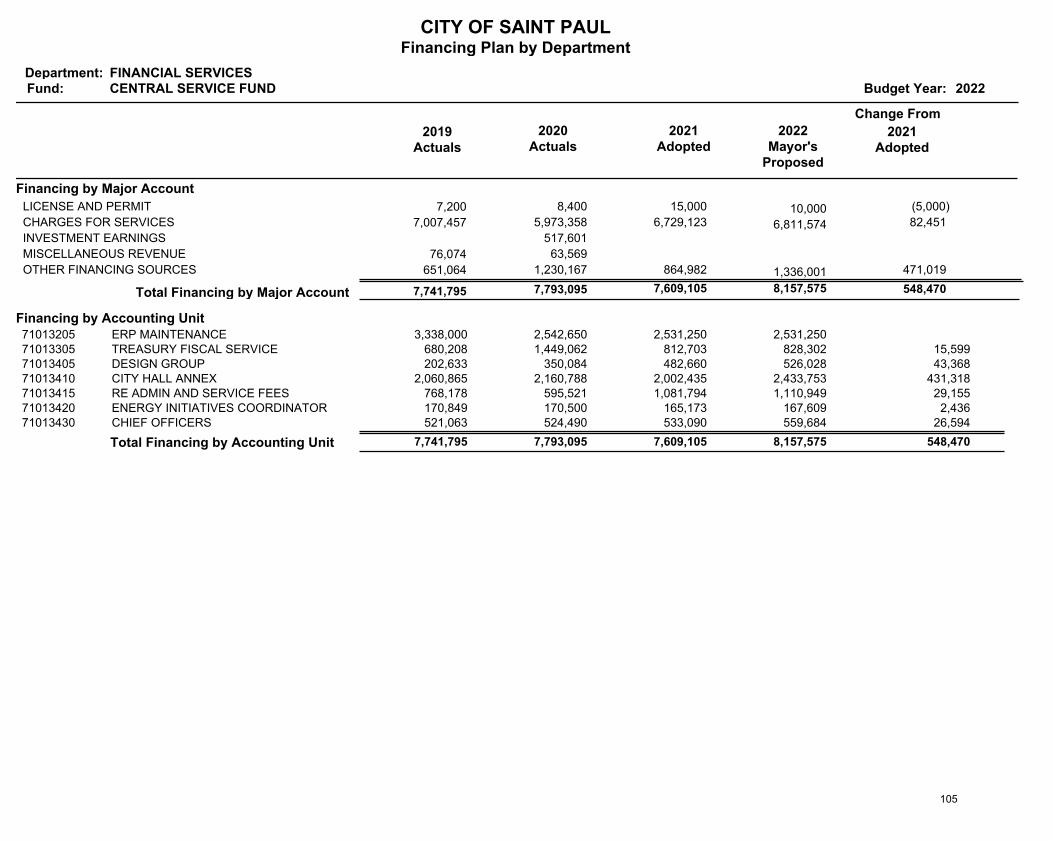
CITY OF SAINT PAULFinancing Plan by Department
Department:Fund: Budget Year: 2022
FINANCIAL SERVICESCENTRAL SERVICE FUND
2019Actuals
Change From
2020Actuals
2021Adopted
2022Mayor's
Proposed
2021Adopted
Financing by Major Account
7,200 8,400 15,000 10,000 LICENSE AND PERMIT (5,000)
7,007,457 5,973,358 6,729,123 6,811,574 CHARGES FOR SERVICES 82,451
517,601 INVESTMENT EARNINGS
76,074 63,569 MISCELLANEOUS REVENUE
651,064 1,230,167 864,982 1,336,001 OTHER FINANCING SOURCES 471,019
548,470 8,157,575 7,609,105 7,793,095 7,741,795 Total Financing by Major Account
Financing by Accounting UnitERP MAINTENANCE 3,338,000 2,531,250 2,531,250 2,542,650 71013205TREASURY FISCAL SERVICE 680,208 828,302 812,703 1,449,062 71013305 15,599 DESIGN GROUP 202,633 526,028 482,660 350,084 71013405 43,368 CITY HALL ANNEX 2,060,865 2,433,753 2,002,435 2,160,788 71013410 431,318 RE ADMIN AND SERVICE FEES 768,178 1,110,949 1,081,794 595,521 71013415 29,155 ENERGY INITIATIVES COORDINATOR 170,849 167,609 165,173 170,500 71013420 2,436 CHIEF OFFICERS 521,063 559,684 533,090 524,490 71013430 26,594
Total Financing by Accounting Unit 7,741,795 8,157,575 548,470 7,793,095 7,609,105
105
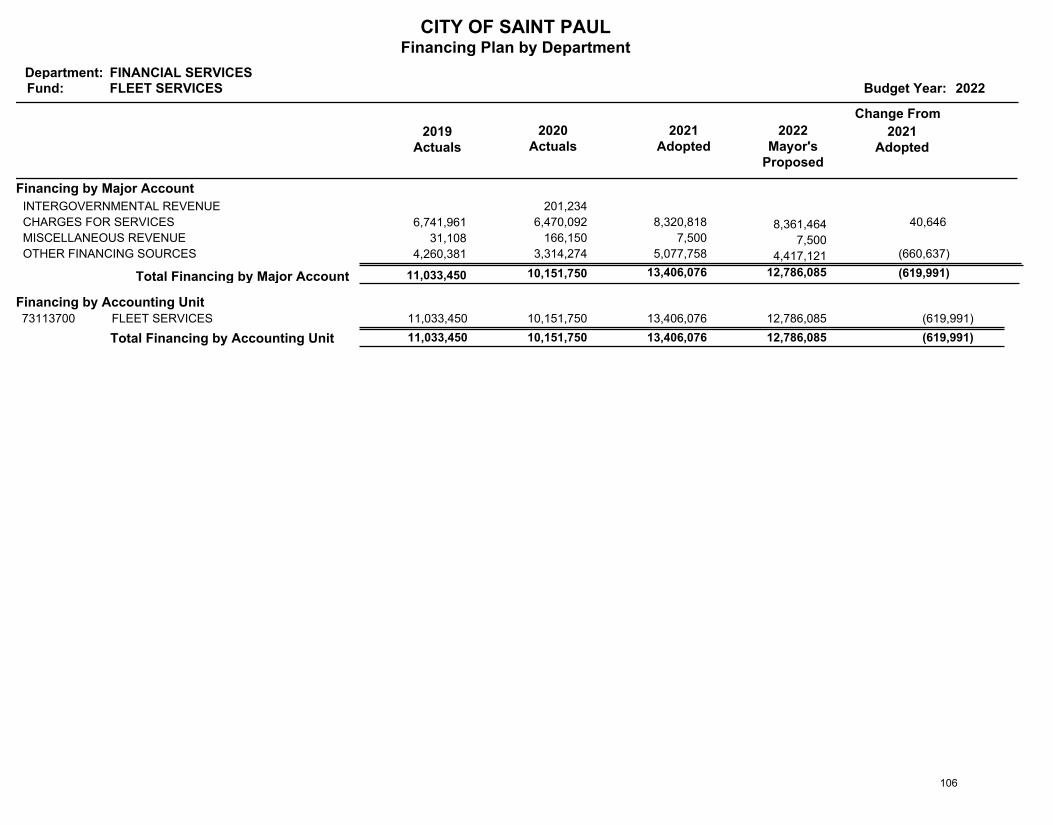
CITY OF SAINT PAULFinancing Plan by Department
Department:Fund: Budget Year: 2022
FINANCIAL SERVICESFLEET SERVICES
2019Actuals
Change From
2020Actuals
2021Adopted
2022Mayor's
Proposed
2021Adopted
Financing by Major Account
201,234 INTERGOVERNMENTAL REVENUE
6,741,961 6,470,092 8,320,818 8,361,464 CHARGES FOR SERVICES 40,646
31,108 166,150 7,500 7,500 MISCELLANEOUS REVENUE
4,260,381 3,314,274 5,077,758 4,417,121 OTHER FINANCING SOURCES (660,637)
(619,991) 12,786,085 13,406,076 10,151,750 11,033,450 Total Financing by Major Account
Financing by Accounting UnitFLEET SERVICES 11,033,450 12,786,085 13,406,076 10,151,750 73113700 (619,991)
Total Financing by Accounting Unit 11,033,450 12,786,085 (619,991) 10,151,750 13,406,076
106
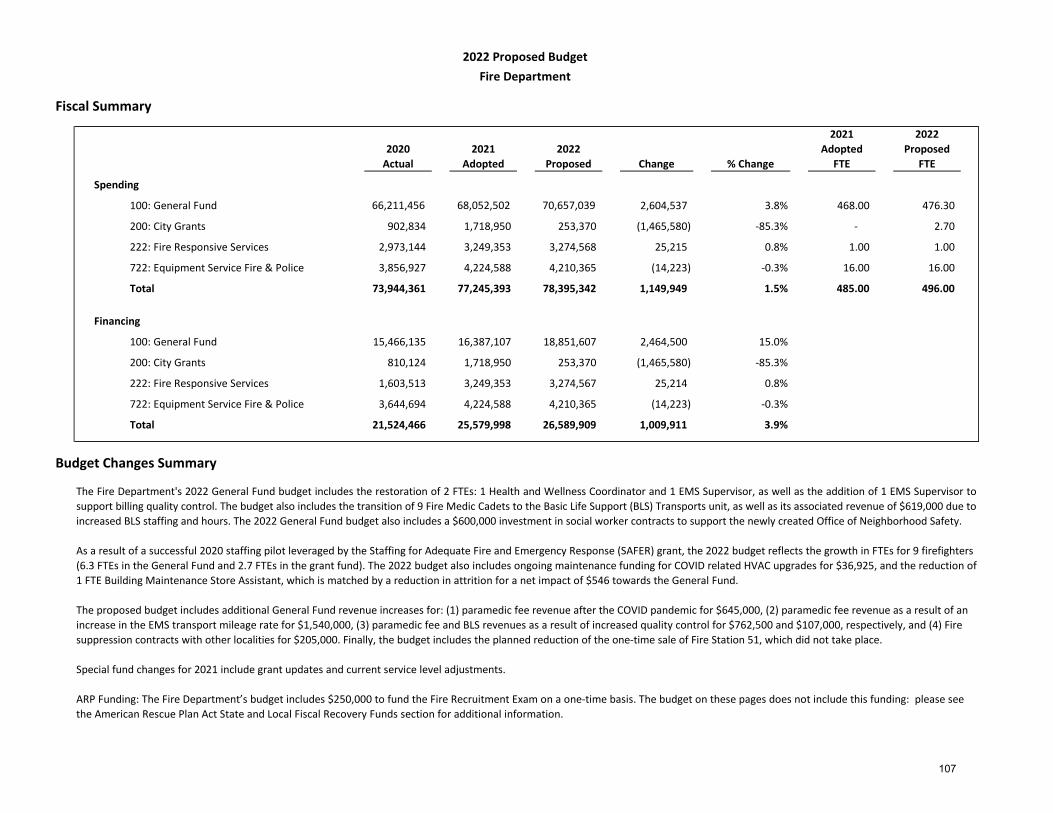
Fiscal Summary
2020Actual
2021Adopted
2022 Proposed Change % Change
2021Adopted
FTE
2022 Proposed
FTE
Spending
66,211,456 68,052,502 70,657,039 2,604,537 3.8% 468.00 476.30
902,834 1,718,950 253,370 (1,465,580) -85.3% - 2.70
2,973,144 3,249,353 3,274,568 25,215 0.8% 1.00 1.00
3,856,927 4,224,588 4,210,365 (14,223) -0.3% 16.00 16.00
73,944,361 77,245,393 78,395,342 1,149,949 1.5% 485.00 496.00
Financing
15,466,135 16,387,107 18,851,607 2,464,500 15.0%
810,124 1,718,950 253,370 (1,465,580) -85.3%
1,603,513 3,249,353 3,274,567 25,214 0.8%
3,644,694 4,224,588 4,210,365 (14,223) -0.3%
21,524,466 25,579,998 26,589,909 1,009,911 3.9%
Budget Changes Summary
2022 Proposed BudgetFire Department
The Fire Department's 2022 General Fund budget includes the restoration of 2 FTEs: 1 Health and Wellness Coordinator and 1 EMS Supervisor, as well as the addition of 1 EMS Supervisor to support billing quality control. The budget also includes the transition of 9 Fire Medic Cadets to the Basic Life Support (BLS) Transports unit, as well as its associated revenue of $619,000 due to increased BLS staffing and hours. The 2022 General Fund budget also includes a $600,000 investment in social worker contracts to support the newly created Office of Neighborhood Safety.
As a result of a successful 2020 staffing pilot leveraged by the Staffing for Adequate Fire and Emergency Response (SAFER) grant, the 2022 budget reflects the growth in FTEs for 9 firefighters (6.3 FTEs in the General Fund and 2.7 FTEs in the grant fund). The 2022 budget also includes ongoing maintenance funding for COVID related HVAC upgrades for $36,925, and the reduction of 1 FTE Building Maintenance Store Assistant, which is matched by a reduction in attrition for a net impact of $546 towards the General Fund.
The proposed budget includes additional General Fund revenue increases for: (1) paramedic fee revenue after the COVID pandemic for $645,000, (2) paramedic fee revenue as a result of an increase in the EMS transport mileage rate for $1,540,000, (3) paramedic fee and BLS revenues as a result of increased quality control for $762,500 and $107,000, respectively, and (4) Fire suppression contracts with other localities for $205,000. Finally, the budget includes the planned reduction of the one-time sale of Fire Station 51, which did not take place.
Special fund changes for 2021 include grant updates and current service level adjustments.
ARP Funding: The Fire Department’s budget includes $250,000 to fund the Fire Recruitment Exam on a one-time basis. The budget on these pages does not include this funding: please see the American Rescue Plan Act State and Local Fiscal Recovery Funds section for additional information.
722: Equipment Service Fire & Police
200: City Grants
222: Fire Responsive Services
100: General Fund
200: City Grants
722: Equipment Service Fire & Police
222: Fire Responsive Services
Total
Total
100: General Fund
107

Spending Reports 108
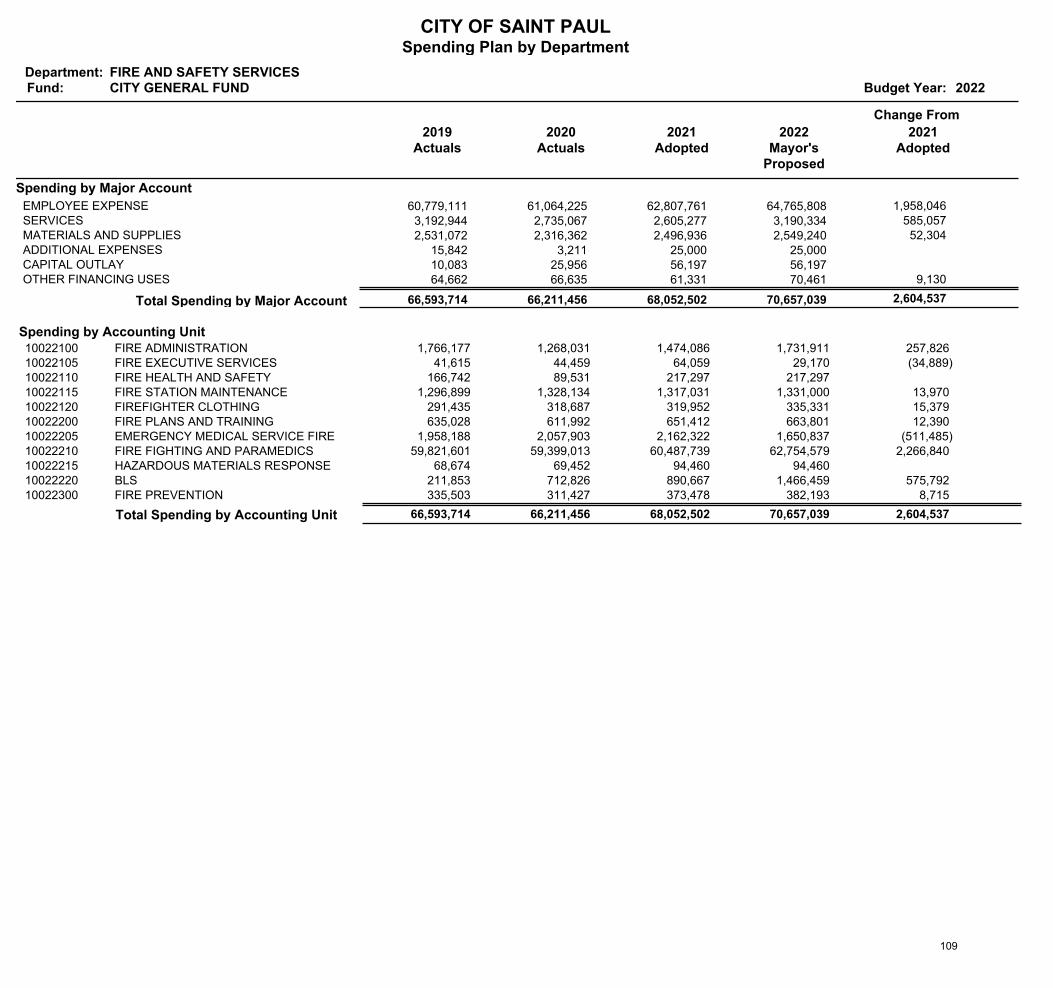
CITY OF SAINT PAULSpending Plan by Department
Department:Fund: Budget Year: 2022
FIRE AND SAFETY SERVICESCITY GENERAL FUND
2019Actuals
Change From
2020Actuals
2021Adopted
2022Mayor's
Proposed
2021Adopted
Spending by Major Account
60,779,111 61,064,225 62,807,761 64,765,808 EMPLOYEE EXPENSE 1,958,046 3,192,944 2,735,067 2,605,277 3,190,334 SERVICES 585,057 2,531,072 2,316,362 2,496,936 2,549,240 MATERIALS AND SUPPLIES 52,304
15,842 3,211 25,000 25,000 ADDITIONAL EXPENSES 10,083 25,956 56,197 56,197 CAPITAL OUTLAY 64,662 66,635 61,331 70,461 OTHER FINANCING USES 9,130
2,604,537 70,657,039 68,052,502 66,211,456 66,593,714 Total Spending by Major Account
Spending by Accounting UnitFIRE ADMINISTRATION 1,766,177 1,731,911 1,474,086 1,268,031 10022100 257,826 FIRE EXECUTIVE SERVICES 41,615 29,170 64,059 44,459 10022105 (34,889)FIRE HEALTH AND SAFETY 166,742 217,297 217,297 89,531 10022110FIRE STATION MAINTENANCE 1,296,899 1,331,000 1,317,031 1,328,134 10022115 13,970 FIREFIGHTER CLOTHING 291,435 335,331 319,952 318,687 10022120 15,379 FIRE PLANS AND TRAINING 635,028 663,801 651,412 611,992 10022200 12,390 EMERGENCY MEDICAL SERVICE FIRE 1,958,188 1,650,837 2,162,322 2,057,903 10022205 (511,485)FIRE FIGHTING AND PARAMEDICS 59,821,601 62,754,579 60,487,739 59,399,013 10022210 2,266,840 HAZARDOUS MATERIALS RESPONSE 68,674 94,460 94,460 69,452 10022215BLS 211,853 1,466,459 890,667 712,826 10022220 575,792 FIRE PREVENTION 335,503 382,193 373,478 311,427 10022300 8,715
Total Spending by Accounting Unit 66,593,714 70,657,039 2,604,537 66,211,456 68,052,502
109
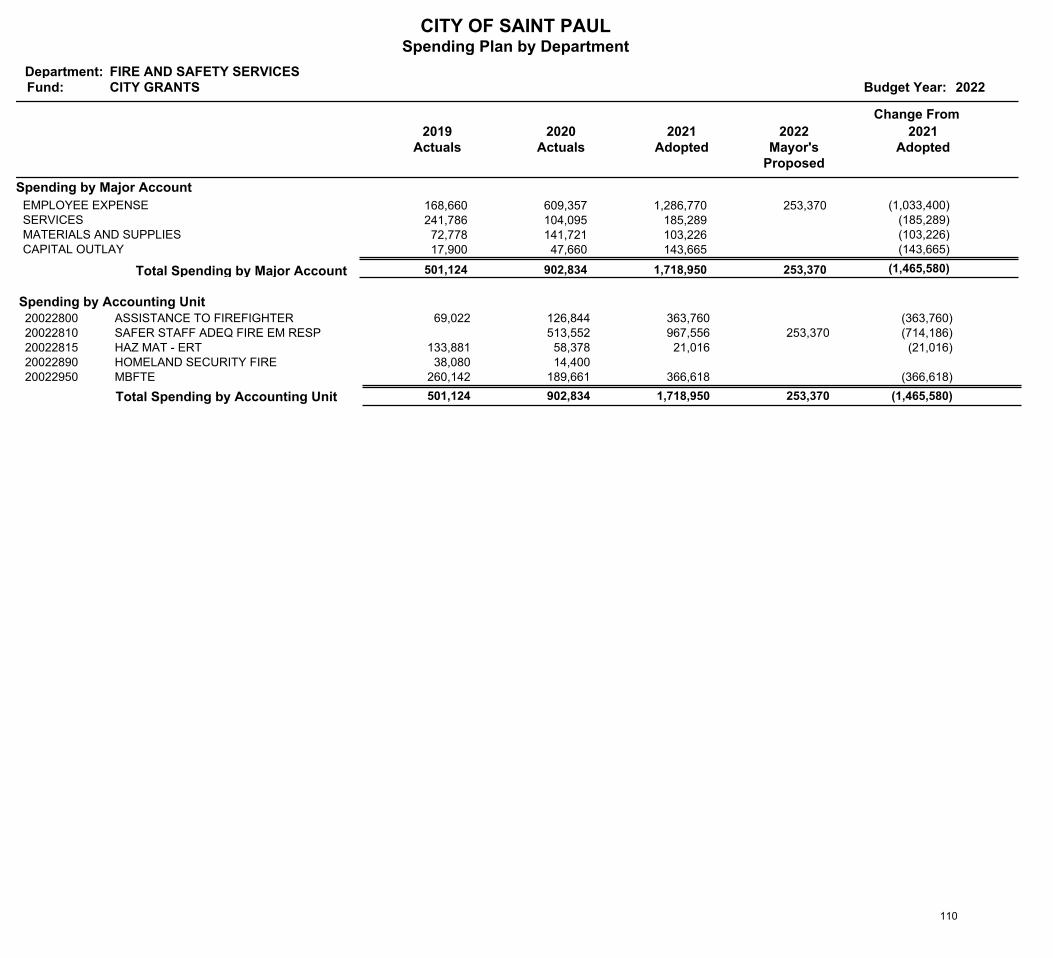
CITY OF SAINT PAULSpending Plan by Department
Department:Fund: Budget Year: 2022
FIRE AND SAFETY SERVICESCITY GRANTS
2019Actuals
Change From
2020Actuals
2021Adopted
2022Mayor's
Proposed
2021Adopted
Spending by Major Account
168,660 609,357 1,286,770 253,370 EMPLOYEE EXPENSE (1,033,400) 241,786 104,095 185,289 SERVICES (185,289) 72,778 141,721 103,226 MATERIALS AND SUPPLIES (103,226) 17,900 47,660 143,665 CAPITAL OUTLAY (143,665)
(1,465,580) 253,370 1,718,950 902,834 501,124 Total Spending by Major Account
Spending by Accounting UnitASSISTANCE TO FIREFIGHTER 69,022 363,760 126,844 20022800 (363,760)SAFER STAFF ADEQ FIRE EM RESP 253,370 967,556 513,552 20022810 (714,186)HAZ MAT - ERT 133,881 21,016 58,378 20022815 (21,016)HOMELAND SECURITY FIRE 38,080 14,400 20022890MBFTE 260,142 366,618 189,661 20022950 (366,618)
Total Spending by Accounting Unit 501,124 253,370 (1,465,580) 902,834 1,718,950
110
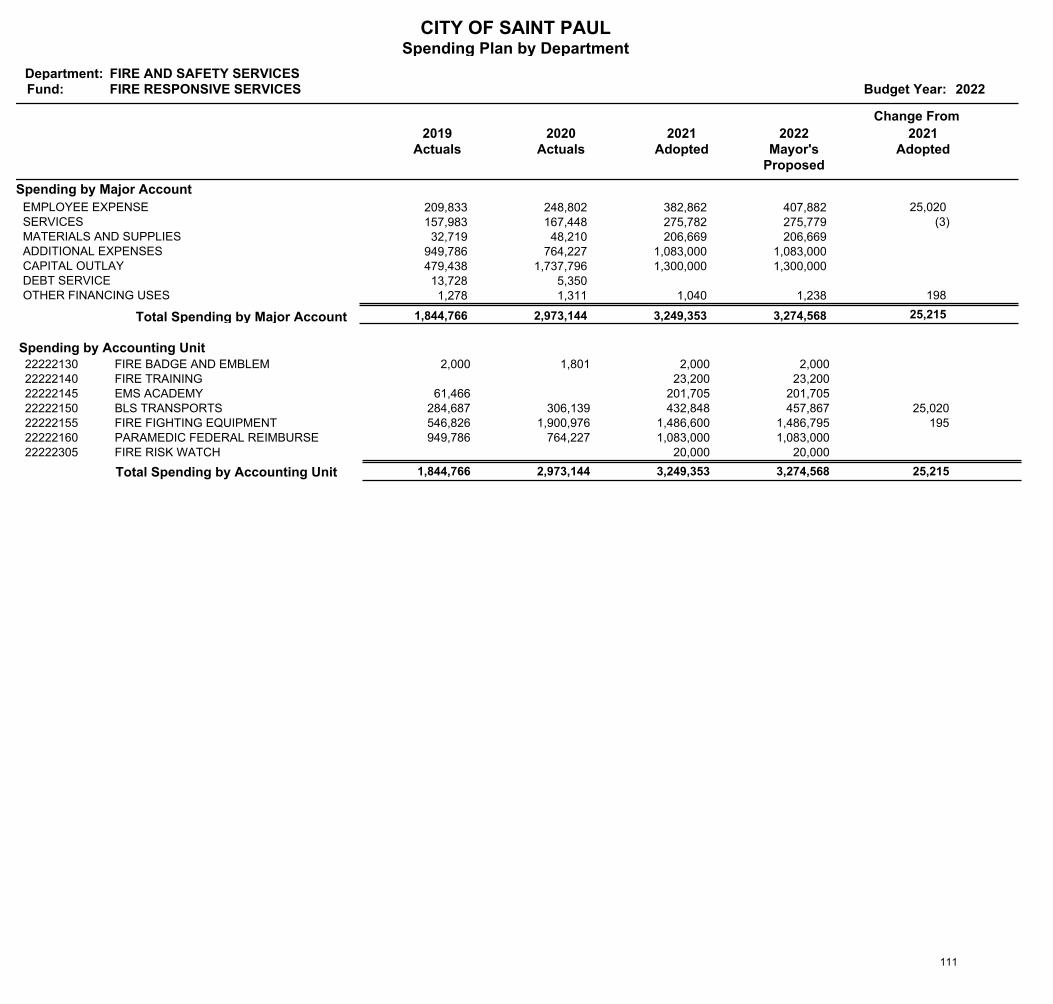
CITY OF SAINT PAULSpending Plan by Department
Department:Fund: Budget Year: 2022
FIRE AND SAFETY SERVICESFIRE RESPONSIVE SERVICES
2019Actuals
Change From
2020Actuals
2021Adopted
2022Mayor's
Proposed
2021Adopted
Spending by Major Account
209,833 248,802 382,862 407,882 EMPLOYEE EXPENSE 25,020 157,983 167,448 275,782 275,779 SERVICES (3) 32,719 48,210 206,669 206,669 MATERIALS AND SUPPLIES
949,786 764,227 1,083,000 1,083,000 ADDITIONAL EXPENSES 479,438 1,737,796 1,300,000 1,300,000 CAPITAL OUTLAY 13,728 5,350 DEBT SERVICE 1,278 1,311 1,040 1,238 OTHER FINANCING USES 198
25,215 3,274,568 3,249,353 2,973,144 1,844,766 Total Spending by Major Account
Spending by Accounting UnitFIRE BADGE AND EMBLEM 2,000 2,000 2,000 1,801 22222130FIRE TRAINING 23,200 23,200 22222140EMS ACADEMY 61,466 201,705 201,705 22222145BLS TRANSPORTS 284,687 457,867 432,848 306,139 22222150 25,020 FIRE FIGHTING EQUIPMENT 546,826 1,486,795 1,486,600 1,900,976 22222155 195 PARAMEDIC FEDERAL REIMBURSE 949,786 1,083,000 1,083,000 764,227 22222160FIRE RISK WATCH 20,000 20,000 22222305
Total Spending by Accounting Unit 1,844,766 3,274,568 25,215 2,973,144 3,249,353
111
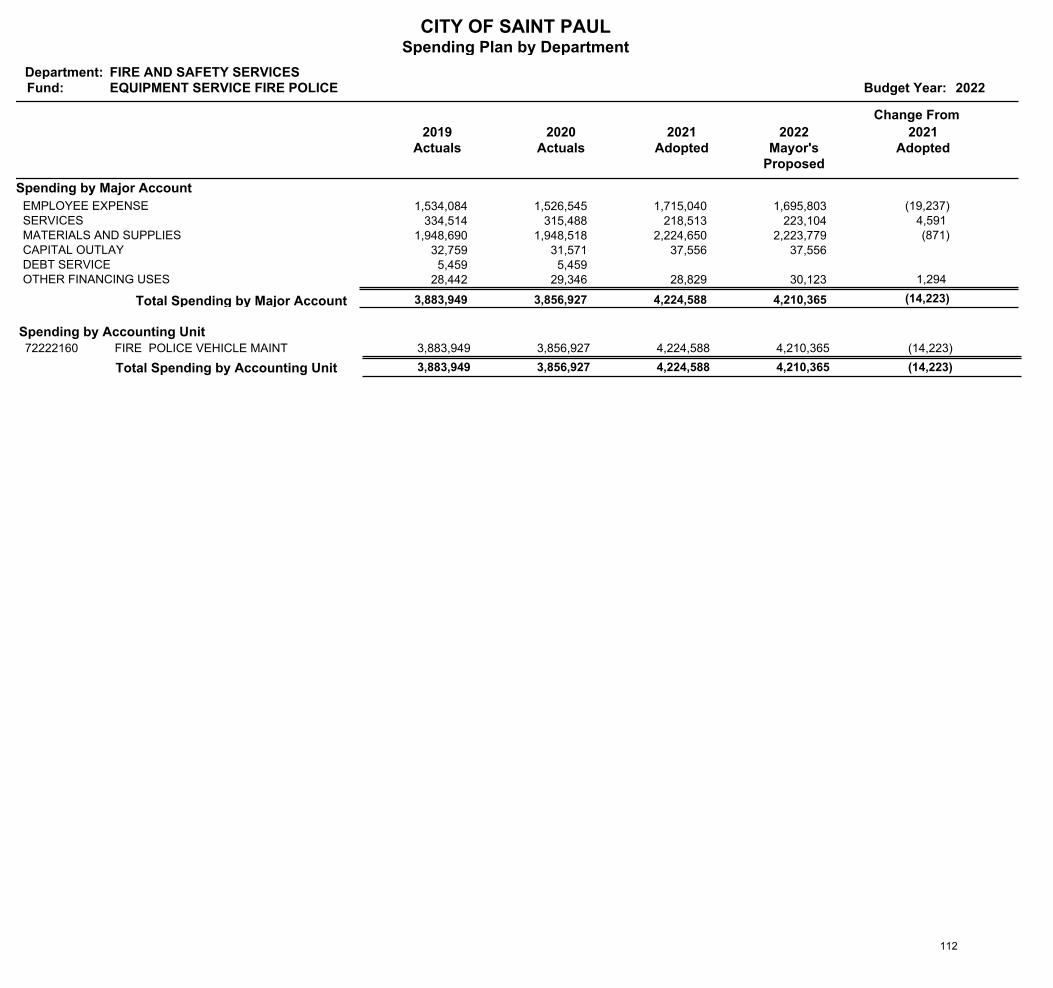
CITY OF SAINT PAULSpending Plan by Department
Department:Fund: Budget Year: 2022
FIRE AND SAFETY SERVICESEQUIPMENT SERVICE FIRE POLICE
2019Actuals
Change From
2020Actuals
2021Adopted
2022Mayor's
Proposed
2021Adopted
Spending by Major Account
1,534,084 1,526,545 1,715,040 1,695,803 EMPLOYEE EXPENSE (19,237) 334,514 315,488 218,513 223,104 SERVICES 4,591
1,948,690 1,948,518 2,224,650 2,223,779 MATERIALS AND SUPPLIES (871) 32,759 31,571 37,556 37,556 CAPITAL OUTLAY 5,459 5,459 DEBT SERVICE
28,442 29,346 28,829 30,123 OTHER FINANCING USES 1,294
(14,223) 4,210,365 4,224,588 3,856,927 3,883,949 Total Spending by Major Account
Spending by Accounting UnitFIRE POLICE VEHICLE MAINT 3,883,949 4,210,365 4,224,588 3,856,927 72222160 (14,223)
Total Spending by Accounting Unit 3,883,949 4,210,365 (14,223) 3,856,927 4,224,588
112
Financing Reports 113
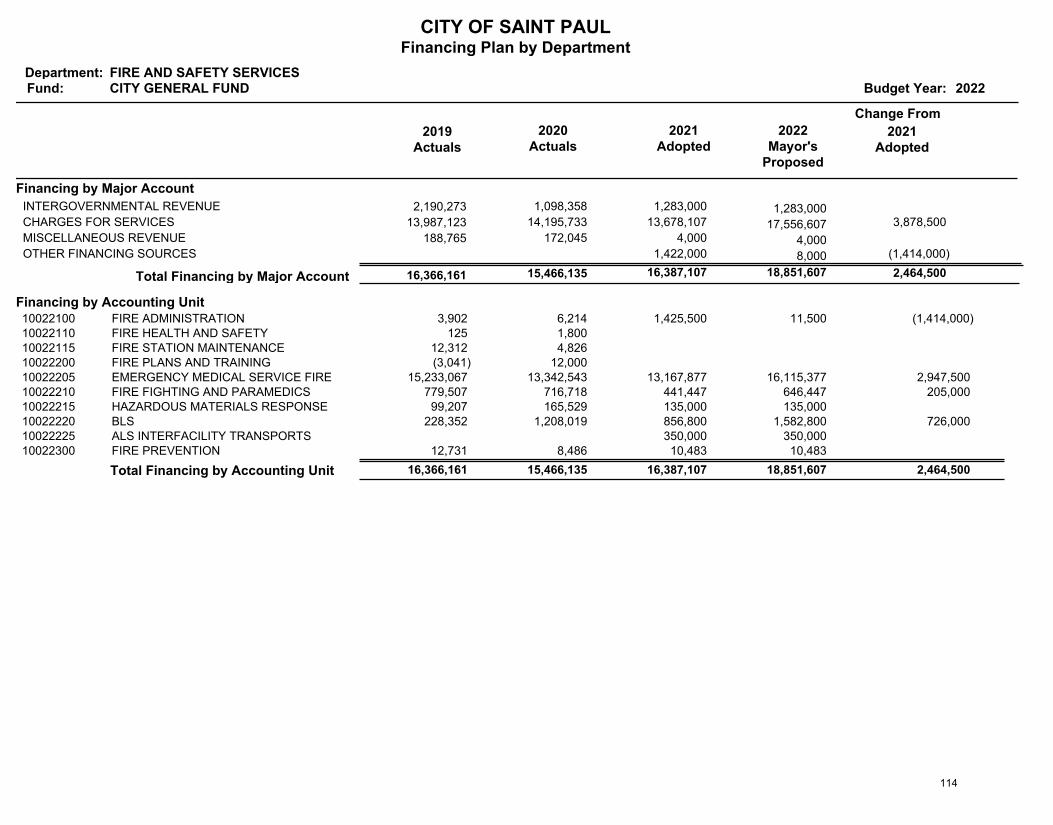
CITY OF SAINT PAULFinancing Plan by Department
Department:Fund: Budget Year: 2022
FIRE AND SAFETY SERVICESCITY GENERAL FUND
2019Actuals
Change From
2020Actuals
2021Adopted
2022Mayor's
Proposed
2021Adopted
Financing by Major Account
2,190,273 1,098,358 1,283,000 1,283,000 INTERGOVERNMENTAL REVENUE
13,987,123 14,195,733 13,678,107 17,556,607 CHARGES FOR SERVICES 3,878,500
188,765 172,045 4,000 4,000 MISCELLANEOUS REVENUE
1,422,000 8,000 OTHER FINANCING SOURCES (1,414,000)
2,464,500 18,851,607 16,387,107 15,466,135 16,366,161 Total Financing by Major Account
Financing by Accounting UnitFIRE ADMINISTRATION 3,902 11,500 1,425,500 6,214 10022100 (1,414,000)FIRE HEALTH AND SAFETY 125 1,800 10022110FIRE STATION MAINTENANCE 12,312 4,826 10022115FIRE PLANS AND TRAINING (3,041) 12,000 10022200EMERGENCY MEDICAL SERVICE FIRE 15,233,067 16,115,377 13,167,877 13,342,543 10022205 2,947,500 FIRE FIGHTING AND PARAMEDICS 779,507 646,447 441,447 716,718 10022210 205,000 HAZARDOUS MATERIALS RESPONSE 99,207 135,000 135,000 165,529 10022215BLS 228,352 1,582,800 856,800 1,208,019 10022220 726,000 ALS INTERFACILITY TRANSPORTS 350,000 350,000 10022225FIRE PREVENTION 12,731 10,483 10,483 8,486 10022300
Total Financing by Accounting Unit 16,366,161 18,851,607 2,464,500 15,466,135 16,387,107
114
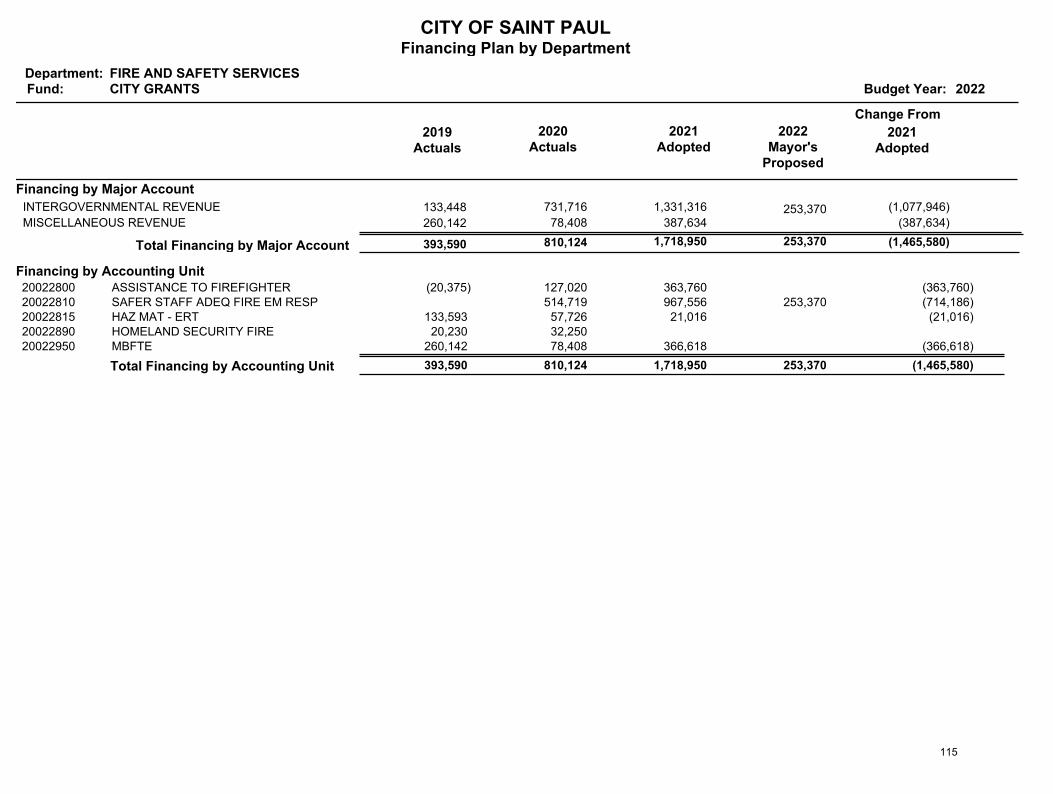
CITY OF SAINT PAULFinancing Plan by Department
Department:Fund: Budget Year: 2022
FIRE AND SAFETY SERVICESCITY GRANTS
2019Actuals
Change From
2020Actuals
2021Adopted
2022Mayor's
Proposed
2021Adopted
Financing by Major Account
133,448 731,716 1,331,316 253,370 INTERGOVERNMENTAL REVENUE (1,077,946)
260,142 78,408 387,634 MISCELLANEOUS REVENUE (387,634)
(1,465,580) 253,370 1,718,950 810,124 393,590 Total Financing by Major Account
Financing by Accounting UnitASSISTANCE TO FIREFIGHTER (20,375) 363,760 127,020 20022800 (363,760)SAFER STAFF ADEQ FIRE EM RESP 253,370 967,556 514,719 20022810 (714,186)HAZ MAT - ERT 133,593 21,016 57,726 20022815 (21,016)HOMELAND SECURITY FIRE 20,230 32,250 20022890MBFTE 260,142 366,618 78,408 20022950 (366,618)
Total Financing by Accounting Unit 393,590 253,370 (1,465,580) 810,124 1,718,950
115
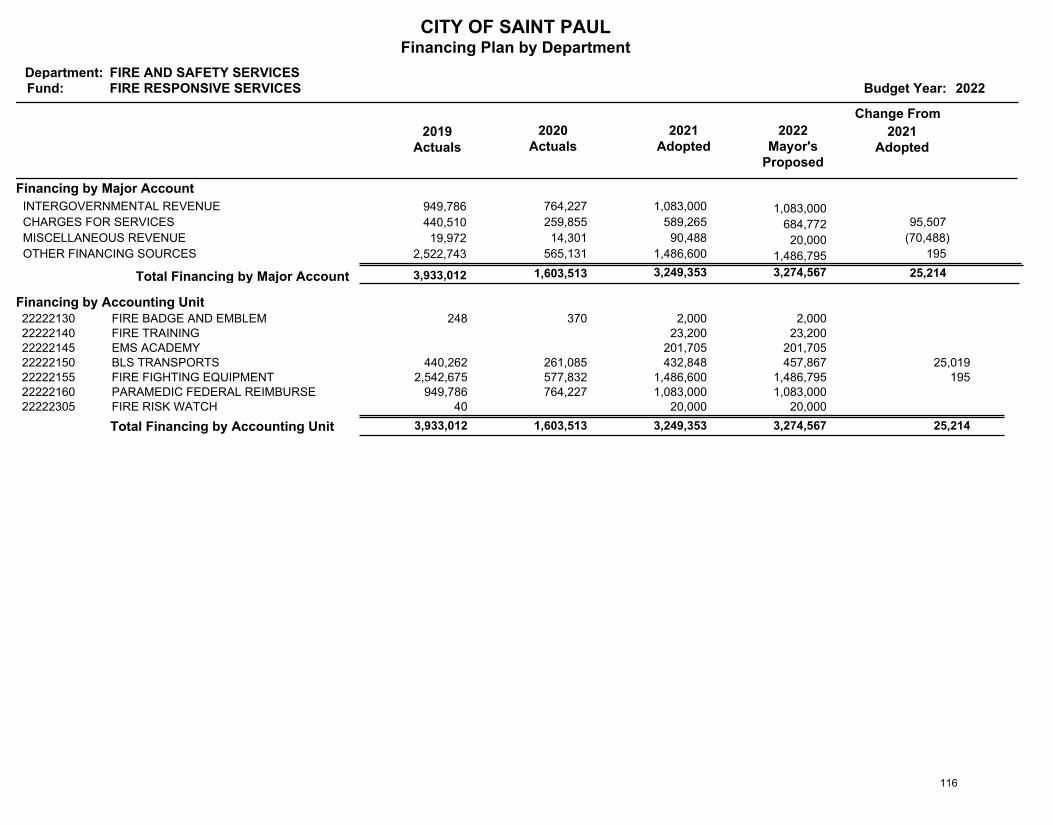
CITY OF SAINT PAULFinancing Plan by Department
Department:Fund: Budget Year: 2022
FIRE AND SAFETY SERVICESFIRE RESPONSIVE SERVICES
2019Actuals
Change From
2020Actuals
2021Adopted
2022Mayor's
Proposed
2021Adopted
Financing by Major Account
949,786 764,227 1,083,000 1,083,000 INTERGOVERNMENTAL REVENUE
440,510 259,855 589,265 684,772 CHARGES FOR SERVICES 95,507
19,972 14,301 90,488 20,000 MISCELLANEOUS REVENUE (70,488)
2,522,743 565,131 1,486,600 1,486,795 OTHER FINANCING SOURCES 195
25,214 3,274,567 3,249,353 1,603,513 3,933,012 Total Financing by Major Account
Financing by Accounting UnitFIRE BADGE AND EMBLEM 248 2,000 2,000 370 22222130FIRE TRAINING 23,200 23,200 22222140EMS ACADEMY 201,705 201,705 22222145BLS TRANSPORTS 440,262 457,867 432,848 261,085 22222150 25,019 FIRE FIGHTING EQUIPMENT 2,542,675 1,486,795 1,486,600 577,832 22222155 195 PARAMEDIC FEDERAL REIMBURSE 949,786 1,083,000 1,083,000 764,227 22222160FIRE RISK WATCH 40 20,000 20,000 22222305
Total Financing by Accounting Unit 3,933,012 3,274,567 25,214 1,603,513 3,249,353
116

CITY OF SAINT PAULFinancing Plan by Department
Department:Fund: Budget Year: 2022
FIRE AND SAFETY SERVICESEQUIPMENT SERVICE FIRE POLICE
2019Actuals
Change From
2020Actuals
2021Adopted
2022Mayor's
Proposed
2021Adopted
Financing by Major Account
4,300 3,000 180,000 180,000 LICENSE AND PERMIT
3,595,612 3,639,665 4,044,588 4,030,365 CHARGES FOR SERVICES (14,223)
1,801 2,028 MISCELLANEOUS REVENUE
(14,223) 4,210,365 4,224,588 3,644,694 3,601,713 Total Financing by Major Account
Financing by Accounting UnitFIRE POLICE VEHICLE MAINT 3,601,713 4,210,365 4,224,588 3,644,694 72222160 (14,223)
Total Financing by Accounting Unit 3,601,713 4,210,365 (14,223) 3,644,694 4,224,588
117
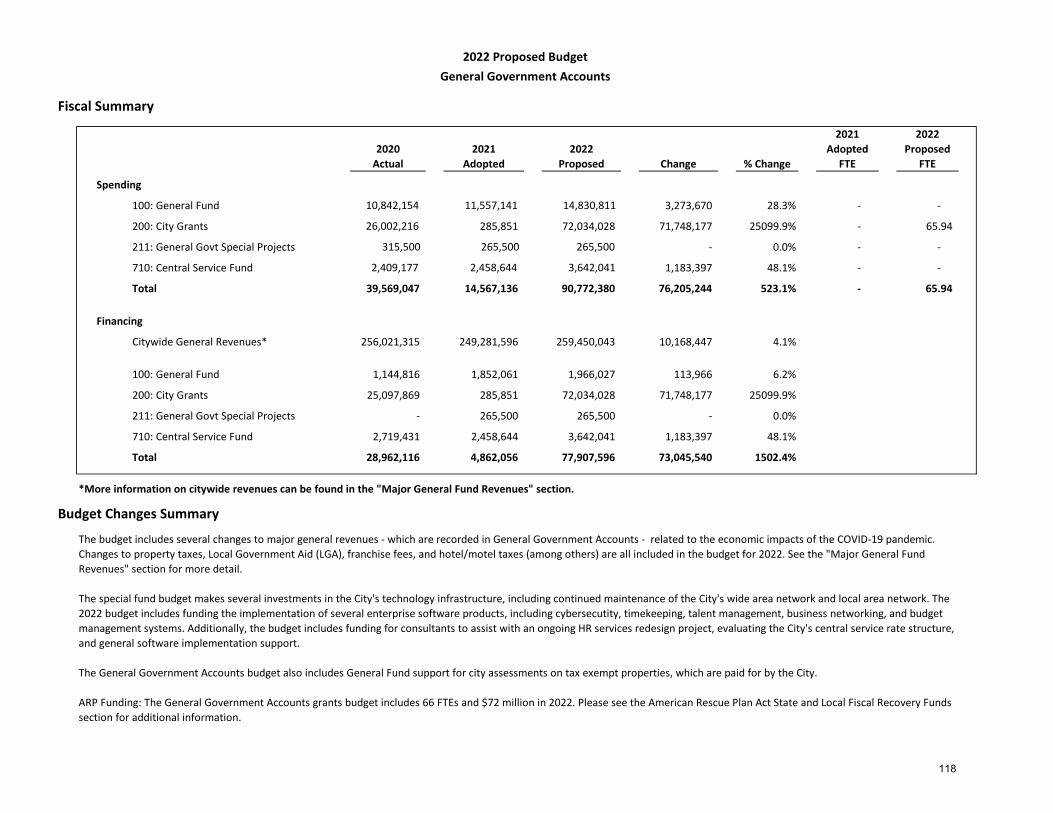
Fiscal Summary
2020Actual
2021Adopted
2022Proposed Change % Change
2021 Adopted
FTE
2022 Proposed
FTE
Spending
10,842,154 11,557,141 14,830,811 3,273,670 28.3% - -
200: City Grants 26,002,216 285,851 72,034,028 71,748,177 25099.9% - 65.94
211: General Govt Special Projects 315,500 265,500 265,500 - 0.0% - -
710: Central Service Fund 2,409,177 2,458,644 3,642,041 1,183,397 48.1% - -
Total 39,569,047 14,567,136 90,772,380 76,205,244 523.1% - 65.94
Financing
Citywide General Revenues* 256,021,315 249,281,596 259,450,043 10,168,447 4.1%
1,144,816 1,852,061 1,966,027 113,966 6.2%
200: City Grants 25,097,869 285,851 72,034,028 71,748,177 25099.9%
211: General Govt Special Projects - 265,500 265,500 - 0.0%
2,719,431 2,458,644 3,642,041 1,183,397 48.1%
28,962,116 4,862,056 77,907,596 73,045,540 1502.4%
Budget Changes Summary
2022 Proposed BudgetGeneral Government Accounts
The budget includes several changes to major general revenues - which are recorded in General Government Accounts - related to the economic impacts of the COVID-19 pandemic. Changes to property taxes, Local Government Aid (LGA), franchise fees, and hotel/motel taxes (among others) are all included in the budget for 2022. See the "Major General Fund Revenues" section for more detail.
The special fund budget makes several investments in the City's technology infrastructure, including continued maintenance of the City's wide area network and local area network. The 2022 budget includes funding the implementation of several enterprise software products, including cybersecutity, timekeeping, talent management, business networking, and budget management systems. Additionally, the budget includes funding for consultants to assist with an ongoing HR services redesign project, evaluating the City's central service rate structure, and general software implementation support.
The General Government Accounts budget also includes General Fund support for city assessments on tax exempt properties, which are paid for by the City.
ARP Funding: The General Government Accounts grants budget includes 66 FTEs and $72 million in 2022. Please see the American Rescue Plan Act State and Local Fiscal Recovery Funds section for additional information.
100: General Fund
100: General Fund
710: Central Service Fund
Total
*More information on citywide revenues can be found in the "Major General Fund Revenues" section.
118

Spending Reports 119
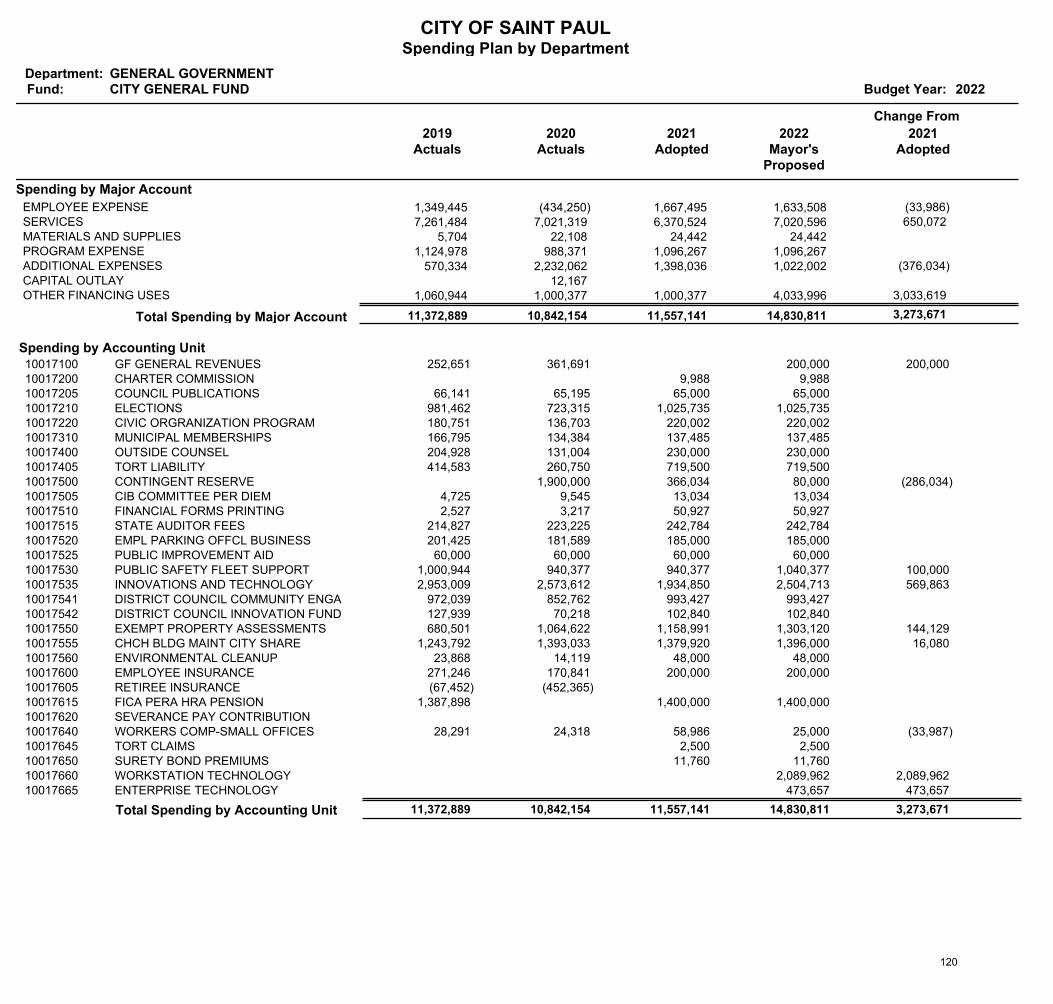
CITY OF SAINT PAULSpending Plan by Department
Department:Fund: Budget Year: 2022
GENERAL GOVERNMENTCITY GENERAL FUND
2019Actuals
Change From
2020Actuals
2021Adopted
2022Mayor's
Proposed
2021Adopted
Spending by Major Account
1,349,445 (434,250) 1,667,495 1,633,508 EMPLOYEE EXPENSE (33,986) 7,261,484 7,021,319 6,370,524 7,020,596 SERVICES 650,072
5,704 22,108 24,442 24,442 MATERIALS AND SUPPLIES 1,124,978 988,371 1,096,267 1,096,267 PROGRAM EXPENSE
570,334 2,232,062 1,398,036 1,022,002 ADDITIONAL EXPENSES (376,034) 12,167 CAPITAL OUTLAY
1,060,944 1,000,377 1,000,377 4,033,996 OTHER FINANCING USES 3,033,619
3,273,671 14,830,811 11,557,141 10,842,154 11,372,889 Total Spending by Major Account
Spending by Accounting UnitGF GENERAL REVENUES 252,651 200,000 361,691 10017100 200,000 CHARTER COMMISSION 9,988 9,988 10017200COUNCIL PUBLICATIONS 66,141 65,000 65,000 65,195 10017205ELECTIONS 981,462 1,025,735 1,025,735 723,315 10017210CIVIC ORGRANIZATION PROGRAM 180,751 220,002 220,002 136,703 10017220MUNICIPAL MEMBERSHIPS 166,795 137,485 137,485 134,384 10017310OUTSIDE COUNSEL 204,928 230,000 230,000 131,004 10017400TORT LIABILITY 414,583 719,500 719,500 260,750 10017405CONTINGENT RESERVE 80,000 366,034 1,900,000 10017500 (286,034)CIB COMMITTEE PER DIEM 4,725 13,034 13,034 9,545 10017505FINANCIAL FORMS PRINTING 2,527 50,927 50,927 3,217 10017510STATE AUDITOR FEES 214,827 242,784 242,784 223,225 10017515EMPL PARKING OFFCL BUSINESS 201,425 185,000 185,000 181,589 10017520PUBLIC IMPROVEMENT AID 60,000 60,000 60,000 60,000 10017525PUBLIC SAFETY FLEET SUPPORT 1,000,944 1,040,377 940,377 940,377 10017530 100,000 INNOVATIONS AND TECHNOLOGY 2,953,009 2,504,713 1,934,850 2,573,612 10017535 569,863 DISTRICT COUNCIL COMMUNITY ENGAGEMENT 972,039 993,427 993,427 852,762 10017541DISTRICT COUNCIL INNOVATION FUND 127,939 102,840 102,840 70,218 10017542EXEMPT PROPERTY ASSESSMENTS 680,501 1,303,120 1,158,991 1,064,622 10017550 144,129 CHCH BLDG MAINT CITY SHARE 1,243,792 1,396,000 1,379,920 1,393,033 10017555 16,080 ENVIRONMENTAL CLEANUP 23,868 48,000 48,000 14,119 10017560EMPLOYEE INSURANCE 271,246 200,000 200,000 170,841 10017600RETIREE INSURANCE (67,452) (452,365)10017605FICA PERA HRA PENSION 1,387,898 1,400,000 1,400,000 10017615SEVERANCE PAY CONTRIBUTION10017620WORKERS COMP-SMALL OFFICES 28,291 25,000 58,986 24,318 10017640 (33,987)TORT CLAIMS 2,500 2,500 10017645SURETY BOND PREMIUMS 11,760 11,760 10017650WORKSTATION TECHNOLOGY 2,089,962 10017660 2,089,962 ENTERPRISE TECHNOLOGY 473,657 10017665 473,657
Total Spending by Accounting Unit 11,372,889 14,830,811 3,273,671 10,842,154 11,557,141
120
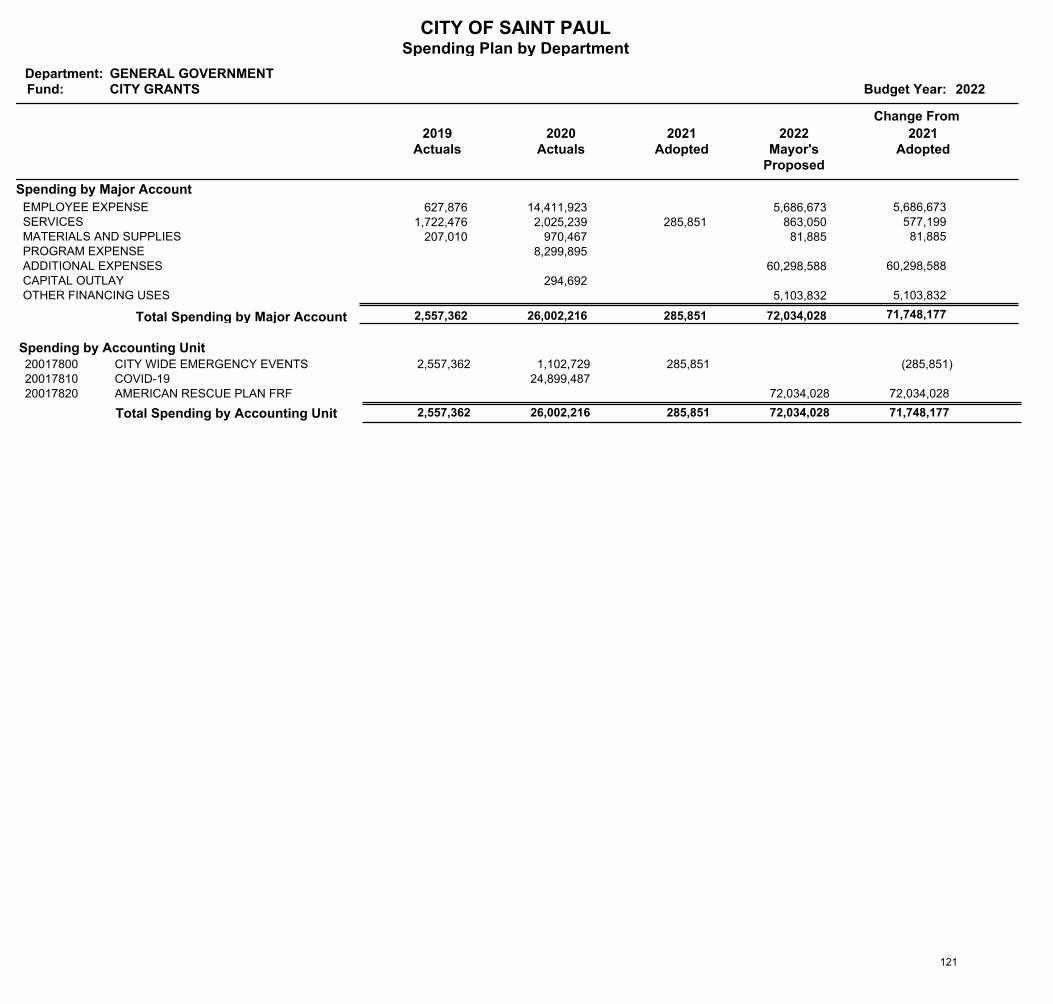
CITY OF SAINT PAULSpending Plan by Department
Department:Fund: Budget Year: 2022
GENERAL GOVERNMENTCITY GRANTS
2019Actuals
Change From
2020Actuals
2021Adopted
2022Mayor's
Proposed
2021Adopted
Spending by Major Account
627,876 14,411,923 5,686,673 EMPLOYEE EXPENSE 5,686,673 1,722,476 2,025,239 285,851 863,050 SERVICES 577,199
207,010 970,467 81,885 MATERIALS AND SUPPLIES 81,885 8,299,895 PROGRAM EXPENSE
60,298,588 ADDITIONAL EXPENSES 60,298,588 294,692 CAPITAL OUTLAY
5,103,832 OTHER FINANCING USES 5,103,832
71,748,177 72,034,028 285,851 26,002,216 2,557,362 Total Spending by Major Account
Spending by Accounting UnitCITY WIDE EMERGENCY EVENTS 2,557,362 285,851 1,102,729 20017800 (285,851)COVID-19 24,899,487 20017810AMERICAN RESCUE PLAN FRF 72,034,028 20017820 72,034,028
Total Spending by Accounting Unit 2,557,362 72,034,028 71,748,177 26,002,216 285,851
121
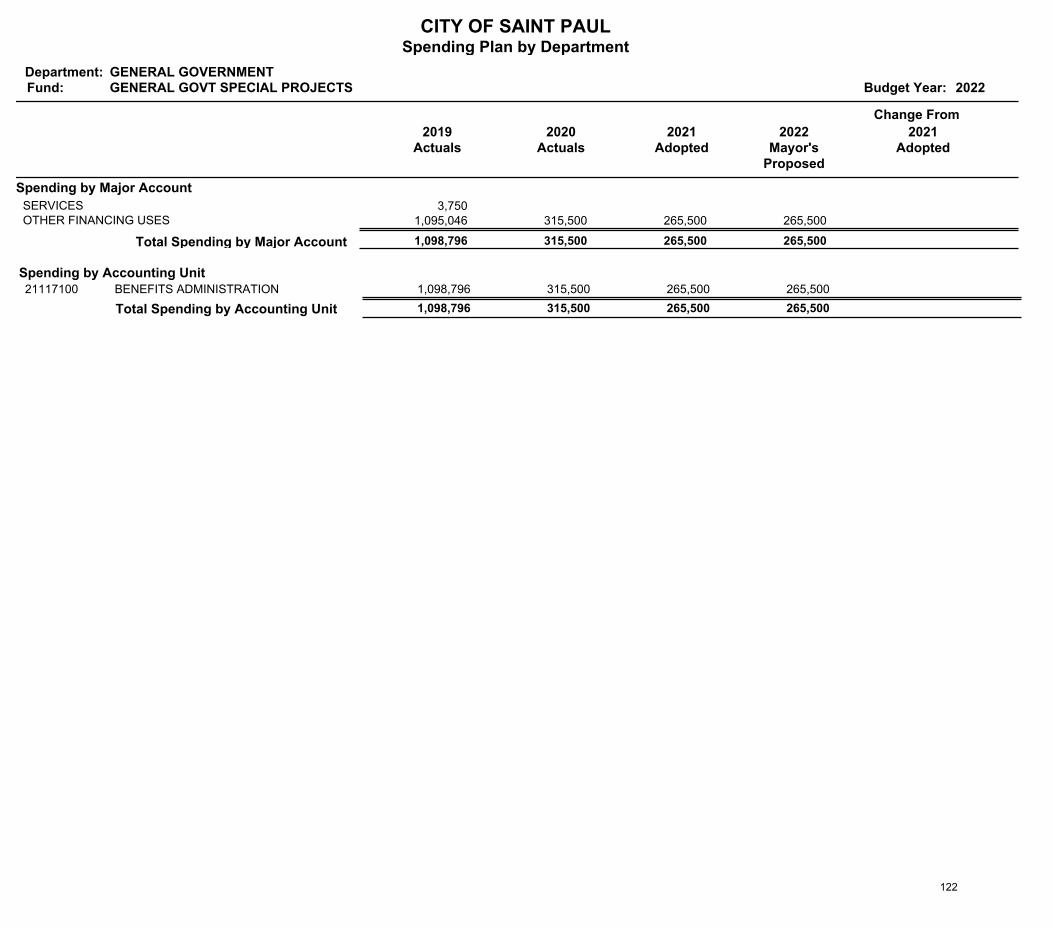
CITY OF SAINT PAULSpending Plan by Department
Department:Fund: Budget Year: 2022
GENERAL GOVERNMENTGENERAL GOVT SPECIAL PROJECTS
2019Actuals
Change From
2020Actuals
2021Adopted
2022Mayor's
Proposed
2021Adopted
Spending by Major Account
3,750 SERVICES 1,095,046 315,500 265,500 265,500 OTHER FINANCING USES
265,500 265,500 315,500 1,098,796 Total Spending by Major Account
Spending by Accounting UnitBENEFITS ADMINISTRATION 1,098,796 265,500 265,500 315,500 21117100
Total Spending by Accounting Unit 1,098,796 265,500 315,500 265,500
122
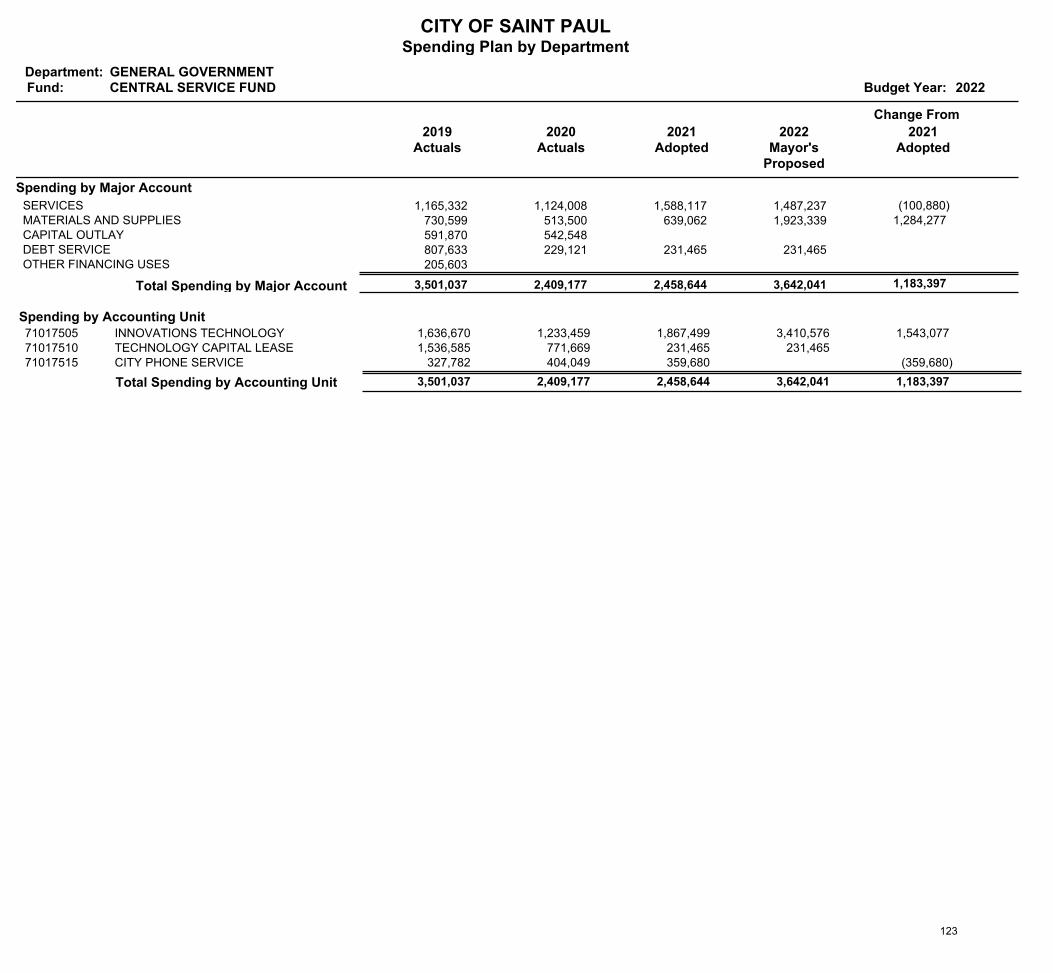
CITY OF SAINT PAULSpending Plan by Department
Department:Fund: Budget Year: 2022
GENERAL GOVERNMENTCENTRAL SERVICE FUND
2019Actuals
Change From
2020Actuals
2021Adopted
2022Mayor's
Proposed
2021Adopted
Spending by Major Account
1,165,332 1,124,008 1,588,117 1,487,237 SERVICES (100,880) 730,599 513,500 639,062 1,923,339 MATERIALS AND SUPPLIES 1,284,277 591,870 542,548 CAPITAL OUTLAY 807,633 229,121 231,465 231,465 DEBT SERVICE 205,603 OTHER FINANCING USES
1,183,397 3,642,041 2,458,644 2,409,177 3,501,037 Total Spending by Major Account
Spending by Accounting UnitINNOVATIONS TECHNOLOGY 1,636,670 3,410,576 1,867,499 1,233,459 71017505 1,543,077 TECHNOLOGY CAPITAL LEASE 1,536,585 231,465 231,465 771,669 71017510CITY PHONE SERVICE 327,782 359,680 404,049 71017515 (359,680)
Total Spending by Accounting Unit 3,501,037 3,642,041 1,183,397 2,409,177 2,458,644
123

Financing Reports 124
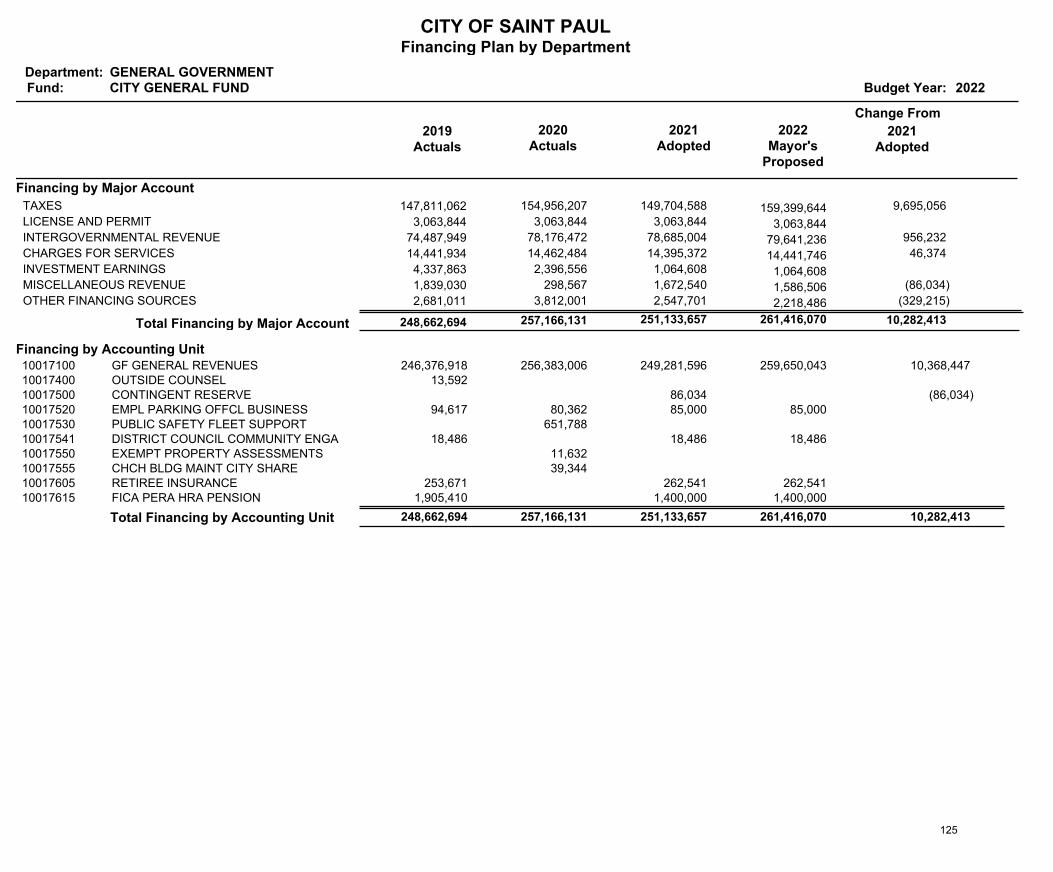
CITY OF SAINT PAULFinancing Plan by Department
Department:Fund: Budget Year: 2022
GENERAL GOVERNMENTCITY GENERAL FUND
2019Actuals
Change From
2020Actuals
2021Adopted
2022Mayor's
Proposed
2021Adopted
Financing by Major Account
147,811,062 154,956,207 149,704,588 159,399,644 TAXES 9,695,056
3,063,844 3,063,844 3,063,844 3,063,844 LICENSE AND PERMIT
74,487,949 78,176,472 78,685,004 79,641,236 INTERGOVERNMENTAL REVENUE 956,232
14,441,934 14,462,484 14,395,372 14,441,746 CHARGES FOR SERVICES 46,374
4,337,863 2,396,556 1,064,608 1,064,608 INVESTMENT EARNINGS
1,839,030 298,567 1,672,540 1,586,506 MISCELLANEOUS REVENUE (86,034)
2,681,011 3,812,001 2,547,701 2,218,486 OTHER FINANCING SOURCES (329,215)
10,282,413 261,416,070 251,133,657 257,166,131 248,662,694 Total Financing by Major Account
Financing by Accounting UnitGF GENERAL REVENUES 246,376,918 259,650,043 249,281,596 256,383,006 10017100 10,368,447 OUTSIDE COUNSEL 13,592 10017400CONTINGENT RESERVE 86,034 10017500 (86,034)EMPL PARKING OFFCL BUSINESS 94,617 85,000 85,000 80,362 10017520PUBLIC SAFETY FLEET SUPPORT 651,788 10017530DISTRICT COUNCIL COMMUNITY ENGAGEMENT 18,486 18,486 18,486 10017541EXEMPT PROPERTY ASSESSMENTS 11,632 10017550CHCH BLDG MAINT CITY SHARE 39,344 10017555RETIREE INSURANCE 253,671 262,541 262,541 10017605FICA PERA HRA PENSION 1,905,410 1,400,000 1,400,000 10017615
Total Financing by Accounting Unit 248,662,694 261,416,070 10,282,413 257,166,131 251,133,657
125
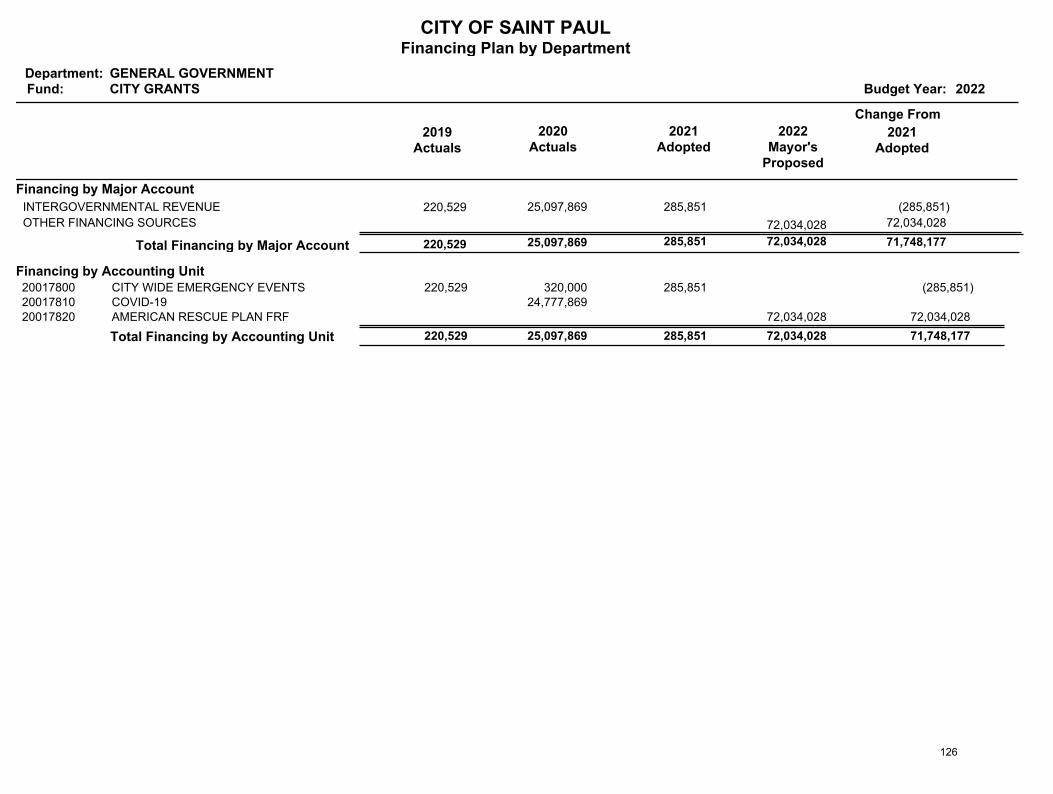
CITY OF SAINT PAULFinancing Plan by Department
Department:Fund: Budget Year: 2022
GENERAL GOVERNMENTCITY GRANTS
2019Actuals
Change From
2020Actuals
2021Adopted
2022Mayor's
Proposed
2021Adopted
Financing by Major Account
220,529 25,097,869 285,851 INTERGOVERNMENTAL REVENUE (285,851)
72,034,028 OTHER FINANCING SOURCES 72,034,028
71,748,177 72,034,028 285,851 25,097,869 220,529 Total Financing by Major Account
Financing by Accounting UnitCITY WIDE EMERGENCY EVENTS 220,529 285,851 320,000 20017800 (285,851)COVID-19 24,777,869 20017810AMERICAN RESCUE PLAN FRF 72,034,028 20017820 72,034,028
Total Financing by Accounting Unit 220,529 72,034,028 71,748,177 25,097,869 285,851
126
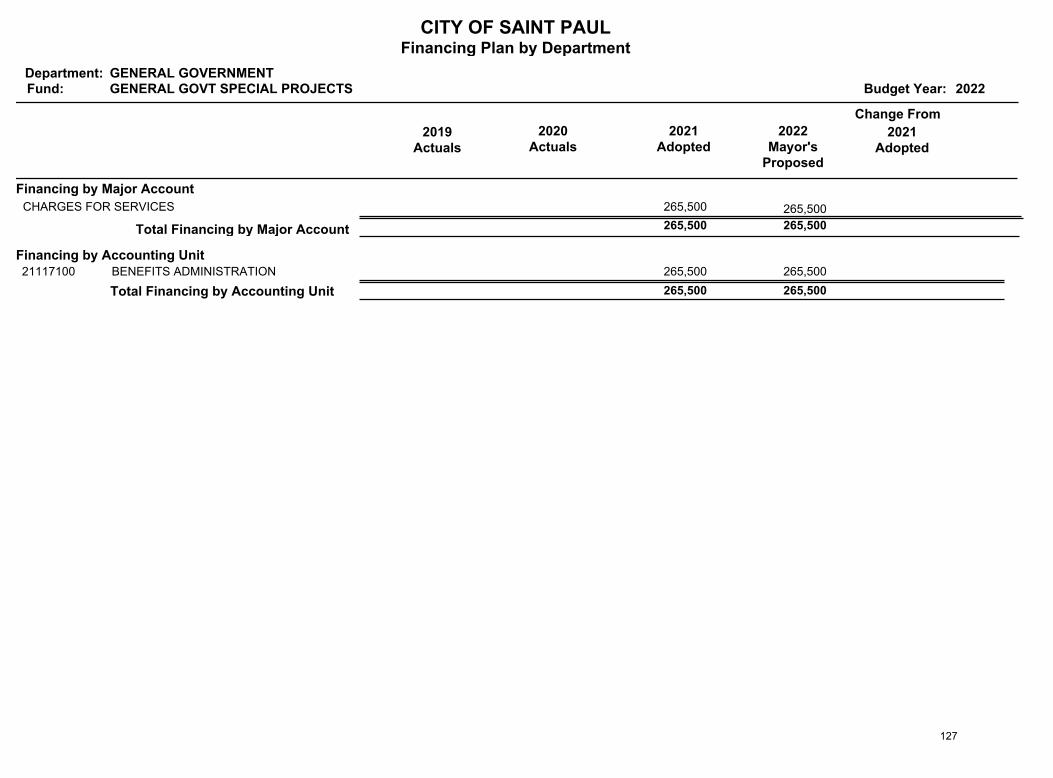
CITY OF SAINT PAULFinancing Plan by Department
Department:Fund: Budget Year: 2022
GENERAL GOVERNMENTGENERAL GOVT SPECIAL PROJECTS
2019Actuals
Change From
2020Actuals
2021Adopted
2022Mayor's
Proposed
2021Adopted
Financing by Major Account
265,500 265,500 CHARGES FOR SERVICES
265,500 265,500 Total Financing by Major Account
Financing by Accounting UnitBENEFITS ADMINISTRATION 265,500 265,500 21117100
Total Financing by Accounting Unit 265,500 265,500
127

CITY OF SAINT PAULFinancing Plan by Department
Department:Fund: Budget Year: 2022
GENERAL GOVERNMENTCENTRAL SERVICE FUND
2019Actuals
Change From
2020Actuals
2021Adopted
2022Mayor's
Proposed
2021Adopted
Financing by Major Account
2,702,894 2,713,514 1,842,940 2,571,963 CHARGES FOR SERVICES 729,023
311,650 5,917 615,705 1,070,079 OTHER FINANCING SOURCES 454,374
1,183,397 3,642,042 2,458,645 2,719,431 3,014,544 Total Financing by Major Account
Financing by Accounting UnitINNOVATIONS TECHNOLOGY 1,784,919 3,410,576 1,867,499 2,038,666 71017505 1,543,077 TECHNOLOGY CAPITAL LEASE 865,593 231,466 231,466 301,839 71017510CITY PHONE SERVICE 364,032 359,680 378,926 71017515 (359,680)
Total Financing by Accounting Unit 3,014,544 3,642,042 1,183,397 2,719,431 2,458,645
128
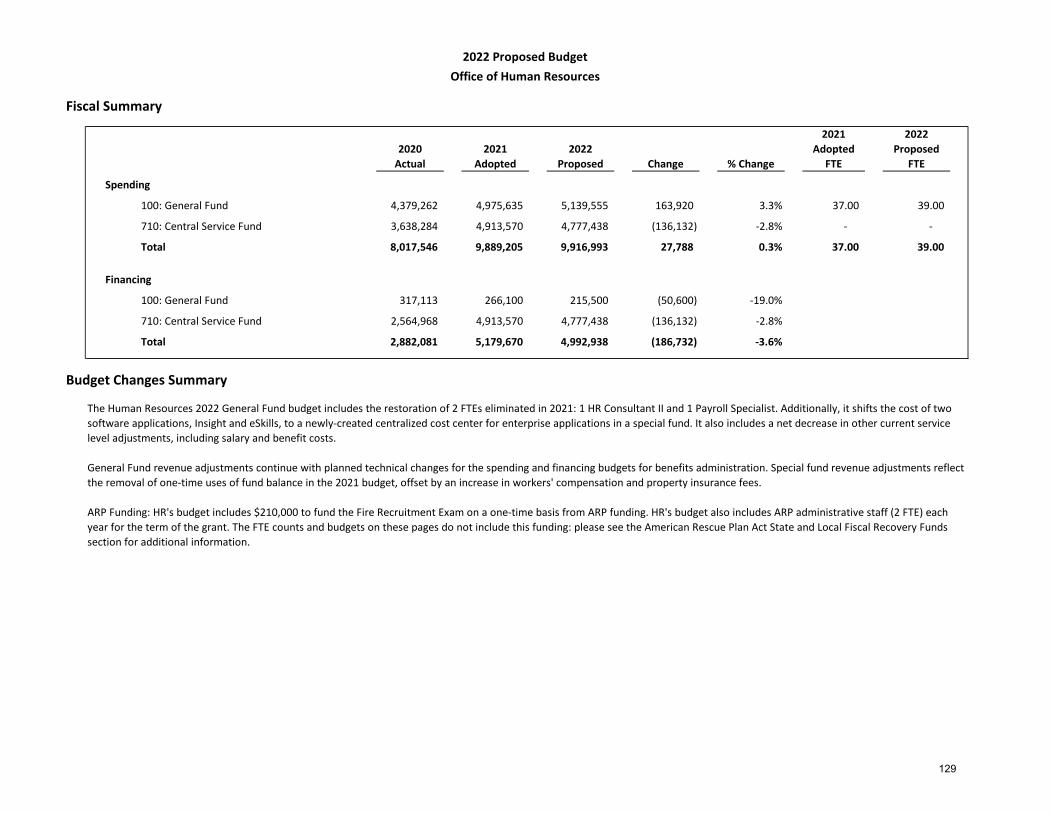
Fiscal Summary
2020Actual
2021Adopted
2022Proposed Change % Change
2021Adopted
FTE
2022 Proposed
FTE
Spending
4,379,262 4,975,635 5,139,555 163,920 3.3% 37.00 39.00
3,638,284 4,913,570 4,777,438 (136,132) -2.8% - -
8,017,546 9,889,205 9,916,993 27,788 0.3% 37.00 39.00
Financing
317,113 266,100 215,500 (50,600) -19.0%
2,564,968 4,913,570 4,777,438 (136,132) -2.8%
2,882,081 5,179,670 4,992,938 (186,732) -3.6%
Budget Changes Summary
2022 Proposed BudgetOffice of Human Resources
The Human Resources 2022 General Fund budget includes the restoration of 2 FTEs eliminated in 2021: 1 HR Consultant II and 1 Payroll Specialist. Additionally, it shifts the cost of two software applications, Insight and eSkills, to a newly-created centralized cost center for enterprise applications in a special fund. It also includes a net decrease in other current service level adjustments, including salary and benefit costs.
General Fund revenue adjustments continue with planned technical changes for the spending and financing budgets for benefits administration. Special fund revenue adjustments reflect the removal of one-time uses of fund balance in the 2021 budget, offset by an increase in workers' compensation and property insurance fees.
ARP Funding: HR's budget includes $210,000 to fund the Fire Recruitment Exam on a one-time basis from ARP funding. HR's budget also includes ARP administrative staff (2 FTE) each year for the term of the grant. The FTE counts and budgets on these pages do not include this funding: please see the American Rescue Plan Act State and Local Fiscal Recovery Funds section for additional information.
100: General Fund
710: Central Service Fund
Total
710: Central Service Fund
100: General Fund
Total
129

Spending Reports 130
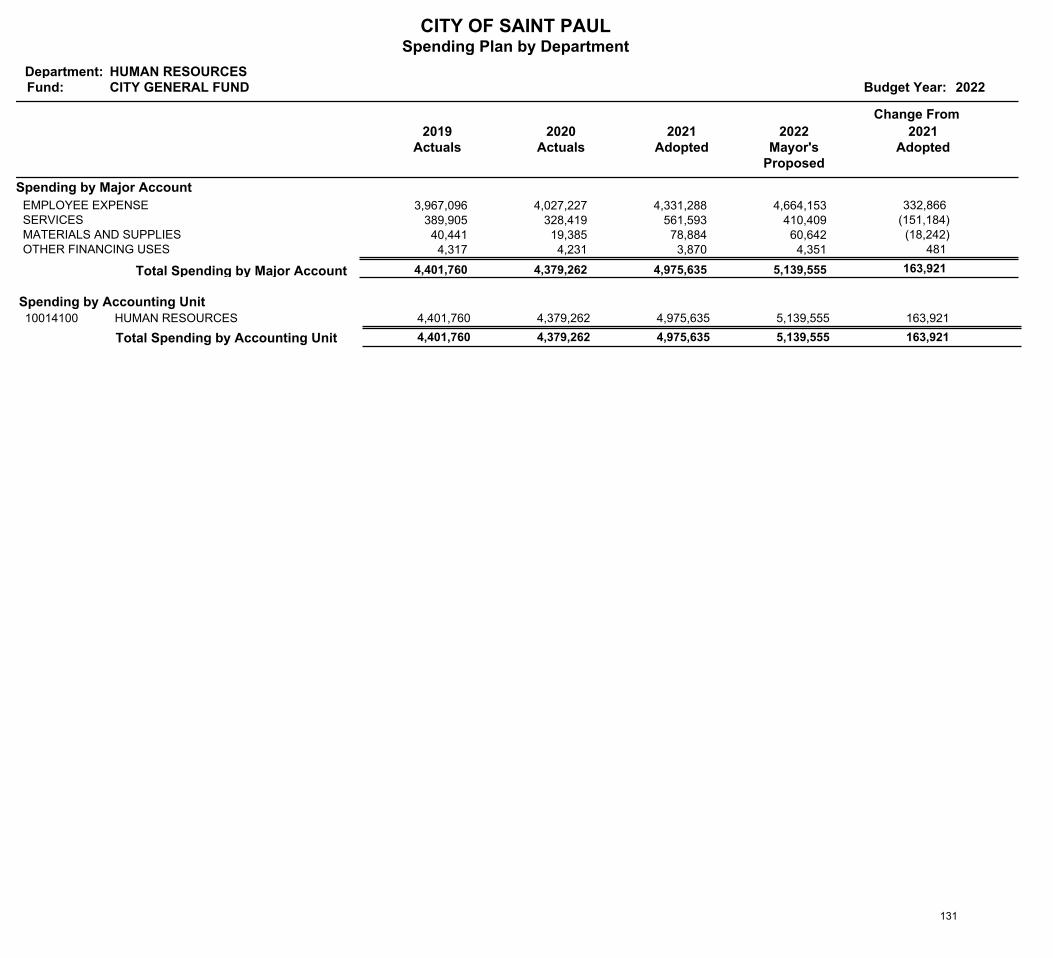
CITY OF SAINT PAULSpending Plan by Department
Department:Fund: Budget Year: 2022
HUMAN RESOURCESCITY GENERAL FUND
2019Actuals
Change From
2020Actuals
2021Adopted
2022Mayor's
Proposed
2021Adopted
Spending by Major Account
3,967,096 4,027,227 4,331,288 4,664,153 EMPLOYEE EXPENSE 332,866 389,905 328,419 561,593 410,409 SERVICES (151,184) 40,441 19,385 78,884 60,642 MATERIALS AND SUPPLIES (18,242) 4,317 4,231 3,870 4,351 OTHER FINANCING USES 481
163,921 5,139,555 4,975,635 4,379,262 4,401,760 Total Spending by Major Account
Spending by Accounting UnitHUMAN RESOURCES 4,401,760 5,139,555 4,975,635 4,379,262 10014100 163,921
Total Spending by Accounting Unit 4,401,760 5,139,555 163,921 4,379,262 4,975,635
131
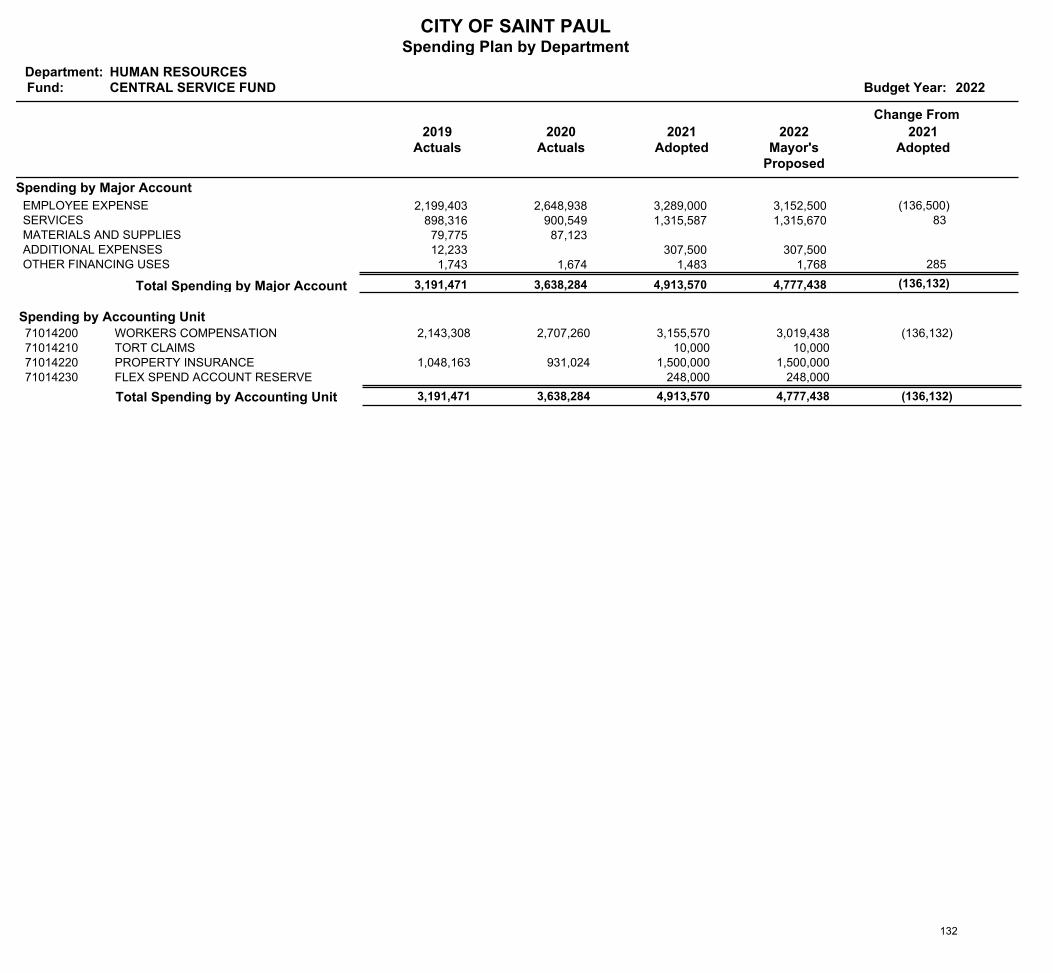
CITY OF SAINT PAULSpending Plan by Department
Department:Fund: Budget Year: 2022
HUMAN RESOURCESCENTRAL SERVICE FUND
2019Actuals
Change From
2020Actuals
2021Adopted
2022Mayor's
Proposed
2021Adopted
Spending by Major Account
2,199,403 2,648,938 3,289,000 3,152,500 EMPLOYEE EXPENSE (136,500) 898,316 900,549 1,315,587 1,315,670 SERVICES 83 79,775 87,123 MATERIALS AND SUPPLIES 12,233 307,500 307,500 ADDITIONAL EXPENSES 1,743 1,674 1,483 1,768 OTHER FINANCING USES 285
(136,132) 4,777,438 4,913,570 3,638,284 3,191,471 Total Spending by Major Account
Spending by Accounting UnitWORKERS COMPENSATION 2,143,308 3,019,438 3,155,570 2,707,260 71014200 (136,132)TORT CLAIMS 10,000 10,000 71014210PROPERTY INSURANCE 1,048,163 1,500,000 1,500,000 931,024 71014220FLEX SPEND ACCOUNT RESERVE 248,000 248,000 71014230
Total Spending by Accounting Unit 3,191,471 4,777,438 (136,132) 3,638,284 4,913,570
132

Financing Reports 133
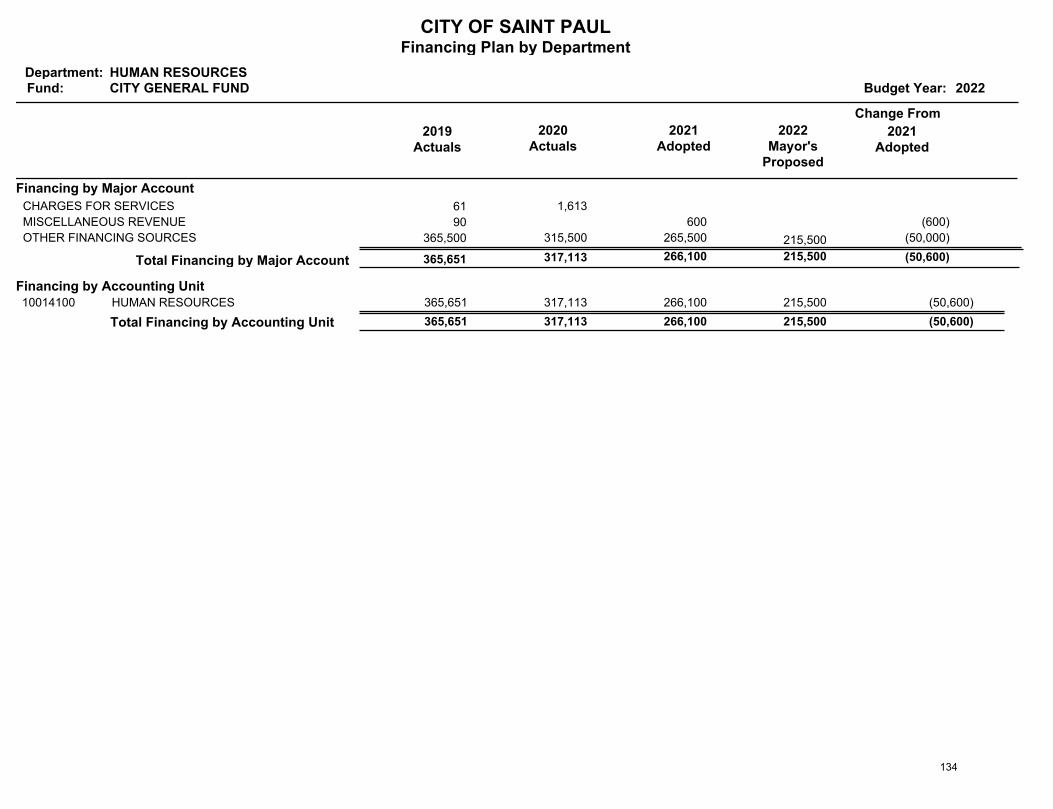
CITY OF SAINT PAULFinancing Plan by Department
Department:Fund: Budget Year: 2022
HUMAN RESOURCESCITY GENERAL FUND
2019Actuals
Change From
2020Actuals
2021Adopted
2022Mayor's
Proposed
2021Adopted
Financing by Major Account
61 1,613 CHARGES FOR SERVICES
90 600 MISCELLANEOUS REVENUE (600)
365,500 315,500 265,500 215,500 OTHER FINANCING SOURCES (50,000)
(50,600) 215,500 266,100 317,113 365,651 Total Financing by Major Account
Financing by Accounting UnitHUMAN RESOURCES 365,651 215,500 266,100 317,113 10014100 (50,600)
Total Financing by Accounting Unit 365,651 215,500 (50,600) 317,113 266,100
134

CITY OF SAINT PAULFinancing Plan by Department
Department:Fund: Budget Year: 2022
HUMAN RESOURCESCENTRAL SERVICE FUND
2019Actuals
Change From
2020Actuals
2021Adopted
2022Mayor's
Proposed
2021Adopted
Financing by Major Account
2,121,559 2,374,801 3,554,720 3,918,588 CHARGES FOR SERVICES 363,868
1,011,093 190,166 848,850 848,850 MISCELLANEOUS REVENUE
510,000 10,000 OTHER FINANCING SOURCES (500,000)
(136,132) 4,777,438 4,913,570 2,564,968 3,132,652 Total Financing by Major Account
Financing by Accounting UnitWORKERS COMPENSATION 2,456,064 3,019,438 3,155,570 1,766,280 71014200 (136,132)TORT CLAIMS 10,000 10,000 71014210PROPERTY INSURANCE 676,588 1,500,000 1,500,000 798,688 71014220FLEX SPEND ACCOUNT RESERVE 248,000 248,000 71014230
Total Financing by Accounting Unit 3,132,652 4,777,438 (136,132) 2,564,968 4,913,570
135
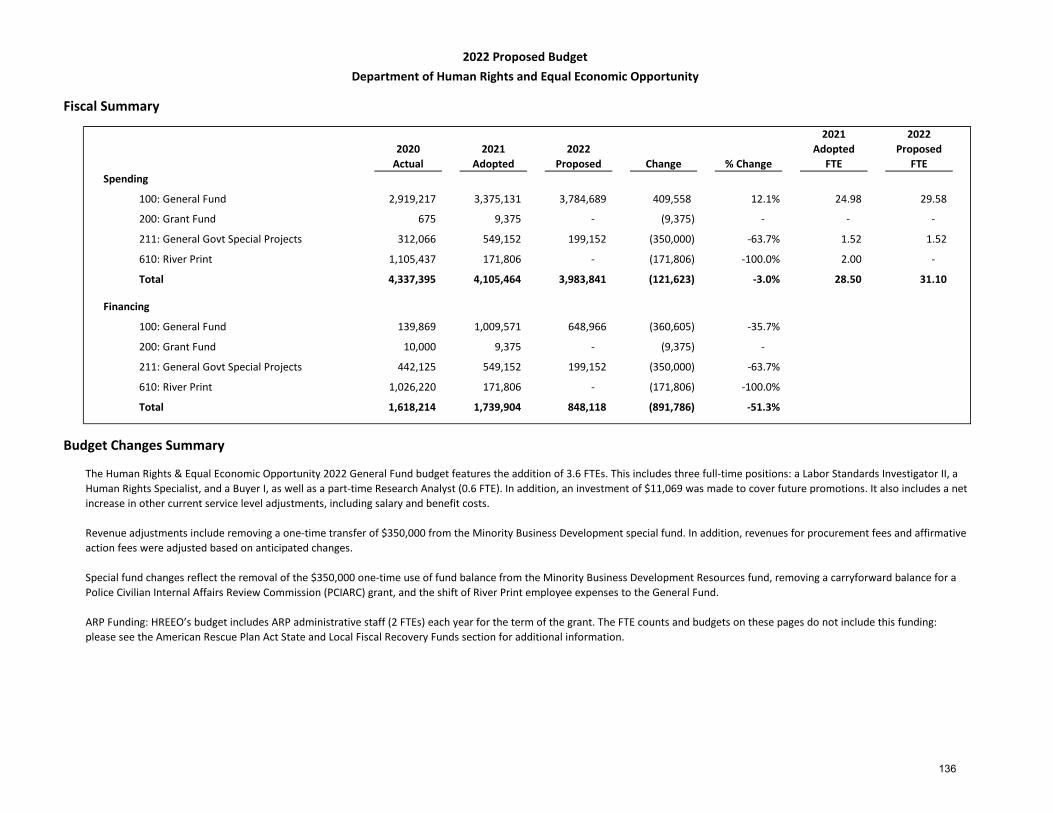
Fiscal Summary
2020Actual
2021Adopted
2022Proposed Change % Change
2021Adopted
FTE
2022 Proposed
FTESpending
2,919,217 3,375,131 3,784,689 409,558 12.1% 24.98 29.58
200: Grant Fund 675 9,375 - (9,375) - - -
312,066 549,152 199,152 (350,000) -63.7% 1.52 1.52
1,105,437 171,806 - (171,806) -100.0% 2.00 -
4,337,395 4,105,464 3,983,841 (121,623) -3.0% 28.50 31.10
Financing
139,869 1,009,571 648,966 (360,605) -35.7%
200: Grant Fund 10,000 9,375 - (9,375) -
442,125 549,152 199,152 (350,000) -63.7%
1,026,220 171,806 - (171,806) -100.0%
1,618,214 1,739,904 848,118 (891,786) -51.3%
Budget Changes Summary
610: River Print
Total
Total
2022 Proposed BudgetDepartment of Human Rights and Equal Economic Opportunity
211: General Govt Special Projects
100: General Fund
211: General Govt Special Projects
100: General Fund
610: River Print
The Human Rights & Equal Economic Opportunity 2022 General Fund budget features the addition of 3.6 FTEs. This includes three full-time positions: a Labor Standards Investigator II, a Human Rights Specialist, and a Buyer I, as well as a part-time Research Analyst (0.6 FTE). In addition, an investment of $11,069 was made to cover future promotions. It also includes a net increase in other current service level adjustments, including salary and benefit costs.
Revenue adjustments include removing a one-time transfer of $350,000 from the Minority Business Development special fund. In addition, revenues for procurement fees and affirmative action fees were adjusted based on anticipated changes.
Special fund changes reflect the removal of the $350,000 one-time use of fund balance from the Minority Business Development Resources fund, removing a carryforward balance for a Police Civilian Internal Affairs Review Commission (PCIARC) grant, and the shift of River Print employee expenses to the General Fund.
ARP Funding: HREEO’s budget includes ARP administrative staff (2 FTEs) each year for the term of the grant. The FTE counts and budgets on these pages do not include this funding: please see the American Rescue Plan Act State and Local Fiscal Recovery Funds section for additional information.
136

Spending Reports 137
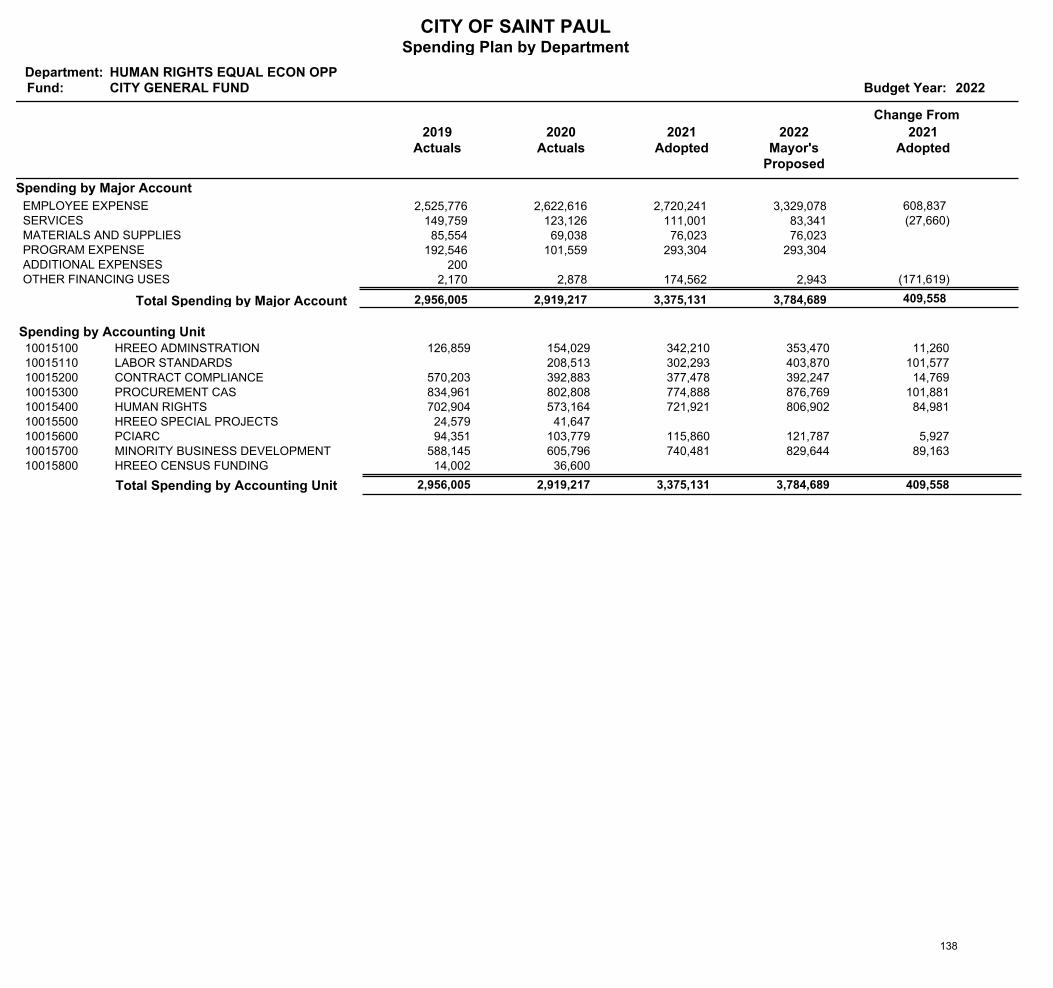
CITY OF SAINT PAULSpending Plan by Department
Department:Fund: Budget Year: 2022
HUMAN RIGHTS EQUAL ECON OPPCITY GENERAL FUND
2019Actuals
Change From
2020Actuals
2021Adopted
2022Mayor's
Proposed
2021Adopted
Spending by Major Account
2,525,776 2,622,616 2,720,241 3,329,078 EMPLOYEE EXPENSE 608,837 149,759 123,126 111,001 83,341 SERVICES (27,660) 85,554 69,038 76,023 76,023 MATERIALS AND SUPPLIES
192,546 101,559 293,304 293,304 PROGRAM EXPENSE 200 ADDITIONAL EXPENSES
2,170 2,878 174,562 2,943 OTHER FINANCING USES (171,619)
409,558 3,784,689 3,375,131 2,919,217 2,956,005 Total Spending by Major Account
Spending by Accounting UnitHREEO ADMINSTRATION 126,859 353,470 342,210 154,029 10015100 11,260 LABOR STANDARDS 403,870 302,293 208,513 10015110 101,577 CONTRACT COMPLIANCE 570,203 392,247 377,478 392,883 10015200 14,769 PROCUREMENT CAS 834,961 876,769 774,888 802,808 10015300 101,881 HUMAN RIGHTS 702,904 806,902 721,921 573,164 10015400 84,981 HREEO SPECIAL PROJECTS 24,579 41,647 10015500PCIARC 94,351 121,787 115,860 103,779 10015600 5,927 MINORITY BUSINESS DEVELOPMENT 588,145 829,644 740,481 605,796 10015700 89,163 HREEO CENSUS FUNDING 14,002 36,600 10015800
Total Spending by Accounting Unit 2,956,005 3,784,689 409,558 2,919,217 3,375,131
138
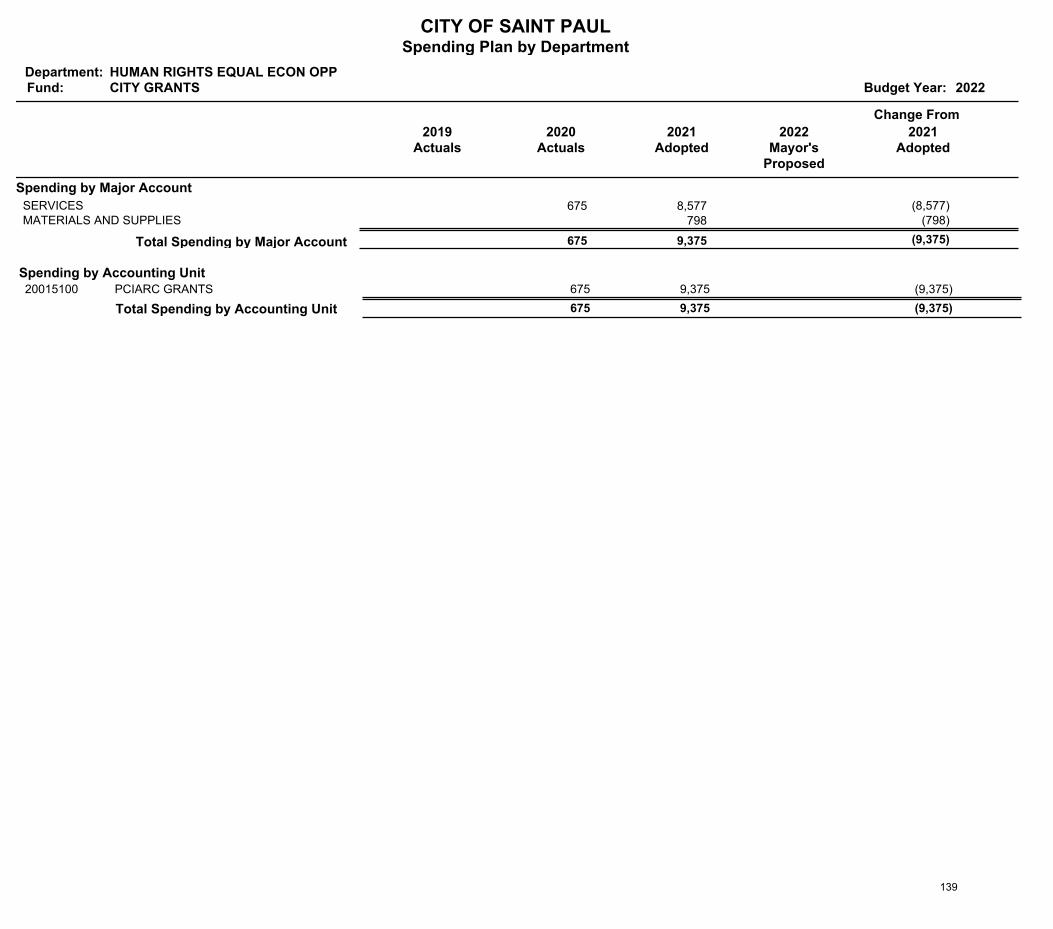
CITY OF SAINT PAULSpending Plan by Department
Department:Fund: Budget Year: 2022
HUMAN RIGHTS EQUAL ECON OPPCITY GRANTS
2019Actuals
Change From
2020Actuals
2021Adopted
2022Mayor's
Proposed
2021Adopted
Spending by Major Account
675 8,577 SERVICES (8,577) 798 MATERIALS AND SUPPLIES (798)
(9,375) 9,375 675 Total Spending by Major Account
Spending by Accounting UnitPCIARC GRANTS 9,375 675 20015100 (9,375)
Total Spending by Accounting Unit (9,375) 675 9,375
139
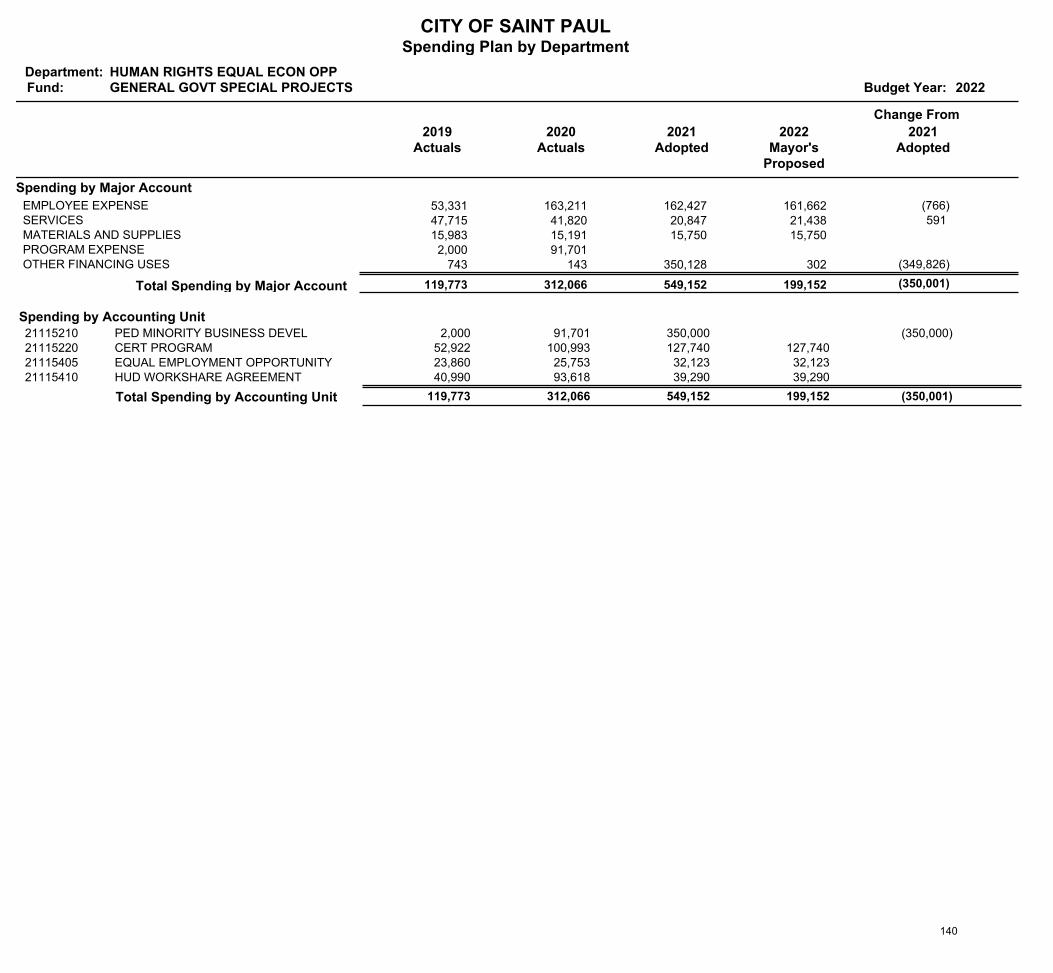
CITY OF SAINT PAULSpending Plan by Department
Department:Fund: Budget Year: 2022
HUMAN RIGHTS EQUAL ECON OPPGENERAL GOVT SPECIAL PROJECTS
2019Actuals
Change From
2020Actuals
2021Adopted
2022Mayor's
Proposed
2021Adopted
Spending by Major Account
53,331 163,211 162,427 161,662 EMPLOYEE EXPENSE (766) 47,715 41,820 20,847 21,438 SERVICES 591 15,983 15,191 15,750 15,750 MATERIALS AND SUPPLIES 2,000 91,701 PROGRAM EXPENSE
743 143 350,128 302 OTHER FINANCING USES (349,826)
(350,001) 199,152 549,152 312,066 119,773 Total Spending by Major Account
Spending by Accounting UnitPED MINORITY BUSINESS DEVEL 2,000 350,000 91,701 21115210 (350,000)CERT PROGRAM 52,922 127,740 127,740 100,993 21115220EQUAL EMPLOYMENT OPPORTUNITY 23,860 32,123 32,123 25,753 21115405HUD WORKSHARE AGREEMENT 40,990 39,290 39,290 93,618 21115410
Total Spending by Accounting Unit 119,773 199,152 (350,001) 312,066 549,152
140
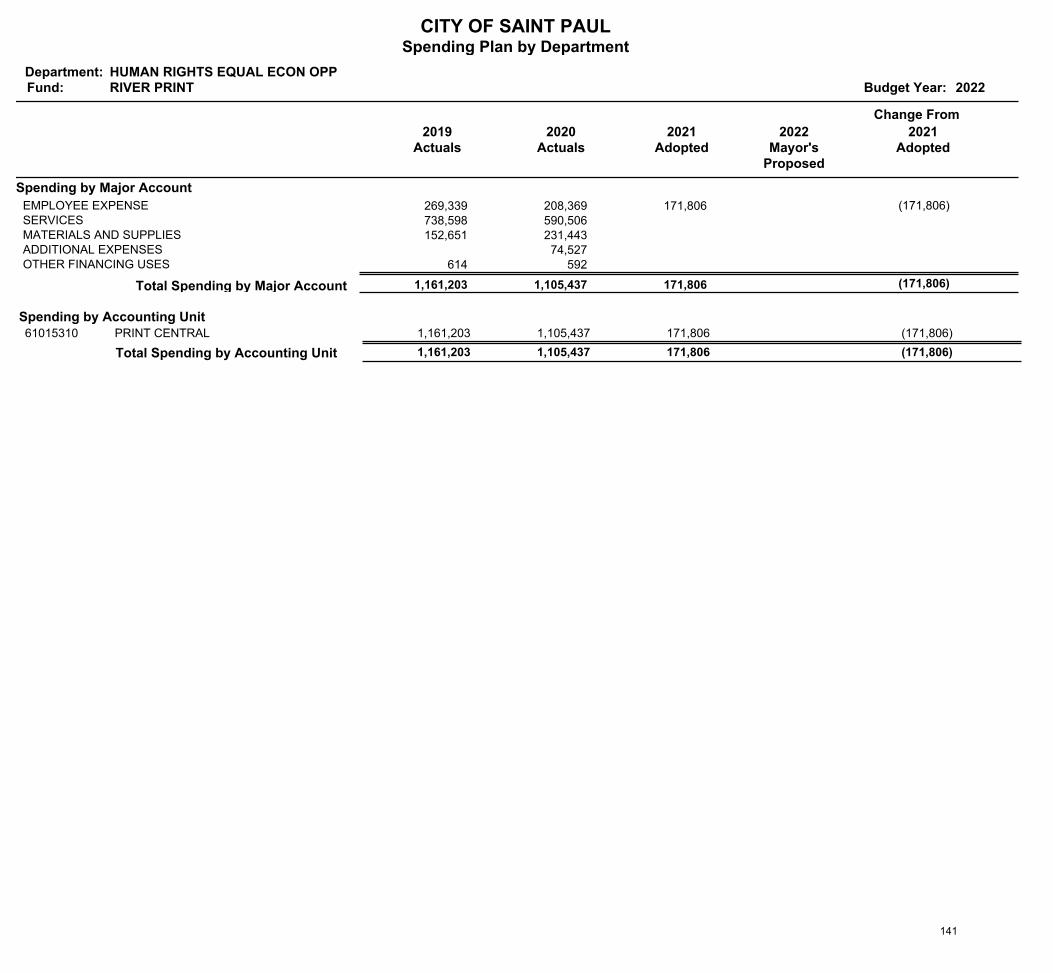
CITY OF SAINT PAULSpending Plan by Department
Department:Fund: Budget Year: 2022
HUMAN RIGHTS EQUAL ECON OPPRIVER PRINT
2019Actuals
Change From
2020Actuals
2021Adopted
2022Mayor's
Proposed
2021Adopted
Spending by Major Account
269,339 208,369 171,806 EMPLOYEE EXPENSE (171,806) 738,598 590,506 SERVICES 152,651 231,443 MATERIALS AND SUPPLIES
74,527 ADDITIONAL EXPENSES 614 592 OTHER FINANCING USES
(171,806) 171,806 1,105,437 1,161,203 Total Spending by Major Account
Spending by Accounting UnitPRINT CENTRAL 1,161,203 171,806 1,105,437 61015310 (171,806)
Total Spending by Accounting Unit 1,161,203 (171,806) 1,105,437 171,806
141

Financing Reports 142
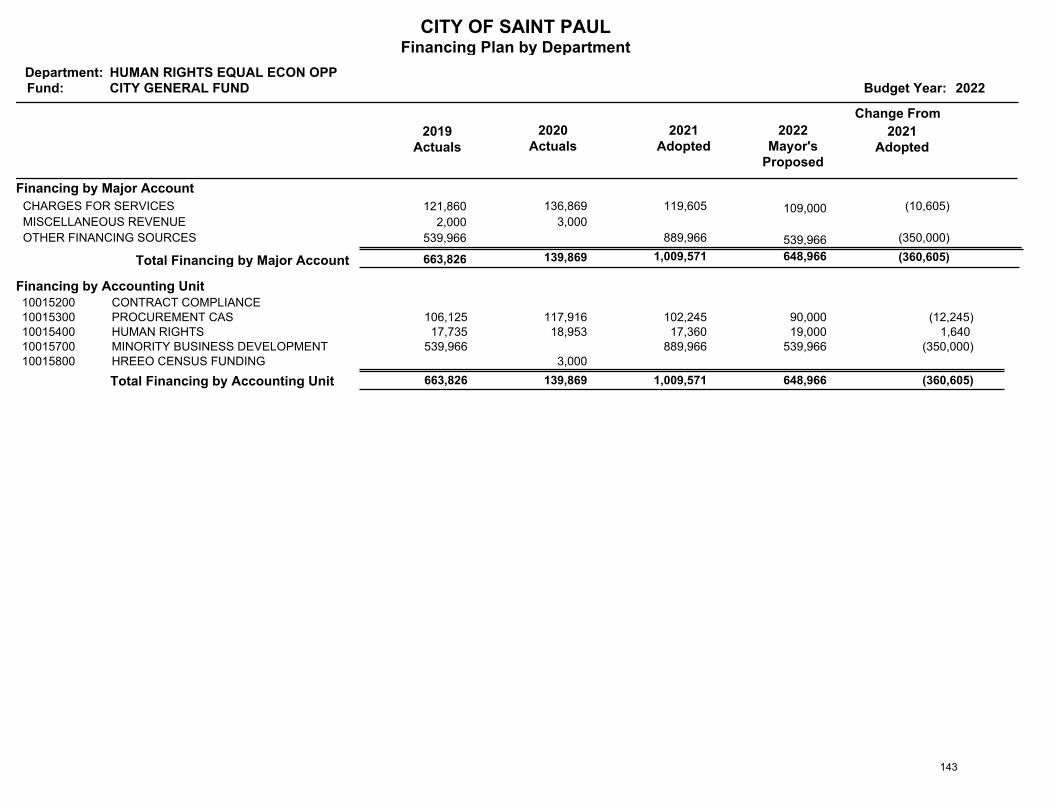
CITY OF SAINT PAULFinancing Plan by Department
Department:Fund: Budget Year: 2022
HUMAN RIGHTS EQUAL ECON OPPCITY GENERAL FUND
2019Actuals
Change From
2020Actuals
2021Adopted
2022Mayor's
Proposed
2021Adopted
Financing by Major Account
121,860 136,869 119,605 109,000 CHARGES FOR SERVICES (10,605)
2,000 3,000 MISCELLANEOUS REVENUE
539,966 889,966 539,966 OTHER FINANCING SOURCES (350,000)
(360,605) 648,966 1,009,571 139,869 663,826 Total Financing by Major Account
Financing by Accounting UnitCONTRACT COMPLIANCE10015200PROCUREMENT CAS 106,125 90,000 102,245 117,916 10015300 (12,245)HUMAN RIGHTS 17,735 19,000 17,360 18,953 10015400 1,640 MINORITY BUSINESS DEVELOPMENT 539,966 539,966 889,966 10015700 (350,000)HREEO CENSUS FUNDING 3,000 10015800
Total Financing by Accounting Unit 663,826 648,966 (360,605) 139,869 1,009,571
143
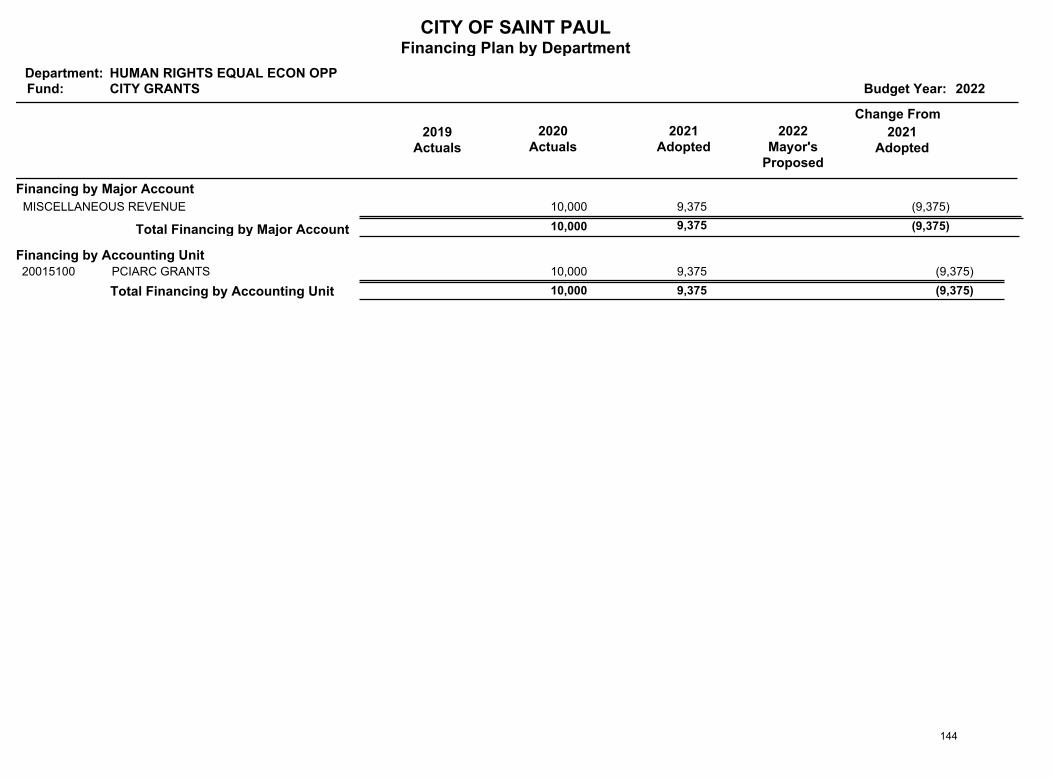
CITY OF SAINT PAULFinancing Plan by Department
Department:Fund: Budget Year: 2022
HUMAN RIGHTS EQUAL ECON OPPCITY GRANTS
2019Actuals
Change From
2020Actuals
2021Adopted
2022Mayor's
Proposed
2021Adopted
Financing by Major Account
10,000 9,375 MISCELLANEOUS REVENUE (9,375)
(9,375) 9,375 10,000 Total Financing by Major Account
Financing by Accounting UnitPCIARC GRANTS 9,375 10,000 20015100 (9,375)
Total Financing by Accounting Unit (9,375) 10,000 9,375
144
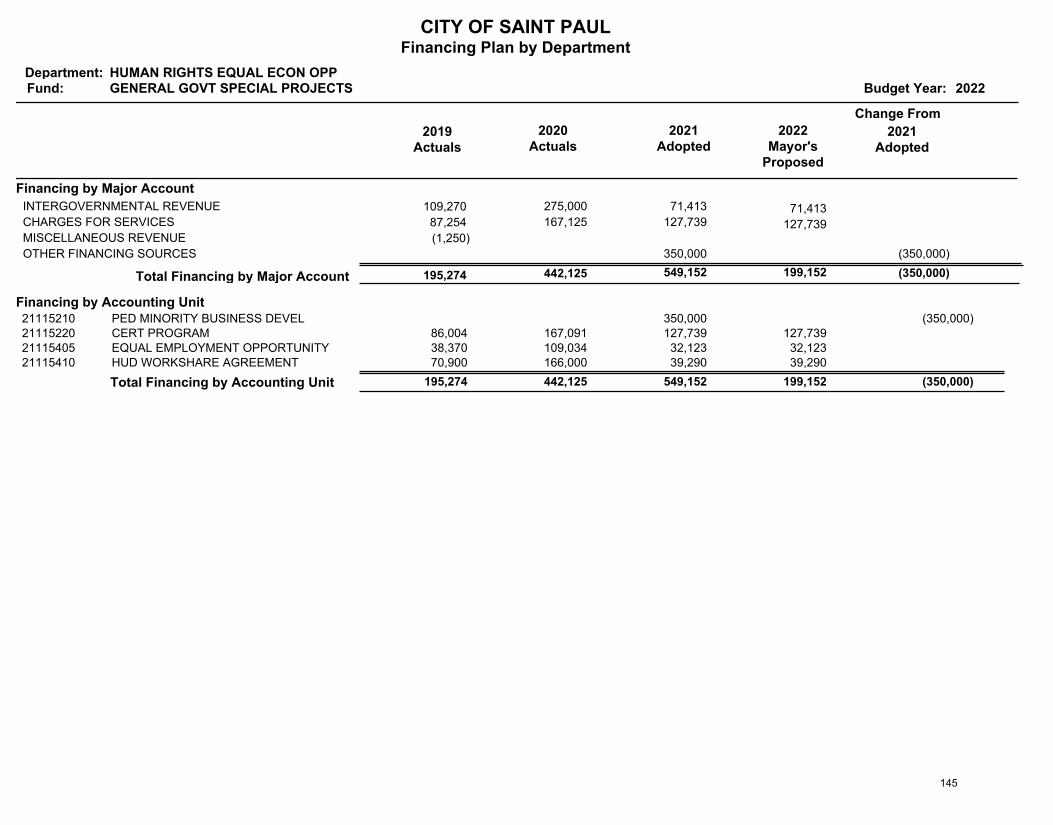
CITY OF SAINT PAULFinancing Plan by Department
Department:Fund: Budget Year: 2022
HUMAN RIGHTS EQUAL ECON OPPGENERAL GOVT SPECIAL PROJECTS
2019Actuals
Change From
2020Actuals
2021Adopted
2022Mayor's
Proposed
2021Adopted
Financing by Major Account
109,270 275,000 71,413 71,413 INTERGOVERNMENTAL REVENUE
87,254 167,125 127,739 127,739 CHARGES FOR SERVICES
(1,250)MISCELLANEOUS REVENUE
350,000 OTHER FINANCING SOURCES (350,000)
(350,000) 199,152 549,152 442,125 195,274 Total Financing by Major Account
Financing by Accounting UnitPED MINORITY BUSINESS DEVEL 350,000 21115210 (350,000)CERT PROGRAM 86,004 127,739 127,739 167,091 21115220EQUAL EMPLOYMENT OPPORTUNITY 38,370 32,123 32,123 109,034 21115405HUD WORKSHARE AGREEMENT 70,900 39,290 39,290 166,000 21115410
Total Financing by Accounting Unit 195,274 199,152 (350,000) 442,125 549,152
145
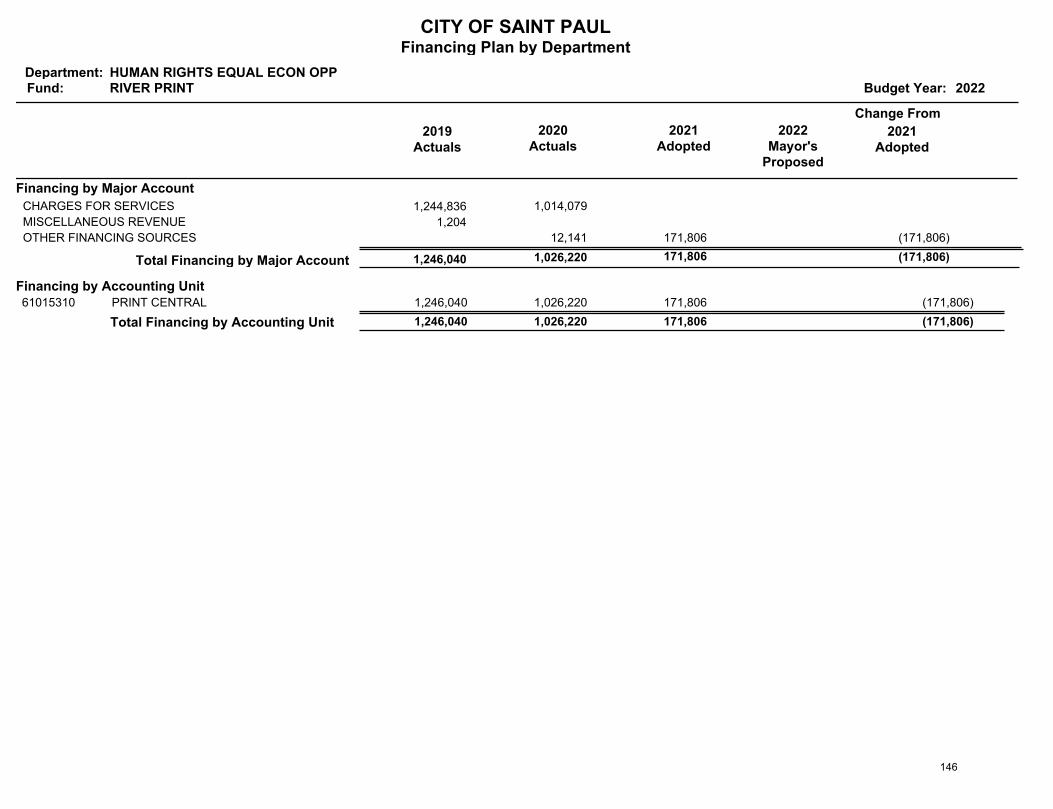
CITY OF SAINT PAULFinancing Plan by Department
Department:Fund: Budget Year: 2022
HUMAN RIGHTS EQUAL ECON OPPRIVER PRINT
2019Actuals
Change From
2020Actuals
2021Adopted
2022Mayor's
Proposed
2021Adopted
Financing by Major Account
1,244,836 1,014,079 CHARGES FOR SERVICES
1,204 MISCELLANEOUS REVENUE
12,141 171,806 OTHER FINANCING SOURCES (171,806)
(171,806) 171,806 1,026,220 1,246,040 Total Financing by Major Account
Financing by Accounting UnitPRINT CENTRAL 1,246,040 171,806 1,026,220 61015310 (171,806)
Total Financing by Accounting Unit 1,246,040 (171,806) 1,026,220 171,806
146
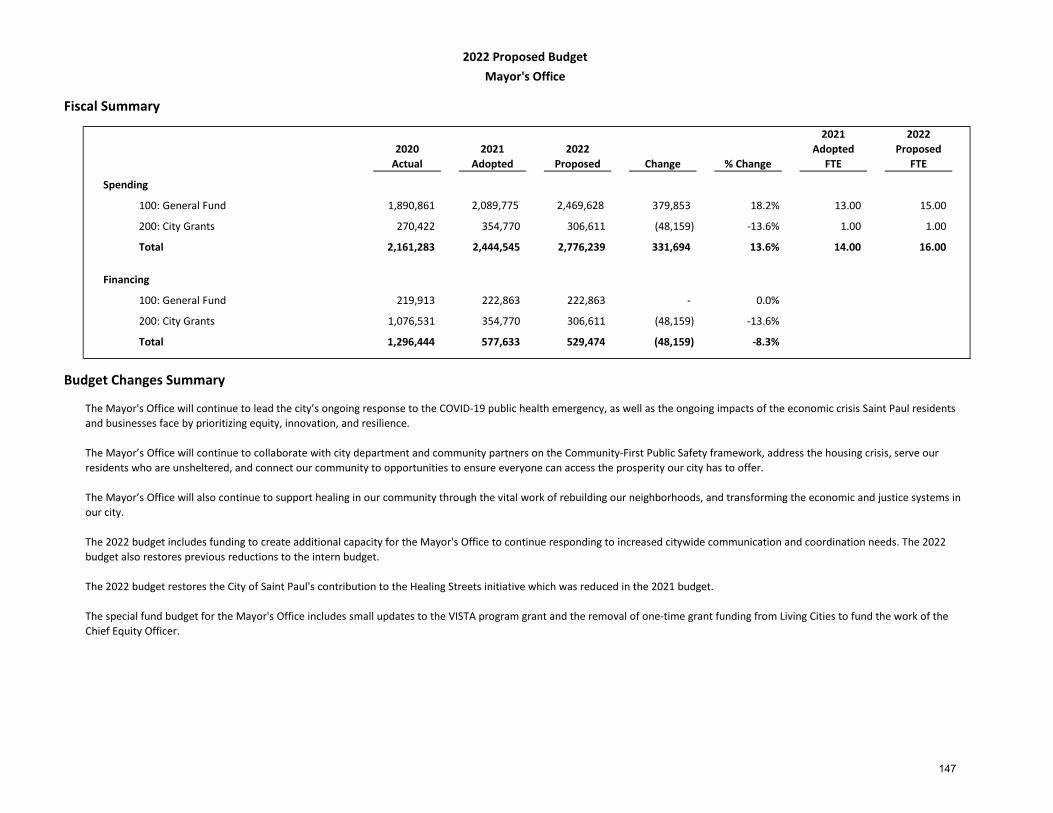
Fiscal Summary
2020Actual
2021Adopted
2022Proposed Change % Change
2021Adopted
FTE
2022 Proposed
FTE
Spending
1,890,861 2,089,775 2,469,628 379,853 18.2% 13.00 15.00
270,422 354,770 306,611 (48,159) -13.6% 1.00 1.00
2,161,283 2,444,545 2,776,239 331,694 13.6% 14.00 16.00
Financing
219,913 222,863 222,863 - 0.0%
1,076,531 354,770 306,611 (48,159) -13.6%
1,296,444 577,633 529,474 (48,159) -8.3%
Budget Changes Summary
2022 Proposed BudgetMayor's Office
The Mayor's Office will continue to lead the city’s ongoing response to the COVID-19 public health emergency, as well as the ongoing impacts of the economic crisis Saint Paul residents and businesses face by prioritizing equity, innovation, and resilience.
The Mayor’s Office will continue to collaborate with city department and community partners on the Community-First Public Safety framework, address the housing crisis, serve our residents who are unsheltered, and connect our community to opportunities to ensure everyone can access the prosperity our city has to offer.
The Mayor’s Office will also continue to support healing in our community through the vital work of rebuilding our neighborhoods, and transforming the economic and justice systems in our city.
The 2022 budget includes funding to create additional capacity for the Mayor's Office to continue responding to increased citywide communication and coordination needs. The 2022 budget also restores previous reductions to the intern budget.
The 2022 budget restores the City of Saint Paul's contribution to the Healing Streets initiative which was reduced in the 2021 budget.
The special fund budget for the Mayor's Office includes small updates to the VISTA program grant and the removal of one-time grant funding from Living Cities to fund the work of the Chief Equity Officer.
200: City Grants
100: General Fund
200: City Grants
100: General Fund
Total
Total
147

Spending Reports 148
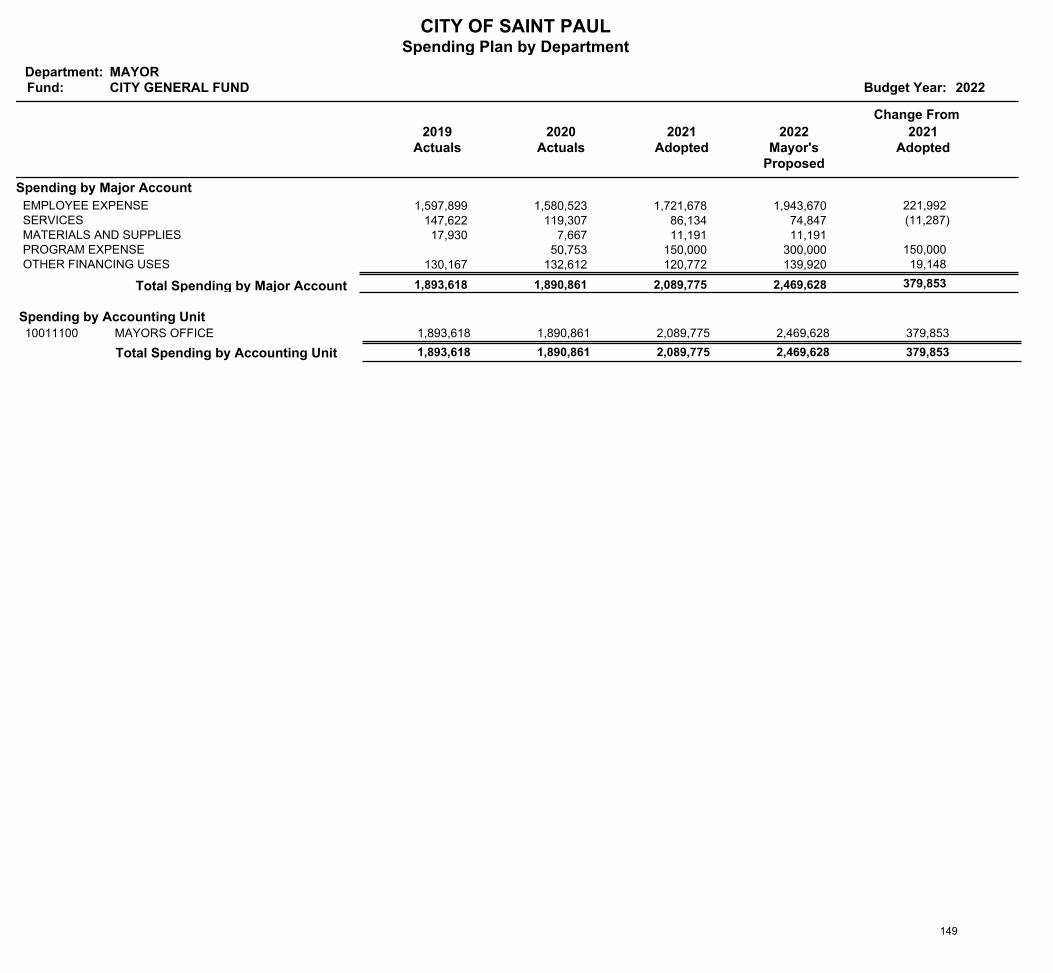
CITY OF SAINT PAULSpending Plan by Department
Department:Fund: Budget Year: 2022
MAYORCITY GENERAL FUND
2019Actuals
Change From
2020Actuals
2021Adopted
2022Mayor's
Proposed
2021Adopted
Spending by Major Account
1,597,899 1,580,523 1,721,678 1,943,670 EMPLOYEE EXPENSE 221,992 147,622 119,307 86,134 74,847 SERVICES (11,287) 17,930 7,667 11,191 11,191 MATERIALS AND SUPPLIES
50,753 150,000 300,000 PROGRAM EXPENSE 150,000 130,167 132,612 120,772 139,920 OTHER FINANCING USES 19,148
379,853 2,469,628 2,089,775 1,890,861 1,893,618 Total Spending by Major Account
Spending by Accounting UnitMAYORS OFFICE 1,893,618 2,469,628 2,089,775 1,890,861 10011100 379,853
Total Spending by Accounting Unit 1,893,618 2,469,628 379,853 1,890,861 2,089,775
149

CITY OF SAINT PAULSpending Plan by Department
Department:Fund: Budget Year: 2022
MAYORCITY GRANTS
2019Actuals
Change From
2020Actuals
2021Adopted
2022Mayor's
Proposed
2021Adopted
Spending by Major Account
222,925 248,068 273,710 275,551 EMPLOYEE EXPENSE 1,842 55,450 19,479 27,260 27,260 SERVICES 2,407 2,875 3,800 3,800 MATERIALS AND SUPPLIES
50,000 OTHER FINANCING USES (50,000)
(48,158) 306,611 354,770 270,422 280,782 Total Spending by Major Account
Spending by Accounting UnitEDUCATION INITIATIVE 238,612 306,611 304,770 268,757 20011800 1,842 ENERGY INITIATIVES 42,170 1,665 20011810MAYOR'S INITIATIVES 50,000 20011811 (50,000)
Total Spending by Accounting Unit 280,782 306,611 (48,158) 270,422 354,770
150

Financing Reports 151
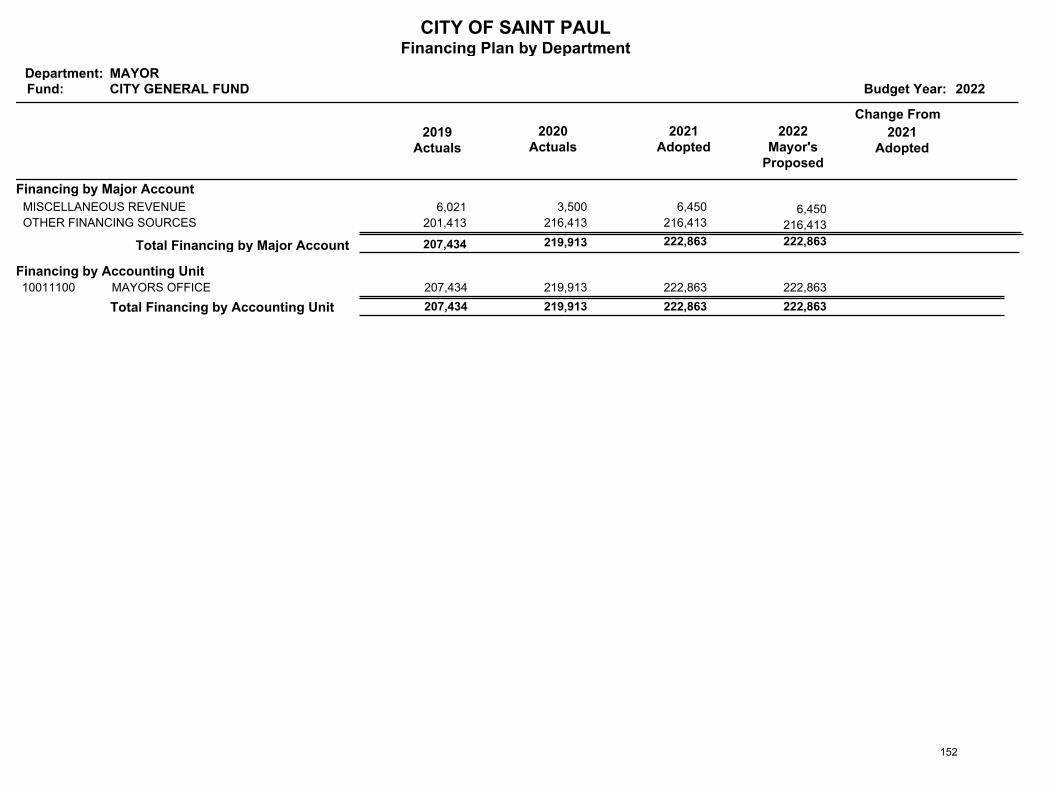
CITY OF SAINT PAULFinancing Plan by Department
Department:Fund: Budget Year: 2022
MAYORCITY GENERAL FUND
2019Actuals
Change From
2020Actuals
2021Adopted
2022Mayor's
Proposed
2021Adopted
Financing by Major Account
6,021 3,500 6,450 6,450 MISCELLANEOUS REVENUE
201,413 216,413 216,413 216,413 OTHER FINANCING SOURCES
222,863 222,863 219,913 207,434 Total Financing by Major Account
Financing by Accounting UnitMAYORS OFFICE 207,434 222,863 222,863 219,913 10011100
Total Financing by Accounting Unit 207,434 222,863 219,913 222,863
152

CITY OF SAINT PAULFinancing Plan by Department
Department:Fund: Budget Year: 2022
MAYORCITY GRANTS
2019Actuals
Change From
2020Actuals
2021Adopted
2022Mayor's
Proposed
2021Adopted
Financing by Major Account
250,900 247,037 221,000 221,000 INTERGOVERNMENTAL REVENUE
87,028 79,494 81,500 31,500 MISCELLANEOUS REVENUE (50,000)
750,000 52,270 54,111 OTHER FINANCING SOURCES 1,841
(48,159) 306,611 354,770 1,076,531 337,928 Total Financing by Major Account
Financing by Accounting UnitEDUCATION INITIATIVE 287,928 306,611 304,770 301,531 20011800 1,841 ENERGY INITIATIVES 50,000 25,000 20011810MAYOR'S INITIATIVES 50,000 750,000 20011811 (50,000)
Total Financing by Accounting Unit 337,928 306,611 (48,159) 1,076,531 354,770
153
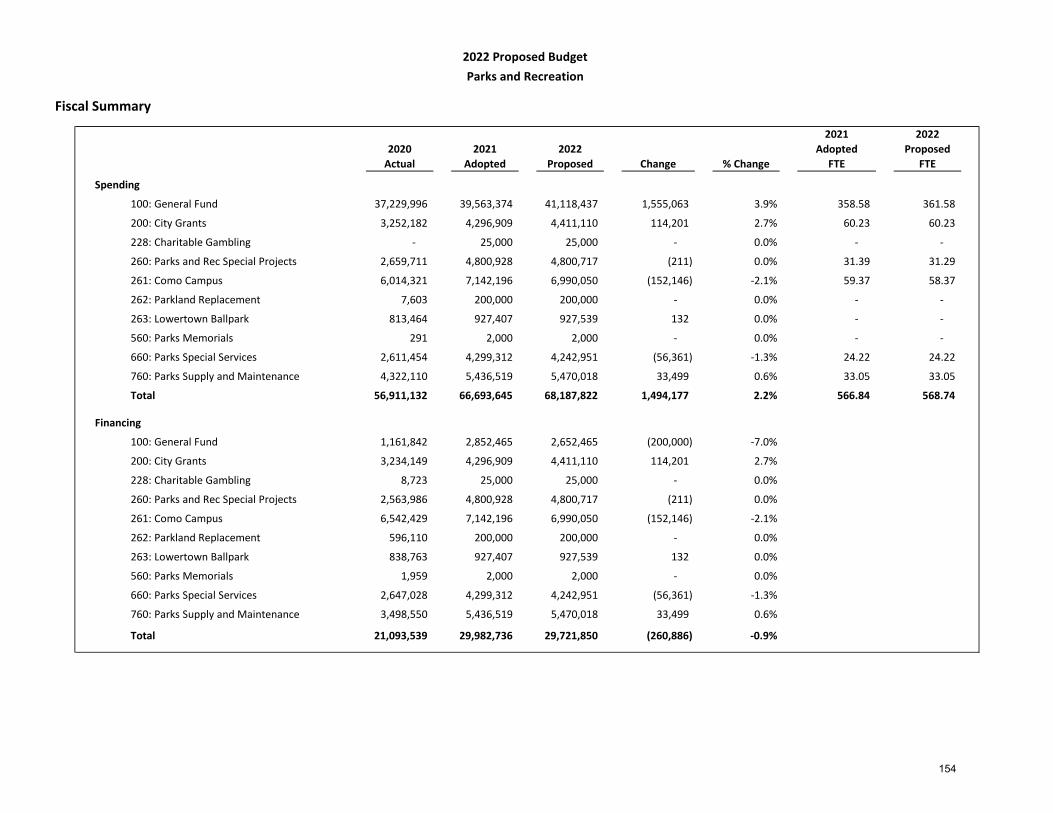
Fiscal Summary
2020Actual
2021Adopted
2022 Proposed Change % Change
2021Adopted
FTE
2022 Proposed
FTE
Spending
37,229,996 39,563,374 41,118,437 1,555,063 3.9% 358.58 361.58
3,252,182 4,296,909 4,411,110 114,201 2.7% 60.23 60.23
- 25,000 25,000 - 0.0% - -
2,659,711 4,800,928 4,800,717 (211) 0.0% 31.39 31.29
6,014,321 7,142,196 6,990,050 (152,146) -2.1% 59.37 58.37
7,603 200,000 200,000 - 0.0% - -
263: Lowertown Ballpark 813,464 927,407 927,539 132 0.0% - -
291 2,000 2,000 - 0.0% - -
2,611,454 4,299,312 4,242,951 (56,361) -1.3% 24.22 24.22
4,322,110 5,436,519 5,470,018 33,499 0.6% 33.05 33.05
56,911,132 66,693,645 68,187,822 1,494,177 2.2% 566.84 568.74
Financing
1,161,842 2,852,465 2,652,465 (200,000) -7.0%
3,234,149 4,296,909 4,411,110 114,201 2.7%
8,723 25,000 25,000 - 0.0%
2,563,986 4,800,928 4,800,717 (211) 0.0%
6,542,429 7,142,196 6,990,050 (152,146) -2.1%
596,110 200,000 200,000 - 0.0%
263: Lowertown Ballpark 838,763 927,407 927,539 132 0.0%
1,959 2,000 2,000 - 0.0%
2,647,028 4,299,312 4,242,951 (56,361) -1.3%
3,498,550 5,436,519 5,470,018 33,499 0.6%
21,093,539 29,982,736 29,721,850 (260,886) -0.9%
560: Parks Memorials
262: Parkland Replacement
660: Parks Special Services
200: City Grants
228: Charitable Gambling
260: Parks and Rec Special Projects
2022 Proposed BudgetParks and Recreation
100: General Fund
200: City Grants
228: Charitable Gambling
100: General Fund
260: Parks and Rec Special Projects
261: Como Campus
261: Como Campus
Total
262: Parkland Replacement
760: Parks Supply and Maintenance
560: Parks Memorials
Total
660: Parks Special Services
760: Parks Supply and Maintenance
154
Budget Changes Summary
ARP Funding: The 2022 proposed budget includes $1,131,810 in American Rescue Plan funding to restore hours at recreation and aquatics facilities that were reduced in the 2021 budget. Restoring these services includes adding back 25 FTE's. The FTE counts and budgets on these pages do not include this funding: Please see the American Rescue Plan Act State and Local Fiscal Recovery Funds section for additional information.
With the construction of additional parks at Highland Bridge (formerly the "Ford Site"), the Parks department has identified additional operations and maintenance needs. The 2022 budget includes funding for the upkeep of new parkland, including three full-time equivalent Parks Workers, janitorial supplies, and utilities.
To respond to urgent needs in 2021, the Parks and Recreation department worked with the Como Friends to temporarily prioritize its annual gift to increase operating support. This one-time funding has been removed in the 2022 budget.
The proposed budget also includes ongoing funding of $35,610 for building maintenance costs associated with HVAC upgrades.
155

Spending Reports 156
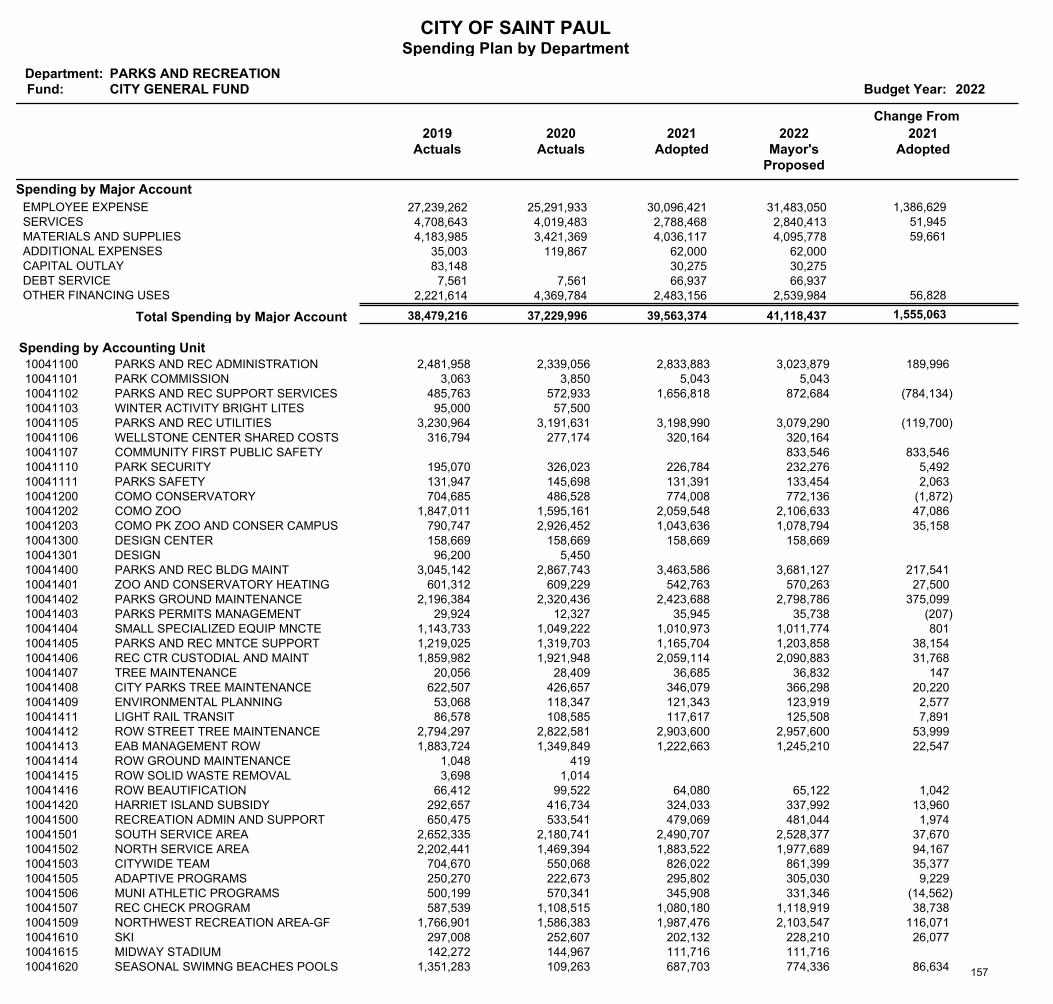
CITY OF SAINT PAULSpending Plan by Department
Department:Fund: Budget Year: 2022
PARKS AND RECREATIONCITY GENERAL FUND
2019Actuals
Change From
2020Actuals
2021Adopted
2022Mayor's
Proposed
2021Adopted
Spending by Major Account
27,239,262 25,291,933 30,096,421 31,483,050 EMPLOYEE EXPENSE 1,386,629 4,708,643 4,019,483 2,788,468 2,840,413 SERVICES 51,945 4,183,985 3,421,369 4,036,117 4,095,778 MATERIALS AND SUPPLIES 59,661
35,003 119,867 62,000 62,000 ADDITIONAL EXPENSES 83,148 30,275 30,275 CAPITAL OUTLAY 7,561 7,561 66,937 66,937 DEBT SERVICE
2,221,614 4,369,784 2,483,156 2,539,984 OTHER FINANCING USES 56,828
1,555,063 41,118,437 39,563,374 37,229,996 38,479,216 Total Spending by Major Account
Spending by Accounting UnitPARKS AND REC ADMINISTRATION 2,481,958 3,023,879 2,833,883 2,339,056 10041100 189,996 PARK COMMISSION 3,063 5,043 5,043 3,850 10041101PARKS AND REC SUPPORT SERVICES 485,763 872,684 1,656,818 572,933 10041102 (784,134)WINTER ACTIVITY BRIGHT LITES 95,000 57,500 10041103PARKS AND REC UTILITIES 3,230,964 3,079,290 3,198,990 3,191,631 10041105 (119,700)WELLSTONE CENTER SHARED COSTS 316,794 320,164 320,164 277,174 10041106COMMUNITY FIRST PUBLIC SAFETY 833,546 10041107 833,546 PARK SECURITY 195,070 232,276 226,784 326,023 10041110 5,492 PARKS SAFETY 131,947 133,454 131,391 145,698 10041111 2,063 COMO CONSERVATORY 704,685 772,136 774,008 486,528 10041200 (1,872)COMO ZOO 1,847,011 2,106,633 2,059,548 1,595,161 10041202 47,086 COMO PK ZOO AND CONSER CAMPUS 790,747 1,078,794 1,043,636 2,926,452 10041203 35,158 DESIGN CENTER 158,669 158,669 158,669 158,669 10041300DESIGN 96,200 5,450 10041301PARKS AND REC BLDG MAINT 3,045,142 3,681,127 3,463,586 2,867,743 10041400 217,541 ZOO AND CONSERVATORY HEATING 601,312 570,263 542,763 609,229 10041401 27,500 PARKS GROUND MAINTENANCE 2,196,384 2,798,786 2,423,688 2,320,436 10041402 375,099 PARKS PERMITS MANAGEMENT 29,924 35,738 35,945 12,327 10041403 (207)SMALL SPECIALIZED EQUIP MNCTE 1,143,733 1,011,774 1,010,973 1,049,222 10041404 801 PARKS AND REC MNTCE SUPPORT 1,219,025 1,203,858 1,165,704 1,319,703 10041405 38,154 REC CTR CUSTODIAL AND MAINT 1,859,982 2,090,883 2,059,114 1,921,948 10041406 31,768 TREE MAINTENANCE 20,056 36,832 36,685 28,409 10041407 147 CITY PARKS TREE MAINTENANCE 622,507 366,298 346,079 426,657 10041408 20,220 ENVIRONMENTAL PLANNING 53,068 123,919 121,343 118,347 10041409 2,577 LIGHT RAIL TRANSIT 86,578 125,508 117,617 108,585 10041411 7,891 ROW STREET TREE MAINTENANCE 2,794,297 2,957,600 2,903,600 2,822,581 10041412 53,999 EAB MANAGEMENT ROW 1,883,724 1,245,210 1,222,663 1,349,849 10041413 22,547 ROW GROUND MAINTENANCE 1,048 419 10041414ROW SOLID WASTE REMOVAL 3,698 1,014 10041415ROW BEAUTIFICATION 66,412 65,122 64,080 99,522 10041416 1,042 HARRIET ISLAND SUBSIDY 292,657 337,992 324,033 416,734 10041420 13,960 RECREATION ADMIN AND SUPPORT 650,475 481,044 479,069 533,541 10041500 1,974 SOUTH SERVICE AREA 2,652,335 2,528,377 2,490,707 2,180,741 10041501 37,670 NORTH SERVICE AREA 2,202,441 1,977,689 1,883,522 1,469,394 10041502 94,167 CITYWIDE TEAM 704,670 861,399 826,022 550,068 10041503 35,377 ADAPTIVE PROGRAMS 250,270 305,030 295,802 222,673 10041505 9,229 MUNI ATHLETIC PROGRAMS 500,199 331,346 345,908 570,341 10041506 (14,562)REC CHECK PROGRAM 587,539 1,118,919 1,080,180 1,108,515 10041507 38,738 NORTHWEST RECREATION AREA-GF 1,766,901 2,103,547 1,987,476 1,586,383 10041509 116,071 SKI 297,008 228,210 202,132 252,607 10041610 26,077 MIDWAY STADIUM 142,272 111,716 111,716 144,967 10041615SEASONAL SWIMNG BEACHES POOLS 1,351,283 774,336 687,703 109,263 10041620 86,634 157
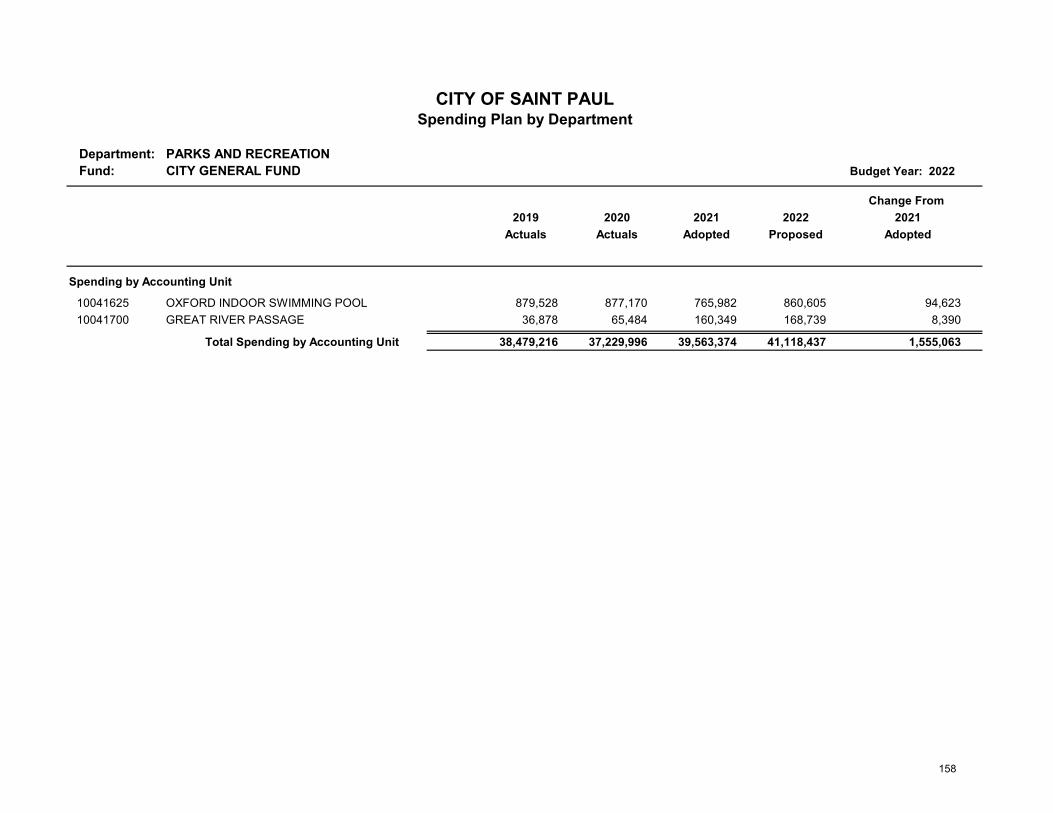
Department: PARKS AND RECREATIONFund: CITY GENERAL FUND Budget Year: 2022
Change From 2019 2020 2021 2022 2021
Actuals Actuals Adopted Proposed Adopted
Spending by Accounting Unit
10041625 OXFORD INDOOR SWIMMING POOL 879,528 877,170 765,982 860,605 94,623 10041700 GREAT RIVER PASSAGE 36,878 65,484 160,349 168,739 8,390
Total Spending by Accounting Unit 38,479,216 37,229,996 39,563,374 41,118,437 1,555,063
CITY OF SAINT PAULSpending Plan by Department
158
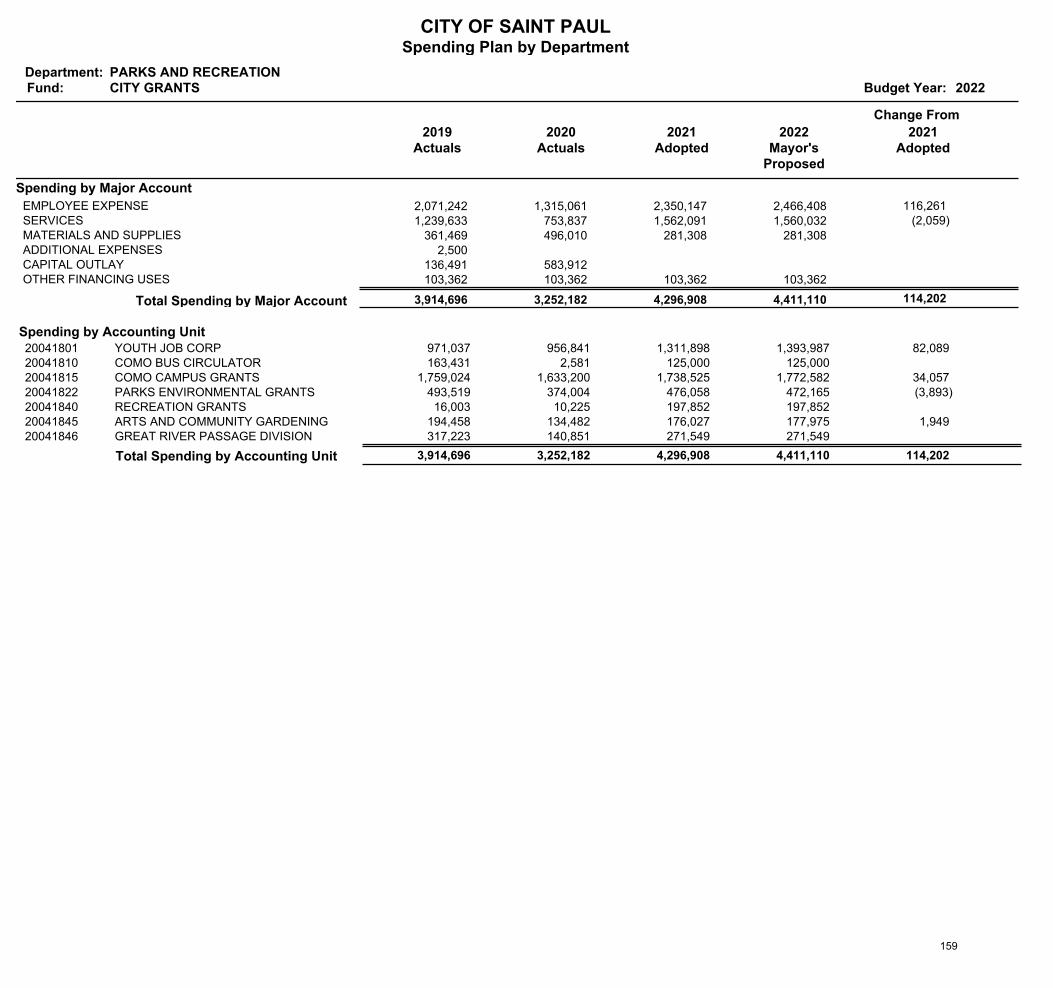
CITY OF SAINT PAULSpending Plan by Department
Department:Fund: Budget Year: 2022
PARKS AND RECREATIONCITY GRANTS
2019Actuals
Change From
2020Actuals
2021Adopted
2022Mayor's
Proposed
2021Adopted
Spending by Major Account
2,071,242 1,315,061 2,350,147 2,466,408 EMPLOYEE EXPENSE 116,261 1,239,633 753,837 1,562,091 1,560,032 SERVICES (2,059)
361,469 496,010 281,308 281,308 MATERIALS AND SUPPLIES 2,500 ADDITIONAL EXPENSES
136,491 583,912 CAPITAL OUTLAY 103,362 103,362 103,362 103,362 OTHER FINANCING USES
114,202 4,411,110 4,296,908 3,252,182 3,914,696 Total Spending by Major Account
Spending by Accounting UnitYOUTH JOB CORP 971,037 1,393,987 1,311,898 956,841 20041801 82,089 COMO BUS CIRCULATOR 163,431 125,000 125,000 2,581 20041810COMO CAMPUS GRANTS 1,759,024 1,772,582 1,738,525 1,633,200 20041815 34,057 PARKS ENVIRONMENTAL GRANTS 493,519 472,165 476,058 374,004 20041822 (3,893)RECREATION GRANTS 16,003 197,852 197,852 10,225 20041840ARTS AND COMMUNITY GARDENING 194,458 177,975 176,027 134,482 20041845 1,949 GREAT RIVER PASSAGE DIVISION 317,223 271,549 271,549 140,851 20041846
Total Spending by Accounting Unit 3,914,696 4,411,110 114,202 3,252,182 4,296,908
159
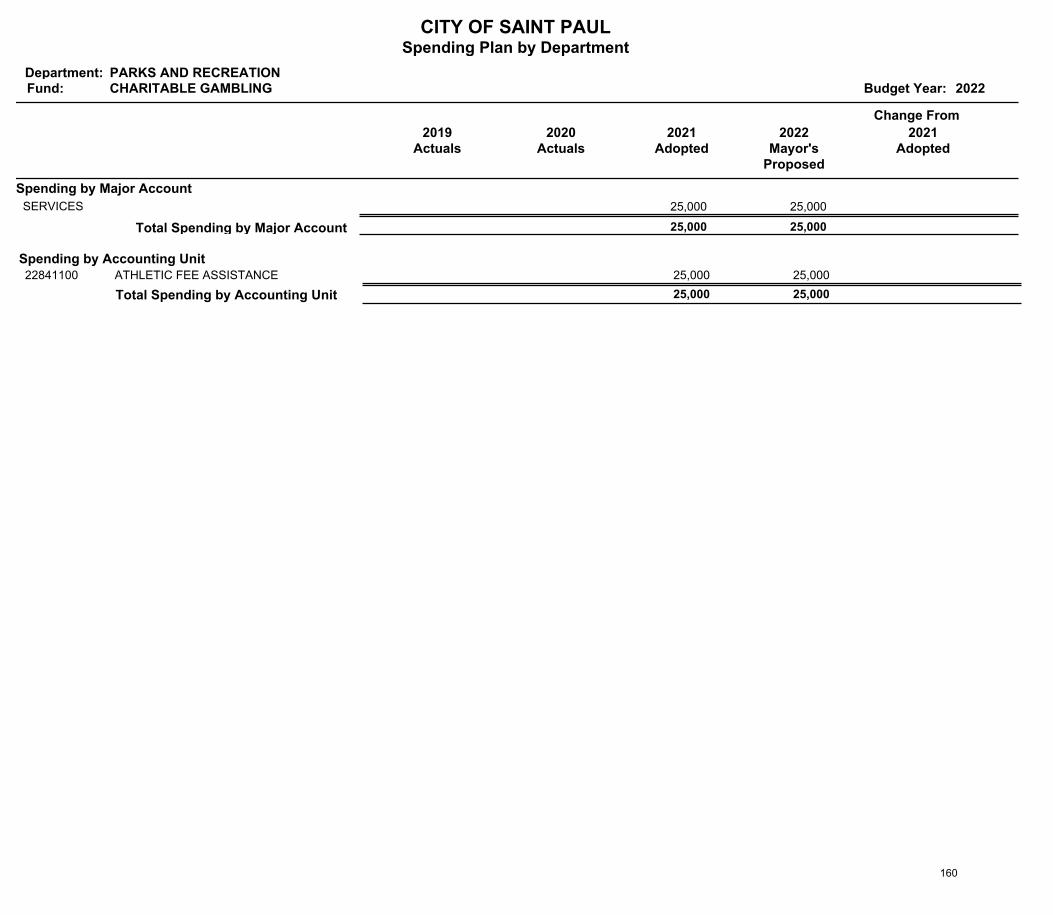
CITY OF SAINT PAULSpending Plan by Department
Department:Fund: Budget Year: 2022
PARKS AND RECREATIONCHARITABLE GAMBLING
2019Actuals
Change From
2020Actuals
2021Adopted
2022Mayor's
Proposed
2021Adopted
Spending by Major Account
25,000 25,000 SERVICES
25,000 25,000 Total Spending by Major Account
Spending by Accounting UnitATHLETIC FEE ASSISTANCE 25,000 25,000 22841100
Total Spending by Accounting Unit 25,000 25,000
160
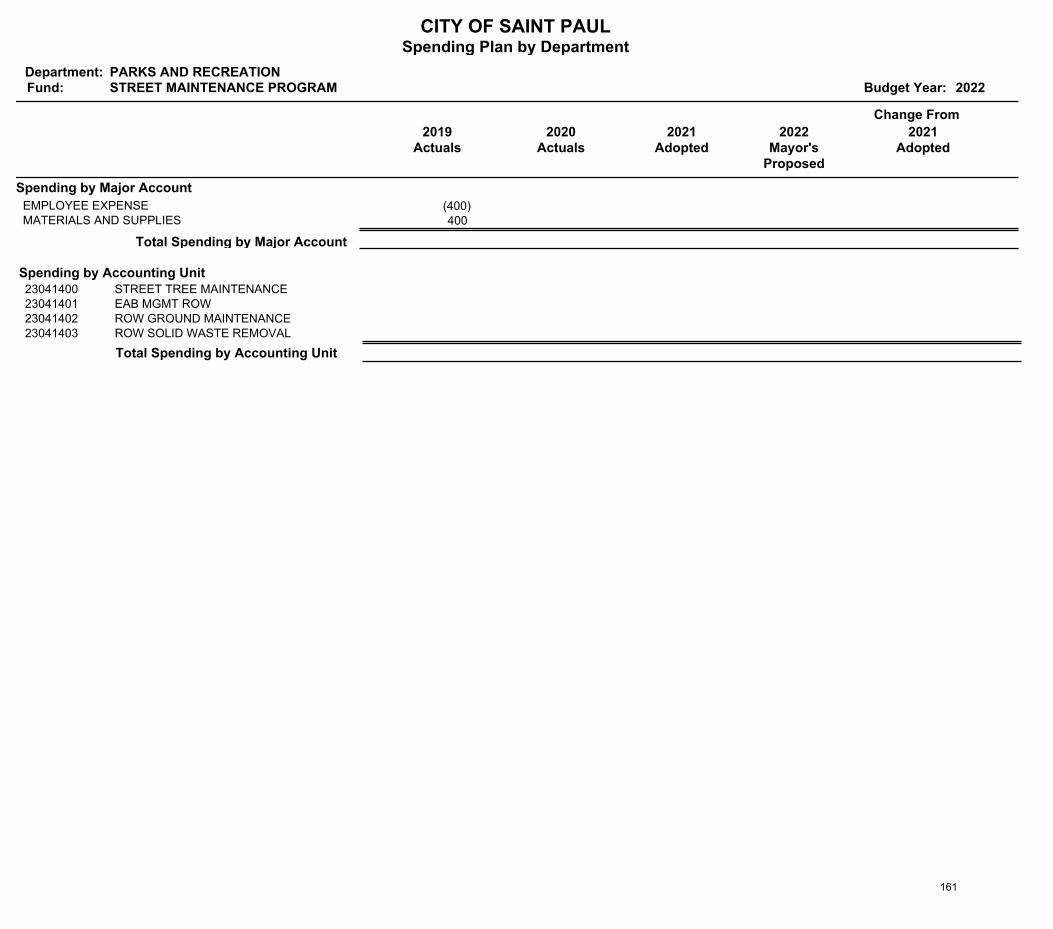
CITY OF SAINT PAULSpending Plan by Department
Department:Fund: Budget Year: 2022
PARKS AND RECREATIONSTREET MAINTENANCE PROGRAM
2019Actuals
Change From
2020Actuals
2021Adopted
2022Mayor's
Proposed
2021Adopted
Spending by Major Account
(400)EMPLOYEE EXPENSE 400 MATERIALS AND SUPPLIES
Total Spending by Major Account
Spending by Accounting UnitSTREET TREE MAINTENANCE23041400EAB MGMT ROW23041401ROW GROUND MAINTENANCE23041402ROW SOLID WASTE REMOVAL23041403
Total Spending by Accounting Unit
161
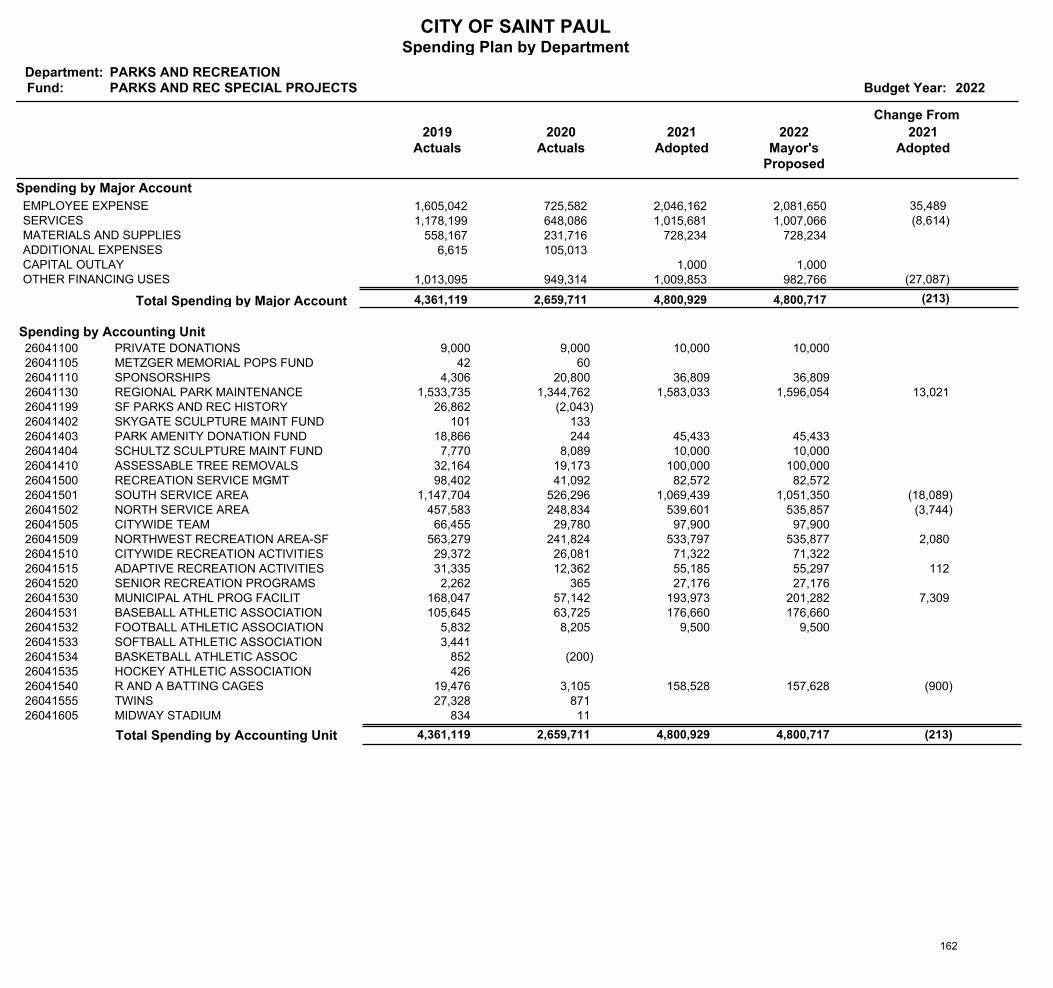
CITY OF SAINT PAULSpending Plan by Department
Department:Fund: Budget Year: 2022
PARKS AND RECREATIONPARKS AND REC SPECIAL PROJECTS
2019Actuals
Change From
2020Actuals
2021Adopted
2022Mayor's
Proposed
2021Adopted
Spending by Major Account
1,605,042 725,582 2,046,162 2,081,650 EMPLOYEE EXPENSE 35,489 1,178,199 648,086 1,015,681 1,007,066 SERVICES (8,614)
558,167 231,716 728,234 728,234 MATERIALS AND SUPPLIES 6,615 105,013 ADDITIONAL EXPENSES
1,000 1,000 CAPITAL OUTLAY 1,013,095 949,314 1,009,853 982,766 OTHER FINANCING USES (27,087)
(213) 4,800,717 4,800,929 2,659,711 4,361,119 Total Spending by Major Account
Spending by Accounting UnitPRIVATE DONATIONS 9,000 10,000 10,000 9,000 26041100METZGER MEMORIAL POPS FUND 42 60 26041105SPONSORSHIPS 4,306 36,809 36,809 20,800 26041110REGIONAL PARK MAINTENANCE 1,533,735 1,596,054 1,583,033 1,344,762 26041130 13,021 SF PARKS AND REC HISTORY 26,862 (2,043)26041199SKYGATE SCULPTURE MAINT FUND 101 133 26041402PARK AMENITY DONATION FUND 18,866 45,433 45,433 244 26041403SCHULTZ SCULPTURE MAINT FUND 7,770 10,000 10,000 8,089 26041404ASSESSABLE TREE REMOVALS 32,164 100,000 100,000 19,173 26041410RECREATION SERVICE MGMT 98,402 82,572 82,572 41,092 26041500SOUTH SERVICE AREA 1,147,704 1,051,350 1,069,439 526,296 26041501 (18,089)NORTH SERVICE AREA 457,583 535,857 539,601 248,834 26041502 (3,744)CITYWIDE TEAM 66,455 97,900 97,900 29,780 26041505NORTHWEST RECREATION AREA-SF 563,279 535,877 533,797 241,824 26041509 2,080 CITYWIDE RECREATION ACTIVITIES 29,372 71,322 71,322 26,081 26041510ADAPTIVE RECREATION ACTIVITIES 31,335 55,297 55,185 12,362 26041515 112 SENIOR RECREATION PROGRAMS 2,262 27,176 27,176 365 26041520MUNICIPAL ATHL PROG FACILIT 168,047 201,282 193,973 57,142 26041530 7,309 BASEBALL ATHLETIC ASSOCIATION 105,645 176,660 176,660 63,725 26041531FOOTBALL ATHLETIC ASSOCIATION 5,832 9,500 9,500 8,205 26041532SOFTBALL ATHLETIC ASSOCIATION 3,441 26041533BASKETBALL ATHLETIC ASSOC 852 (200)26041534HOCKEY ATHLETIC ASSOCIATION 426 26041535R AND A BATTING CAGES 19,476 157,628 158,528 3,105 26041540 (900)TWINS 27,328 871 26041555MIDWAY STADIUM 834 11 26041605
Total Spending by Accounting Unit 4,361,119 4,800,717 (213) 2,659,711 4,800,929
162
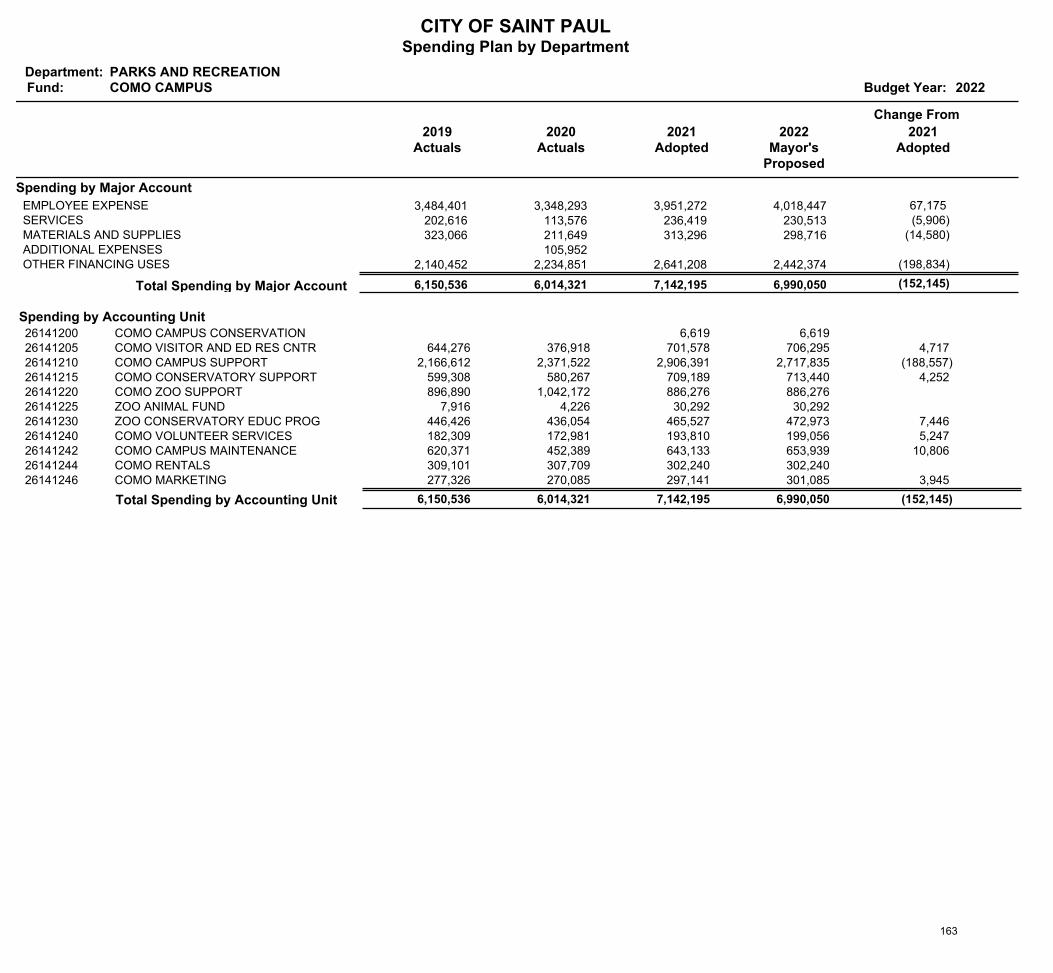
CITY OF SAINT PAULSpending Plan by Department
Department:Fund: Budget Year: 2022
PARKS AND RECREATIONCOMO CAMPUS
2019Actuals
Change From
2020Actuals
2021Adopted
2022Mayor's
Proposed
2021Adopted
Spending by Major Account
3,484,401 3,348,293 3,951,272 4,018,447 EMPLOYEE EXPENSE 67,175 202,616 113,576 236,419 230,513 SERVICES (5,906) 323,066 211,649 313,296 298,716 MATERIALS AND SUPPLIES (14,580)
105,952 ADDITIONAL EXPENSES 2,140,452 2,234,851 2,641,208 2,442,374 OTHER FINANCING USES (198,834)
(152,145) 6,990,050 7,142,195 6,014,321 6,150,536 Total Spending by Major Account
Spending by Accounting UnitCOMO CAMPUS CONSERVATION 6,619 6,619 26141200COMO VISITOR AND ED RES CNTR 644,276 706,295 701,578 376,918 26141205 4,717 COMO CAMPUS SUPPORT 2,166,612 2,717,835 2,906,391 2,371,522 26141210 (188,557)COMO CONSERVATORY SUPPORT 599,308 713,440 709,189 580,267 26141215 4,252 COMO ZOO SUPPORT 896,890 886,276 886,276 1,042,172 26141220ZOO ANIMAL FUND 7,916 30,292 30,292 4,226 26141225ZOO CONSERVATORY EDUC PROG 446,426 472,973 465,527 436,054 26141230 7,446 COMO VOLUNTEER SERVICES 182,309 199,056 193,810 172,981 26141240 5,247 COMO CAMPUS MAINTENANCE 620,371 653,939 643,133 452,389 26141242 10,806 COMO RENTALS 309,101 302,240 302,240 307,709 26141244COMO MARKETING 277,326 301,085 297,141 270,085 26141246 3,945
Total Spending by Accounting Unit 6,150,536 6,990,050 (152,145) 6,014,321 7,142,195
163
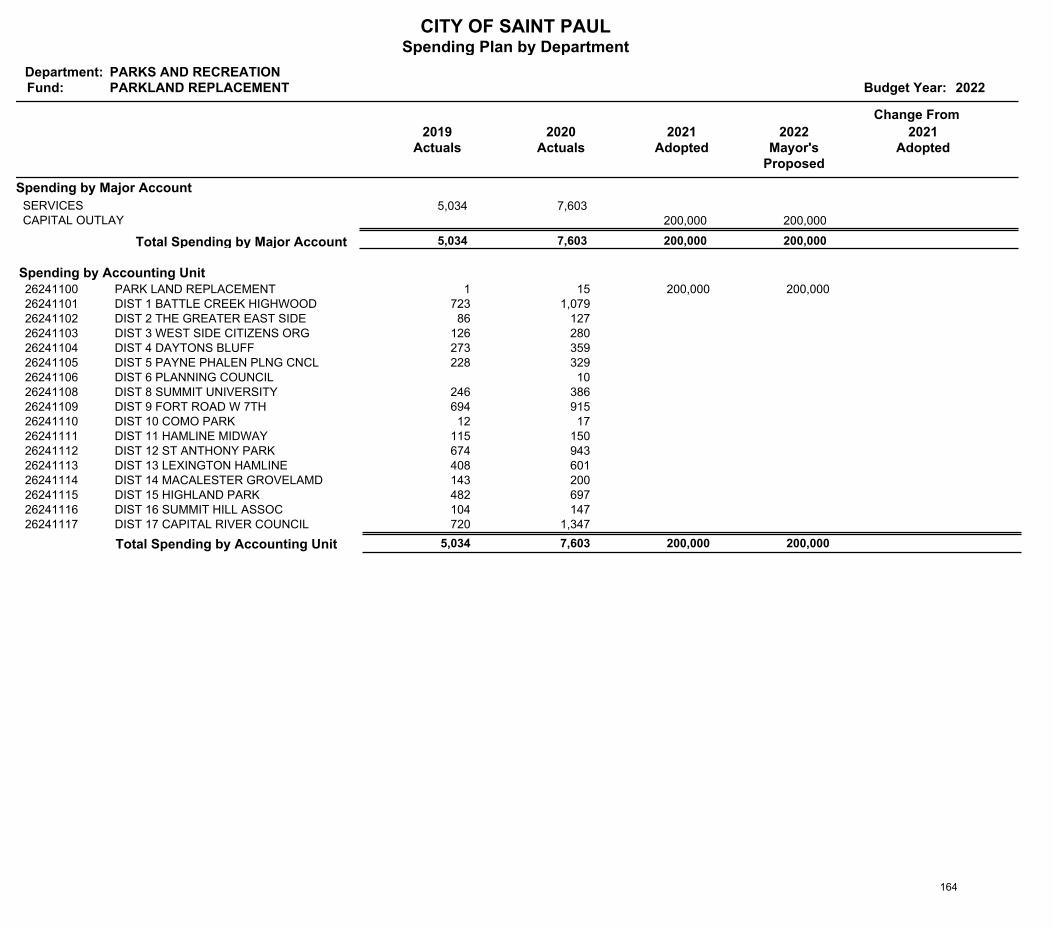
CITY OF SAINT PAULSpending Plan by Department
Department:Fund: Budget Year: 2022
PARKS AND RECREATIONPARKLAND REPLACEMENT
2019Actuals
Change From
2020Actuals
2021Adopted
2022Mayor's
Proposed
2021Adopted
Spending by Major Account
5,034 7,603 SERVICES 200,000 200,000 CAPITAL OUTLAY
200,000 200,000 7,603 5,034 Total Spending by Major Account
Spending by Accounting UnitPARK LAND REPLACEMENT 1 200,000 200,000 15 26241100DIST 1 BATTLE CREEK HIGHWOOD 723 1,079 26241101DIST 2 THE GREATER EAST SIDE 86 127 26241102DIST 3 WEST SIDE CITIZENS ORG 126 280 26241103DIST 4 DAYTONS BLUFF 273 359 26241104DIST 5 PAYNE PHALEN PLNG CNCL 228 329 26241105DIST 6 PLANNING COUNCIL 10 26241106DIST 8 SUMMIT UNIVERSITY 246 386 26241108DIST 9 FORT ROAD W 7TH 694 915 26241109DIST 10 COMO PARK 12 17 26241110DIST 11 HAMLINE MIDWAY 115 150 26241111DIST 12 ST ANTHONY PARK 674 943 26241112DIST 13 LEXINGTON HAMLINE 408 601 26241113DIST 14 MACALESTER GROVELAMD 143 200 26241114DIST 15 HIGHLAND PARK 482 697 26241115DIST 16 SUMMIT HILL ASSOC 104 147 26241116DIST 17 CAPITAL RIVER COUNCIL 720 1,347 26241117
Total Spending by Accounting Unit 5,034 200,000 7,603 200,000
164
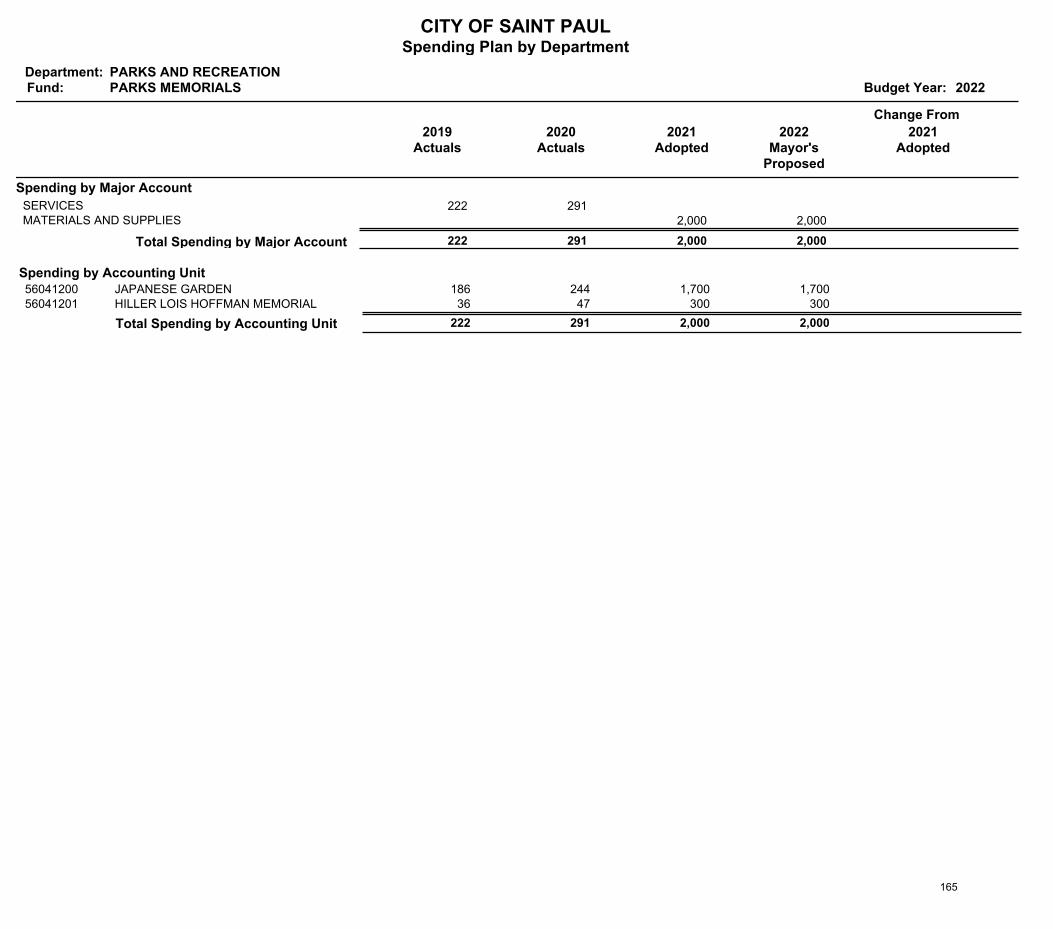
CITY OF SAINT PAULSpending Plan by Department
Department:Fund: Budget Year: 2022
PARKS AND RECREATIONPARKS MEMORIALS
2019Actuals
Change From
2020Actuals
2021Adopted
2022Mayor's
Proposed
2021Adopted
Spending by Major Account
222 291 SERVICES 2,000 2,000 MATERIALS AND SUPPLIES
2,000 2,000 291 222 Total Spending by Major Account
Spending by Accounting UnitJAPANESE GARDEN 186 1,700 1,700 244 56041200HILLER LOIS HOFFMAN MEMORIAL 36 300 300 47 56041201
Total Spending by Accounting Unit 222 2,000 291 2,000
165
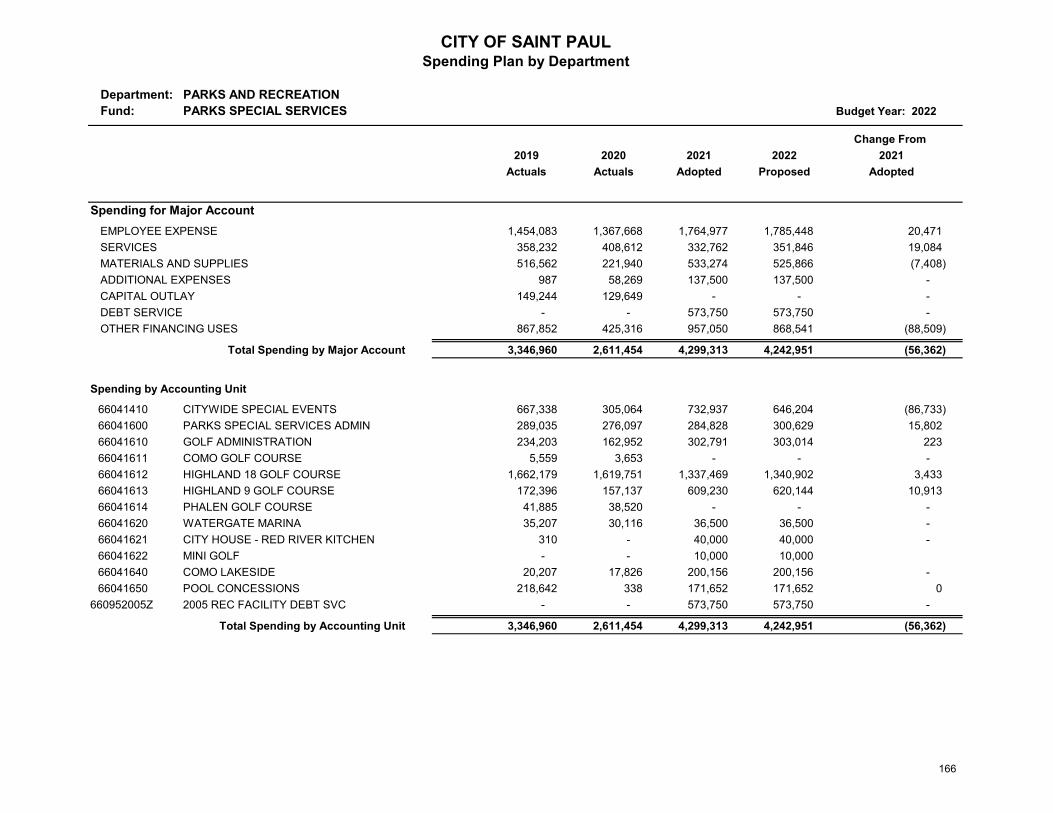
Department: PARKS AND RECREATIONFund: PARKS SPECIAL SERVICES Budget Year: 2022
Change From 2019 2020 2021 2022 2021
Actuals Actuals Adopted Proposed Adopted
Spending for Major AccountEMPLOYEE EXPENSE 1,454,083 1,367,668 1,764,977 1,785,448 20,471 SERVICES 358,232 408,612 332,762 351,846 19,084 MATERIALS AND SUPPLIES 516,562 221,940 533,274 525,866 (7,408) ADDITIONAL EXPENSES 987 58,269 137,500 137,500 - CAPITAL OUTLAY 149,244 129,649 - - - DEBT SERVICE - - 573,750 573,750 - OTHER FINANCING USES 867,852 425,316 957,050 868,541 (88,509)
Total Spending by Major Account 3,346,960 2,611,454 4,299,313 4,242,951 (56,362)
Spending by Accounting Unit
66041410 CITYWIDE SPECIAL EVENTS 667,338 305,064 732,937 646,204 (86,733) 66041600 PARKS SPECIAL SERVICES ADMIN 289,035 276,097 284,828 300,629 15,802 66041610 GOLF ADMINISTRATION 234,203 162,952 302,791 303,014 223 66041611 COMO GOLF COURSE 5,559 3,653 - - - 66041612 HIGHLAND 18 GOLF COURSE 1,662,179 1,619,751 1,337,469 1,340,902 3,433 66041613 HIGHLAND 9 GOLF COURSE 172,396 157,137 609,230 620,144 10,913 66041614 PHALEN GOLF COURSE 41,885 38,520 - - - 66041620 WATERGATE MARINA 35,207 30,116 36,500 36,500 - 66041621 CITY HOUSE - RED RIVER KITCHEN 310 - 40,000 40,000 - 66041622 MINI GOLF - - 10,000 10,000 66041640 COMO LAKESIDE 20,207 17,826 200,156 200,156 - 66041650 POOL CONCESSIONS 218,642 338 171,652 171,652 0
660952005Z 2005 REC FACILITY DEBT SVC - - 573,750 573,750 -
Total Spending by Accounting Unit 3,346,960 2,611,454 4,299,313 4,242,951 (56,362)
CITY OF SAINT PAULSpending Plan by Department
166
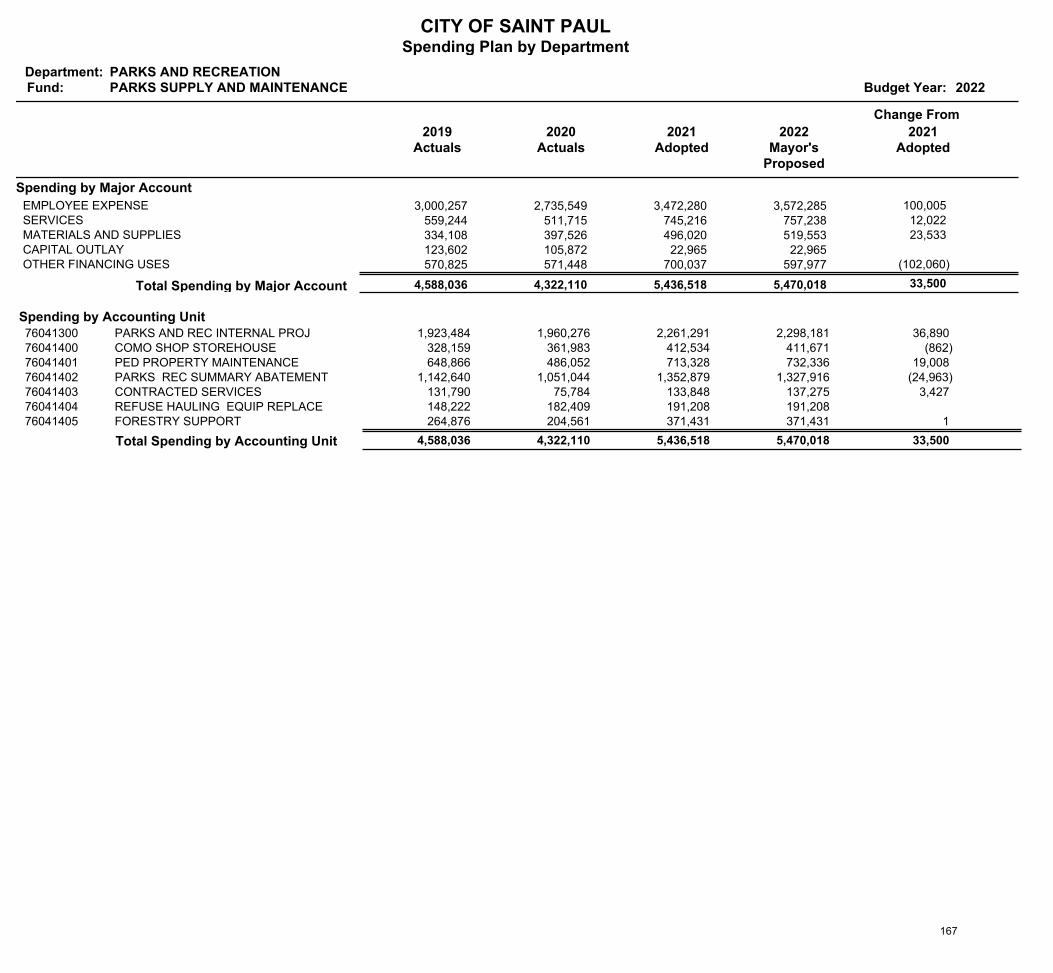
CITY OF SAINT PAULSpending Plan by Department
Department:Fund: Budget Year: 2022
PARKS AND RECREATIONPARKS SUPPLY AND MAINTENANCE
2019Actuals
Change From
2020Actuals
2021Adopted
2022Mayor's
Proposed
2021Adopted
Spending by Major Account
3,000,257 2,735,549 3,472,280 3,572,285 EMPLOYEE EXPENSE 100,005 559,244 511,715 745,216 757,238 SERVICES 12,022 334,108 397,526 496,020 519,553 MATERIALS AND SUPPLIES 23,533 123,602 105,872 22,965 22,965 CAPITAL OUTLAY 570,825 571,448 700,037 597,977 OTHER FINANCING USES (102,060)
33,500 5,470,018 5,436,518 4,322,110 4,588,036 Total Spending by Major Account
Spending by Accounting UnitPARKS AND REC INTERNAL PROJ 1,923,484 2,298,181 2,261,291 1,960,276 76041300 36,890 COMO SHOP STOREHOUSE 328,159 411,671 412,534 361,983 76041400 (862)PED PROPERTY MAINTENANCE 648,866 732,336 713,328 486,052 76041401 19,008 PARKS REC SUMMARY ABATEMENT 1,142,640 1,327,916 1,352,879 1,051,044 76041402 (24,963)CONTRACTED SERVICES 131,790 137,275 133,848 75,784 76041403 3,427 REFUSE HAULING EQUIP REPLACE 148,222 191,208 191,208 182,409 76041404FORESTRY SUPPORT 264,876 371,431 371,431 204,561 76041405 1
Total Spending by Accounting Unit 4,588,036 5,470,018 33,500 4,322,110 5,436,518
167

CITY OF SAINT PAULSpending Plan by Department
Department:Fund: Budget Year: 2022
PARKS AND RECREATIONLOWERTOWN BALLPARK
2019Actuals
Change From
2020Actuals
2021Adopted
2022Mayor's
Proposed
2021Adopted
Spending by Major Account
61,340 30,670 54,526 54,526 SERVICES 560,570 560,621 560,570 559,516 ADDITIONAL EXPENSES (1,054) 292,983 222,174 312,311 313,497 OTHER FINANCING USES 1,186
132 927,539 927,407 813,464 914,893 Total Spending by Major Account
Spending by Accounting UnitBALLPARK OPERATIONS 914,893 927,539 927,407 813,464 26341605 132
Total Spending by Accounting Unit 914,893 927,539 132 813,464 927,407
168

Financing Reports 169
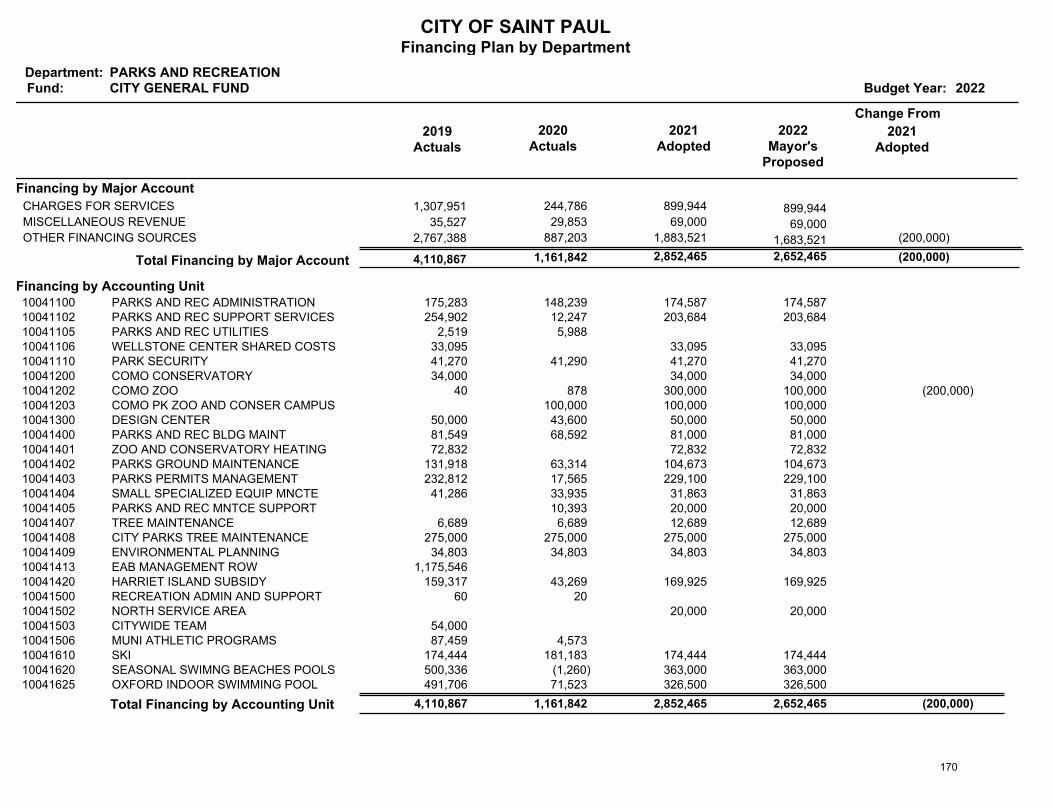
CITY OF SAINT PAULFinancing Plan by Department
Department:Fund: Budget Year: 2022
PARKS AND RECREATIONCITY GENERAL FUND
2019Actuals
Change From
2020Actuals
2021Adopted
2022Mayor's
Proposed
2021Adopted
Financing by Major Account
1,307,951 244,786 899,944 899,944 CHARGES FOR SERVICES
35,527 29,853 69,000 69,000 MISCELLANEOUS REVENUE
2,767,388 887,203 1,883,521 1,683,521 OTHER FINANCING SOURCES (200,000)
(200,000) 2,652,465 2,852,465 1,161,842 4,110,867 Total Financing by Major Account
Financing by Accounting UnitPARKS AND REC ADMINISTRATION 175,283 174,587 174,587 148,239 10041100PARKS AND REC SUPPORT SERVICES 254,902 203,684 203,684 12,247 10041102PARKS AND REC UTILITIES 2,519 5,988 10041105WELLSTONE CENTER SHARED COSTS 33,095 33,095 33,095 10041106PARK SECURITY 41,270 41,270 41,270 41,290 10041110COMO CONSERVATORY 34,000 34,000 34,000 10041200COMO ZOO 40 100,000 300,000 878 10041202 (200,000)COMO PK ZOO AND CONSER CAMPUS 100,000 100,000 100,000 10041203DESIGN CENTER 50,000 50,000 50,000 43,600 10041300PARKS AND REC BLDG MAINT 81,549 81,000 81,000 68,592 10041400ZOO AND CONSERVATORY HEATING 72,832 72,832 72,832 10041401PARKS GROUND MAINTENANCE 131,918 104,673 104,673 63,314 10041402PARKS PERMITS MANAGEMENT 232,812 229,100 229,100 17,565 10041403SMALL SPECIALIZED EQUIP MNCTE 41,286 31,863 31,863 33,935 10041404PARKS AND REC MNTCE SUPPORT 20,000 20,000 10,393 10041405TREE MAINTENANCE 6,689 12,689 12,689 6,689 10041407CITY PARKS TREE MAINTENANCE 275,000 275,000 275,000 275,000 10041408ENVIRONMENTAL PLANNING 34,803 34,803 34,803 34,803 10041409EAB MANAGEMENT ROW 1,175,546 10041413HARRIET ISLAND SUBSIDY 159,317 169,925 169,925 43,269 10041420RECREATION ADMIN AND SUPPORT 60 20 10041500NORTH SERVICE AREA 20,000 20,000 10041502CITYWIDE TEAM 54,000 10041503MUNI ATHLETIC PROGRAMS 87,459 4,573 10041506SKI 174,444 174,444 174,444 181,183 10041610SEASONAL SWIMNG BEACHES POOLS 500,336 363,000 363,000 (1,260)10041620OXFORD INDOOR SWIMMING POOL 491,706 326,500 326,500 71,523 10041625
Total Financing by Accounting Unit 4,110,867 2,652,465 (200,000) 1,161,842 2,852,465
170
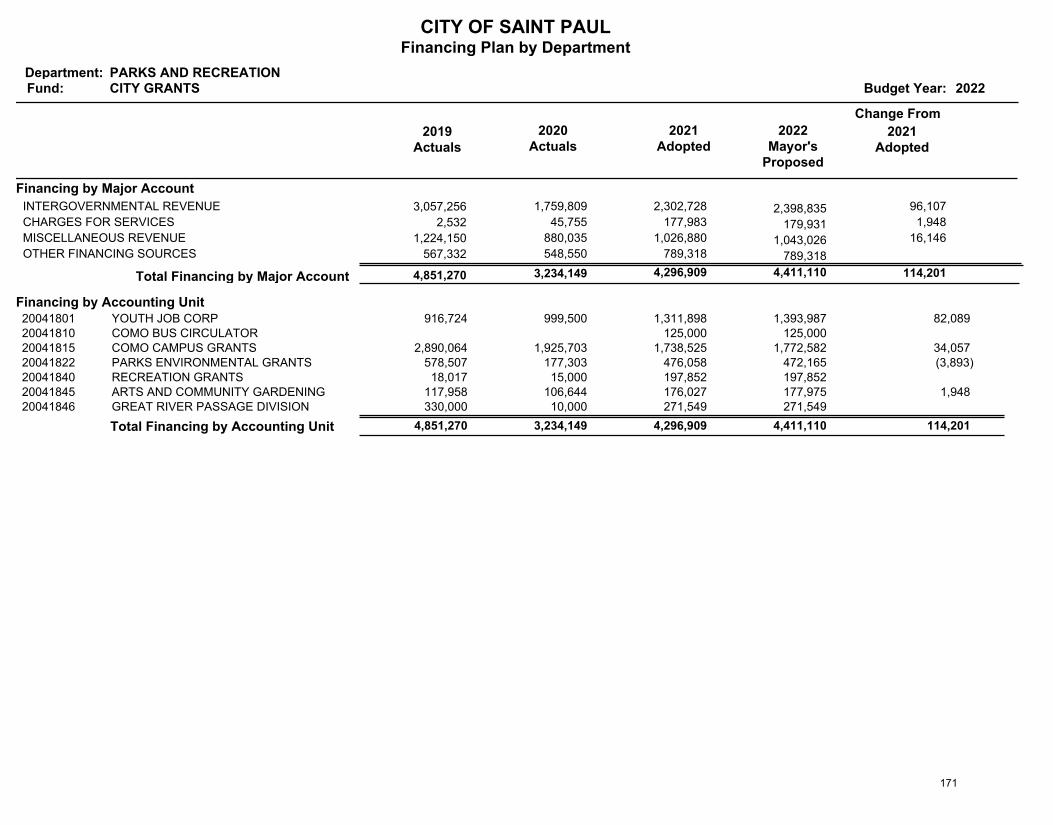
CITY OF SAINT PAULFinancing Plan by Department
Department:Fund: Budget Year: 2022
PARKS AND RECREATIONCITY GRANTS
2019Actuals
Change From
2020Actuals
2021Adopted
2022Mayor's
Proposed
2021Adopted
Financing by Major Account
3,057,256 1,759,809 2,302,728 2,398,835 INTERGOVERNMENTAL REVENUE 96,107
2,532 45,755 177,983 179,931 CHARGES FOR SERVICES 1,948
1,224,150 880,035 1,026,880 1,043,026 MISCELLANEOUS REVENUE 16,146
567,332 548,550 789,318 789,318 OTHER FINANCING SOURCES
114,201 4,411,110 4,296,909 3,234,149 4,851,270 Total Financing by Major Account
Financing by Accounting UnitYOUTH JOB CORP 916,724 1,393,987 1,311,898 999,500 20041801 82,089 COMO BUS CIRCULATOR 125,000 125,000 20041810COMO CAMPUS GRANTS 2,890,064 1,772,582 1,738,525 1,925,703 20041815 34,057 PARKS ENVIRONMENTAL GRANTS 578,507 472,165 476,058 177,303 20041822 (3,893)RECREATION GRANTS 18,017 197,852 197,852 15,000 20041840ARTS AND COMMUNITY GARDENING 117,958 177,975 176,027 106,644 20041845 1,948 GREAT RIVER PASSAGE DIVISION 330,000 271,549 271,549 10,000 20041846
Total Financing by Accounting Unit 4,851,270 4,411,110 114,201 3,234,149 4,296,909
171
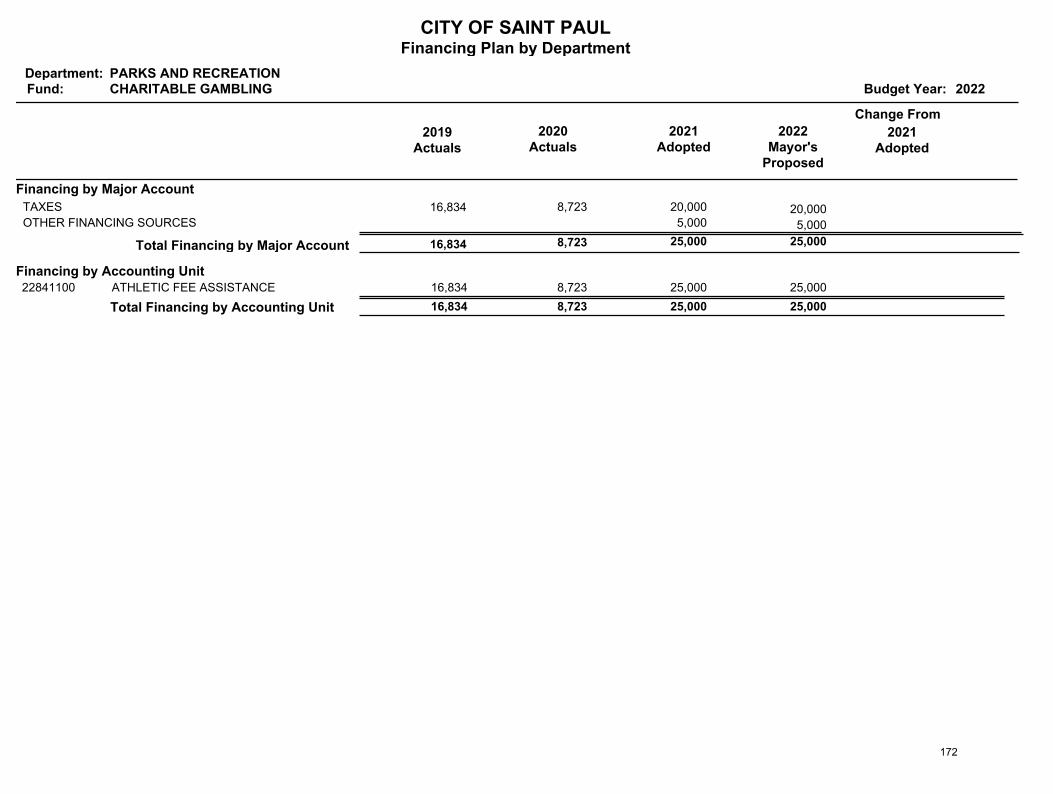
CITY OF SAINT PAULFinancing Plan by Department
Department:Fund: Budget Year: 2022
PARKS AND RECREATIONCHARITABLE GAMBLING
2019Actuals
Change From
2020Actuals
2021Adopted
2022Mayor's
Proposed
2021Adopted
Financing by Major Account
16,834 8,723 20,000 20,000 TAXES
5,000 5,000 OTHER FINANCING SOURCES
25,000 25,000 8,723 16,834 Total Financing by Major Account
Financing by Accounting UnitATHLETIC FEE ASSISTANCE 16,834 25,000 25,000 8,723 22841100
Total Financing by Accounting Unit 16,834 25,000 8,723 25,000
172
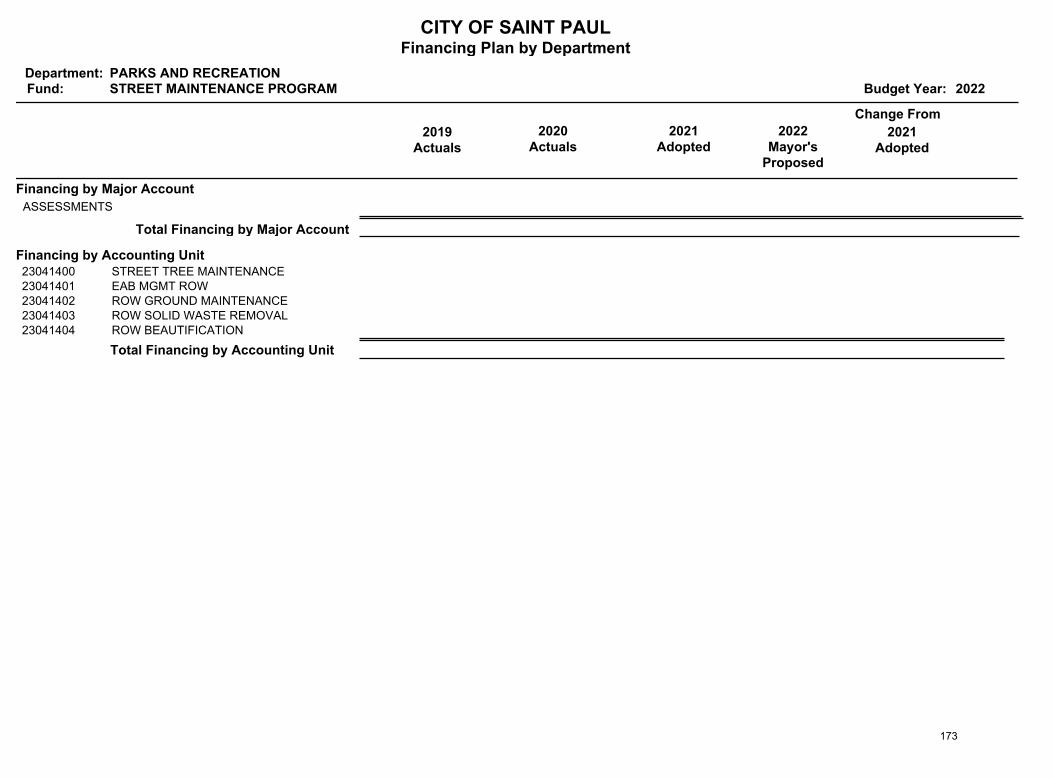
CITY OF SAINT PAULFinancing Plan by Department
Department:Fund: Budget Year: 2022
PARKS AND RECREATIONSTREET MAINTENANCE PROGRAM
2019Actuals
Change From
2020Actuals
2021Adopted
2022Mayor's
Proposed
2021Adopted
Financing by Major Account
ASSESSMENTS
Total Financing by Major Account
Financing by Accounting UnitSTREET TREE MAINTENANCE23041400EAB MGMT ROW23041401ROW GROUND MAINTENANCE23041402ROW SOLID WASTE REMOVAL23041403ROW BEAUTIFICATION23041404
Total Financing by Accounting Unit
173
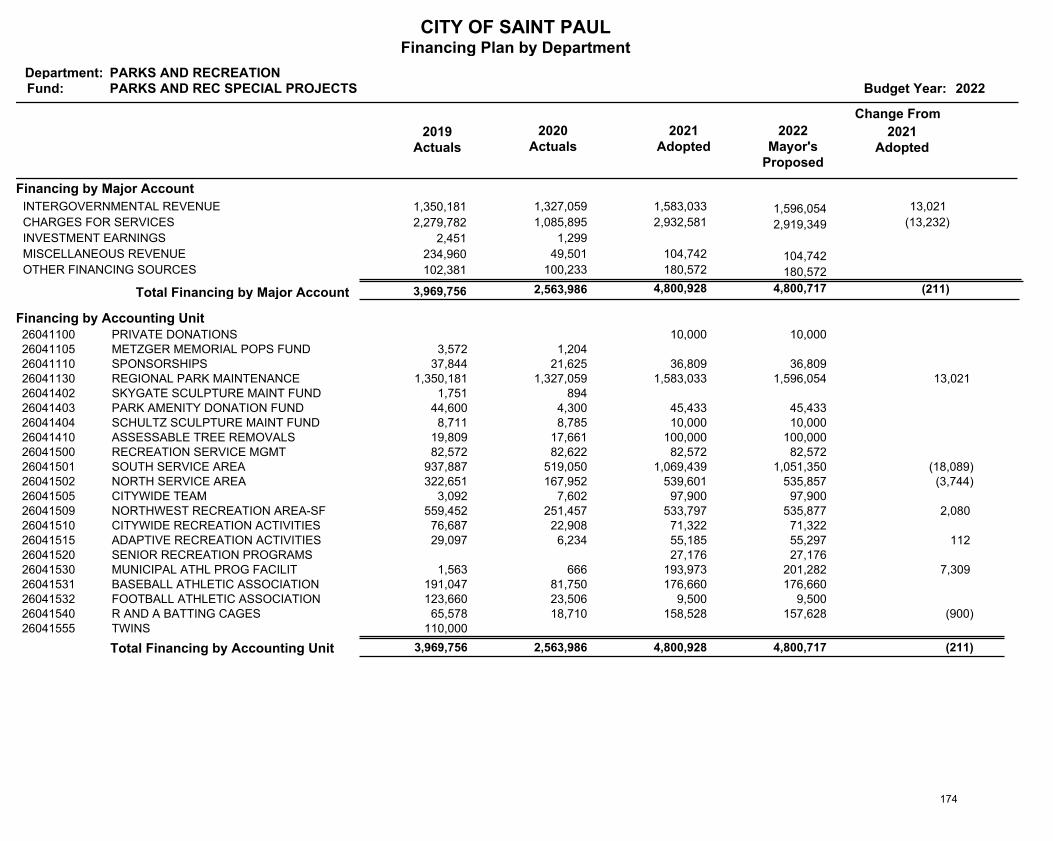
CITY OF SAINT PAULFinancing Plan by Department
Department:Fund: Budget Year: 2022
PARKS AND RECREATIONPARKS AND REC SPECIAL PROJECTS
2019Actuals
Change From
2020Actuals
2021Adopted
2022Mayor's
Proposed
2021Adopted
Financing by Major Account
1,350,181 1,327,059 1,583,033 1,596,054 INTERGOVERNMENTAL REVENUE 13,021
2,279,782 1,085,895 2,932,581 2,919,349 CHARGES FOR SERVICES (13,232)
2,451 1,299 INVESTMENT EARNINGS
234,960 49,501 104,742 104,742 MISCELLANEOUS REVENUE
102,381 100,233 180,572 180,572 OTHER FINANCING SOURCES
(211) 4,800,717 4,800,928 2,563,986 3,969,756 Total Financing by Major Account
Financing by Accounting UnitPRIVATE DONATIONS 10,000 10,000 26041100METZGER MEMORIAL POPS FUND 3,572 1,204 26041105SPONSORSHIPS 37,844 36,809 36,809 21,625 26041110REGIONAL PARK MAINTENANCE 1,350,181 1,596,054 1,583,033 1,327,059 26041130 13,021 SKYGATE SCULPTURE MAINT FUND 1,751 894 26041402PARK AMENITY DONATION FUND 44,600 45,433 45,433 4,300 26041403SCHULTZ SCULPTURE MAINT FUND 8,711 10,000 10,000 8,785 26041404ASSESSABLE TREE REMOVALS 19,809 100,000 100,000 17,661 26041410RECREATION SERVICE MGMT 82,572 82,572 82,572 82,622 26041500SOUTH SERVICE AREA 937,887 1,051,350 1,069,439 519,050 26041501 (18,089)NORTH SERVICE AREA 322,651 535,857 539,601 167,952 26041502 (3,744)CITYWIDE TEAM 3,092 97,900 97,900 7,602 26041505NORTHWEST RECREATION AREA-SF 559,452 535,877 533,797 251,457 26041509 2,080 CITYWIDE RECREATION ACTIVITIES 76,687 71,322 71,322 22,908 26041510ADAPTIVE RECREATION ACTIVITIES 29,097 55,297 55,185 6,234 26041515 112 SENIOR RECREATION PROGRAMS 27,176 27,176 26041520MUNICIPAL ATHL PROG FACILIT 1,563 201,282 193,973 666 26041530 7,309 BASEBALL ATHLETIC ASSOCIATION 191,047 176,660 176,660 81,750 26041531FOOTBALL ATHLETIC ASSOCIATION 123,660 9,500 9,500 23,506 26041532R AND A BATTING CAGES 65,578 157,628 158,528 18,710 26041540 (900)TWINS 110,000 26041555
Total Financing by Accounting Unit 3,969,756 4,800,717 (211) 2,563,986 4,800,928
174
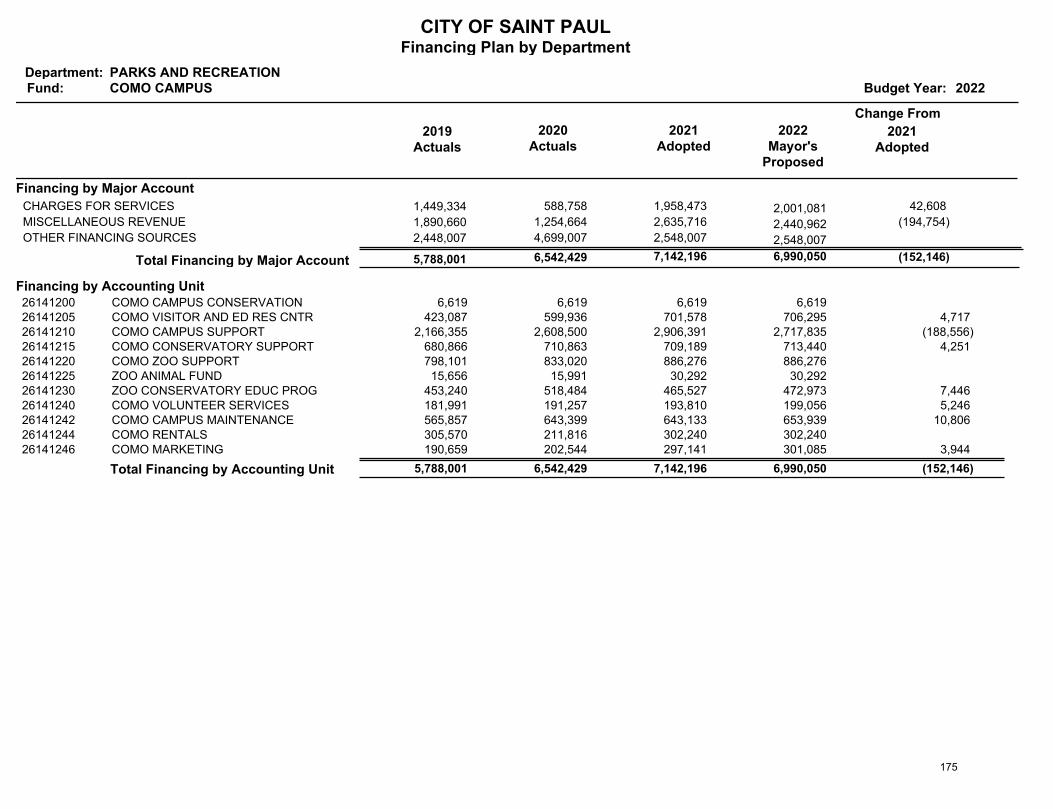
CITY OF SAINT PAULFinancing Plan by Department
Department:Fund: Budget Year: 2022
PARKS AND RECREATIONCOMO CAMPUS
2019Actuals
Change From
2020Actuals
2021Adopted
2022Mayor's
Proposed
2021Adopted
Financing by Major Account
1,449,334 588,758 1,958,473 2,001,081 CHARGES FOR SERVICES 42,608
1,890,660 1,254,664 2,635,716 2,440,962 MISCELLANEOUS REVENUE (194,754)
2,448,007 4,699,007 2,548,007 2,548,007 OTHER FINANCING SOURCES
(152,146) 6,990,050 7,142,196 6,542,429 5,788,001 Total Financing by Major Account
Financing by Accounting UnitCOMO CAMPUS CONSERVATION 6,619 6,619 6,619 6,619 26141200COMO VISITOR AND ED RES CNTR 423,087 706,295 701,578 599,936 26141205 4,717 COMO CAMPUS SUPPORT 2,166,355 2,717,835 2,906,391 2,608,500 26141210 (188,556)COMO CONSERVATORY SUPPORT 680,866 713,440 709,189 710,863 26141215 4,251 COMO ZOO SUPPORT 798,101 886,276 886,276 833,020 26141220ZOO ANIMAL FUND 15,656 30,292 30,292 15,991 26141225ZOO CONSERVATORY EDUC PROG 453,240 472,973 465,527 518,484 26141230 7,446 COMO VOLUNTEER SERVICES 181,991 199,056 193,810 191,257 26141240 5,246 COMO CAMPUS MAINTENANCE 565,857 653,939 643,133 643,399 26141242 10,806 COMO RENTALS 305,570 302,240 302,240 211,816 26141244COMO MARKETING 190,659 301,085 297,141 202,544 26141246 3,944
Total Financing by Accounting Unit 5,788,001 6,990,050 (152,146) 6,542,429 7,142,196
175
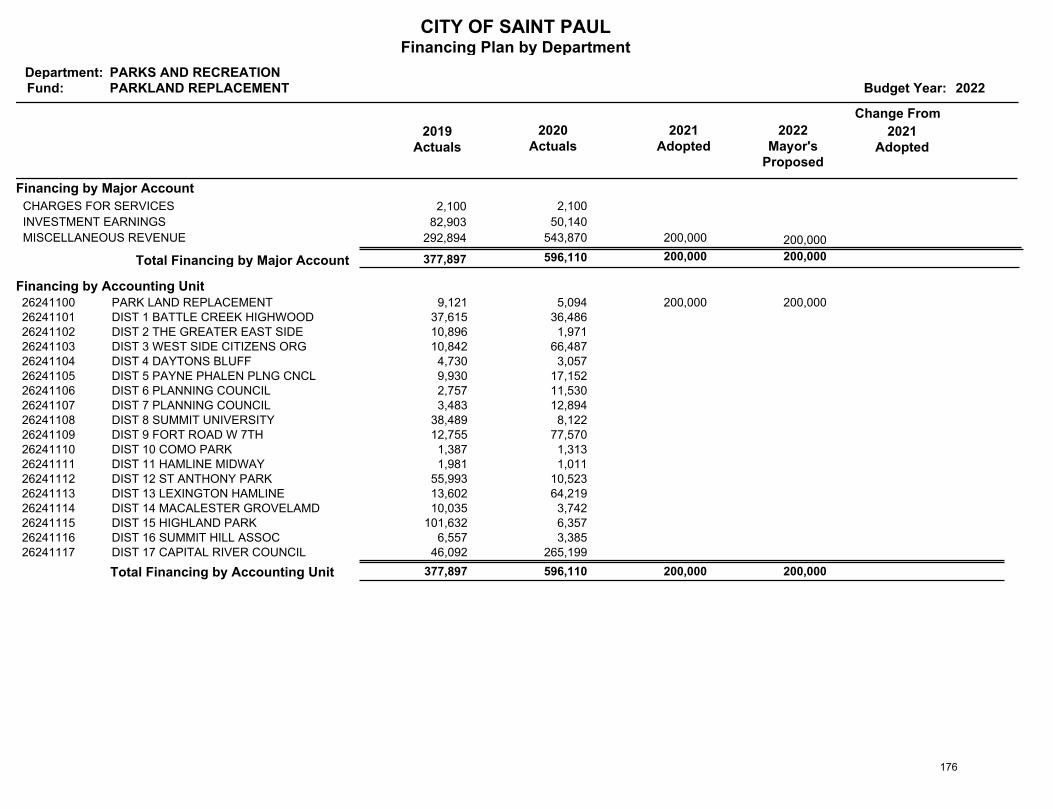
CITY OF SAINT PAULFinancing Plan by Department
Department:Fund: Budget Year: 2022
PARKS AND RECREATIONPARKLAND REPLACEMENT
2019Actuals
Change From
2020Actuals
2021Adopted
2022Mayor's
Proposed
2021Adopted
Financing by Major Account
2,100 2,100 CHARGES FOR SERVICES
82,903 50,140 INVESTMENT EARNINGS
292,894 543,870 200,000 200,000 MISCELLANEOUS REVENUE
200,000 200,000 596,110 377,897 Total Financing by Major Account
Financing by Accounting UnitPARK LAND REPLACEMENT 9,121 200,000 200,000 5,094 26241100DIST 1 BATTLE CREEK HIGHWOOD 37,615 36,486 26241101DIST 2 THE GREATER EAST SIDE 10,896 1,971 26241102DIST 3 WEST SIDE CITIZENS ORG 10,842 66,487 26241103DIST 4 DAYTONS BLUFF 4,730 3,057 26241104DIST 5 PAYNE PHALEN PLNG CNCL 9,930 17,152 26241105DIST 6 PLANNING COUNCIL 2,757 11,530 26241106DIST 7 PLANNING COUNCIL 3,483 12,894 26241107DIST 8 SUMMIT UNIVERSITY 38,489 8,122 26241108DIST 9 FORT ROAD W 7TH 12,755 77,570 26241109DIST 10 COMO PARK 1,387 1,313 26241110DIST 11 HAMLINE MIDWAY 1,981 1,011 26241111DIST 12 ST ANTHONY PARK 55,993 10,523 26241112DIST 13 LEXINGTON HAMLINE 13,602 64,219 26241113DIST 14 MACALESTER GROVELAMD 10,035 3,742 26241114DIST 15 HIGHLAND PARK 101,632 6,357 26241115DIST 16 SUMMIT HILL ASSOC 6,557 3,385 26241116DIST 17 CAPITAL RIVER COUNCIL 46,092 265,199 26241117
Total Financing by Accounting Unit 377,897 200,000 596,110 200,000
176
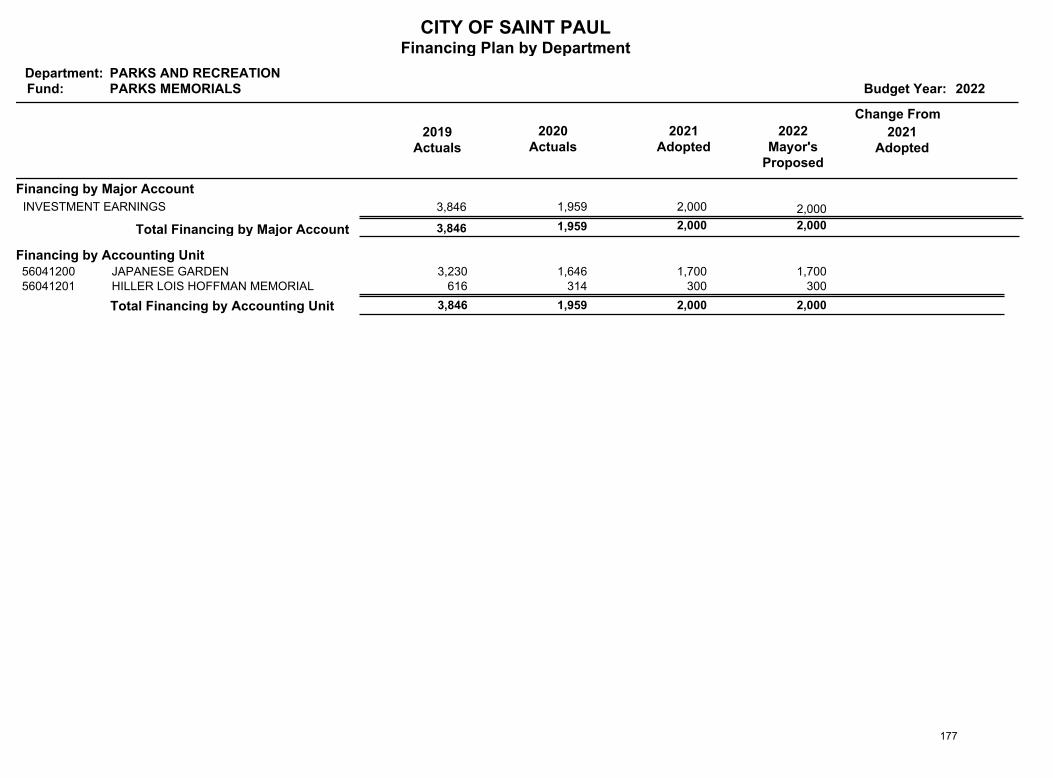
CITY OF SAINT PAULFinancing Plan by Department
Department:Fund: Budget Year: 2022
PARKS AND RECREATIONPARKS MEMORIALS
2019Actuals
Change From
2020Actuals
2021Adopted
2022Mayor's
Proposed
2021Adopted
Financing by Major Account
3,846 1,959 2,000 2,000 INVESTMENT EARNINGS
2,000 2,000 1,959 3,846 Total Financing by Major Account
Financing by Accounting UnitJAPANESE GARDEN 3,230 1,700 1,700 1,646 56041200HILLER LOIS HOFFMAN MEMORIAL 616 300 300 314 56041201
Total Financing by Accounting Unit 3,846 2,000 1,959 2,000
177
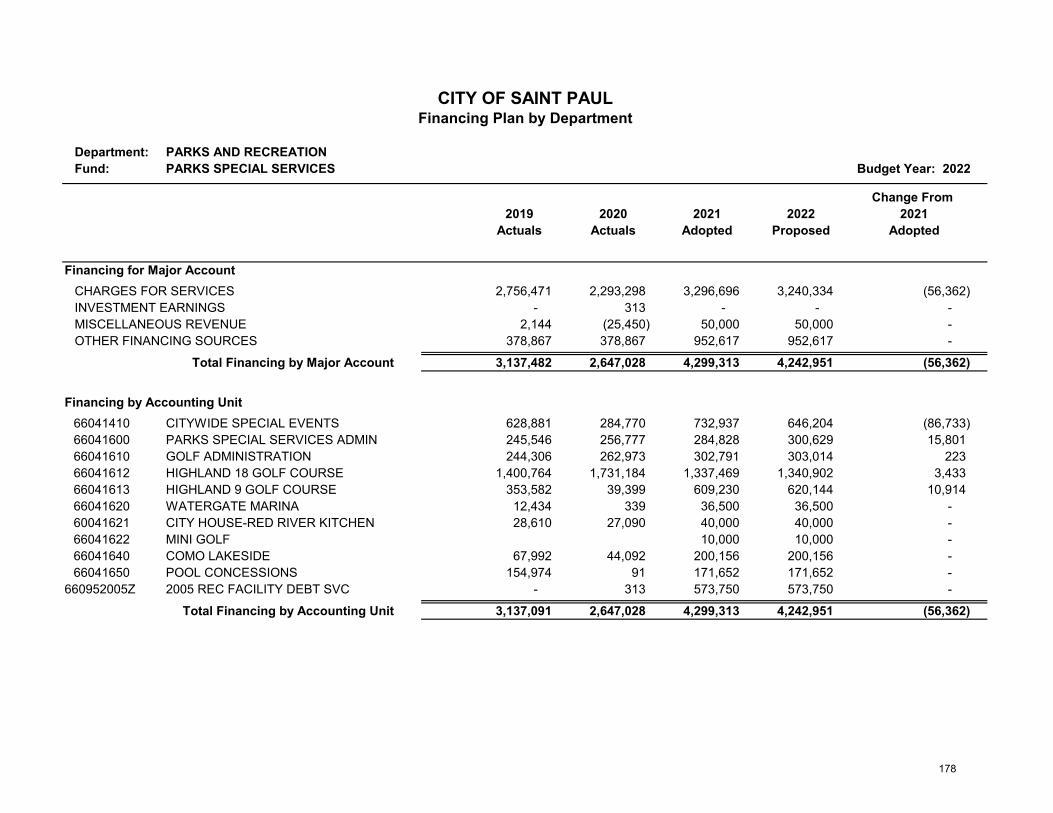
Department: PARKS AND RECREATIONFund: PARKS SPECIAL SERVICES Budget Year: 2022
Change From 2019 2020 2021 2022 2021
Actuals Actuals Adopted Proposed Adopted
Financing for Major AccountCHARGES FOR SERVICES 2,756,471 2,293,298 3,296,696 3,240,334 (56,362) INVESTMENT EARNINGS - 313 - - - MISCELLANEOUS REVENUE 2,144 (25,450) 50,000 50,000 - OTHER FINANCING SOURCES 378,867 378,867 952,617 952,617 -
Total Financing by Major Account 3,137,482 2,647,028 4,299,313 4,242,951 (56,362)
Financing by Accounting Unit66041410 CITYWIDE SPECIAL EVENTS 628,881 284,770 732,937 646,204 (86,733) 66041600 PARKS SPECIAL SERVICES ADMIN 245,546 256,777 284,828 300,629 15,801 66041610 GOLF ADMINISTRATION 244,306 262,973 302,791 303,014 223 66041612 HIGHLAND 18 GOLF COURSE 1,400,764 1,731,184 1,337,469 1,340,902 3,433 66041613 HIGHLAND 9 GOLF COURSE 353,582 39,399 609,230 620,144 10,914 66041620 WATERGATE MARINA 12,434 339 36,500 36,500 - 60041621 CITY HOUSE-RED RIVER KITCHEN 28,610 27,090 40,000 40,000 - 66041622 MINI GOLF 10,000 10,000 - 66041640 COMO LAKESIDE 67,992 44,092 200,156 200,156 - 66041650 POOL CONCESSIONS 154,974 91 171,652 171,652 -
660952005Z 2005 REC FACILITY DEBT SVC - 313 573,750 573,750 -
Total Financing by Accounting Unit 3,137,091 2,647,028 4,299,313 4,242,951 (56,362)
CITY OF SAINT PAULFinancing Plan by Department
178
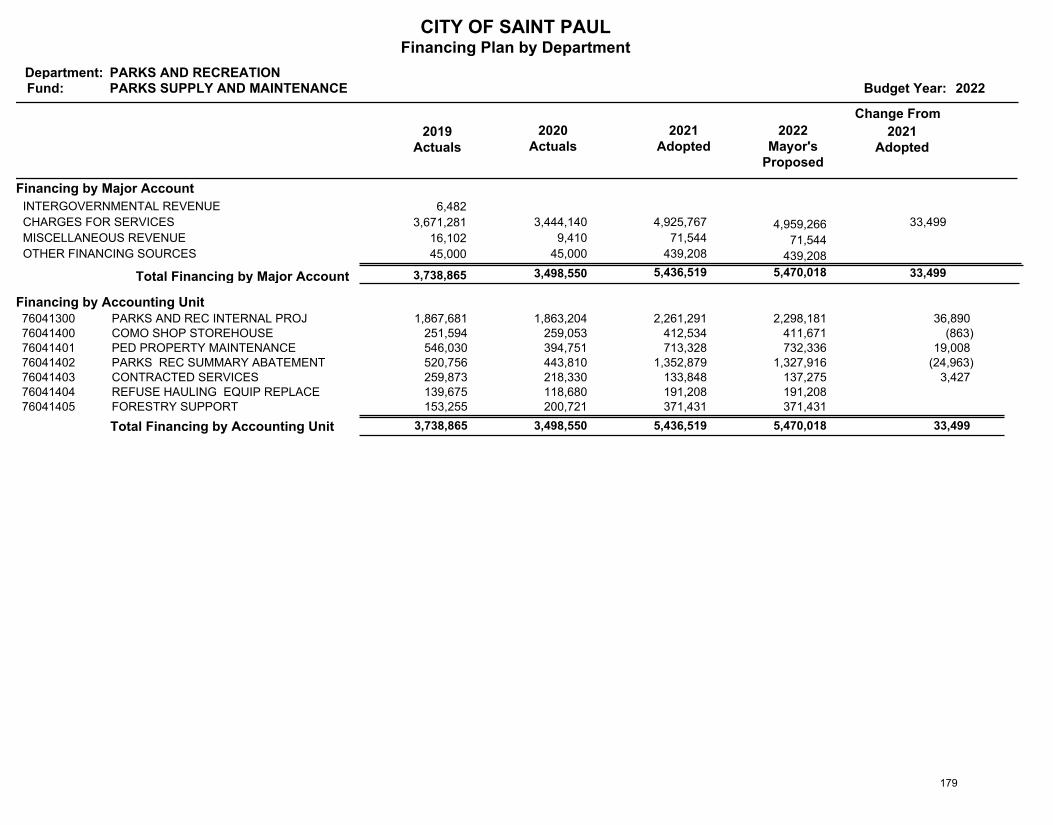
CITY OF SAINT PAULFinancing Plan by Department
Department:Fund: Budget Year: 2022
PARKS AND RECREATIONPARKS SUPPLY AND MAINTENANCE
2019Actuals
Change From
2020Actuals
2021Adopted
2022Mayor's
Proposed
2021Adopted
Financing by Major Account
6,482 INTERGOVERNMENTAL REVENUE
3,671,281 3,444,140 4,925,767 4,959,266 CHARGES FOR SERVICES 33,499
16,102 9,410 71,544 71,544 MISCELLANEOUS REVENUE
45,000 45,000 439,208 439,208 OTHER FINANCING SOURCES
33,499 5,470,018 5,436,519 3,498,550 3,738,865 Total Financing by Major Account
Financing by Accounting UnitPARKS AND REC INTERNAL PROJ 1,867,681 2,298,181 2,261,291 1,863,204 76041300 36,890 COMO SHOP STOREHOUSE 251,594 411,671 412,534 259,053 76041400 (863)PED PROPERTY MAINTENANCE 546,030 732,336 713,328 394,751 76041401 19,008 PARKS REC SUMMARY ABATEMENT 520,756 1,327,916 1,352,879 443,810 76041402 (24,963)CONTRACTED SERVICES 259,873 137,275 133,848 218,330 76041403 3,427 REFUSE HAULING EQUIP REPLACE 139,675 191,208 191,208 118,680 76041404FORESTRY SUPPORT 153,255 371,431 371,431 200,721 76041405
Total Financing by Accounting Unit 3,738,865 5,470,018 33,499 3,498,550 5,436,519
179
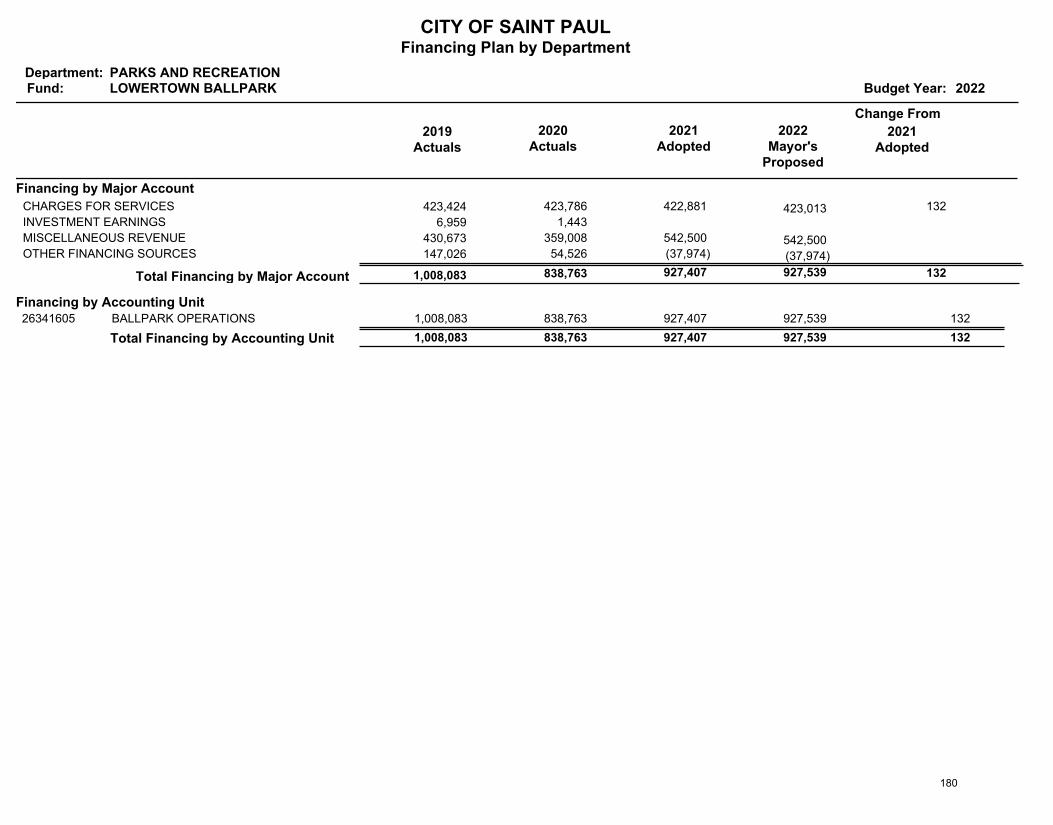
CITY OF SAINT PAULFinancing Plan by Department
Department:Fund: Budget Year: 2022
PARKS AND RECREATIONLOWERTOWN BALLPARK
2019Actuals
Change From
2020Actuals
2021Adopted
2022Mayor's
Proposed
2021Adopted
Financing by Major Account
423,424 423,786 422,881 423,013 CHARGES FOR SERVICES 132
6,959 1,443 INVESTMENT EARNINGS
430,673 359,008 542,500 542,500 MISCELLANEOUS REVENUE
147,026 54,526 (37,974) (37,974)OTHER FINANCING SOURCES
132 927,539 927,407 838,763 1,008,083 Total Financing by Major Account
Financing by Accounting UnitBALLPARK OPERATIONS 1,008,083 927,539 927,407 838,763 26341605 132
Total Financing by Accounting Unit 1,008,083 927,539 132 838,763 927,407
180
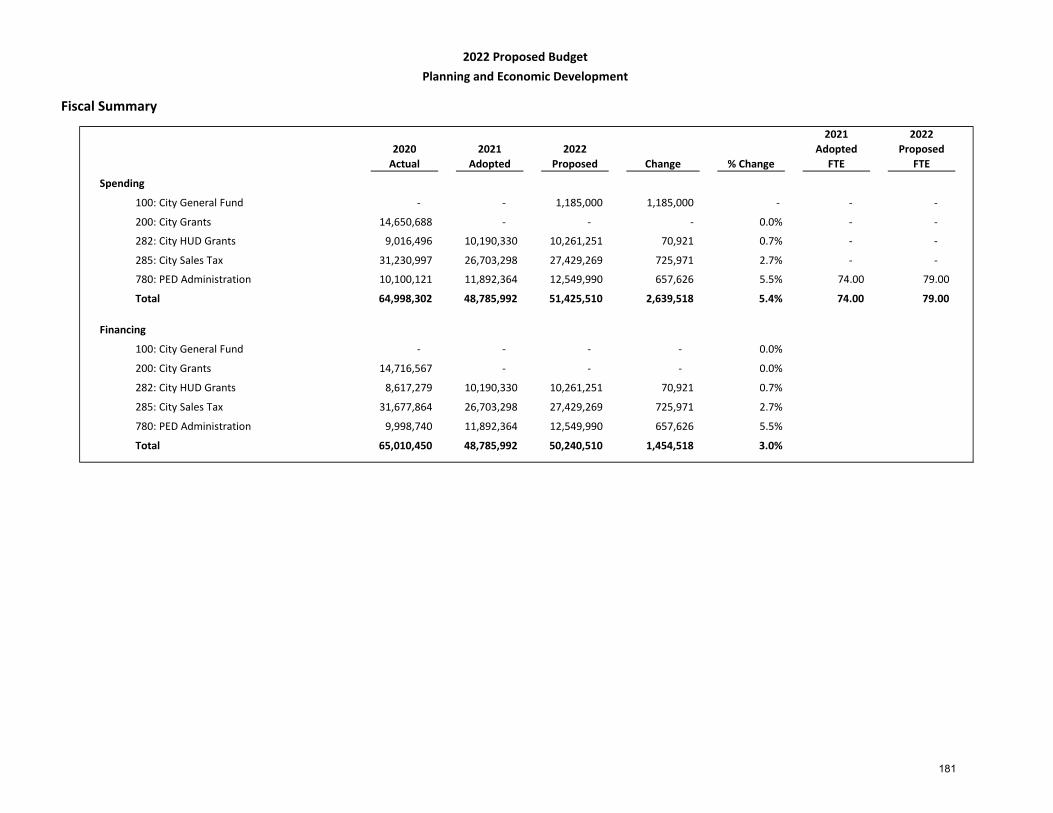
Fiscal Summary
2020Actual
2021Adopted
2022 Proposed Change % Change
2021Adopted
FTE
2022 Proposed
FTE
Spending
100: City General Fund - - 1,185,000 1,185,000 - - -
14,650,688 - - - 0.0% - -
9,016,496 10,190,330 10,261,251 70,921 0.7% - -
31,230,997 26,703,298 27,429,269 725,971 2.7% - -
780: PED Administration 10,100,121 11,892,364 12,549,990 657,626 5.5% 74.00 79.00
64,998,302 48,785,992 51,425,510 2,639,518 5.4% 74.00 79.00
Financing
100: City General Fund - - - - 0.0%
14,716,567 - - - 0.0%
8,617,279 10,190,330 10,261,251 70,921 0.7%
31,677,864 26,703,298 27,429,269 725,971 2.7%
9,998,740 11,892,364 12,549,990 657,626 5.5%
65,010,450 48,785,992 50,240,510 1,454,518 3.0%
2022 Proposed BudgetPlanning and Economic Development
285: City Sales Tax
282: City HUD Grants
200: City Grants
282: City HUD Grants
285: City Sales Tax
200: City Grants
780: PED Administration
Total
Total
181
Budget Changes Summary
The 2022 Planning and Economic Development (PED) proposed General Fund budget adds $500,000 to pay for PED staff time. The proposed budget also adds $600,000 of General Fund support for programs in the HRA Housing Trust Fund. Finally, the PED proposed General Fund budget adds $85,000 for a contract to perform building-energy benchmarking.
The PED Administration Fund proposed budget adds back $95,000 for membership dues to the Greater MSP and East Metro Strong organizations. The PED Administration budget also adds 5 FTEs. 2 positions that were cut in 2021 are restored, a Loan Servicing and Real Estate Supervisor and a Grants Manager. 2 FTEs are added to the Housing team, a Multifamily Team Lead and a Loan Specialist Assistant. Additionally, a Supervisor of Rehabilitation position on the Housing team is reclassified to serve as the Single Family Team Lead. Finally, the Executive Project Lead for Redevelopment is moved from the General Professional Services account to an FTE in the budget.
The 2022 proposed budget also includes adjustments to the Sales Tax Revitalization (STAR) program. The forecast for sales tax revenue in 2022 is increased by $625,000 due to the increased spending and improvement in the economy in 2021. The 2022 projection estimates lower revenue than was received in 2019 and accounts for the possibility of continued impacts of the COVID-19 pandemic. Due to the increase in revenue, the budget for the Neighborhood STAR program is increased by $388,695 and the Cultural STAR budget is increased by $271,025 in 2022. Additionally, the budget to offset COVID-related revenue losses for the RiverCentre Convention and Visitors Authority is reduced from $956,000 in 2021 to $750,000 in 2022 to account for projected continuing but less severe revenue impacts due to COVID-19 in 2022. Finally, the Public Works Pedestrian Safety budget is reduced by $82,401 in the 2022 proposed STAR budget.
ARP Funding: PED’s budget includes ARP administrative staff (1 FTE) each year for the term of the grant. The FTE counts and budgets on these pages do not include this funding: please see the American Rescue Plan Act State and Local Fiscal Recovery Funds section for additional information.
In the 2022 Housing and Redevelopment Authority proposed budget, the HRA levy is increased by 13% which results in an additional $643,069 of projected revenue. Additionally, $600,000 from the Housing Trust Fund (HTF) will be used for a program to support low-income homeowners. The City General Fund will provide $600,000 of ongoing support for other critical affordable housing needs. NOTE: The HRA budget is not part of the City of Saint Paul's budget. Please reference the proposed budget of the Housing and Redevelopment Authority of the City of Saint Paul for more information.
182

Spending Reports 183
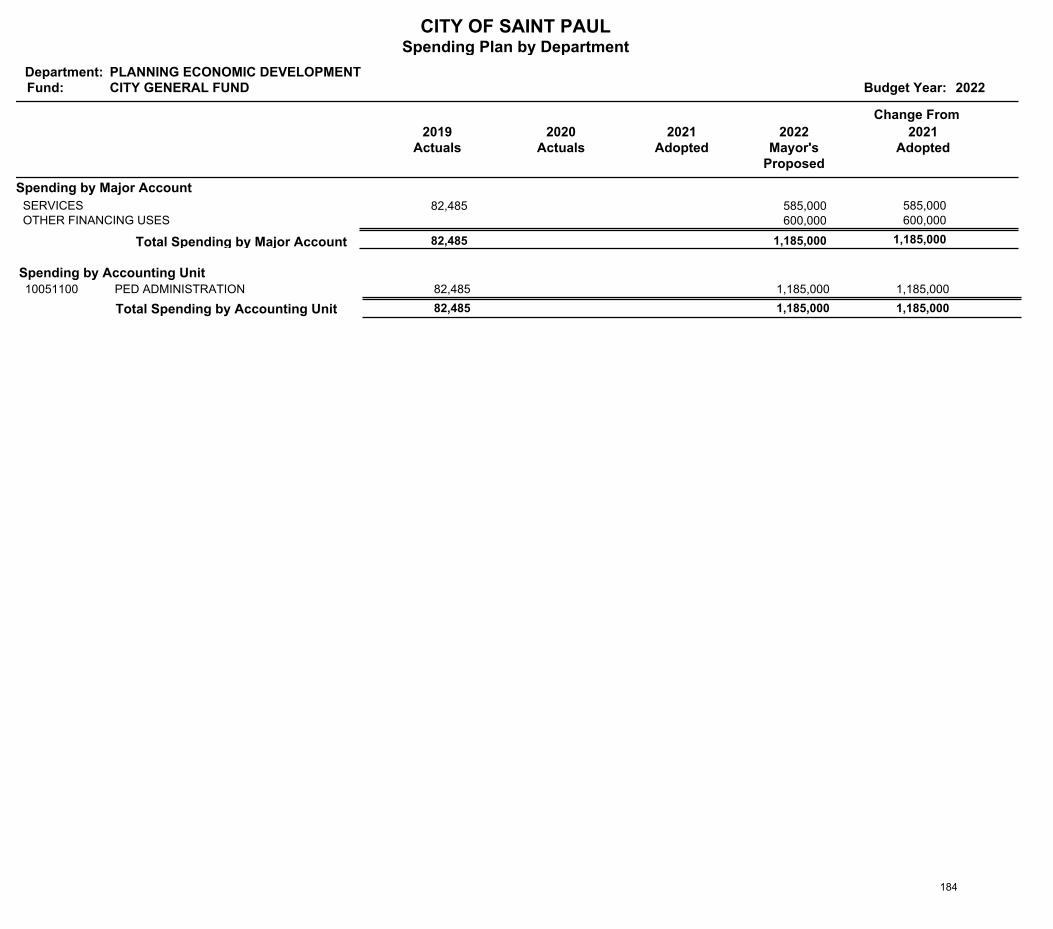
CITY OF SAINT PAULSpending Plan by Department
Department:Fund: Budget Year: 2022
PLANNING ECONOMIC DEVELOPMENTCITY GENERAL FUND
2019Actuals
Change From
2020Actuals
2021Adopted
2022Mayor's
Proposed
2021Adopted
Spending by Major Account
82,485 585,000 SERVICES 585,000 600,000 OTHER FINANCING USES 600,000
1,185,000 1,185,000 82,485 Total Spending by Major Account
Spending by Accounting UnitPED ADMINISTRATION 82,485 1,185,000 10051100 1,185,000
Total Spending by Accounting Unit 82,485 1,185,000 1,185,000
184
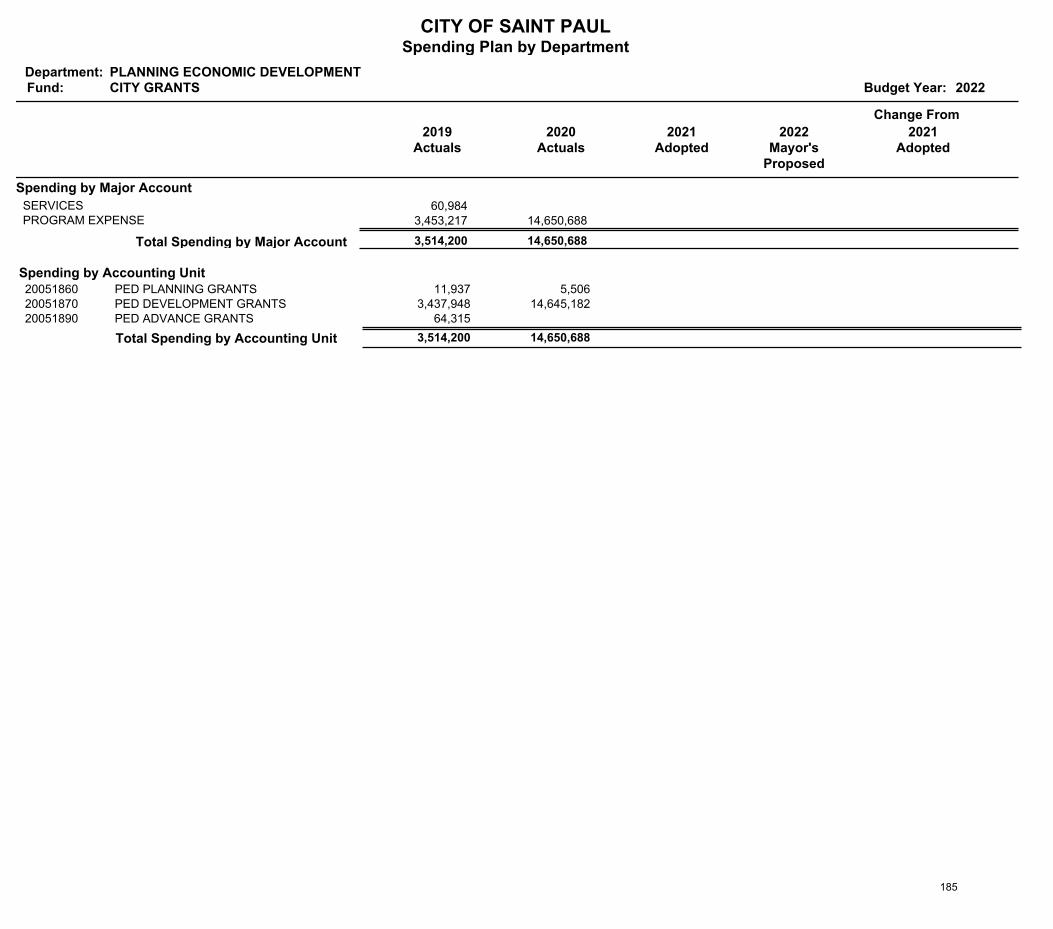
CITY OF SAINT PAULSpending Plan by Department
Department:Fund: Budget Year: 2022
PLANNING ECONOMIC DEVELOPMENTCITY GRANTS
2019Actuals
Change From
2020Actuals
2021Adopted
2022Mayor's
Proposed
2021Adopted
Spending by Major Account
60,984 SERVICES 3,453,217 14,650,688 PROGRAM EXPENSE
14,650,688 3,514,200 Total Spending by Major Account
Spending by Accounting UnitPED PLANNING GRANTS 11,937 5,506 20051860PED DEVELOPMENT GRANTS 3,437,948 14,645,182 20051870PED ADVANCE GRANTS 64,315 20051890
Total Spending by Accounting Unit 3,514,200 14,650,688
185
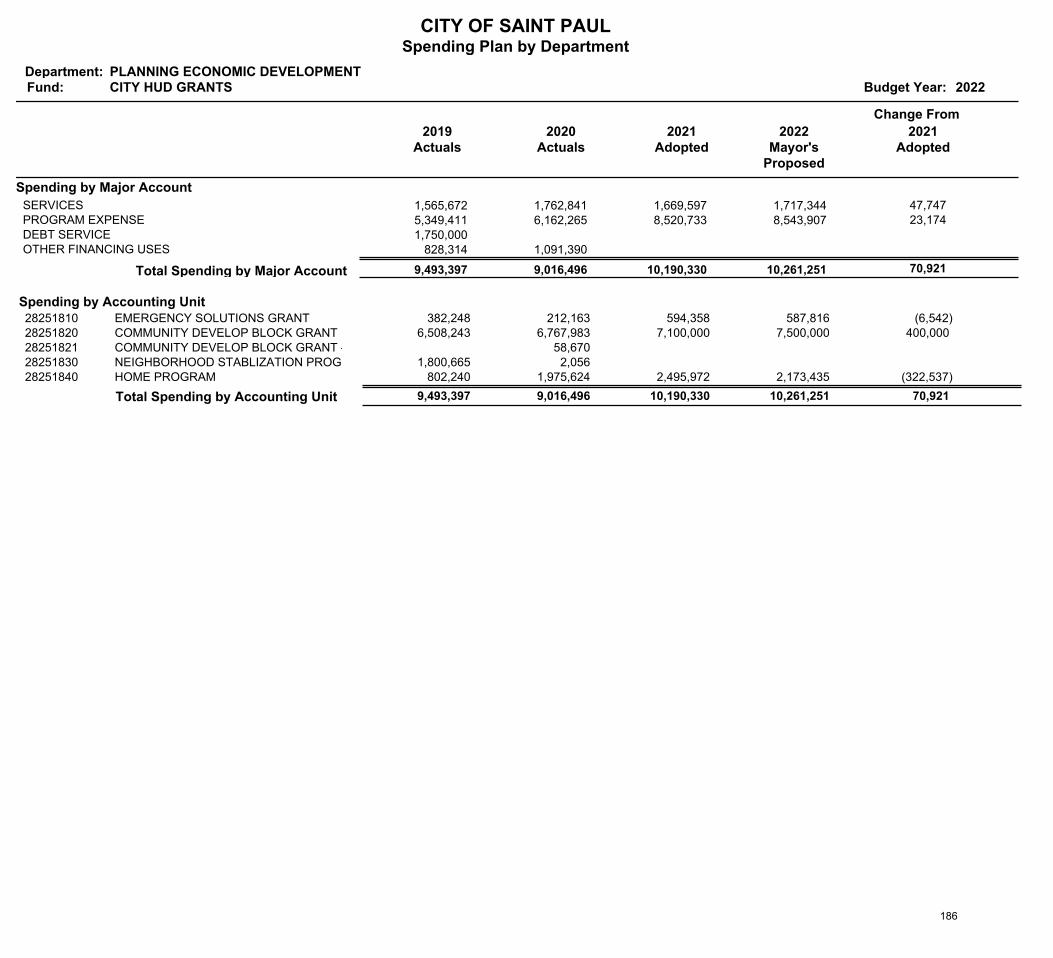
CITY OF SAINT PAULSpending Plan by Department
Department:Fund: Budget Year: 2022
PLANNING ECONOMIC DEVELOPMENTCITY HUD GRANTS
2019Actuals
Change From
2020Actuals
2021Adopted
2022Mayor's
Proposed
2021Adopted
Spending by Major Account
1,565,672 1,762,841 1,669,597 1,717,344 SERVICES 47,747 5,349,411 6,162,265 8,520,733 8,543,907 PROGRAM EXPENSE 23,174 1,750,000 DEBT SERVICE
828,314 1,091,390 OTHER FINANCING USES
70,921 10,261,251 10,190,330 9,016,496 9,493,397 Total Spending by Major Account
Spending by Accounting UnitEMERGENCY SOLUTIONS GRANT 382,248 587,816 594,358 212,163 28251810 (6,542)COMMUNITY DEVELOP BLOCK GRANT 6,508,243 7,500,000 7,100,000 6,767,983 28251820 400,000 COMMUNITY DEVELOP BLOCK GRANT - CV 58,670 28251821NEIGHBORHOOD STABLIZATION PROG 1,800,665 2,056 28251830HOME PROGRAM 802,240 2,173,435 2,495,972 1,975,624 28251840 (322,537)
Total Spending by Accounting Unit 9,493,397 10,261,251 70,921 9,016,496 10,190,330
186

CITY OF SAINT PAULSpending Plan by Department
Department:Fund: Budget Year: 2022
PLANNING ECONOMIC DEVELOPMENTCITY SALES TAX
2019Actuals
Change From
2020Actuals
2021Adopted
2022Mayor's
Proposed
2021Adopted
Spending by Major Account
436,361 448,033 572,401 340,000 SERVICES (232,401) 4,894,720 4,195,352 2,430,897 2,689,269 PROGRAM EXPENSE 258,372
27,373,703 26,587,612 23,700,000 24,400,000 OTHER FINANCING USES 700,000
725,971 27,429,269 26,703,298 31,230,997 32,704,785 Total Spending by Major Account
Spending by Accounting UnitCITY SALES TAX REVENUE 19,557,706 17,500,000 16,875,000 18,261,802 28551100 625,000 NEIGHBORHOOD STAR PROGRAM 6,329,138 5,054,269 5,141,922 6,641,767 28551200 (87,653)CITY CAPITAL FUNDING 1,525,000 1,525,000 1,525,000 1,525,000 28551220HOUSING TRUST 85,764 264,072 28551240CULTURAL STAR PROGRAM 1,889,177 1,750,000 1,478,975 2,306,845 28551300 271,025 PAY GO ECON DEVELOPMENT 3,318,000 1,600,000 1,682,401 2,231,510 28551400 (82,401)
Total Spending by Accounting Unit 32,704,785 27,429,269 725,971 31,230,997 26,703,298
187
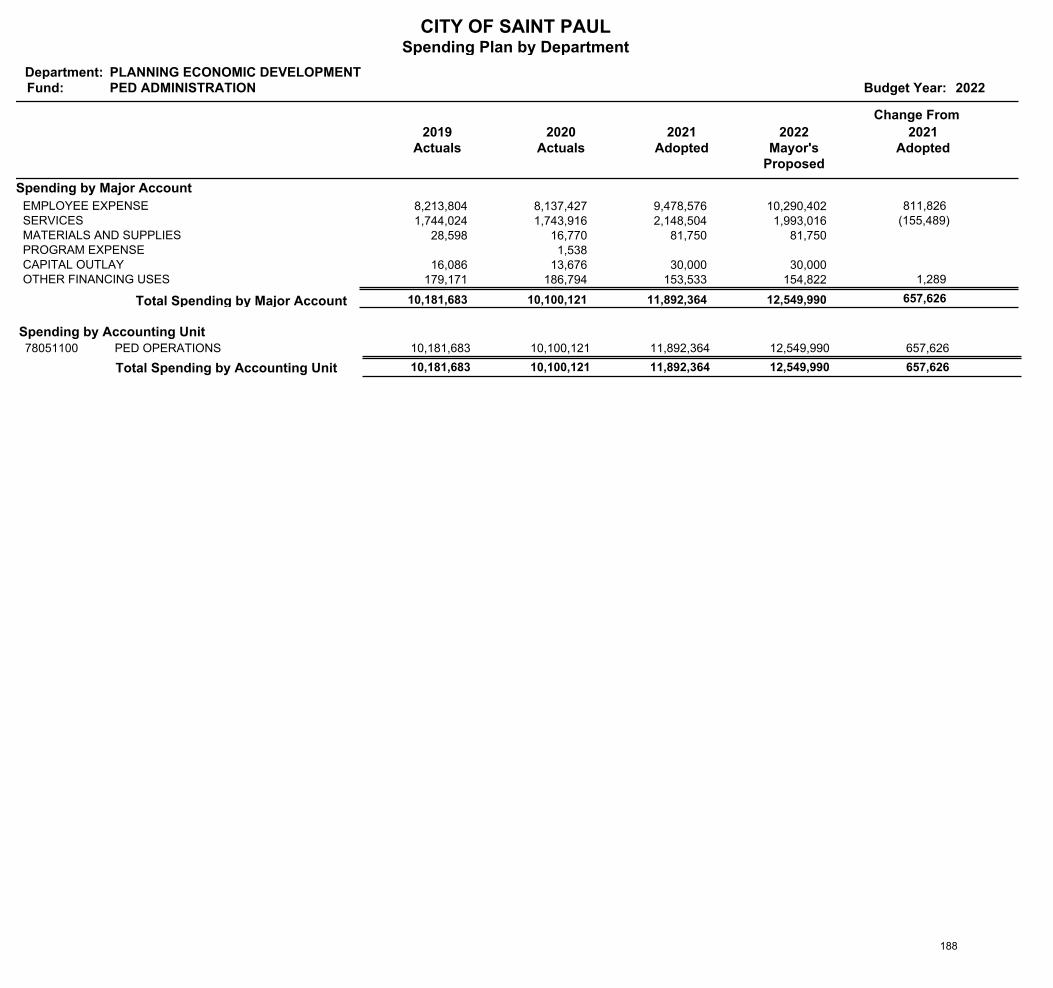
CITY OF SAINT PAULSpending Plan by Department
Department:Fund: Budget Year: 2022
PLANNING ECONOMIC DEVELOPMENTPED ADMINISTRATION
2019Actuals
Change From
2020Actuals
2021Adopted
2022Mayor's
Proposed
2021Adopted
Spending by Major Account
8,213,804 8,137,427 9,478,576 10,290,402 EMPLOYEE EXPENSE 811,826 1,744,024 1,743,916 2,148,504 1,993,016 SERVICES (155,489)
28,598 16,770 81,750 81,750 MATERIALS AND SUPPLIES 1,538 PROGRAM EXPENSE
16,086 13,676 30,000 30,000 CAPITAL OUTLAY 179,171 186,794 153,533 154,822 OTHER FINANCING USES 1,289
657,626 12,549,990 11,892,364 10,100,121 10,181,683 Total Spending by Major Account
Spending by Accounting UnitPED OPERATIONS 10,181,683 12,549,990 11,892,364 10,100,121 78051100 657,626
Total Spending by Accounting Unit 10,181,683 12,549,990 657,626 10,100,121 11,892,364
188

Financing Reports 189
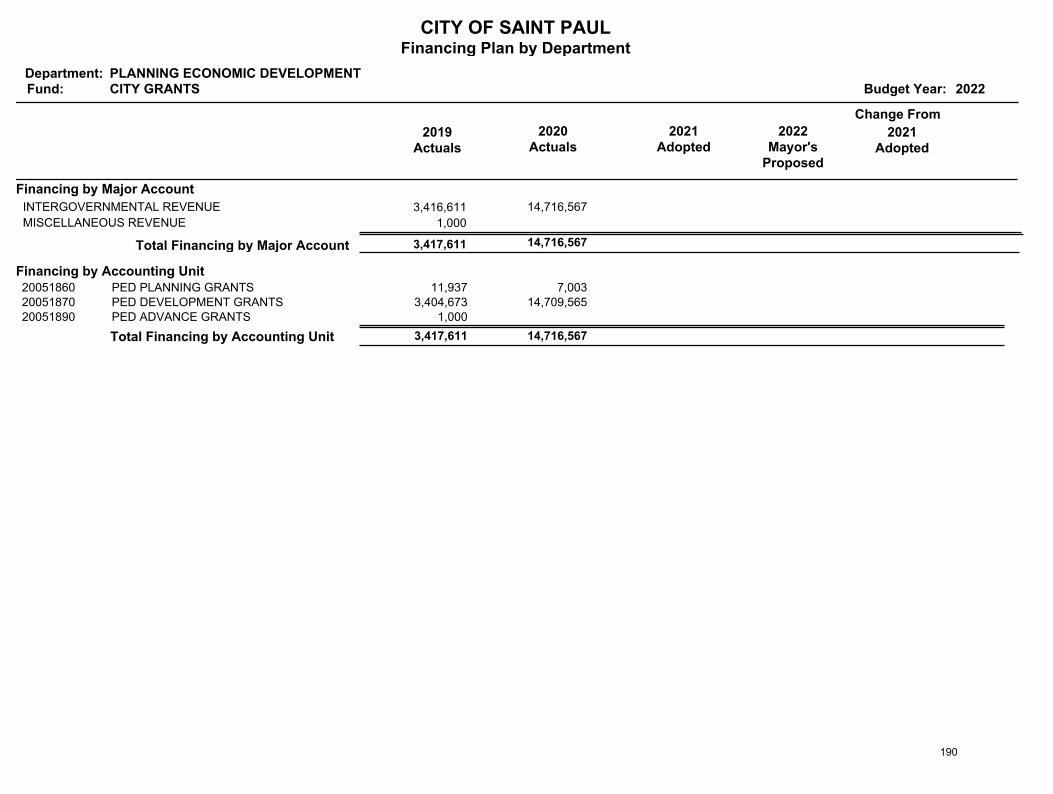
CITY OF SAINT PAULFinancing Plan by Department
Department:Fund: Budget Year: 2022
PLANNING ECONOMIC DEVELOPMENTCITY GRANTS
2019Actuals
Change From
2020Actuals
2021Adopted
2022Mayor's
Proposed
2021Adopted
Financing by Major Account
3,416,611 14,716,567 INTERGOVERNMENTAL REVENUE
1,000 MISCELLANEOUS REVENUE
14,716,567 3,417,611 Total Financing by Major Account
Financing by Accounting UnitPED PLANNING GRANTS 11,937 7,003 20051860PED DEVELOPMENT GRANTS 3,404,673 14,709,565 20051870PED ADVANCE GRANTS 1,000 20051890
Total Financing by Accounting Unit 3,417,611 14,716,567
190
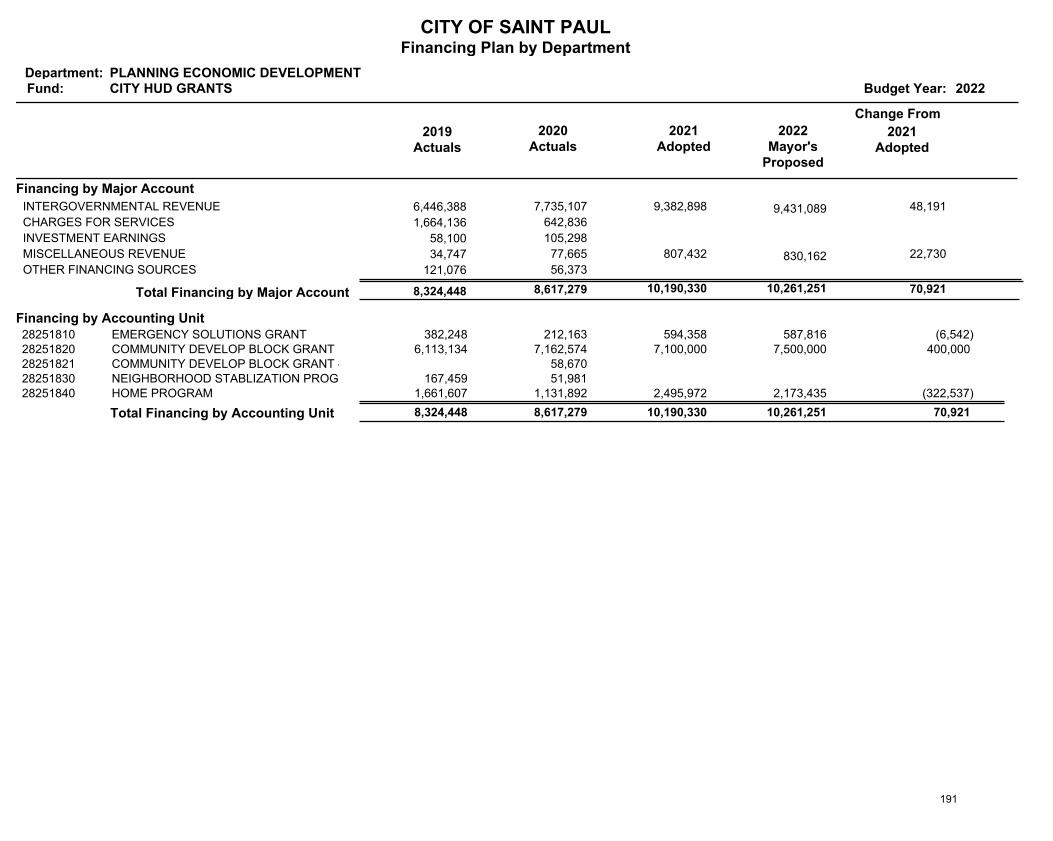
CITY OF SAINT PAULFinancing Plan by Department
Department:Fund: Budget Year: 2022
PLANNING ECONOMIC DEVELOPMENTCITY HUD GRANTS
2019Actuals
Change From
2020Actuals
2021Adopted
2022Mayor's
Proposed
2021Adopted
Financing by Major Account
6,446,388 7,735,107 9,382,898 9,431,089 INTERGOVERNMENTAL REVENUE 48,191
1,664,136 642,836 CHARGES FOR SERVICES
58,100 105,298 INVESTMENT EARNINGS
34,747 77,665 807,432 830,162 MISCELLANEOUS REVENUE 22,730
121,076 56,373 OTHER FINANCING SOURCES
70,921 10,261,251 10,190,330 8,617,279 8,324,448 Total Financing by Major Account
Financing by Accounting UnitEMERGENCY SOLUTIONS GRANT 382,248 587,816 594,358 212,163 28251810 (6,542)COMMUNITY DEVELOP BLOCK GRANT 6,113,134 7,500,000 7,100,000 7,162,574 28251820 400,000 COMMUNITY DEVELOP BLOCK GRANT - CV 58,670 28251821NEIGHBORHOOD STABLIZATION PROG 167,459 51,981 28251830HOME PROGRAM 1,661,607 2,173,435 2,495,972 1,131,892 28251840 (322,537)
Total Financing by Accounting Unit 8,324,448 10,261,251 70,921 8,617,279 10,190,330
191
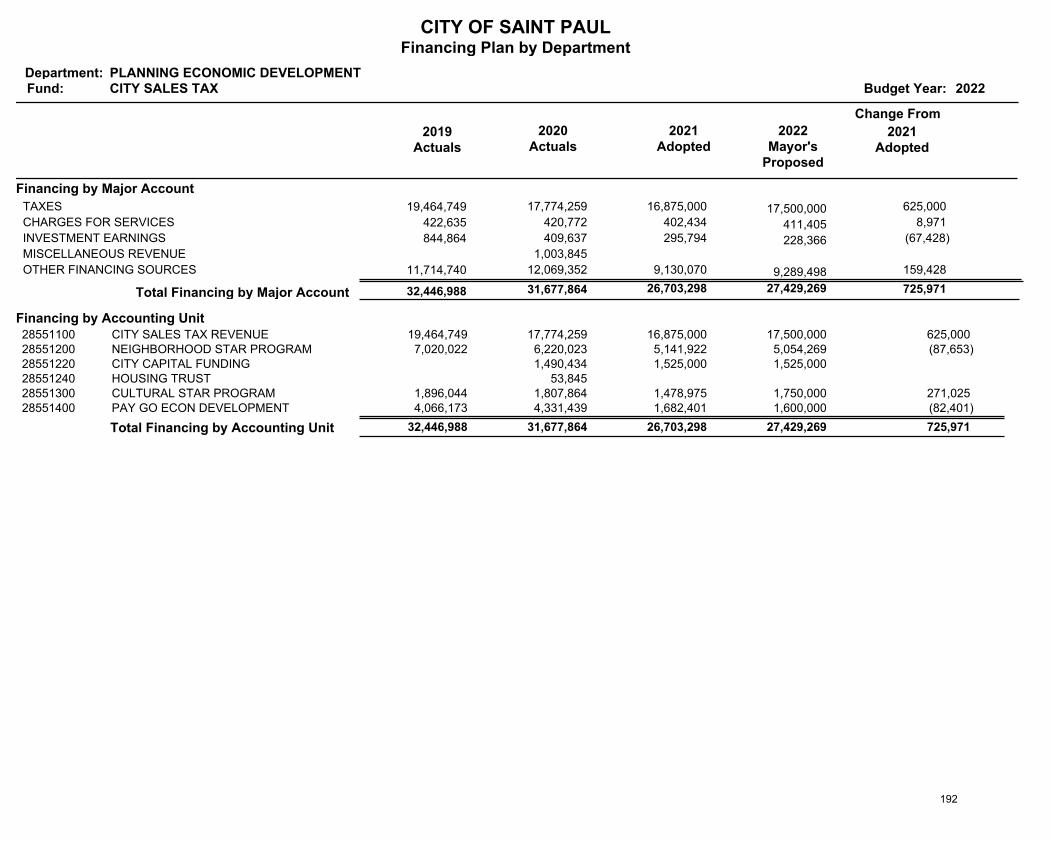
CITY OF SAINT PAULFinancing Plan by Department
Department:Fund: Budget Year: 2022
PLANNING ECONOMIC DEVELOPMENTCITY SALES TAX
2019Actuals
Change From
2020Actuals
2021Adopted
2022Mayor's
Proposed
2021Adopted
Financing by Major Account
19,464,749 17,774,259 16,875,000 17,500,000 TAXES 625,000
422,635 420,772 402,434 411,405 CHARGES FOR SERVICES 8,971
844,864 409,637 295,794 228,366 INVESTMENT EARNINGS (67,428)
1,003,845 MISCELLANEOUS REVENUE
11,714,740 12,069,352 9,130,070 9,289,498 OTHER FINANCING SOURCES 159,428
725,971 27,429,269 26,703,298 31,677,864 32,446,988 Total Financing by Major Account
Financing by Accounting UnitCITY SALES TAX REVENUE 19,464,749 17,500,000 16,875,000 17,774,259 28551100 625,000 NEIGHBORHOOD STAR PROGRAM 7,020,022 5,054,269 5,141,922 6,220,023 28551200 (87,653)CITY CAPITAL FUNDING 1,525,000 1,525,000 1,490,434 28551220HOUSING TRUST 53,845 28551240CULTURAL STAR PROGRAM 1,896,044 1,750,000 1,478,975 1,807,864 28551300 271,025 PAY GO ECON DEVELOPMENT 4,066,173 1,600,000 1,682,401 4,331,439 28551400 (82,401)
Total Financing by Accounting Unit 32,446,988 27,429,269 725,971 31,677,864 26,703,298
192
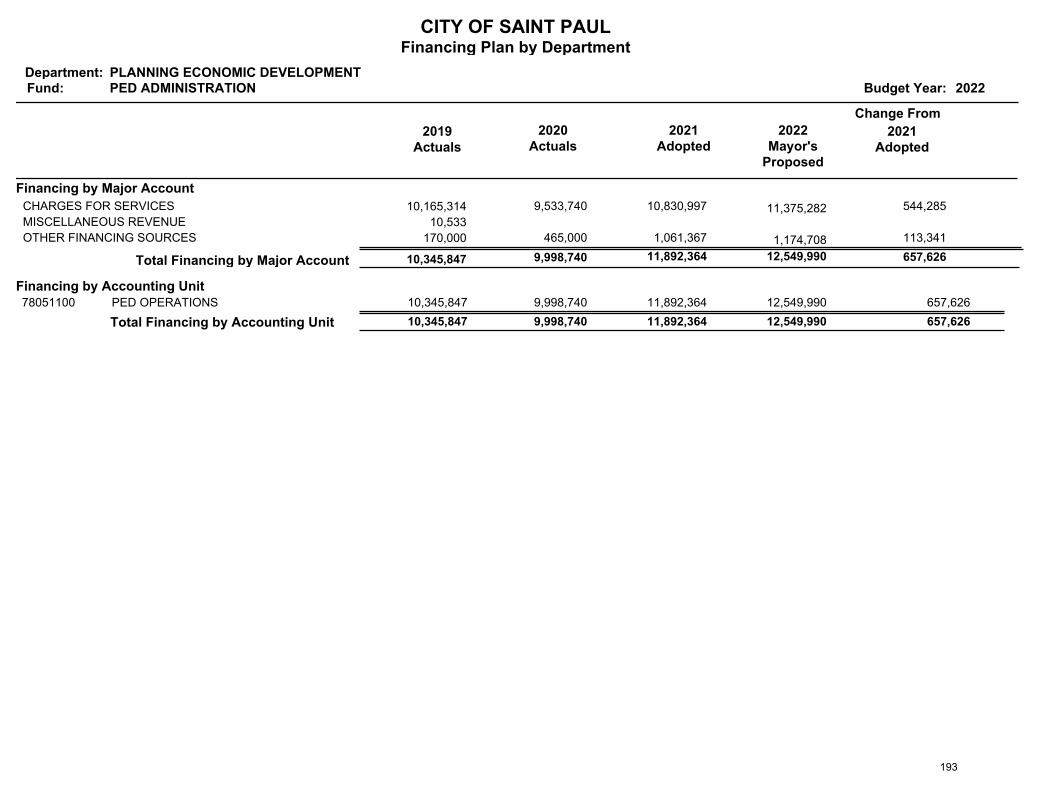
CITY OF SAINT PAULFinancing Plan by Department
Department:Fund: Budget Year: 2022
PLANNING ECONOMIC DEVELOPMENTPED ADMINISTRATION
2019Actuals
Change From
2020Actuals
2021Adopted
2022Mayor's
Proposed
2021Adopted
Financing by Major Account
10,165,314 9,533,740 10,830,997 11,375,282 CHARGES FOR SERVICES 544,285
10,533 MISCELLANEOUS REVENUE
170,000 465,000 1,061,367 1,174,708 OTHER FINANCING SOURCES 113,341
657,626 12,549,990 11,892,364 9,998,740 10,345,847 Total Financing by Major Account
Financing by Accounting UnitPED OPERATIONS 10,345,847 12,549,990 11,892,364 9,998,740 78051100 657,626
Total Financing by Accounting Unit 10,345,847 12,549,990 657,626 9,998,740 11,892,364
193
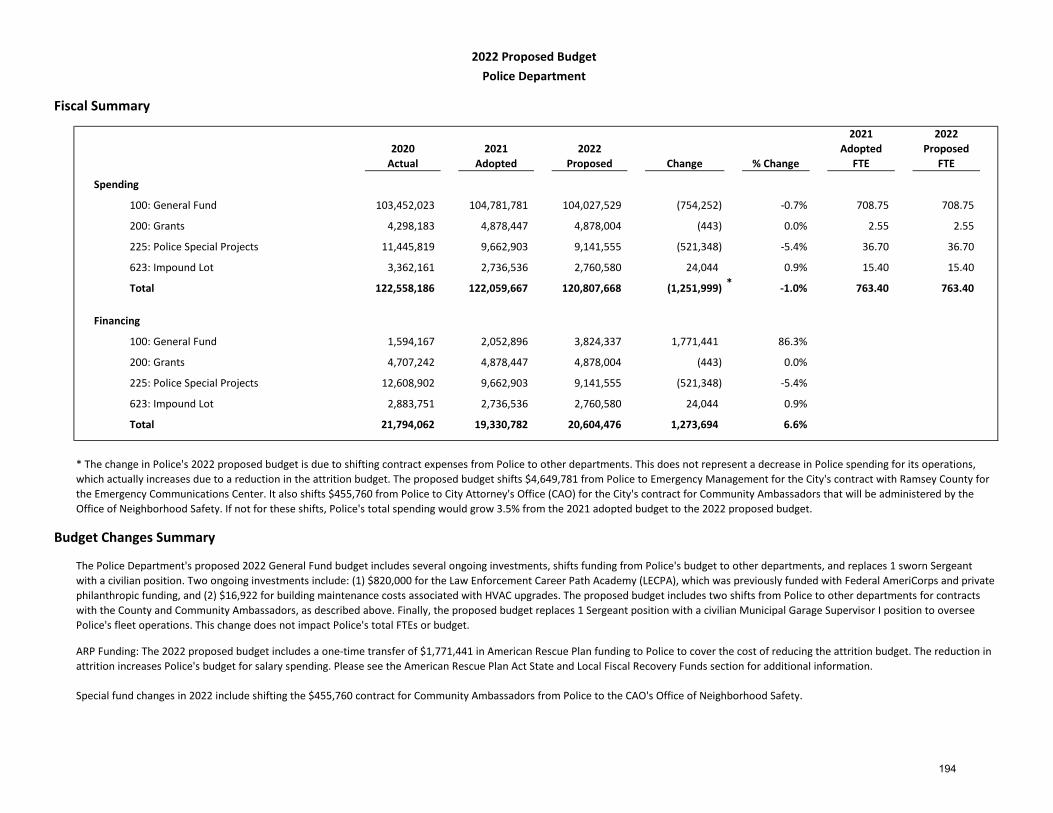
Fiscal Summary
2020Actual
2021Adopted
2022 Proposed Change % Change
2021Adopted
FTE
2022 Proposed
FTE
Spending
103,452,023 104,781,781 104,027,529 (754,252) -0.7% 708.75 708.75
4,298,183 4,878,447 4,878,004 (443) 0.0% 2.55 2.55
11,445,819 9,662,903 9,141,555 (521,348) -5.4% 36.70 36.70
3,362,161 2,736,536 2,760,580 24,044 0.9% 15.40 15.40
122,558,186 122,059,667 120,807,668 (1,251,999) * -1.0% 763.40 763.40
Financing
1,594,167 2,052,896 3,824,337 1,771,441 86.3%
4,707,242 4,878,447 4,878,004 (443) 0.0%
12,608,902 9,662,903 9,141,555 (521,348) -5.4%
2,883,751 2,736,536 2,760,580 24,044 0.9%
21,794,062 19,330,782 20,604,476 1,273,694 6.6%
Budget Changes Summary
2022 Proposed BudgetPolice Department
100: General Fund
200: Grants
225: Police Special Projects
623: Impound Lot
Total
The Police Department's proposed 2022 General Fund budget includes several ongoing investments, shifts funding from Police's budget to other departments, and replaces 1 sworn Sergeant with a civilian position. Two ongoing investments include: (1) $820,000 for the Law Enforcement Career Path Academy (LECPA), which was previously funded with Federal AmeriCorps and private philanthropic funding, and (2) $16,922 for building maintenance costs associated with HVAC upgrades. The proposed budget includes two shifts from Police to other departments for contracts with the County and Community Ambassadors, as described above. Finally, the proposed budget replaces 1 Sergeant position with a civilian Municipal Garage Supervisor I position to oversee Police's fleet operations. This change does not impact Police's total FTEs or budget.
ARP Funding: The 2022 proposed budget includes a one-time transfer of $1,771,441 in American Rescue Plan funding to Police to cover the cost of reducing the attrition budget. The reduction in attrition increases Police's budget for salary spending. Please see the American Rescue Plan Act State and Local Fiscal Recovery Funds section for additional information.
Special fund changes in 2022 include shifting the $455,760 contract for Community Ambassadors from Police to the CAO's Office of Neighborhood Safety.
* The change in Police's 2022 proposed budget is due to shifting contract expenses from Police to other departments. This does not represent a decrease in Police spending for its operations,which actually increases due to a reduction in the attrition budget. The proposed budget shifts $4,649,781 from Police to Emergency Management for the City's contract with Ramsey County for the Emergency Communications Center. It also shifts $455,760 from Police to City Attorney's Office (CAO) for the City's contract for Community Ambassadors that will be administered by theOffice of Neighborhood Safety. If not for these shifts, Police's total spending would grow 3.5% from the 2021 adopted budget to the 2022 proposed budget.
623: Impound Lot
Total
100: General Fund
200: Grants
225: Police Special Projects
194

Spending Reports 195
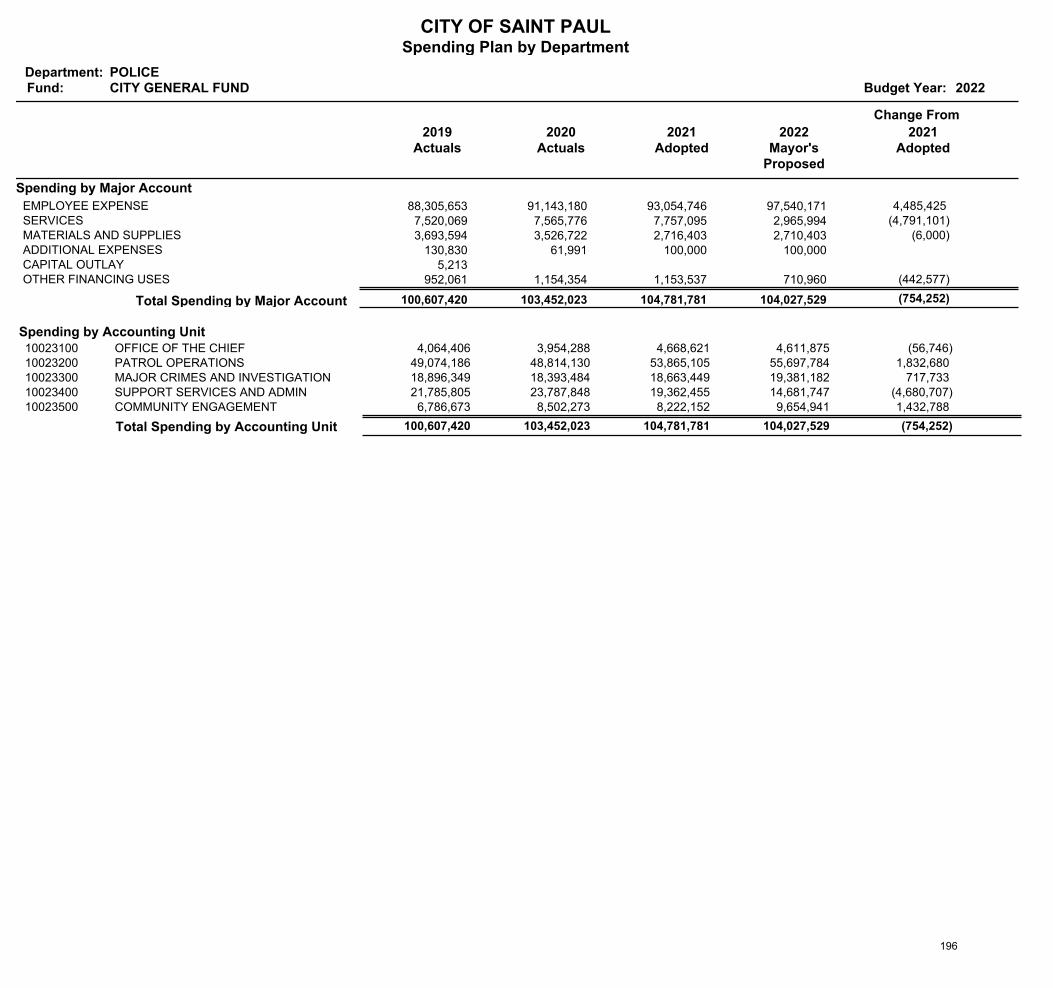
CITY OF SAINT PAULSpending Plan by Department
Department:Fund: Budget Year: 2022
POLICECITY GENERAL FUND
2019Actuals
Change From
2020Actuals
2021Adopted
2022Mayor's
Proposed
2021Adopted
Spending by Major Account
88,305,653 91,143,180 93,054,746 97,540,171 EMPLOYEE EXPENSE 4,485,425 7,520,069 7,565,776 7,757,095 2,965,994 SERVICES (4,791,101) 3,693,594 3,526,722 2,716,403 2,710,403 MATERIALS AND SUPPLIES (6,000)
130,830 61,991 100,000 100,000 ADDITIONAL EXPENSES 5,213 CAPITAL OUTLAY
952,061 1,154,354 1,153,537 710,960 OTHER FINANCING USES (442,577)
(754,252) 104,027,529 104,781,781 103,452,023 100,607,420 Total Spending by Major Account
Spending by Accounting UnitOFFICE OF THE CHIEF 4,064,406 4,611,875 4,668,621 3,954,288 10023100 (56,746)PATROL OPERATIONS 49,074,186 55,697,784 53,865,105 48,814,130 10023200 1,832,680 MAJOR CRIMES AND INVESTIGATION 18,896,349 19,381,182 18,663,449 18,393,484 10023300 717,733 SUPPORT SERVICES AND ADMIN 21,785,805 14,681,747 19,362,455 23,787,848 10023400 (4,680,707)COMMUNITY ENGAGEMENT 6,786,673 9,654,941 8,222,152 8,502,273 10023500 1,432,788
Total Spending by Accounting Unit 100,607,420 104,027,529 (754,252) 103,452,023 104,781,781
196
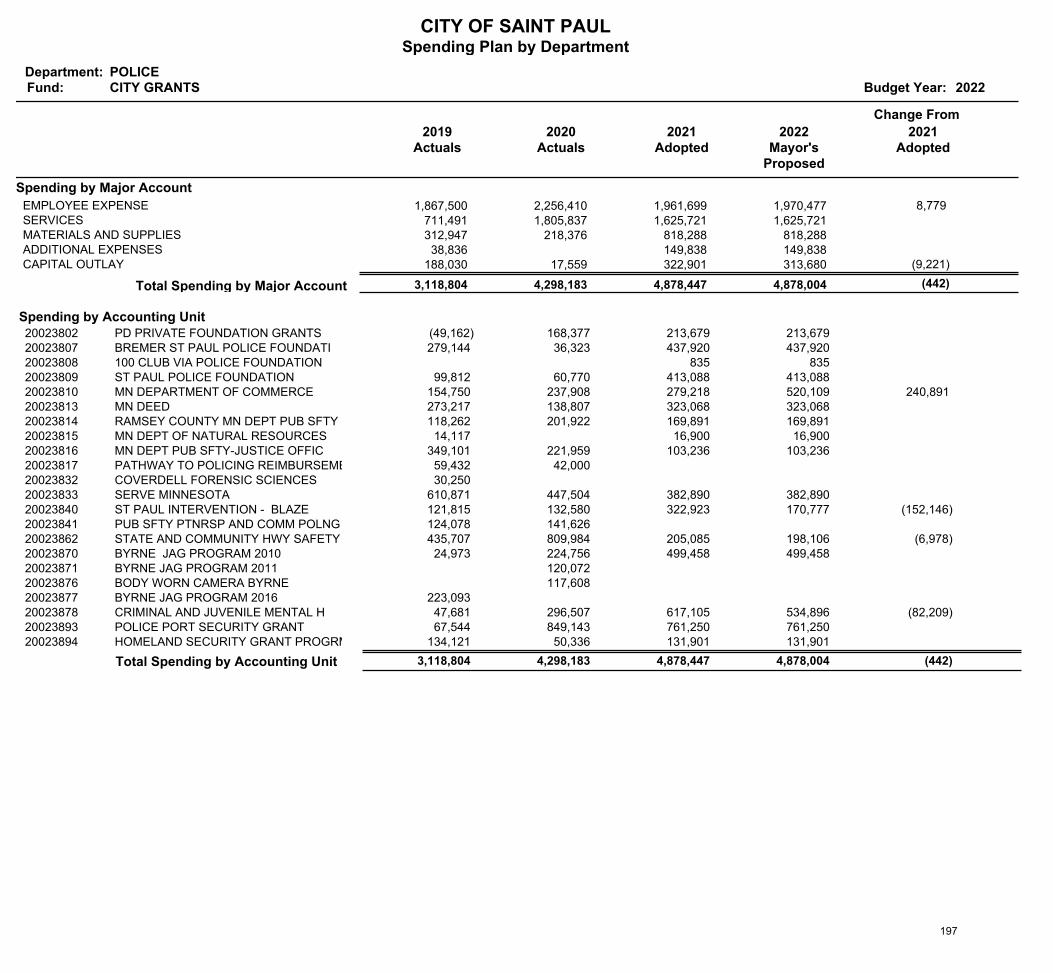
CITY OF SAINT PAULSpending Plan by Department
Department:Fund: Budget Year: 2022
POLICECITY GRANTS
2019Actuals
Change From
2020Actuals
2021Adopted
2022Mayor's
Proposed
2021Adopted
Spending by Major Account
1,867,500 2,256,410 1,961,699 1,970,477 EMPLOYEE EXPENSE 8,779 711,491 1,805,837 1,625,721 1,625,721 SERVICES 312,947 218,376 818,288 818,288 MATERIALS AND SUPPLIES 38,836 149,838 149,838 ADDITIONAL EXPENSES
188,030 17,559 322,901 313,680 CAPITAL OUTLAY (9,221)
(442) 4,878,004 4,878,447 4,298,183 3,118,804 Total Spending by Major Account
Spending by Accounting UnitPD PRIVATE FOUNDATION GRANTS (49,162) 213,679 213,679 168,377 20023802BREMER ST PAUL POLICE FOUNDATI 279,144 437,920 437,920 36,323 20023807100 CLUB VIA POLICE FOUNDATION 835 835 20023808ST PAUL POLICE FOUNDATION 99,812 413,088 413,088 60,770 20023809MN DEPARTMENT OF COMMERCE 154,750 520,109 279,218 237,908 20023810 240,891 MN DEED 273,217 323,068 323,068 138,807 20023813RAMSEY COUNTY MN DEPT PUB SFTY 118,262 169,891 169,891 201,922 20023814MN DEPT OF NATURAL RESOURCES 14,117 16,900 16,900 20023815MN DEPT PUB SFTY-JUSTICE OFFIC 349,101 103,236 103,236 221,959 20023816PATHWAY TO POLICING REIMBURSEMENT GRANT 59,432 42,000 20023817COVERDELL FORENSIC SCIENCES 30,250 20023832SERVE MINNESOTA 610,871 382,890 382,890 447,504 20023833ST PAUL INTERVENTION - BLAZE 121,815 170,777 322,923 132,580 20023840 (152,146)PUB SFTY PTNRSP AND COMM POLNG 124,078 141,626 20023841STATE AND COMMUNITY HWY SAFETY 435,707 198,106 205,085 809,984 20023862 (6,978)BYRNE JAG PROGRAM 2010 24,973 499,458 499,458 224,756 20023870BYRNE JAG PROGRAM 2011 120,072 20023871BODY WORN CAMERA BYRNE 117,608 20023876BYRNE JAG PROGRAM 2016 223,093 20023877CRIMINAL AND JUVENILE MENTAL H 47,681 534,896 617,105 296,507 20023878 (82,209)POLICE PORT SECURITY GRANT 67,544 761,250 761,250 849,143 20023893HOMELAND SECURITY GRANT PROGRM 134,121 131,901 131,901 50,336 20023894
Total Spending by Accounting Unit 3,118,804 4,878,004 (442) 4,298,183 4,878,447
197
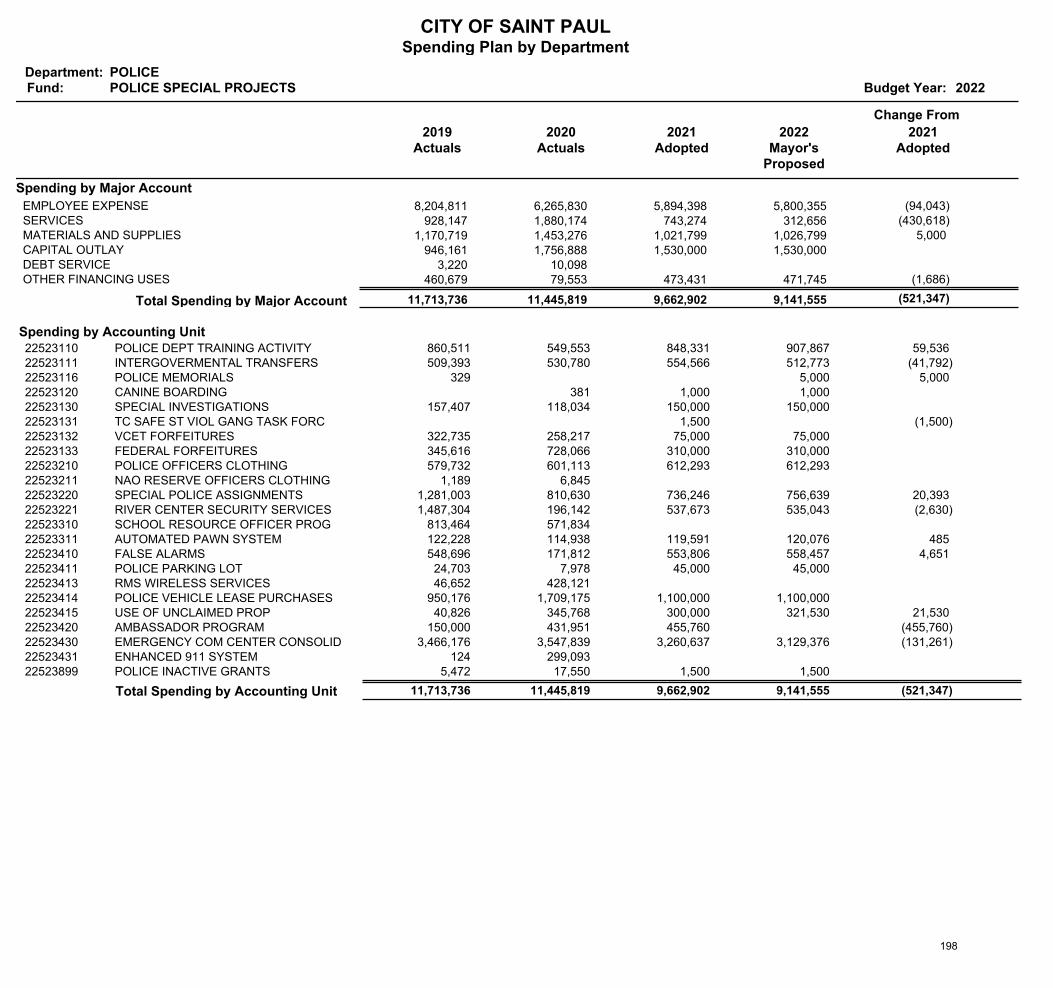
CITY OF SAINT PAULSpending Plan by Department
Department:Fund: Budget Year: 2022
POLICEPOLICE SPECIAL PROJECTS
2019Actuals
Change From
2020Actuals
2021Adopted
2022Mayor's
Proposed
2021Adopted
Spending by Major Account
8,204,811 6,265,830 5,894,398 5,800,355 EMPLOYEE EXPENSE (94,043) 928,147 1,880,174 743,274 312,656 SERVICES (430,618)
1,170,719 1,453,276 1,021,799 1,026,799 MATERIALS AND SUPPLIES 5,000 946,161 1,756,888 1,530,000 1,530,000 CAPITAL OUTLAY
3,220 10,098 DEBT SERVICE 460,679 79,553 473,431 471,745 OTHER FINANCING USES (1,686)
(521,347) 9,141,555 9,662,902 11,445,819 11,713,736 Total Spending by Major Account
Spending by Accounting UnitPOLICE DEPT TRAINING ACTIVITY 860,511 907,867 848,331 549,553 22523110 59,536 INTERGOVERMENTAL TRANSFERS 509,393 512,773 554,566 530,780 22523111 (41,792)POLICE MEMORIALS 329 5,000 22523116 5,000 CANINE BOARDING 1,000 1,000 381 22523120SPECIAL INVESTIGATIONS 157,407 150,000 150,000 118,034 22523130TC SAFE ST VIOL GANG TASK FORC 1,500 22523131 (1,500)VCET FORFEITURES 322,735 75,000 75,000 258,217 22523132FEDERAL FORFEITURES 345,616 310,000 310,000 728,066 22523133POLICE OFFICERS CLOTHING 579,732 612,293 612,293 601,113 22523210NAO RESERVE OFFICERS CLOTHING 1,189 6,845 22523211SPECIAL POLICE ASSIGNMENTS 1,281,003 756,639 736,246 810,630 22523220 20,393 RIVER CENTER SECURITY SERVICES 1,487,304 535,043 537,673 196,142 22523221 (2,630)SCHOOL RESOURCE OFFICER PROG 813,464 571,834 22523310AUTOMATED PAWN SYSTEM 122,228 120,076 119,591 114,938 22523311 485 FALSE ALARMS 548,696 558,457 553,806 171,812 22523410 4,651 POLICE PARKING LOT 24,703 45,000 45,000 7,978 22523411RMS WIRELESS SERVICES 46,652 428,121 22523413POLICE VEHICLE LEASE PURCHASES 950,176 1,100,000 1,100,000 1,709,175 22523414USE OF UNCLAIMED PROP 40,826 321,530 300,000 345,768 22523415 21,530 AMBASSADOR PROGRAM 150,000 455,760 431,951 22523420 (455,760)EMERGENCY COM CENTER CONSOLID 3,466,176 3,129,376 3,260,637 3,547,839 22523430 (131,261)ENHANCED 911 SYSTEM 124 299,093 22523431POLICE INACTIVE GRANTS 5,472 1,500 1,500 17,550 22523899
Total Spending by Accounting Unit 11,713,736 9,141,555 (521,347) 11,445,819 9,662,902
198
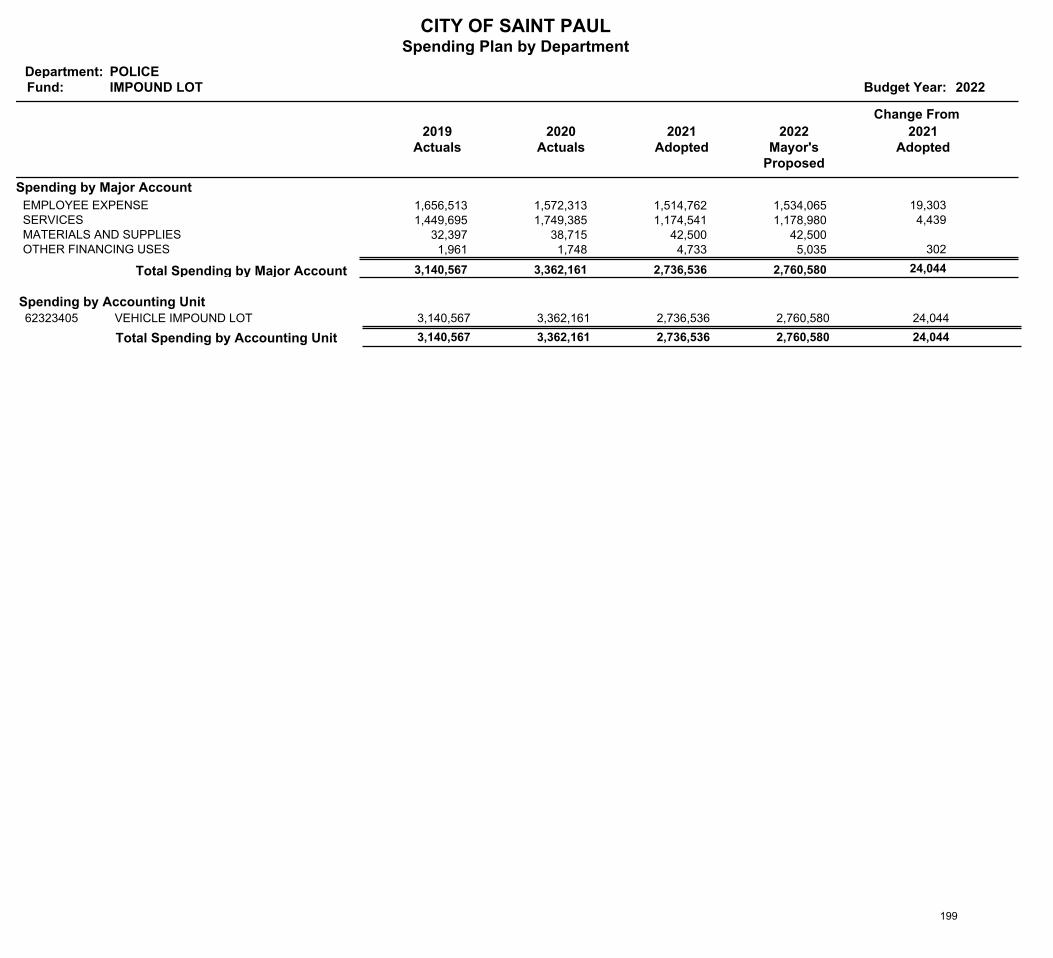
CITY OF SAINT PAULSpending Plan by Department
Department:Fund: Budget Year: 2022
POLICEIMPOUND LOT
2019Actuals
Change From
2020Actuals
2021Adopted
2022Mayor's
Proposed
2021Adopted
Spending by Major Account
1,656,513 1,572,313 1,514,762 1,534,065 EMPLOYEE EXPENSE 19,303 1,449,695 1,749,385 1,174,541 1,178,980 SERVICES 4,439
32,397 38,715 42,500 42,500 MATERIALS AND SUPPLIES 1,961 1,748 4,733 5,035 OTHER FINANCING USES 302
24,044 2,760,580 2,736,536 3,362,161 3,140,567 Total Spending by Major Account
Spending by Accounting UnitVEHICLE IMPOUND LOT 3,140,567 2,760,580 2,736,536 3,362,161 62323405 24,044
Total Spending by Accounting Unit 3,140,567 2,760,580 24,044 3,362,161 2,736,536
199

Financing Reports 200
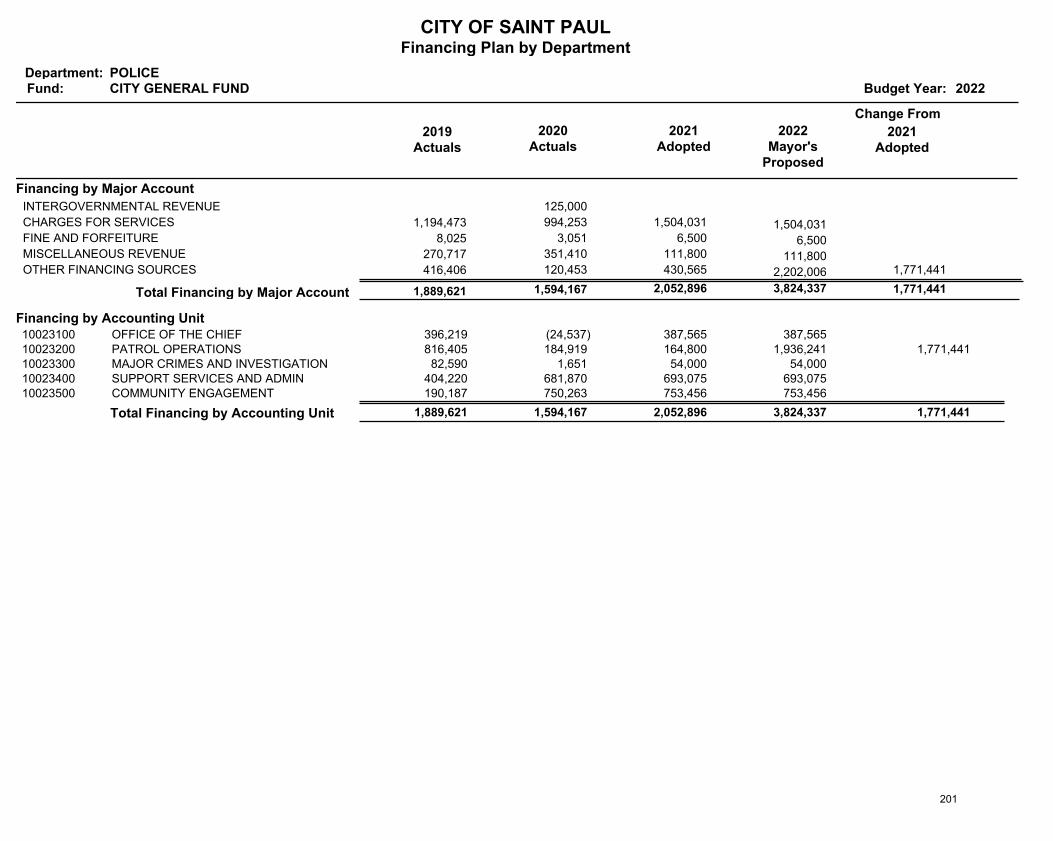
CITY OF SAINT PAULFinancing Plan by Department
Department:Fund: Budget Year: 2022
POLICECITY GENERAL FUND
2019Actuals
Change From
2020Actuals
2021Adopted
2022Mayor's
Proposed
2021Adopted
Financing by Major Account
125,000 INTERGOVERNMENTAL REVENUE
1,194,473 994,253 1,504,031 1,504,031 CHARGES FOR SERVICES
8,025 3,051 6,500 6,500 FINE AND FORFEITURE
270,717 351,410 111,800 111,800 MISCELLANEOUS REVENUE
416,406 120,453 430,565 2,202,006 OTHER FINANCING SOURCES 1,771,441
1,771,441 3,824,337 2,052,896 1,594,167 1,889,621 Total Financing by Major Account
Financing by Accounting UnitOFFICE OF THE CHIEF 396,219 387,565 387,565 (24,537)10023100PATROL OPERATIONS 816,405 1,936,241 164,800 184,919 10023200 1,771,441 MAJOR CRIMES AND INVESTIGATION 82,590 54,000 54,000 1,651 10023300SUPPORT SERVICES AND ADMIN 404,220 693,075 693,075 681,870 10023400COMMUNITY ENGAGEMENT 190,187 753,456 753,456 750,263 10023500
Total Financing by Accounting Unit 1,889,621 3,824,337 1,771,441 1,594,167 2,052,896
201
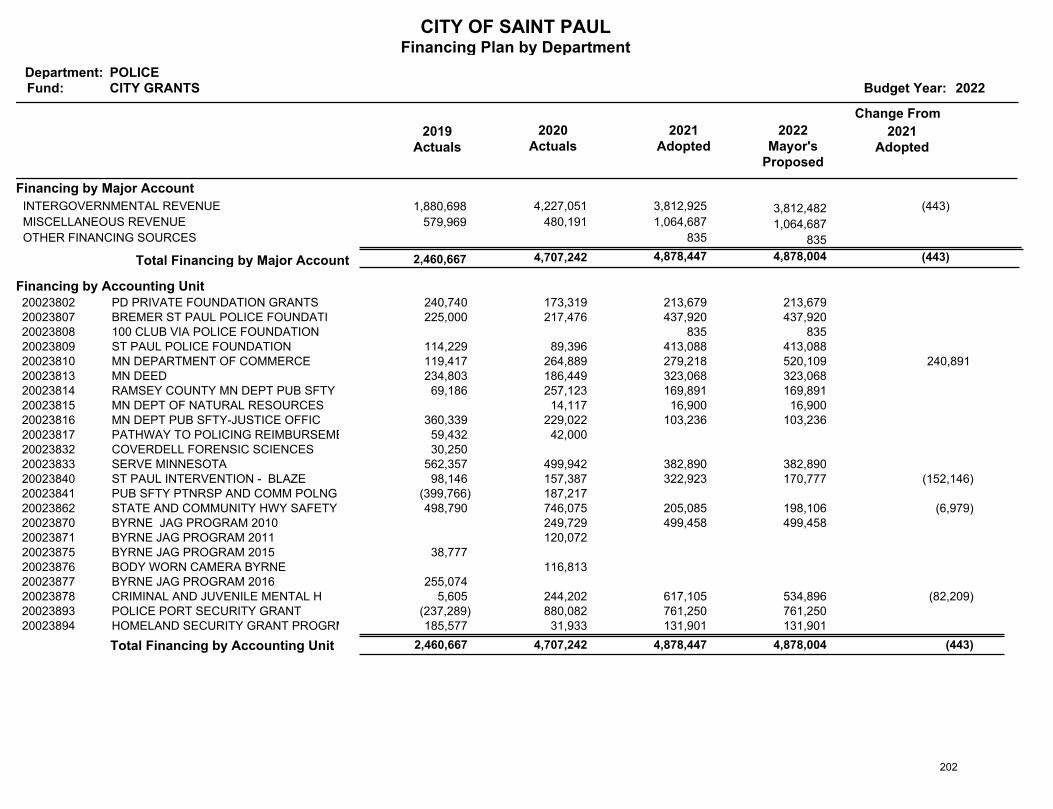
CITY OF SAINT PAULFinancing Plan by Department
Department:Fund: Budget Year: 2022
POLICECITY GRANTS
2019Actuals
Change From
2020Actuals
2021Adopted
2022Mayor's
Proposed
2021Adopted
Financing by Major Account
1,880,698 4,227,051 3,812,925 3,812,482 INTERGOVERNMENTAL REVENUE (443)
579,969 480,191 1,064,687 1,064,687 MISCELLANEOUS REVENUE
835 835 OTHER FINANCING SOURCES
(443) 4,878,004 4,878,447 4,707,242 2,460,667 Total Financing by Major Account
Financing by Accounting UnitPD PRIVATE FOUNDATION GRANTS 240,740 213,679 213,679 173,319 20023802BREMER ST PAUL POLICE FOUNDATI 225,000 437,920 437,920 217,476 20023807100 CLUB VIA POLICE FOUNDATION 835 835 20023808ST PAUL POLICE FOUNDATION 114,229 413,088 413,088 89,396 20023809MN DEPARTMENT OF COMMERCE 119,417 520,109 279,218 264,889 20023810 240,891 MN DEED 234,803 323,068 323,068 186,449 20023813RAMSEY COUNTY MN DEPT PUB SFTY 69,186 169,891 169,891 257,123 20023814MN DEPT OF NATURAL RESOURCES 16,900 16,900 14,117 20023815MN DEPT PUB SFTY-JUSTICE OFFIC 360,339 103,236 103,236 229,022 20023816PATHWAY TO POLICING REIMBURSEMENT GRANT 59,432 42,000 20023817COVERDELL FORENSIC SCIENCES 30,250 20023832SERVE MINNESOTA 562,357 382,890 382,890 499,942 20023833ST PAUL INTERVENTION - BLAZE 98,146 170,777 322,923 157,387 20023840 (152,146)PUB SFTY PTNRSP AND COMM POLNG (399,766) 187,217 20023841STATE AND COMMUNITY HWY SAFETY 498,790 198,106 205,085 746,075 20023862 (6,979)BYRNE JAG PROGRAM 2010 499,458 499,458 249,729 20023870BYRNE JAG PROGRAM 2011 120,072 20023871BYRNE JAG PROGRAM 2015 38,777 20023875BODY WORN CAMERA BYRNE 116,813 20023876BYRNE JAG PROGRAM 2016 255,074 20023877CRIMINAL AND JUVENILE MENTAL H 5,605 534,896 617,105 244,202 20023878 (82,209)POLICE PORT SECURITY GRANT (237,289) 761,250 761,250 880,082 20023893HOMELAND SECURITY GRANT PROGRM 185,577 131,901 131,901 31,933 20023894
Total Financing by Accounting Unit 2,460,667 4,878,004 (443) 4,707,242 4,878,447
202
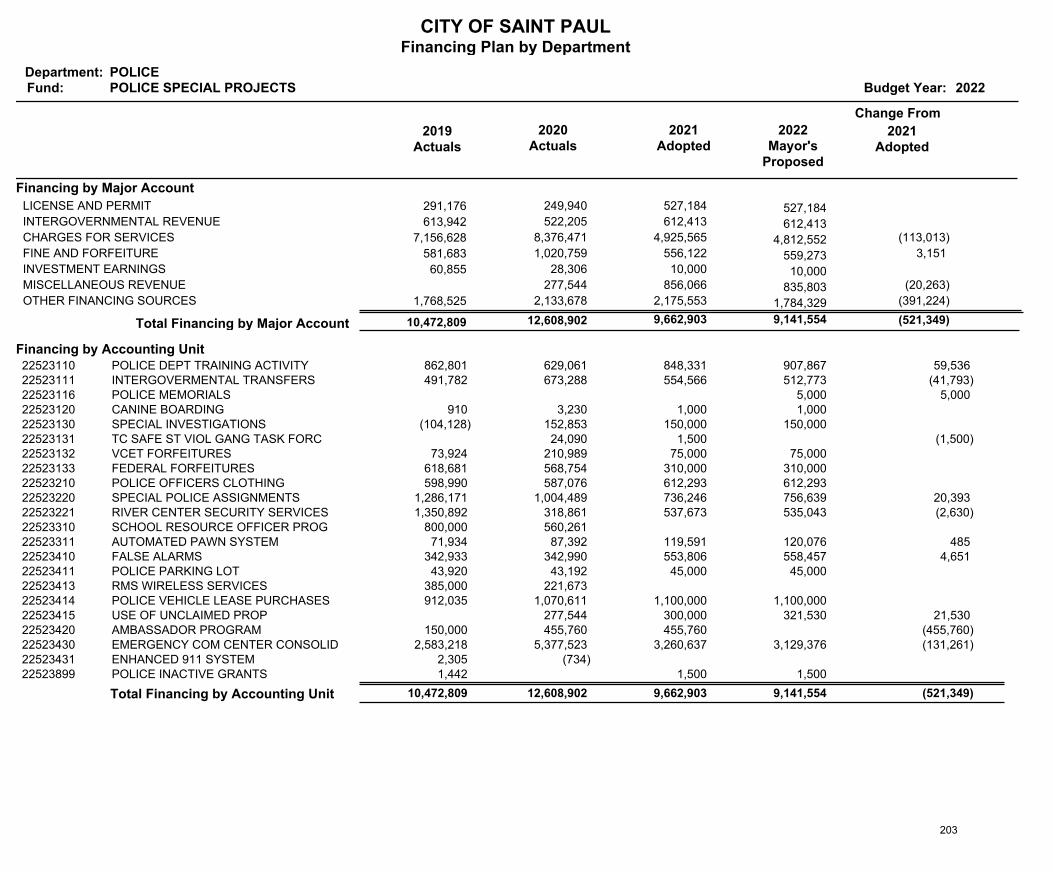
CITY OF SAINT PAULFinancing Plan by Department
Department:Fund: Budget Year: 2022
POLICEPOLICE SPECIAL PROJECTS
2019Actuals
Change From
2020Actuals
2021Adopted
2022Mayor's
Proposed
2021Adopted
Financing by Major Account
291,176 249,940 527,184 527,184 LICENSE AND PERMIT
613,942 522,205 612,413 612,413 INTERGOVERNMENTAL REVENUE
7,156,628 8,376,471 4,925,565 4,812,552 CHARGES FOR SERVICES (113,013)
581,683 1,020,759 556,122 559,273 FINE AND FORFEITURE 3,151
60,855 28,306 10,000 10,000 INVESTMENT EARNINGS
277,544 856,066 835,803 MISCELLANEOUS REVENUE (20,263)
1,768,525 2,133,678 2,175,553 1,784,329 OTHER FINANCING SOURCES (391,224)
(521,349) 9,141,554 9,662,903 12,608,902 10,472,809 Total Financing by Major Account
Financing by Accounting UnitPOLICE DEPT TRAINING ACTIVITY 862,801 907,867 848,331 629,061 22523110 59,536 INTERGOVERMENTAL TRANSFERS 491,782 512,773 554,566 673,288 22523111 (41,793)POLICE MEMORIALS 5,000 22523116 5,000 CANINE BOARDING 910 1,000 1,000 3,230 22523120SPECIAL INVESTIGATIONS (104,128) 150,000 150,000 152,853 22523130TC SAFE ST VIOL GANG TASK FORC 1,500 24,090 22523131 (1,500)VCET FORFEITURES 73,924 75,000 75,000 210,989 22523132FEDERAL FORFEITURES 618,681 310,000 310,000 568,754 22523133POLICE OFFICERS CLOTHING 598,990 612,293 612,293 587,076 22523210SPECIAL POLICE ASSIGNMENTS 1,286,171 756,639 736,246 1,004,489 22523220 20,393 RIVER CENTER SECURITY SERVICES 1,350,892 535,043 537,673 318,861 22523221 (2,630)SCHOOL RESOURCE OFFICER PROG 800,000 560,261 22523310AUTOMATED PAWN SYSTEM 71,934 120,076 119,591 87,392 22523311 485 FALSE ALARMS 342,933 558,457 553,806 342,990 22523410 4,651 POLICE PARKING LOT 43,920 45,000 45,000 43,192 22523411RMS WIRELESS SERVICES 385,000 221,673 22523413POLICE VEHICLE LEASE PURCHASES 912,035 1,100,000 1,100,000 1,070,611 22523414USE OF UNCLAIMED PROP 321,530 300,000 277,544 22523415 21,530 AMBASSADOR PROGRAM 150,000 455,760 455,760 22523420 (455,760)EMERGENCY COM CENTER CONSOLID 2,583,218 3,129,376 3,260,637 5,377,523 22523430 (131,261)ENHANCED 911 SYSTEM 2,305 (734)22523431POLICE INACTIVE GRANTS 1,442 1,500 1,500 22523899
Total Financing by Accounting Unit 10,472,809 9,141,554 (521,349) 12,608,902 9,662,903
203
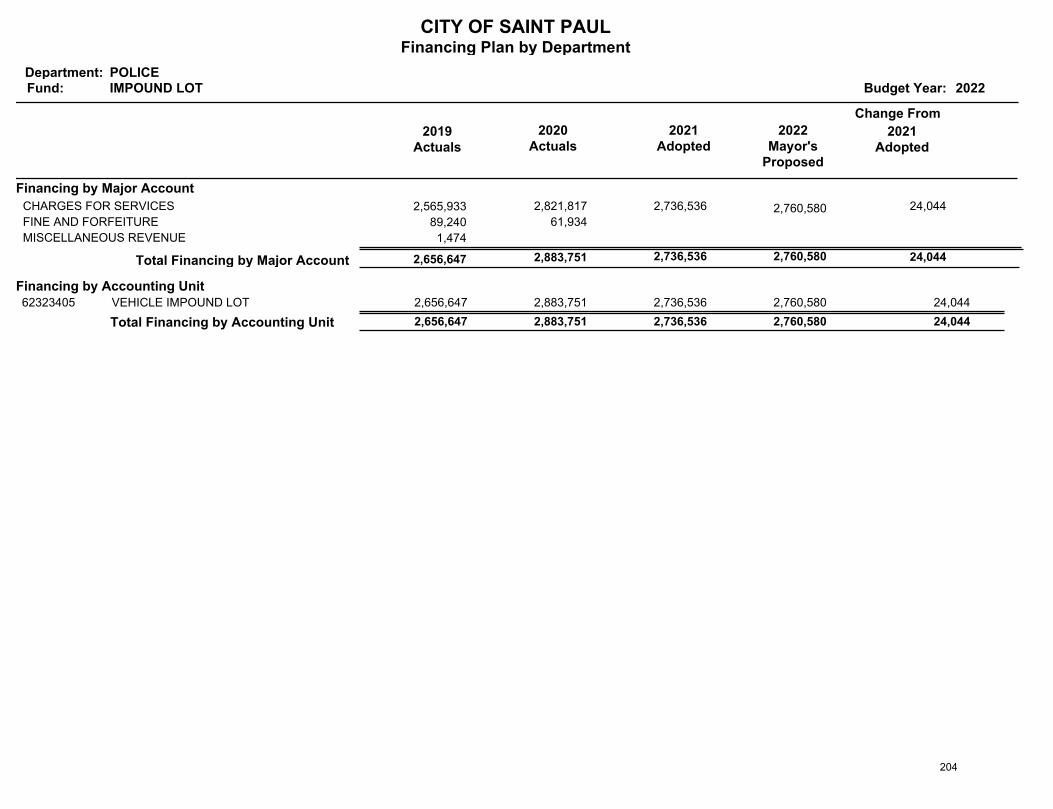
CITY OF SAINT PAULFinancing Plan by Department
Department:Fund: Budget Year: 2022
POLICEIMPOUND LOT
2019Actuals
Change From
2020Actuals
2021Adopted
2022Mayor's
Proposed
2021Adopted
Financing by Major Account
2,565,933 2,821,817 2,736,536 2,760,580 CHARGES FOR SERVICES 24,044
89,240 61,934 FINE AND FORFEITURE
1,474 MISCELLANEOUS REVENUE
24,044 2,760,580 2,736,536 2,883,751 2,656,647 Total Financing by Major Account
Financing by Accounting UnitVEHICLE IMPOUND LOT 2,656,647 2,760,580 2,736,536 2,883,751 62323405 24,044
Total Financing by Accounting Unit 2,656,647 2,760,580 24,044 2,883,751 2,736,536
204
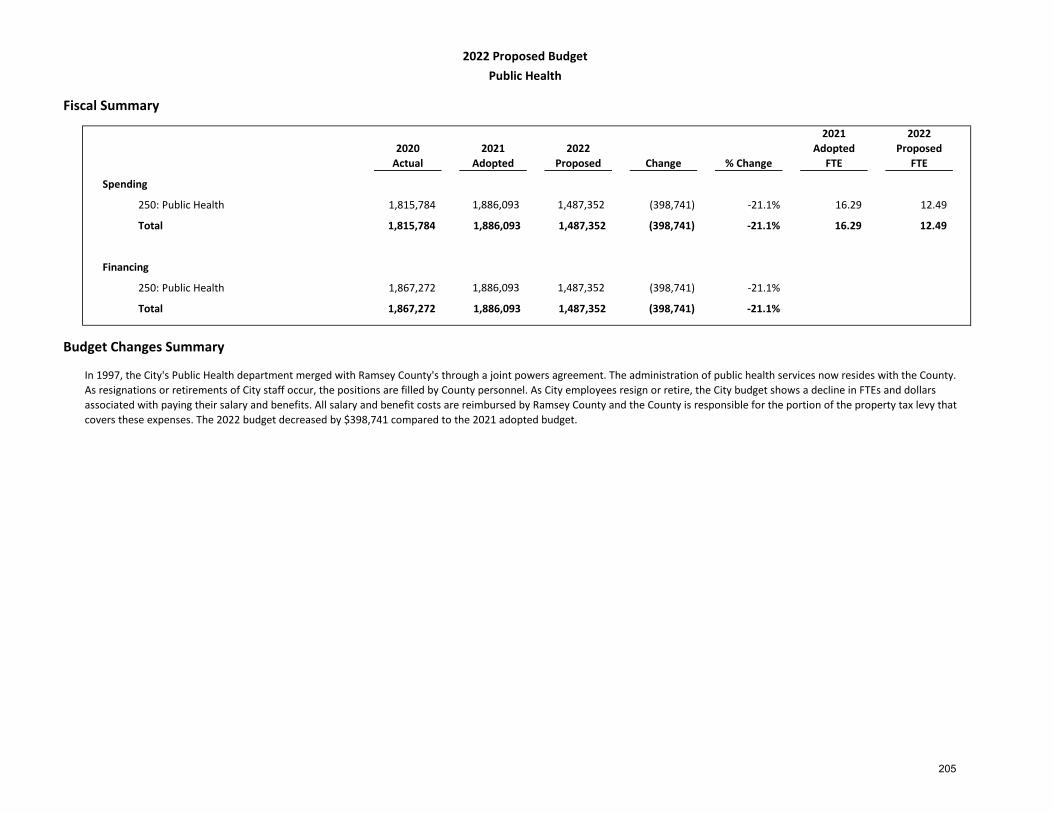
Fiscal Summary
2020Actual
2021Adopted
2022 Proposed Change % Change
2021Adopted
FTE
2022 Proposed
FTE
Spending
1,815,784 1,886,093 1,487,352 (398,741) -21.1% 16.29 12.49
1,815,784 1,886,093 1,487,352 (398,741) -21.1% 16.29 12.49
Financing
1,867,272 1,886,093 1,487,352 (398,741) -21.1%
1,867,272 1,886,093 1,487,352 (398,741) -21.1%
Budget Changes Summary
2022 Proposed BudgetPublic Health
250: Public Health
250: Public Health
In 1997, the City's Public Health department merged with Ramsey County's through a joint powers agreement. The administration of public health services now resides with the County. As resignations or retirements of City staff occur, the positions are filled by County personnel. As City employees resign or retire, the City budget shows a decline in FTEs and dollars associated with paying their salary and benefits. All salary and benefit costs are reimbursed by Ramsey County and the County is responsible for the portion of the property tax levy that covers these expenses. The 2022 budget decreased by $398,741 compared to the 2021 adopted budget.
Total
Total
205

Spending Reports 206
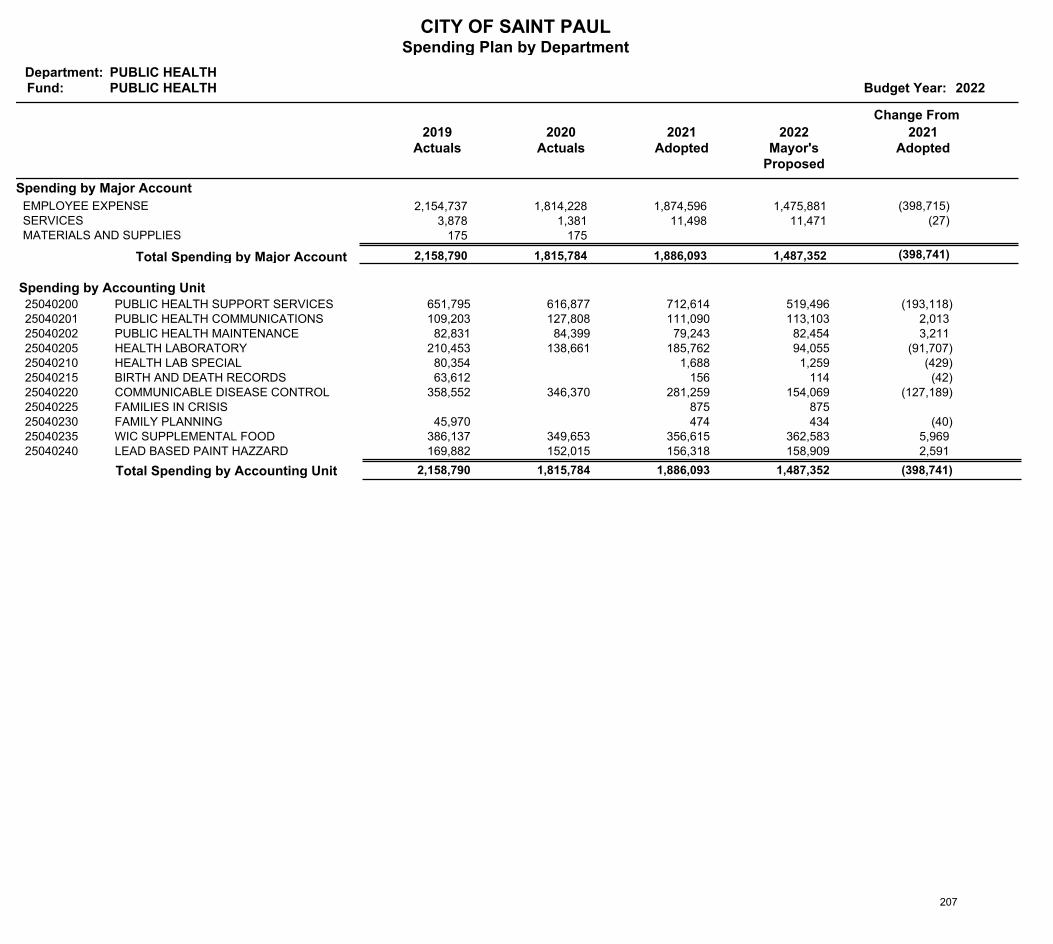
CITY OF SAINT PAULSpending Plan by Department
Department:Fund: Budget Year: 2022
PUBLIC HEALTHPUBLIC HEALTH
2019Actuals
Change From
2020Actuals
2021Adopted
2022Mayor's
Proposed
2021Adopted
Spending by Major Account
2,154,737 1,814,228 1,874,596 1,475,881 EMPLOYEE EXPENSE (398,715) 3,878 1,381 11,498 11,471 SERVICES (27)
175 175 MATERIALS AND SUPPLIES
(398,741) 1,487,352 1,886,093 1,815,784 2,158,790 Total Spending by Major Account
Spending by Accounting UnitPUBLIC HEALTH SUPPORT SERVICES 651,795 519,496 712,614 616,877 25040200 (193,118)PUBLIC HEALTH COMMUNICATIONS 109,203 113,103 111,090 127,808 25040201 2,013 PUBLIC HEALTH MAINTENANCE 82,831 82,454 79,243 84,399 25040202 3,211 HEALTH LABORATORY 210,453 94,055 185,762 138,661 25040205 (91,707)HEALTH LAB SPECIAL 80,354 1,259 1,688 25040210 (429)BIRTH AND DEATH RECORDS 63,612 114 156 25040215 (42)COMMUNICABLE DISEASE CONTROL 358,552 154,069 281,259 346,370 25040220 (127,189)FAMILIES IN CRISIS 875 875 25040225FAMILY PLANNING 45,970 434 474 25040230 (40)WIC SUPPLEMENTAL FOOD 386,137 362,583 356,615 349,653 25040235 5,969 LEAD BASED PAINT HAZZARD 169,882 158,909 156,318 152,015 25040240 2,591
Total Spending by Accounting Unit 2,158,790 1,487,352 (398,741) 1,815,784 1,886,093
207

Financing Reports 208
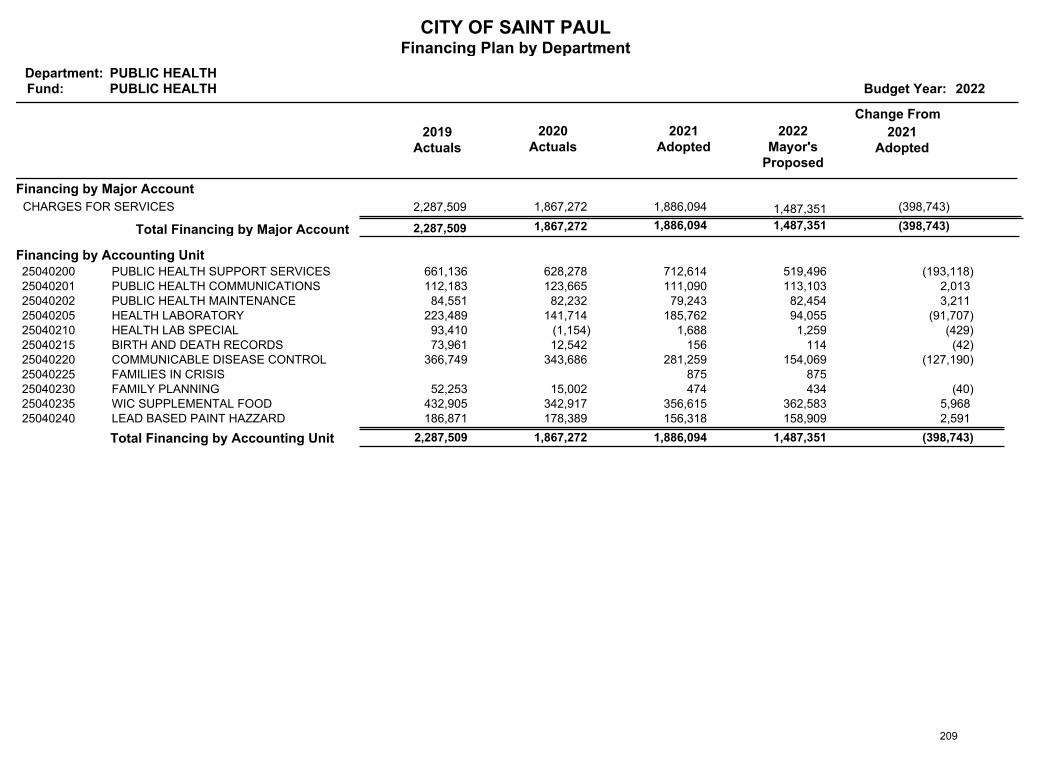
CITY OF SAINT PAULFinancing Plan by Department
Department:Fund: Budget Year: 2022
PUBLIC HEALTHPUBLIC HEALTH
2019Actuals
Change From
2020Actuals
2021Adopted
2022Mayor's
Proposed
2021Adopted
Financing by Major Account
2,287,509 1,867,272 1,886,094 1,487,351 CHARGES FOR SERVICES (398,743)
(398,743) 1,487,351 1,886,094 1,867,272 2,287,509 Total Financing by Major Account
Financing by Accounting UnitPUBLIC HEALTH SUPPORT SERVICES 661,136 519,496 712,614 628,278 25040200 (193,118)PUBLIC HEALTH COMMUNICATIONS 112,183 113,103 111,090 123,665 25040201 2,013 PUBLIC HEALTH MAINTENANCE 84,551 82,454 79,243 82,232 25040202 3,211 HEALTH LABORATORY 223,489 94,055 185,762 141,714 25040205 (91,707)HEALTH LAB SPECIAL 93,410 1,259 1,688 (1,154)25040210 (429)BIRTH AND DEATH RECORDS 73,961 114 156 12,542 25040215 (42)COMMUNICABLE DISEASE CONTROL 366,749 154,069 281,259 343,686 25040220 (127,190)FAMILIES IN CRISIS 875 875 25040225FAMILY PLANNING 52,253 434 474 15,002 25040230 (40)WIC SUPPLEMENTAL FOOD 432,905 362,583 356,615 342,917 25040235 5,968 LEAD BASED PAINT HAZZARD 186,871 158,909 156,318 178,389 25040240 2,591
Total Financing by Accounting Unit 2,287,509 1,487,351 (398,743) 1,867,272 1,886,094
209
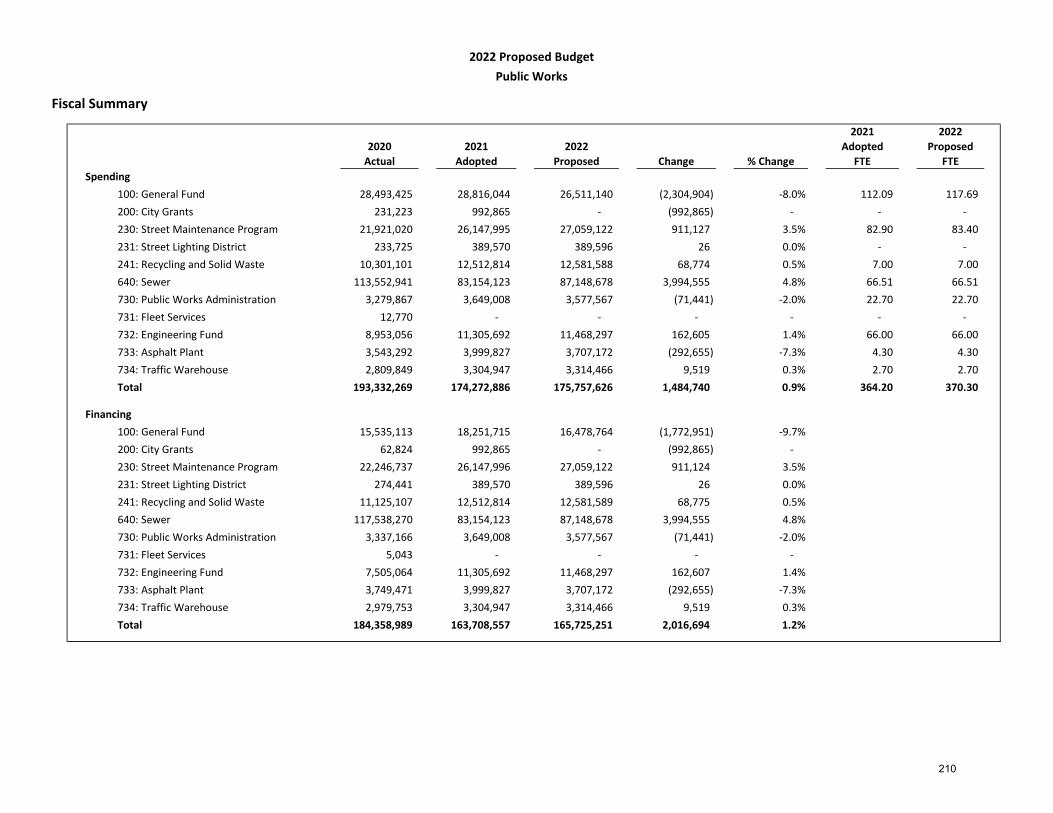
Fiscal Summary
2020Actual
2021Adopted
2022Proposed Change % Change
2021Adopted
FTE
2022 Proposed
FTESpending
100: General Fund 28,493,425 28,816,044 26,511,140 (2,304,904) -8.0% 112.09 117.69 200: City Grants 231,223 992,865 - (992,865) - - - 230: Street Maintenance Program 21,921,020 26,147,995 27,059,122 911,127 3.5% 82.90 83.40 231: Street Lighting District 233,725 389,570 389,596 26 0.0% - - 241: Recycling and Solid Waste 10,301,101 12,512,814 12,581,588 68,774 0.5% 7.00 7.00 640: Sewer 113,552,941 83,154,123 87,148,678 3,994,555 4.8% 66.51 66.51 730: Public Works Administration 3,279,867 3,649,008 3,577,567 (71,441) -2.0% 22.70 22.70 731: Fleet Services 12,770 - - - - - - 732: Engineering Fund 8,953,056 11,305,692 11,468,297 162,605 1.4% 66.00 66.00 733: Asphalt Plant 3,543,292 3,999,827 3,707,172 (292,655) -7.3% 4.30 4.30 734: Traffic Warehouse 2,809,849 3,304,947 3,314,466 9,519 0.3% 2.70 2.70 Total 193,332,269 174,272,886 175,757,626 1,484,740 0.9% 364.20 370.30
Financing100: General Fund 15,535,113 18,251,715 16,478,764 (1,772,951) -9.7%200: City Grants 62,824 992,865 - (992,865) -230: Street Maintenance Program 22,246,737 26,147,996 27,059,122 911,124 3.5%231: Street Lighting District 274,441 389,570 389,596 26 0.0%241: Recycling and Solid Waste 11,125,107 12,512,814 12,581,589 68,775 0.5%640: Sewer 117,538,270 83,154,123 87,148,678 3,994,555 4.8%730: Public Works Administration 3,337,166 3,649,008 3,577,567 (71,441) -2.0%731: Fleet Services 5,043 - - - -732: Engineering Fund 7,505,064 11,305,692 11,468,297 162,607 1.4%733: Asphalt Plant 3,749,471 3,999,827 3,707,172 (292,655) -7.3%734: Traffic Warehouse 2,979,753 3,304,947 3,314,466 9,519 0.3%Total 184,358,989 163,708,557 165,725,251 2,016,694 1.2%
2022 Proposed BudgetPublic Works
210
Budget Changes Summary
The 2022 proposed General Fund budget for Public Works includes ongoing adjustments to: restore positions cut in the 2021 budget due to pandemic pressures, add funding for Highland Bridge operations and maintenance, and reflect an ongoing reduction for debt that has been paid. The budget includes $790,269 to restore 4.5 FTEs including a Principal City Planner (1 FTE), an Electrical Inspector III (0.5 FTEs), Electricians (2 FTEs) and a Painter (1 FTE). The proposed budget includes $242,850 for ongoing operations and maintenance costs at Highland Bridge, including $64,221 for electricity, equipment, and materials, $85,630 transferred to the Sewer Fund for contractors, a Public Works Tech II (0.1 FTE), and a Street Service Worker (1 FTE). Finally, the budget includes a $2,146 ongoing increase for building maintenance costs associated with HVAC upgrades, and an ongoing spending reduction of $213,108 for debt that has been paid.
ARP Funding: The 2022 proposed budget includes a one-time transfer of $3,332,391 in American Rescue Plan funding for Mill and Overlay, which replaces a transfer included in Public Works' 2021 General Fund budget. As a result, Public Works' General Fund budget is reduced by $3,332,391. Total Mill and Overlay spending remains the same, but the source of funding changes on a one-time basis. Public Works' budget also includes ARP administrative staff (1 FTE) each year for the term of the grant. This FTE in not included on Public Works' budget pages: please see the American Rescue Plan Act State and Local Fiscal Recovery Funds section for additional information.
Special fund changes include rate increases in the Solid Waste Fund (3.5%), Sewer Fund (3.5%), and Street Maintenance Program Fund (ranges from 2.8% to 6.25% by service). The Solid Waste rate increase addresses additional costs for organized collection cart replacement. The Sewer rate increase of 3.5% is consistent with established long-term rate planning. The Street Maintenance Program rate increases address increased costs for vehicle rental and equipment and are for rates that did not increase in 2021.
211

Spending Reports 212
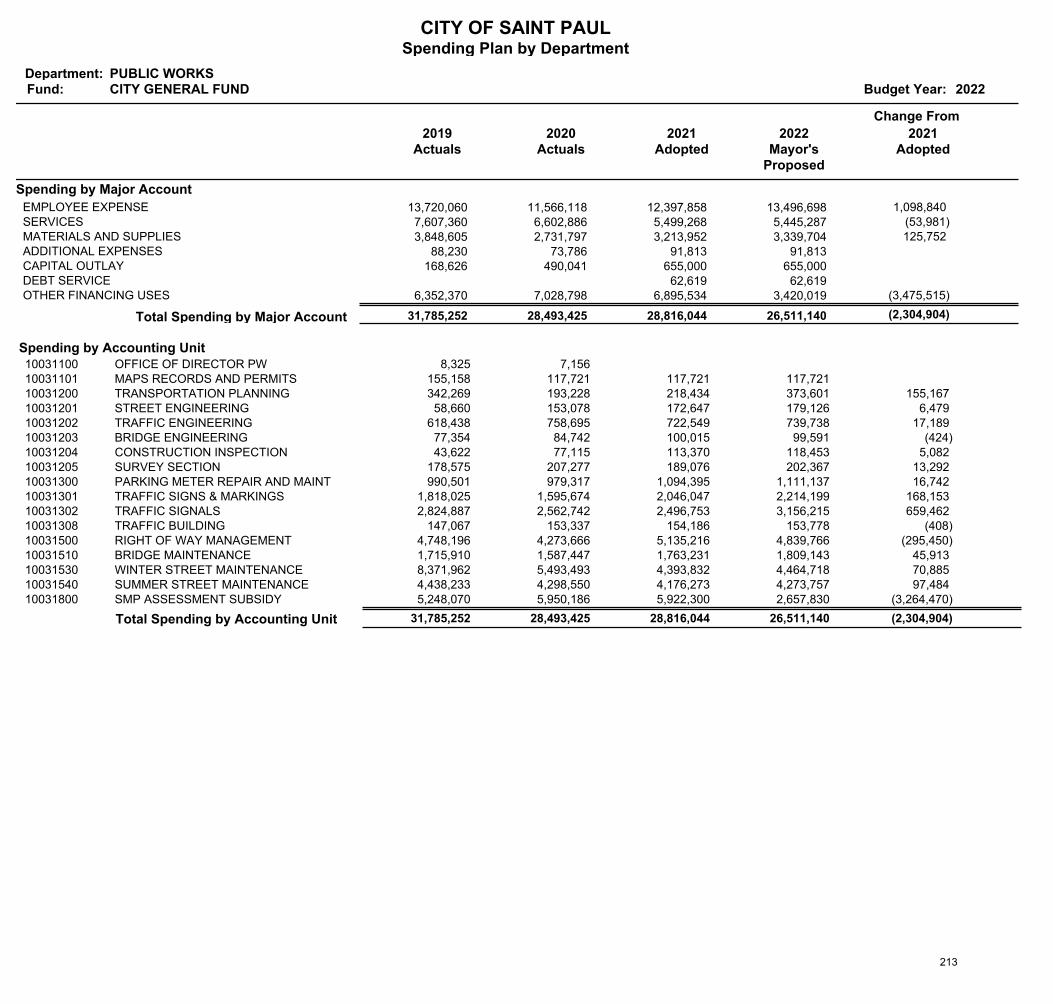
CITY OF SAINT PAULSpending Plan by Department
Department:Fund: Budget Year: 2022
PUBLIC WORKSCITY GENERAL FUND
2019Actuals
Change From
2020Actuals
2021Adopted
2022Mayor's
Proposed
2021Adopted
Spending by Major Account
13,720,060 11,566,118 12,397,858 13,496,698 EMPLOYEE EXPENSE 1,098,840 7,607,360 6,602,886 5,499,268 5,445,287 SERVICES (53,981) 3,848,605 2,731,797 3,213,952 3,339,704 MATERIALS AND SUPPLIES 125,752
88,230 73,786 91,813 91,813 ADDITIONAL EXPENSES 168,626 490,041 655,000 655,000 CAPITAL OUTLAY
62,619 62,619 DEBT SERVICE 6,352,370 7,028,798 6,895,534 3,420,019 OTHER FINANCING USES (3,475,515)
(2,304,904) 26,511,140 28,816,044 28,493,425 31,785,252 Total Spending by Major Account
Spending by Accounting UnitOFFICE OF DIRECTOR PW 8,325 7,156 10031100MAPS RECORDS AND PERMITS 155,158 117,721 117,721 117,721 10031101TRANSPORTATION PLANNING 342,269 373,601 218,434 193,228 10031200 155,167 STREET ENGINEERING 58,660 179,126 172,647 153,078 10031201 6,479 TRAFFIC ENGINEERING 618,438 739,738 722,549 758,695 10031202 17,189 BRIDGE ENGINEERING 77,354 99,591 100,015 84,742 10031203 (424)CONSTRUCTION INSPECTION 43,622 118,453 113,370 77,115 10031204 5,082 SURVEY SECTION 178,575 202,367 189,076 207,277 10031205 13,292 PARKING METER REPAIR AND MAINT 990,501 1,111,137 1,094,395 979,317 10031300 16,742 TRAFFIC SIGNS & MARKINGS 1,818,025 2,214,199 2,046,047 1,595,674 10031301 168,153 TRAFFIC SIGNALS 2,824,887 3,156,215 2,496,753 2,562,742 10031302 659,462 TRAFFIC BUILDING 147,067 153,778 154,186 153,337 10031308 (408)RIGHT OF WAY MANAGEMENT 4,748,196 4,839,766 5,135,216 4,273,666 10031500 (295,450)BRIDGE MAINTENANCE 1,715,910 1,809,143 1,763,231 1,587,447 10031510 45,913 WINTER STREET MAINTENANCE 8,371,962 4,464,718 4,393,832 5,493,493 10031530 70,885 SUMMER STREET MAINTENANCE 4,438,233 4,273,757 4,176,273 4,298,550 10031540 97,484 SMP ASSESSMENT SUBSIDY 5,248,070 2,657,830 5,922,300 5,950,186 10031800 (3,264,470)
Total Spending by Accounting Unit 31,785,252 26,511,140 (2,304,904) 28,493,425 28,816,044
213
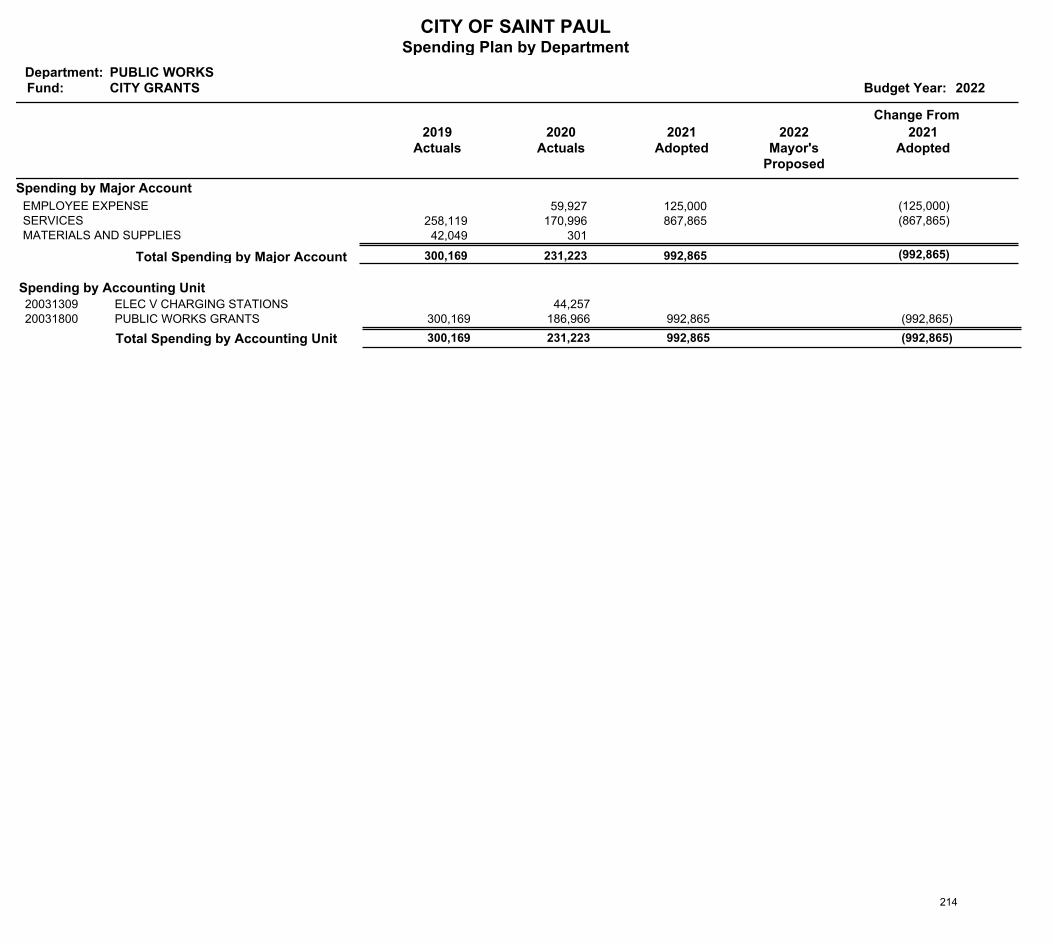
CITY OF SAINT PAULSpending Plan by Department
Department:Fund: Budget Year: 2022
PUBLIC WORKSCITY GRANTS
2019Actuals
Change From
2020Actuals
2021Adopted
2022Mayor's
Proposed
2021Adopted
Spending by Major Account
59,927 125,000 EMPLOYEE EXPENSE (125,000) 258,119 170,996 867,865 SERVICES (867,865) 42,049 301 MATERIALS AND SUPPLIES
(992,865) 992,865 231,223 300,169 Total Spending by Major Account
Spending by Accounting UnitELEC V CHARGING STATIONS 44,257 20031309PUBLIC WORKS GRANTS 300,169 992,865 186,966 20031800 (992,865)
Total Spending by Accounting Unit 300,169 (992,865) 231,223 992,865
214
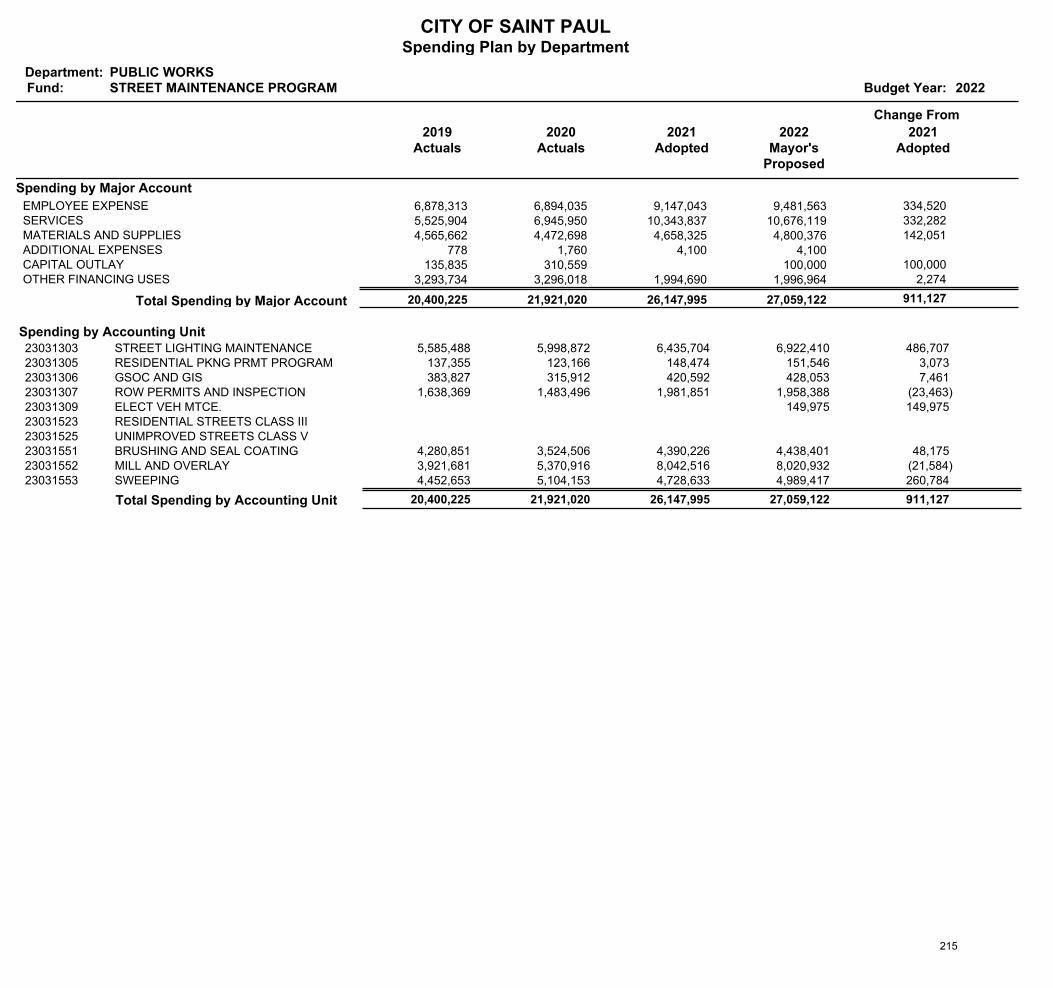
CITY OF SAINT PAULSpending Plan by Department
Department:Fund: Budget Year: 2022
PUBLIC WORKSSTREET MAINTENANCE PROGRAM
2019Actuals
Change From
2020Actuals
2021Adopted
2022Mayor's
Proposed
2021Adopted
Spending by Major Account
6,878,313 6,894,035 9,147,043 9,481,563 EMPLOYEE EXPENSE 334,520 5,525,904 6,945,950 10,343,837 10,676,119 SERVICES 332,282 4,565,662 4,472,698 4,658,325 4,800,376 MATERIALS AND SUPPLIES 142,051
778 1,760 4,100 4,100 ADDITIONAL EXPENSES 135,835 310,559 100,000 CAPITAL OUTLAY 100,000
3,293,734 3,296,018 1,994,690 1,996,964 OTHER FINANCING USES 2,274
911,127 27,059,122 26,147,995 21,921,020 20,400,225 Total Spending by Major Account
Spending by Accounting UnitSTREET LIGHTING MAINTENANCE 5,585,488 6,922,410 6,435,704 5,998,872 23031303 486,707 RESIDENTIAL PKNG PRMT PROGRAM 137,355 151,546 148,474 123,166 23031305 3,073 GSOC AND GIS 383,827 428,053 420,592 315,912 23031306 7,461 ROW PERMITS AND INSPECTION 1,638,369 1,958,388 1,981,851 1,483,496 23031307 (23,463)ELECT VEH MTCE. 149,975 23031309 149,975 RESIDENTIAL STREETS CLASS III23031523UNIMPROVED STREETS CLASS V23031525BRUSHING AND SEAL COATING 4,280,851 4,438,401 4,390,226 3,524,506 23031551 48,175 MILL AND OVERLAY 3,921,681 8,020,932 8,042,516 5,370,916 23031552 (21,584)SWEEPING 4,452,653 4,989,417 4,728,633 5,104,153 23031553 260,784
Total Spending by Accounting Unit 20,400,225 27,059,122 911,127 21,921,020 26,147,995
215

CITY OF SAINT PAULSpending Plan by Department
Department:Fund: Budget Year: 2022
PUBLIC WORKSSTREET LIGHTING DISTRICTS
2019Actuals
Change From
2020Actuals
2021Adopted
2022Mayor's
Proposed
2021Adopted
Spending by Major Account
128,931 109,369 174,452 174,455 SERVICES 3 146,949 124,223 215,000 215,000 MATERIALS AND SUPPLIES
137 133 118 141 OTHER FINANCING USES 23
26 389,596 389,570 233,725 276,017 Total Spending by Major Account
Spending by Accounting UnitSTREET LIGHTING DISTRICTS 276,017 389,596 389,570 233,725 23131300 26
Total Spending by Accounting Unit 276,017 389,596 26 233,725 389,570
216
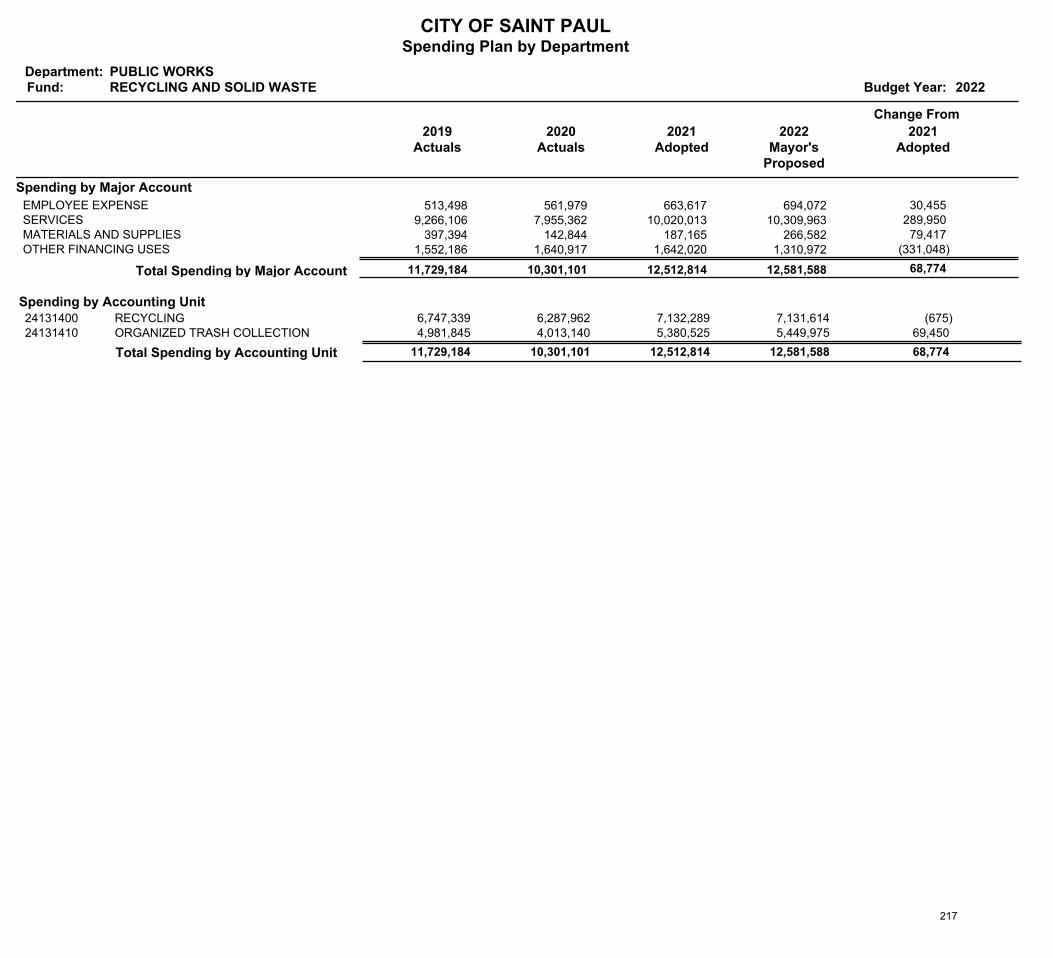
CITY OF SAINT PAULSpending Plan by Department
Department:Fund: Budget Year: 2022
PUBLIC WORKSRECYCLING AND SOLID WASTE
2019Actuals
Change From
2020Actuals
2021Adopted
2022Mayor's
Proposed
2021Adopted
Spending by Major Account
513,498 561,979 663,617 694,072 EMPLOYEE EXPENSE 30,455 9,266,106 7,955,362 10,020,013 10,309,963 SERVICES 289,950
397,394 142,844 187,165 266,582 MATERIALS AND SUPPLIES 79,417 1,552,186 1,640,917 1,642,020 1,310,972 OTHER FINANCING USES (331,048)
68,774 12,581,588 12,512,814 10,301,101 11,729,184 Total Spending by Major Account
Spending by Accounting UnitRECYCLING 6,747,339 7,131,614 7,132,289 6,287,962 24131400 (675)ORGANIZED TRASH COLLECTION 4,981,845 5,449,975 5,380,525 4,013,140 24131410 69,450
Total Spending by Accounting Unit 11,729,184 12,581,588 68,774 10,301,101 12,512,814
217
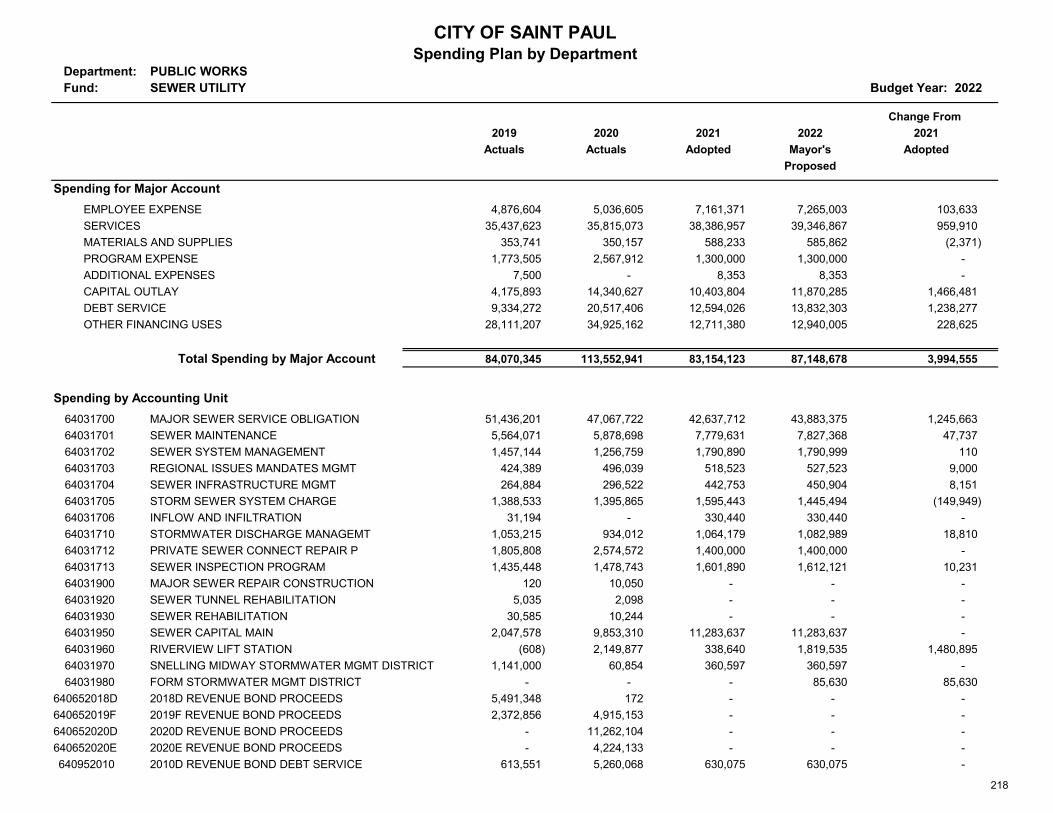
Department: PUBLIC WORKSFund: SEWER UTILITY Budget Year: 2022
Change From 2019 2020 2021 2022 2021
Actuals Actuals Adopted Mayor's AdoptedProposed
Spending for Major AccountEMPLOYEE EXPENSE 4,876,604 5,036,605 7,161,371 7,265,003 103,633 SERVICES 35,437,623 35,815,073 38,386,957 39,346,867 959,910 MATERIALS AND SUPPLIES 353,741 350,157 588,233 585,862 (2,371) PROGRAM EXPENSE 1,773,505 2,567,912 1,300,000 1,300,000 - ADDITIONAL EXPENSES 7,500 - 8,353 8,353 - CAPITAL OUTLAY 4,175,893 14,340,627 10,403,804 11,870,285 1,466,481 DEBT SERVICE 9,334,272 20,517,406 12,594,026 13,832,303 1,238,277 OTHER FINANCING USES 28,111,207 34,925,162 12,711,380 12,940,005 228,625
Total Spending by Major Account 84,070,345 113,552,941 83,154,123 87,148,678 3,994,555
Spending by Accounting Unit64031700 MAJOR SEWER SERVICE OBLIGATION 51,436,201 47,067,722 42,637,712 43,883,375 1,245,663 64031701 SEWER MAINTENANCE 5,564,071 5,878,698 7,779,631 7,827,368 47,737 64031702 SEWER SYSTEM MANAGEMENT 1,457,144 1,256,759 1,790,890 1,790,999 110 64031703 REGIONAL ISSUES MANDATES MGMT 424,389 496,039 518,523 527,523 9,000 64031704 SEWER INFRASTRUCTURE MGMT 264,884 296,522 442,753 450,904 8,151 64031705 STORM SEWER SYSTEM CHARGE 1,388,533 1,395,865 1,595,443 1,445,494 (149,949) 64031706 INFLOW AND INFILTRATION 31,194 - 330,440 330,440 - 64031710 STORMWATER DISCHARGE MANAGEMT 1,053,215 934,012 1,064,179 1,082,989 18,810 64031712 PRIVATE SEWER CONNECT REPAIR P 1,805,808 2,574,572 1,400,000 1,400,000 - 64031713 SEWER INSPECTION PROGRAM 1,435,448 1,478,743 1,601,890 1,612,121 10,231 64031900 MAJOR SEWER REPAIR CONSTRUCTION 120 10,050 - - - 64031920 SEWER TUNNEL REHABILITATION 5,035 2,098 - - - 64031930 SEWER REHABILITATION 30,585 10,244 - - - 64031950 SEWER CAPITAL MAIN 2,047,578 9,853,310 11,283,637 11,283,637 - 64031960 RIVERVIEW LIFT STATION (608) 2,149,877 338,640 1,819,535 1,480,895 64031970 SNELLING MIDWAY STORMWATER MGMT DISTRICT 1,141,000 60,854 360,597 360,597 - 64031980 FORM STORMWATER MGMT DISTRICT - - - 85,630 85,630
640652018D 2018D REVENUE BOND PROCEEDS 5,491,348 172 - - - 640652019F 2019F REVENUE BOND PROCEEDS 2,372,856 4,915,153 - - - 640652020D 2020D REVENUE BOND PROCEEDS - 11,262,104 - - - 640652020E 2020E REVENUE BOND PROCEEDS - 4,224,133 - - - 640952010 2010D REVENUE BOND DEBT SERVICE 613,551 5,260,068 630,075 630,075 -
CITY OF SAINT PAULSpending Plan by Department
218
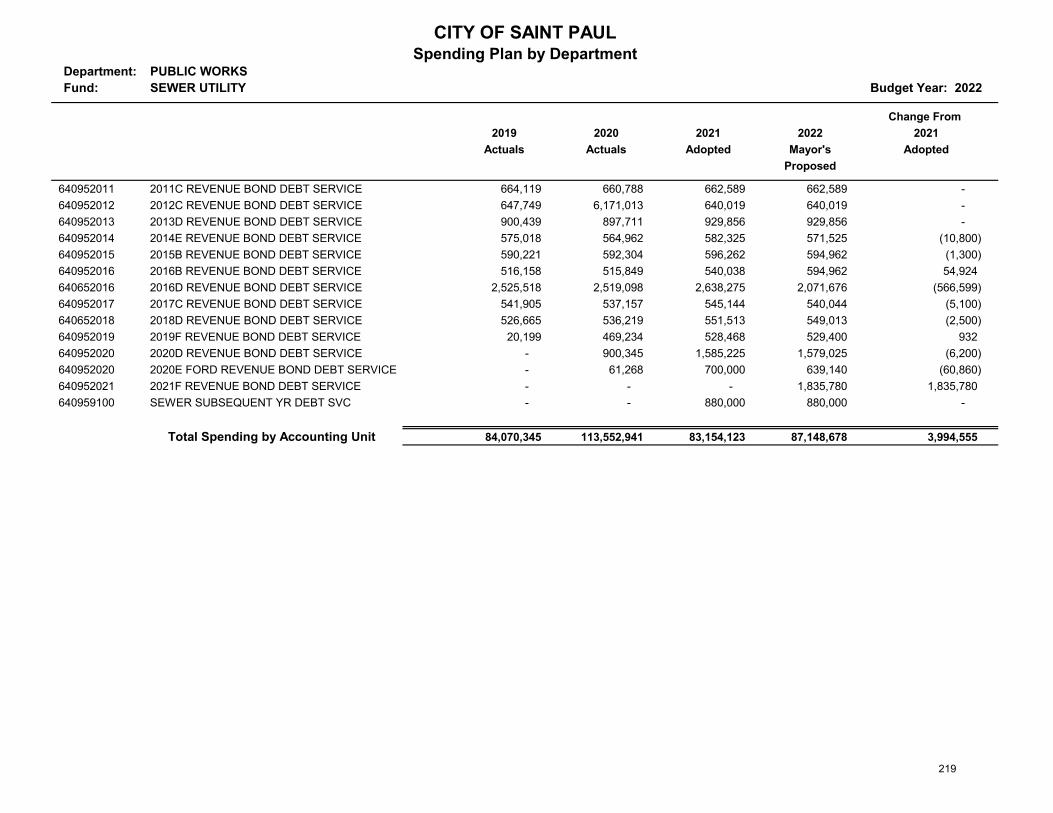
Department: PUBLIC WORKSFund: SEWER UTILITY Budget Year: 2022
Change From 2019 2020 2021 2022 2021
Actuals Actuals Adopted Mayor's AdoptedProposed
CITY OF SAINT PAULSpending Plan by Department
640952011 2011C REVENUE BOND DEBT SERVICE 664,119 660,788 662,589 662,589 - 640952012 2012C REVENUE BOND DEBT SERVICE 647,749 6,171,013 640,019 640,019 - 640952013 2013D REVENUE BOND DEBT SERVICE 900,439 897,711 929,856 929,856 - 640952014 2014E REVENUE BOND DEBT SERVICE 575,018 564,962 582,325 571,525 (10,800) 640952015 2015B REVENUE BOND DEBT SERVICE 590,221 592,304 596,262 594,962 (1,300) 640952016 2016B REVENUE BOND DEBT SERVICE 516,158 515,849 540,038 594,962 54,924 640652016 2016D REVENUE BOND DEBT SERVICE 2,525,518 2,519,098 2,638,275 2,071,676 (566,599) 640952017 2017C REVENUE BOND DEBT SERVICE 541,905 537,157 545,144 540,044 (5,100) 640652018 2018D REVENUE BOND DEBT SERVICE 526,665 536,219 551,513 549,013 (2,500) 640952019 2019F REVENUE BOND DEBT SERVICE 20,199 469,234 528,468 529,400 932 640952020 2020D REVENUE BOND DEBT SERVICE - 900,345 1,585,225 1,579,025 (6,200) 640952020 2020E FORD REVENUE BOND DEBT SERVICE - 61,268 700,000 639,140 (60,860) 640952021 2021F REVENUE BOND DEBT SERVICE - - - 1,835,780 1,835,780 640959100 SEWER SUBSEQUENT YR DEBT SVC - - 880,000 880,000 -
Total Spending by Accounting Unit 84,070,345 113,552,941 83,154,123 87,148,678 3,994,555
219
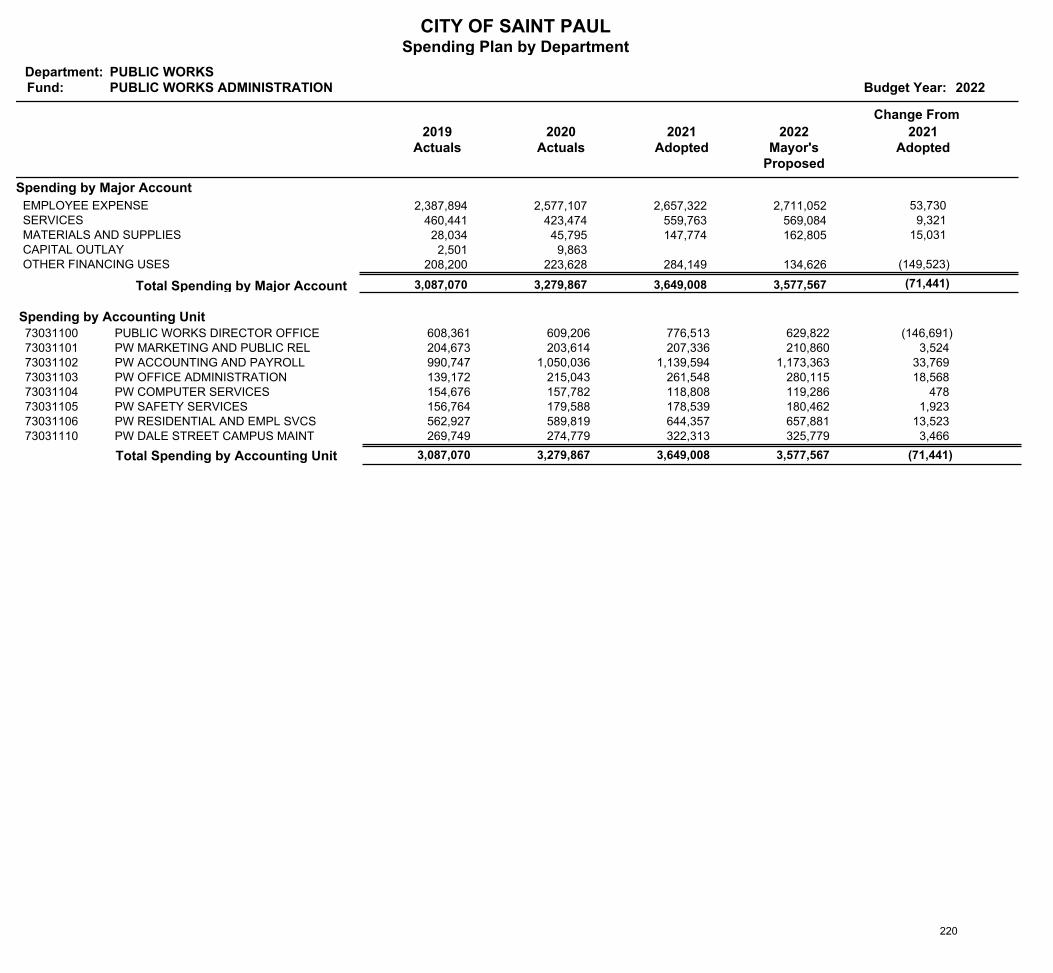
CITY OF SAINT PAULSpending Plan by Department
Department:Fund: Budget Year: 2022
PUBLIC WORKSPUBLIC WORKS ADMINISTRATION
2019Actuals
Change From
2020Actuals
2021Adopted
2022Mayor's
Proposed
2021Adopted
Spending by Major Account
2,387,894 2,577,107 2,657,322 2,711,052 EMPLOYEE EXPENSE 53,730 460,441 423,474 559,763 569,084 SERVICES 9,321 28,034 45,795 147,774 162,805 MATERIALS AND SUPPLIES 15,031 2,501 9,863 CAPITAL OUTLAY
208,200 223,628 284,149 134,626 OTHER FINANCING USES (149,523)
(71,441) 3,577,567 3,649,008 3,279,867 3,087,070 Total Spending by Major Account
Spending by Accounting UnitPUBLIC WORKS DIRECTOR OFFICE 608,361 629,822 776,513 609,206 73031100 (146,691)PW MARKETING AND PUBLIC REL 204,673 210,860 207,336 203,614 73031101 3,524 PW ACCOUNTING AND PAYROLL 990,747 1,173,363 1,139,594 1,050,036 73031102 33,769 PW OFFICE ADMINISTRATION 139,172 280,115 261,548 215,043 73031103 18,568 PW COMPUTER SERVICES 154,676 119,286 118,808 157,782 73031104 478 PW SAFETY SERVICES 156,764 180,462 178,539 179,588 73031105 1,923 PW RESIDENTIAL AND EMPL SVCS 562,927 657,881 644,357 589,819 73031106 13,523 PW DALE STREET CAMPUS MAINT 269,749 325,779 322,313 274,779 73031110 3,466
Total Spending by Accounting Unit 3,087,070 3,577,567 (71,441) 3,279,867 3,649,008
220
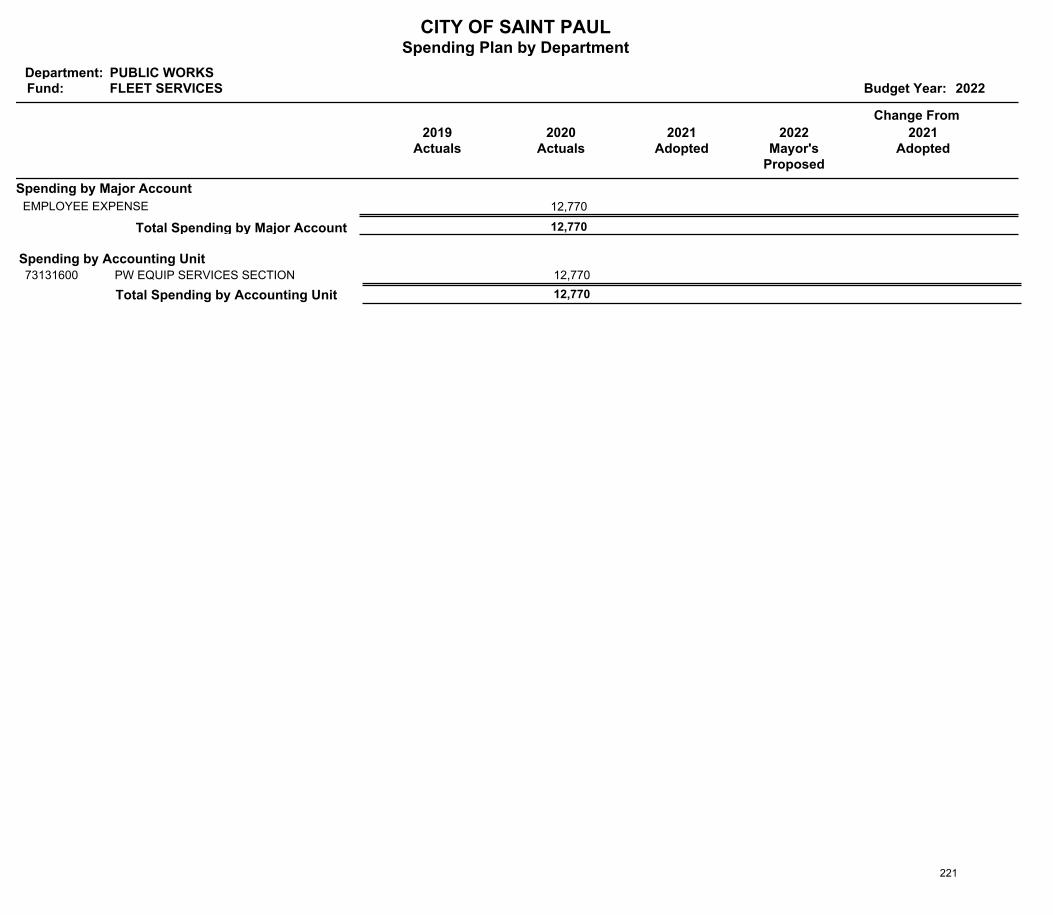
CITY OF SAINT PAULSpending Plan by Department
Department:Fund: Budget Year: 2022
PUBLIC WORKSFLEET SERVICES
2019Actuals
Change From
2020Actuals
2021Adopted
2022Mayor's
Proposed
2021Adopted
Spending by Major Account
12,770 EMPLOYEE EXPENSE
12,770 Total Spending by Major Account
Spending by Accounting UnitPW EQUIP SERVICES SECTION 12,770 73131600
Total Spending by Accounting Unit 12,770
221
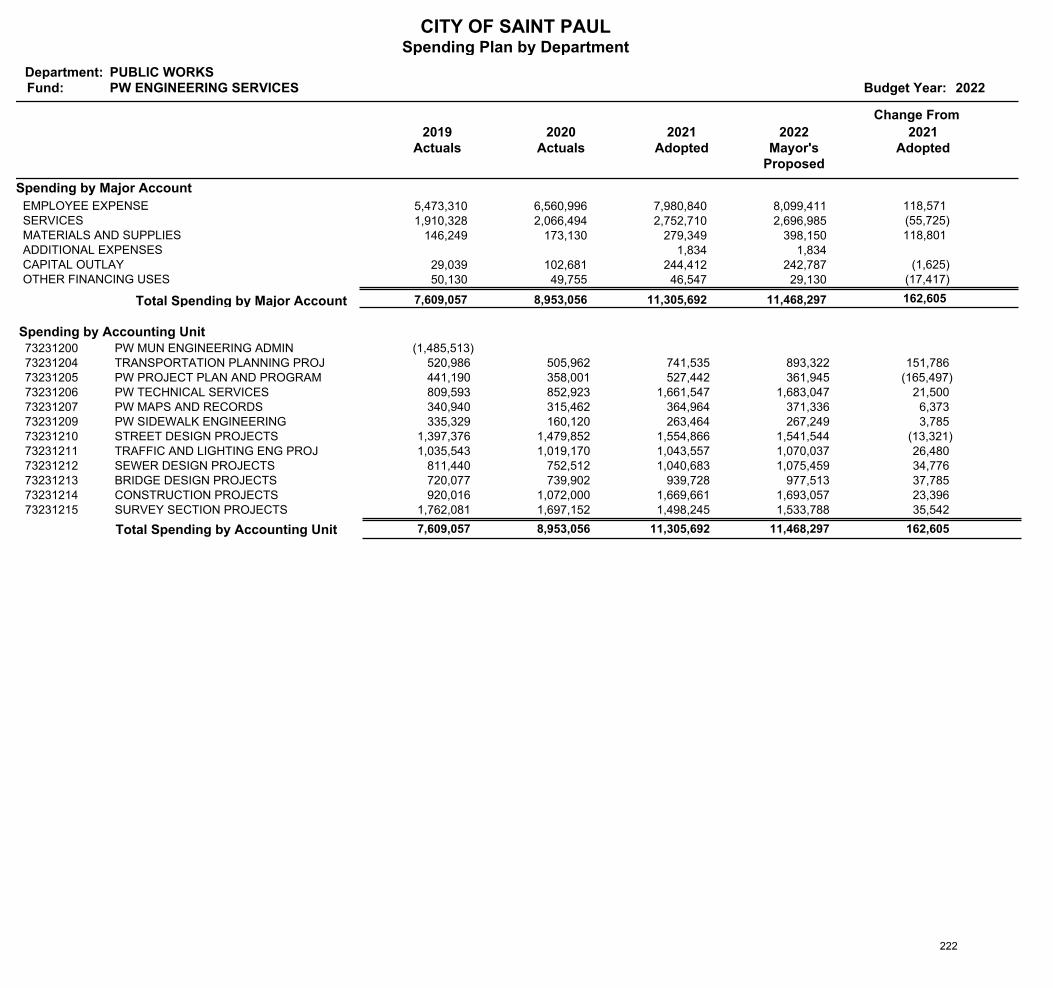
CITY OF SAINT PAULSpending Plan by Department
Department:Fund: Budget Year: 2022
PUBLIC WORKSPW ENGINEERING SERVICES
2019Actuals
Change From
2020Actuals
2021Adopted
2022Mayor's
Proposed
2021Adopted
Spending by Major Account
5,473,310 6,560,996 7,980,840 8,099,411 EMPLOYEE EXPENSE 118,571 1,910,328 2,066,494 2,752,710 2,696,985 SERVICES (55,725)
146,249 173,130 279,349 398,150 MATERIALS AND SUPPLIES 118,801 1,834 1,834 ADDITIONAL EXPENSES
29,039 102,681 244,412 242,787 CAPITAL OUTLAY (1,625) 50,130 49,755 46,547 29,130 OTHER FINANCING USES (17,417)
162,605 11,468,297 11,305,692 8,953,056 7,609,057 Total Spending by Major Account
Spending by Accounting UnitPW MUN ENGINEERING ADMIN (1,485,513)73231200TRANSPORTATION PLANNING PROJ 520,986 893,322 741,535 505,962 73231204 151,786 PW PROJECT PLAN AND PROGRAM 441,190 361,945 527,442 358,001 73231205 (165,497)PW TECHNICAL SERVICES 809,593 1,683,047 1,661,547 852,923 73231206 21,500 PW MAPS AND RECORDS 340,940 371,336 364,964 315,462 73231207 6,373 PW SIDEWALK ENGINEERING 335,329 267,249 263,464 160,120 73231209 3,785 STREET DESIGN PROJECTS 1,397,376 1,541,544 1,554,866 1,479,852 73231210 (13,321)TRAFFIC AND LIGHTING ENG PROJ 1,035,543 1,070,037 1,043,557 1,019,170 73231211 26,480 SEWER DESIGN PROJECTS 811,440 1,075,459 1,040,683 752,512 73231212 34,776 BRIDGE DESIGN PROJECTS 720,077 977,513 939,728 739,902 73231213 37,785 CONSTRUCTION PROJECTS 920,016 1,693,057 1,669,661 1,072,000 73231214 23,396 SURVEY SECTION PROJECTS 1,762,081 1,533,788 1,498,245 1,697,152 73231215 35,542
Total Spending by Accounting Unit 7,609,057 11,468,297 162,605 8,953,056 11,305,692
222

CITY OF SAINT PAULSpending Plan by Department
Department:Fund: Budget Year: 2022
PUBLIC WORKSASPHALT PLANT
2019Actuals
Change From
2020Actuals
2021Adopted
2022Mayor's
Proposed
2021Adopted
Spending by Major Account
432,079 438,328 437,292 441,839 EMPLOYEE EXPENSE 4,547 251,480 178,715 193,316 197,664 SERVICES 4,348
2,674,540 2,909,827 3,067,762 3,065,932 MATERIALS AND SUPPLIES (1,830) 177,037 14,887 300,000 CAPITAL OUTLAY (300,000)(159,007) 1,535 1,457 1,737 OTHER FINANCING USES 280
(292,655) 3,707,172 3,999,827 3,543,292 3,376,128 Total Spending by Major Account
Spending by Accounting UnitASPHALT PAVING PLANT 3,376,128 3,707,172 3,999,827 3,543,292 73331500 (292,655)
Total Spending by Accounting Unit 3,376,128 3,707,172 (292,655) 3,543,292 3,999,827
223
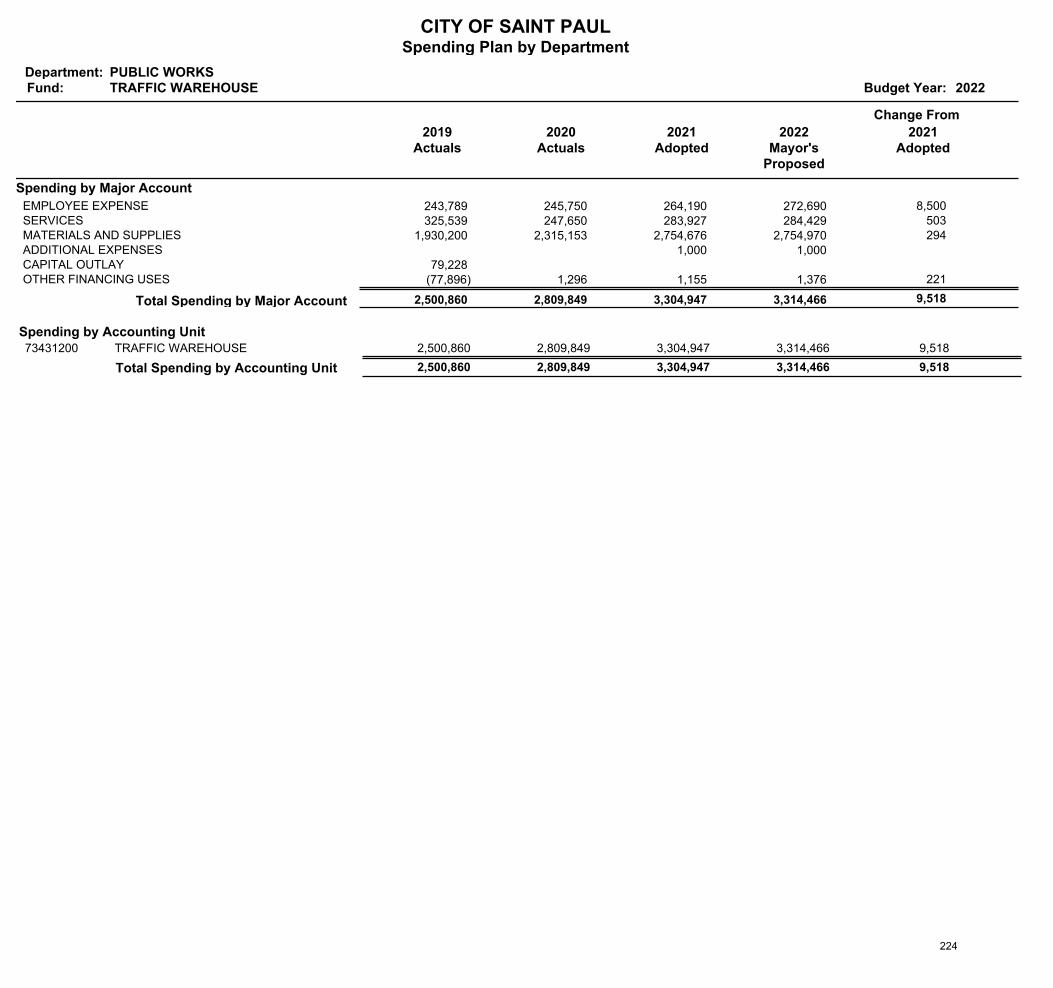
CITY OF SAINT PAULSpending Plan by Department
Department:Fund: Budget Year: 2022
PUBLIC WORKSTRAFFIC WAREHOUSE
2019Actuals
Change From
2020Actuals
2021Adopted
2022Mayor's
Proposed
2021Adopted
Spending by Major Account
243,789 245,750 264,190 272,690 EMPLOYEE EXPENSE 8,500 325,539 247,650 283,927 284,429 SERVICES 503
1,930,200 2,315,153 2,754,676 2,754,970 MATERIALS AND SUPPLIES 294 1,000 1,000 ADDITIONAL EXPENSES
79,228 CAPITAL OUTLAY(77,896) 1,296 1,155 1,376 OTHER FINANCING USES 221
9,518 3,314,466 3,304,947 2,809,849 2,500,860 Total Spending by Major Account
Spending by Accounting UnitTRAFFIC WAREHOUSE 2,500,860 3,314,466 3,304,947 2,809,849 73431200 9,518
Total Spending by Accounting Unit 2,500,860 3,314,466 9,518 2,809,849 3,304,947
224

Financing Reports 225
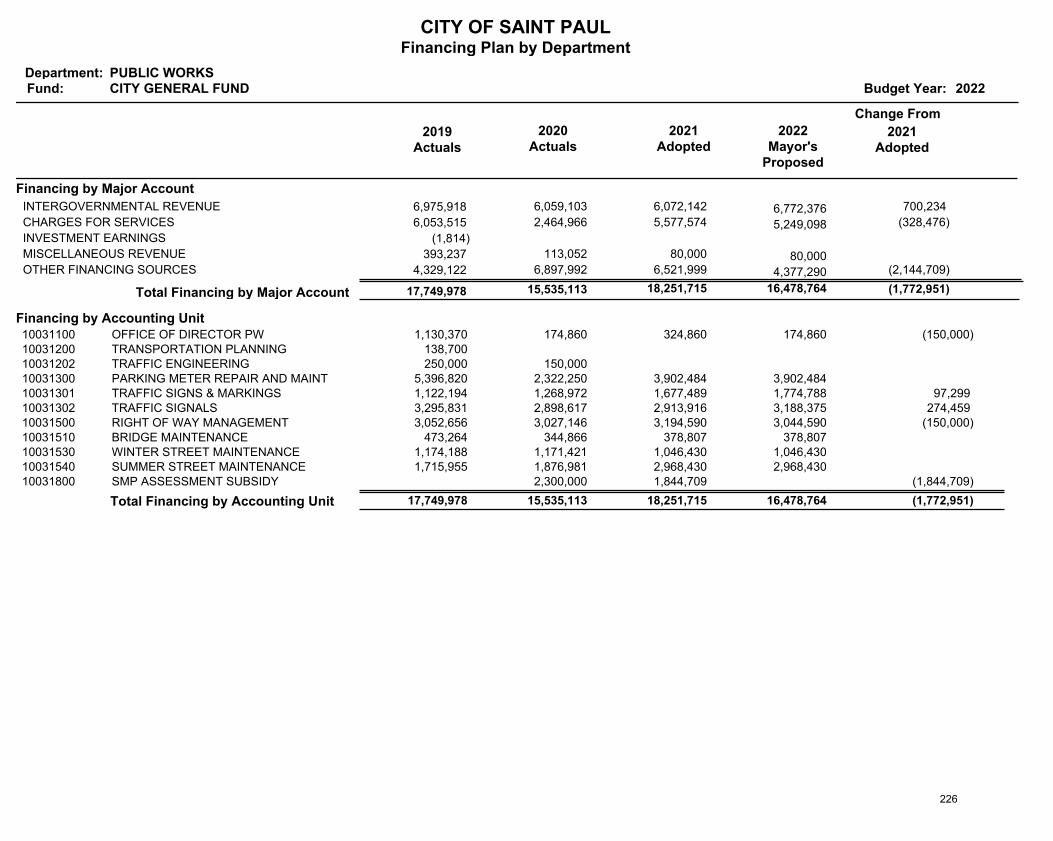
CITY OF SAINT PAULFinancing Plan by Department
Department:Fund: Budget Year: 2022
PUBLIC WORKSCITY GENERAL FUND
2019Actuals
Change From
2020Actuals
2021Adopted
2022Mayor's
Proposed
2021Adopted
Financing by Major Account
6,975,918 6,059,103 6,072,142 6,772,376 INTERGOVERNMENTAL REVENUE 700,234
6,053,515 2,464,966 5,577,574 5,249,098 CHARGES FOR SERVICES (328,476)
(1,814)INVESTMENT EARNINGS
393,237 113,052 80,000 80,000 MISCELLANEOUS REVENUE
4,329,122 6,897,992 6,521,999 4,377,290 OTHER FINANCING SOURCES (2,144,709)
(1,772,951) 16,478,764 18,251,715 15,535,113 17,749,978 Total Financing by Major Account
Financing by Accounting UnitOFFICE OF DIRECTOR PW 1,130,370 174,860 324,860 174,860 10031100 (150,000)TRANSPORTATION PLANNING 138,700 10031200TRAFFIC ENGINEERING 250,000 150,000 10031202PARKING METER REPAIR AND MAINT 5,396,820 3,902,484 3,902,484 2,322,250 10031300TRAFFIC SIGNS & MARKINGS 1,122,194 1,774,788 1,677,489 1,268,972 10031301 97,299 TRAFFIC SIGNALS 3,295,831 3,188,375 2,913,916 2,898,617 10031302 274,459 RIGHT OF WAY MANAGEMENT 3,052,656 3,044,590 3,194,590 3,027,146 10031500 (150,000)BRIDGE MAINTENANCE 473,264 378,807 378,807 344,866 10031510WINTER STREET MAINTENANCE 1,174,188 1,046,430 1,046,430 1,171,421 10031530SUMMER STREET MAINTENANCE 1,715,955 2,968,430 2,968,430 1,876,981 10031540SMP ASSESSMENT SUBSIDY 1,844,709 2,300,000 10031800 (1,844,709)
Total Financing by Accounting Unit 17,749,978 16,478,764 (1,772,951) 15,535,113 18,251,715
226
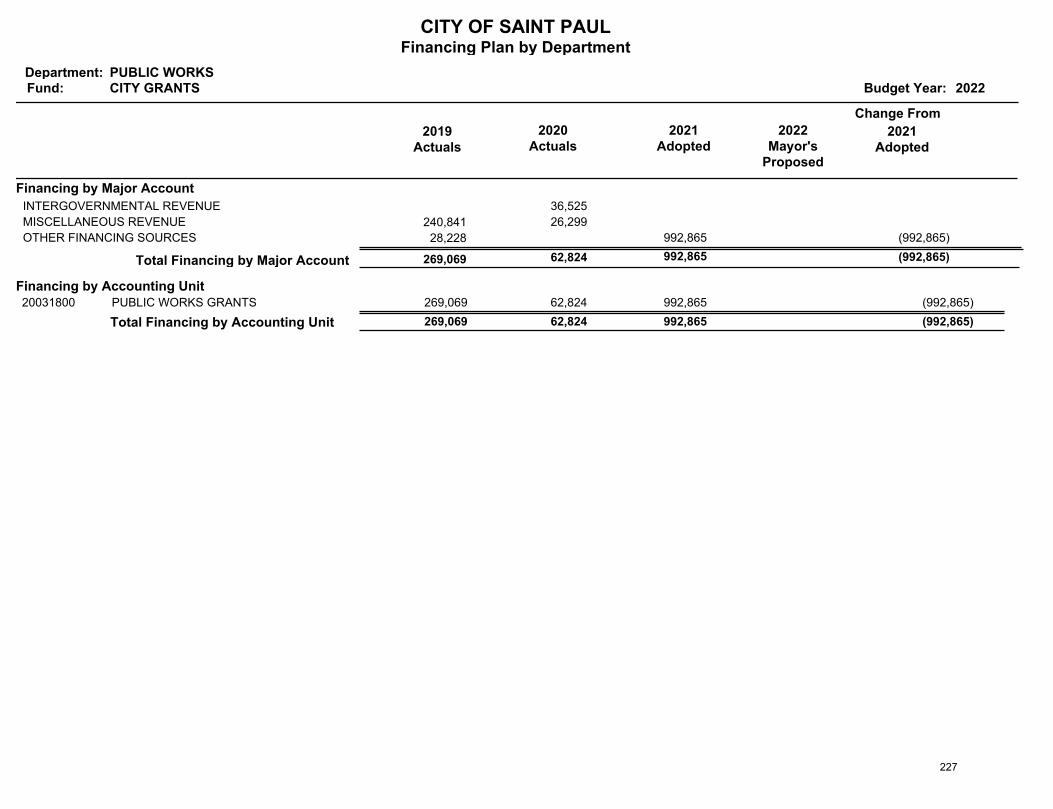
CITY OF SAINT PAULFinancing Plan by Department
Department:Fund: Budget Year: 2022
PUBLIC WORKSCITY GRANTS
2019Actuals
Change From
2020Actuals
2021Adopted
2022Mayor's
Proposed
2021Adopted
Financing by Major Account
36,525 INTERGOVERNMENTAL REVENUE
240,841 26,299 MISCELLANEOUS REVENUE
28,228 992,865 OTHER FINANCING SOURCES (992,865)
(992,865) 992,865 62,824 269,069 Total Financing by Major Account
Financing by Accounting UnitPUBLIC WORKS GRANTS 269,069 992,865 62,824 20031800 (992,865)
Total Financing by Accounting Unit 269,069 (992,865) 62,824 992,865
227
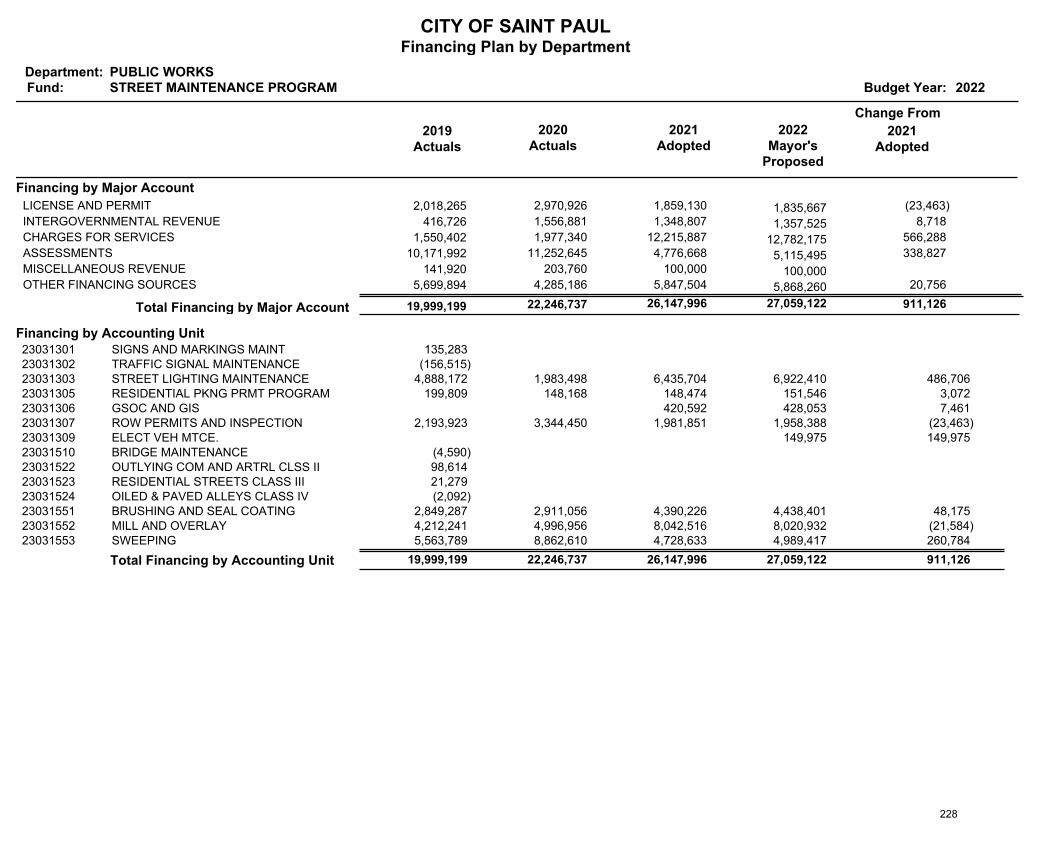
CITY OF SAINT PAULFinancing Plan by Department
Department:Fund: Budget Year: 2022
PUBLIC WORKSSTREET MAINTENANCE PROGRAM
2019Actuals
Change From
2020Actuals
2021Adopted
2022Mayor's
Proposed
2021Adopted
Financing by Major Account
2,018,265 2,970,926 1,859,130 1,835,667 LICENSE AND PERMIT (23,463)
416,726 1,556,881 1,348,807 1,357,525 INTERGOVERNMENTAL REVENUE 8,718
1,550,402 1,977,340 12,215,887 12,782,175 CHARGES FOR SERVICES 566,288
10,171,992 11,252,645 4,776,668 5,115,495 ASSESSMENTS 338,827
141,920 203,760 100,000 100,000 MISCELLANEOUS REVENUE
5,699,894 4,285,186 5,847,504 5,868,260 OTHER FINANCING SOURCES 20,756
911,126 27,059,122 26,147,996 22,246,737 19,999,199 Total Financing by Major Account
Financing by Accounting UnitSIGNS AND MARKINGS MAINT 135,283 23031301TRAFFIC SIGNAL MAINTENANCE (156,515)23031302STREET LIGHTING MAINTENANCE 4,888,172 6,922,410 6,435,704 1,983,498 23031303 486,706 RESIDENTIAL PKNG PRMT PROGRAM 199,809 151,546 148,474 148,168 23031305 3,072 GSOC AND GIS 428,053 420,592 23031306 7,461 ROW PERMITS AND INSPECTION 2,193,923 1,958,388 1,981,851 3,344,450 23031307 (23,463)ELECT VEH MTCE. 149,975 23031309 149,975 BRIDGE MAINTENANCE (4,590)23031510OUTLYING COM AND ARTRL CLSS II 98,614 23031522RESIDENTIAL STREETS CLASS III 21,279 23031523OILED & PAVED ALLEYS CLASS IV (2,092)23031524BRUSHING AND SEAL COATING 2,849,287 4,438,401 4,390,226 2,911,056 23031551 48,175 MILL AND OVERLAY 4,212,241 8,020,932 8,042,516 4,996,956 23031552 (21,584)SWEEPING 5,563,789 4,989,417 4,728,633 8,862,610 23031553 260,784
Total Financing by Accounting Unit 19,999,199 27,059,122 911,126 22,246,737 26,147,996
228

CITY OF SAINT PAULFinancing Plan by Department
Department:Fund: Budget Year: 2022
PUBLIC WORKSSTREET LIGHTING DISTRICTS
2019Actuals
Change From
2020Actuals
2021Adopted
2022Mayor's
Proposed
2021Adopted
Financing by Major Account
219,993 274,441 389,570 389,596 ASSESSMENTS 26
26 389,596 389,570 274,441 219,993 Total Financing by Major Account
Financing by Accounting UnitSTREET LIGHTING DISTRICTS 219,993 389,596 389,570 274,441 23131300 26
Total Financing by Accounting Unit 219,993 389,596 26 274,441 389,570
229
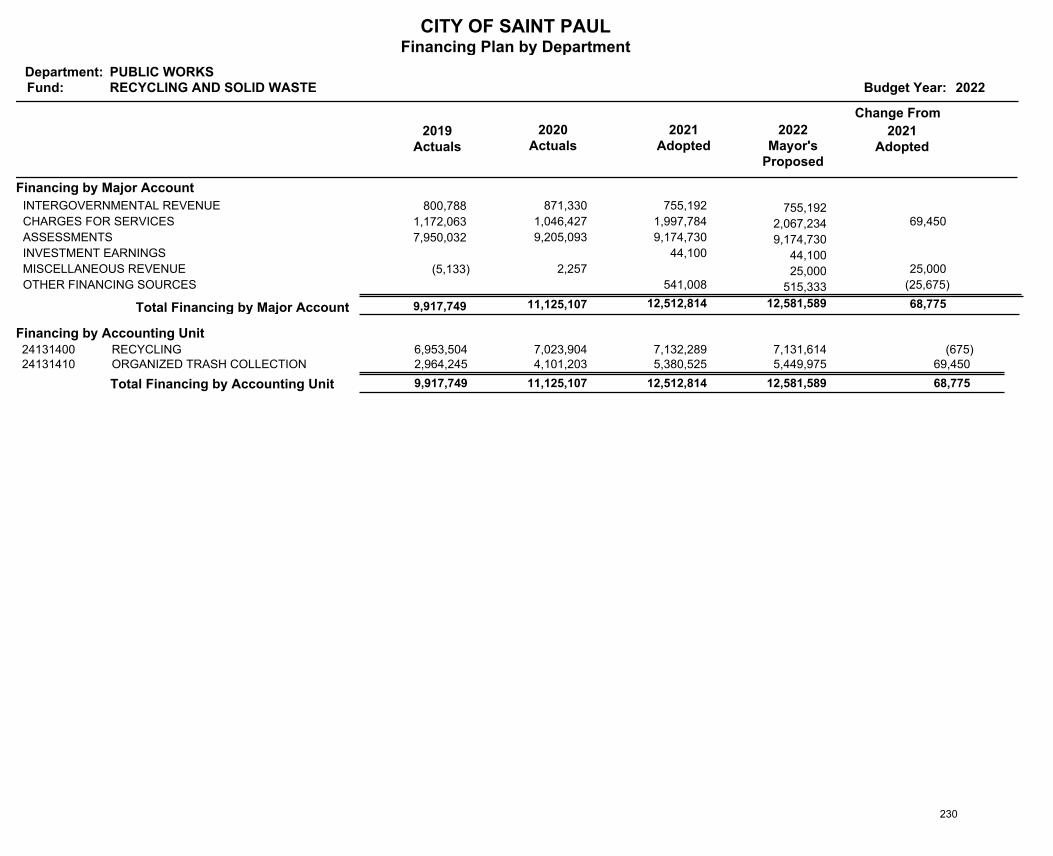
CITY OF SAINT PAULFinancing Plan by Department
Department:Fund: Budget Year: 2022
PUBLIC WORKSRECYCLING AND SOLID WASTE
2019Actuals
Change From
2020Actuals
2021Adopted
2022Mayor's
Proposed
2021Adopted
Financing by Major Account
800,788 871,330 755,192 755,192 INTERGOVERNMENTAL REVENUE
1,172,063 1,046,427 1,997,784 2,067,234 CHARGES FOR SERVICES 69,450
7,950,032 9,205,093 9,174,730 9,174,730 ASSESSMENTS
44,100 44,100 INVESTMENT EARNINGS
(5,133) 2,257 25,000 MISCELLANEOUS REVENUE 25,000
541,008 515,333 OTHER FINANCING SOURCES (25,675)
68,775 12,581,589 12,512,814 11,125,107 9,917,749 Total Financing by Major Account
Financing by Accounting UnitRECYCLING 6,953,504 7,131,614 7,132,289 7,023,904 24131400 (675)ORGANIZED TRASH COLLECTION 2,964,245 5,449,975 5,380,525 4,101,203 24131410 69,450
Total Financing by Accounting Unit 9,917,749 12,581,589 68,775 11,125,107 12,512,814
230
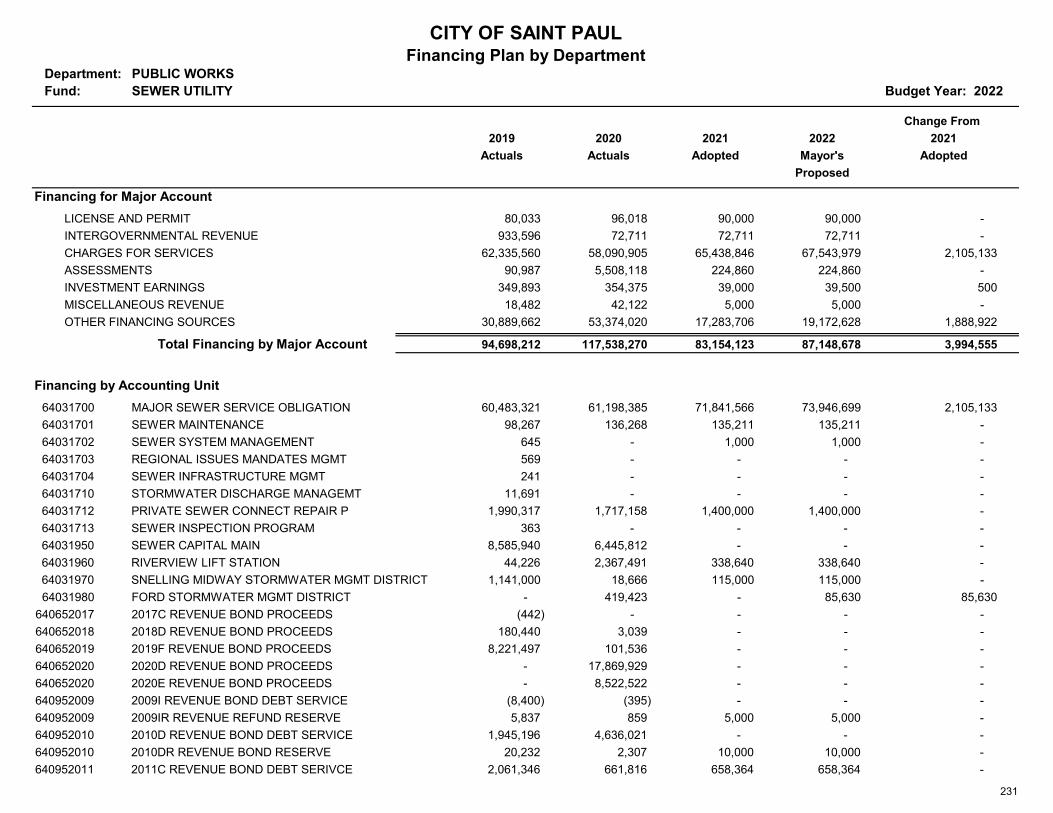
Department: PUBLIC WORKSFund: SEWER UTILITY Budget Year: 2022
Change From 2019 2020 2021 2022 2021
Actuals Actuals Adopted Mayor's AdoptedProposed
Financing for Major AccountLICENSE AND PERMIT 80,033 96,018 90,000 90,000 - INTERGOVERNMENTAL REVENUE 933,596 72,711 72,711 72,711 - CHARGES FOR SERVICES 62,335,560 58,090,905 65,438,846 67,543,979 2,105,133 ASSESSMENTS 90,987 5,508,118 224,860 224,860 - INVESTMENT EARNINGS 349,893 354,375 39,000 39,500 500 MISCELLANEOUS REVENUE 18,482 42,122 5,000 5,000 - OTHER FINANCING SOURCES 30,889,662 53,374,020 17,283,706 19,172,628 1,888,922
Total Financing by Major Account 94,698,212 117,538,270 83,154,123 87,148,678 3,994,555
Financing by Accounting Unit64031700 MAJOR SEWER SERVICE OBLIGATION 60,483,321 61,198,385 71,841,566 73,946,699 2,105,133 64031701 SEWER MAINTENANCE 98,267 136,268 135,211 135,211 - 64031702 SEWER SYSTEM MANAGEMENT 645 - 1,000 1,000 - 64031703 REGIONAL ISSUES MANDATES MGMT 569 - - - - 64031704 SEWER INFRASTRUCTURE MGMT 241 - - - - 64031710 STORMWATER DISCHARGE MANAGEMT 11,691 - - - - 64031712 PRIVATE SEWER CONNECT REPAIR P 1,990,317 1,717,158 1,400,000 1,400,000 - 64031713 SEWER INSPECTION PROGRAM 363 - - - - 64031950 SEWER CAPITAL MAIN 8,585,940 6,445,812 - - - 64031960 RIVERVIEW LIFT STATION 44,226 2,367,491 338,640 338,640 - 64031970 SNELLING MIDWAY STORMWATER MGMT DISTRICT 1,141,000 18,666 115,000 115,000 - 64031980 FORD STORMWATER MGMT DISTRICT - 419,423 - 85,630 85,630
640652017 2017C REVENUE BOND PROCEEDS (442) - - - - 640652018 2018D REVENUE BOND PROCEEDS 180,440 3,039 - - - 640652019 2019F REVENUE BOND PROCEEDS 8,221,497 101,536 - - - 640652020 2020D REVENUE BOND PROCEEDS - 17,869,929 - - - 640652020 2020E REVENUE BOND PROCEEDS - 8,522,522 - - - 640952009 2009I REVENUE BOND DEBT SERVICE (8,400) (395) - - - 640952009 2009IR REVENUE REFUND RESERVE 5,837 859 5,000 5,000 - 640952010 2010D REVENUE BOND DEBT SERVICE 1,945,196 4,636,021 - - - 640952010 2010DR REVENUE BOND RESERVE 20,232 2,307 10,000 10,000 - 640952011 2011C REVENUE BOND DEBT SERIVCE 2,061,346 661,816 658,364 658,364 -
CITY OF SAINT PAULFinancing Plan by Department
231
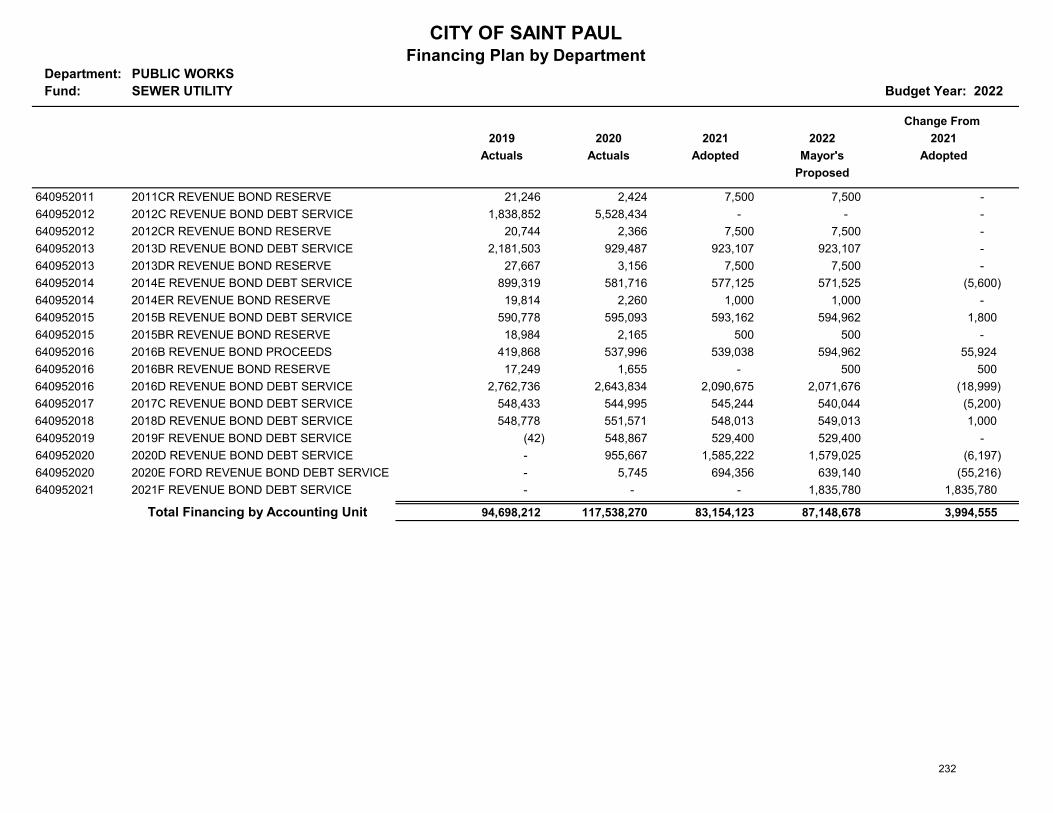
Department: PUBLIC WORKSFund: SEWER UTILITY Budget Year: 2022
Change From 2019 2020 2021 2022 2021
Actuals Actuals Adopted Mayor's AdoptedProposed
CITY OF SAINT PAULFinancing Plan by Department
640952011 2011CR REVENUE BOND RESERVE 21,246 2,424 7,500 7,500 - 640952012 2012C REVENUE BOND DEBT SERVICE 1,838,852 5,528,434 - - - 640952012 2012CR REVENUE BOND RESERVE 20,744 2,366 7,500 7,500 - 640952013 2013D REVENUE BOND DEBT SERVICE 2,181,503 929,487 923,107 923,107 - 640952013 2013DR REVENUE BOND RESERVE 27,667 3,156 7,500 7,500 - 640952014 2014E REVENUE BOND DEBT SERVICE 899,319 581,716 577,125 571,525 (5,600) 640952014 2014ER REVENUE BOND RESERVE 19,814 2,260 1,000 1,000 - 640952015 2015B REVENUE BOND DEBT SERVICE 590,778 595,093 593,162 594,962 1,800 640952015 2015BR REVENUE BOND RESERVE 18,984 2,165 500 500 - 640952016 2016B REVENUE BOND PROCEEDS 419,868 537,996 539,038 594,962 55,924 640952016 2016BR REVENUE BOND RESERVE 17,249 1,655 - 500 500 640952016 2016D REVENUE BOND DEBT SERVICE 2,762,736 2,643,834 2,090,675 2,071,676 (18,999) 640952017 2017C REVENUE BOND DEBT SERVICE 548,433 544,995 545,244 540,044 (5,200) 640952018 2018D REVENUE BOND DEBT SERVICE 548,778 551,571 548,013 549,013 1,000 640952019 2019F REVENUE BOND DEBT SERVICE (42) 548,867 529,400 529,400 - 640952020 2020D REVENUE BOND DEBT SERVICE - 955,667 1,585,222 1,579,025 (6,197) 640952020 2020E FORD REVENUE BOND DEBT SERVICE - 5,745 694,356 639,140 (55,216) 640952021 2021F REVENUE BOND DEBT SERVICE - - - 1,835,780 1,835,780
Total Financing by Accounting Unit 94,698,212 117,538,270 83,154,123 87,148,678 3,994,555
232
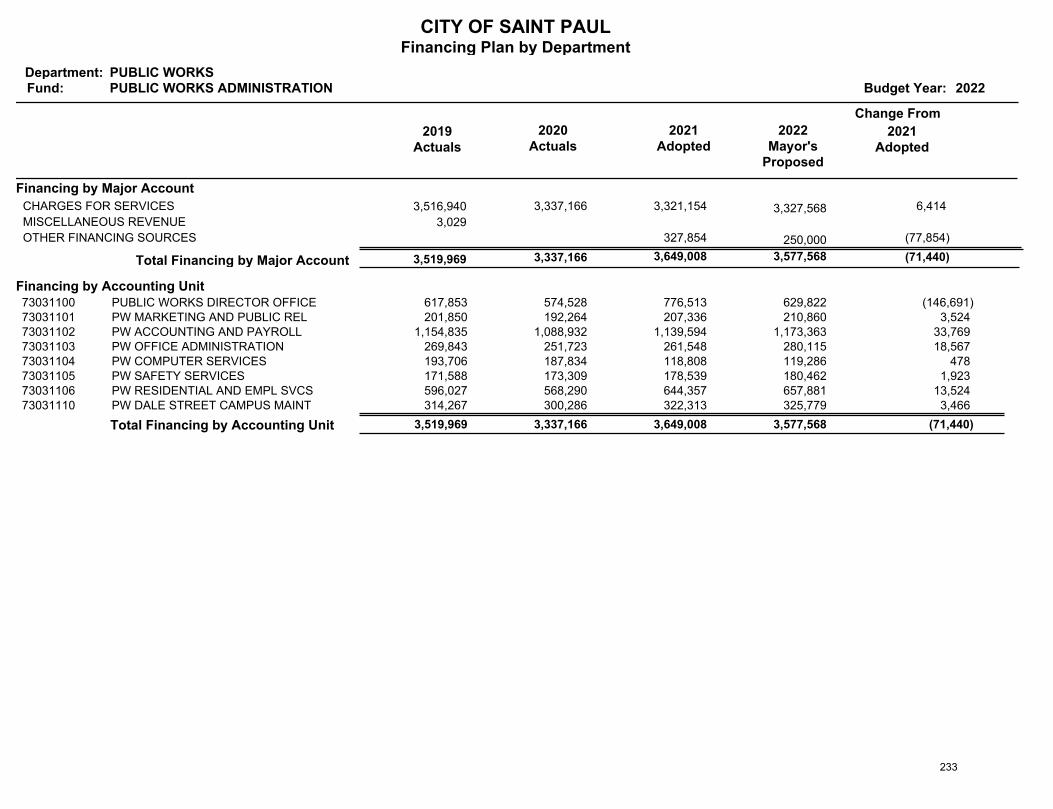
CITY OF SAINT PAULFinancing Plan by Department
Department:Fund: Budget Year: 2022
PUBLIC WORKSPUBLIC WORKS ADMINISTRATION
2019Actuals
Change From
2020Actuals
2021Adopted
2022Mayor's
Proposed
2021Adopted
Financing by Major Account
3,516,940 3,337,166 3,321,154 3,327,568 CHARGES FOR SERVICES 6,414
3,029 MISCELLANEOUS REVENUE
327,854 250,000 OTHER FINANCING SOURCES (77,854)
(71,440) 3,577,568 3,649,008 3,337,166 3,519,969 Total Financing by Major Account
Financing by Accounting UnitPUBLIC WORKS DIRECTOR OFFICE 617,853 629,822 776,513 574,528 73031100 (146,691)PW MARKETING AND PUBLIC REL 201,850 210,860 207,336 192,264 73031101 3,524 PW ACCOUNTING AND PAYROLL 1,154,835 1,173,363 1,139,594 1,088,932 73031102 33,769 PW OFFICE ADMINISTRATION 269,843 280,115 261,548 251,723 73031103 18,567 PW COMPUTER SERVICES 193,706 119,286 118,808 187,834 73031104 478 PW SAFETY SERVICES 171,588 180,462 178,539 173,309 73031105 1,923 PW RESIDENTIAL AND EMPL SVCS 596,027 657,881 644,357 568,290 73031106 13,524 PW DALE STREET CAMPUS MAINT 314,267 325,779 322,313 300,286 73031110 3,466
Total Financing by Accounting Unit 3,519,969 3,577,568 (71,440) 3,337,166 3,649,008
233
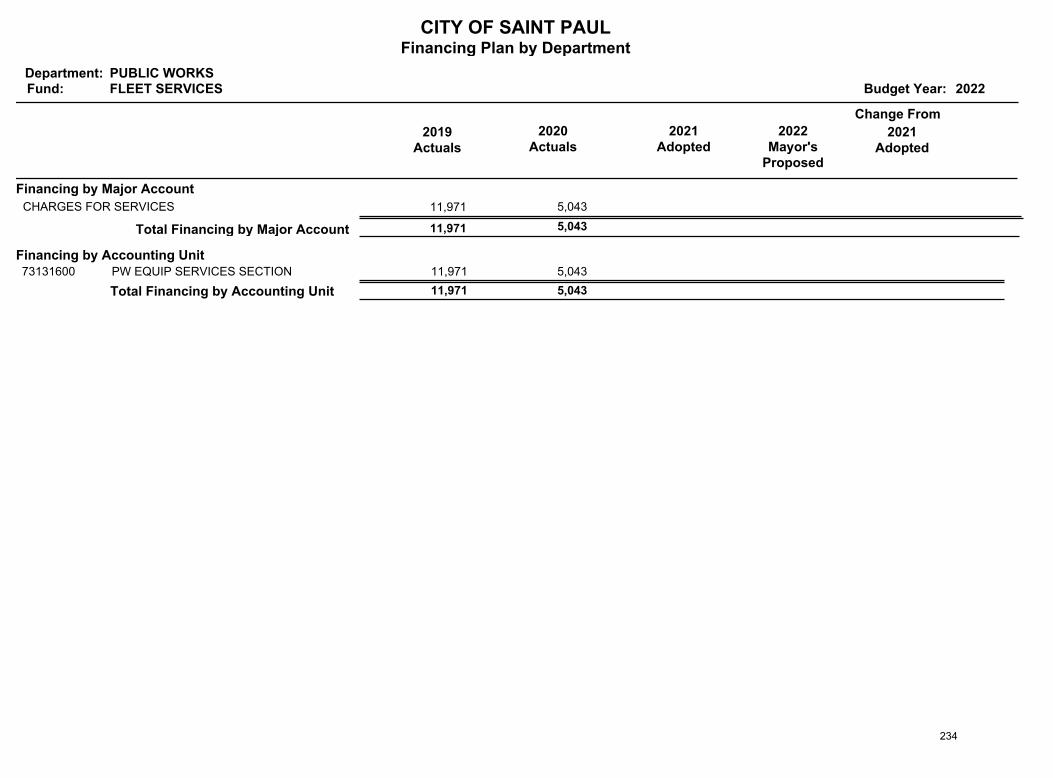
CITY OF SAINT PAULFinancing Plan by Department
Department:Fund: Budget Year: 2022
PUBLIC WORKSFLEET SERVICES
2019Actuals
Change From
2020Actuals
2021Adopted
2022Mayor's
Proposed
2021Adopted
Financing by Major Account
11,971 5,043 CHARGES FOR SERVICES
5,043 11,971 Total Financing by Major Account
Financing by Accounting UnitPW EQUIP SERVICES SECTION 11,971 5,043 73131600
Total Financing by Accounting Unit 11,971 5,043
234
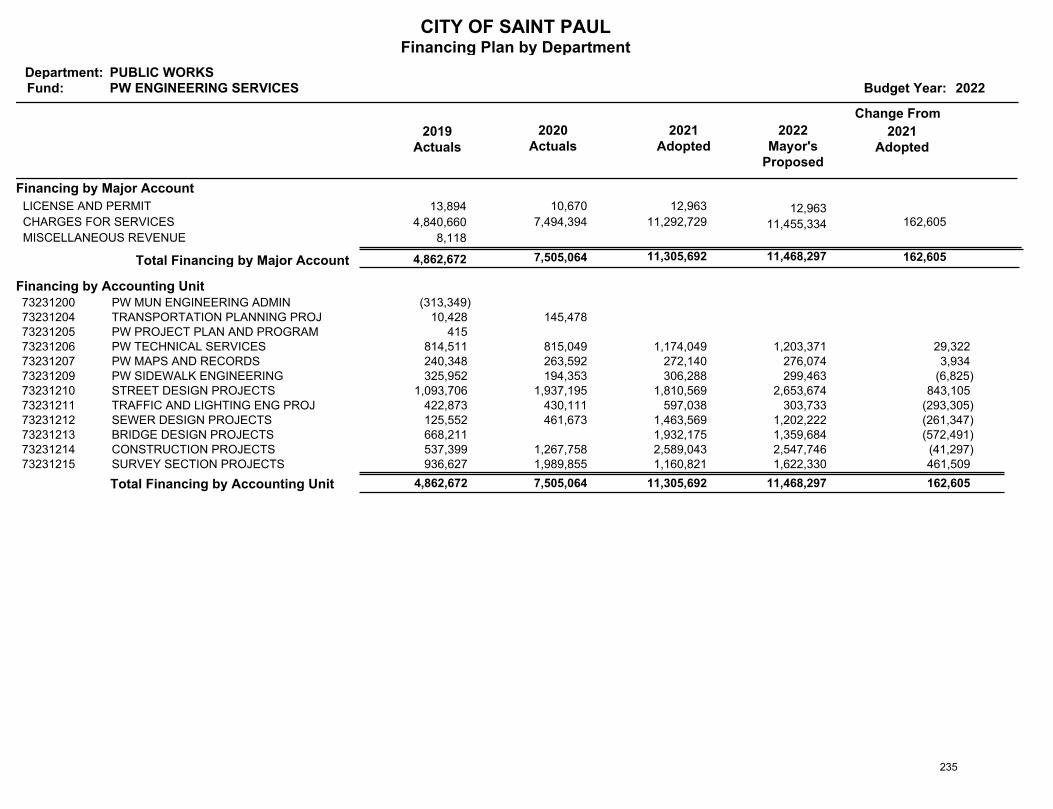
CITY OF SAINT PAULFinancing Plan by Department
Department:Fund: Budget Year: 2022
PUBLIC WORKSPW ENGINEERING SERVICES
2019Actuals
Change From
2020Actuals
2021Adopted
2022Mayor's
Proposed
2021Adopted
Financing by Major Account
13,894 10,670 12,963 12,963 LICENSE AND PERMIT
4,840,660 7,494,394 11,292,729 11,455,334 CHARGES FOR SERVICES 162,605
8,118 MISCELLANEOUS REVENUE
162,605 11,468,297 11,305,692 7,505,064 4,862,672 Total Financing by Major Account
Financing by Accounting UnitPW MUN ENGINEERING ADMIN (313,349)73231200TRANSPORTATION PLANNING PROJ 10,428 145,478 73231204PW PROJECT PLAN AND PROGRAM 415 73231205PW TECHNICAL SERVICES 814,511 1,203,371 1,174,049 815,049 73231206 29,322 PW MAPS AND RECORDS 240,348 276,074 272,140 263,592 73231207 3,934 PW SIDEWALK ENGINEERING 325,952 299,463 306,288 194,353 73231209 (6,825)STREET DESIGN PROJECTS 1,093,706 2,653,674 1,810,569 1,937,195 73231210 843,105 TRAFFIC AND LIGHTING ENG PROJ 422,873 303,733 597,038 430,111 73231211 (293,305)SEWER DESIGN PROJECTS 125,552 1,202,222 1,463,569 461,673 73231212 (261,347)BRIDGE DESIGN PROJECTS 668,211 1,359,684 1,932,175 73231213 (572,491)CONSTRUCTION PROJECTS 537,399 2,547,746 2,589,043 1,267,758 73231214 (41,297)SURVEY SECTION PROJECTS 936,627 1,622,330 1,160,821 1,989,855 73231215 461,509
Total Financing by Accounting Unit 4,862,672 11,468,297 162,605 7,505,064 11,305,692
235
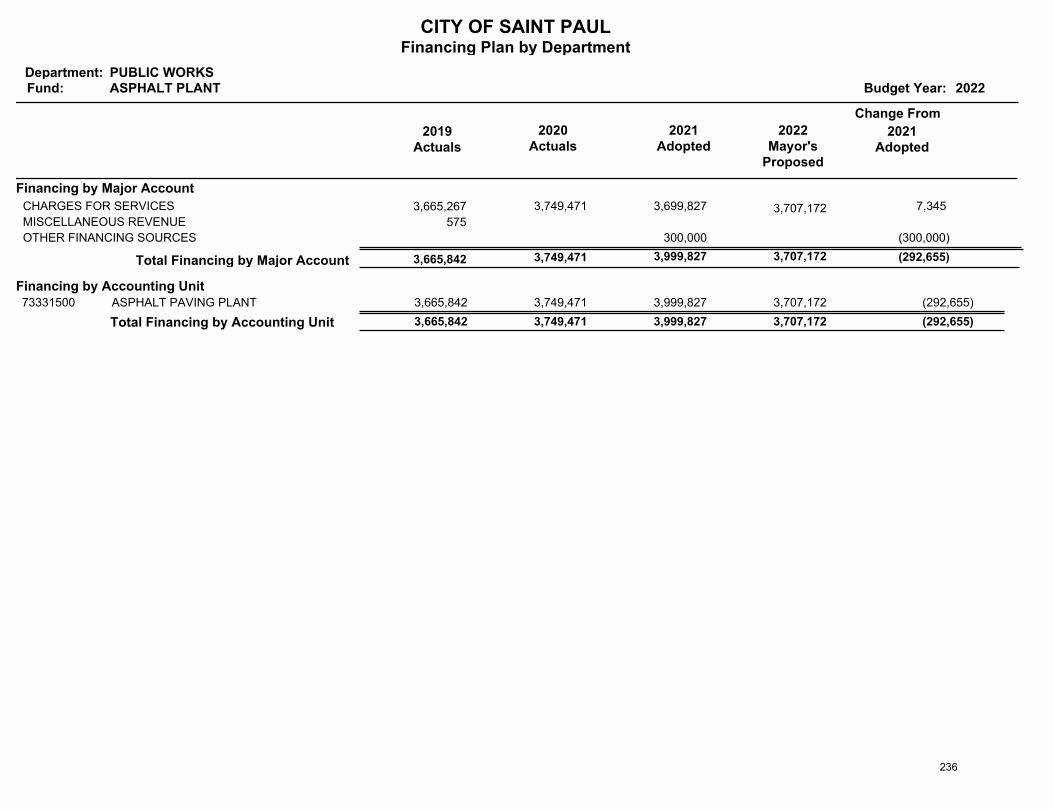
CITY OF SAINT PAULFinancing Plan by Department
Department:Fund: Budget Year: 2022
PUBLIC WORKSASPHALT PLANT
2019Actuals
Change From
2020Actuals
2021Adopted
2022Mayor's
Proposed
2021Adopted
Financing by Major Account
3,665,267 3,749,471 3,699,827 3,707,172 CHARGES FOR SERVICES 7,345
575 MISCELLANEOUS REVENUE
300,000 OTHER FINANCING SOURCES (300,000)
(292,655) 3,707,172 3,999,827 3,749,471 3,665,842 Total Financing by Major Account
Financing by Accounting UnitASPHALT PAVING PLANT 3,665,842 3,707,172 3,999,827 3,749,471 73331500 (292,655)
Total Financing by Accounting Unit 3,665,842 3,707,172 (292,655) 3,749,471 3,999,827
236
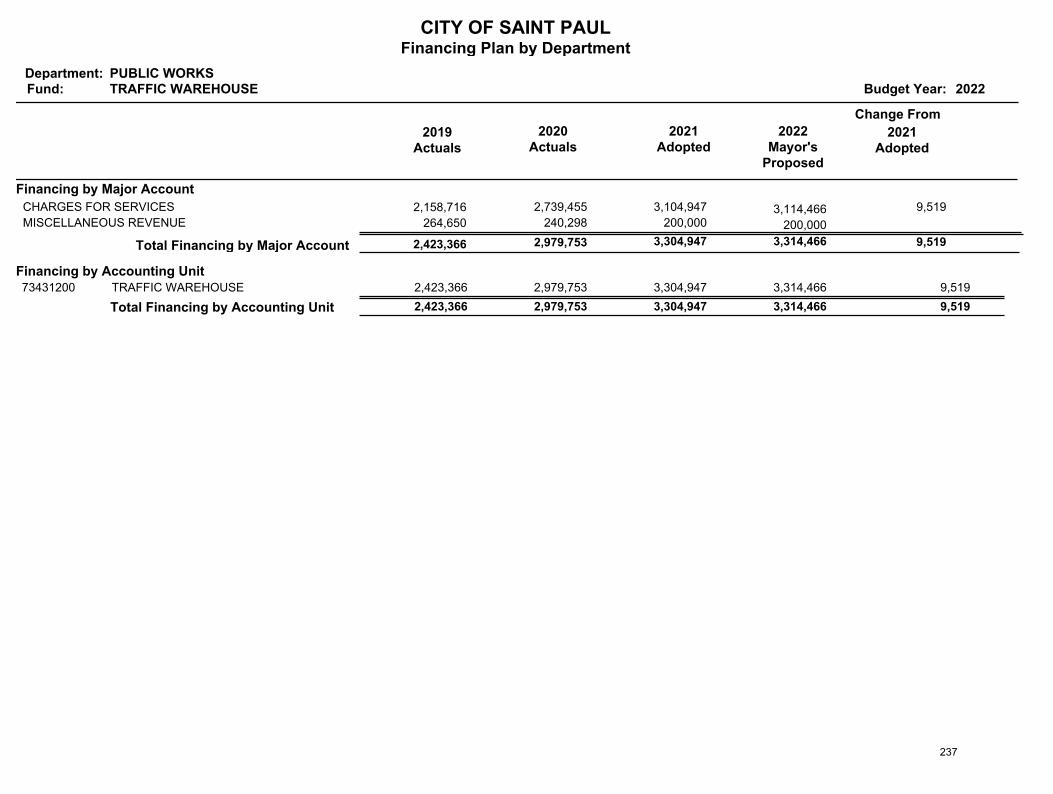
CITY OF SAINT PAULFinancing Plan by Department
Department:Fund: Budget Year: 2022
PUBLIC WORKSTRAFFIC WAREHOUSE
2019Actuals
Change From
2020Actuals
2021Adopted
2022Mayor's
Proposed
2021Adopted
Financing by Major Account
2,158,716 2,739,455 3,104,947 3,114,466 CHARGES FOR SERVICES 9,519
264,650 240,298 200,000 200,000 MISCELLANEOUS REVENUE
9,519 3,314,466 3,304,947 2,979,753 2,423,366 Total Financing by Major Account
Financing by Accounting UnitTRAFFIC WAREHOUSE 2,423,366 3,314,466 3,304,947 2,979,753 73431200 9,519
Total Financing by Accounting Unit 2,423,366 3,314,466 9,519 2,979,753 3,304,947
237
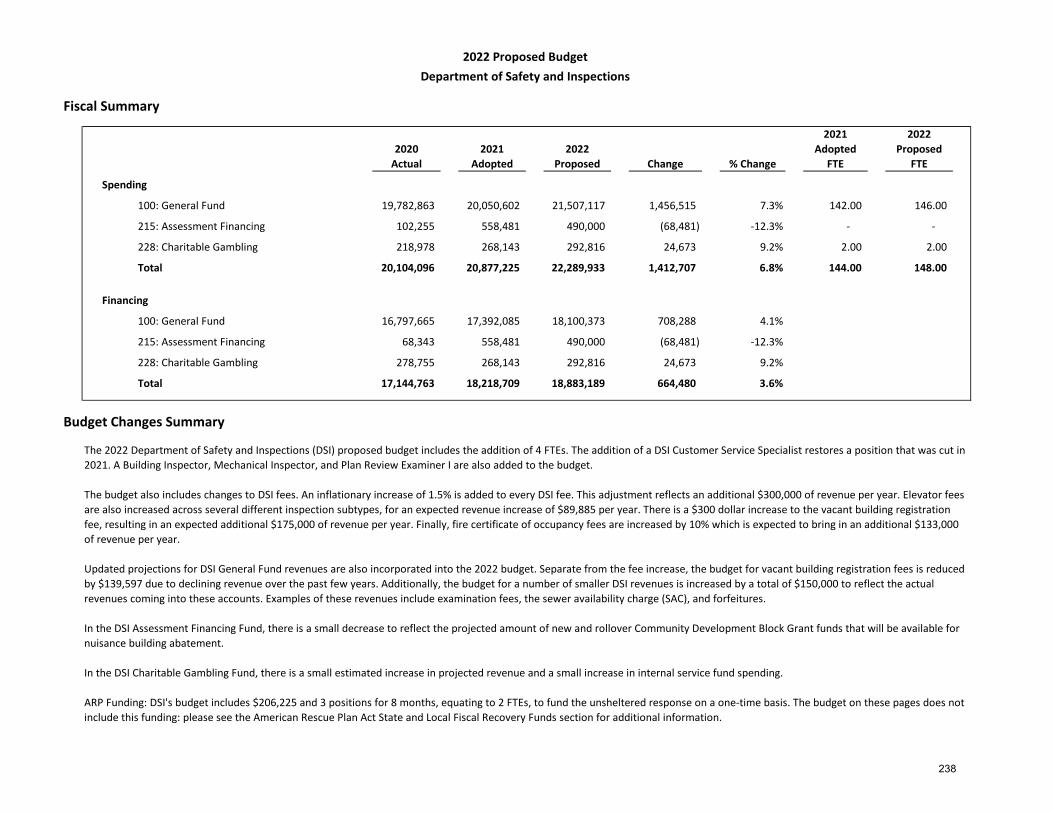
Fiscal Summary
2020Actual
2021Adopted
2022 Proposed Change % Change
2021Adopted
FTE
2022 Proposed
FTE
Spending
19,782,863 20,050,602 21,507,117 1,456,515 7.3% 142.00 146.00
102,255 558,481 490,000 (68,481) -12.3% - -
218,978 268,143 292,816 24,673 9.2% 2.00 2.00
20,104,096 20,877,225 22,289,933 1,412,707 6.8% 144.00 148.00
Financing
16,797,665 17,392,085 18,100,373 708,288 4.1%
68,343 558,481 490,000 (68,481) -12.3%
278,755 268,143 292,816 24,673 9.2%
17,144,763 18,218,709 18,883,189 664,480 3.6%
Budget Changes Summary
2022 Proposed BudgetDepartment of Safety and Inspections
The 2022 Department of Safety and Inspections (DSI) proposed budget includes the addition of 4 FTEs. The addition of a DSI Customer Service Specialist restores a position that was cut in 2021. A Building Inspector, Mechanical Inspector, and Plan Review Examiner I are also added to the budget.
The budget also includes changes to DSI fees. An inflationary increase of 1.5% is added to every DSI fee. This adjustment reflects an additional $300,000 of revenue per year. Elevator fees are also increased across several different inspection subtypes, for an expected revenue increase of $89,885 per year. There is a $300 dollar increase to the vacant building registration fee, resulting in an expected additional $175,000 of revenue per year. Finally, fire certificate of occupancy fees are increased by 10% which is expected to bring in an additional $133,000 of revenue per year.
Updated projections for DSI General Fund revenues are also incorporated into the 2022 budget. Separate from the fee increase, the budget for vacant building registration fees is reduced by $139,597 due to declining revenue over the past few years. Additionally, the budget for a number of smaller DSI revenues is increased by a total of $150,000 to reflect the actual revenues coming into these accounts. Examples of these revenues include examination fees, the sewer availability charge (SAC), and forfeitures.
In the DSI Assessment Financing Fund, there is a small decrease to reflect the projected amount of new and rollover Community Development Block Grant funds that will be available for nuisance building abatement.
In the DSI Charitable Gambling Fund, there is a small estimated increase in projected revenue and a small increase in internal service fund spending.
ARP Funding: DSI's budget includes $206,225 and 3 positions for 8 months, equating to 2 FTEs, to fund the unsheltered response on a one-time basis. The budget on these pages does not include this funding: please see the American Rescue Plan Act State and Local Fiscal Recovery Funds section for additional information.
228: Charitable Gambling
215: Assessment Financing
100: General Fund
228: Charitable Gambling
215: Assessment Financing
100: General Fund
Total
Total
238

Spending Reports 239
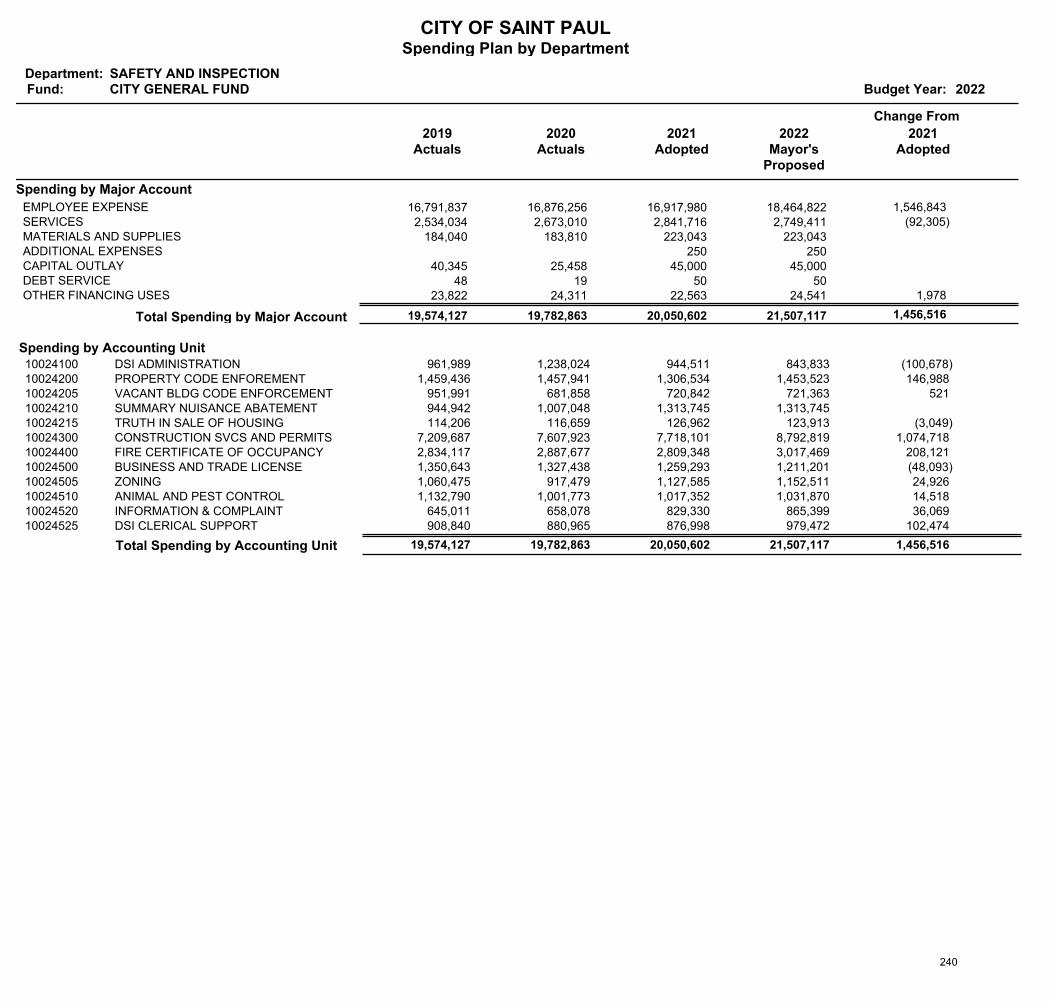
CITY OF SAINT PAULSpending Plan by Department
Department:Fund: Budget Year: 2022
SAFETY AND INSPECTIONCITY GENERAL FUND
2019Actuals
Change From
2020Actuals
2021Adopted
2022Mayor's
Proposed
2021Adopted
Spending by Major Account
16,791,837 16,876,256 16,917,980 18,464,822 EMPLOYEE EXPENSE 1,546,843 2,534,034 2,673,010 2,841,716 2,749,411 SERVICES (92,305)
184,040 183,810 223,043 223,043 MATERIALS AND SUPPLIES 250 250 ADDITIONAL EXPENSES
40,345 25,458 45,000 45,000 CAPITAL OUTLAY 48 19 50 50 DEBT SERVICE
23,822 24,311 22,563 24,541 OTHER FINANCING USES 1,978
1,456,516 21,507,117 20,050,602 19,782,863 19,574,127 Total Spending by Major Account
Spending by Accounting UnitDSI ADMINISTRATION 961,989 843,833 944,511 1,238,024 10024100 (100,678)PROPERTY CODE ENFOREMENT 1,459,436 1,453,523 1,306,534 1,457,941 10024200 146,988 VACANT BLDG CODE ENFORCEMENT 951,991 721,363 720,842 681,858 10024205 521 SUMMARY NUISANCE ABATEMENT 944,942 1,313,745 1,313,745 1,007,048 10024210TRUTH IN SALE OF HOUSING 114,206 123,913 126,962 116,659 10024215 (3,049)CONSTRUCTION SVCS AND PERMITS 7,209,687 8,792,819 7,718,101 7,607,923 10024300 1,074,718 FIRE CERTIFICATE OF OCCUPANCY 2,834,117 3,017,469 2,809,348 2,887,677 10024400 208,121 BUSINESS AND TRADE LICENSE 1,350,643 1,211,201 1,259,293 1,327,438 10024500 (48,093)ZONING 1,060,475 1,152,511 1,127,585 917,479 10024505 24,926 ANIMAL AND PEST CONTROL 1,132,790 1,031,870 1,017,352 1,001,773 10024510 14,518 INFORMATION & COMPLAINT 645,011 865,399 829,330 658,078 10024520 36,069 DSI CLERICAL SUPPORT 908,840 979,472 876,998 880,965 10024525 102,474
Total Spending by Accounting Unit 19,574,127 21,507,117 1,456,516 19,782,863 20,050,602
240
CITY OF SAINT PAULSpending Plan by Department
Department:Fund: Budget Year: 2022
SAFETY AND INSPECTIONGENERAL GOVT SPECIAL PROJECTS
2019Actuals
Change From
2020Actuals
2021Adopted
2022Mayor's
Proposed
2021Adopted
Spending by Major Account
SERVICES
Total Spending by Major Account
Spending by Accounting UnitDSI SPECIAL PROJECTS21124100
Total Spending by Accounting Unit
241
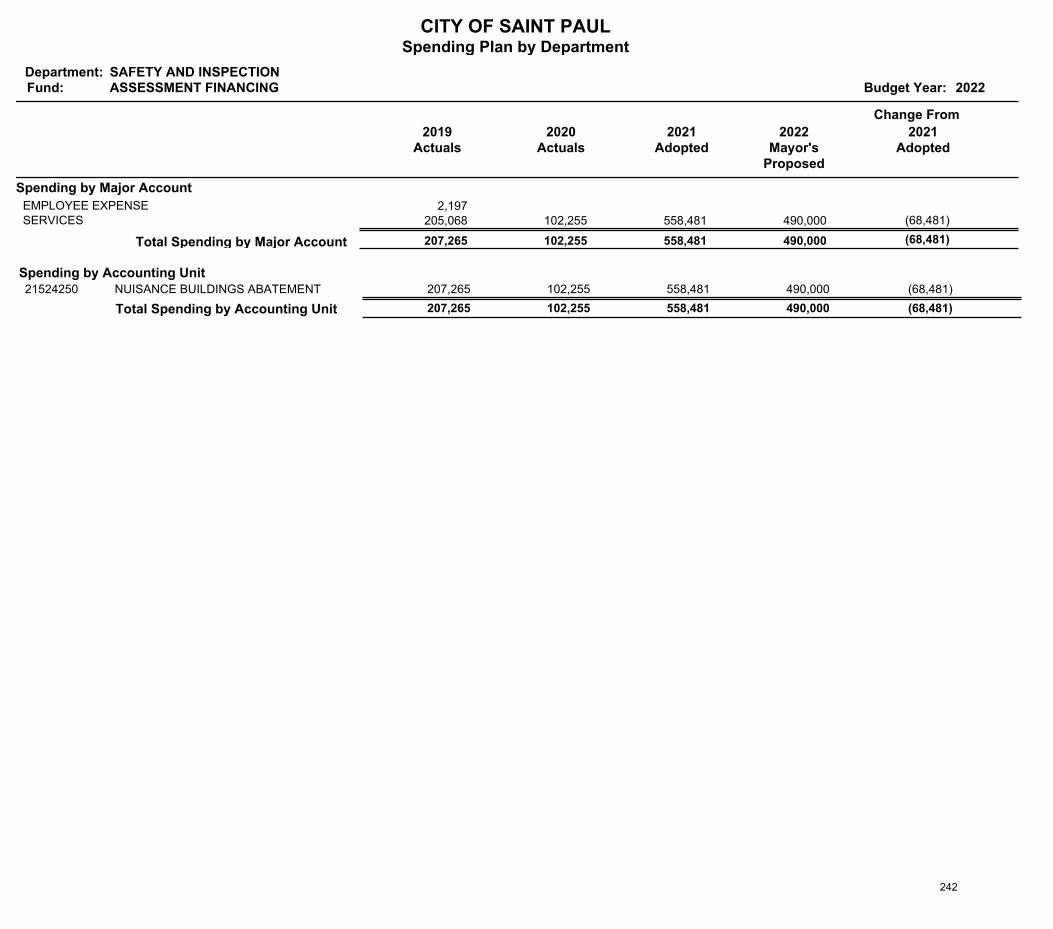
CITY OF SAINT PAULSpending Plan by Department
Department:Fund: Budget Year: 2022
SAFETY AND INSPECTIONASSESSMENT FINANCING
2019Actuals
Change From
2020Actuals
2021Adopted
2022Mayor's
Proposed
2021Adopted
Spending by Major Account
2,197 EMPLOYEE EXPENSE 205,068 102,255 558,481 490,000 SERVICES (68,481)
(68,481) 490,000 558,481 102,255 207,265 Total Spending by Major Account
Spending by Accounting UnitNUISANCE BUILDINGS ABATEMENT 207,265 490,000 558,481 102,255 21524250 (68,481)
Total Spending by Accounting Unit 207,265 490,000 (68,481) 102,255 558,481
242

CITY OF SAINT PAULSpending Plan by Department
Department:Fund: Budget Year: 2022
SAFETY AND INSPECTIONCHARITABLE GAMBLING
2019Actuals
Change From
2020Actuals
2021Adopted
2022Mayor's
Proposed
2021Adopted
Spending by Major Account
178,453 185,949 203,248 227,320 EMPLOYEE EXPENSE 24,072 17,572 23,018 54,840 55,405 SERVICES 565
11 MATERIALS AND SUPPLIES 10,185 10,000 10,055 10,091 OTHER FINANCING USES 36
24,674 292,816 268,143 218,978 206,210 Total Spending by Major Account
Spending by Accounting UnitGAMBLING ENFORCEMENT 206,210 292,816 268,143 218,978 22824550 24,674
Total Spending by Accounting Unit 206,210 292,816 24,674 218,978 268,143
243

Financing Reports 244
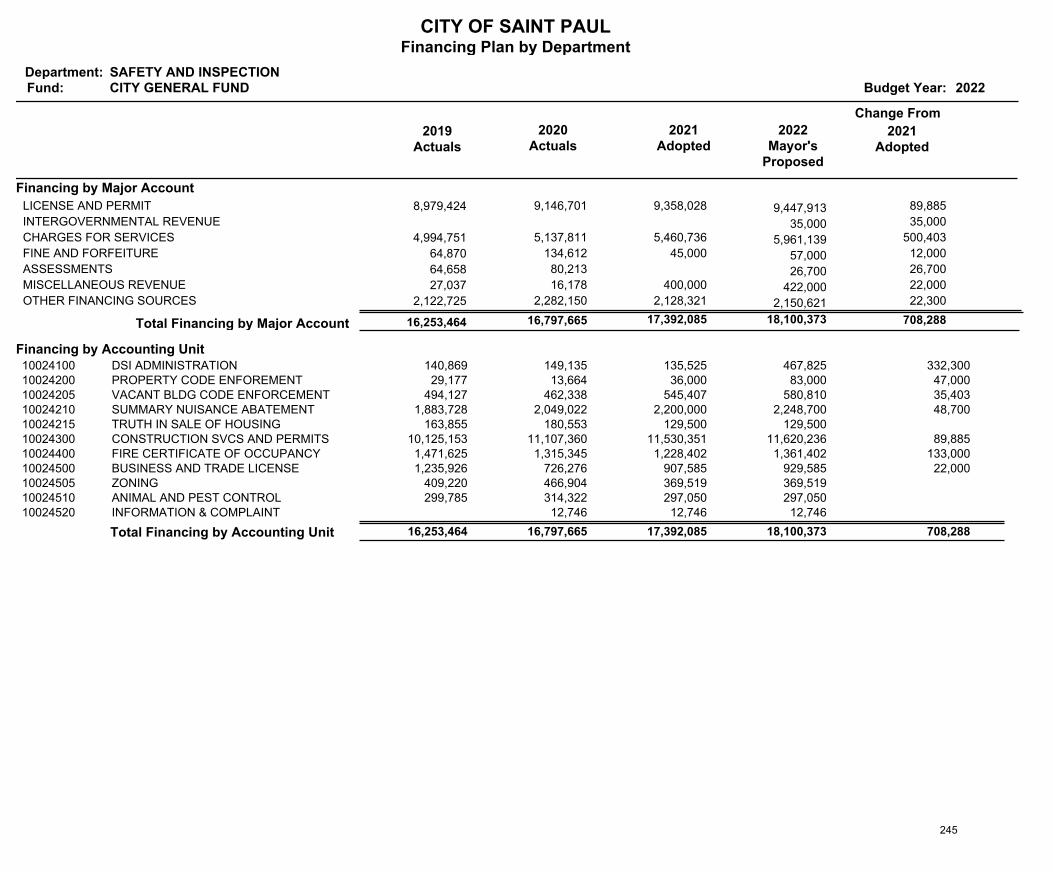
CITY OF SAINT PAULFinancing Plan by Department
Department:Fund: Budget Year: 2022
SAFETY AND INSPECTIONCITY GENERAL FUND
2019Actuals
Change From
2020Actuals
2021Adopted
2022Mayor's
Proposed
2021Adopted
Financing by Major Account
8,979,424 9,146,701 9,358,028 9,447,913 LICENSE AND PERMIT 89,885
35,000 INTERGOVERNMENTAL REVENUE 35,000
4,994,751 5,137,811 5,460,736 5,961,139 CHARGES FOR SERVICES 500,403
64,870 134,612 45,000 57,000 FINE AND FORFEITURE 12,000
64,658 80,213 26,700 ASSESSMENTS 26,700
27,037 16,178 400,000 422,000 MISCELLANEOUS REVENUE 22,000
2,122,725 2,282,150 2,128,321 2,150,621 OTHER FINANCING SOURCES 22,300
708,288 18,100,373 17,392,085 16,797,665 16,253,464 Total Financing by Major Account
Financing by Accounting UnitDSI ADMINISTRATION 140,869 467,825 135,525 149,135 10024100 332,300 PROPERTY CODE ENFOREMENT 29,177 83,000 36,000 13,664 10024200 47,000 VACANT BLDG CODE ENFORCEMENT 494,127 580,810 545,407 462,338 10024205 35,403 SUMMARY NUISANCE ABATEMENT 1,883,728 2,248,700 2,200,000 2,049,022 10024210 48,700 TRUTH IN SALE OF HOUSING 163,855 129,500 129,500 180,553 10024215CONSTRUCTION SVCS AND PERMITS 10,125,153 11,620,236 11,530,351 11,107,360 10024300 89,885 FIRE CERTIFICATE OF OCCUPANCY 1,471,625 1,361,402 1,228,402 1,315,345 10024400 133,000 BUSINESS AND TRADE LICENSE 1,235,926 929,585 907,585 726,276 10024500 22,000 ZONING 409,220 369,519 369,519 466,904 10024505ANIMAL AND PEST CONTROL 299,785 297,050 297,050 314,322 10024510INFORMATION & COMPLAINT 12,746 12,746 12,746 10024520
Total Financing by Accounting Unit 16,253,464 18,100,373 708,288 16,797,665 17,392,085
245
CITY OF SAINT PAULFinancing Plan by Department
Department:Fund: Budget Year: 2022
SAFETY AND INSPECTIONGENERAL GOVT SPECIAL PROJECTS
2019Actuals
Change From
2020Actuals
2021Adopted
2022Mayor's
Proposed
2021Adopted
Financing by Major Account
OTHER FINANCING SOURCES
Total Financing by Major Account
Financing by Accounting UnitDSI SPECIAL PROJECTS21124100
Total Financing by Accounting Unit
246
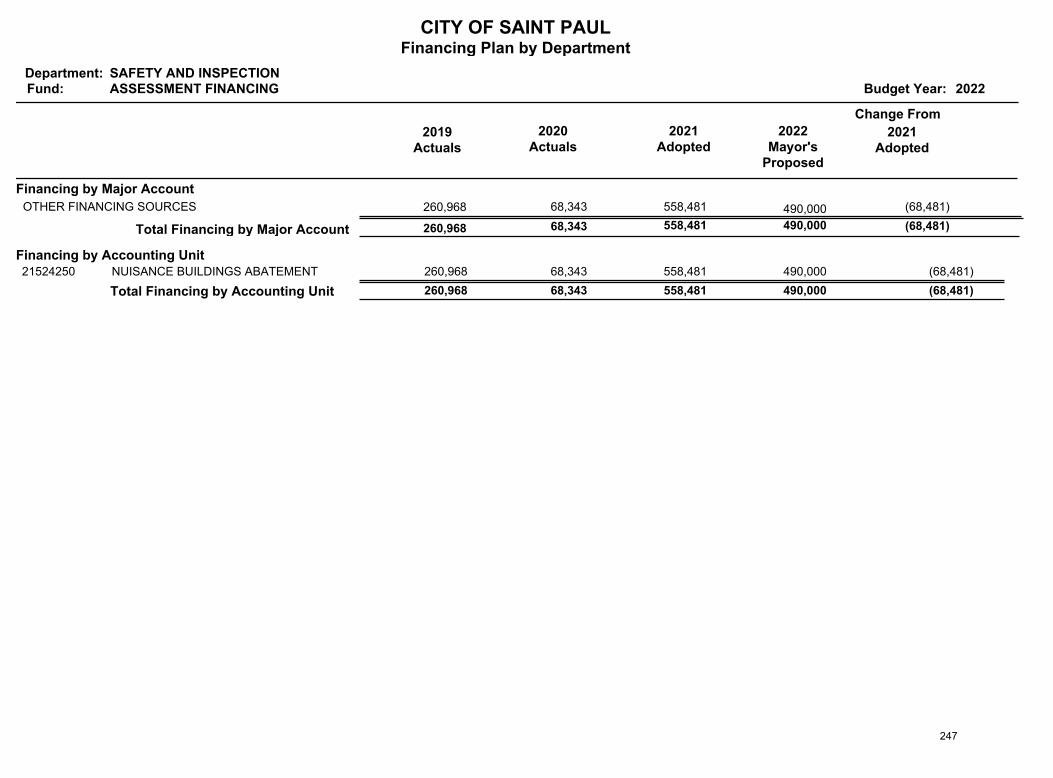
CITY OF SAINT PAULFinancing Plan by Department
Department:Fund: Budget Year: 2022
SAFETY AND INSPECTIONASSESSMENT FINANCING
2019Actuals
Change From
2020Actuals
2021Adopted
2022Mayor's
Proposed
2021Adopted
Financing by Major Account
260,968 68,343 558,481 490,000 OTHER FINANCING SOURCES (68,481)
(68,481) 490,000 558,481 68,343 260,968 Total Financing by Major Account
Financing by Accounting UnitNUISANCE BUILDINGS ABATEMENT 260,968 490,000 558,481 68,343 21524250 (68,481)
Total Financing by Accounting Unit 260,968 490,000 (68,481) 68,343 558,481
247
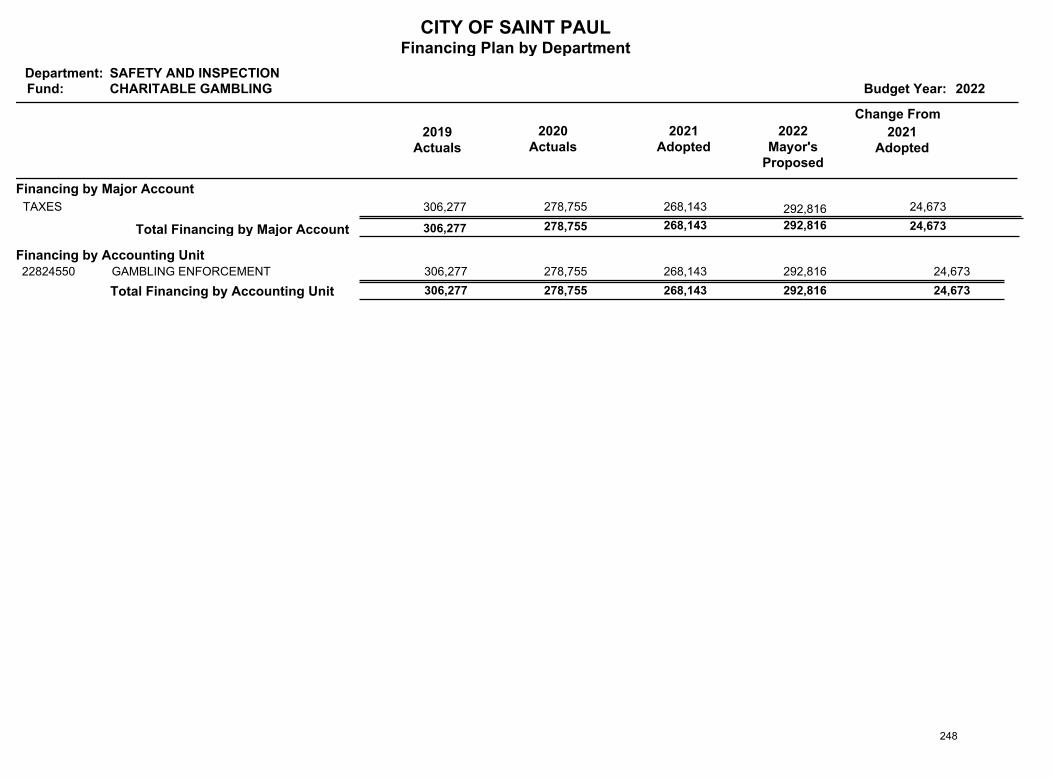
CITY OF SAINT PAULFinancing Plan by Department
Department:Fund: Budget Year: 2022
SAFETY AND INSPECTIONCHARITABLE GAMBLING
2019Actuals
Change From
2020Actuals
2021Adopted
2022Mayor's
Proposed
2021Adopted
Financing by Major Account
306,277 278,755 268,143 292,816 TAXES 24,673
24,673 292,816 268,143 278,755 306,277 Total Financing by Major Account
Financing by Accounting UnitGAMBLING ENFORCEMENT 306,277 292,816 268,143 278,755 22824550 24,673
Total Financing by Accounting Unit 306,277 292,816 24,673 278,755 268,143
248
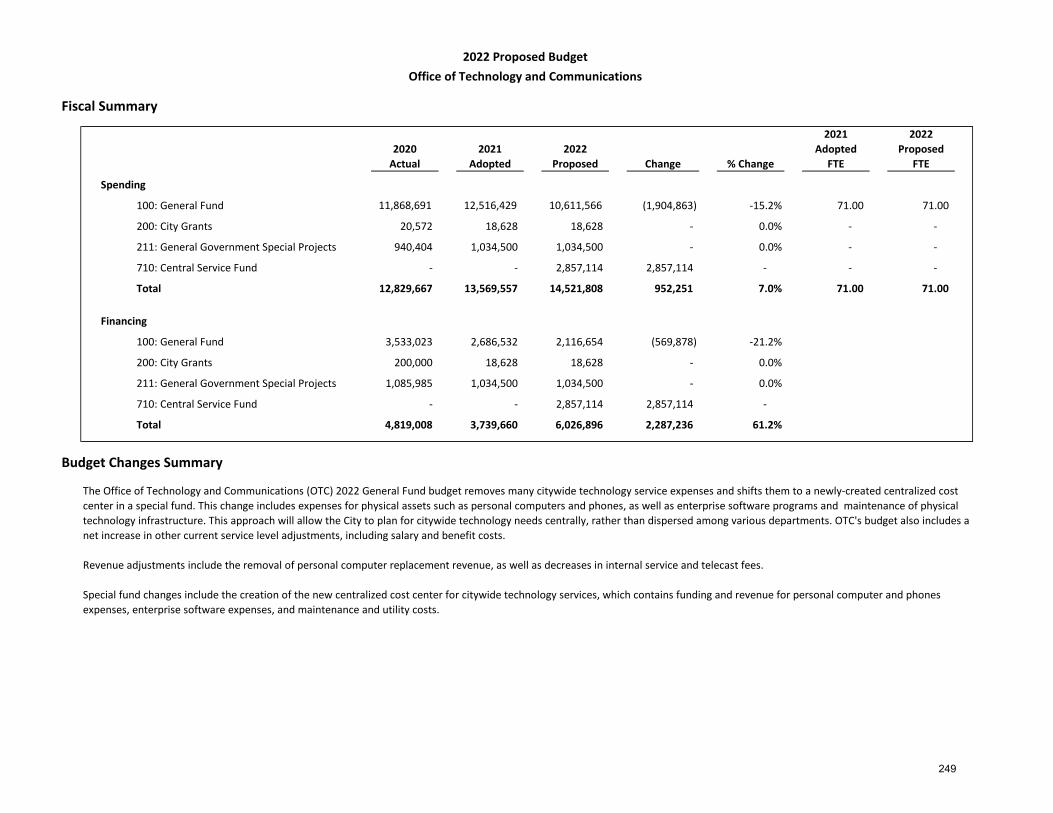
Fiscal Summary
2020Actual
2021Adopted
2022Proposed Change % Change
2021Adopted
FTE
2022 Proposed
FTE
Spending
11,868,691 12,516,429 10,611,566 (1,904,863) -15.2% 71.00 71.00
200: City Grants 20,572 18,628 18,628 - 0.0% - -
211: General Government Special Projects 940,404 1,034,500 1,034,500 - 0.0% - -
710: Central Service Fund - - 2,857,114 2,857,114 - - -
12,829,667 13,569,557 14,521,808 952,251 7.0% 71.00 71.00
Financing
3,533,023 2,686,532 2,116,654 (569,878) -21.2%
200: City Grants 200,000 18,628 18,628 - 0.0%
1,085,985 1,034,500 1,034,500 - 0.0%
- - 2,857,114 2,857,114 -
4,819,008 3,739,660 6,026,896 2,287,236 61.2%
Budget Changes Summary
The Office of Technology and Communications (OTC) 2022 General Fund budget removes many citywide technology service expenses and shifts them to a newly-created centralized cost center in a special fund. This change includes expenses for physical assets such as personal computers and phones, as well as enterprise software programs and maintenance of physical technology infrastructure. This approach will allow the City to plan for citywide technology needs centrally, rather than dispersed among various departments. OTC's budget also includes a net increase in other current service level adjustments, including salary and benefit costs.
Revenue adjustments include the removal of personal computer replacement revenue, as well as decreases in internal service and telecast fees.
Special fund changes include the creation of the new centralized cost center for citywide technology services, which contains funding and revenue for personal computer and phones expenses, enterprise software expenses, and maintenance and utility costs.
2022 Proposed BudgetOffice of Technology and Communications
211: General Government Special Projects
100: General Fund
100: General Fund
Total
710: Central Service Fund
Total
249

Spending Reports 250
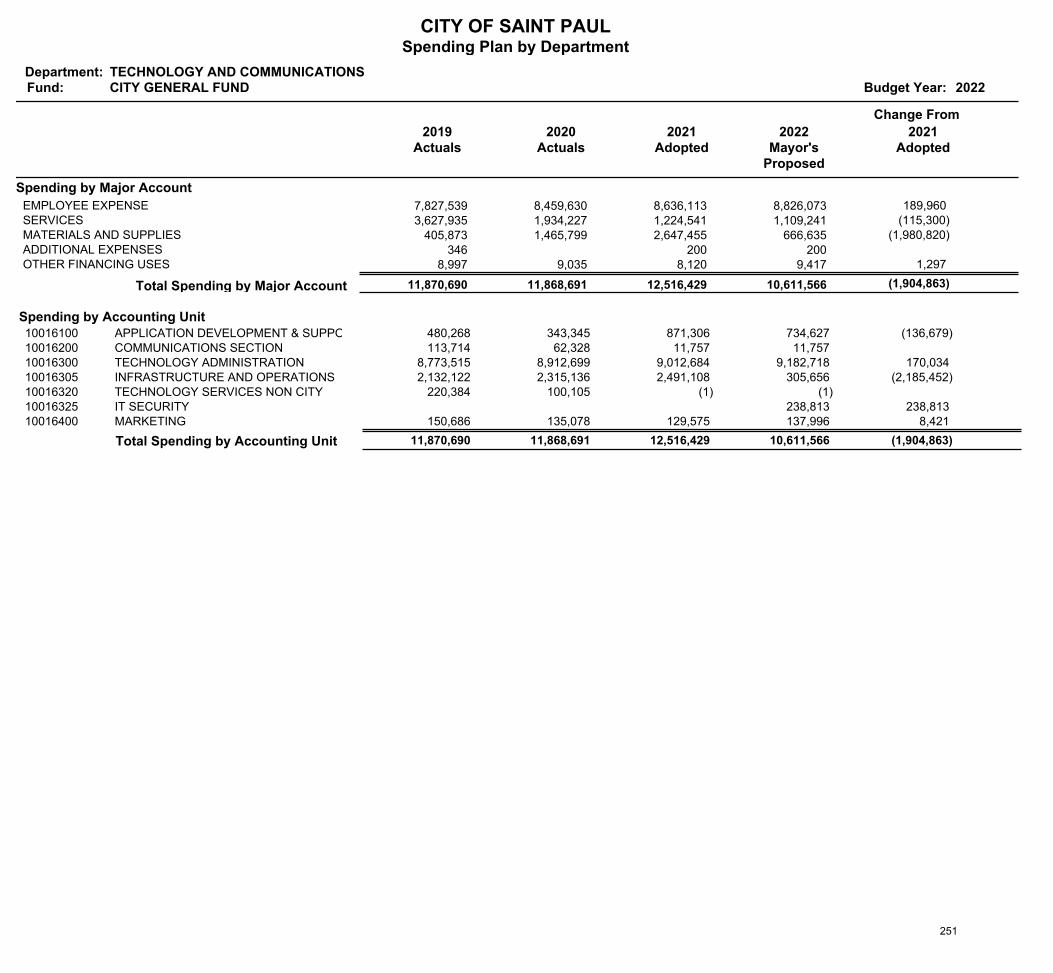
CITY OF SAINT PAULSpending Plan by Department
Department:Fund: Budget Year: 2022
TECHNOLOGY AND COMMUNICATIONSCITY GENERAL FUND
2019Actuals
Change From
2020Actuals
2021Adopted
2022Mayor's
Proposed
2021Adopted
Spending by Major Account
7,827,539 8,459,630 8,636,113 8,826,073 EMPLOYEE EXPENSE 189,960 3,627,935 1,934,227 1,224,541 1,109,241 SERVICES (115,300)
405,873 1,465,799 2,647,455 666,635 MATERIALS AND SUPPLIES (1,980,820) 346 200 200 ADDITIONAL EXPENSES
8,997 9,035 8,120 9,417 OTHER FINANCING USES 1,297
(1,904,863) 10,611,566 12,516,429 11,868,691 11,870,690 Total Spending by Major Account
Spending by Accounting UnitAPPLICATION DEVELOPMENT & SUPPORT 480,268 734,627 871,306 343,345 10016100 (136,679)COMMUNICATIONS SECTION 113,714 11,757 11,757 62,328 10016200TECHNOLOGY ADMINISTRATION 8,773,515 9,182,718 9,012,684 8,912,699 10016300 170,034 INFRASTRUCTURE AND OPERATIONS 2,132,122 305,656 2,491,108 2,315,136 10016305 (2,185,452)TECHNOLOGY SERVICES NON CITY 220,384 (1)(1) 100,105 10016320IT SECURITY 238,813 10016325 238,813 MARKETING 150,686 137,996 129,575 135,078 10016400 8,421
Total Spending by Accounting Unit 11,870,690 10,611,566 (1,904,863) 11,868,691 12,516,429
251
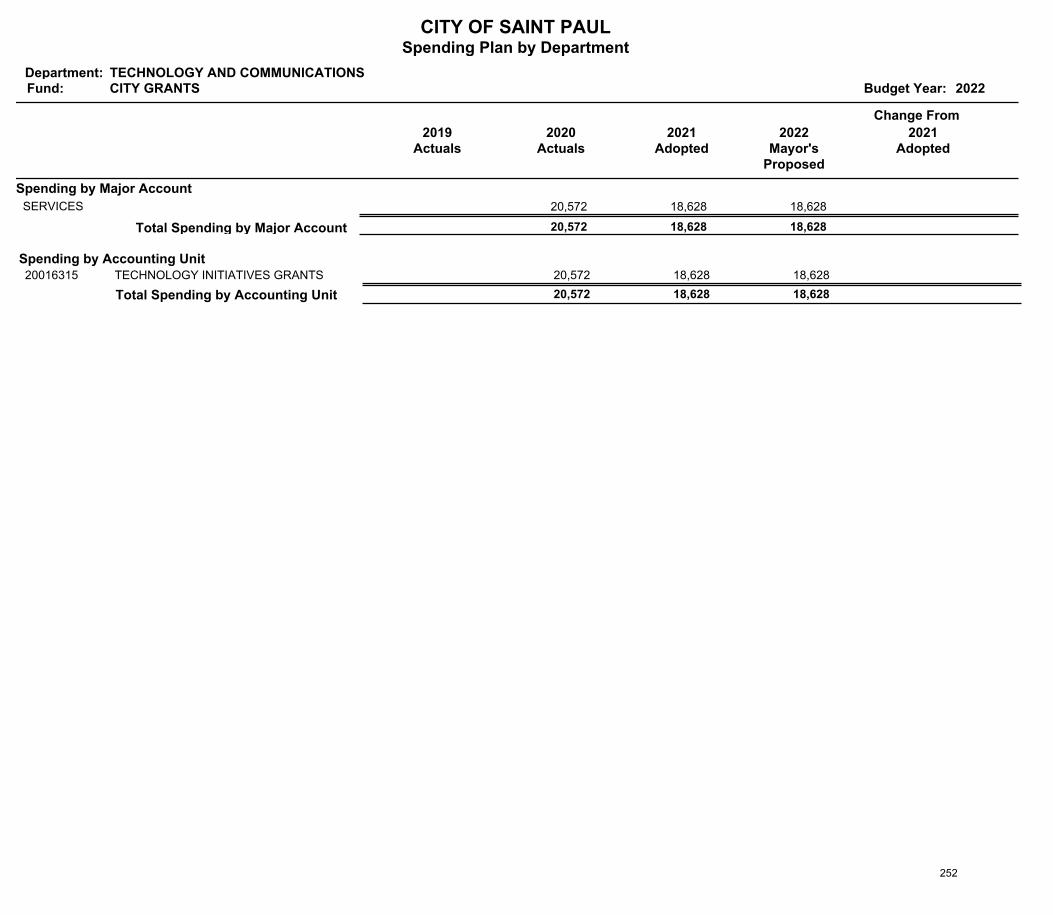
CITY OF SAINT PAULSpending Plan by Department
Department:Fund: Budget Year: 2022
TECHNOLOGY AND COMMUNICATIONSCITY GRANTS
2019Actuals
Change From
2020Actuals
2021Adopted
2022Mayor's
Proposed
2021Adopted
Spending by Major Account
20,572 18,628 18,628 SERVICES
18,628 18,628 20,572 Total Spending by Major Account
Spending by Accounting UnitTECHNOLOGY INITIATIVES GRANTS 18,628 18,628 20,572 20016315
Total Spending by Accounting Unit 18,628 20,572 18,628
252
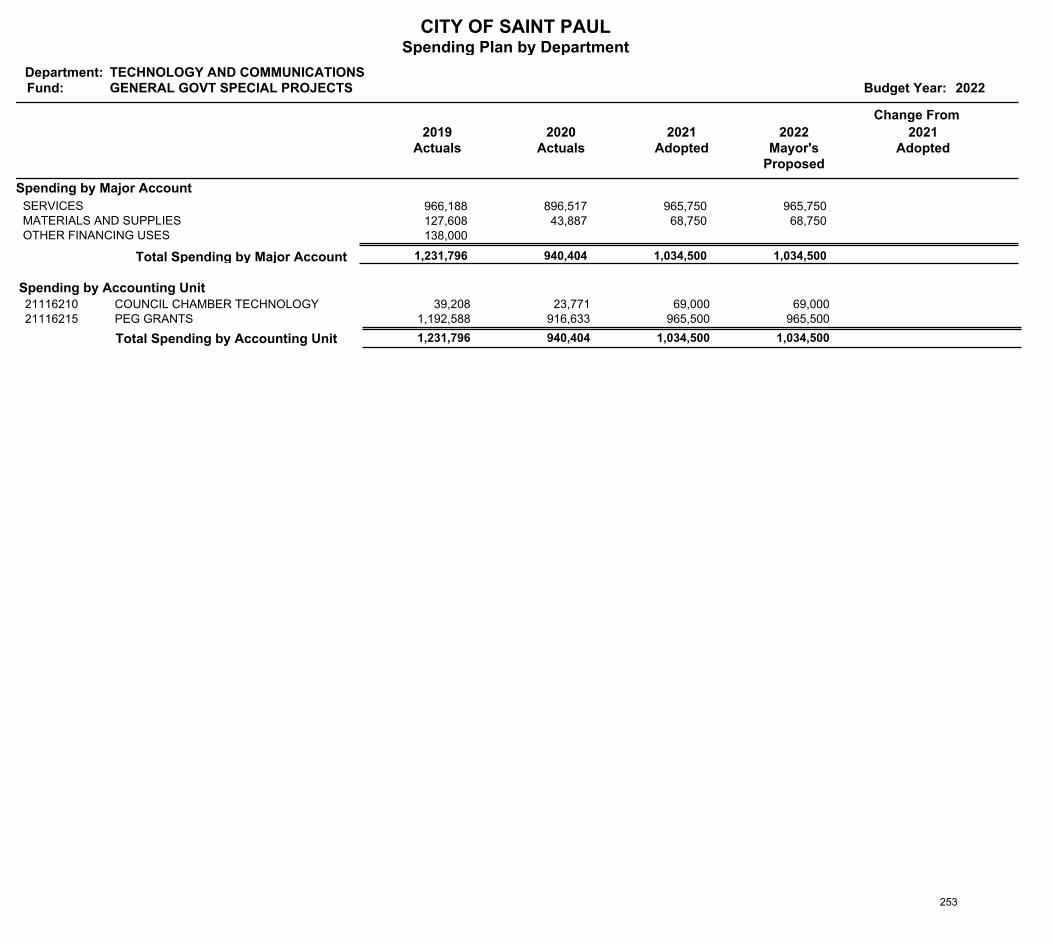
CITY OF SAINT PAULSpending Plan by Department
Department:Fund: Budget Year: 2022
TECHNOLOGY AND COMMUNICATIONSGENERAL GOVT SPECIAL PROJECTS
2019Actuals
Change From
2020Actuals
2021Adopted
2022Mayor's
Proposed
2021Adopted
Spending by Major Account
966,188 896,517 965,750 965,750 SERVICES 127,608 43,887 68,750 68,750 MATERIALS AND SUPPLIES 138,000 OTHER FINANCING USES
1,034,500 1,034,500 940,404 1,231,796 Total Spending by Major Account
Spending by Accounting UnitCOUNCIL CHAMBER TECHNOLOGY 39,208 69,000 69,000 23,771 21116210PEG GRANTS 1,192,588 965,500 965,500 916,633 21116215
Total Spending by Accounting Unit 1,231,796 1,034,500 940,404 1,034,500
253
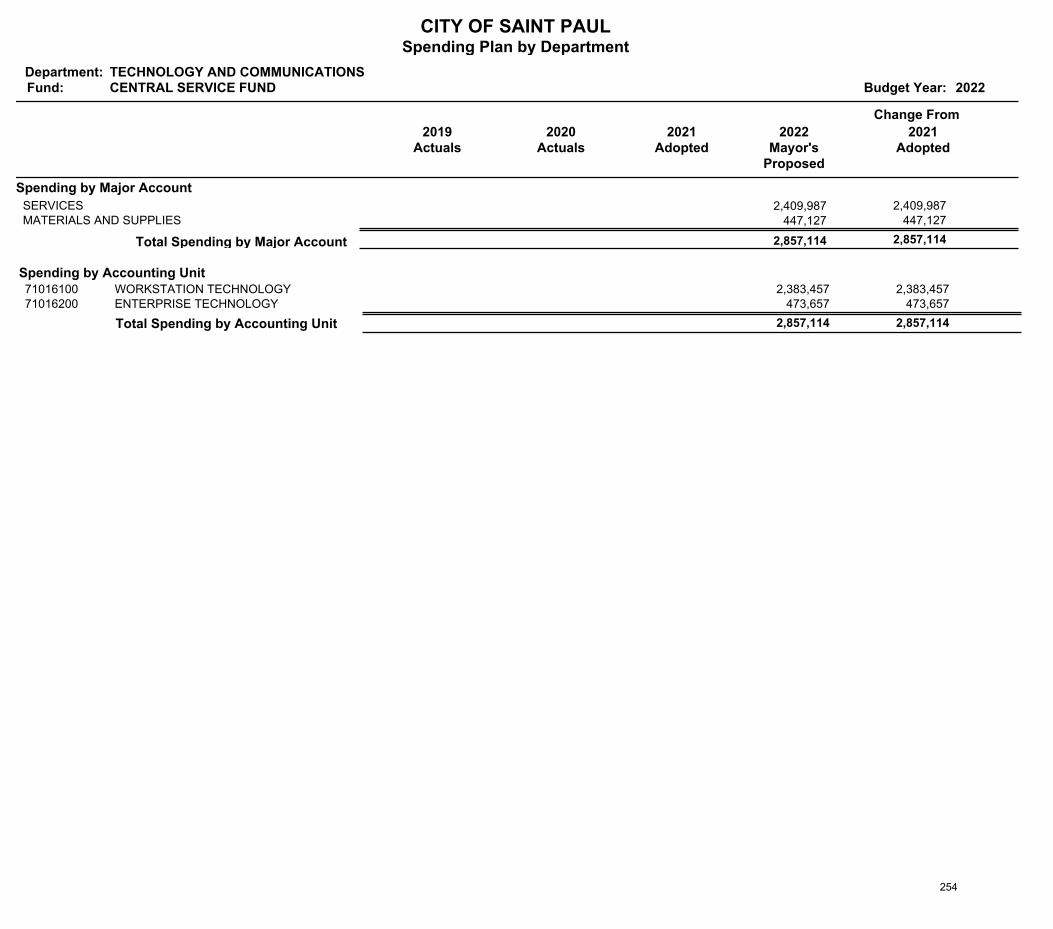
CITY OF SAINT PAULSpending Plan by Department
Department:Fund: Budget Year: 2022
TECHNOLOGY AND COMMUNICATIONSCENTRAL SERVICE FUND
2019Actuals
Change From
2020Actuals
2021Adopted
2022Mayor's
Proposed
2021Adopted
Spending by Major Account
2,409,987 SERVICES 2,409,987 447,127 MATERIALS AND SUPPLIES 447,127
2,857,114 2,857,114 Total Spending by Major Account
Spending by Accounting UnitWORKSTATION TECHNOLOGY 2,383,457 71016100 2,383,457 ENTERPRISE TECHNOLOGY 473,657 71016200 473,657
Total Spending by Accounting Unit 2,857,114 2,857,114
254

Financing Reports 255
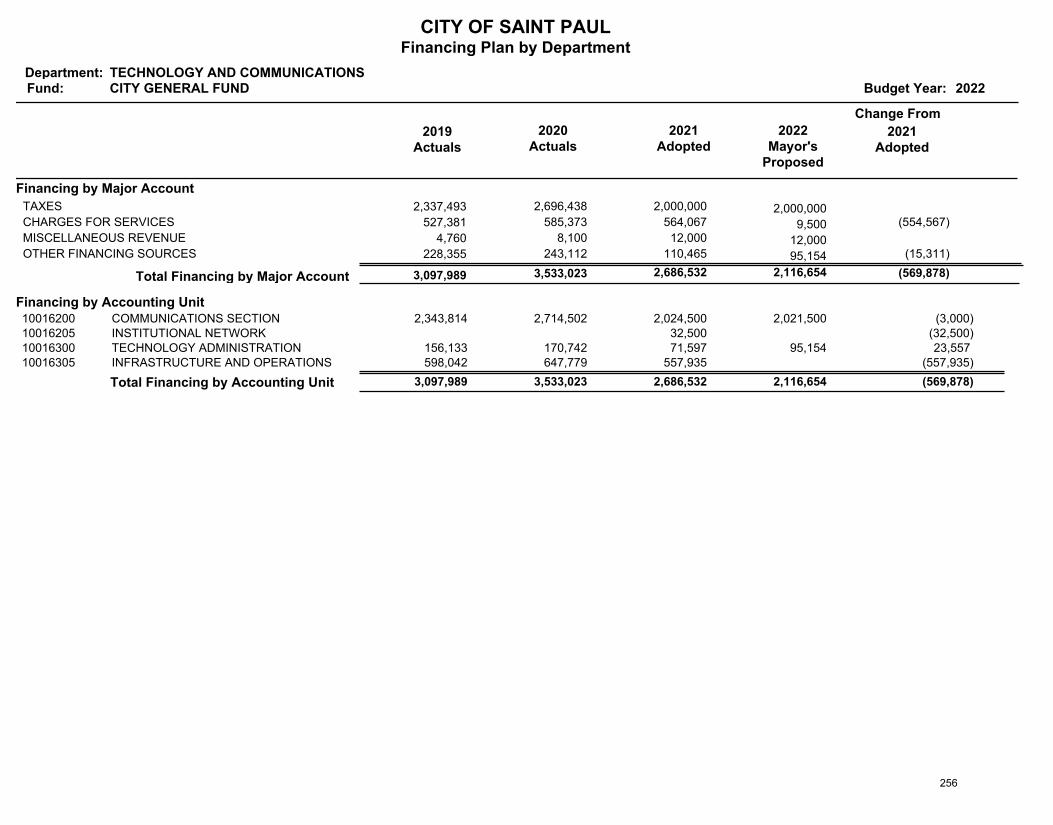
CITY OF SAINT PAULFinancing Plan by Department
Department:Fund: Budget Year: 2022
TECHNOLOGY AND COMMUNICATIONSCITY GENERAL FUND
2019Actuals
Change From
2020Actuals
2021Adopted
2022Mayor's
Proposed
2021Adopted
Financing by Major Account
2,337,493 2,696,438 2,000,000 2,000,000 TAXES
527,381 585,373 564,067 9,500 CHARGES FOR SERVICES (554,567)
4,760 8,100 12,000 12,000 MISCELLANEOUS REVENUE
228,355 243,112 110,465 95,154 OTHER FINANCING SOURCES (15,311)
(569,878) 2,116,654 2,686,532 3,533,023 3,097,989 Total Financing by Major Account
Financing by Accounting UnitCOMMUNICATIONS SECTION 2,343,814 2,021,500 2,024,500 2,714,502 10016200 (3,000)INSTITUTIONAL NETWORK 32,500 10016205 (32,500)TECHNOLOGY ADMINISTRATION 156,133 95,154 71,597 170,742 10016300 23,557 INFRASTRUCTURE AND OPERATIONS 598,042 557,935 647,779 10016305 (557,935)
Total Financing by Accounting Unit 3,097,989 2,116,654 (569,878) 3,533,023 2,686,532
256

CITY OF SAINT PAULFinancing Plan by Department
Department:Fund: Budget Year: 2022
TECHNOLOGY AND COMMUNICATIONSCITY GRANTS
2019Actuals
Change From
2020Actuals
2021Adopted
2022Mayor's
Proposed
2021Adopted
Financing by Major Account
50,000 200,000 MISCELLANEOUS REVENUE
18,628 18,628 OTHER FINANCING SOURCES
18,628 18,628 200,000 50,000 Total Financing by Major Account
Financing by Accounting UnitTECHNOLOGY INITIATIVES GRANTS 50,000 18,628 18,628 200,000 20016315
Total Financing by Accounting Unit 50,000 18,628 200,000 18,628
257
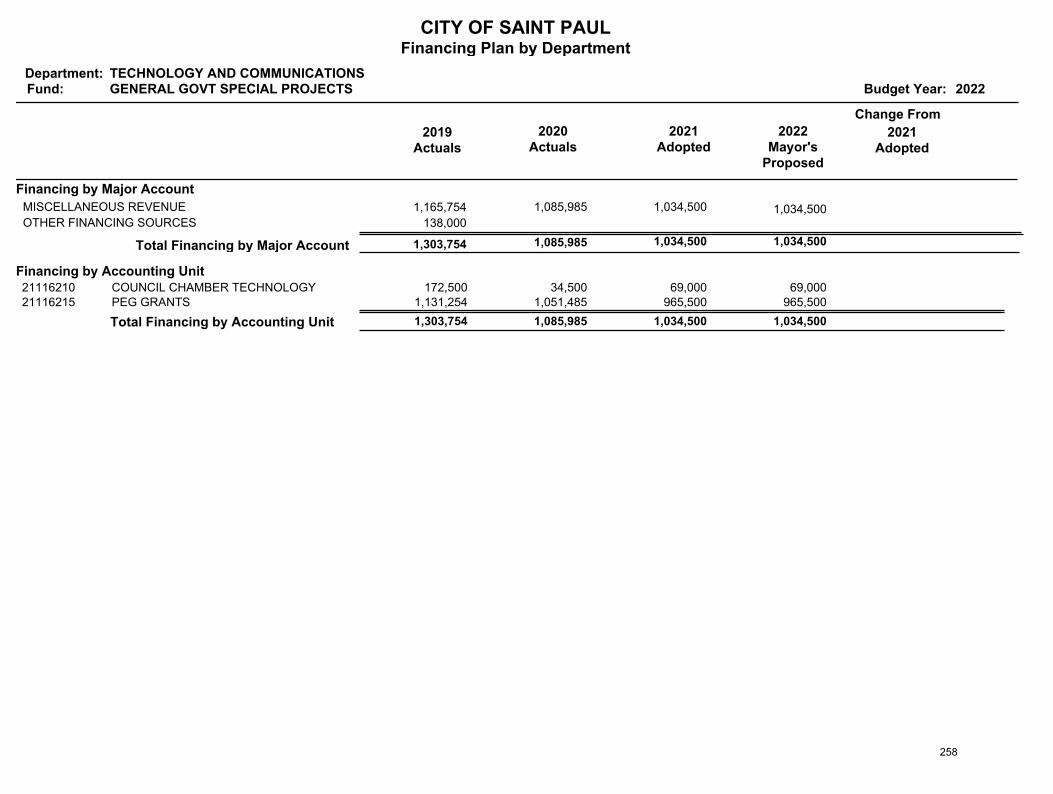
CITY OF SAINT PAULFinancing Plan by Department
Department:Fund: Budget Year: 2022
TECHNOLOGY AND COMMUNICATIONSGENERAL GOVT SPECIAL PROJECTS
2019Actuals
Change From
2020Actuals
2021Adopted
2022Mayor's
Proposed
2021Adopted
Financing by Major Account
1,165,754 1,085,985 1,034,500 1,034,500 MISCELLANEOUS REVENUE
138,000 OTHER FINANCING SOURCES
1,034,500 1,034,500 1,085,985 1,303,754 Total Financing by Major Account
Financing by Accounting UnitCOUNCIL CHAMBER TECHNOLOGY 172,500 69,000 69,000 34,500 21116210PEG GRANTS 1,131,254 965,500 965,500 1,051,485 21116215
Total Financing by Accounting Unit 1,303,754 1,034,500 1,085,985 1,034,500
258
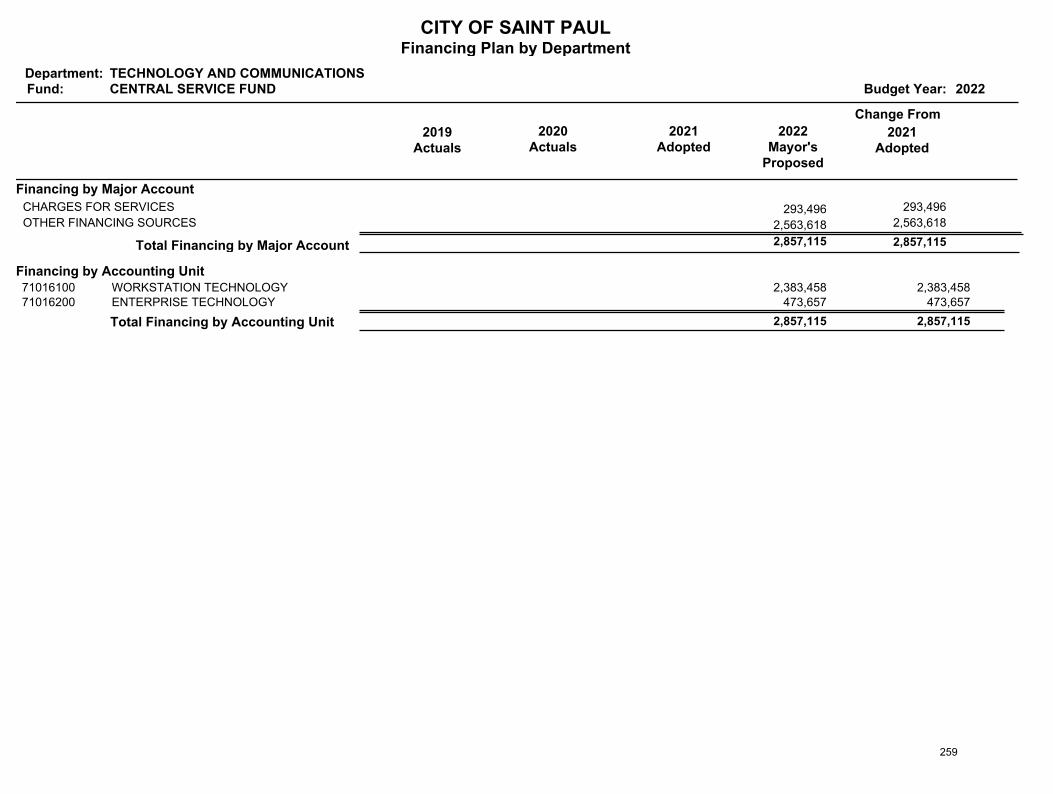
CITY OF SAINT PAULFinancing Plan by Department
Department:Fund: Budget Year: 2022
TECHNOLOGY AND COMMUNICATIONSCENTRAL SERVICE FUND
2019Actuals
Change From
2020Actuals
2021Adopted
2022Mayor's
Proposed
2021Adopted
Financing by Major Account
293,496 CHARGES FOR SERVICES 293,496
2,563,618 OTHER FINANCING SOURCES 2,563,618
2,857,115 2,857,115 Total Financing by Major Account
Financing by Accounting UnitWORKSTATION TECHNOLOGY 2,383,458 71016100 2,383,458 ENTERPRISE TECHNOLOGY 473,657 71016200 473,657
Total Financing by Accounting Unit 2,857,115 2,857,115
259

Appendix
260
Glossary Account Code. A five-digit code assigned to a specific type of receipt or expenditure. A major account code is a grouping of expenditures or receipts on the basis of the types of goods or services purchased or rendered. For example, personnel services, materials, supplies, and equipment are major account codes. Accounting Unit (AU): An accounting unit is a subunit of a fund. Each fund contains one or more accounting units, a specific and distinguishable budgetary unit of work or service. Accounting units are detailed levels of budget spending authority created to accomplish the approved objectives of the fund. Accounting Unit Number: An eight (8)-digit number which uniquely identifies the accounting unit. The first digit indicates the fund type, while the second digit indicates the department. Allocation: A portion of a lump-sum appropriation which is designated for expenditure by specific organizational units or for special purposes. See Appropriation. American Rescue Plan Act (ARP): The American Rescue Plan Act, signed into law March 11, 2021, provides $1.9 trillion in direct economic assistance for American workers, families, small businesses, and industries to address issues related to the COVID-19 pandemic. The ARP creates the Coronavirus State and Local Fiscal Recovery Funds, which provide $350 billion to address the pandemic’s public health and economic impacts, and lay the foundation for a strong and equitable recovery. Appropriation: An expenditure authorized by the City Council for a specified amount and time. Assessed Valuation: The value that is established for real estate or other property by a government for use as a basis for levying property taxes. Bond: A written promise to pay a specific sum of money (called the principal amount or face value) at a specified future date (called the maturity date) along with periodic interest at a specified rate. Budget Document: The written record of the comprehensive financial plan the mayor presents to the city council for review, revision if deemed appropriate, and adoption. Capital Allocation: Assignment of available capital (dollars) to specific uses. Capital Expenditure: Actual spending of capital (dollars) for capital improvement projects. Capital Improvement: The purchase or construction of durable/fixed assets. Examples include streets, bridges, parks or buildings. Capital Improvement Budget (CIB): A plan for capital expenditures (physical development of the city) to be incurred each year, over a fixed number of years, in order to meet capital needs arising from the long-term work program.
Capital Outlay: Equipment, machinery, vehicles or furniture items included in the operating budget. See Capital Improvement Budget. Capital Projects Fund: A fund established to account for all financial resources used for the construction or acquisition of major capital facilities, except those financed by special assessment, proprietary or fiduciary funds. CIB: Acronym for capital improvement budget. Debt Service Fund: A fund established to account for the financial resources used for the payment of long-term general obligation debt principal, interest, and related costs. Division: An organizational subunit of a department. Each department has one or more divisions, which are responsible for one or more activities. Encumbrances: Legal commitment of appropriated funds (in the form of purchase orders or contracts) to purchase goods or services to be delivered or performed at a future date. They cease to be encumbrances when paid or when the actual liability is created. Enterprise Fund: A fund established to account for city operations that are financed and operated in a manner similar to private business enterprises. The intent is that the costs (expenses, including depreciation) of providing goods and services on a continuing basis be financed or recovered primarily through user charges. ERP: Acronym for Enterprise Resource Planning, a document and information management system. The City’s ERP system is Infor. ETI: Acronym for Enterprise Technology Initiative. This is an activity in the Technology department in which spending and financing for city-wide technology improvements are budgeted. Expenditures: Total charges incurred, whether paid or unpaid, including the provision for retirement of debt not reported as a liability of the fund from which it will be retired, and capital outlays (for governmental funds and fiduciary funds, except non-expendable trust funds) . Expenses. Charges incurred, whether paid or unpaid, for operation, maintenance, interest, and other charges which benefit the current fiscal period (for proprietary funds and non-expendable trust funds). See Expenditures. Fiduciary Fund: A fund established to account for resources held for the benefit of parties outside the government. Financing Plan: Identifies sources of revenues that support the spending plan. Full Time Equivalent (FTE): A personnel position which is financed for the equivalent of 80 hours per pay period, for 26.1 pay periods (a typical year), or 2,088 hours in a year. This is roughly equivalent to 40 hours per week for 52
261
weeks. For example, a .5 FTE would represent 20 hours per week for 52 weeks, or 40 hours per week for 26 weeks. A 1.0 FTE is a general reference to a position normally working for a year. Fund: Each individual fund is a separate accounting entity having its own assets, liabilities, revenues and expenditures or expenses. City financial resources are allocated to, and accounted for, in individual funds based on legal, donor, or administrative restrictions or requirements. Fund Balance: An equity account reflecting the excess of accumulated assets over accumulated liabilities and reserves (monies set aside for specific purposes). Fund Manager: Fund managers are accountable to and receive authority from their department director and division manager, and ultimately from the mayor, the city council, and city residents/taxpayers. Each fund manager is responsible for correctly preparing and submitting the portion of the city's financial plan that is provided by their fund. This includes a properly completed budget request consisting of performance, spending and financing plans. Fund managers are responsible for monitoring the collection of receipts, authorizing spending payments, cash flow planning, and service delivery in accordance with the adopted plan. Fund managers are also responsible for forecasting significant performance, spending or financing variances, determining their cause, creating a solution, and reporting such information to their department director and the director of the office of financial services. See Performance Plan, Spending Plan, and Financing Plan. Fund Number: A three-digit number which uniquely identifies the fund. For example, the General Fund is fund number 100, the city grants fund is 200, and the parks and recreation special projects is 260. There is no significance to the sequence of numbers. See Activity Number. Fund Type: A classification of funds by similar purpose. The fund types are: governmental (general, special revenue, debt service, capital project, special assessment), proprietary (enterprise, internal service), and fiduciary (trust and agency funds). Although the city hall annex operating fund and the public works engineering fund are separate funds, they are the same fund type (internal service). See each fund type for its definition. Also see Fund. GIS: Acronym for geographic information system. General Fund: The fund used to account for all financial resources not specifically earmarked for other purposes. The General Fund is the primary operating fund for the City of Saint Paul. Governmental Funds: All funds other than fiduciary and proprietary funds. Includes the general fund, special revenue funds, capital projects funds, debt service funds and special assessment funds. The measurement focus is on spending or financial flow rather than on net income. See Fiduciary Funds and Proprietary Funds.
Internal Service Fund: A fund established to account for the financing of goods or services provided by one city department to other city departments, divisions or funds on a cost-reimbursement basis. LGA: Acronym for local government aid. See State Aids. MSA: Acronym for municipal state aids. See State Aids. Operating Budget: The annual operating budget is the primary means by which most of the financing, acquisition, spending and service delivery activities of a government are controlled. Operating Transfer In/Out: Interfund transfers are legally authorized transfers between a fund receiving revenue and a fund where resources are expended. PED: Acronym for the planning and economic development department. Permanent Fund: A fund established to account for the custody and administration of assets held in a trust capacity. The assets held in a trust fund must be spent or invested in accordance with the conditions of the trust. Expendable trust funds are similar to governmental funds in that the measurement focus is on spending or financial flow rather than on net income. Non-expendable trust funds are similar to proprietary funds, with the measurement focus on determination of net income. See Agency Fund and Fiduciary Fund. Proprietary Funds: Any fund which attempts to determine net income. Measurement focus is on cost of services similar to private sector for-profit organizations. This category includes enterprise and internal service funds. Recoverable Expenditure: An expenditure made for, or on behalf of, another governmental unit, fund, or department, private individual, firm, or corporation which will, subsequently, be recovered in cash or its equivalent. Retained Earnings: An equity account reflecting the accumulated earnings of an enterprise or internal service fund which are not reserved for any specific purpose. Special Assessment: Charges which the local government collects from property owners to pay for specific services or capital improvement projects such as streets, sewers, etc., which benefit a particular piece of real estate. Special Fund: A fund established to account for the proceeds of specific revenue sources (other than special assessments, expendable trusts, and capital projects) that are legally restricted to expenditures for specified functions or activities. Spending Plan: Provides a unit or subunit of an organization with spending authority to pay for the resources required to effectively accomplish the performance plan. STAR: Acronym for sales tax revitalization program.
262
State Aids: The following are the major types of intergovernmental revenues received by the City of Saint Paul from the State of Minnesota:
Local Government Aid (LGA): Begun in 1971, this program was designed to provide indirect property tax relief through the redistribution of income tax and sales tax revenues collected at the state level to local units of government. The amount of funding received by local units of government is based on a distribution formula determined by the Minnesota State Legislature. The distribution formula is based on "need" as well as "capacity". The 2001 State Legislature rolled the Homestead and Agricultural Credit Aid into Local Government Aid.
Municipal State Aids (MSA). This program is financed by motor vehicle related taxes collected at the state level. The state gasoline tax is the largest revenue source and the dollars collected are constitutionally dedicated for expenses related to MSA routes. The revenues are redistributed back to municipalities of 5,000 or more residents to be used for construction and maintenance of their MSA designated routes.
Tax Increment Financing (TIF) District: A TIF district is a designated geographical area where a city is undertaking redevelopment or development activity. Any increase in assessed valuation due to new development activity is captured by the district. Property taxes levied against those captured values are used to finance the public improvement costs incurred to induce the private development activity. Public improvement costs can be financed by issuing bonds or by a pay-as-you-go plan.
263