rec reported practice level challenges to achieving meaningful use office of provider adoption...
TRANSCRIPT

REC Reported Practice Level Challenges to Achieving Meaningful Use
Office of Provider Adoption SupportDawn Heisey-Grove, MPH
September 10, 2012
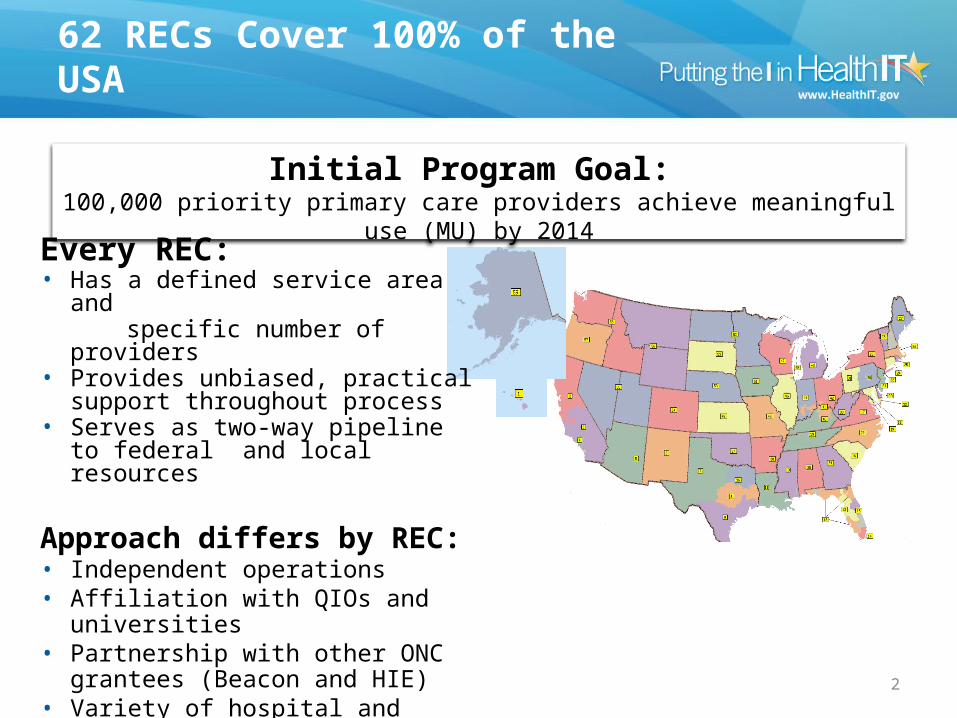
Initial Program Goal: 100,000 priority primary care providers achieve meaningful use (MU) by 2014
62 RECs Cover 100% of the USA
2
Every REC:• Has a defined service area and specific number of providers• Provides unbiased, practical support
throughout process• Serves as two-way pipeline to federal
and local resources
Approach differs by REC:• Independent operations• Affiliation with QIOs and universities• Partnership with other ONC grantees
(Beacon and HIE)• Variety of hospital and payer partnerships
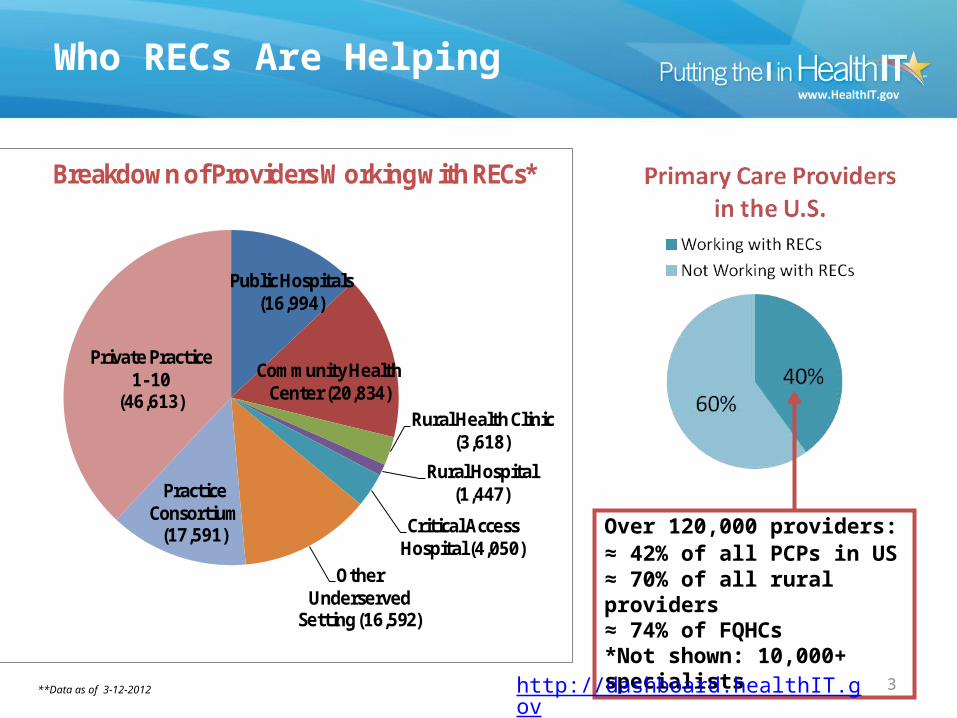
Public Hospitals (16,994)
Community Health Center (20,834)
Rural Health Clinic (3,618)
Rural Hospital (1,447)
Critical Access Hospital (4,050)
Other Underserved
Setti ng (16,592)
Practice Consortium
(17,591)
Private Practice 1- 10
(46,613)
Breakdown of Providers Working with RECs*
Over 120,000 providers:≈ 42% of all PCPs in US≈ 70% of all rural providers≈ 74% of FQHCs*Not shown: 10,000+ specialists
Who RECs Are Helping
3http://dashboard.healthIT.gov**Data as of 3-12-2012

Who Works with the RECs?
4
Family Practice Providers (52,665)
Pediatricians(21361)
Internal Medicine Practitioners
(29,320)
OB-GYNs (14,702)
General Practice Providers (5,579)
Gynecologists (926)
Other Providers
(1,665)
Geriatricians (882)
Adolescent Medicine Providers
(222)
Specialties Working with RECs
**Data as of 3-12-2012

Background
• In November, 2011, RECs were asked to enter site-level challenges in the CRM
• RECs are using the CRM Challenges feature in varying ways– Some are creating a “Challenges” for every site; for those
sites on track, they are creating an “On Track” issue– Others are only creating “Challenges” issues for those
practices that are stuck in the process• 3 RECs are sending data files to OPAS external to the
CRM. Those data are incorporated into these slides.

Challenges Categories
• One field captures the stage of adoption for the practice: are they trying to reach AIU, or MU?
• There are then 5 Challenges Types: Practice Issues, Vendor Issues, Attestation Process problems, problems with MU Measures, and an “On Track” classification
• Within each of the Challenges Types, there are sub-categories. A definition page is available upon request.
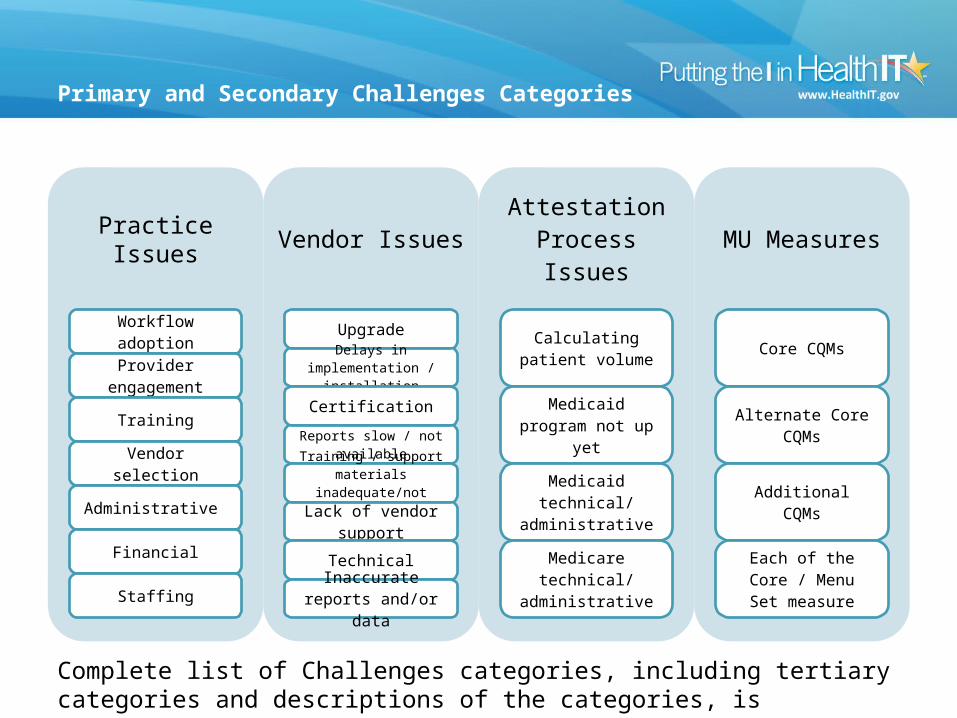
Primary and Secondary Challenges Categories
Practice Issues
Workflow adoption
Provider engagement
Training
Vendor selection
Administrative
Financial
Staffing
Vendor Issues
Upgrade
Delays in implementation / installation
Certification
Reports slow / not available
Training / support materials inadequate/not
availableLack of vendor
support
Technical
Inaccurate reports and/or data
Attestation Process Issues
Calculating patient volume
Medicaid program not up yet
Medicaid technical/ administrative
Medicare technical/ administrative
MU Measures
Core CQMs
Alternate Core CQMs
Additional CQMs
Each of the Core / Menu Set measure
Complete list of Challenges categories, including tertiary categories and descriptions of the categories, is available upon request.
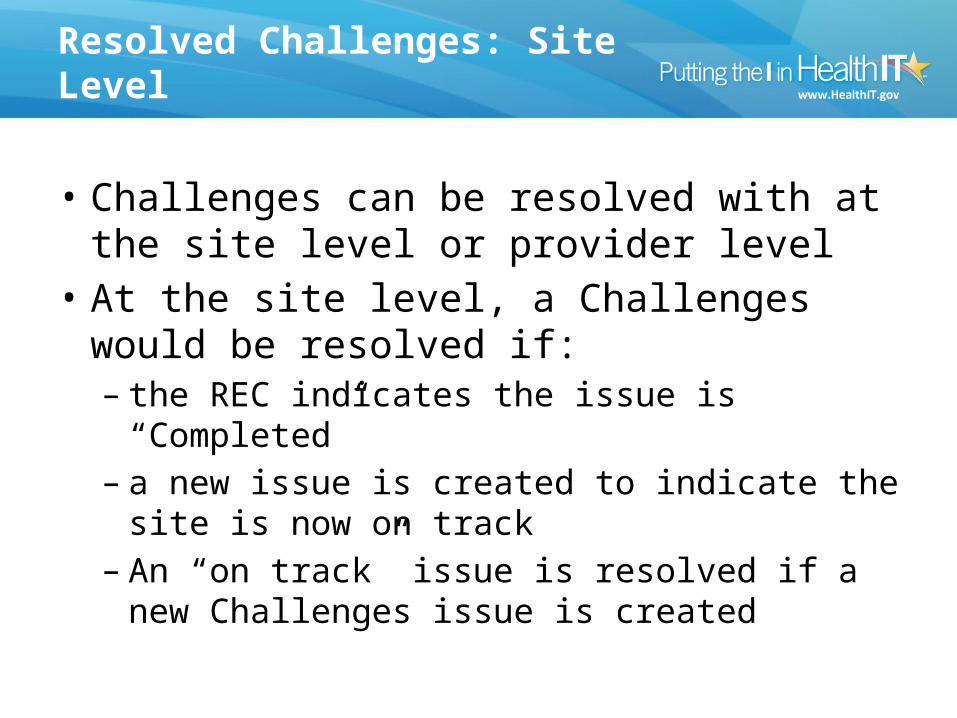
Resolved Challenges: Site Level
• Challenges can be resolved with at the site level or provider level
• At the site level, a Challenges would be resolved if:– the REC indicates the issue is “Completed”– a new issue is created to indicate the site is now
on track– An “on track” issue is resolved if a new Challenges
issue is created

Resolved Challenges: Provider Level
• At the provider level, all challenges are resolved if the provider receives an MU payment from CMS.
• Other ways a provider may have a Challenges resolved:– Attestation Process issues are resolved when a payment is
received from CMS– AIU issues are resolved if an AIU payment is received by CMS– Vendor selection issues are resolved if a provider reaches M2 and
the issue was created before the M2 date– All issues except Attestation Process are resolved if a provider
reaches M3– All AIU Vendor Issues when the provider reaches M2, provided
the issue was created before the M2 date

Top Ten Overall Challenge Categories by Number of Providers ImpactedRank Secondary Challenge Category Rank
Last Month
Total Providers Impacted (% resolved)
New reports this month by number of providers (% of total providers with new reports)
1 MU Measures 1 4,556 (12%) 364 (15%)
2 Provider engagement 2 3,853 (12%) 249 (10%)
3 Administrative practice issues 4 3,063 (11%) 510 (21%)
4 Vendor selection 3 2,974 (22%) 72 (3%)
5 Workflow adoption 6 2,081 (10%) 76 (3%)
6 Vendor delays in implementation/ installation 5 1,995 (9%) 157 (6%)
7 Medicaid Program not up yet 7 1,645 (29%) 32 (1%)
8 Practice financial issues 10 1,609 (14%) 244 (10%)
9 Vendor EHR reports slow/ not available 8 1,408 (12%) 66 (3%)
10 Practice staffing issues 13 1,191 (14%) 77 (3%)
Data as of August 5, 2012, pulled from the ONC CRM. A total of 19,237 challenge Issues have been reported by RECs, impacting 54,101 providers. A total of 1,197 challenge Issues were created between July 1 and August 5, 2012, affecting 3,251 providers. 2,942 providers had challenge issues resolved between July 1 and August 5, 2012.

Challenge Activity For The Month
Top Ten New Challenge IssuesSecondary Challenge Category
Number of Providers (% of total providers with new reports)
Administrative practice issues 510 (21%)
MU Measures 364 (15%)
Provider engagement 249 (10%)
Practice financial issues 244 (10%)
Vendor delays in implementation / installation 157 (6%)
Vendor EHR reports slow/ not available 95 (4%)
Staffing 77 (3%)
Workflow adoption 76 (3%)
Medicare technical issues 75 (3%)
Vendor selection 72 (3%)
Top Ten Resolved ChallengesSecondary Challenge Category
Number of Providers (% of total providers impacted by secondary category)
Vendor selection 192 (13%)
MU Measures 159 (11%)
Provider engagement 124 (8%)
Vendor EHR reports slow/ not available 109 (7%)
Administrative practice issues 95 (6%)
Vendor upgrades 76 (5%)
Practice staffing issues 67 (5%)
Vendor delays in implementation / installation 60 (4%)
Medicaid program not up yet 59 (4%)
Workflow adoption 54 (4%)
Data as of August 5, 2012, pulled from the ONC CRM. A total of 1,197 challenge issues were created between July 1 and August 5, 2012, affecting 3,251 providers. 2,942 providers had challenge issues resolved between July 1 and August 5, 2012. The green circle represents the issue with the most movement this month.
6

Overall Top Ten MU Measures-Specific Challenges
Rank Meaningful Use MeasureNumber of Providers Impacted
New Reports this month by number of providers impacted
1 Core 13: Clinical Summary 1648 116 (28%)
2 Menu 7: Medication Reconciliation 852 9 (2%)
3 Core 15: Security Review 851 15 (4%)
4 Menu 4: Patient Reminders 820 6 (1%)
5 Menu 8: Summary Care Record 802 7 (2%)
6 Menu 9: Immunization 607 11 (3%)
7 Menu 6: Educational Resources 585 26 (6%)
8 Core 14: Electronic Exchange 513 17 (4%)
9 Core 9: Smoking Status 490 1 (0.2%)
10 Core CQMs 444 7 (2%)
Data as of August 5, 2012, pulled from the ONC CRM. Users may select multiple measure-specific issues as challenges within one report, therefore, these numbers may overestimate the total number of challenge reports for Measure-specific issues. The blue ribbon indicates the top reported issue for the month. The green circle represents the issue with the most movement this month.
Measures to watch:Core 4 (eRx) is #13 overall this month (down from #8) with 21 (5%) new reports.
5
7
5

Top Ten Newly Reported MU Measures-Specific Challenges: July 1-August 5, 2012
Rank Meaningful Use Measure New Reports this month, by number of providers impacted
Percent of total monthly providers impacted
1 Core 13: Clinical Summary 116 28%
2 Core 9: Smoking Status 62 15%
3 Core 8: Vital Signs 37 9%
4 Menu 6: Educational Resources 26 6%
5 Core 4: eRx 21 5%
6 Core 14: Electronic Exchange 17 4%
7 Core 15: Security Review 15 4%
8 Additional CQMs 12 3%
9 Menu 9: Immunization 11 3%
10 Menu 2: Laboratory Tests 10 2%
Data as of August 5, 2012, pulled from the ONC CRM. Users may select multiple measure-specific issues as challenges within one report, therefore, these numbers may overestimate the total number of challenge reports for Measure-specific issues.

Top Ten Top Ten Challenge Categories for Providers Trying to Reach MURank Secondary Challenge Category Rank
Last Month
Total Providers Impacted (% resolved)
Reports this month (% of total monthly reports)
1 MU Measures-specific issues 1 2,859 (8%) 109 (14%)
2 Provider engagement 2 1,533 (5%) 124 (16%)
3 Practice administrative issues 6 1,133 (3%) 96 (13%)
4 Vendor EHR reports slow/ not available
3 1,064 (5%) 16 (2%)
5 Workflow adoption 4 1,023 (2%) 30 (4%)
6 Upgrade 5 805 (3%) 20 (3%)
7 Vendor delays in implementation/ installation
7 565 (0.4%) 45 (6%)
8 Practice staffing issues 13 538 (1%) 64 (8%)
9 Practice financial issues 9 526 (2%) 8 (1%)
10 Vendor reports and/or data inaccurate
10 523 (1%) 39 (5%)
Data as of August 5, 2012, pulled from the ONC CRM. MU refers to the implementation phase the site is at for their EHR. A total of 11,991 providers have MU challenge Issues. The green circle represents the issue with the most movement this month; the blue ribbon indicates the top reported challenge for the month.
5

Top Ten Newly Reported Challenge Categories for Providers Trying to Reach MU: July 1-August 5, 2012
Rank Secondary Challenge Category Rank Last Month
Total Providers Impacted
Percent of total monthly providers impacted
1 Provider engagement 2 124 16%2 MU Measures 1 109 14%3 Administrative practice issues 6 96 13%4 Practice staffing issues 7 64 8%5 Medicare technical issues 17 53 7%6 Vendor delays in implementation/
installation3 45 6%
7 Vendor reports and/or data inaccurate
9 39 5%
8 Practice staff training 4 32 4%9 Workflow adoption 5 30 4%10 Upgrade 15 20 3%
12
Data as of August 5, 2012, pulled from the ONC CRM. MU refers to the implementation phase the site is at for their EHR. A total of 2,773 providers have newly reported MU challenge Issues between July 1-August 5, 2012. The green circle represents the issue with the most movement this month.
5

Challenge and On Track Reports by Site
12%
8%
79%
Proportion of Sites with Challenge/On Track
Reports
Barrier Issue On Track ReportNo Barrier Issue
Series112000
12500
13000
13500
14000
14500
15000
15500
16000
16500
24211387654321
*
Number of Reports Per Site
Data as of August 5, 2012, pulled from the ONC CRM. 15,983 sites are represented in 19,237 challenge reports. Each site in the CRM may have multiple challenge issues created for it.
*84% of sites have only 1 challenge/on track issue reported.

Overall Monthly Challenge Activity
Nov-11
Dec-11
Jan-12
Feb-12
Mar-
12
Apr-12
May
-12
Jun-12
Jul-1
2
Aug-12
0
1000
2000
3000
4000
5000
6000
7000
8000
ResolvedUpdatedCreated
*
*Data as of August 5, 2012, pulled from the ONC CRM. A total of 19,237 challenge Issues have been reported by RECs.

Proportion of Providers Impacted by Challenge Types as Reported in CRM
Unresolved Challenge Issues
Practice Issues50%
MU Measures14%
Vendor Issues25%
Attestation Process12%
Resolved Challenge Issues
Issue Type Percent Resolved
Attestation Process 29
MU Measures 12.3
Practice Issues 13.7
Vendor Issues 15.9
Data as of August 5, 2012, pulled from the ONC CRM. 43,906 providers have open challenge issues; 33% (14,420) of those are on track. 10,195 providers have resolved issues.

Practice Issue Challenges
Unresolved Practice Issue Challenges
Adminis-trative
15%
Financial10%
Provider En-
gage-ment21%
Staffing8%
Training6%
Vendor Se-lection
31%
Workflow Adop-tion10%
Resolved Practice Issue Challenges by Number of Providers
Nov-11
Dec-1
1
Jan-1
2
Feb-1
2
Mar-
12
Apr-12
May
-12
Jun-1
2Ju
l-12
Aug-12
0
50
100
150
200
250
300
350
400
450
Workflow AdoptionVendor SelectionTrainingStaffingProvider EngagementFinancialAdministrative
Data as of August 5, 2012, pulled from the ONC CRM. A total of 17,015 providers have a practice issue challenges report; 1,425 (8%) do not have a sub-category. 2,337 (14%) providers have practice issues that have been resolved.
Num
ber
of
Pro
vid
ers

Vendor Issue Challenges
Unresolved Vendor Issue Challenges
Certification12%
Delays In Implemen-tation/In-stallation
27%
Inaccurate Reports And/Or Data
11%
Lack Of Support3%
Reports Slow/Not Available
16%
Technical12%
Training/Support
Materials4%
Upgrade15%
Vendor Selection0%
Resolved Vendor Issue Challenges
Nov-11
Dec-11
Jan-12
Feb-12
Mar-12
Apr-12
May-12
Jun-12Jul-1
2
Aug-120
50
100
150
200
250
300
UpgradeTraining/Support ma-terialsTechnicalReports Slow/Not AvailableLack Of SupportInaccurate Reports and/or DataDelays In Implementa-tion/InstallationCertification
Data as of August 5, 2012, pulled from the ONC CRM. A total of 8,737 providers have a vendor issue challenge report ; 825 (9%) do not have a sub-category. 1,385 (16%) providers have resolved vendor issue challenges.
Num
ber
of
Pro
vid
ers

Attestation Process Challenges
Unresolved Attestation Process Issues
Med-icaid Pro-gram
Not Up Yet
34%
No Sub-Type26%
Medicaid19%
Medicare15%
Calculate Patient Volume
6%
Resolved Attestation Process Issues
Nov-11
Jan-1
2
Mar-
12
May
-12
Jul-1
20
50
100
150
200
250
300
MedicareMedicaid Program Not Up YetMedicaidCalculate Patient Volume
Data as of August 5, 2012, pulled from the ONC CRM. A total of 4,878 providers have an attestation process challenge report; 1,230 (25%) do not have a sub-category. 1,419 (29%) providers have a resolved attestation process issue.
Num
ber
of
Pro
vid
ers

Top Five Challenges by Practice Type
Private Practice
Private Practice
1-10 11+
1 MU Measures Practice staffi ng
MU Measures Practice
Administrative Provider
EngagementPractice
financial issues
Vendor delays In
Implementation/Installation
Provider Engagement
Practice administrative
Medicaid program not up
yet
2 Practice Administrative
Practice Administrative
Workflow adoption
Vendor selection
Vendor selection
Provider Engagement
Provider Engagement
MU Measures MU Measures MU Measures
3
Vendor delays In
Implementation/Installation
MU Measures Provider
engagement MU Measures MU Measures
Medicaid program not up
yet
Practice Administrative
Practice financial issues
Vendor technical
Vendor selection
4Medicaid
program not up yet
Practice financial issues
Practice Administrative
Training/support materials
Practice Administrative
MU Measures Medicaid
program not up yet
Practice administrative
Vendor upgrade
Vendor upgrade
5 Medicaid technical issues
Workflow adoption
Vendor delays In
Implementation/Installation
Provider Engagement
Practice financial issues
Medicare technical issues
Vendor selection
Vendor selection
Medicaid calculate
patient volume
Provider Engagement
Rural Health Clinic
Rural Hospital
Specialty Practice Rank CHCs CAHs
Other Underserved Setting
Practice Consortium
Public Hospitals
Data as of August 5 2012, pulled from the ONC CRM. Non-priority hospitals did not report any challenges.
Attestation Process Practice Issue Vendor IssueMU Measures

Top Five MU Measures-Specific Challenges by Practice Type
Rank CHCs CAHs
Other Underserved Setting
Practice Consortium
Private Practice 1-10
Public Hospitals
Rural Hospital
Rural Health Clinic
Specialty Practice
1 Core 15: Security Review
Menu 4: Patient Reminders
Core 13: Clinical Summary
Core 15: Security Review
Core 13: Clinical Summary
Core CQMs Core 8: Vital Signs Core 4: eRx
Core 9: Smoking Status
2 Menu 9: Immunization
Core 13: Clinical Summary
Menu 8: Summary Care Record
Core 13: Clinical Summary
Core 15: Security Review
Core 13: Clinical Summary
Core 9: Smoking Status
Core 13: Clinical Summary
Core 4: eRx
3 Menu 5: Electronic Access
Menu 8: Summary Care Record
Menu 4: Patient Reminders
Core 14: Electronic Exchange
Menu 9: Immunization Core 1: CPOEN/A Core CQMs
Core 13: Clinical Summary
4 Core 4: eRxMenu 7: Medication Reconciliation
Menu 7: Medication Reconciliation
Core 11: Implement CDS
Core 14: Electronic Exchange
Core 9: Smoking Status
N/A Additional CQMs
Core 15: Security Review
5 Core 12: Electronic Copy
Menu 6: Educational Resources
Menu 6: Educational Resources
Core 9: Smoking Status
Core 9: Smoking Status
Core 4: eRx N/ACore 10: Reporting Ambulatory CQMs
Core 5: Active Medication List
Data as of August 5, 2012,pulled from ONC CRM, Private Practices >10 and non-priority hospitals did not report any MU Measures challenges.Users may select multiple measure-specific issues as challenges within one report, therefore, these numbers may overestimate the total number of challenge reports for Measure-specific issues.Green arrows indicate measures with significant upward movement in the rankings.
6
5
11
8
9