recen t hie-measurement of neutron and gamma-ray spectra …
TRANSCRIPT
National DefenseDefence natonale
RECEN T HiE-MEASUREMENT OF NEUTRONAND GAMMA-RAY SPECTRA 1080 METERS
FROM THE APRD CRITICAL FACILITY
by
H.A. Robitaille and B.E. Hoffarth •
t..IL
DEFENCE RESEARCH ESTABLISHMENT OTTAWAREPORT 877
anuary 1984Canadcua! Ottawa

U National Defensen Defence nationale
RECENT RE-MEASUREMENT OF NEUTRONAND GAMMA-RAY SPECTRA 1080 METERS
FROM THE APRO CRITICAL FACILITYby
H.A. Robitaille arnd B.E. HoffarthNuclear Effects Section
Protective Sciences Division
.,-,-.--
.,q FROM THEAPRD CRTICAL F CT ZAB
€- ,T
.>.-
Vt t
DEFENCE RESEARCH ESTABLISHMENT OTTAWAREPORT 877
PCN January 198411A Ottawa
I.. .- -"
ABSTRACT
Previously reported measurements of long-range air-transportedneutron and gamma-ray spectra from the fast-critical facility at the US ArmyAberdeen Proving Ground have been supplemented recently at the 1080-meter position. The results of these determinations are presented herein andcompared to several recent calculations from other research establishments.
In addition, a summary of all dosimetric measurements obtained in theperiod 1979-1982 are appended, as are new determinations of APRD soilcomposition.
Integral quantities such as neutron and gamma-ray kermas are verywell predicted by the latest calculations, however there still existsignificant spectral differences. At short ranges calculated neutronspectra are somewhat softer than experimental measurements, but at thefarthest range of 1080 meters agreement is surprisingly good. Gamma-ray spectra remain well-calculated at all ranges.
RESUME
On prisente ici le compliment, l'altitude de 1080 metres, desmesures d~ji cities et faites lors de vols de longue port~e, par les installations exp~rimentales de la base militaire americaine d'Aberdeen,concernant les spectres d'6missions neutroniques et de rayons gamma. On acompar6 les risultats de ces mesures A plusieurs calculs rcents effectu~spar d'autres centres de recherches.
En outre, dans la section annexe figure un r~sumE de toutes les mesures dosim~triques, de mime que de nouvelles analyses de la composition
des sols de l'APRD.
Les calculs les plus rcents permettent tr&s bien d'ivaluer desquantit~s int~grales telles que les kermas engendr~s par les neutrons et le-rayons gamma; on observe toutefois d'importantes differences spectrales. A faible altitude, les spectres neutroniques son i6g~rement moins prononc~sque dans les mesures exp~rimentales, mais A 1'altitude plus grande de 1080m, la concordance est 6tonnamment bonne. Les spectres gamma restentcorrectement calcul6s S toutes les altitudes.
del.
TABLE OF CONTENTS
PAGE
ABSTRACT .............................................................
TABLE OF CONTENTS ..................................................... ivLS.-:.LIST OF ILLUSTRATIONS ..... ............................................ vi xl
.0 LIST OF TABLESI... ..................................................... 1
S1.0 INTRODUCTION.........................1I
2.0 EXPERIMENT ....................................................... 2
2.1 Geometry .................................................... 2
2.2 Radiation Source ............................................ 2
2.3 Detectors ................................................... 5
2.4 Soil Composition ............................................ 6
3.0 EXPERIMENTAL RESULTS ............................................. 6
3.1 Review of 1980 Spectroscopy ................................. 6
3.2 1981 Measurement at 1080 Meters ............................. 10
3.3 Bonner-Sphere Determinations ................................ 12
3.4 High Temperature and Humidity Measurements .................. 13
3.5 Integral Dosimetry .......................................... 13
3.6 Discussion .................................................. 20
4.0 THEORETICAL CALCULATIONS ......................................... 21
4.1 Previous ORNL and DREO Calculations ......................... 21
4.2 Recent LANL, SAI and LLNL Calculations ...................... 21
iv
TABLE OF CONTENTS -(Continued)
PAGE
4.3 Comparison to Experimental Spectroscopy .................... 22
4.4 Comparison to Experimental Dosimetry ....................... 29
4.5 Discussion .............................................. 290
5.0 CONCLUSIONS .................................................. 31
6.0 ACKNOWLEDGEMENTS.............................................. 32
7.0 REFERENCES........... .......... ............................. 33
8.0 APPENDICES ................................................... 37
A. Plotted DREO Free-Field Neutron Spectra..................... 37
B. Plotted DREO Free-Field Gammna-Ray Spectra................... 49
C. Listed Fine Group OREO Neutron Spectra ...................... 61
D. Listed Fine Group DREO Gamma-Ray Spectra.................... 69
E. DREO Neutron Spectra in 37-Group Format..................... 77
F. DREO Ganuna-Ray Spectra in 21-Group Format................... 83
G. Summary of Free-Field Integral Measurements................. 89
U.Theoretically-Calculated Integral Quantities................ 99
I. APRD Soil Composition..................................... 103
J. Neutron and Gamma-Ray Spectra from Californium-252...........109
* ~~V
6
LIST OF ILLUSTRATIONS
PAGE
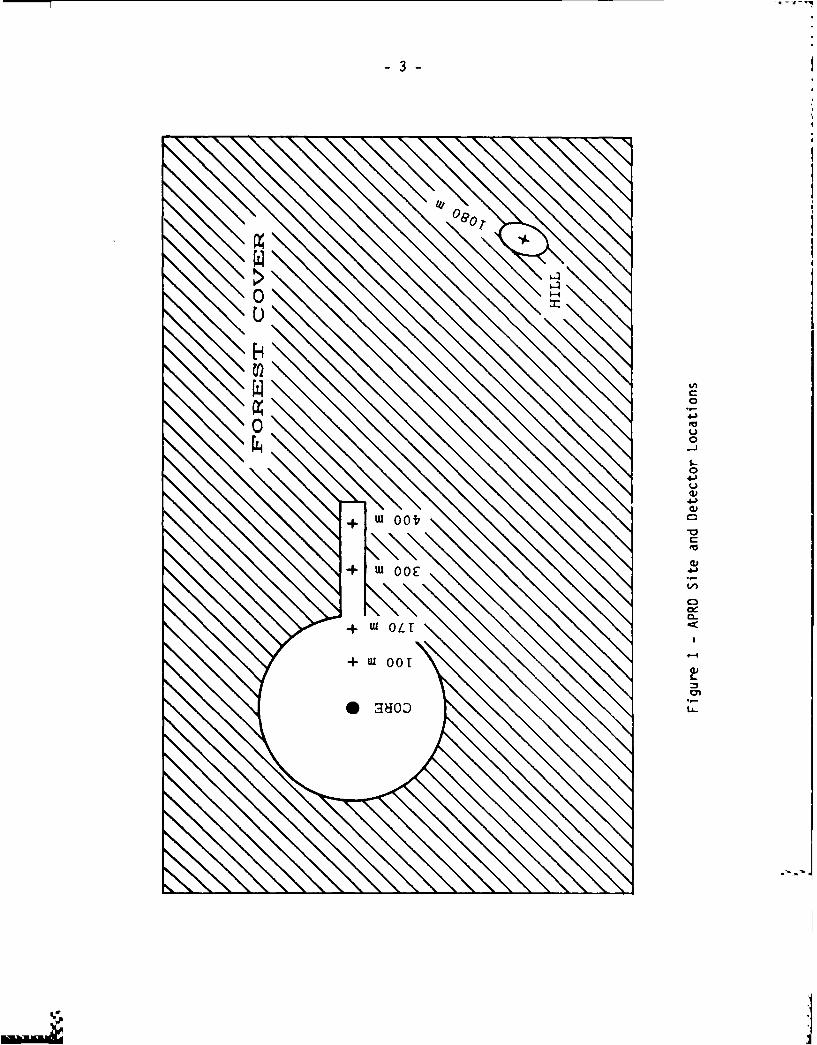
Figure 1. APRD Site and Detector Locations ......................... 3
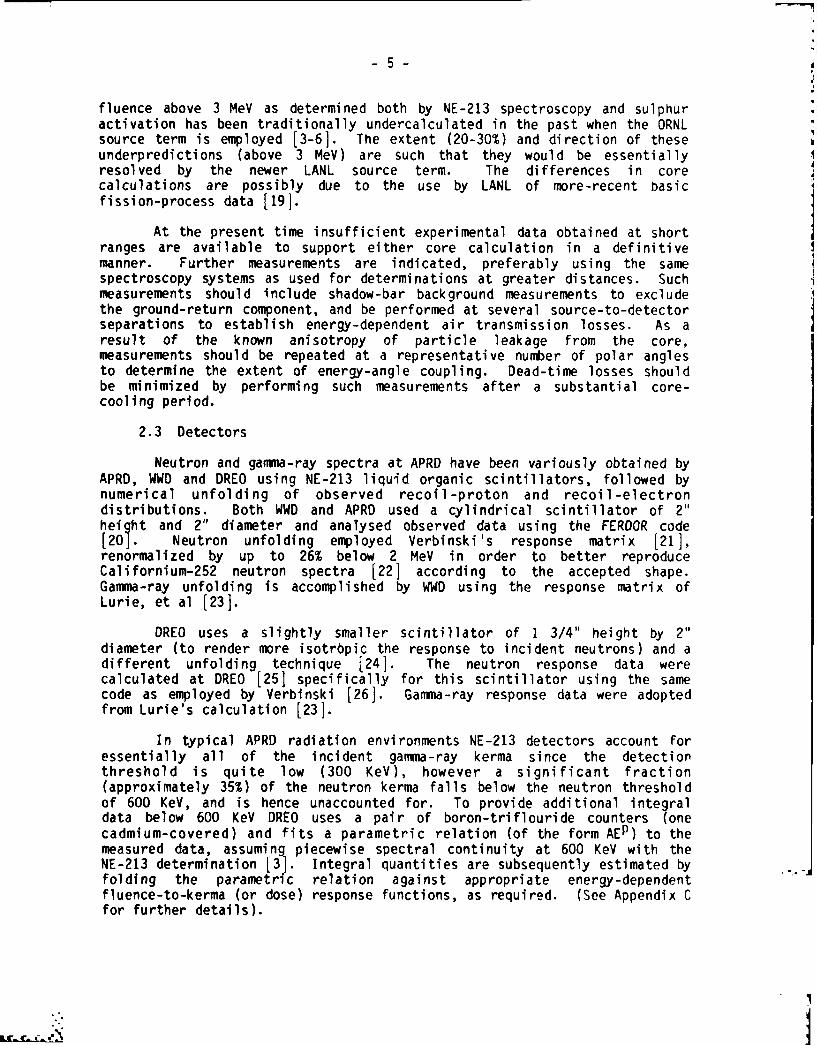
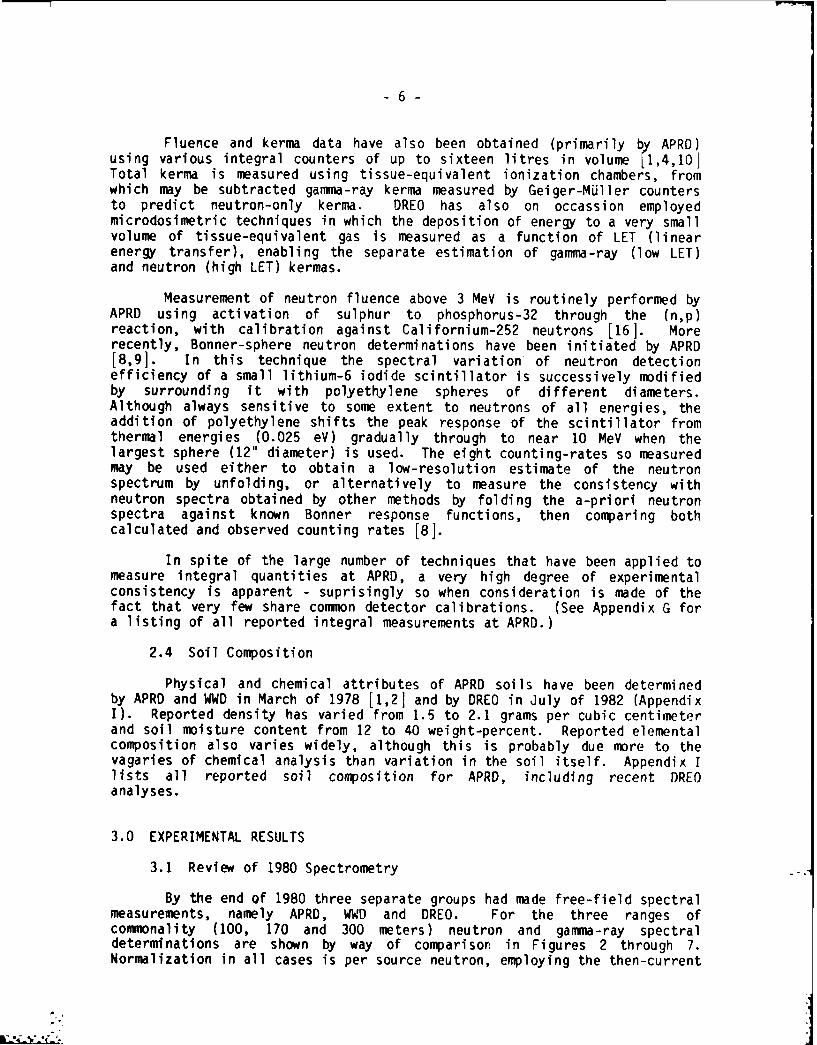
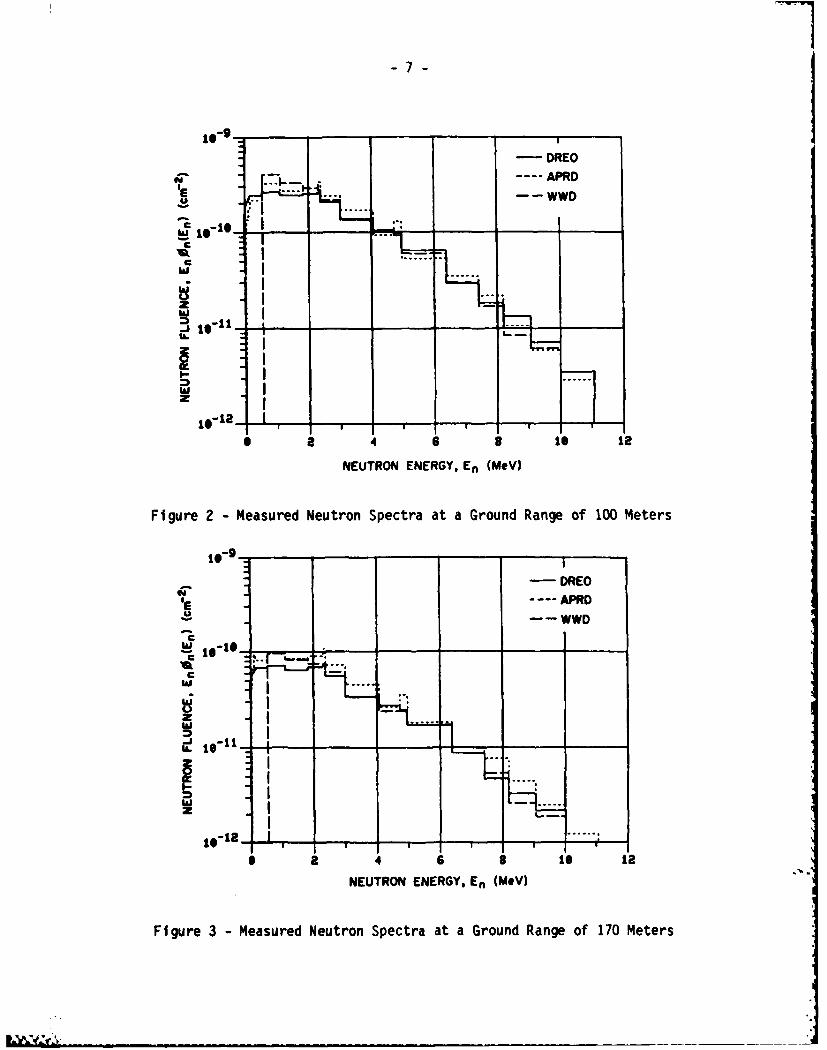
Figure 2. Measured Neutron Spectra at a Ground Range of100 Meters ................................................. 7
Figure 3. Measured Neutron Spectra at a Ground Rangeof 170 Meters .............................................. 7
Figure 4. Measured Neutron Spectra at a Ground Rangeof 300 Meters .............................................. 8
Figure 5. Measured Gamma-Ray Spectra at a Ground RangeFgrof 100 Meters .............. ........................... 8
Figure 6. Measured Gamma-Ray Spectra at a Ground Rangeof 170 Meters .............................................. 9
Figure 7. Measured Gamma-Ray Spectra at a Ground Rangeof 300 Meters ......................................... 9
Figure 8. Neutron Spectra Measured in 1980 and 1981at 1080 Meters ............................................. 11
Figure 9. Gamma-Ray Spectra Measured in 1980 and 1981at 1080 Meters ............................................. 11
Figure 10. Neutron Spectrum Measured in 1982 at 1080 Meters ........... 14
Figure 11. Gamma-Ray Spectrum Measured in 1982 at 1080 Meters ......... 14
Figure 12. Measured Neutron Fluence Above 3 MeV ..................... 15
Figure 13. Measured Neutron Tissue-Kerma ........................... 16
Figure 14. Measured Gamma-Ray Tissue-Kerma .......................... 17
Figure 15. Measured Total Tissue-Kerma ............................. 18
Figure 16. LANL vs DREO Neutron Spectra at 170 Meters ................ 23
Figure 17. LANL vs DREO Neutron Spectra at 400 Meters ................. 24
Figure 18. LANL vs DREO Neutron Spectra at 1080 Meters...............25
Figure 19. SAL vs DREO Neutron Spectra at 170 Meters .................. 26
Vi
'-.0
4%.%I b
LIST OF ILLUSTRATIONS - (Continued)
PAGE
Figure 20. SA vs DREG Neutron Spectra at 400 Meters...............-26
Figure 21. SAI vs DREO Neutron Spectra at 1080 Meters ................ 27
Figure 22. SAI vs DREO GaNma-Ray Spectra at 170 Meters ............... 27
Figure 23. SAI vs DREO Gamma-Ray Spectra at 400 Meters ............... 28
Figure 24. SAI vs DREO Gamma-Ray Spectra at 1080 Meters............. 28
Figure 25. Comparison of Theoretical and ExperimentalIntegral Quantities ....................................... 30
Figure A-1. Free-Field Neutron Spectrum at 15 Meters (1980)...........39
Figure A-2. Free-Field Neutron Spectrum at 100 Meters (1980) ......... 40
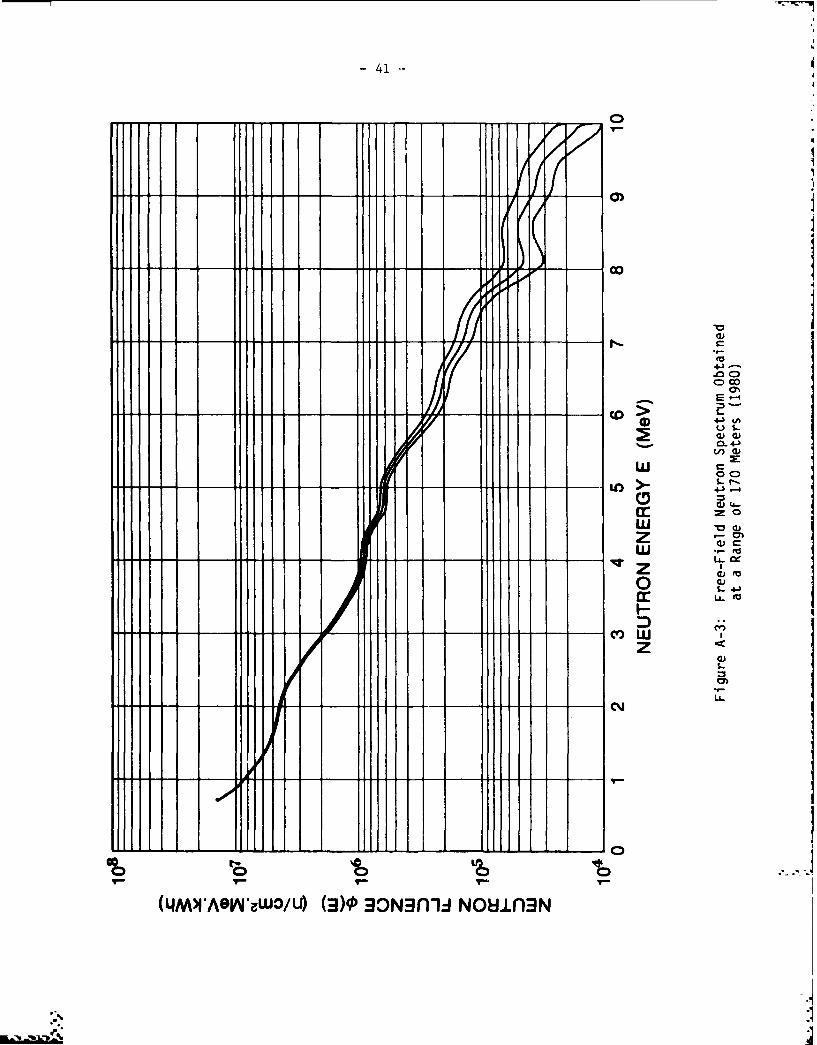
Figure A-3. Free-Field Neutron Spectrum at 170 Meters (1980) ......... 41
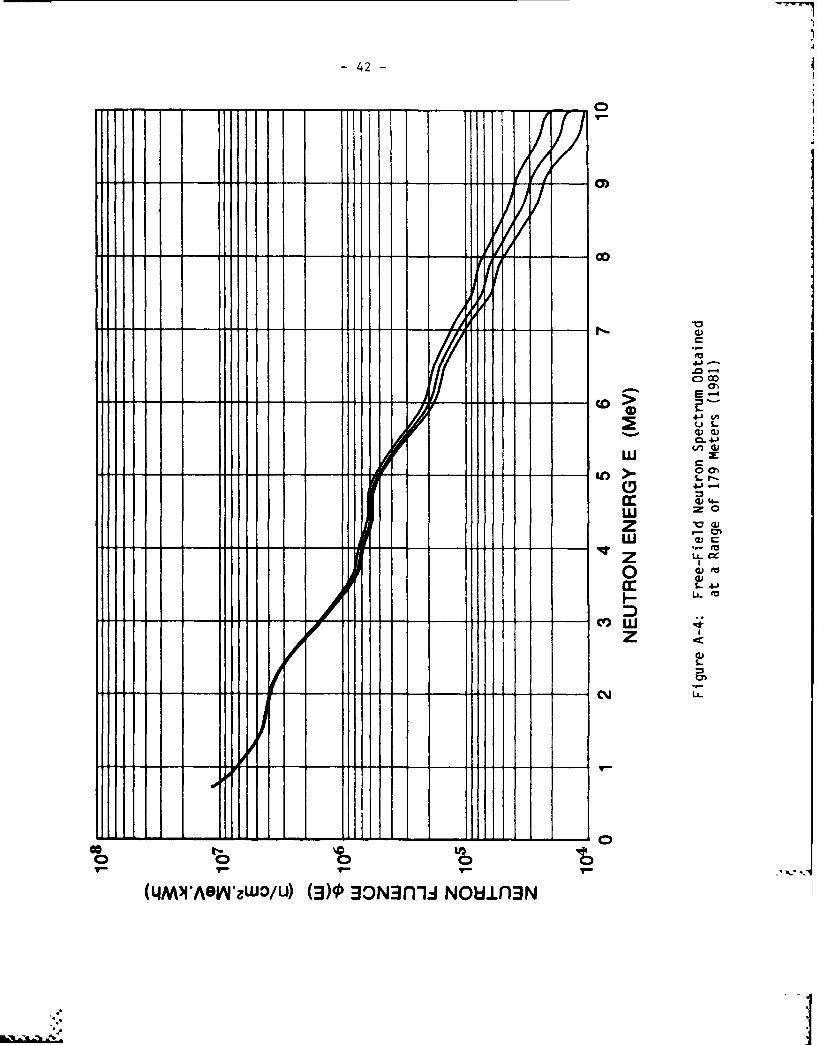
Figure A-4. Free-Field Neutron Spectrum at 179 Meters (1981) ......... 42
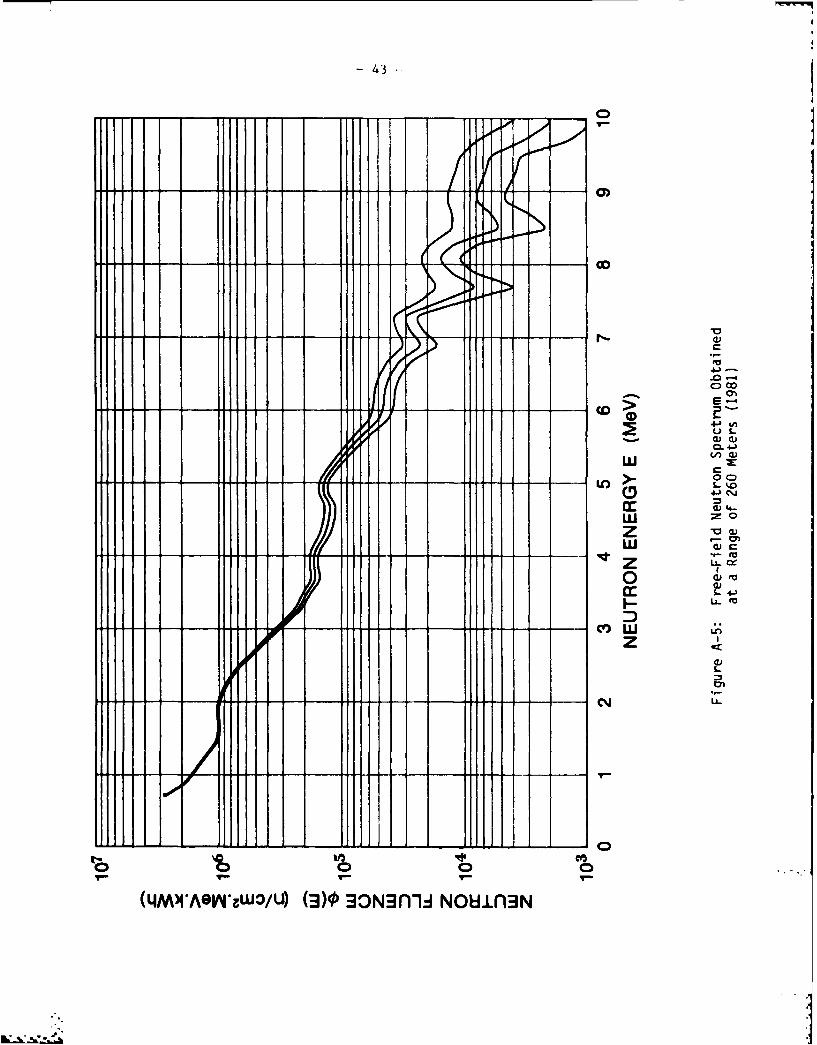
Figure A-5. Free-Field Neutron Spectrum at 260 Meters (1981) ......... 43
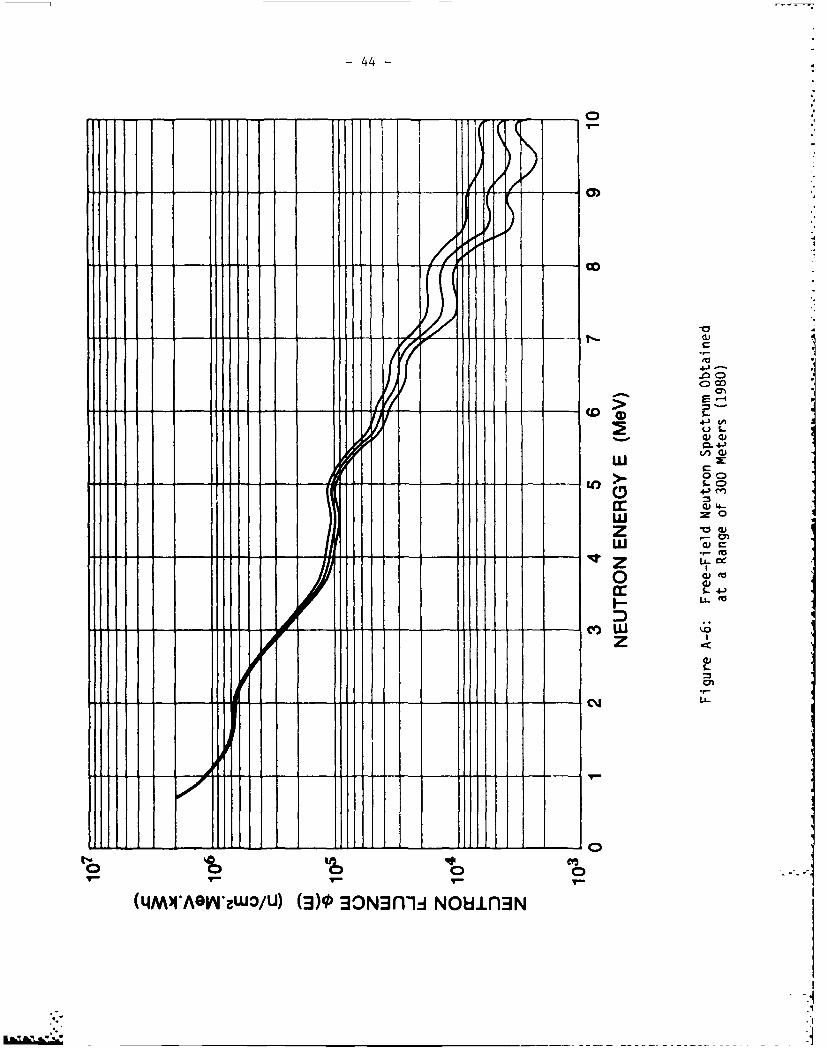
Figure A-6. Free-Field Neutron Spectrum at 300 Meters (1980)..........44
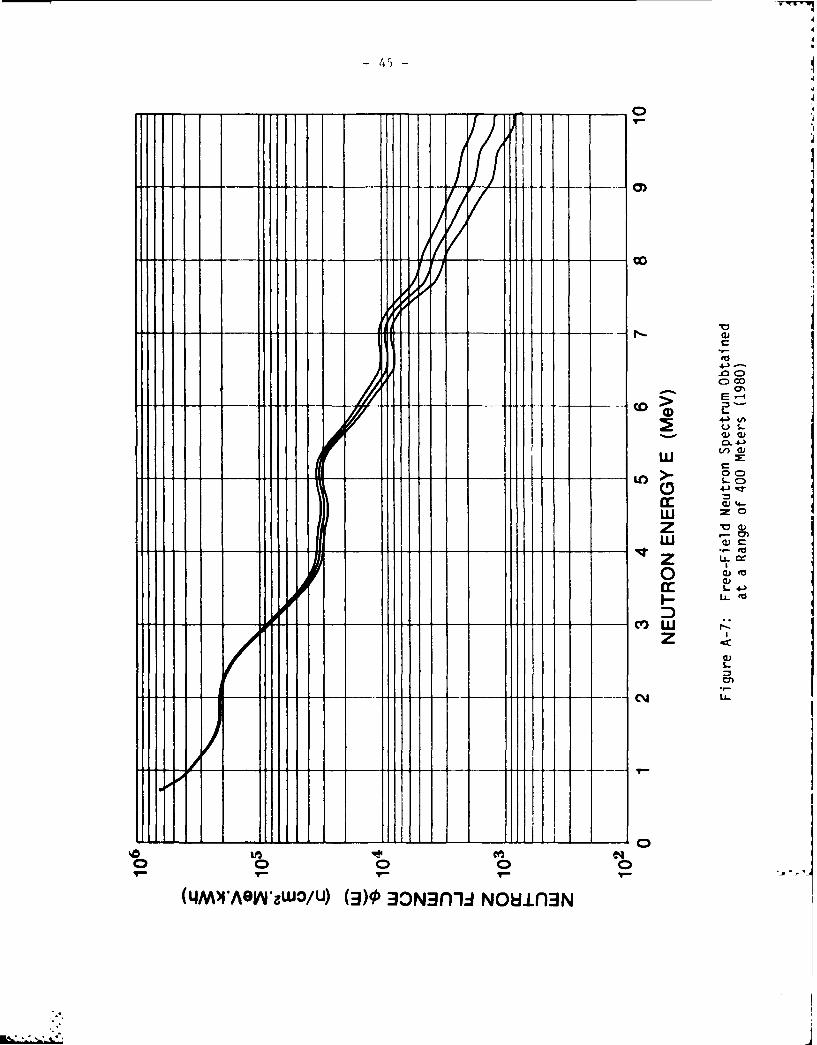
Figure A-7. Free-Field Neutron Spectrum at 400 Meters (1980) ......... 45
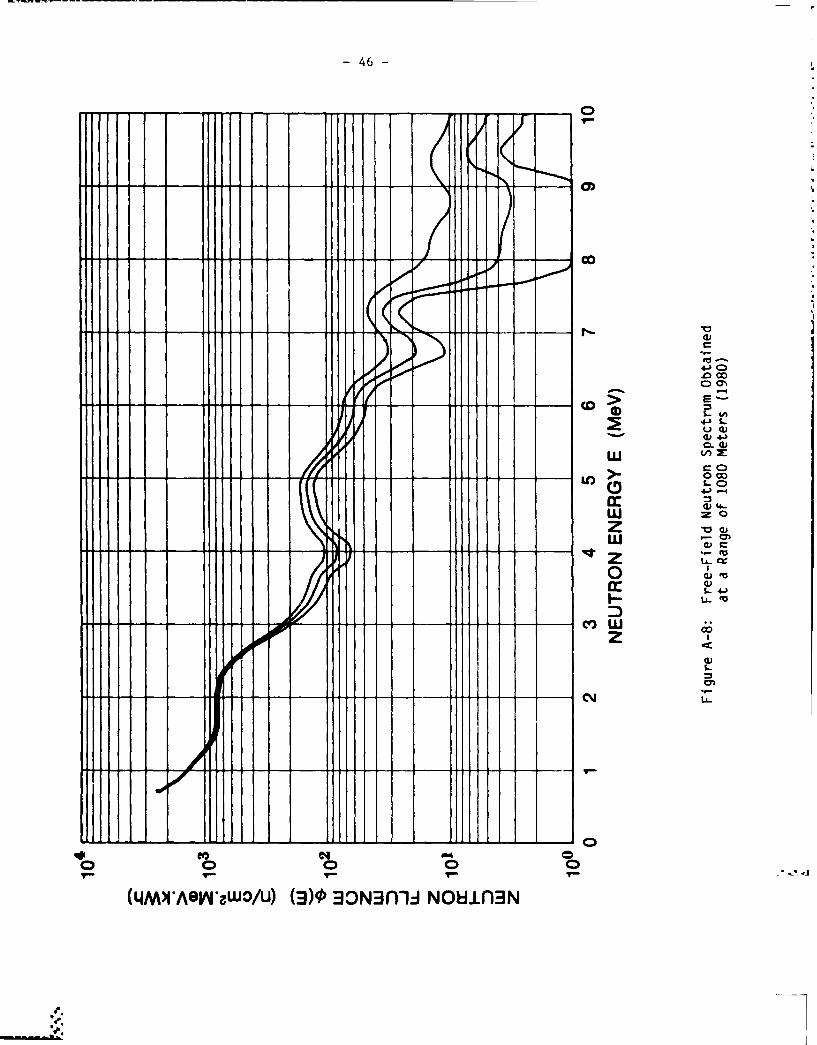
Figure A-8. Free-Field Neutron Spectrum at 1080 Meters (1980) ......... 46
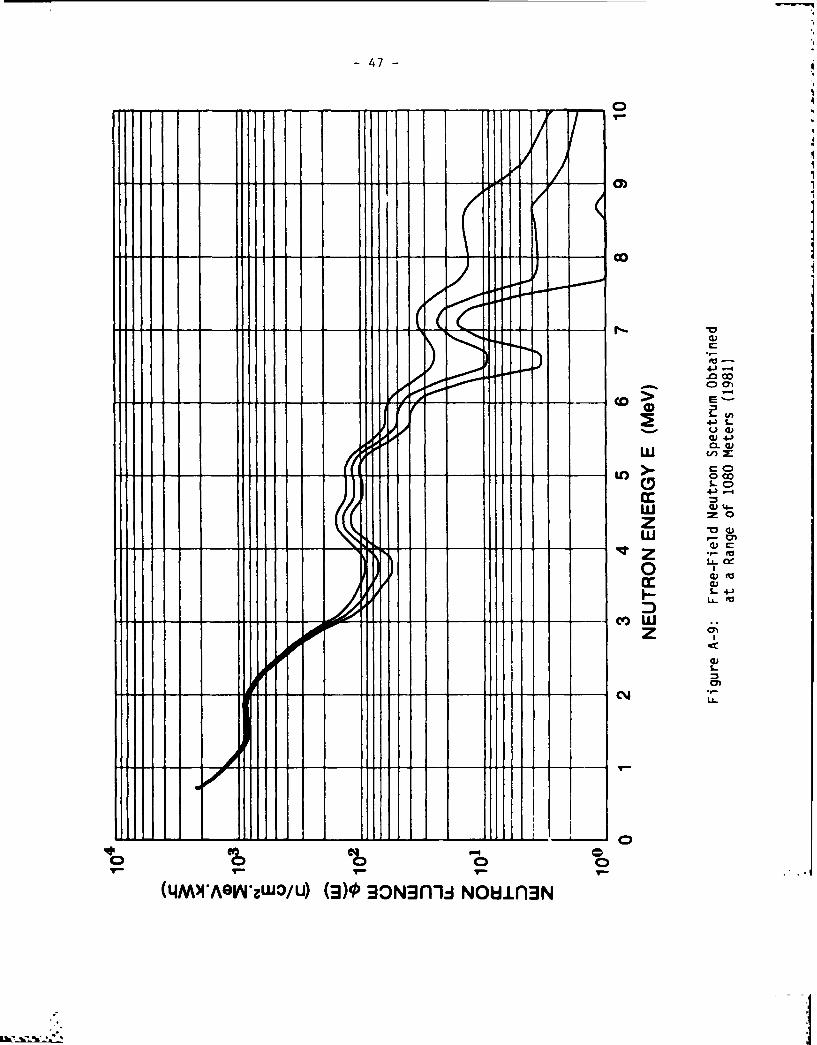
Figure A-9. Free-Field Neutron Spectrum at 1080 Meters (1981) ......... 47
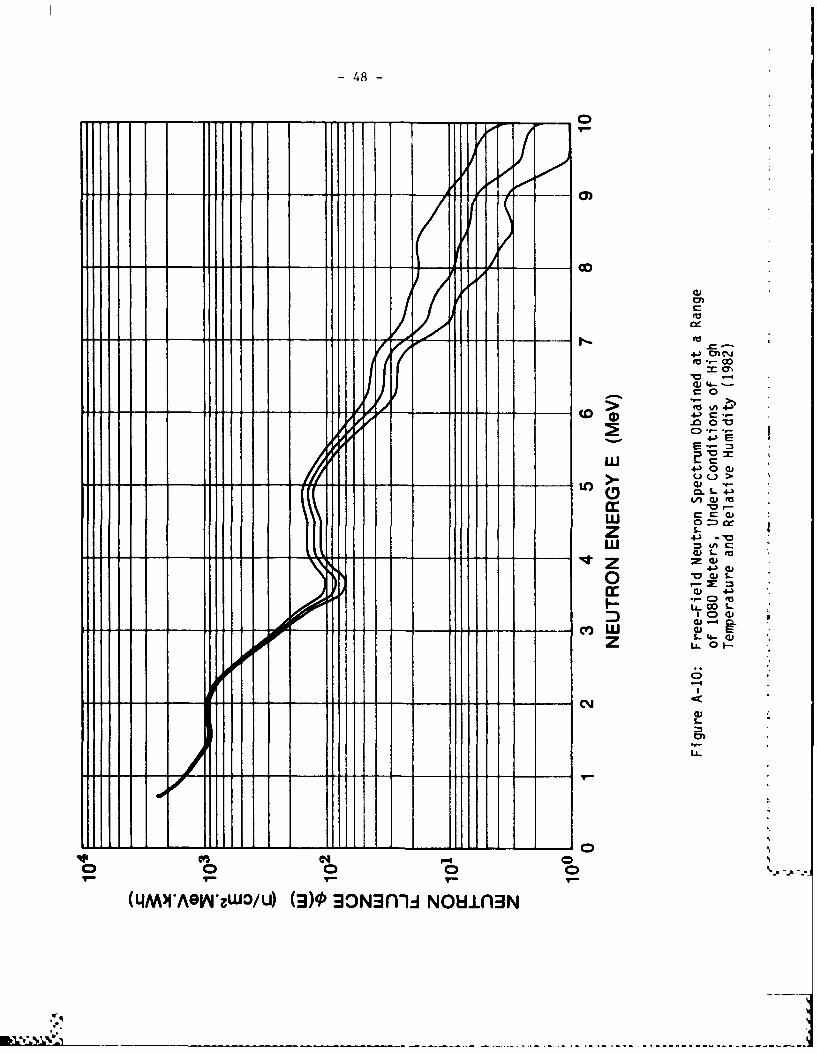
Figure A-10. Free-Field Neutron Spectrum at 1080 Meters, Under Conditionsof High Temperature and Relative Humidity (1982) ......... 48
Fics
Figure B-2. Free-Field Gamma-Ray Spectrum at 100 Meters (1980) ....... 51Figure B-3. Free-Field Gamma-Ray Spectrum at 170 Meters (1980) ....... 52
Figure B-4. Free-Field Gamma-Ray Spectrum at 179 Meters (1981)....... 53
Figure B-6. Free-Field Gamma-Ray Spectrum at 260 Meters (1981) ....... 54
Figure B-6. Free-Field Gamma-Ray Spectrum at 300 Meters (1980) ....... 55 6Figure 8-7. Free-Field Gamma-Ray Spectrum at 400 Meters (1980)........5.
Vii
.
LIST OF ILLUSTRATIONS - (Continued)
PAGE
S.,
Figure B-8. Free-Field Gamma-Ray Spectrum at 1080 Meters (1980) ...... 57
-i Figure B-9. Free-Field Gammna-Ray Spectrum at 1080 Meters (1981)....... 58
Figure B-10. Free-Field Gamma-Ray Spectrum at 1080 Meters, Under Conditionsof High Temperature and Relative Humidity (1982) ......... 59
Figure J-1. Neutron Spectrum Recorded by DREO One Meterfrom the APRD Cf2 52 Source .............................. 111
Figure J-2. Gamma-Ray Spectrum Recorded by DREO One Meterfrom the APRD Cf252 Source .............................. 112
Figure J-3. Cf252 Neutron Spectrum Recorded by DREO in 1978 ......... 114
Figure J-4. Comparison of DREO Measurement to SRL Calibrationof the Neutron Emission Rate (> 600 KeY) froma Californium-252 Source ............................. 115
"-'--4
VIN
LIST OF TABLES
PAGE
TABLE 1. Bonner-Sphere Counting-Rate Ratios ........................ 12
TABLE 2. Atmospheric Parameters During Measurements at 1080 Meters 13
TABLE C-1. Neutron Spectrum at 15m (1980) ............................ 64
TABLE C-2. Neutron Spectrum at 100m (1980) ......................... 64
TABLE C-3. Neutron Spectrum at 170m (1980) ......................... 65
LE C-4. Neutron Spectrum at 179m (1981) 65
TABLE C-5. Neutron Spectrum at 260m (1981) ......................... 66
TAE CTABLE C-5. Neutron Spectrum at 200m (1980) ......................... 66
TABLE C-8. Neutron Spectrum at 10m (1980) ......................... 67
TABLE C-9. Neutron Spectrum at 108m (1980) ......................... 67
TABLE C-8. Neutron Spectrum at 1080m (1980)........................6
TABLE C-9. Neutron Spectrum at 1080m (1981) ........................ 68
TABLE C-30. Neutron Spectrum at 108Gm (1982) ........................ 68
TABLE D-2. Ganma-Ray Spectrum at 109m (1981).......................7 1
TABLE D-5. Gamma-Ray Spectrum at 170m (1980) ....................... 71
TABLE D-6. Gamma-Ray Spectrum at 17m (1980) ......................... 72
TABLE D-7. Gamma-Ray Spectrum at 26Gm (1981) ........................ 72Ta-........................ 74TABLE D-6. Gamma-Ray Spectrum at 10Gm (1981) ........................ 74
TABLE D-7. Gamma-Ray Spectrum at 40Gm (1981) ........................ 73
TABLE D-8. GaNua-Ray Spectrum at 108 m (1980) ....................... 74
TABLE D-9. Ganuna-Ray Spectrum at 108Gm (1981)............74
~ TABLE 0-i0. Gammna-Ray Spectrum at 108Gm (1982)....................... 75
TABLE E-2. Neutron Spectrum at 10Gm (1980) ........................... 79
ix %
LIST OF TABLES- (Continued)
PAGE
TABLE E-3. Neutron Spectrum at 170m (1980) ........................... 79
TABLE E-4. Neutron Spectrum at 179m (1981) .......................... 80
TABLE E-5. Neutron Spectrum at 260m (1981) .......................... 80
TABLE E-6. Neutron Spectrum at 300m (1980) .......................... 80
TABLE E-7. Neutron Spectrum at 400m (1980) .......................... 81
TABLE E-8. Neutron Spectrum at 1080m (1980)......................... 81
TABLE E-1. Neutron Spectrum at 1080m (1981) ......................... 81
TABLE E-2. Neutron Spectrum at 1080m (1982) ......................... 82TABLE F-2. GaNua-Ray Spectrum at 10m (1980) ......................... 85
TABLE F-4. Gammna-Ray Spectrum at 179m (1980)........................ 85
TABLE F-5. Ganuma-Ray Spectrum at 260m (1981)........................ 85
TABLE F-6. Gamma-Ray Spectrum at 300m (1980) ........................ 86
TABLE F-7. Gamma-Ray Spectrum at 400m (1980) ........................ 86
TABLE F-8. Gamma-Ray Spectrum at 1080m (1980) ....................... 86
TABLE F-9. Gamma-Ray Spectrum at 1080m (1981) ........................ 86 ~TABLE F-10. Ganuna-Ray Spectrum at 1080m (1982)....................... 87 TABLE F-10. Gamma-Ray Spectrum at 1080m (1982) ........................ 87
TABLE G-1. Integral Quantities Determined Experimentally at APRF ..... 92
TABLE G-2. Average Integral Data Obtained Experimentally ............. 98
TABLE H-i. Calculated Integral Data Interpolatedat Experimental Points ................................. 101
TABLE H-2. Ratios of Calculated to Average Experimental Data ......... 102
TABLE I-i. Results of Elemental Analysis ofDREO Soil Sampling at APRF .............................. 106
TABLE 1-2 Absolute Elemental Concentrations ofAPRF Soil (atoms/barn-cm) . ................................. 107
'
1.0 INTRODUCTION
In 1978 measurements of the outdoor, free-field radiationenvironments surrounding the fast-critical facility operated by the U.S. Arnry Pulse Radiation Division (APRD) at the Aberdeen Proving Ground(Maryland, USA) were made by both APRD [1j and a German group,Wehrwissenschaftliche Dienststelle der Bundeswehr f(ir ABC-Schutz (WWD) [2].Neutron spectra were measured by both groups using NE-213 proton-recoilspectrometers at ranges of 100 m, 170 m and 300 m. Gamma-ray spectra weremeasured by WWD at the same ranges, also using an NE-213 scintillator. In addition, integral dosimetric measurements were performed by both groups,using a variety of tissue-equivalent ion-chambers, Geiger-M(.ller countersand sulphur activation (n,p).
In 1980 measurements of neutron and gamma-ray spectra at se sameranges were performed by personnel from the Defence Research Est; ,shment Ottawa (DREO). Additionally, similar measurements were obtained rangesof 400 m and 1080 m [3-51 . Measurement at the greater distance, madepossible by the provision of a self-contained mobile nuclear la atory,which rendered unnecessary the cabling of detector signals back to thereactor control building.
The measurements so obtained were compared to theoreticalcalculations performed by ORNL [6] to 500 meters and by DREO [31 to 1600meters. Both of these calculations were somewhat deficient - in the ORNLcase due to the limited ground range and in the DREO case by a coarsespatial and angular mesh and the use of a "dry-air" approximation. Nevertheless, it was thus concluded that the calculations predicted integralkermas (both neutron and gamma-ray) reasonably accurately but in generalboth neutron and gamma-ray spectra were somewhat softer than observedexperimentally. Above an energy of 3 MeV neutron fluence was underpredicted by about 30%, but below 2 MeV overpredicted by some 10 to 40%.Surprisingly, these differences were most pronounced at the intermediateranges of 300 and 400 meters, and least pronounced at the farthest range of1080 meters.
Agreement amongst the three experimental groups was shown to beexcellent in the case of integral quantities but with some differencesapparent in spectroscopy, particularly above 6 MeV and below 1 MeV in thecase of gamma-rays and below 2 MeV in the case of neutrons.
In 1981 re-measurement of neutron and gamma-ray spectra at 1080meters was made by DREO at a similar time of the year and under almostidentical weather conditions, to verify the reproducibility of the single1980 data-point. The following year (1982) measurement was again made byDREO at this position during the summer months, under conditions of _ significantly higher temperature and atmospheric humidity both to investigate the influence of these parameters on radiation transmission and -'to provide better comparative data of interest to those involved in theretrospective calculation of dosimetry at Hiroshima and Nagasaki [7].
The 1981 neutron measurements were complemented by new APRD Bonner- sphere determinations, both at 170 meters and coincidentally with DREO at1080 meters [8]. In 1982 coincidental measurement with DREO was again madeat the 1080-meter position [9]. During the same experimental series APRD
-2-
ion-chamber and Geiger-Muller dosimetry was performed at 1618 meters [10and shortly thereafter Bonner-sphere determinations made at this samedistance [11].I0
Three new theoretical calculations of the APRD radiation environmentsalso became available during 1982, determined by groups at LawrenceLivermore National Laboratory (LLNL) [12], Science Applications Incorporated(SAI) [131 and Los Alamos National Laboratory (LANL) [14]. These generallyprovide ouch better reproduction of experimental measurement than previouscalculations, however spectral discrepancies continue to exist below a neutron energy of 2 MeV.
In this report a description of the recent spectroscopy and dosimetrywill be presented, along with a comprehensive compilation of all previousdosimetric measurements and DREO-measured spectra. Improvements in theaccuracy of important experimental parameters will be discussed, in particular relating to distance measurement, soil composition, atmosphericcharacterization and neutron source anisotropy and normalization. Finallythe adequacy of the recent theoretical calculations in reproducingexperimental measurement will be examined.
2.0 EXPERIMENT
2.1 Geometry
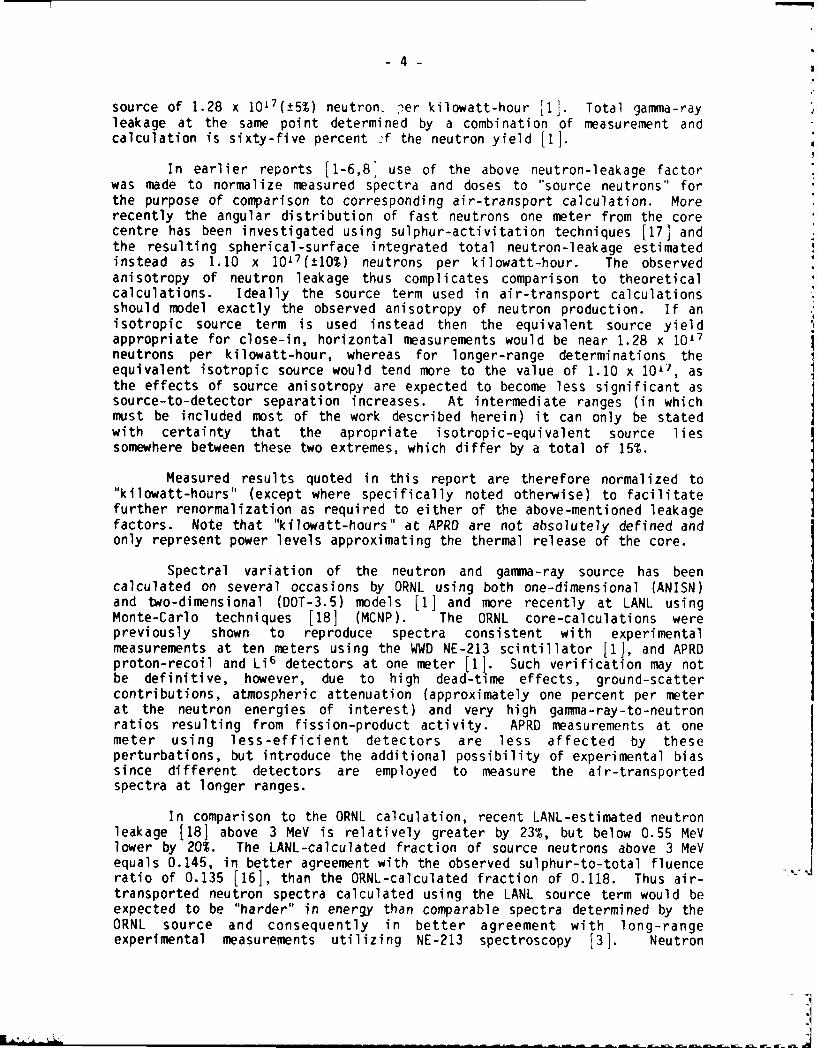
The APRD critical facility normally resides inside a low-massaluminum weather-protecting silo. For the purpose of free-fieldmeasurements the core may be remotely removed from the silo and positionedat a height above ground of fourteen meters [1]. Detectors are normallypositioned at any of five reproducible distances: 100, 170, 300, 400 and1080 meters, established by laser-range finding equipment. (In earlierreports [3-5] the estimate of ground range to the farthest position wasquoted as 1100 meters, resulting from less accurate estimation by aerialphotography.)
Terrain surrounding the reactor is clear of growth to approximately200 meters, and then fairly densely forested beyond (Figure I).Measurements at 300 and 400 meters were made along the centerline of atwenty-meter wide path cleared to a distance of 450 meters into the forestedarea. At 1080 meters a small hill of approximate height of 15 meters enabled measurements just above the forest cover. In all cases thedetectors were maintained at a height of two meters above the air-groundinterface.
2.2 Radiation Source
The APRD fast-pulse facility consists of a compact core of enriched-uranium fuel in the form of a right-circular cylinder [15], similar indesign to the Health Physics Research Reactor (HPRR) at the Oak RidgeNational Laboratory (ORNL). Steady-state operation for extended periods ispossible to a maximum power level of six kilowatts (nominal), as monitoredby various fission-chambers [16]. Total neutron leakage above an energy of100 eV, measured using calibrated fission-chambers horizontally at adistance of one meter from the core centre, is equivalent to an isotropic
-3-
c0
a-.4-)EuLi o .a~J
1-0
4..)
Li
o
-vCEu
*.- C
a-
a-4
a) L
cab
1k
fg
-- '
-4-
source of 1.28 x 10¹⁷(±5%) neutron. ?er kilowatt-hour [1]. Total gamma-rayleakage at the same point determined by a combination of measurement andcalculation is sixty-five percent -f the neutron yield [I].
In earlier reports [1-6,8] use of the above neutron-leakage factorwas made to normalize measured spectra and doses to "source neutrons" forthe purpose of comparison to corresponding air-transport calculation. Morerecently the angular distribution of fast neutrons one meter from the corecentre has been investigated using sulphur-activitation techniques [17] andthe resulting spherical-surface integrated total neutron-leakage estimated instead as 1.10 x 10¹⁷(±10%) neutrons per kilowatt-hour. The observedanisotropy of neutron leakage thus complicates comparison to theoreticalcalculations. Ideally the source term used in air-transport calculationsshould model exactly the observed anisotropy of neutron production. If anisotropic source term is used instead then the equivalent source yieldappropriate for close-in, horizontal measurements would be near 1.28 x 10¹⁷neutrons per kilowatt-hour, whereas for longer-range determinations theequivalent isotropic source would tend more to the value of 1.10 x 101 7, asthe effects of source anisotropy are expected to become less significant assource-to-detector separation increases. At intermediate ranges (in whichmust be included most of the work described herein) it can only be statedwith certainty that the apropriate isotropic-equivalent source liessomewhere between these two extremes, which differ by a total of 15%.
Measured results quoted in this report are therefore normalized to"kilowatt-hours" (except where specifically noted otherwise) to facilitate further renormalization as required to either of the above-mentioned leakagefactors. Note that "kilowatt-hours" at APRO are not absolutely defined andonly represent power levels approximating the thermal release of the core.
Spectral variation of the neutron and gamma-ray source has beencalculated on several occasions by ORNL using both one-dimensional (ANISN)and two-dimensional (DOT-3.5) models [1] and more recently at LANL usingMonte-Carlo techniques [18] (MCNP). The ORNL core-calculations werepreviously shown to reproduce spectra consistent with experimentalmeasurements at ten meters using the WWD NE-213 scintillator [1], and APRDproton-recoil and Li6 detectors at one meter [1]. Such verification may notbe definitive, however, due to high dead-time effects, ground-scattercontributions, atmospheric attenuation (approximately one percent per meterat the neutron energies of interest) and very high gamma-ray-to-neutronratios resulting from fission-product activity. APRD measurements at onemeter using less-efficient detectors are less affected by these
perturbations, but introduce the additional possibility of experimental biassince different detectors are employed to measure the air-transportedspectra at longer ranges.
In comparison to the ORNL calculation, recent LANL-estimated neutronleakage [18] above 3 MeV is relatively greater by 23%, but below 0.55 MeVSlower by 20%. The LANL-calculated fraction of source neutrons above 3 MeVequals 0.145, in better agreement with the observed sulphur-to-total fluence ratio of 0.135 [16], than the ORNL-calculated fraction of 0.118. Thus air-transported neutron spectra calculated using the LANL source term would beexpected to be "harder" in energy than comparable spectra determined by theORNL source and consequently in better agreement with long-range experimental measurements utilizing NE-213 spectroscopy [3]. Neutron
1-
L
-5-
fluence above 3 MeV as determined both by NE-213 spectroscopy and sulphuractivation has been traditionally undercalculated in the past when the ORNLsource term is employed [3-6]. The extent (20-30%) and direction of theseunderpredictions (above 3 MeV) are such that they would be essentially resolved by the newer LANL source term. The differences in corecalculations are possibly due to the use by LANL of more-recent basicfission-process data [19].
At the present time insufficient experimental data obtained at shortranges are available to support either core calculation in a definitive manner. Further measurements are indicated, preferably using the samespectroscopy systems as used for determinations at greater distances. Suchmeasurements should include shadow-bar background measurements to excludethe ground-return component, and be performed at several source-to-detectorseparations to establish energy-dependent air transmission losses. As aresult of the known anisotropy of particle leakage from the core, measurements should be repeated at a representative number of polar anglesto determine the extent of energy-angle coupling. Dead-time losses shouldbe minimized by performing such measurements after a substantial core-cooling period.
2.3 Detectors
Neutron and gamma-ray spectra at APRO have been variously obtained byAPRD, WWD and DREO using NE-213 liquid organic scintillators, followed bynumerical unfolding of observed recoil-proton and recoil-electrondistributions. Both WWD and APRD used a cylindrical scintillator of 2"height and 2" diameter and analysed observed data using the FERDOR code [20]. Neutron unfolding employed Verbinski's response matrix [21],renormalized by up to 26% below 2 MeV in order to better reproduceCalifornium-252 neutron spectra [22] according to the accepted shape.Gamma-ray unfolding is accomplished by WWD using the response matrix ofLurie, et al [23].
DREO uses a slightly smaller scintillator of 1 3/4" height by 2"diameter (to render more isotropic the response to incident neutrons) and adifferent unfolding technique [24]. The neutron response data were .calculated at DREO [251 specifically for this scintillator using the samecode as employed by Verbinski [26]. Garrua-ray response data were adoptedfrom Lurie's calculation [23].
In typical APRD radiation environments NE-213 detectors account foressentially all of the incident gamma-ray kerma since the detectionthreshold is quite low (300 KeV), however a significant fraction(approximately 35%) of the neutron kerma falls below the neutron thresholdof 600 KeV, and is hence unaccounted for. To provide additional integral data below 600 KeV DREG uses a pair of boron-triflouride counters (onecadmium-covered) and fits a parametric relation (of the form AEP) to themeasured data, assuming piecewise spectral continuity at 600 KeV with theNE-213 determination [3]. Integral quantities are subsequently estimated byfolding the parametric relation against appropriate energy-dependentfluence-to-kerma (or dose) response functions, as required. (See Appendix Cfor further details).
-6-
Fluence and kerma data have also been obtained (primarily by APRO)using various integral counters of up to sixteen litres in volume 1,4,10 ]
Total kerma is measured using tissue-equivalent ionization chambers, fromwhich may be subtracted gamma-ray kerma measured by Geiger-MUller countersto predict neutron-only kerma. DREO has also on occassion employedmicrodosimetric techniques in which the deposition of energy to a very smallvolume of tissue-equivalent gas is measured as a function of LET (linearenergy transfer), enabling the separate estimation of gamma-ray (low LET)and neutron (high LET) kermas.
Measurement of neutron fluence above 3 MeV is routinely performed byAPRD using activation of sulphur to phosphorus-32 through the (n,p)reaction, with calibration against Californium-252 neutrons [16]. Morerecently, Bonner-sphere neutron determinations have been initiated by APRD[8,91. In this technique the spectral variation of neutron detectionefficiency of a small lithium-6 iodide scintillator is successively modifiedby surrounding it with polyethylene spheres of different diameters.Although always sensitive to some extent to neutrons of all energies, theaddition of polyethylene shifts the peak response of the scintillator fromthermal energies (0.025 eV) gradually through to near 10 MeV when thelargest sphere (12" diameter) is used. The eight counting-rates so measuredmay be used either to obtain a low-resolution estimate of the neutronspectrum by unfolding, or alternatively to measure the consistency withneutron spectra obtained by other methods by folding the a-priori neutronspectra against known Bonner response functions, then comparing bothcalculated and observed counting rates [8].
In spite of the large number of techniques that have been applied tomeasure integral quantities at APRD, a very high degree of experimentalconsistency is apparent - suprisingly so when consideration is made of thefact that very few share common detector calibrations. (See Appendix G fora listing of all reported integral measurements at APRD.)
2.4 Soil Composition
Physical and chemical attributes of APRD soils have been determinedAPRD and WWD in March of 1978 [1,21 and by DREO in July of 1982 (Appendix
I). Reported density has varied from 1.5 to 2.1 grams per cubic centimeterand soil moisture content from 12 to 40 weight-percent. Reported elementalcomposition also varies widely, although this is probably due more to thevagaries of chemical analysis than variation in the soil itself. Appendix Ilists all reported soil composition for APRD, including recent DREOanalyses.
3.0 EXPERIMENTAL RESULTS
3.1 Review of 1980 Spectrometry
By the end of 1980 three separate groups had made free-field spectralmeasurements, namely APRD, WWD and DREO. For the three ranges ofcommonality (100, 170 and 300 meters) neutron and gamma-ray spectraldeterminations are shown by way of comparison in Figures 2 through 7.Normalization in all cases is per source neutron, employing the then-current
.fjLtA
-7-
1S~~- -DREO
Cd *...~ ---APRD'E .... --- WWD
! %41I
z
4.12 6
NEUTRON ENERGY, En (M#V)
Figure 2 -Measured Neutron Spectra at a Ground Range of 100 Meters
-DREO
* '6 ---APRO-- WWD
wC
z
4 NEUTRON ENERGY, En (M*V)
1..Figure 3 -Measured Neutron Spectra at a Ground Range of 170 Meters
-8-
if-is--DREO
C iO- 1-I_1
NEUTRON ENERGY, En (MOV)
Figure 4 -Measured Neutron Spectra at a Ground Range of 300 Meters
IE-DREO--- WWD
~169
0 2 468iPPHOTON ENERGY, E y (MOV)
Figure 5 -Measured Gamma-Ray Spectra at a Ground Range of 100 Meters
-9-
-DREO
--- WWD
Nb
a 4
PHTO ENRYzE M
-J.
ape
S84 6 8 is
PHOTON ENERGY, Er (MV)
Figure 7 Measured Gamma-Ray Spectra at a Ground Range of 170 Meters
'C'- .% __ _ _ _ _ _ __o_ _ _ _ _ _ _
10..
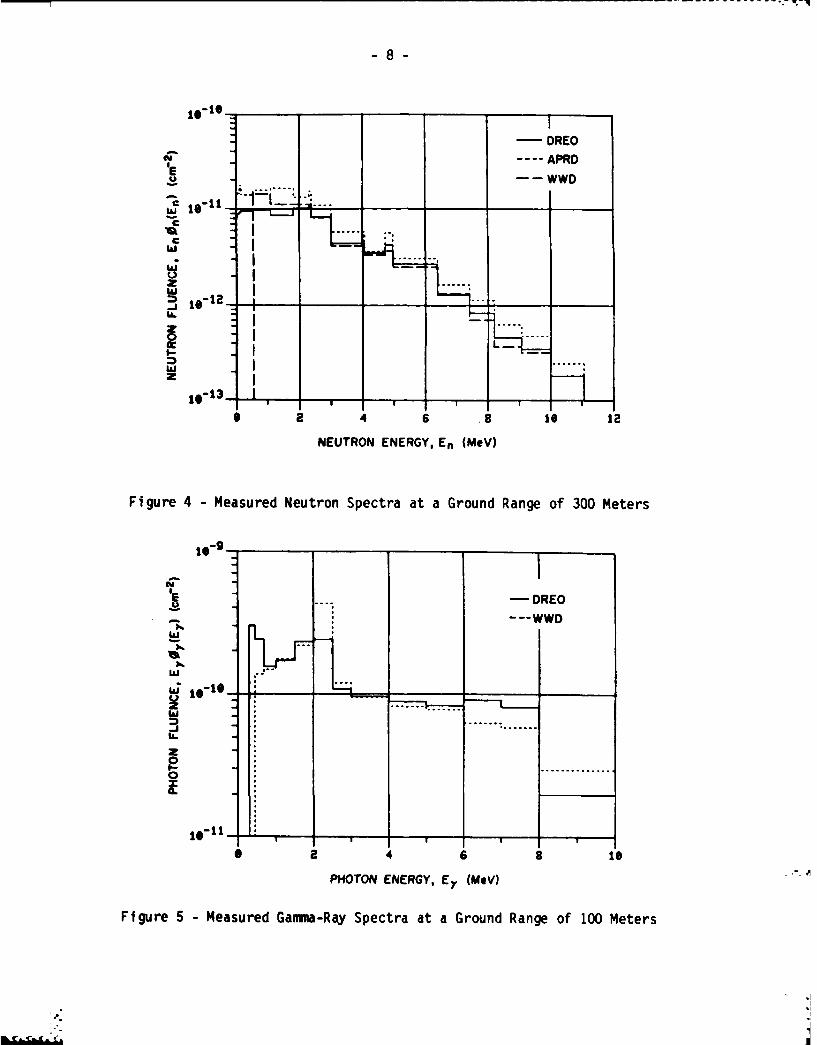
source yield of 1.28 x i01 7 neutrons per kilowatt-hour. (Results of theadditional DREO measurements at 15, 400 and 1080 meters may be found inAppendices A through F, as part of a comprehensive reporting of DREOmeasurements to date.)
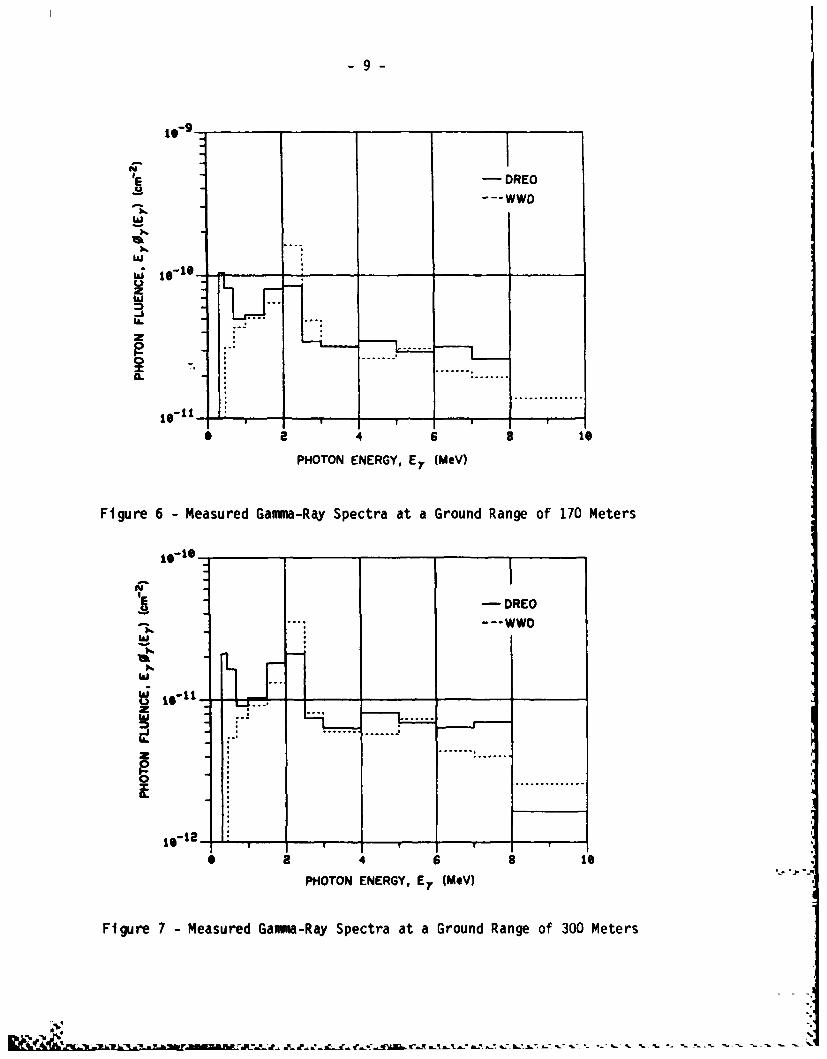
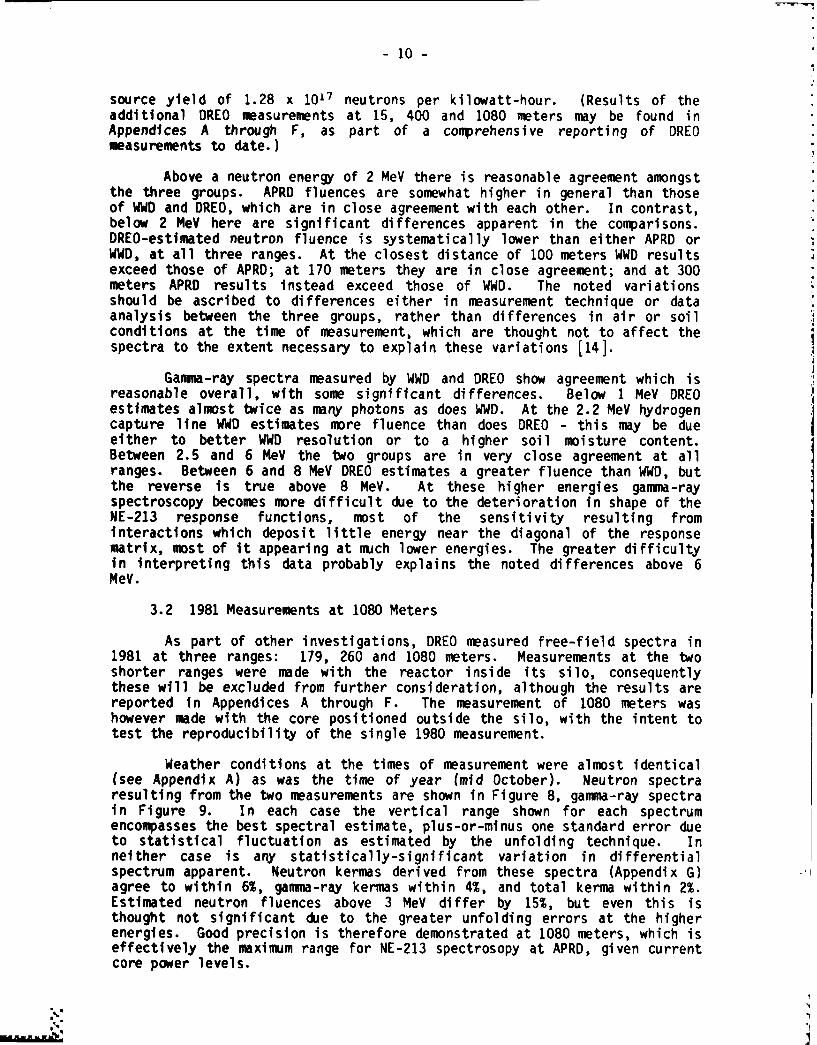
Above a neutron energy of 2 MeV there is reasonable agreement amongstthe three groups. APRO fluences are somewhat higher in general than thoseof WWD and DREO, which are in close agreement with each other. In contrast,below 2 MeV here are significant differences apparent in the comparisons.DREO-estimated neutron fluence is systematically lower than either APRD orWWD, at all three ranges. At the closest distance of 100 meters WWD resultsexceed those of APRD; at 170 meters they are in close agreement; and at 300meters APRD results instead exceed those of WWD. The noted variationsshould be ascribed to differences either in measurement technique or dataanalysis between the three groups, rather than differences in air or soilconditions at the time of measurement, which are thought not to affect thespectra to the extent necessary to explain these variations [14].
Gamma-ray spectra measured by WWD and DREO show agreement which isreasonable overall, with some significant differences. Below 1 MeV DREOestimates almost twice as many photons as does WWD. At the 2.2 MeV hydrogencapture line WWD estimates more fluence than does DREO - this may be dueeither to better WWD resolution or to a higher soil moisture content.Between 2.5 and 6 MeV the two groups are in very close agreement at allIranges. Between 6 and 8 MeV DREO estimates a greater fluence than WWD, butthe reverse is true above 8 MeV. At these higher energies gamma-rayspectroscopy becomes more difficult due to the deterioration in shape of theNE-213 response functions, most of the sensitivity resulting frominteractions which deposit little energy near the diagonal of the responsematrix, most of it appearing at much lower energies. The greater difficultyin interpreting this data probably explains the noted differences above 6MeV.
3.2 1981 Measurements at 1080 Meters
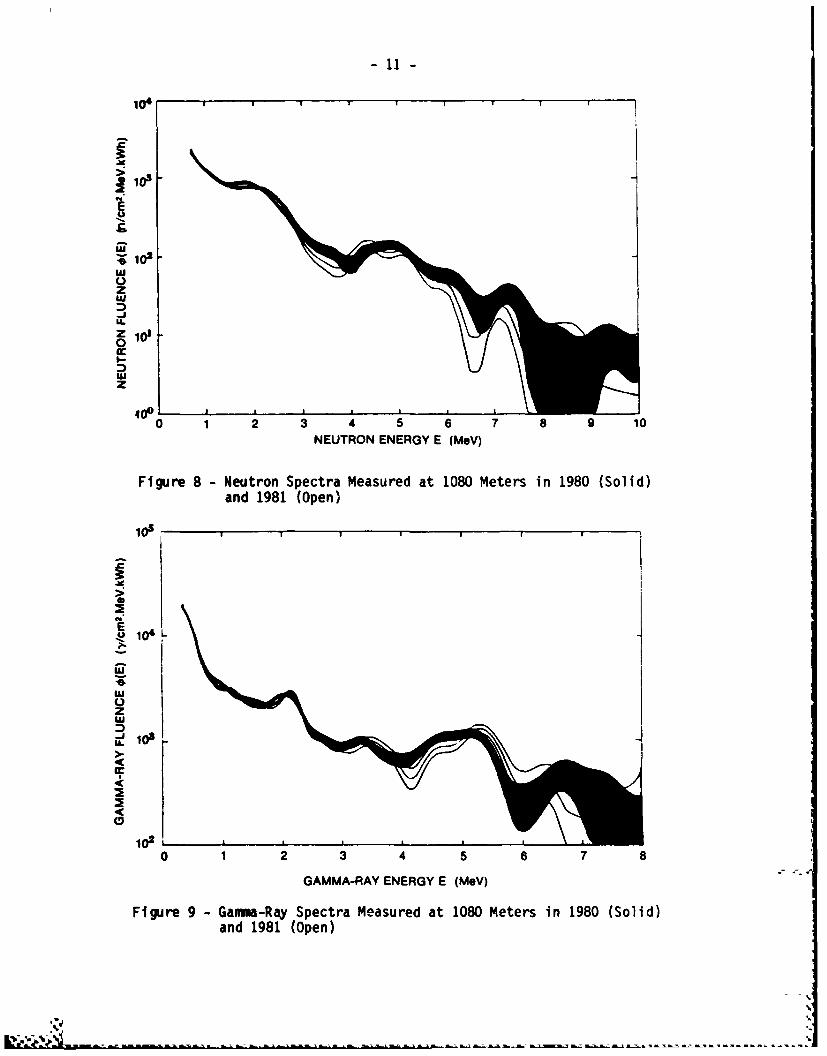
As part of other investigations, DREO measured free-field spectra in1981 at three ranges: 179, 260 and 1080 meters. Measurements at the twoshorter ranges were made with the reactor inside its silo, consequentlythese will be excluded from further consideration, although the results arereported in Appendices A through F. The measurement of 1080 meters washowever made with the core positioned outside the silo, with the intent totest the reproducibility of the single 1980 measurement.
Weather conditions at the times of measurement were almost identical(see Appendix A) as was the time of year (mid October). Neutron spectraresulting from the two measurements are shown in Figure 8, gamma-ray spectrain Figure 9. In each case the vertical range shown for each spectrumencompasses the best spectral estimate, plus-or-minus one standard error due
to statistical fluctuation as estimated by the unfolding technique. Inneither case is any statistically-significant variation in differentialspectrum apparent. Neutron kermas derived from these spectra (Appendix G)agree to within 6%, gamma-ray kermas within 4%, and total kerma within 2%.Estimated neutron fluences above 3 MeV differ by 15%, but even this isthought not significant due to the greater unfolding errors at the higherenergies. Good precision is therefore demonstrated at 1080 meters, which iseffectively the maximum range for NE-213 spectrosopy at APRD, given currentcore power levels.
13
00
0
100
z
w
,()2
0z 2 3 o5lGAM-A0NEG MV
Fiur 9wam-a pcr esrda 00Mtr n18 Sld
anz91(pn
-12-
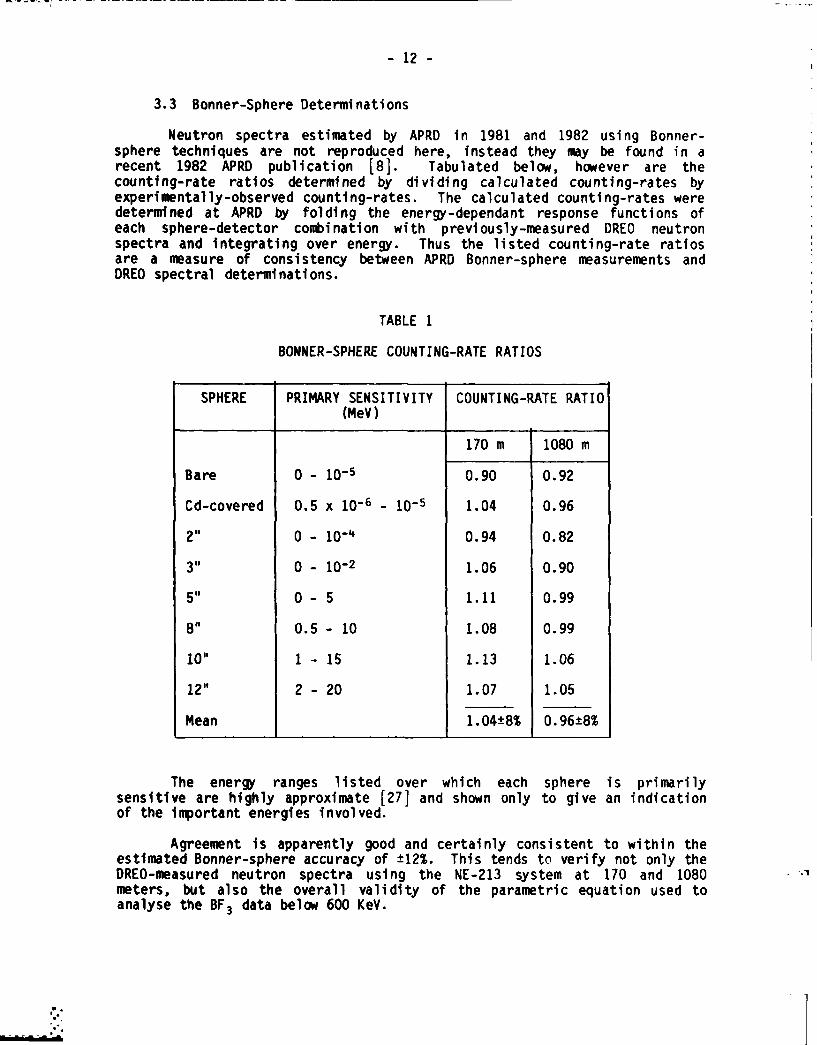
3.3 Bonner-Sphere Determinations
Neutron spectra estimated by APRD in 1981 and 1982 using Bonner-sphere techniques are not reproduced here, instead they may be found in arecent 1982 APRD publication [8]. Tabulated below, however are thecounting-rate ratios determined by dividing calculated counting-rates byexperimentally-observed counting-rates. The calculated counting-rates weredetermined at APRD by folding the energy-dependant response functions ofeach sphere-detector combination with previously-measured DREO neutronspectra and integrating over energy. Thus the listed counting-rate ratiosare a measure of consistency between APRD Bonner-sphere measurements andDREO spectral determinations.
TABLE 1
BONNER-SPHERE COUNTING-RATE RATIOS
SPHERE PRIMARY SENSITIVITY COUNTING-RATE RATIO(MeV)
170 m 1080 m
Bare 0 - 10- 0.90 0.92Cd-covered 0.5 x i - - I0 - 1.04 0.96
2" 0 - 10-4 0.94 0.82
311 0 - 10- 2 1.06 0.90
5" 0 - 5 1.11 0.99-- 8"
8" 0.5 - 10 1.08 0.99
10" 1 - 15 1.13 1.06
12" 2 - 20 1.07 1.05
Mean 1.04±8% 0.96±8%
The energy ranges listed over which each sphere is primarilysensitive are highly approximate [27] and shown only to give an indicationof the important energies involved.
Agreement is apparently good and certainly consistent to within theestimated Bonner-sphere accuracy of ±12%. This tends to verify not only theDREO-measured neutron spectra using the NE-213 system at 170 and 1080
74 meters, but also the overall validity of the parametric equation used toanalyse the BF3 data below 600 KeV.
% %
13
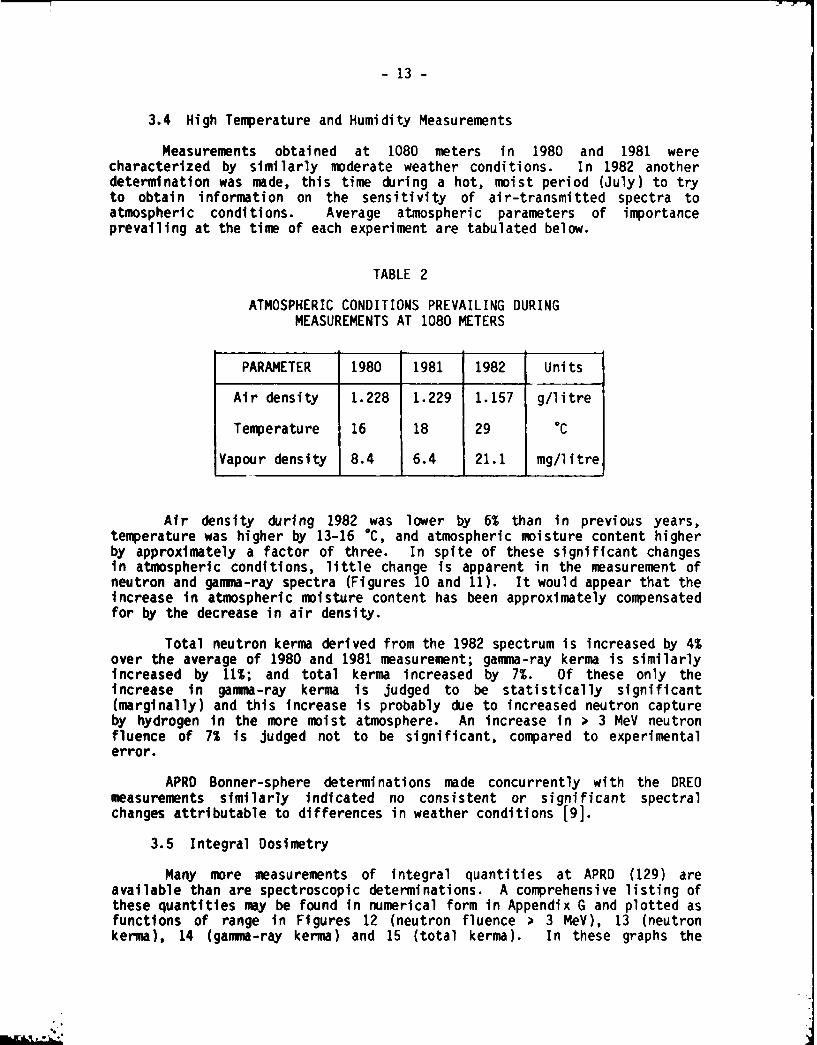
3.4 High Temperature and Humidity Measurements
Measurements obtained at 1080 meters in 1980 and 1981 were characterized by similarly moderate weather conditions. In 1982 anotherdetermination was made, this time during a hot, moist period (July) to tryto obtain information on the sensitivity of air-transmitted spectra toatmospheric conditions. Average atmospheric parameters of importanceprevailing at the time of each experiment are tabulated below.
TABLE 2ATMOSPHERIC CONDITIONS PREVAILING DURING
MEASUREMENTS AT 1080 METERS
PARAMETER 1980 1981 1982 Units
Air density 1.228 1.229 1.157 g/litre
Temperature 16 18 29 0C
Vapour density 8.4 6.4 21.1 mg/litre
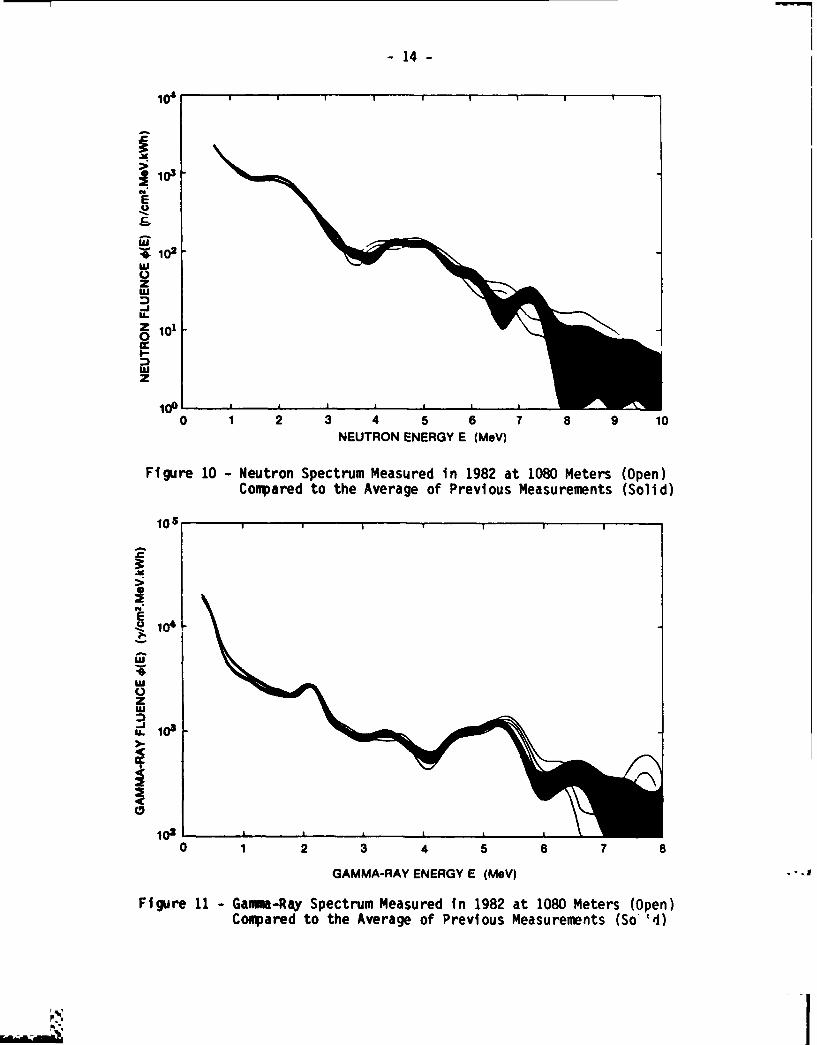
Air density during 1982 was lower by 6% than in previous years,temperature was higher by 13-16 "C, and atmospheric moisture content higherby approximately a factor of three. In spite of these significant changesin atmospheric conditions, little change is apparent in the measurement ofneutron and gamma-ray spectra (Figures 10 and 11). It would appear that theincrease in atmospheric moisture content has been approximately compensatedfor by the decrease in air density.
over Total neutron kerma derived from the 1982 spectrum is increased by 4%over the average of 1980 and 1981 measurement; gamma-ray kerma is similarlyincreased by 11%; and total kerma increased by 7%. Of these only theincrease in gamma-ray kerma is judged to be statistically significant(marginally) and this increase is probably due to increased neutron captureby hydrogen in the more moist atmosphere. An increase in > 3 MeV neutronfluence of 7% is Judged not to be significant, compared to experimental
error.
APRD Bonner-sphere determinations made concurrently with the DREO measurements similarly indicated no consistent or significant spectral changes attributable to differences in weather conditions [9].
3.5 Integral Dosimetry
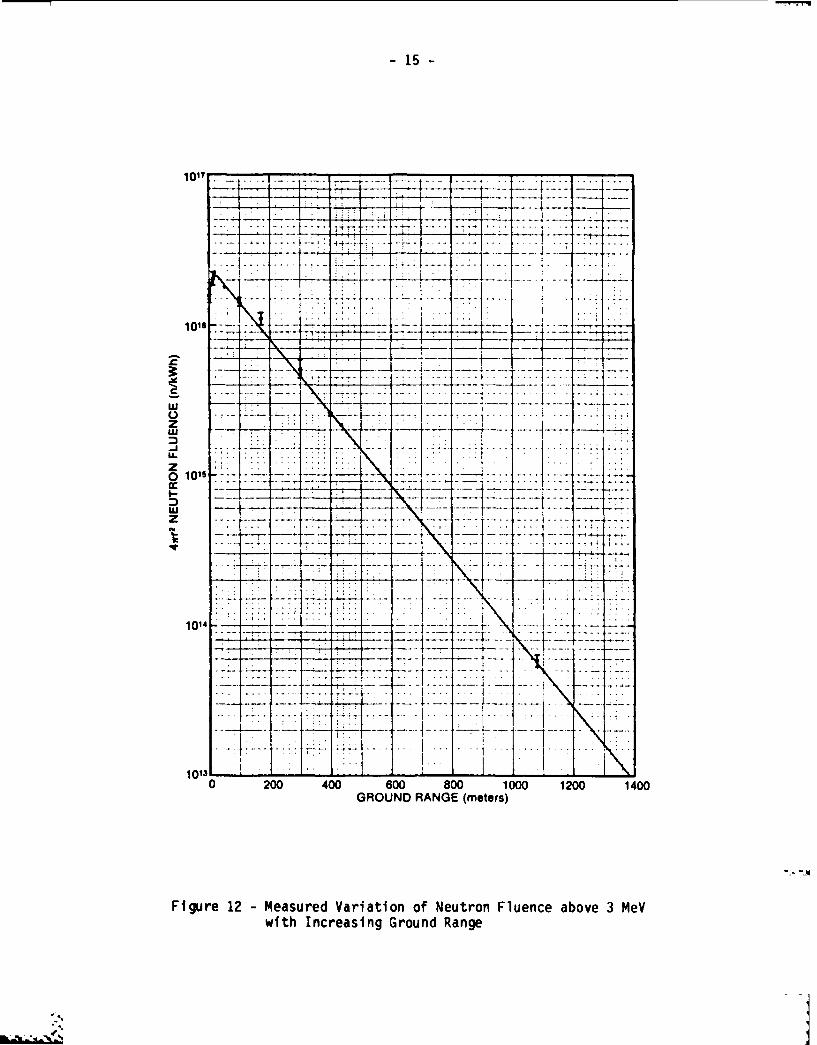
Many more measurements of integral quantities at APRD (129) areavailable than are spectroscopic determinations. A comprehensive listing of 0these quantities may be found in numerical form in Appendix G and plotted as functions of range in Figures 12 (neutron fluence > 3 MeV), 13 (neutronkerma), 14 (gamma-ray kerma) and 15 (total kerma). In these graphs the
.....
-14-
1 ~' I I II I
100
4 Uj
z 10,
z
4 1000 1 2 3 4 5 6 7 8 9 10
NEUTRON ENERGY E (MeV)
Figure 10 - Neutron Spectrum Measured in 1982 at 1080 Meters (Open)%.0 Compared to the Average of Previous Measurements (Solid)
1041
'I.7
z
U. 103 tO
0 1 2 3 4 5 6 7 8GAMMA-RAY ENERGY E (MeV)
Figure 11 -Gamma-Ray Spectrum Measured in 1982 at 1080 Meters (Open)Compared to the Average of Previous Measurements (So''d)
.. .1017
-15-
. -12L2i L2-t L- 21L: ..... .. . ... .
:::.:::. ., .. . .=. . . . 10
,, -- 77
101- -7-.m
- - - t-o- *--
z: . ..
l+
LU
Uj
... .. I .... ' '. ... :- : -: - "
- .-. ---77 77-I]
U.,
10134 -
- 7-
0 200 400 600 800 1000 1200 1400GROUND RANGE (meters)
Figure 12 -Measured Variation of Neutron Fluence above 3 MeVwith Increasing Ground Range ~~%
.~ S ~.. . . . . . . . . .
.,
-16-
..f . . . ... ...
-77' -7I
106_ _
-- ~-r-. IL
0.. 20 40 00 80 10 100 140. 60.10-- 1-.....D.......(meters)- ... Y. - 77.47t-oo
Fiur 13 Maue6aito fNurnTsu-emwith InraigGon Rne
- 17 -
-V..
100
* 106 ~ -. ~ -. - -.
..... .... . ... ......_ .: . ... . . . . .. + . .. .. ..
;i7 7 7-97- --- - 7-7- - -- 7 7-j
7--- t' --. .. . . . .
:..L...- ,
i - ,.. . .
wt.. h.. .....I---as.n..G--
. . .-_ . . .- . .. . . V.T .. .:.. . .... .. : . 7 9- --- .-- . .
... -+ :... ...+ i- +-., ! i 11:-. -li -,-.
200 40 6 0 00 10 0 20 140 1600 GR U D R N E ( ees<. ., , - ! : +-! ! : -+ !.
a
.. .. . .. . .. .. . .. ........................ .............. ....-.-.......... . .--.. '.. . .+... .~
+++ +++ + _ ,,+., .- ++- ++ ++; ... .... ,+
-18-
-l.-t --,• .-- - ,- - - - - . -o• .--. •.°,.•
1:°.z zp". 7 -i
100
, .. .... ..
- 7 - - -=.. .... ..-. .. . .n. . .... . . . .. . . . . .
1 - -. .... ."
uT T -... .. ... .... ._ 21 L
0 .... ..
106
---- ----. -
-"..... .. . . .. . . . .
. I
10s -L- I_ '--I
0 200 400 600 800 1000 1200 1400 1600 1800GROUND RANGE (meters)
Figure 15 Measured Variation of Total Tissue-Kermawith Increasing Ground Range
-.. . . . , . - ,.. -: -': ,: -. -': .; : -: .,. ,: -" .: , ,: -' .'- : ..: .: ,: , : .: ,: -: .: .: .:
Jl
- 19 -
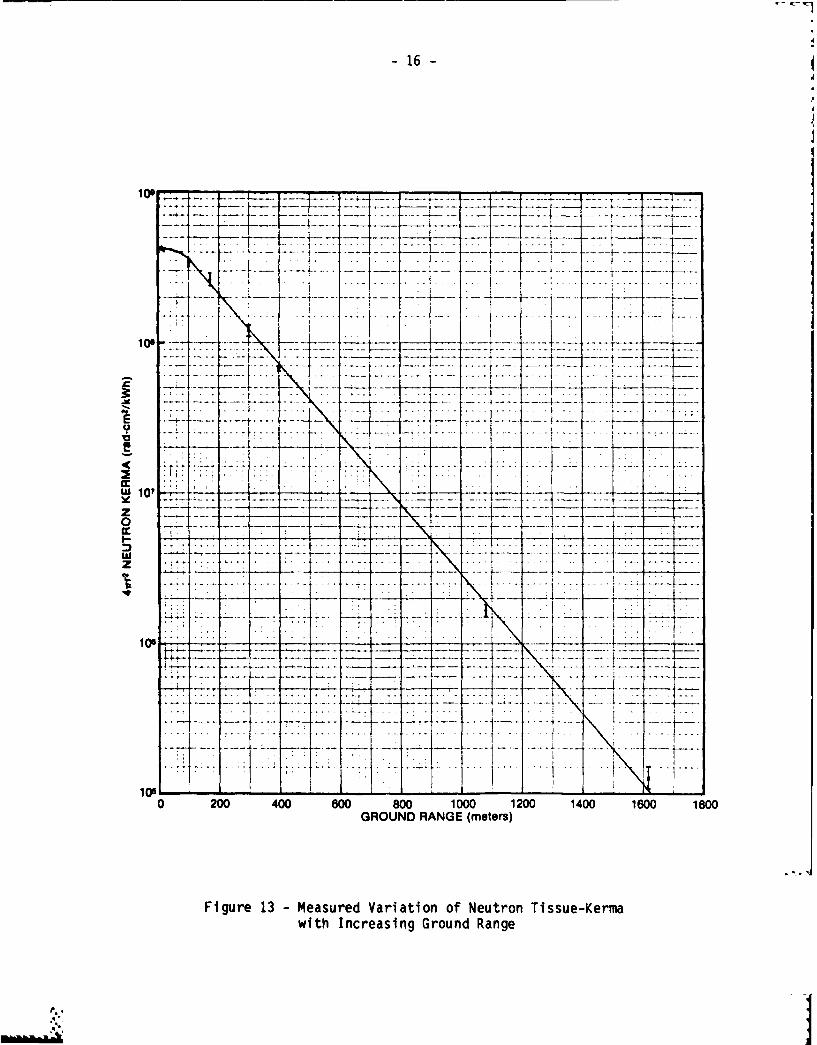
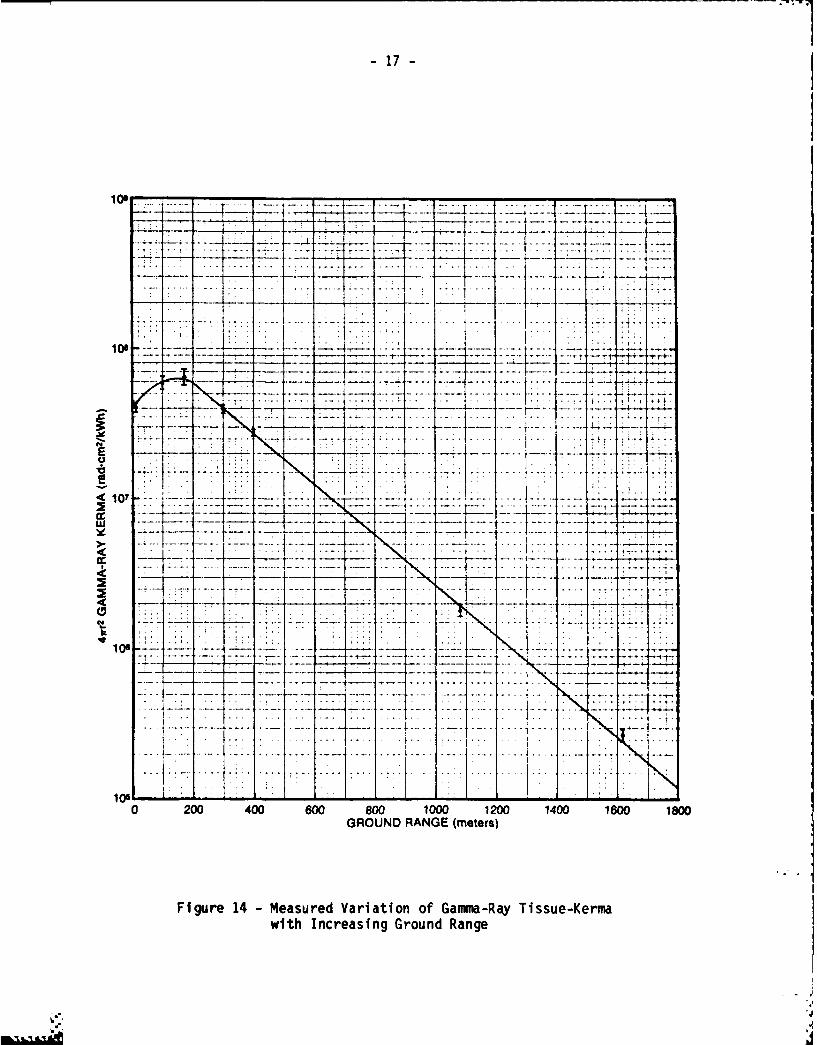
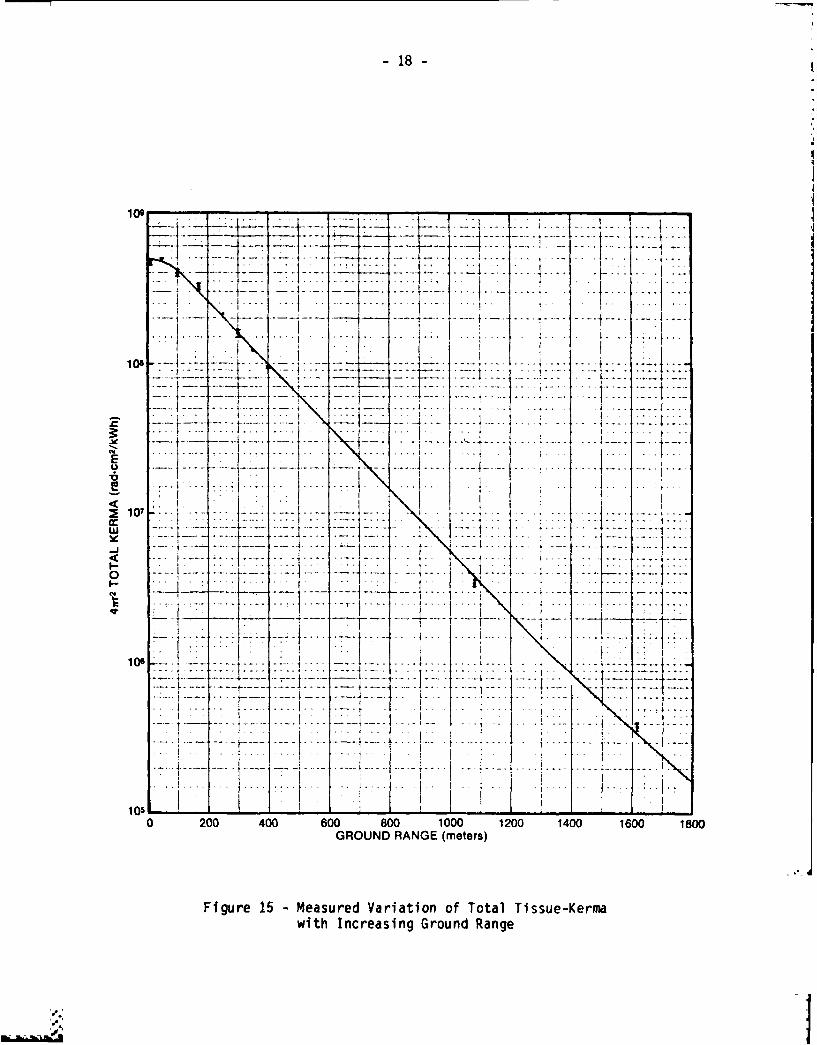
plotted quantities have been multiplied by 4rr2 at each measurement positionin order to eliminate strictly geometrical attenuation with distance. The"error bars" shown correspond not to estimated experimental error butinstead observed standard deviations (sample definition) amongst all commonmeasurements at each range. (A point without an associated deviationindicates a single measurement.) The plotted lines are not theoretically-derived, instead these are best-fit exponentials beyond the ranges at which equilibrium attenuation appears to be achieved, and smooth curves("optical") at shorter ranges.
Neutron fluence above 3 MeV (Figure 12) increases approximately 20%in the first twenty meters from the core (presumably due to ground-return) thereafter decaying exponentially with distance with an indicated relaxationlength of 177 meters. Consistency amongst the various measurements isgenerally better than 10%.
Neutron kerma (Figure 13) decreases monotonically with distance,equilibrium attenuation appearing to start at about 100 meters, with acharacteristic relaxation distance of 187 meters. Presumably ground-returnneutrons are reflected back at sufficiently lower energies that an initialincrease in 4wr 2 neutron tissue-kerma is not observed. Neutron kermameasurements are self-consistent to approximately the same degree as are neutron fluences, or generally better than 10%. Recent APRD Bonner-sphere[11] and ion-chamber Geiger-Miller [101 measurements at 1618 meters are also apparently in good agreement with measurements at shorter ranges.
Initial enhancement of gamma-ray kerma (in the 4irr2 sense) isapparent to approximately 150 meters, after which attenuation with arelaxation length of 259 meters is indicated (Figure 14). The increase ingamma kerma at short range is due to radiative neutron capture in the airand ground, and the greater relaxation length (compared to neutron kerma) tothe longer mean-free-path in air. Observed experimental consistency isgenerally between 5 and 10 percent at most ranges.
In the case of total tissue kerma (Figure 15) the plotted linerepresents the sum of previously plotted neutron and gamma-ray kermas.Experimental consistency is everywhere better than 6% and often less thanthis. Since this is somewhat superior to the consistency observed amongsteither neutron or gamma-ray measurements, it may be suspected that some mis- identification of particle type occurs in individual measurements. Inparticular DREO estimates total kerma by adding individual contributions asmeasured by the same detector (using pulse-shape discrimination betweenparticle types), consequently an overestimation of one component could becompensated for by a similar underestimation of the other component. APRDmeasurements of total kerma are instead made directly using tissue- equivalent Ionization chambers of large volume (4 or 16 litres), however theestimation of neutron kerma is accomplished by subtracting gamma-kerma asmeasured by Geiger-M~iller counters. Greater variance is therefore expectedIn the measurement of neutron kerma since this is determined by numericaldifference, and hence subject to greater statistical fluctuation. It should be noted, however, that no statistically-significant systematic over- or under-prediction may be attributed to either of the above-mentionedtechniques as a result of measurements made to date at APRD. All that maybe concluded is that measurement of total kerma appears to be generally moreprecise than measurement of either neutron or gamma-ray kerma alone.
0 *~. - - - ... . ... _ .
20-
The overall consistency observed in the measurement of integralquantities at APRD compares favourably, for instance, with the 7 to 8%variations observed by the 1975 European neutron dosimetry intercomparison
project [28] - especially considering the much less-well controlledexperimental conditions at APRD, and the five-year span of the measurements.
The good agreement between APRD TE-GM determinations of neutron kermaand those of DRED employing a combination of NE-213 and BF3 detectors (seeAppendix G) is at variance with previously-noted spectral differences below 2 MeV between DREO, APRD and WWD-determined neutron spectra (Figures 2-4).Between 0.11 and 2.3 MeV of neutron energy falls approximately 65% of theneutron tissue-kerma (as determined at 170 meters by DREO). Were the DREO-determined neutron spectra at 100, 170, and 300 meters deficient by the 25to 35% indicated by comparison to WWD and APRD determined spectra in thisenergy range, then it would be expected that DREO estimates of total neutron kerma should be similarly deficient by approximately 20%, in a systematicmanner when compared to other integral measurements. This is in fact notobserved - DREO estimates of neutron kerma are at all ranges within 7% ofthe corresponding mean values. Compensation by differences at energiesoutside the cited range is unlikely since only 35% of neutron kerma isavailable to compensate, and the DREO-measured neutron spectra have beenshown to be in good agreement with Bonner-sphere observations [8].
3.6 Discussion
The varied techniques employed by the three groups to measureintegral quantities at APRD are in good agreement with each other - observed variances are no more than would be reasonably expected given currentknowledge of radiation dosimetry, even under more favourably-controlledexperimental conditions.
The less-numerous neutron spectra measured at APRD, however, doexhibit significant, systematic differences at ranges where commonalityexists - APRD is generally higher than the others at all energies, WWD andDREO are in good agreement above 2 meV but below this energy DREO isgenerally lower by 25 to 35%. All three groups use similar instrumentationand pulse-shape discrimination techniques. WWD and APRD used identicalunfolding codes and neutron response matrices, however DREO codes andresponse matrices differed. A possibility of unfolding bias therefore exists between DREO and APRD/WWD results; however for the opposite reasonAPRD and WWD neutron spectra should be in better agreement with each otherthan currently observed. DREO results are supported by consistency withBonner-sphere observations, integral dosimetry and demonstrated spectral andabsolute reproducibility of Cf2 5 2 neutron spectra (Appendix J). It ispresently unclear however, why the measurements of neutron spectra similarto that from Cf2 s2 do not agree better. Only through a well-controlledspectral intercomparison between the three groups may it be resolved whetherthe noted differences are in fact due to experimental bias or instead merely due to the vagaries of NE-213 neutron spectroscopy.
Differences between WWD- and DREO-measured gamma-ray spectra are alsoevident, the most significant occuring below 1 MeV where differences of a
,.'.-'.::.-,'
" " "" " " C ' " "" " "" " "" " "" ' "" """ " """ "" "" " " ".- ' " " .
-21 -
factor of two are observed. As was discussed regarding neutron spectra,these differences are presently unexplained, but could be put intoperspective by a better-controlled intercomparison.
At 1080 meters, good reproducibility has been demonstrated both inthe measurement of neutron and gamma-ray spectra, and also integralquantities, over extended time periods. The influence of variations inatmospheric conditions has been shown to be minimal, although low-temperature measurements might also be made to support this claim further.
4.0 THEORETICAL CALCULATIONS
4.1 Previous ORNL and DREO Calculations
Prior to 1981 two calculations of the free-field radiation environments at APRD were available - one performed in 1979 at ORNL [6] andone in 1980 performed at DREO [3]. Both employed the DOT radiationtransport code [29], interaction data from the 1975 DNA library [30],neutron and gamma-ray source spectra as predicted by an earlier ORNL core-calculation r2], and the then-accepted source normalization factor of 1.28 x10¹⁷ neutrons per kilowatt-hour [2]. The ORNL calculation used an S8angular quadrature and a realistic atmospheric composition includinghumidity, but was limited to a maximum range of 500 meters. The DREOcalculation used a coarser angular quadrature (S6) and spatial mesh, and adry-air approximation, but extended the ground range to 1500 meters. Inspite of the different approximations employed agreement in the integralsense was good, although the DREO-calculated gamma-ray spectra were probablydeficient due to discrete ray-streaming effects [3]. Calculated neutronspectra, however, were in good agreement.
Comparison to experimental measurement [3,6] indicated thattheoretical predictions of neutron spectra were softer than observed (fewerneutrons above 2 MeV but more below this energy). Surprisingly, agreementwas best at the farthest measurement position of 1080 meters. Calculatedgamma-ray spectra were also softer than observed and agreement best at 1080meters, but it must be noted that the DREO calculations were influenced tosome degree by discrete ray-streaming effects.
4.2 Recent LANL, SAI and LLNL Calculations
In 1982 a group at LANL recalculated the APRD neutron radiationenvironments [14], using a continous-energy Monte Carlo transport code(MCNP) and interaction data derived from ENDF/B-V. Only neutron spectraabove 0.55 MeV (the lower NE-213 threshold) were predicted, but concurrentlythe effects of ground water content, ground density, relative atmospheric humidity and revised source spectra were examined, as were drastic changesin the total cross sections of nitrogen and oxygen. Their study concludedthat integral quantities were predicted with reasonable accuracy, but thatspectral disagreement persisted which could not be readily resolved bypostulated changes in the above-mentioned parameters. Calculated neutron
"
. .,,,
e
22-
spectra were found to be uniformly softer than measured; as were similarcalculations [311 performed to compare with the ORNL "broomstick" and LLNL"pulsed-sphere" experiments, in which neutron transport through samples ofliquid nitrogen and liquid oxygen was studied.
Also in 1982, SAI performed calculations [13] of the radiationenvironments at APRD for comparison with experimental measurement usingdiscrete-ordinates techniques (DOT-SAI), the DNA data library [301 and therevised LANL-calculated neutron source spectrum [18]. Calculations of theimportance of atmospheric composition on neutron transport were originallymade using one-dimensional models (ANISN [32]) and indicated thatatmospheric conditions prevailing at the time of each groups' experimentsmade little difference to the calculations out to a 500 meter range, but atone kilometer significant differences (±15%) were apparent. Subsequent DOT calculations used atmospheric conditions characteristic of the DREOexperiments as these led to the intermediate ANISN results at onekilometer.
Calculated and measured neutron and gamma-ray kermas were concludedto be in generally good agreement with each other. Calculated neutronspectra were found to be in better agreement with the measurements of WWDthan those of either APRD or DREO. It was postulated that this may havebeen due to differing soil water contents typical at the time of each groupsmeasurements (WWD measurements were made in March of 1978 with ground snowcover of 35 1/m2 [1]) or alternatively to unfolding errors on the part ofDREO, primarily below a neutron energy of 3 MeV. Between 0.5 and 3 MeV theWWD spectra were in good agreement with SAI calculations, however APRD'swere higher and those of DREO lower. Below 0.5 MeV the SAI calculationswere, however, found to be in good agreement with the parametric BF3determinations of DREO.
Gamma-ray spectra were also in better agreement with the measurementsof WWD than those of DREO, but this was somewhat expected since soilconditions at the time of the WWD experiments were employed in thecalculations. The greater intensity of the 2.2 MeV capture gamma-ray fromhydrogen apparent in the WWD spectra (when compared to DREO spectra) wascited as evidence that ground moisture content was in fact higher. Improvedagreement with DREO spectra at 1080 meters also indicated that soil moisturewas relatively less important at the longer experimental ranges (the reducedintensity of DREO-measured 2.2 MeV gamma-rays at 1080 meters supports this observation - see Appendix B).
LLNL has similarly calculated [12] the APRD environments using theD-T-4 code and LLNL data-libraries. At the time of writing, only integraldosimetry data are available, however these will be seen to be in reasonableagreement with corresponding experimental values.
4.3 Comparison to Experimental Spectroscopy
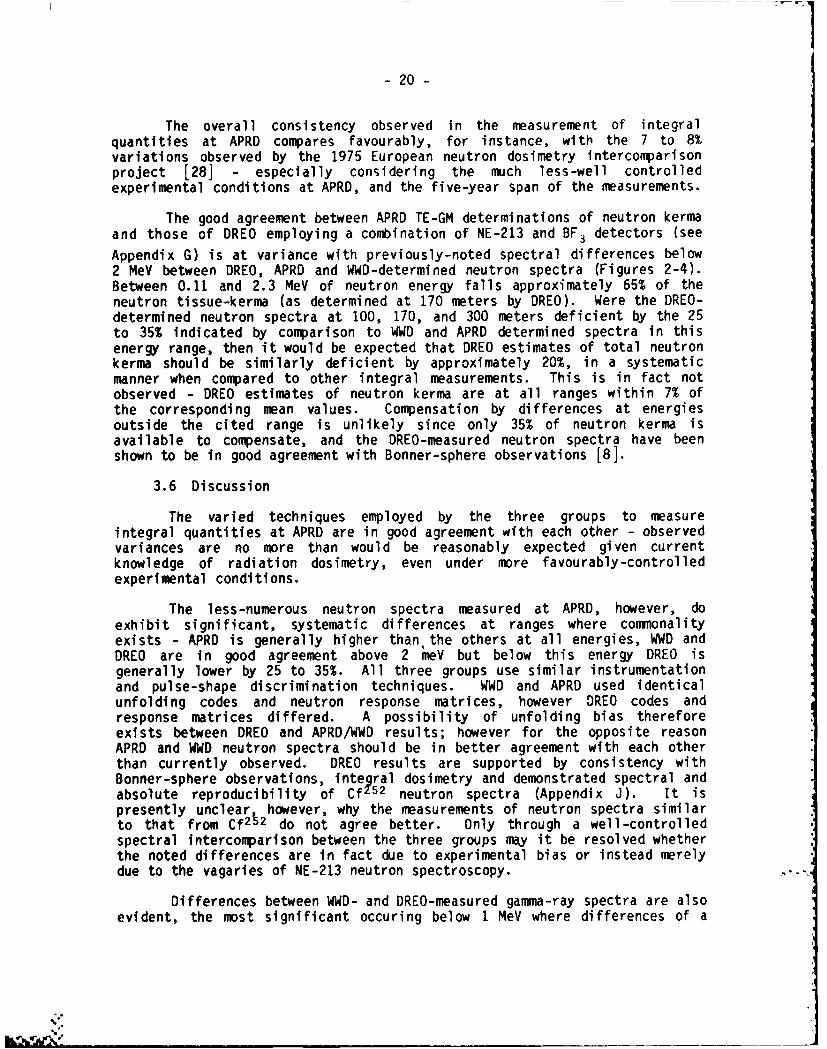
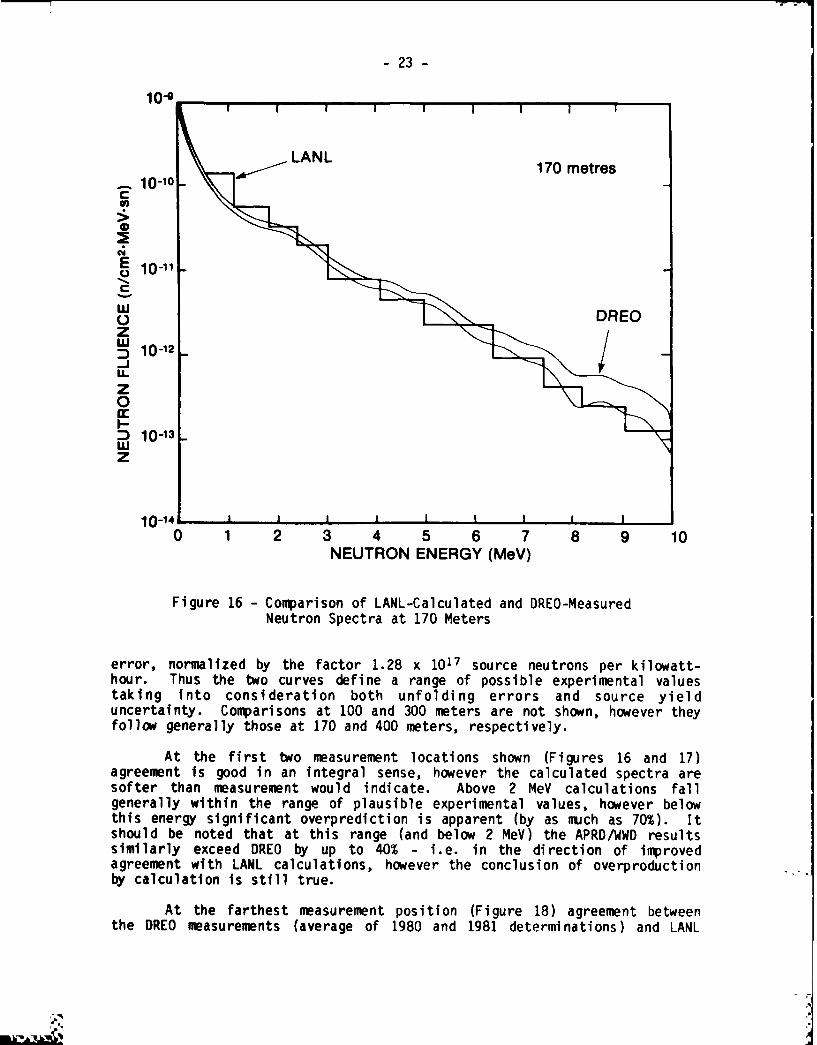
In Figures 16 through 18 LANL calculations of neutron spectra arecompared to DREO measurement at each of three ground ranges: 170, 400 and1080 meters. Two experimental curves are shown. The upper curvecorresponds to the unfolded spectrum plus one standard error, normalized tosource neutrons using the factor 1.10 x 10¹⁷ source neutrons per kilowatt-hour. The lower curve indicates the unfolded spectrum minus one standard
.'., ..
- 23 .
10-.
LANL0LANL 170 metres
10-10-
E 10-11
Q""u DREO
W 10-12LL
I, J,"'
-D 10-3Z
0 1 2 3 4 5 6 7 8 9 10 NEUTRON ENERGY (MeV)
Figure 16 - Comparison of LANL-Calculated and DREO-MeasuredNeutron Spectra at 170 Meters
error, normalized by the factor 1.28 x 10¹⁷ source neutrons per kilowatt-hour. Thus the two curves define a range of possible experimental valuestaking into consideration both unfolding errors and source yielduncertainty. Comparisons at 100 and 300 meters are not shown, however theyfollow generally those at 170 and 400 meters, respectively.
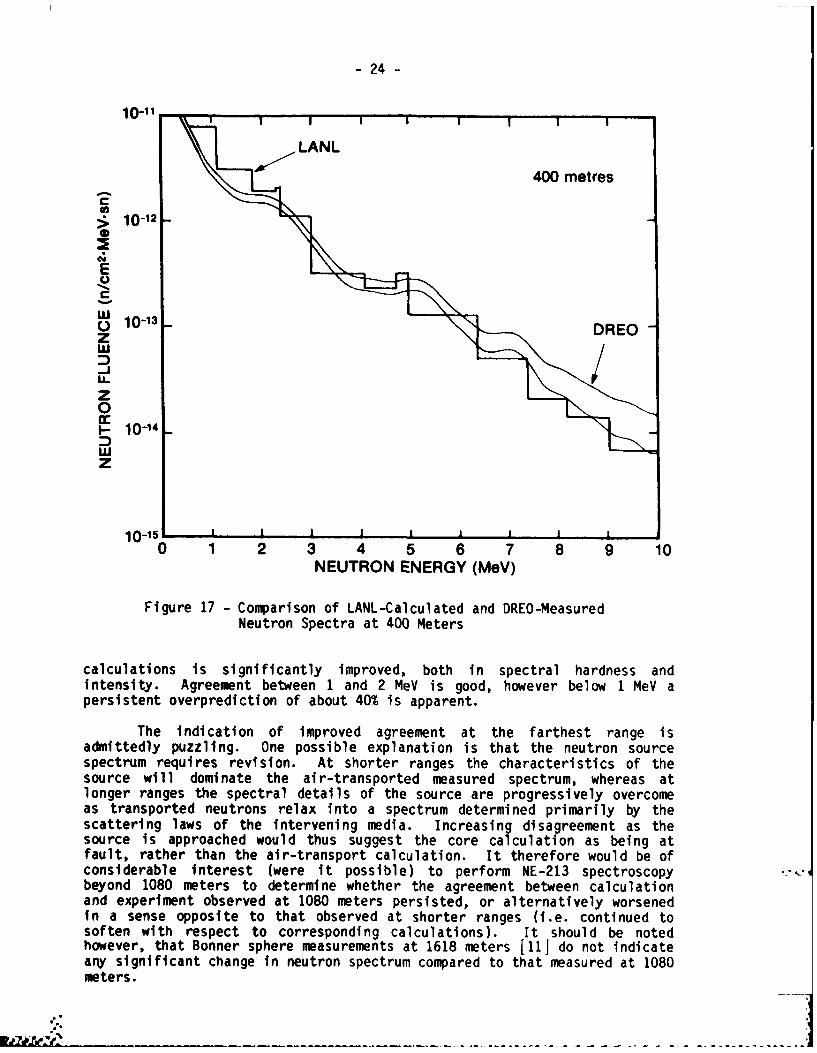
At the first two measurement locations shown (Figures 16 and 17)agreement is good in an integral sense, however the calculated spectra aresofter than measurement would indicate. Above 2 MeV calculations fallgenerally within the range of plausible experimental values, however belowthis energy significant overprediction is apparent (by as ouch as 70%). Itshould be noted that at this range (and below 2 MeV) the APRD/WWD resultssimilarly exceed DREO by up to 40% - i.e. in the direction of improvedagreement with LANL calculations, however the conclusion of overproductionby calculation is still true.
At the farthest measurement position (Figure 18) agreement betweenthe DREO measurements (average of 1980 and 1981 determinations) and LANL
.:,
- 24 -.1.'o.
10-11
LANL400 metres
10-12
A
"~W 10-13 "'"'; - ~DREO -- -
UW
10-14
0 150 1 258
inest. Aremn0we 1 an 2 4 e is god hoee belo 1 0 persisten ENERGYico ofaot(0Ms pa e V)n-t..
Fige 17n-icati rion of proved areemete an th -earet range"ispcrmrqi e ron. Spetsra t4Mterags th caaceisic-f h
.1.
clngrlaions ts sgifcnheipoe, oh i spectral dealsoardnureae rg essivl overcome''-.asntrnspt ed neree ns elaxeento an 2spectrum deteminedverimarlow by hea.-psattengt aw over tre i t ervnin medbu 4 ia. apparesnt. diageeet s h
sour e i dcto ofpiproahe wolahss ge m t the atones beng is.a.-tfadmitthe r puzzang th e -rpo rt ecplculation. I ht the e r on oul e of;
csierabwle dointes (wee airtrpoibe) toesrfomed1 spectroheescato.pybeond 1080gether seta detie whehe the oraremn progreieclocultoneand trxnprmedntosrea 108nmter apecristeormintedrmaivly byoheescein g awse oppstet th at bservn edia shoreasinge isageementinue toei"sofrcen ith rppoceossget the corrspedn calculations) Itshol beino thoweve, hathe Bonne sher me-tansprt calcuatin 61 m t her ef1o notuldicaeof,.
ansigificae 1nt7 (ere io a tron o ecA Cl catred no DE-M easured a- 8
meters. eer odtrie hte h areetbtee aclto
%eron Sat 40 ete r
alclaini significant lyimprovednbothon spectrumcmaeotal heardess and00...:In mtensit. Areetbten1ad2MVi od oee eo eperisentovrpeditin oaou'40 i aparnt
,_ =,°.----,-,-, , . 'oThe'....... Iniatoo.mpoe agremen at• the.. farthest-. range...-. is. . -.. admittedly uzzing,," r -.'y..,,. ','.'.",.". il exlaato is,.-..,. that the'.../.,.'. neto source:...' ....',-
- 25 -
10-13
LANL 1080 metres
10-14
E
* -~10-15-
z1_
z 10-16- _..- .
0
Z 10-17
Figre 18E Coprio of":'-aluatd ndD'--esuro S-
"Z10-u
0 1 2 3 4 5 6 7 8 9 10 .,_ ~NEUTRON ENERGY (MeV)
- " ~Figure 18 - Comparison of LANL-Calculated and DREO-Measured Neutron Spectra at 1080 Meters
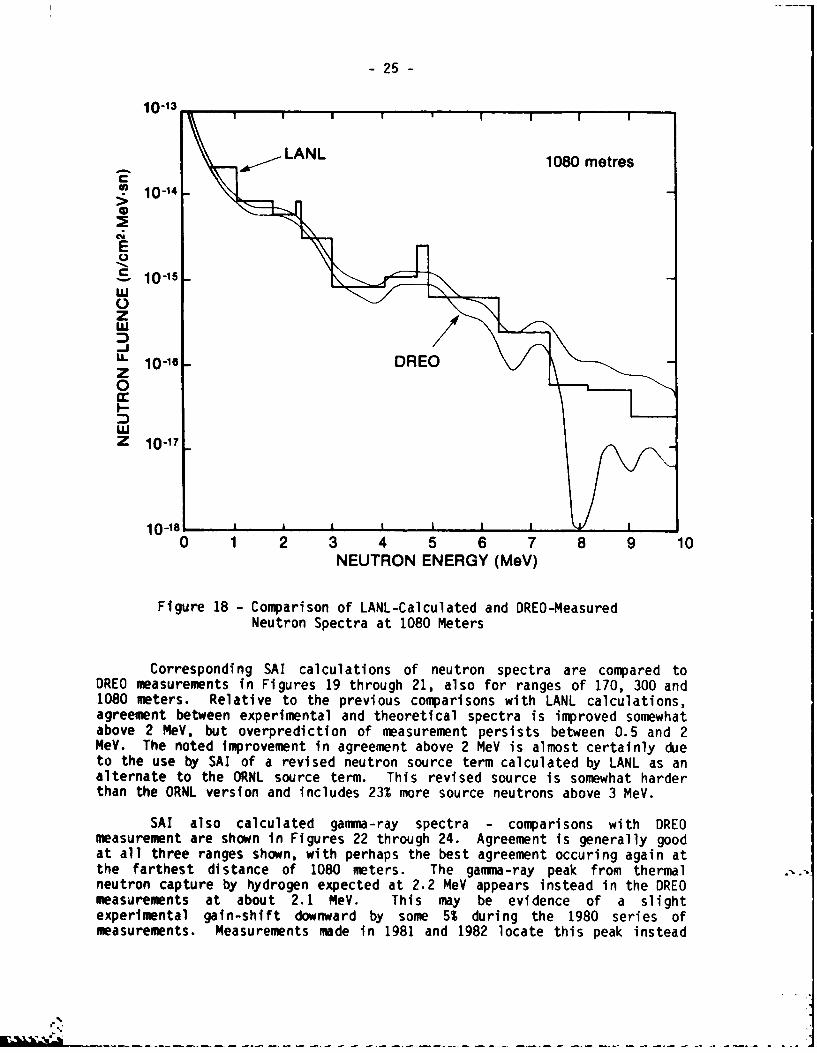
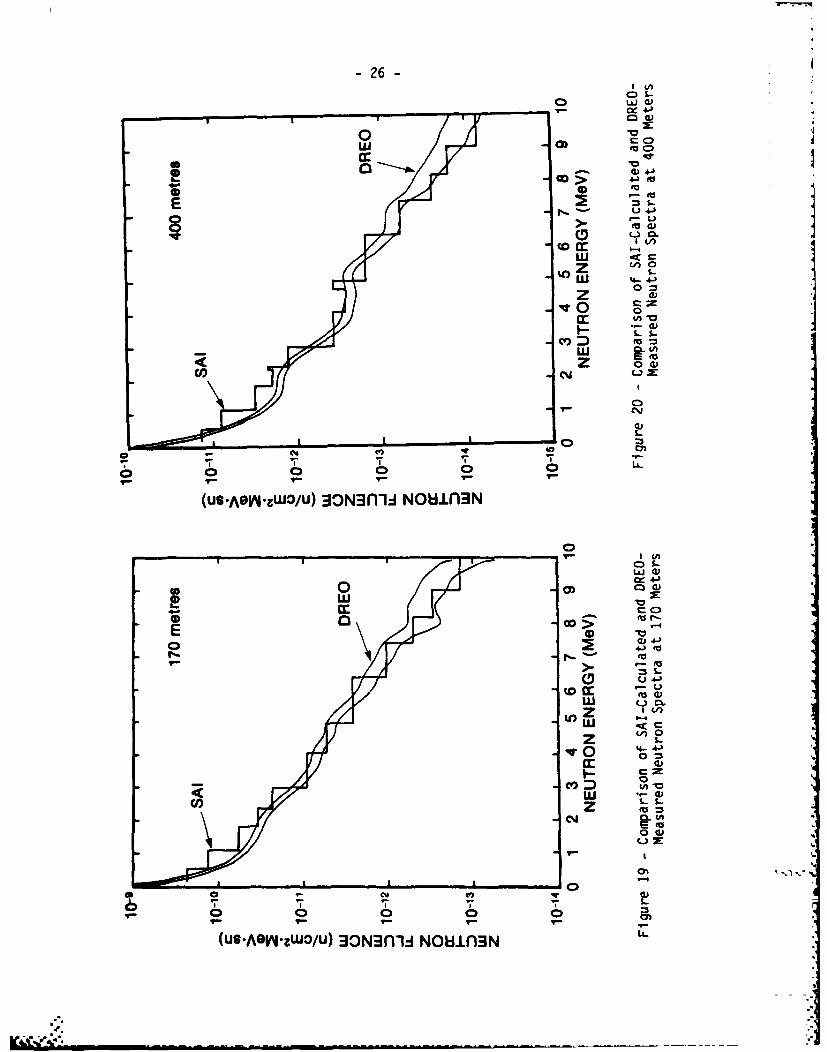
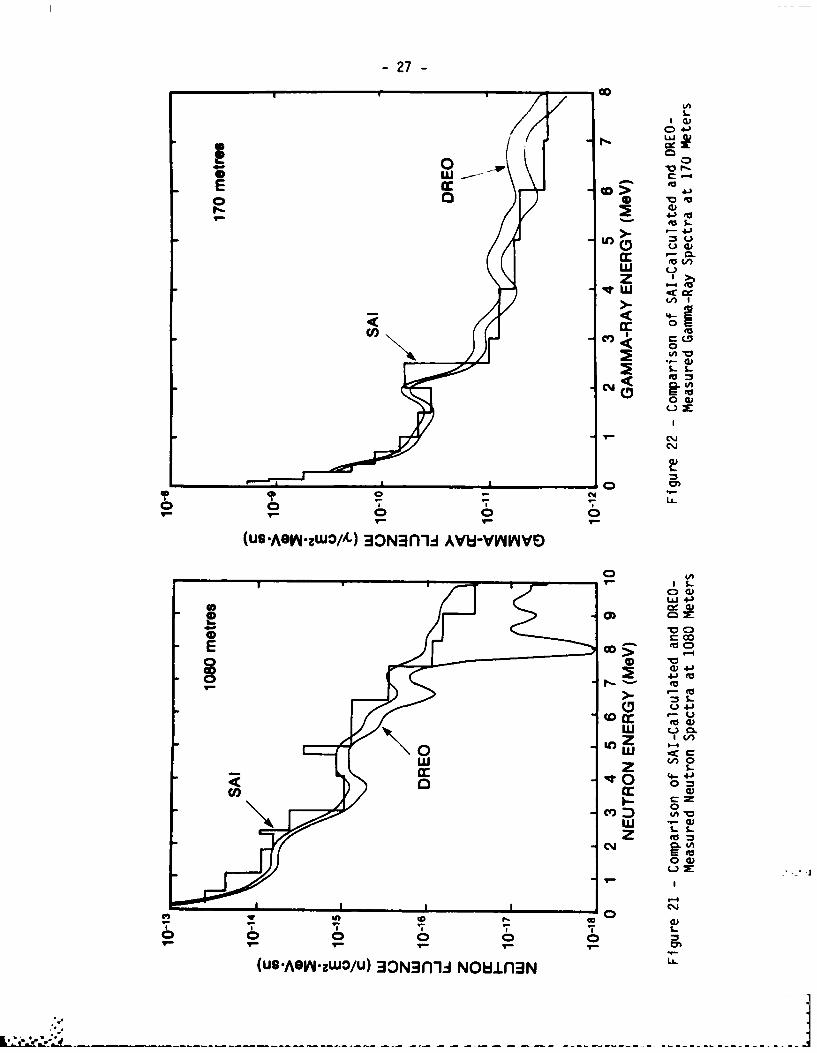
Corresponding SAI calculations of neutron spectra are compared toDREO measurements in Figures 19 through 21, also for ranges of 170, 300 and1080 meters. Relative to the previous comparisons with LANL calculations,agreement between experimental and theoretical spectra is improved somewhatabove 2 MeV, but overprediction of measurement persists between 0.5 and 2MeV. The noted improvement in agreement above 2 MeV is almost certainly due to the use by SAI of a revised neutron source term calculated by LANL as analternate to the ORNL source term. This revised source is somewhat harderthan the ORNL version and includes 23% more source neutrons above 3 MeV.
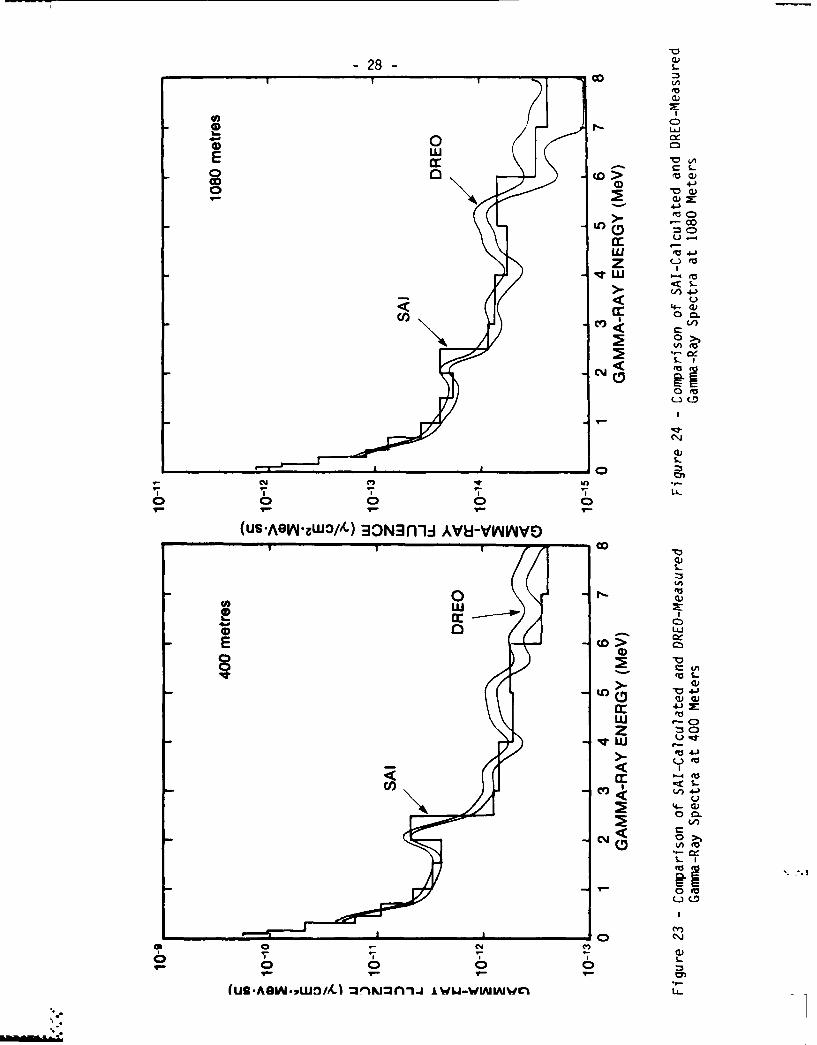
SAI also calculated gamma-ray spectra - comparisons with DREOmeasurement are shown in Figures 22 through 24. Agreement is generally good
at all three ranges shown, with perhaps the best agreement occuring again at the farthest distance of 1080 meters. The gamma-ray peak from thermal ft'.t.
neutron capture by hydrogen expected at 2.2 MeV appears instead in the DREOmeasurements at about 2.1 MeV. This may be evidence of a slight
experimental gain-shift downward by some 5% during the 1980 series ofmeasurements. Measurements made in 1981 and 1982 locate this peak instead .
-26-Ij W
on w
oc > V
E~JU 4
I L
z 0 0
L
00c Co
d 0 0 0 0 0-1~ 1>
w e
4-4 4)0
fLr
0 '
I'-GV'WDU 3OEU1: N.%
-27-
* LA
00
o 0 0a:
.JEWj -cc
0 )
0C 0
0o 4J
*0 Ioo
0 cc
00coa D (A "
w 0
z 0
0 (
CJ
ON
N (U-AGMWDIU 30Nn-I. NowLn3
. . . . .
-28-A
W ~LUq 0wE ~cc
Go 4)C00
"4J
Ule) 0
ccz I
-.-
U.)
CM/
12 !2(NJ
(us.AeV4-wO/A.) 30N~fn-ukvu-vknv~vo
cIS ---- - .
0 LU
E W3
cc -~cc
E C>0 3 n
cc r
Cl)V) ) 4-)L
1 m
"4 1V
(us.AeV4.awD//-) 30N~n-i~jkvu-vvk~~v~ vo
- 29 -
at the expected energy of 2.2 MeV (see Appendix B), however gamma-ray 1$fluences appear to be unaffected at other energies.
4.4 Comparison to Experimental Dosimetry
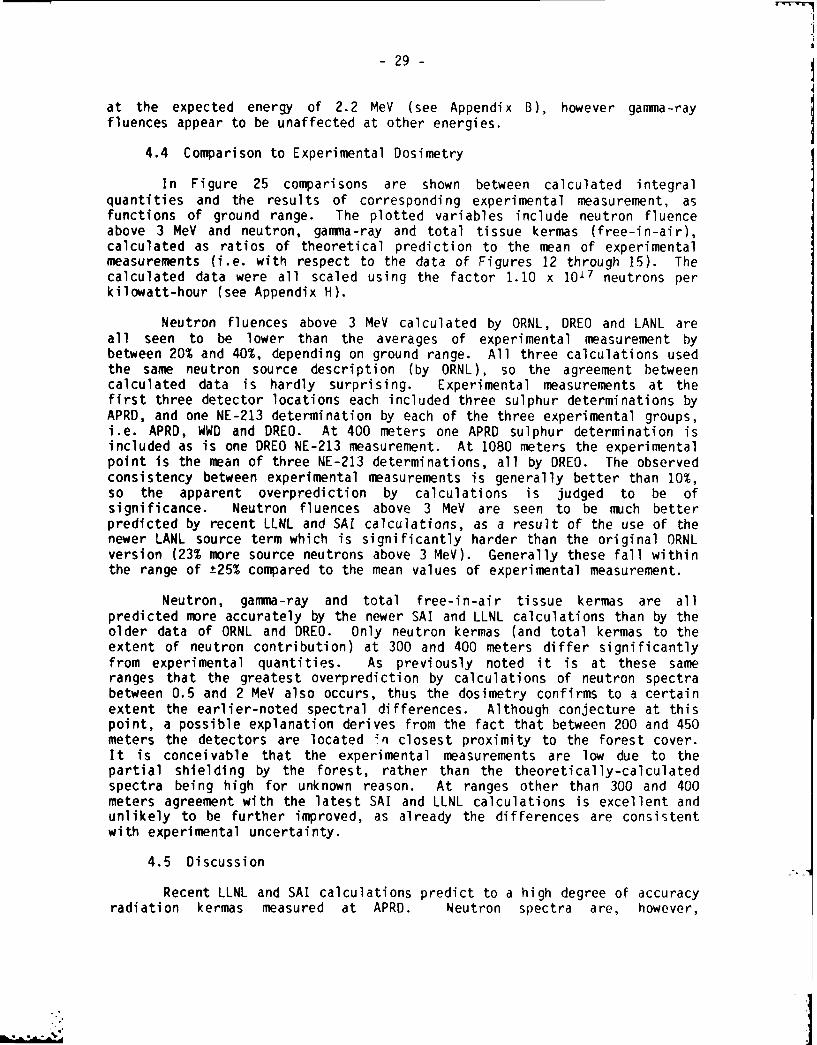
In Figure 25 comparisons are shown between calculated integralquantities and the results of corresponding experimental measurement, asfunctions of ground range. The plotted variables include neutron fluenceabove 3 MeV and neutron, gamma-ray and total tissue kermas (free-in-air),calculated as ratios of theoretical prediction to the mean of experimental measurements (i.e. with respect to the data of Figures 12 through 15). Thecalculated data were all scaled using the factor 1.10 x 10,7 neutrons per kilowatt-hour (see Appendix H).
Neutron fluences above 3 MeV calculated by ORNL, DREO and LANL areall seen to be lower than the averages of experimental measurement bybetween 20% and 40%, depending on ground range. All three calculations usedthe same neutron source description (by ORNL), so the agreement betweencalculated data is hardly surprising. Experimental measurements at thefirst three detector locations each included three sulphur determinations byAPRD, and one NE-213 determination by each of the three experimental groups,i.e. APRD, WWD and DREO. At 400 meters one APRD sulphur determination is =included as is one DREO NE-213 measurement. At 1080 meters the experimentalpoint is the mean of three NE-213 determinations, all by DREO. The observedconsistency between experimental measurements is generally better than 10%,so the apparent overprediction by calculations is judged to be ofsignificance. Neutron fluences above 3 MeV are seen to be much betterpredicted by recent LLNL and SAL calculations, as a result of the use of thenewer LANL source term which is significantly harder than the original ORNLversion (23% more source neutrons above 3 MeV). Generally these fall withinthe range of t25% compared to the mean values of experimental measurement.
Neutron, ganna-ray and total free-in-air tissue kermas are allpredicted more accurately by the newer SAI and LLNL calculations than by theolder data of ORNL and DREO. Only neutron kermas (and total kermas to theextent of neutron contribution) at 300 and 400 meters differ significantlyfrom experimental quantities. As previously noted it is at these sameranges that the greatest overprediction by calculations of neutron spectrabetween 0.5 and 2 MeV also occurs, thus the dosimetry confirms to a certainextent the earlier-noted spectral differences. Although conjecture at this point, a possible explanation derives from the fact that between 200 and 450meters the detectors are located n closest proximity to the forest cover.It is conceivable that the experimental measurements are low due to thepartial shielding by the forest, rather than the theoretically-calculated spectra being high for unknown reason. At ranges other than 300 and 400meters agreement with the latest SAI and LLNL calculations is excellent and unlikely to be further improved, as already the differences are consistentwith experimental uncertainty.
4.5 Discussion
Recent LLNL and SAI calculations predict to a high degree of accuracyradiation kermas measured at APRD. Neutron spectra are, however,
-30-
1.2Neutron Fluence > 3MeV
1.0
* ~~~~0.8 0_ _ _ _ _ _ _
4X
<0.41> ~100170 300 400 18
~- 1.4 -
w 0Neutron Kermacc 1.2UIL'
~0.8I
0.61 11 1z 100 170 300 400 1080
0S1.4 1 1 Gamma-ray Kerma
LL1.0
-ed100170 300 400 1080
1.4 I ITotal Kerma1.2 i- -__ _ _ _ _ _ _ _
,eze +0.8
F.100 170 300 400 1080GROUND RANGE (metres)
Figure 25 -Comparison of Various Theoretically-Determined IntegralQuantities to Those Experimentally Measured(+ ORNL, x DREO, * SAl, 0 LLNL, A LANL)
A A
-31-
overpredicted significantly between 0.5 and 2 MeV (more so when compared toDREO results than either APRD or WWD), and are generally softer thancorresponding measurements. Conceivably this disparity may be due either to an inadequacy in the APRD core calculation (and hence neutron leakagespectrum) or to an excessive probability of energy-loss inherent in thescattering cross-section data used in the calculations. Failure of the particle transport methodology by itself is unlikely since both discrete-ordinates and Monte-Carlo calculations are in good agreement with eachother. Discrete-ordinates techniques have also been shown to predictmeasured gamma-ray spectra to a degree of accuracy consistent withexperimental uncertainty. Possible spectral biases attributable toexperimental techniques are also felt to be an unlikely cause as a result ofthe demonstrated capabilities to measure very similar neutron spectra fromcalibrated Cf2 5 2 sources.
5.0 CONCLUSIONS"-'
Neutron and gamma-ray spectra have been measured at a distance of 1080 meters from the APRD core on three separate occasions, two under
prevailing atmospheric conditions which were essentially identical. Goodreproducibility of measured spectra was demonstrated, as was the precisionof derived integral quantities. Similar measurements performed underconditions of much higher atmospheric temperature and humidity differed onlymarginally. Recent dosimetric measurements and Bonner-sphere determinationshave confirmed the previously-reported experiments employing NE-213 and BF3detectors.
Theoretical calculations performed by LANL, SAI and LANL have been Ifound to accurately predict integral quantities of neutron, gamma-ray andtotal radiation tissue-kerma (free-in-air), although spectral differencesbetween calculations and experiments persist. Calculated neutron spectraare somewhat softer than observation, the most significant differencesoccuring between 0.5 and 2 MeV where calculations may exceed measurements by as much as 70%. There is some evidence that this discrepancy is greatest atthe shorter source-to-detector distances, implying that it may not be thefault of the air-transport component of the theoretical calculation butrather due to an inadequacy in the source term and hence initial corecalculation.
Neutron spectra measured on separate occasions by the threeexperimental groups (APRD, WWD, DREO) differ also in the same energy regionof 0.5 to 2 MeV, by up to 40%. The causes of noted experimentalinconsistencies are not presently obvious.
To aid in the resolution of these discrepancies, further measurements are suggested:
1. At the next available opportunity APRD, WWD and DREOshould simultaneously measure neutron and gamma-rayspectra from the APRD Cf2 5 2 source, under identicalexperimental conditions. Comparison of unfoldedspectra will then indicate whether noted experimentaldifferences are traceable to the different measurement
-32-
and analysis techniques employed by the three groups,or instead merely due to the uncontrollable vagaries ofNE-213 spectroscopy.
2. The validity of comparison between theoreticalcalculation and experimental measurement might beimproved if more accurate determinations of the spectraland directional characteristics of core leakage wereavailable. Ideally the same detectors should beemployed as previously used in air-transportmeasurements, however high dead-time effects precludetheir location at small source-to-detector separations.Possibly smaller NE-213 scintillators might be employedinstead with lower efficiencies. In any event,determinations should be made after a substantial core-cooling period and at several polar angles and source-to-detector separations. The measured spectra may then
be used as source terms in subsequent air-transportcalculations, thus avoiding the current reliance oncore-calculations of source leakage.
3. Future investigations should also address the notedspectral discrepancies between neutron energies of 0.5and 2 MeV. An effort to improve experimental accuracyshould be made, possibly utilizing high-pressure He3spectrometers and/or activation methods as well asattempting to lower the present threshold of 600 KeVattributable to the NE-213 scintillators.
4. An experimental program initiated recently by theEtablissement Technique Central de l'Armament (France)to measure angular distributions of air-transportedspectra at APRD should also be pursued as suchinformation will provide a verification of the adaquacyof theoretical calculations not only in energy but alsoparticle direction.
6.0 ACKNOWLEDGEMENTS
The authors are greatly indebted to the staff of the US Army PulsedRadiation Division, in particular A.H. Kazi, C.R. Heimbach and R.C.Harrison; to D.L. Rigotti and A.E. Rainis of the Ballistics ResearchLaboratory and to C.N. Davidson of the US Army Nuclear and Chemical Agencyfor their considerable assistance in planning, performing and analysing themeasurements reported herein and for their many helpful suggestions anddiscussions over the past few years.
,..
,_
- 33 -
7.0 REFERENCES
[11 A.H. Kazi, C.R. Heimbach, R.C. Harrison (APRD) and L. Schanzler, F.W.Buchholz (WWD), "Measurements of the Free-Field Radiation Environmentat the APRD Reactor", Aberdeen Proving Ground Report APG-MT-5279 (July1979), Aberdeen Proving Ground, Maryland, USA.
[2] L. Schinzler, F.W. Buchholz (WWD) and A.H. Kazi, C.R. Heimbach, R.C.Harrison (APRD), "Measurement of the Free-Field Radiation Environmentat the APRD Reactor", WWD Report No. 27, (Feb. 1979).
[3] H.A. Robitaille, and B.E. Hoffarth, "A Comparison of Measured andCalculated Air-Transported Radiation from a Fast, Unshielded NuclearReactor", Defence Research Establishment Ottawa Report DREO R-835(Dec. 1980).
[4] A.H. Kazi, C.R. Heimbach and R.C. Harrison, "Neutron and GammaRadiation Measurements and Calculations up to 1.1 Kilometers from aFission Source", Aberdeen Proving Ground Report APG-MT-5490 (Jan.1981).
[5] H.A. Robitaille, A.H. Kazi, C.R. Heimbach and R.C. Harrison,"Measurement and Calculation of Radiation Transport to 1.1 Km from a Fission Source", Transactions of the American Nuclear Society, 39, 772 " (1981 ).
[6] A.H. Kazi, C.R. Heimbach, L. Schanzler, J.V. Pace Ill and A.E.Rainis, "Comparison of Experimental Radiation Transport withCalculation", Transactions of the American Nuclear Society, 33, 706(1979).
[71 V.P. Bond, and J.W. Thiessen (Eds.), "Reevaluation of DosimetricFactors : Hiroshima and Nagasaki", US Department of Energy SymposiumSeries 55, CONF-810928 (1982).
[8] C.R. Heimbach, "Bonner Sphere Measurements of the APRD Free-FieldNeutron Environment", Aberdeen Proving Ground Report APG-MT-5682,(July 1982).C.R. Heimbach, "Effect of Weather on Neutron Spectrum at 1080 m Range
Using Bonner Sphere Spectrometer", Aberde. , Proving Ground Memo forRecord STEAP-MT-R 11-82, (24 July 1982).
[10] A.H. Kazi, R.C. Harrison and C.R. Heimbach, "Radiation Dose Measurements at 1.6 km Range - Preliminary Data Analysis", AberdeenProving Ground Memo for Record STEAP-MT-R 17-82, (27 August 1982 -revised).
[11] C.R. Heimbach, "Bonner Sphere Measurements at 1.6 km", AberdeenProving Ground Memo for Record STEAP-MT-R 16-82, (16 August 1982).
[12] W.E. Loewe, W.A. Turin, C.W. Pollock, A.C. Springer and B.L.Richardson, "Validated Deep-Penetration, Air-Over-Ground Neutron-GammaTransport", Lawrence Livermore National Laboratory Report UCRL-88498(April 1982).
-34-
[13] Private Communication; D.C. Kaul, SAI, 7 June 1982.
[14] G.P. Estes, R.C. Little, R.E. Seamon and P.D. Soran, "Air Transport inConnection with the Hiroshima-Nagasaki Dose Reevaluation Effort", LosAlamos National Laboratory Report LA-9369-M5, (July 1982).
[15] A.H. Kazi, "Fast-Pulse Reactor Operation with Reflector Control and a106-mm-diam Glory Hole", Nuclear Science and Engineering, 60, 62-73,
(1976).
[16] E.D. McGarry, A.H. Kazi, G.S. Davis and D.M. Gilliam, "AbsoluteNeutron-Flux Measurements at Fast-Pulse Reactors with CalibrationAgainst Californium-252", IEEE Transactions on Nuclear Science, NS-23,6, 2002, (Dec. 1976).
[17] A.H. Kazi, D.R. Harrell, E.J. Kaufman and W.S. Eaton, "Measurement ofAPRD Reactor > 3 MeV Fluence Source Distribution", Aberdeen ProvingGround Memo for Record STEAP-MT-R 8-82, (17 May 1982).
[18] R.C. Little, "Calculation of APRO Reactor", LANL Memorandum to P.P.Whalen, (21 Jan. 1982).
[19] Private Communication; P.P. Whalen, LANL, (July 1982).
[20] W.R. Burres, and R.M. Freestone, Jr., "FERDOR, A Simple and HonestUnfolding Code", Oak Ridge National Laboratory Report ORNL-TM-2709,(1969).
[21] V.V. Verbinski, W.R. Burres, T.A. Love, W. Zobel, N.W. Hill and R.Textor, "Calibration of an Organic Scintillator for NeutronSpectroscopy.", Nuclear Instruments and Methods, 65, 8-25, (1968).
[22] F.W. Buchholz, L. Sch~nzler, S. Stdiker, G. Tumbr~gel and M. Weinert,"Californium Liquid Air Tank Experiment", WWD Report Nr 33, (Dec.1976).
[23] N.A. Lurie, L. Harris and J.C. Young, "Calculation of Gamma-rayResponse Matrix for 5-cm NE-213 Organic Liquid ScintillationDetectors", Nuclear Instruments and Methods, 129, 543-555, (1975).
[24] H.A. Robitaille, "Rapid, On-Line Matrix Unfolding of Fast-NeutronSpectroscopic Data from Organic Scintillators", Thir Symposium onNeutron Dosimetry in Biology and Medicine, Neuherberg/Munchen, (May, 1977), EUR-5848, Commission of the European Communities.
[25] F.P. Szabo, "A Fast-Neutron Spectrometer", Defence ResearchEstablishment Ottawa Report R-637, (July, 1971).
[26] R.E. Textor, and V.V. Verbinski, "OSS, A Monte-Carlo Code forCalculating Pulse Height Distributions due to Monoenergetic NeutronsIncident on Organic Scintillators", Oak Ridge National LaboratoryReport ORNL 4168, (1968).
L 35 -
[271 K.G. Harrison, and P.M. Thomas, "Multisphere Neutron Spectroscopy andDosimetry", Fourth Symposium on Neutron Dosimetry in Biology andMedicine, Neuherberg/Munchen, (June, 1981), EUR-7448 (Vol. II),Commission of the European Communities.
[28] J.J. Broerse, G. Burger and M. Coppola (Eds), "A European NeutronDosimetry Intercomparison Project (ENDIP) Results and Evaluation",Commission of the European Communities, EUR-6004, (1978).
[291 W.A. Rhodes, and F.R. Mynatt, "The DOT-Ill Two-Dimensional Discrete Ordinates Transport Code", Oak Ridge National Laboratory Report TM-4280, (June 1973).
[301 D.E. Bartine, J.R. Knight, J.V. Pace III and R.W. Roussin, "Productionand Testing of the DNA Few-Group Cross Section Library", Oak RidgeNational Laboratory Report TM-4840, (Oct. 1975).
[31] P.P. Whalen, "Status of Los Alamos Efforts Related to Hiroshima andNagasaki Dose Estimates", US Department of Energy Sumposium Series 55,CONF-810928 (1982).
[32] W.W. Engle, Jr., "ANISN, A One-Dimensional Discrete-Ordinates Transport Code with Anisotropic Scattering", Oak Ridge NationalLaboratory Report K-1693, (March 1967).
VS
hOO
-.-
-37-
PREVIOUS PAGE IS BLANK.
6pp
APPENDIX APLOTTED FREE-FIELD NEUTRON SPECTRA MEASURED AT APRD
% %
a-.
-:
APPEDIXA*
PLTTD RE-FED EURO* SECR ME SE AT APDS
-..... .. V......a. . . . . .. .
.. .'V 2 -
-38-
APPENDIX A: PLOTTED FREE-FIELD NEUTRON SPECTRA MEASURED AT APRD
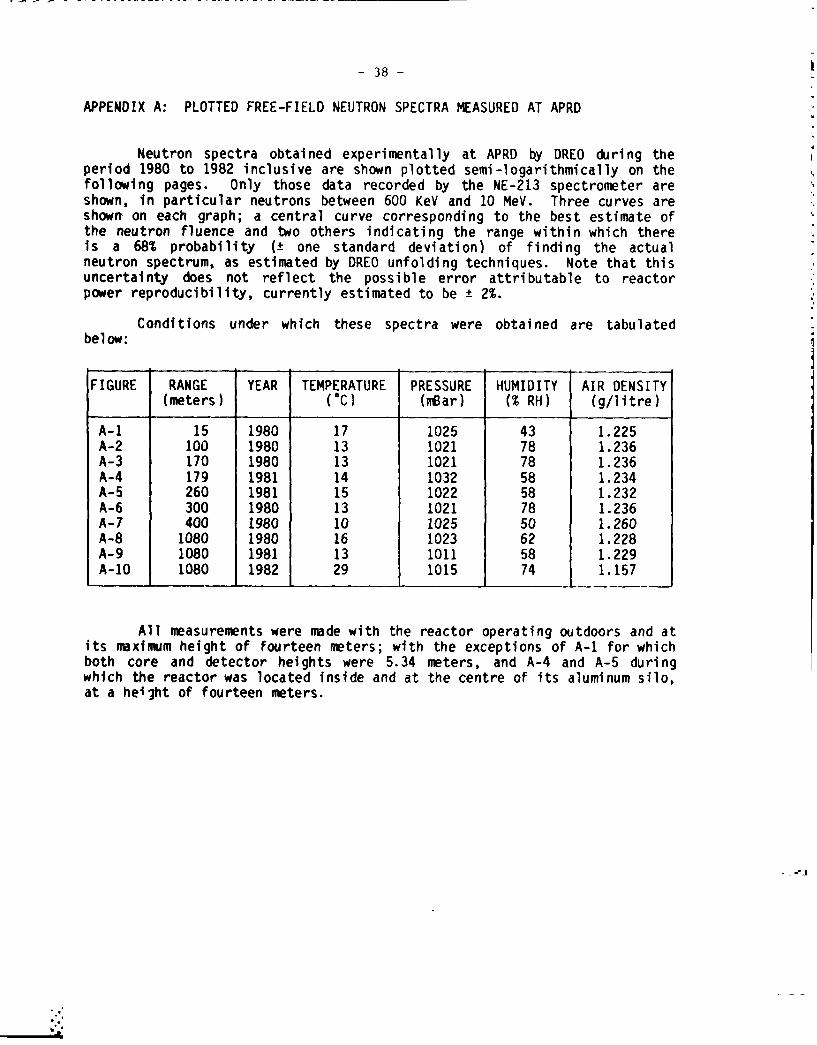
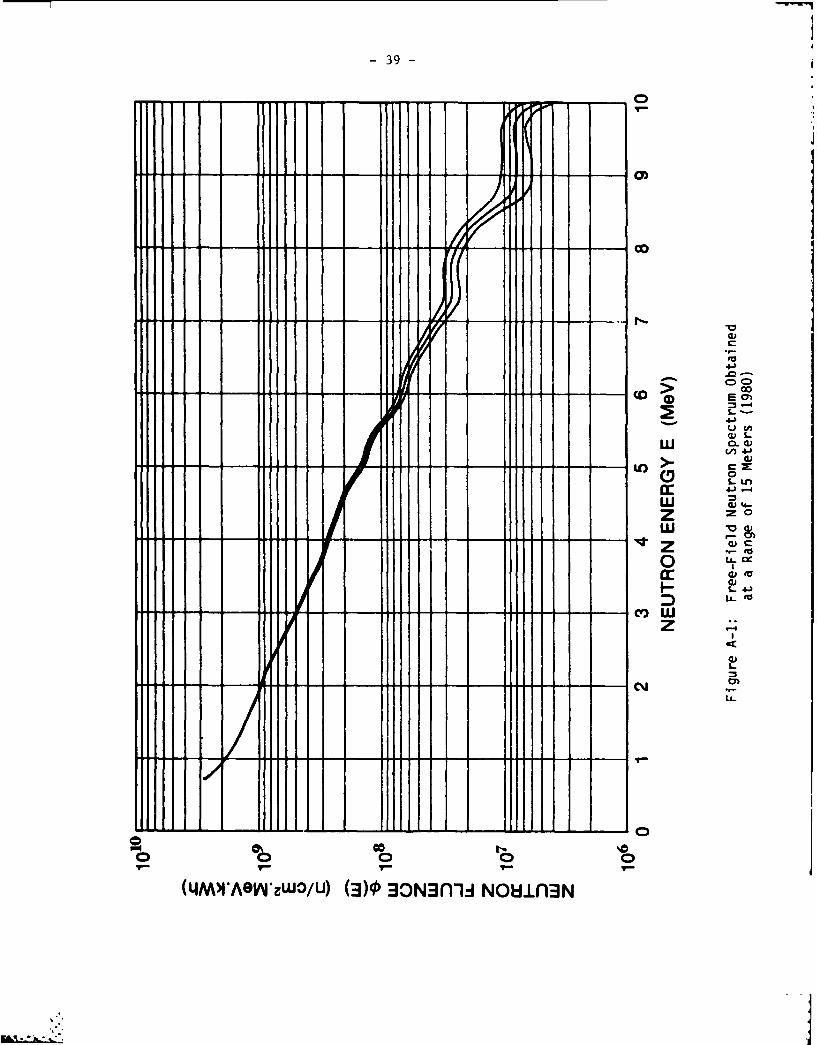
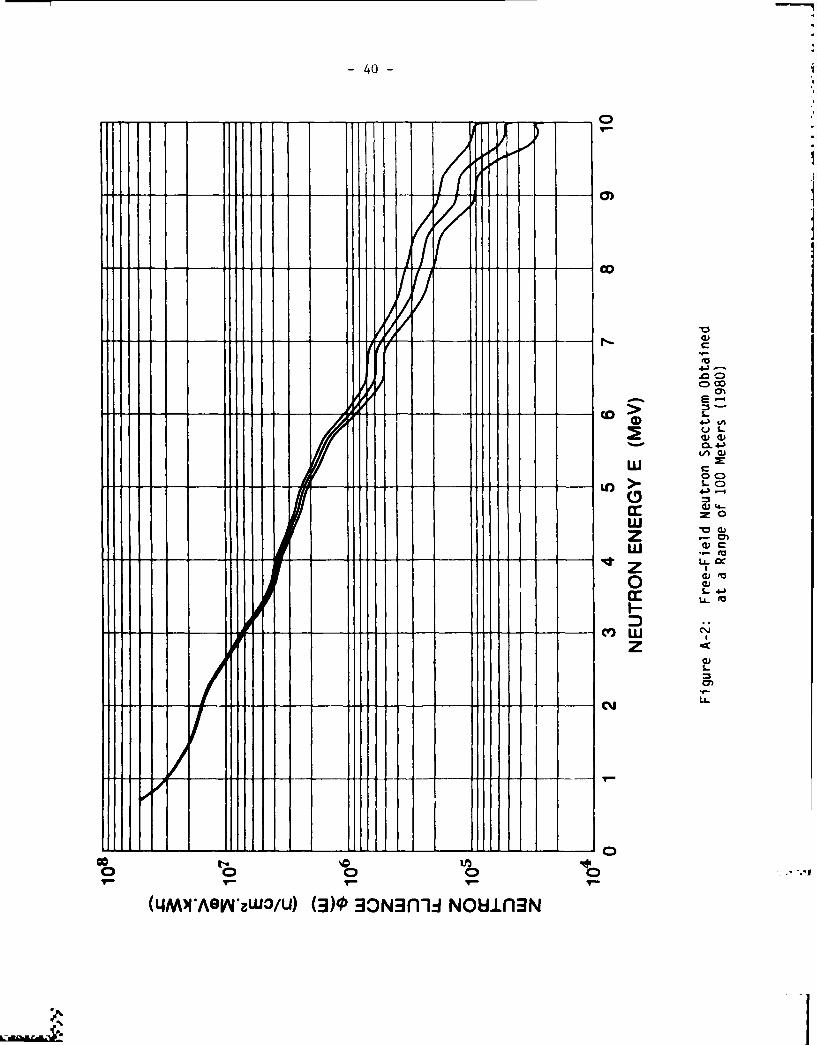
Neutron spectra obtained experimentally at APRD by DREO during theperiod 1980 to 1982 inclusive are shown plotted semi-logarithmically on thefollowing pages. Only those data recorded by the NE-213 spectrometer areshown, in particular neutrons between 600 KeV and 10 MeV. Three curves areshown on each graph; a central curve corresponding to the best estimate ofthe neutron fluence and two others indicating the range within which thereis a 68% probability (± one standard deviation) of finding the actualneutron spectrum, as estimated by DREO unfolding techniques. Note that thisuncertainty does not reflect the possible error attributable to reactorpower reproducibility, currently estimated to be ± 2%.
Conditions under which these spectra were obtained are tabulatedbelow:
FIGURE RANGE YEAR TEMPERATURE PRESSURE HUMIDITY AIR DENSITY (meters) (°C) (mBar) (% RH) (g/litre)
A-1 15 1980 17 1025 43 1.225A-2 100 1980 13 1021 78 1.236A-3 170 1980 13 1021 78 1.236A-4 179 1981 14 1032 58 1.234A-5 260 1981 15 1022 58 1.232A-6 300 1980 13 1021 78 1.236A-7 400 1980 10 1025 50 1.260A-8 1080 1980 16 1023 62 1.228A-9 1080 1981 13 1011 58 1.229A-1O 1080 1982 29 1015 74 1.157
All measurements were made with the reactor operating outdoors and atits maximum height of fourteen meters; with the exceptions of A-i for whichboth core and detector heights were 5.34 meters, and A-4 and A-5 duringwhich the reactor was located inside and at the centre of its aluminum silo,at a heifht of fourteen meters.
V...r-;-
," r = " • " ° .• . , # -." . = " " " m - • m" . " W - ." . " ° " %' " ' " ° " " " " " "° " "
" ' ' % " ' ' .o % . % ,. % . % .. '.. % . . % . ' . " . . ' . .".- % o, •. % . %
'
"
-39-A
0 0.
100
CD )co
C^. 4.)
PrO 00C- &- '-
4.)
w
0~ LA
n.L
cr)woz
* I4
LL-
(4MM*GY~zO/U)(3)030N~-IJ obum
-40-
00)
000
co~
0 4)AV) >
wL-0
zMW
It z LL
0L JLL- -
ZZS
41-
_ 0
00 000.
000
C)o
00 CD
crWLz
0 L4-J
z
0.
LL
(4MXAGV'awOU) 3)0 0N~1.A ohiLn3
-42-
00
-4s
L
a: 0)4-
w
00~
CC)-T-H(4MM*AGY'zwD/w WO 30plANouEI
-43.11
0.0
00
"o.
.44-)
LO C)C
.4a:' 04-
0'
'I-r 4-).0
+U L
C, _._000
.4.4004 -- 1
(4M'AG.4*/U (3) 30Nn-1A Nbu
-44-9
I 141
,it Z
a'aa-.,
CM LL.
H il l I I I
(tM'GV.W3U 303N,-- oa
91 -45-
CDc
0 1..LOL
Wrw
0)
ccSLL.
*~ ~~ l- *
(LIM4*AGVV 3wDfU) (3) 30N3nlJd NouLn3lN
* J.* - 46 -
Go
W
0- a
a: W 4-
0 LL- r
0 afu
00
w Z *va.'200
(4M'AG~z3/U (30 0N~-l- Nbi.n3
-47-
co
000
4j -
CD
Eu
00
W C)
= 0
zZ
Li.
00
-4 00
.40
000o.
Ji lI4
CLi
(4MNAGV~~uD/) (30 30~n-11 No4..
4Al
* -48-
.. 4
OD
000
4-)
4, 'U 44.-
4-) a--
C
w~ Ec0000
w
Uz a
4-A)
z4m)- "a-,
4J(L
* eq 0
a: 4m)
*~~~~4 -4-.. . 44*~~~9~~9 4-~4 41 .**.*
- 4 9 - ..
'-.
-q
a..'..
APPENDIX B -PLOTTED FREE-FIELD GAMMA-RAY SPECTRA MEASURED AT APRD
'ad..
* Sw
W-' ,.-,. '.. ' Jw,".W," ","'-,"- ,e','"", " ,"'" "" . ", . - """"""""""""" - - .
W' L €"
, # - • " "L' L,"[ " " ""I % w' '"W"' . '-% " % " "w ". ,% . " %,,", % . "- " . % "...°- '
- 50 -
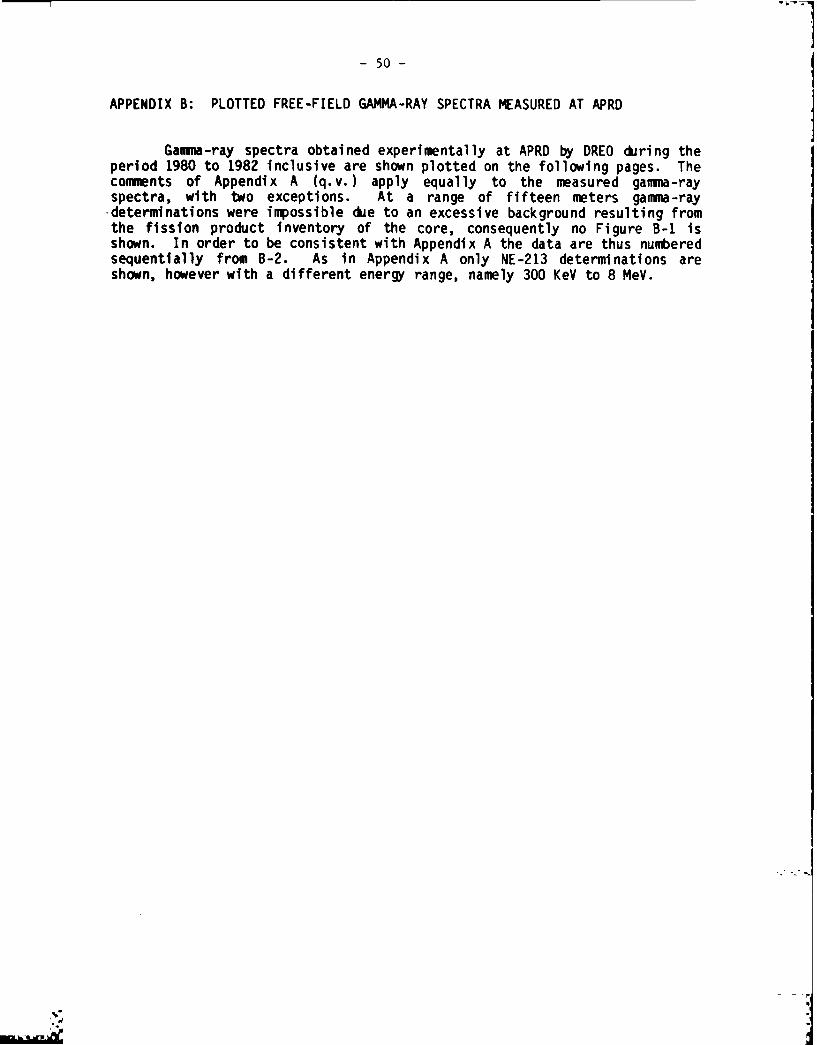
APPENDIX B: PLOTTED FREE-FIELD GAMMA-RAY SPECTRA MEASURED AT APRD
Gamna-ray spectra obtained experimentally at APRD by DREO during the period 1980 to 1982 inclusive are shown plotted on the following pages. Thecomments of Appendix A (q.v.) apply equally to the measured gamma-rayspectra, with two exceptions. At a range of fifteen meters gamma-ray-determinations were impossible due to an excessive background resulting fromthe fission product inventory of the core, consequently no Figure B-i isshown. In order to be consistent with Appendix A the data are thus numberedsequentially from B-2. As in Appendix A only NE-213 determinations areshown, however with a different energy range, namely 300 KeY to 8 MeV.
J
4..-
4.-,'.:i
.
- .;..--
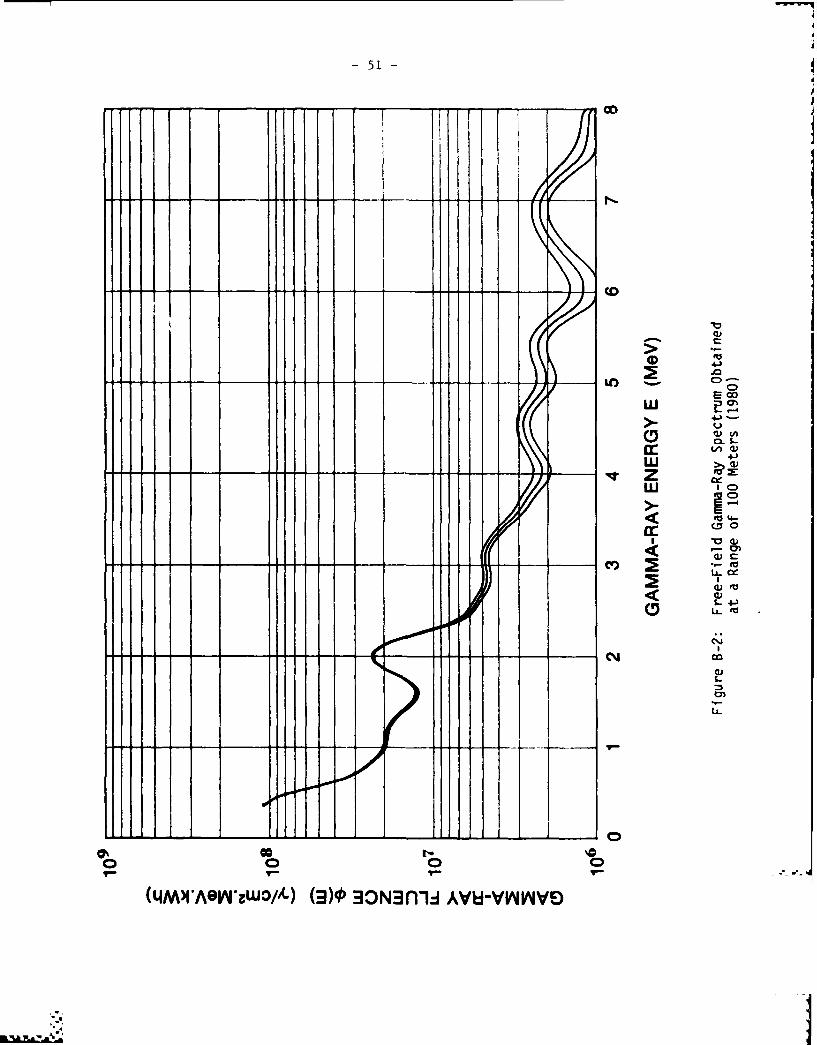
.4 -51-
*~L CD---C
co
4--w t.44
wU
to
_ _~~r t r( o
00 *t- to
00 00
(4M'AIN~wO/0 (34-0 30nm vumm
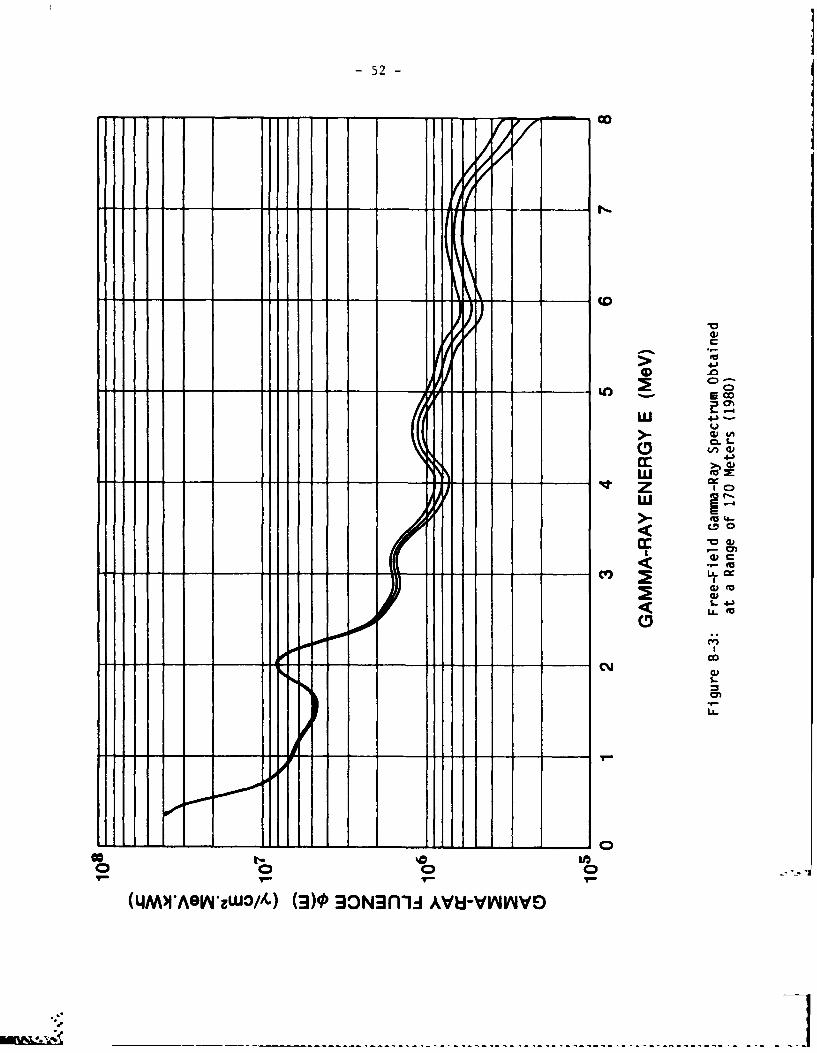
-52-
CCD
w 0m L
CM)
.4Z 0
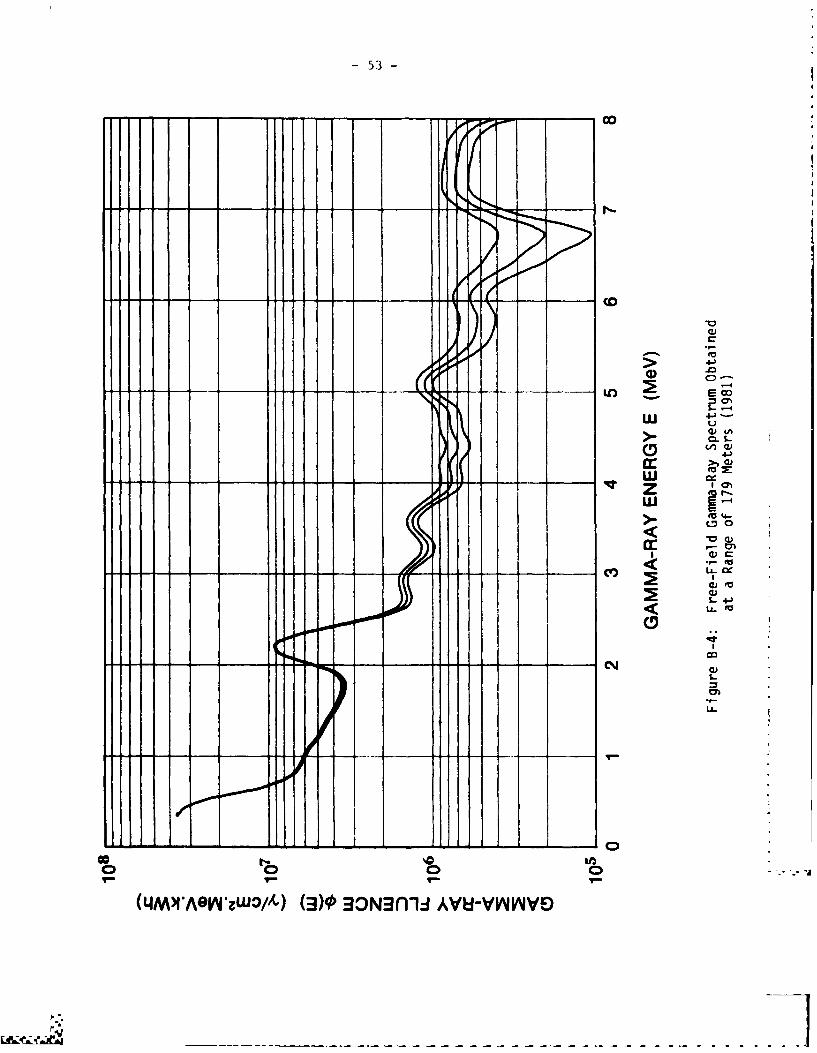
Li - - -. -o r' . W W. W - a . .
-53-
00
_ _4
wIV t
00~
tO 4-
CIO < - ce
0) 0)U-t
L-U
000
0)
4E~ML
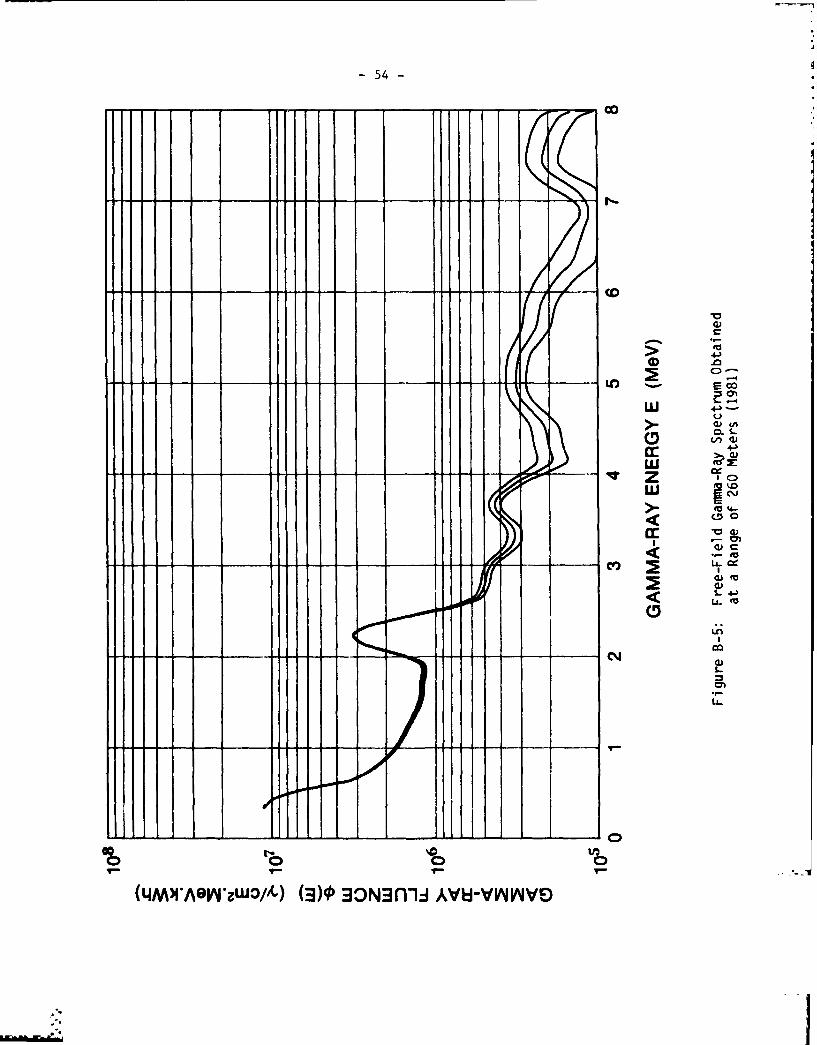
-54-
,00
44
CCA
0.cc:
__T --
to
IL.
-S0.
IAII
(4MAi*s./- 30 0~-,vuv~qE
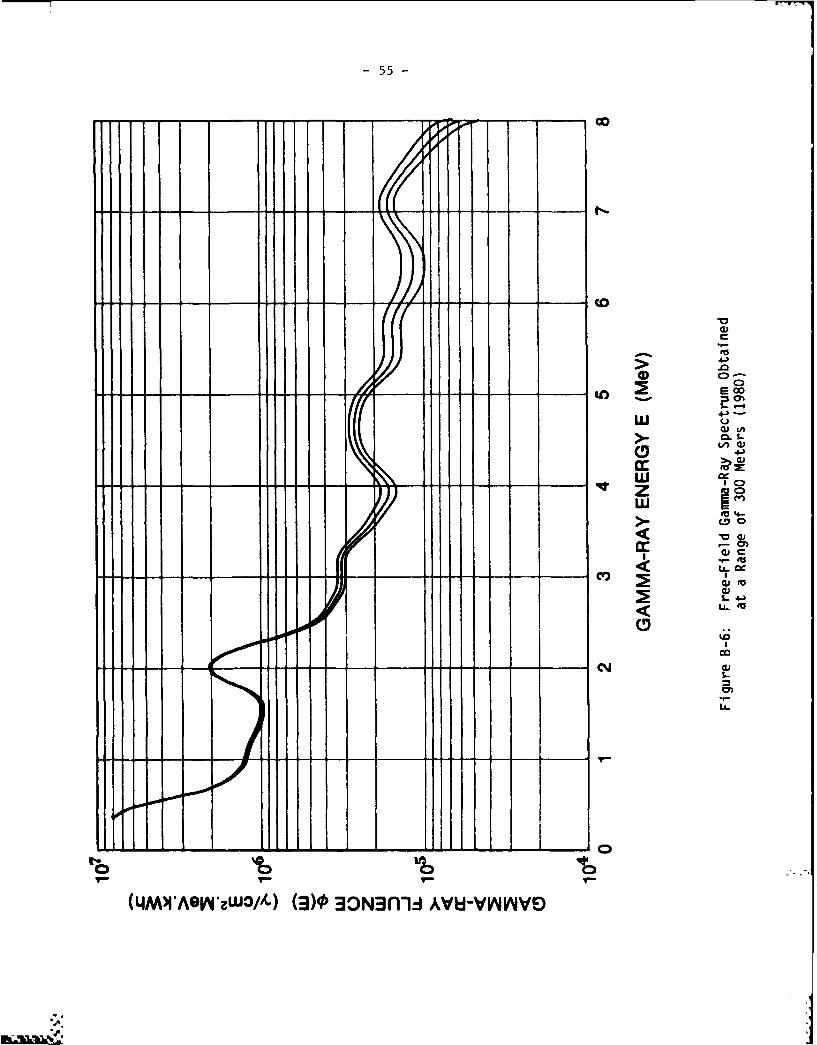
:..._ -- -::"-
-55-
Go
000
,>-- ¢l %-
N.*.
-
~" V). -n ,-,
0
1%
,,go so
if as
O..L
(----.
4l
~~(4MM*'AOV4'zw3/k) (3)0 30N= nu-,&vu=-vINtvy vyvE-)
N.''-.w
" . " . . . ¢ ' - -,. - .-- ; - - - - ,- . - . . .. . ....-. . . ,-.-.-
) .
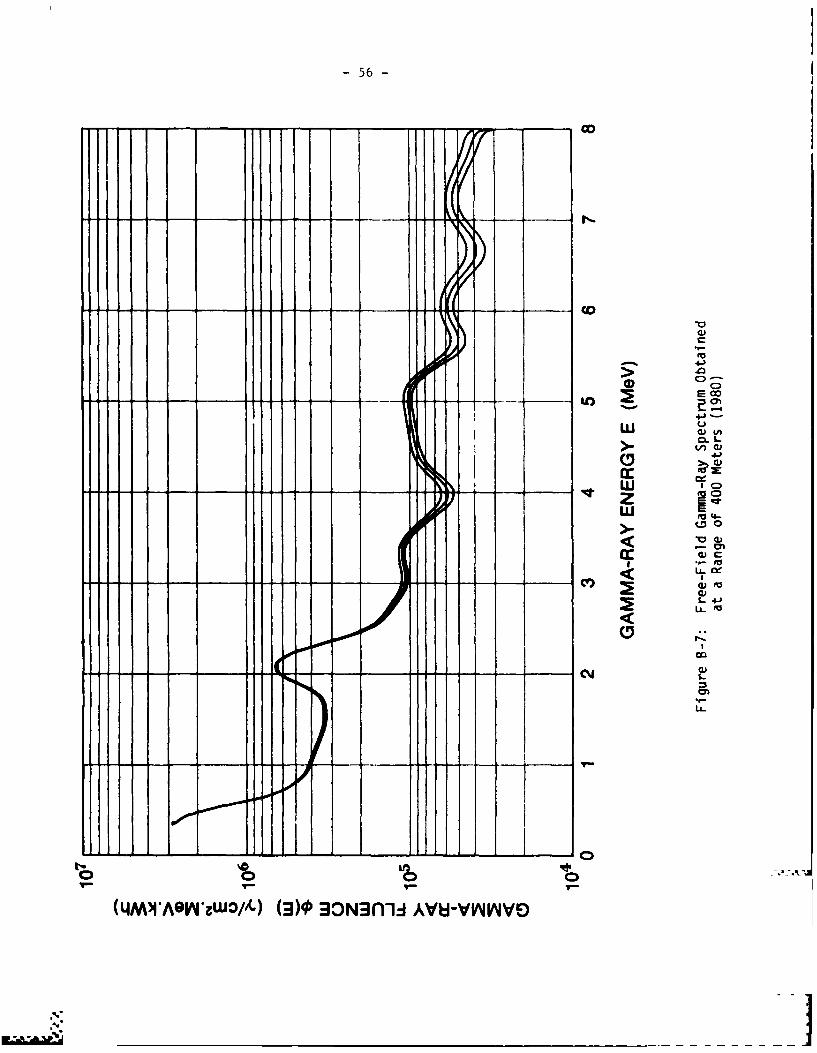
-56-
-=4 00 CD0
U))
0.
.
S- 4J
%. CM
,0000 000
loor___'9~z3- (3_0 30_-_vuv~vE
__ _ _ _'
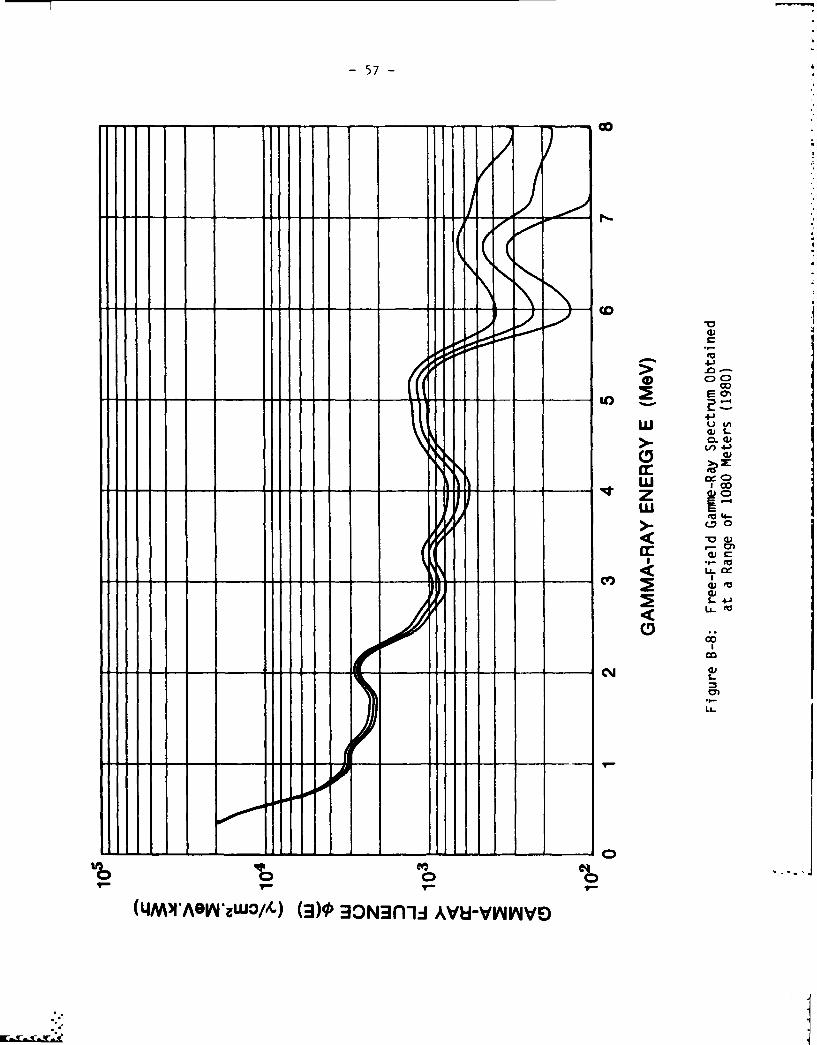
-57-
.4..1
.4. --. -
0-40
0
a: z
4...3
-~~~L to - - -
00,c
4C4
(IMM V'au/. (303Nnli&uvyqE
__ __-cv
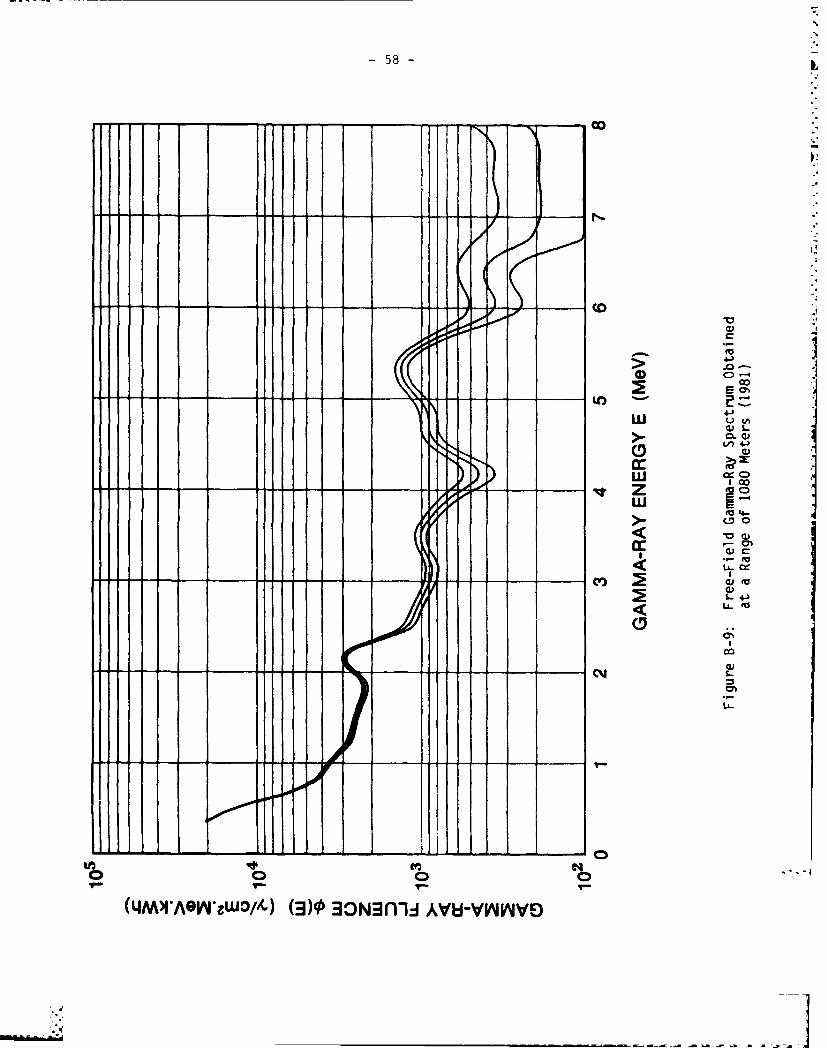
-~~ -58--9
C: -
Coo
On 4
a:)CD)(I!c
* J~.___CD
fO -
s- 40AM f
Im
-4MAV~w/- (3- -O~~ Avum
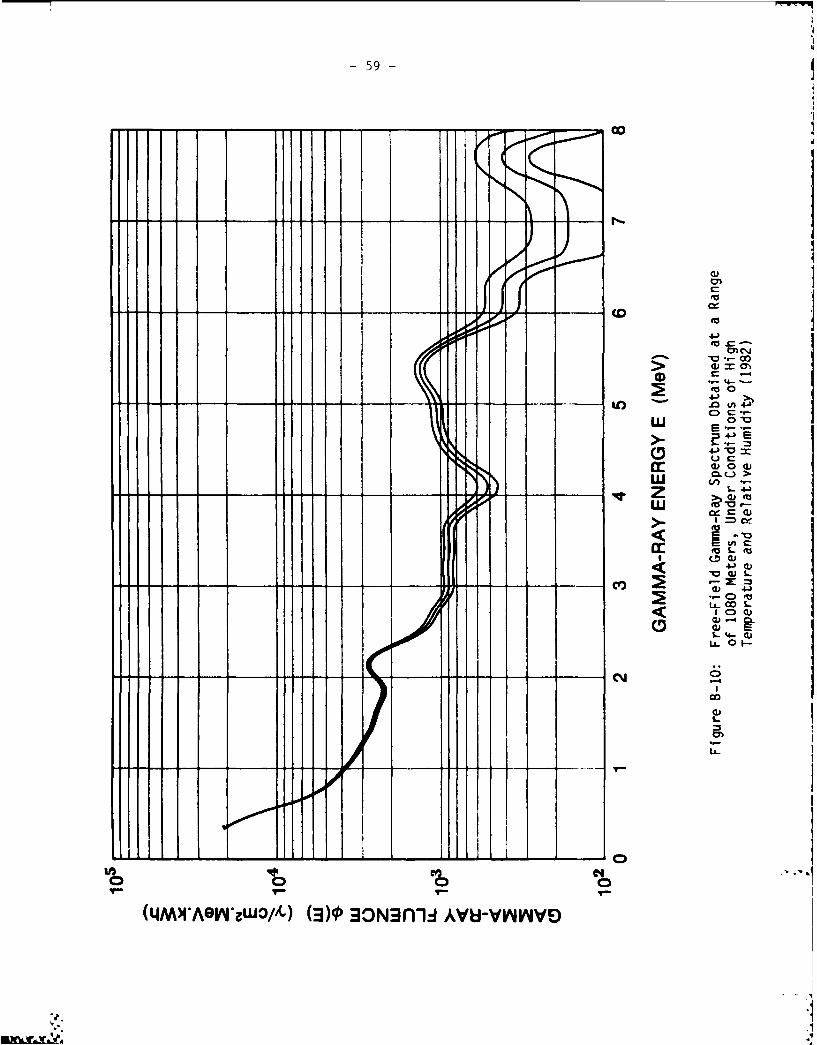
4J)
0~g C0 .
C) 00
(D 0 4w.C5.-.
gII.I
p C
00SL 4.- aj
oooL U- 0k
____ ___ __ CV
3 3,9 o
cm
ooooL
V _ _ _- - ----- -~-- -- 64
(4MAG4aW' WO3NniAv-vnE
-61-
JlI
APPENDIX%
LISTD FIE-GRUP EUTRN SPCTR
%1
e-4 .e
-62-
APPENDIX C: LISTED FINE-GROUP NEUTRON SPECTRA
The following listed data comprise neutron spectra as analysed byDREO unfolding techniques corresponding to the plotted data of Appendix A.Data obtained by the NE-213 detector are shown in a multigroup formatstarting at 600 KeV and continuing to 10 MeV in 200 KeV increments. Thesedata are normalized such that the applicable units are "neutrons percm2 .MeV.KWh" within each energy group. Two additional quantities are alsolisted for each spectrum, labelled "Thermal Flux" and "Epithermals". Thesecorrespond to estimates of the total neutron fluence between 0 and 0.5 eVand between 0.5 eV and 600 KeV, respectively. As such the units aredifferent and correspond to "neutrons per cm2 .KWh" between the previously-specified energy limits. This difference in normalization is taken intoconsideration in the calculation of integral fluence listed in the lastcolumn.
The thermal neutron fluence was measured using a pair of matchedboron-triflouride counters, one of which was lined on the outside with 0.102cm of cadmium. The cadmium-lined counter is insensitive to neutrons below0.5 eV (50% transmission probability) and consequently monitors neutronsonly above this energy. The difference in recorded counts between the twodetectors is thus a measure of neutron fluence below 0.5 eV. The thermalneutron component was assumed to be Maxwellian in spectral shape and inequilibrium at 200C. Conversion to thermal neutron fluence was achieved bydividing by the mean thermal-neutron detection efficiency, as determined byintegration of the energy-dependent counter efficiency (including theinfluence of the cadmium liner) over the above-mentioned Maxwellian.neutronThe epithermal neutron fluence is estimated by assuming that theneutron spectrum between 0.5 eV and 600 KeV may be represented by aparametric equation of the form:
O(E) A-Ep
magnitude A and power P are uniquely determined by simultaneouslyTherq n mhagtude Ap owmetrc pecarube uniquel eteinedysiultantheo_.
requiring that the parametric spectrum be continuous with the NE-213determination at an energy of 600 Key, and that the counting-rate recordedby the cadmium-lined BF3 detector is reproduced when the energy-dependentdetection efficiency is integrated against the parametric representation. Although this formulation ignores all structure present in the neutron spectrum below 600 KeV, integral quantities such as kerma or fluence areadequately determined in well-moderated neutron environments, such as existat APRO.
For the ten neutron spectral determinations at APRO, the followingparameters A and p were recorded:
hN N '
* .% ~ q~.**.*.6*~~.,'-'6*
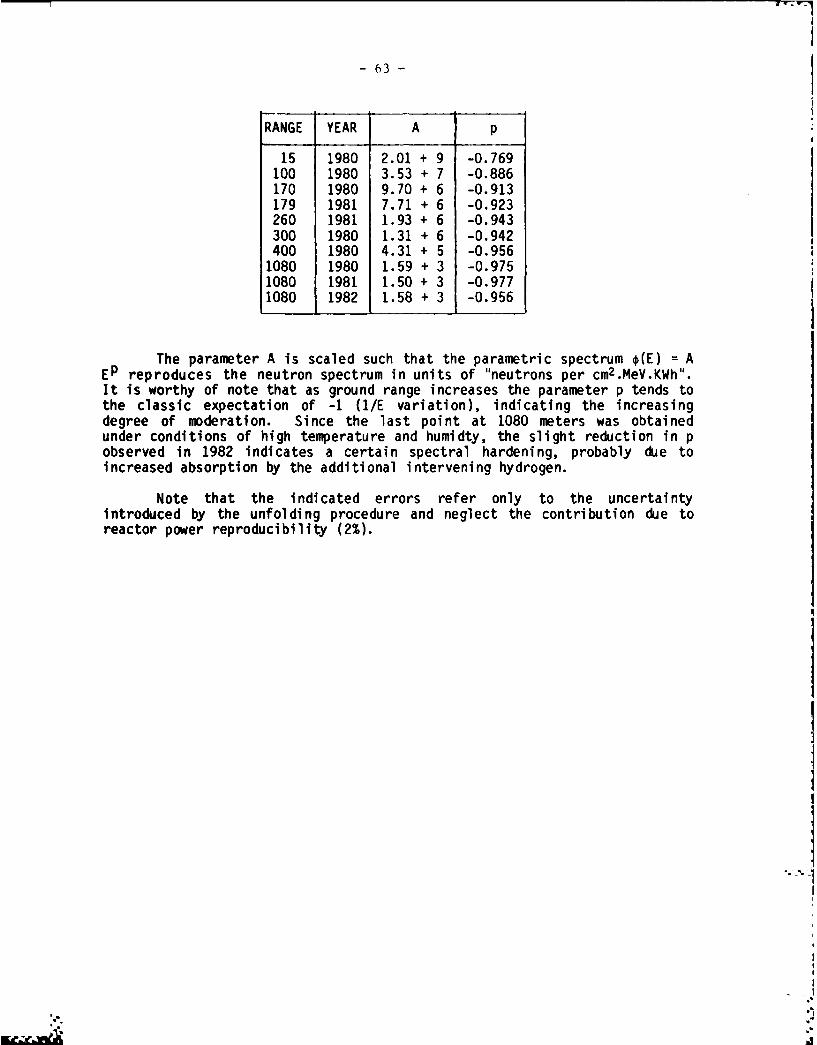
63
RANGE YEAR A p
15 1980 2.01 + 9 -0.769100 1980 3.53 + 7 -0.886170 1980 9.70 + 6 -0.913179 1981 7.71 + 6 -0.923260 1981 1.93 + 6 -0.943300 1980 1.31 + 6 -0.942400 1980 4.31 + 5 -0.9561080 1980 1.59 + 3 -0.9751080 1981 1.50 + 3 -0.9771080 1982 1.58 + 3 -0.956
The parameter A is scaled such that the parametric spectrum O(E) = AEP reproduces the neutron spectrum in units of "neutrons per cm2.MeV.KWh".It is worthy of note that as ground range increases the parameter p tends tothe classic expectation of -1 (lIE variation), indicating the increasing degree of moderation. Since the last point at 1080 meters was obtainedunder conditions of high temperature and humidty, the slight reduction in pobserved in 1982 indicates a certain spectral hardening, probably due toincreased absorption by the additional intervening hydrogen.
Note that the indicated errors refer only to the uncertaintyintroduced by the unfolding procedure and neglect the contribution due toreactor power reproducibility (2%).
*1
'
* .'-.
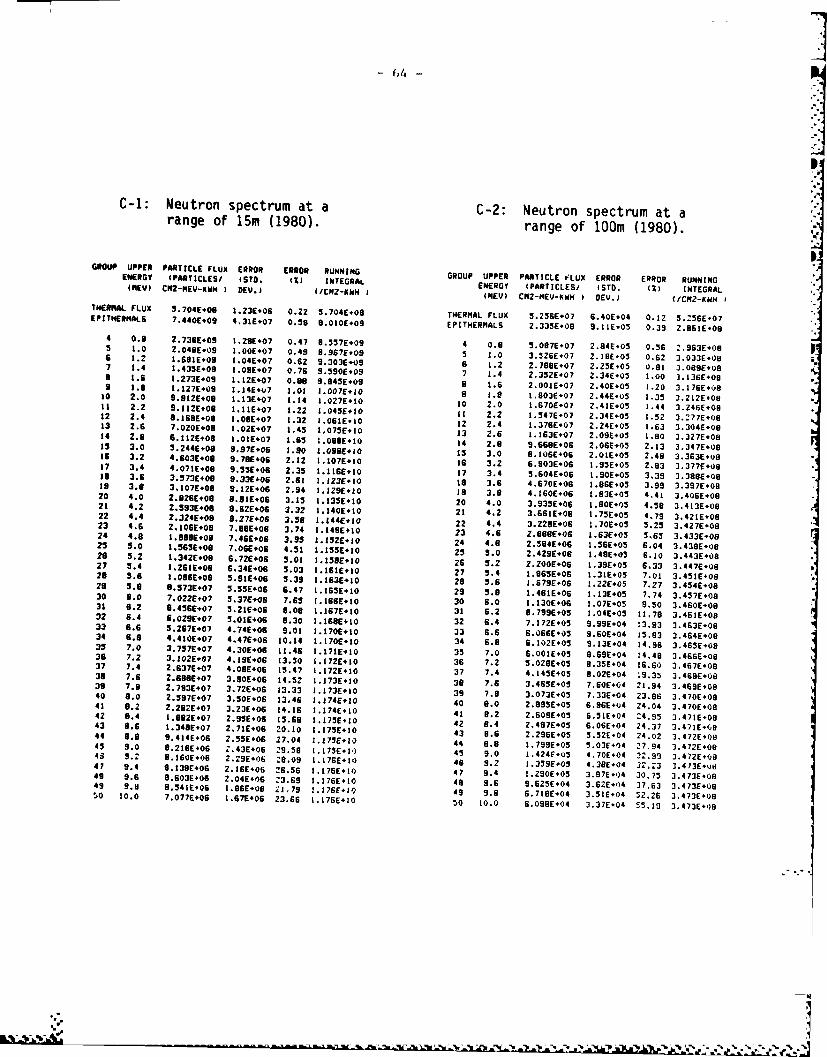
,".
C-i: Neutron spectrum at a C-2: Neutron spectrum at arange of 15m (1980). range of lOOm (1980).
"N ER TL ERROR ERROR RUNNING GROUP UPPR PARTICLE LUX ERROR ERROR RUNNINGENERGY (PARTICLE"E (STD. (2) INTEGRAL TERR
-. V C R - E - W E N RG (P RTV .E) (S TD . (; ) IN TE G R A L . -(NEI N2PqE-5g4 0E.) /62-NH(NEV) CM2-IIEV-6WH ) 0EV.) (/CRZ -K6 ITHEN ML FLUX 5.7046.09 1.23E+06 0.22 5.704E09 THERNAL FLUX 5.256E+07 6.40E*04 0.12 5.256E.07 "EPITHERNALS 7.440E#09 4.316*07 0. 9 9.010E+09 EPITHER PLS 2.33 E 0 9 9.1 605 0.39 . 6 I6 07
4 0.8 2.7366+09 1.29E*07 0.47 0.537E+09 4 0.9 5.087607 2.84E-05 0.56 2.9636.095 1.0 Z.048E09 1.00E*07 0.49 9.967E+09 5 1.0 3.SZ6E.O7 2.29E+05 0.62 3.033E.086 (.2 1.691E,09 1.04E+07 0.62 9.3036.09 6 1.2 2.790E.07 2.25E*05 0.9 3.099E*0o7 1.4 1.435E*09 2.096*07 0.76 9.590E+09 7 1.4 2.352E*07 2.34E+05 1.00 3.036E08 10 1.6 2.273E-09 1.12E+07 0.8e 9.845E.0S a t.6 2.00IE*07 2.40E+05 1.20 3.I76E.,)e9 1.3 1.127E*09 1.14E*07 1.01 1.007E.10 9 1.8 1.6036-07 2.44E05 1.35 3.212E-0810 2.0 9.9126.09 1.13E+07 1.14 1.027E+10 10 2.0 1.670E07 2.41E05 1.44 3.246E06It 2.2 9.112E#09 I.21E07 122 1.045E10 It 2.2 1.547E-07 2.34Ee05 2.52 3.2776.0822 2.4 8.169606 1.08E+07 1.32 1.061E10 2 Z.4 1.376E+07 2.24E+05 1.63 3.3046.0823 2.6 7.020E08 1.02*E07 1.45 1.075E*]0 13 2.6 1.163E07 2.09E.05 1.80 3.327+06.214 2.9 6.112E.01 2.01E07 1.65 1.080E+1O 14 2.0 9.66@E*06 2.06E+03 2.13 3.347E*0615 3.0 5.2446E*0 9.97E+06 2.10 .09E.20 25 3.0 8.106E606 2.016+05 2.48 3.363Ev'II 6 3.2 4.603E.06 9.7906 2.12 1.107E-10 16 3.2 6.903E-06 1.95E*05 2.83 3.377E+0827 3.4 4.0726.09 9.5E 06 2.35 1.116E.2O 27 3.4 5.604E+06 1.90E05 3.39 3.388E+08II 3.6 3.573E.09 9.33E406 2.61 1.123E6.0 19 3.6 4.670606 l.86E.10 3.99 3.397E.0819 3.6 3.107E-09 9.12E06 2.94 1.J29E.10 29 3.8 4.160E.06 1.03E.- 4,4 3.406E.020 4.0 2.8ZGE+06 8.914E06 3.3 1.135E+1O 20 4.0 3.935E*06 I.SOE+0S 4.59 3.4236.0-22 4.3 21 4.2 3.661E06 1.75E05 4.79 3.421E+0822 4.4 2.324E[08 9.27E+06 3.56 1.144E410 22 4.4 3.228E06 1.70E+05 5.25 3.427E.0023 4.6 2.106E+08 7.8E+06 3.74 1.149E-0 23 4.6 Z.699E*06 L.63E05 5.65 3.433E-0824 4.9 1.09060 7.46E+06 3.9, 1.1,ZE.20 24 4.6 2.584606 1.56605 6.04 3.438E.0825 5.0 1.56E06 7.06E+06 4.51 1.135E10 25 5.0 2.429606 1.48605 6.10 3.443E 08526 .2 1.342609 6.72E06 5.01 1.15SE.20 26 5.Z 2.2006.06 1.39605 6.33 3.44760827 5.4 1.261E.09 6.34E+06 5.03 1.161E-10 27 5.4 2.965E 06 2.316*05 7.01 3.4516.0829 5.6 1.096E.00 5.91E+06 5.39 1.163E.10 29 5.6 1.679E06 1.22E.05 7.27 3.45460829 5 .573[.07 3.55E*06 6.47 1.165E,10 29 5.8 1.461E.06 1.136.05 7.74 3.457E0830 6.0 7.022E,07 3.37E406 7.65 1.166E+10 30 6.0 1.130E.06 2.076+05 9.50 3.4606-09 31 6.2 9.4566.07 5.216.06 9.09 1.167E+10 31 6.2 8.7996+03 1.046*05 11.79 3.416E+0832 6.4 6.02!W.07 5.026406 8.30 2.169E10 32 6.4 7.1726*05 9.99E04 13.93 3.4636.0933 6.6 4.267607 4.74E06 9.01 1.1706.10 33 6.6 6.066E+05 9.606+04 15,93 3.464E0834 6.0 4.4206,07 4.4706 10.14 1.170E10 34 6.8 6.102E+05 9.136*04 14.96 3.465E08 35 7.0 3.737E#07 4.30E*06 11.46 1.171E10 35 7.0 6.001E05 9.696*04 14.48 3.466E0036 7.2 3.1026#07 4.1E406 13.50 1.172E.10 36 7.2 5.028E05 9.356*04 16.60 3.467E+0837 7.4 2.637607 4.09£ 06 15.47 1.172E10 37 7.4 4.1456.05 8.02E+04 19.35 3.4683508
30 7.6 2.688E07 3.90E-06 14.52 1.173E.0 39 7.6 3.465E.05 7.606+04 21.94 3.4696+0839 7.0 2.793607 3.72E406 13.33 1.173E10 39 7.9 3.0736.05 7.336*04 23.96 3.4706*0940 8.0 2.5976,07 3.506*06 23.46 2.2746,10 40 9.0 2.95605 6.96E04 24.04 3.470E*0941 9.2 2.282E,07 3.23E*06 24.16 1.174610 41 9.2 2.609E+05 6.16E*04 24.95 3.471E0842 9.4 1.962E,07 2.9E+06 15.66 1.175E+10 42 6.4 2.4076*05 6.06E04 24.37 3.4716.084 3 8 .6 1 .3 48 E *0 7 4 21E 0 6 .41 Z1.1 70 E6 * 4 4 . 7 ,4 1E 044 9.6 2.71E+06 20.10 1.1756*20 43 9.6 2.296E+05 5.52E*04 24.02 3.472E0844 9.9 9.414E+06 2.55E+06 27.04 1.173E10 44 9.8 1.799E+05 5.03E*04 27.94 3.472E*0845 9.0 9.2166*06 2.436*06 29.59 1.2756*20 45 9.0 1.424E.05 4.70E04 32.99 3.472E094S 9 9. 9.1606 2.29E606 :e.09 1.176E.0 46 9.2 1.339605 4.386E*04 3Z.23 3.413Eu89 .1389E06 Z.16E-06 :6.56 1.176E*10 47 9.4 1.290E-05 3.97E-04 30.75 3.473E60R . ' 4 9 9 . 6 . 0 E 0 . 490 3 6 7 E 1 4 9 9 .6 9 .6 2 3 E * 0 4 3 . 6 E 0 4 3 7 ,6 3 3 .4 7 3 E + 0 86
49 9. 8 9.5416*06 1.966*06 21.79 1.176E.10 49 9.8 6.729E04 3.51E04 52.26 3.47360950 10.0 7.077E*06 1.67E406 23.66 1.17GE*0 50 10.0 6.098E04 3.37E04 55.19 3.473E+,)8
re
I.-
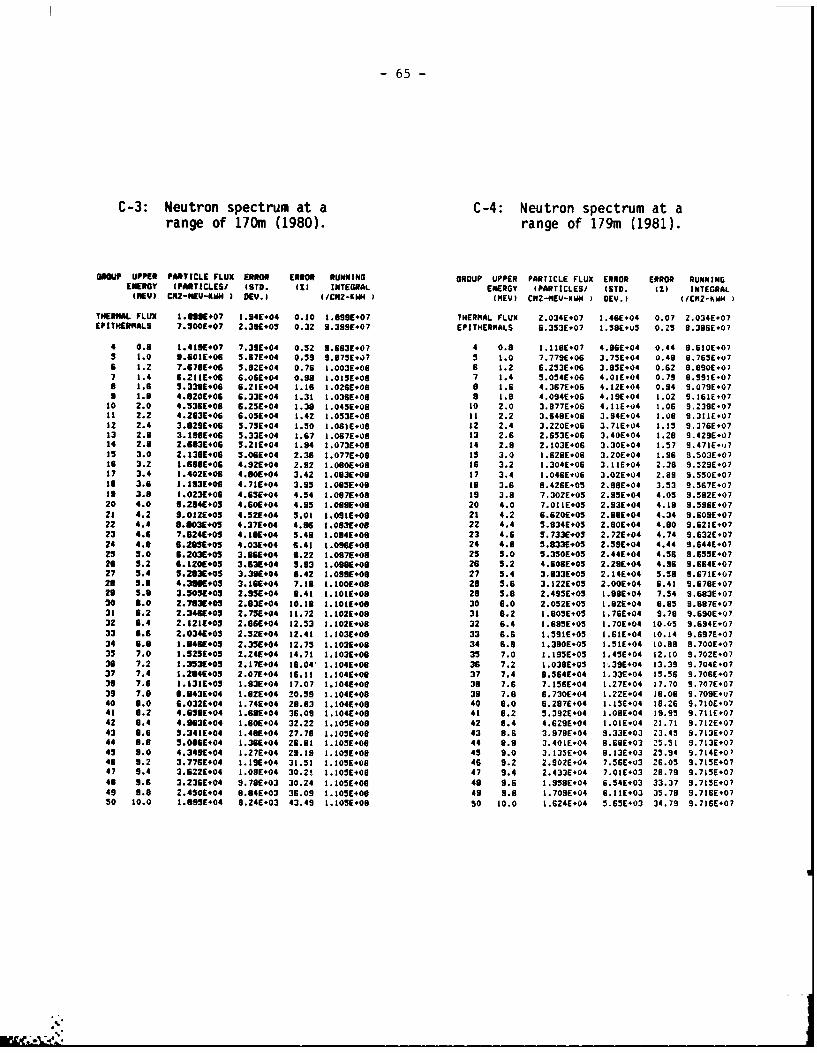
-65-
C-3: Neutron spctu at a C-4: Neutron spectrum at arange of 170m (1980). range of 179m (1981).
~ GOPUPPER PARTICLE FLUX ERROR ERROR RUNNING GROUP UPPER PARTICLE FLUX ERROR ERROR RUNNINGENERG:Y IPARTICLESI (STD. (1) INTEGRAL ENERGY (PARTICLES/ ISTD. MX INTEGRALtHEV) CNZ-NEV-KNM ) IV.) (ICN2-KdH I(HEV) CMZ-9IEV-11d ) DEV.) (/CK2-KhdI
HERNAL FLUX 1.89E+07 1.94E+04 0.10 1.898E*07 THERM4AL FLUX 2.034E.07 1.46E-04 0.07 2.034E.07EPITHERHALS 7.3006.07 2.39E+03 0.32 9.399E.07 EPITI4ERMALS 6.353E.07 1.S8E*U5 0.25 8.386E.07
4 0.8 1.4116.07 7.39E+04 0.52 9.683E+07 4 0.9 1.118E+07 4.86E-04 0.44 9.610E.075 1.0 *.601E+06 3.67E+04 0.59 9.875E+07 5 1.0 7.779E.06 3.75E+04 0.48 8.765E-u76 1.2 7.6706.06 3.02E+04 0.76 1.003E+00 6 1.2 6.2536.06 3.8SE.04 0.62 8.690E-077 1.4 S.ZIIE.06 6.06E*04 0.98 1.015E+o9 7 1.4 5.054E.06 4.01E#04 0.79 8.991E.078 1.6 5.3386.06 6.21E*04 1.16 2.0266.0S 9 1.6 4.367E+06 4.12E+04 0.94 9.079E.079 1.9 4.820E#06 6.33E*04 1.31 1.036E+06 9 1.9 4.094E-06 4.19E#04 1.02 9.161E-07
10 2.0 4.536E.06 6.25E+04 1.38 1.045E+08 t0 2.0 3.877E+06 4.11E-04 1.06 9.23SE.0711 2.2 4.213E.06 6.03E#04 1.42 2.053E.08 if 2.2 3.648E.06 3.94E+04 1.08 9.311E-07
22 2.4 3.029E*06 3.75E+04 1.50 1.061E+08 12 2.4 3.2206.06 3.71E+04 1.15 9.376E.0713 2.6 3.199E#06 5.33E.04 1.67 1.067E.00 13 2.1 2.653E-06 3.40E+04 1.28 9.429E-0714 2.8 2.6836.06 5.21E.04 1.84 1.073E+06 14 2.8 2.1036.06 3.30E.04 1.57 9.471E.,0is 3.0 2.1396.06 3.06E#04 2.38 1.077E+06 1s 3.0 1.628E+06 3.206*04 1.96 9.503E*07is 3.2 1.688E+06 4.92E404 2.92 1.080E.09 16 3.2 1.304E.06 3.11E+04 2.38 9.529E.0727 3.4 1.402E.06 4.90E+04 3.42 1.093E+06 17 3.4 1.046E+06 3.02E+04 2.89 9.550E.07is 3.1 1.193E+06 4.71E*04 3.95 1.083E+09 19 3.6 8.426E.05 2.986*04 3.53 9.567E.07is 3.8 1.023E+08 4.63E+04 4.54 1.087E+08 19 3.8 7.302E+03 2.95E+04 4.05 9.582E+0720 4.0 8.284E.05 4.601*04 4.95 I.089E.0S 20 4.0 7.011IE+05 2.936*04 4.18 9.5966.0721 4.2 9.012E.05 4.3ZE.04 5.01 1.0916.08 21 4.2 6.620E.05 2.686.04 4.34 9.609E+07 22 4.4 8.6031.05 4.3?E.04 4.86 1.093E#06 22 4.4 5.9346.05 Z.80E+04 4.90 9.621E.0723 4.6 7.624E.03 4.19E#04 5.49 1.084E.06 23 4.6 5.733E+05 2.726*04 4.74 9.632E-07 ~ 24 4.8 6.295E+05 4.03E+04 6.41 1.0966.08 24 4.8 5.833E.05 2.59E+04 4.44 9.644E+07
25 5.0 8.203E.05 3.86E#04 6.22 1.097E+00 25 5.0 5.350E+05 2.44E+04 4.56 9.655E+0726 5.2 6.1201.05 3.63E*04 5.83 1.098E.00 28 5.2 4.606E+03 2.29E+04 4.96 9.664E.0727 5.4 5.283E.05 3.311404 6.42 1.099E+06 27 5.4 3.8336.05 Z.14E*04 5.58 9.671E-0728 5.8 4.3166#03 3.16E.04 7.18 1.1006.08 20 5.6 3.122E+03 2.00E#04 6.41 9.6796.0726 5.8 3.505E+05 2.95E#04 0.41 1.101E+08 29 5.9 2.495E+05 1.88E+04 7.54 9.683E-0730 6.0 2.7813605 2.83E+04 10.18 1.101E+08 30 6.0 2.032E+05 1.82E-04 9.95 9.6876.0731 8.2 2.3466.05 2.75E#04 11.72 1.102E+08 31 8.2 1.805E+05 1.76E+04 9.79 9.690E+0732 6.4 2.1211.05 2.6E04 12.53 1.102E+08 32 6.4 2.6956.05 2.706*04 10.05 9.694E+0733 1.6 2.0346.05 2.526404 12.41 1.103E*08 33 6.6 1.5916.05 1.61E-04 10.14 9.697E.07
1.1 1.8481.05 2.33E*04 12.75 1.1036.08 34 6.9 1.390E+03 1.516*04 10.99 9.7006*07 7.0 1.323E.05 2.24E*04 14.71 1.103E.08 35 7.0 1.1956.05 I.45E*04 12.10 9.7026.07
36 7.2 1.353E.05 2.17E.04 19.04' 1.104E#09 36 7.2 1.036E+03 1-.39E*04 13.39 9.7046+0737 7.4 1.2046405 2.076404 16.11 1.104E+09 37 7.4 0.564E+04 1.33E+04 15.56 9.706E+0736 7.1 1.131E*05 1.93E+04 17.07 1.104E+08 39 7.6 7.156E*04 1.27E+04 17.70 9.707E.0739 7.8 6.9436.04 1.02E#04 20.59 1.104E*08 39 7.6 6.7306.04 1.Z6.04 19.06 9.7096*')740 6.0 6.0326.04 1.74E+04 29.93 1.1046.09 40 9.0 6.297E+04 1.156*04 19.26 9.710E+0742 6.2 4.658E.04 1.6@E+04 36.09 1.1046409 41 9.2 5.3926+04 1.096+04 29.95 9.711E+0742 0.4 4.8636.04 1.60E#04 32.22 1.1O5E+08 42 9.4 4.629E.04 1.01E+04 22.71 9.7126+07
43 9.6 3.341E+04 1.4K+.04 27.78 1.1051.08 43 8.6 3.979E.04 9.33E+03 23.45 9.713E.0744 1.6 5.0866.04 2.366*04 28.81 2.105E+00 44 8.9 3.401E*04 8.68E+03 25.51 9.7136.07
9.0 4.3416.04 1.27E.04 29.19 1.1056+08 45 9.0 3.135E-04 8.13E+03 25.94 9.714E*0746 9.2 3.7766.04 1.296.04 31.52 1.105E+08 46 9.2 2.902E+04 7.56E+03 26.05 9.715E.0747 9.4 3.6226.04 2.096*04 30.21 2.205E#09 47 9.4 2.4336.04 7.01E+03 28.79 9.725640746 9.6 3.2366+04 9.78E+03 30.24 1.1056+09 49 9.6 2.9596404 6.54E.03 33.37 9.715E+0749 9.8 2.450E.04 9.946403 36.09 2.105E+08 49 9.8 1.709E+04 6.116*03 35.79 9.7166.0750 10.0 1.8956.04 8.24E.03 43.49 1.1056.09 50 10.0 1.624E.04 5.656*03 34.79 9.7266*07
IIM
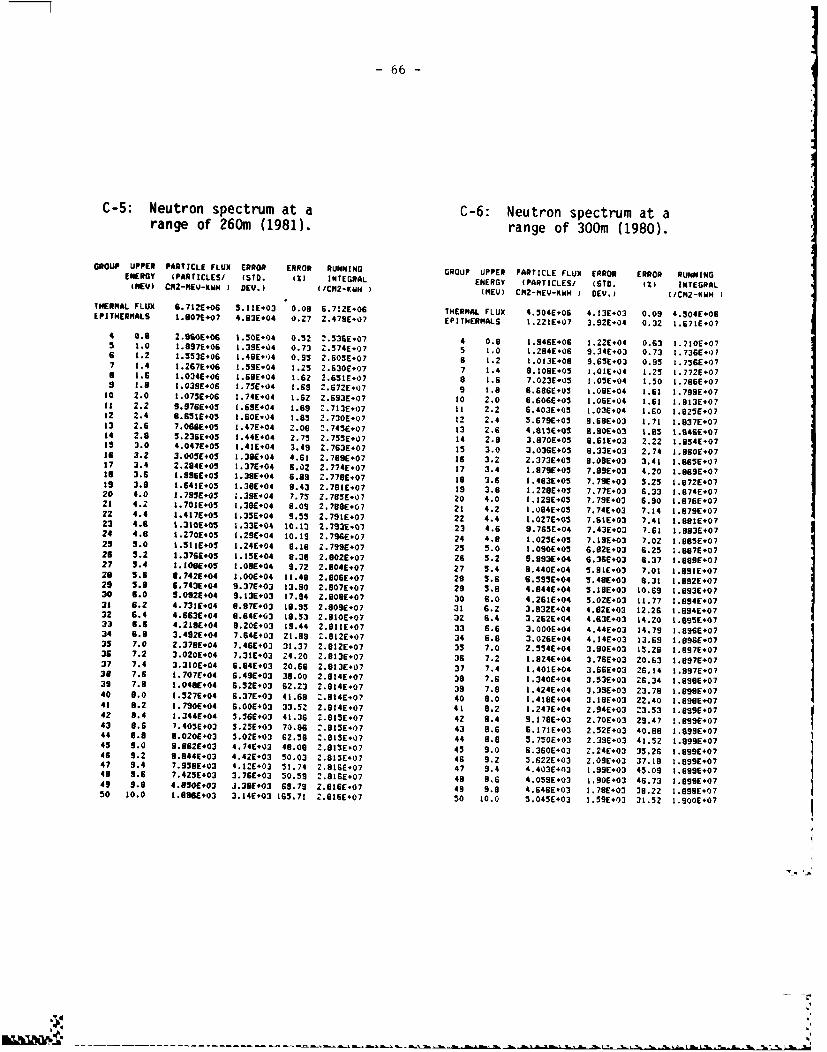
-66-
C-5: Neutron spectrum at a C-6: Neutron spectrum at arange of 260m (1981). range of 300m (1980).
GROUP UPPER PARTICLE FLUX ERROR ERROR RUNNING GROUP UPPER PARTICLE FLUX ERROR ERROR RUNNINGENERGY IPARTICLES/ (D7. INTEGRAL ENERGY (PARTICLES/ (SO. (1) INTEGRALI_E) CM2-MEV-KMN I EV.) (/CM2-KWH ) EV) CM2-fEV-KWH DEU.) (/CN2-KWH
IERMAL FLUX 6.712E+06 5.IIE.03 0.00 6.7!2E06 THERMAL FLUX 4.504E-06 4.13E+03 0.09 4.304E+06EPITHERMALS 1.907E*07 4.83E+04 0.27 2.479E-07 EPITHERMALS 1.221E07 3.92E.04 0.32 1.671E+07
4 0.9 2.960E06 1.506E04 0.52 2.536E.07 4 0.9 1.946E+06 1.22E.04 0.63 1.710E075 1.0 1.897E+06 1.39E+04 0.73 2.574E+07 5 1.0 1.284E-06 9.34E-03 0.73 1.736E+07 6 1.2 I.553E.06 1.48E.)4 0.93 2.605E07 6 1.2 1.013E606 9.65E+03 0.95 1.756E+077 1.4 1.267E06 1.59E-04 1.25 2.630E 07 7 1.4 6.108E 05 .01E04 1.25 1.772E+07a 1.6 1.034E06 1.68E04 1.62 2.6516E07 8 1.6 7.023E+05 1.05E.04 1.50 1.796E-079 1.9 1.039E#06 1.75E-04 1.69 Z.672E-07 9 1.8 6.686E05 .09E.04 1.61 1.799SE0710 2.0 1.075E+06 1.74E-04 1.62 Z.693E07 10 2.0 6.606E03 1.06E04 1.61 1.13E*07II 2.2 9.976E+05 1.69E*04 1.69 2.713E6 7 11 Z.2 6.403E-05 1.03E+04 1. 0 1.825E+0712 2.4 6.651E*05 1.60E-04 1.85 2.730E.07 12 2.4 5.679E-05 9.68E03 1.71 1.837E+0713 2.6 7.066E+05 1.47E*04 Z.08 Z.745E+07 13 2.6 4.815E05 B.906E03 1.85 1.646E-0714 2.8 5.236E*03 1.44E+04 2.75 2.755E+07 14 2.9 3.870E+05 8.61E+03 2.22 1.854E-07is 3.0 4.047E+05 1.41E+04 3.49 2.763E+07 15 3.0 3.036E+05 8.33E*03 2.74 1.860E#07Is 3.2 3.005E*05 1.38E+04 4.61 2.7696+07 i6 3.2 2.373E*05 8.06E+03 3.41 1.665E+0717 3.4 2.2946*05 !.37E+04 6.02 2.774E07 17 3.4 1.979E+05 7.9SE.03 4.20 1.869E+07II 3.6 1.9966.05 1.386404 6.89 Z.778E.07 19 3.6 1.483E*05 7.79603 5.25 1.872E+0719 3.9 1.641E+05 1.38E04 8.43 2.781E+07 19 3.9 1.229E*05 7.77E*03 6.33 1.874E-0720 4.0 J.793E605 1.396E04 7.75 2.7805E07 20 4.0 1.IZ9E05 7.79E.03 6.90 1.876E0721 4.Z 1.701605 1.38E*04 8.09 2.789E+07 21 4.2 1.094E+05 7.74E03 7.14 1.879E*0722 4.4 1.4176.05 1.35E04 9.55 2.791E*07 22 4.4 L.027E*05 7.61E*03 7.41 1.891E+0723 4.6 1.310E+05 1.33E+04 10.13 2.793607 23 4.6 9.765E+04 7.43E*03 7.61 1.893E+0724 4.8 1.2706.05 1.296.04 10.19 2.796E+07 24 4.8 1.025E+05 7.19E+03 7.02 1.985E+0725 5.0 1.511E+05 1.246.04 0.19 Z.799E+07 25 5.0 1.090E*05 6.02E*03 6.25 1.87E+0721 5.2 1.3766.05 1.15E.04 8.39 2.0026.07 26 5.2 9.9936.04 6.366*03 6.37 1.889607 27 5.4 1.100E*05 1.06E04 9.72 2.804E+07 27 5.4 8.440E#04 5.91.-03 7.01 1.991E+07 28 5.6 0.742604 1.006*04 11.48 2.9066.07 29 5.6 6.5956.04 5.48E+03 8.31 1.892E+0729 3.9 6.743E+04 9.37E+03 13.90 2.907607 29 5.8 4.8446.04 5.18E+03 10.69 1.893E60730 6.0 5.0926.04 9.136+03 17.94 2.8086E07 30 6.0 4.261E.04 5.OZE*03 11.77 1.9946+0731 6.2 4.731E+04 0.97E+03 19.95 2.809607 31 6.2 3.932E+04 4.926+03 12.26 1.894E*0732 6.4 4.663E.04 9.64E#03 19.53 2.910 E07 32 6.4 3.2626.04 4.63E+03 14.20 t.S9SE+0733 6.6 4.219E+04 0.20E+03 19.44 2.8116E07 33 6.6 3.000.E04 4.44E+03 14.79 1.896E+0734 6.8 3.492E+04 7.64E+03 21.9 Z.812E*07 34 6.8 3.026E+04 4.14E+03 13.69 1.896E+0733 7.0 Z.70E*04 7.46E+03 31.37 2.82E 7 33 7.0 2.554E+04 3.90E403 13.26 1.897E+07,. 36 7.2 3.020E.04 7.3E.03 24.20 2.013E+07 36 7.2 1.824E+04 3.76E03 20.63 1.897E60737 7.4 3.310E.04 6.84603 20.66 2.913E+07 37 7.4 1.401604 3.66E*03 26.14 1.897E+0736 7.6 1.707E+04 6.49E*03 38.00 2.814E+07 30 7.6 1.340E+04 3.536+03 26.34 1.899E+07 39 7.9 1.048E+04 6.52 +03 62.23 2.814607 39 7.9 1.4246+04 3.39E+03 23.78 1.898E0740 9.0 1.5276.04 6.37E-03 41.69 Z.814E.07 40 9.0 1.4196E04 3.186+03 22.40 1.898E+0741 9.2 1.790E04 6.00E+03 33.52 2.814607 41 8.2 1.247E+04 2.94E+03 23.53 1.8996.0742 8.4 1.3446.04 5.56603 41.36 2.815E07 42 9.4 9.179E*03 2.706+03 29.47 1.89960743 9.6 7.4056.03 5.25E+03 70.86 Z.915E.07 43 9.6 6.171E+03 2.52E+03 40.88 1.89960744 9.9 8.020E+03 5.02.E03 62.56 Z.15 E07 44 9.8 5.7506+03 2.39E+03 41.52 1.899E+0745 9.0 9.962E#03 4.74E+03 49.09 2.8156.07 45 9.0 6.360E+03 2.24E+03 35.26 1.899E+0746 9.2 9.944E.03 4.42E*03 50.03 2.815E+07 46 9.2 5.622E+03 2.09E+03 37.18 1.899E+0747 9.4 7.958E(03 4.12E*03 51.74 2.9166.07 47 9.4 4.4036.03 1.99E.03 45.09 1.699E+0749 9.6 7.425E.03 3.76E+03 50.59 2.816E07 49 9.6 4.0596E03 1.90E+03 46.73 1.899E+0749 9.9 4.650E+03 3.36E#03 69.79 Z.816E.07 49 9.9 4.646E+03 1.78603 39.22 1.8996+0750 10.0 1.696603 3.14603 165.71 2.916E07 50 10.0 5.045E+03 1.59E+03 31.52 1.900E+07
%~. l %%-. (.
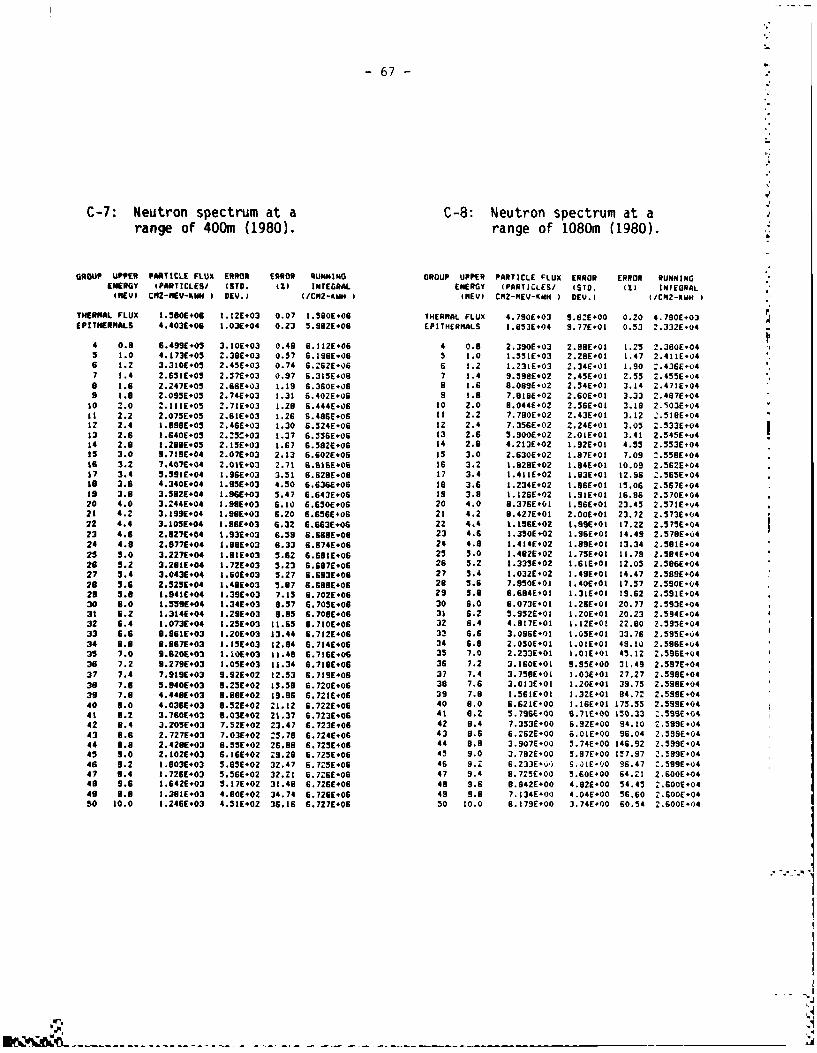
-67-
7: Neutron spectrum at a C-B: Neutron spectrum at arange of 400m (1980). range of 1080m (1980).
GROUP UPPER PARTICLE FLUX ERROR ERROR RUNNING GROUP UPPER PARTICLE FLUX ERROR ERROR RUNNINGENEIIGY (;ARTICLES/ (STD. (%) INTEGRAL ENERGY (PARTICLES/ ISTD. (1) INTEGRAL
KG CM -RlEV-KWN ) Ev.) l/CMN2RMN I3mv Clq2MEV-KWH DEV.) (/CM2-RMN,
4 0.9 6.499E+03 3.IOE+03 0.48 6.132E.06 4 0.8 2.9E0 .E'1 15 238E45 1.0 4.173E*05 2.38E*03 0.57 6.196E+06 2 . .390E-03 2.98E.0 1.47 2.380E-04
7 .3E0 .5.3 07 6.262E+06 6 1.2 1.231E+03 2.34E-01 1.90 Z'.436E+0414 2.631E-05 2.57E+03 0.97 6.313E+06 7 3.4 9.398E.02 2.45E+01 2.55 Z.455E.04
1. 2247E+05 2.66E*03 1.19 6.360E.09 a 1.6 8.089E+02 2.54E+01 3.14 2.471E+04,.9 Z.093E.05 2.74E+03 1.33 6.402E+06 9 1.9 7.818E+02 2.60E+01 3.33 !-.487E+04
30 2.0 2.IIIE.05 2.71E+03 1.29 6.444E-06 t0 2.0 9.044E+02 2.56E~o3 3.18 2.503E+04It 2.2 2.075E+05 2.SIE+03 1.26 6.486E+06 31 2.2 7.780E+02 2.43E+01 3.12 Z.51eE.04 ~12 2.4 1.098E-03 Z.46E+03 1.30 6.324E*06 12 2.4 7.356E+02 2.Z4E+01 3.05 2.533E+0423 2.6 1.640E-05 2.23C+03 1.37 6.336E+06 13 2.6 5.900E+02 2.OIE+o1 3.41 2.545E~u414 2.9 1.288E+05 2.15E+03 1.67 6.582E+06 14 2.9 4.213E+02 1.92E.0I 4.55 2.553E+04Is 3.0 9.719E*04 2.07E+03 2.13 6.602E+06 I5 3.0 2.630E+02 1.87E+01 7.09 :.558E+04Is 3.2 7.407E-04 2.01E+03 2.71 6.61SE. 06 16 3.2 I.S2SE+0Z 1.64E#01 10.09 2.562E+04 37 3.4 5.591E#04 1.96E*03 3.31 6.629E*06 17 3.4 1.411E+02 1.93E.03 12.96 Z-56SE-04is 3.6 4.340E*04 1.95E*03 4.50 6.636E+06 29 3.6 1.234E+02 1.96E#01 35.06 Z.567E*04Is 3.9 3.382E*04 1.96E+03 5.47 6.643E+06 is 3.9 1.12GE.02 1.93E.01 16.96 2.570E+0420 4.0 3.244E#04 t.98E+03 6.10 6.650E#06 20 4.0 8.376E+01 1.96E*01 23.45 2.571E+V423 4.2 3.199E+04 3.99E403 6.20 6.656E*06 22 4.2 0.427E*01 2.OOE+01 23.72 2.573E*0422 4.4 3.103E+04 1.96E*03 6.32 6.663E+06 22 4.4 1.15GE+02 t.S9E*Ot 17.22 2.575E+0423 4.1 Z.127E*04 1.93E+03 6.59 6.668E#06 23 4.6 1.330E+02 1.96E+01 14.49 2.57SE-0424 4.9 2.977E*04 1.99E+03 6.33 6.674E+06 24 4.9 1.414E*02 1.89E#01 13.34 2.581E-0425 5.0 3.227E+04 3.91E+03 5.62 6.681E+06 25 5.0 1.4e2E.02 1.75E.0I 32.79 2-504E-0421 5.2 3.281E+04 1.72E*03 5.23 6.687E+06 26 5.2 1.335E+02 t.6IE#03 32.05 2.386E*0427 5.4 3.043E+04 1.60E+03 5.27 6.693E+06 27 5.4 1.032E-02 1.49E.0t134.47 2.S99E+0429 5.6 2.525E+04 1.48E+03 5.97 6.GSBE+06 29 5.6 7.950E-01 1.40E#01 17.57 2 - 90E -($4
29 5. 1.941E#04 1.39E.03 7.15 6.702E+06 29 5.9 6.684E-01 1.31E#01 39.62 2.591E-04 30 6.0 3.55SE+04 1.34E#03 9.57 6.705E*06 30 6.0 6.073E-01 1.26E+01 20.77 2.593E-043t 1.2 1.314E*04 1.29E+03 9.95 6.708E+06 31 6.2 5.952E*01 3.ZOE+01 20.23 2.594E-0432 6.4 1.073E+04 1.23E+03 33.65 6.710E+06 32 6.4 4.917E-01 3.32E.01 22.90 2.593E+0433 6.6 8.961E+03 1.20E+03 13.44 6.712E+06 33 6.6 3.096E+01 1.05E+01 33.76 2.59SE-0434 9.9 S.967E.03 3.ISE.03 32.94 6.714E+06 34 6.9 2.0SOE+O3 1.01E+01 49.10 2.596E-04 35 7.0 9.620E+03 3.I0E+03 23.49 6.716E.06 35 7.0 2.233E+01 1.OIE.01 45.12 2.596E.04 31 7.2 9.279E*03 1.O5E#03 33.34 6.719E+06 36 7.2 3.360E*01 9.95E#00 31.49 2.597E+0437 7.4 7.919E.03 9.92E+02 12.53 6.719E*06 37 7.4 3.758E+01 1.03E+01 27.27 2.598E+0439 7.6 3.940E*03 9.25E+02 15.59 6.720E+06 38 7.6 3.033E+01 1.20E*01 39.75 2.598E*0439 7.9 4.446E+03 8.88E+02 39.96 6.721E+06 39 7.9 13561E+03 1.32E+01 84.72 2.599E-0440 9.0 4.036E#03 8.32E+02 23.12 6.722E-06 40 9.0 6.621E-00 1.16E+01 175.55 2-599E+0441 8.2 3.760t+03 9.03E402 21.37 6.723E*0S 41 6.2 5.79SE-00 B.71E400 150.33 Z.59SE.0442 9.4 3.205E.03 7.52E#02 23.47 6.723E.06 42 9.4 7.333100 6.92E+00 94.10 2.399E+0443 6.6 2.727E#03 7.03E402 :5.79 6.724E+06 43 9.6 6.262E+00 6.01E#00 96.04 2.399E.0444 9.9 2.420E+03 6.5SE*02 26.99 6.725E+06 44 9.9 3.907E-00 3.74E-00 346.92 2.599E.04 .45 9.0 2.102E+03 6.16E+02 29.29 6.723E+06 45 9.0 3.782E+00 5.97E#00 1!7.97 2.5991.04%
46 9.2 3.9031.03 5.85E+02 32.47 6.725E*06 46 9.2 6.233E~v.) 5. 3E-00 96.47 Z-599E.0447 9.4 3.7211.03 5.36E+02 32.23 6.7261.09 47 9.4 9.725E.00 3.60E-00 64.23 2.600E+0449 9.1 3.6421.03 3.17E+02 31.49 6.7261.06 49 9.6 0.642E+00 4.82E.00 54.45 2.' E+049 9.9 1.381E+03 4.60E+02 34.74 6.726E-06 49 9.9 7.134E-0') 4.04E+00 56.60 2.600E-0450 10.0 3.2461.03 4.51E+02 36.36 6.727E*06 50 30.0 6.179E+00 3.74E-00 60.54 2.600E-04
4
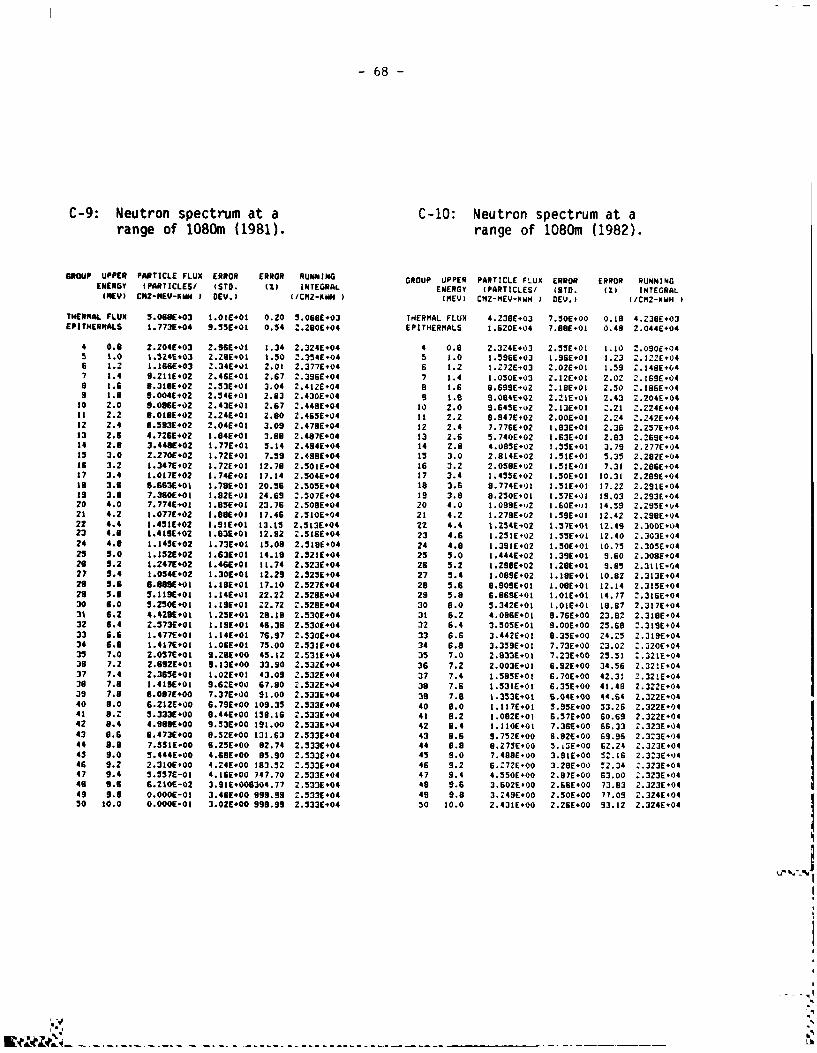
-68-
C-9: Neutron spectrum at a C-10: Neutron spectrum at arange of 1080m (1981). range of 1080m (1982).
GROUP UPPER PARTICLE FLUX ERROR ERROR RUNNING GROUP UPPER PARTICLE FLUX ERROR ERROR RUNNINGENERGY tPARTICLES/ (STD. (1) INTEGRAL ENERGY (PARTICLES/ (STO. (z) INTEGRAL(IEV) CH2-MEY-KbH I DEV.) (/CZ-KW (MEV) C22-MEV-wWM DEV.) (/CM2-KWH
THERMAL FLUX 3.068E*03 I.OIE+01 0.20 3.068E+03 THERMAL FLUX 4.230E.03 7.50E00 0.18 4.2391.03EPITHERMALS 1.7731.04 9.55*01 0.54 2.280E04 EPITHERMALS I.620E.04 7.88E*01 0.49 2.0441*04
4 0.e 2.204E*03 2.96E|01 1.34 2.324E+04 4 0.8 2.3Z4E*03 2.33E*01 1.10 2.090E.045 1.0 1.5241*03 Z.296*01 1.50 2.354E.04 5 3.0 1.596E+03 1.96E+01 1.23 2.122-E046 1.2 1.166E#03 2.34E+01 2.01 2.377E+04 6 1.2 1.272E.03 2.OZE+01 1.59 2.148E*047 1.4 9.211+O2 Z.46E*O1 2.67 2.396SE04 7 1.4 1.050E03 2.12E+01 2.0? 2.169E-04a 1.6 1.310E0Z 2.536*01 3.04 2.412E-04 8 1.6 8.699Eu2 Z.18E*01 2.50 :.196E+049 1.1 9.0041.02 2.54*E01 2.83 2.430E+04 9 E. 9.0841.02 .211E*01 2.43 2.204E:04.0 2.0 .096102 2.43101 2.67 2.4491*04 10 2.0 9.645E02 .13E*01 2.21 .224E*04iI 2.2 *.018E*02 2.24E#01 2.80 2.465E04 11 2.2 8.9471+02 2.00*E01 2.24 Z.242E.0412 2.4 6.5931.02 2.04E*01 3.09 2.478+04 12 2.4 7.776E.02 1.836*01 2.36 2.257E+0413 2.6 4.7261.02 1.84E+01 3.88 2.487E+04 13 2.6 5.740E02 1.63E01 2.83 2.269E04 14 2.0 3.4489102 1.77E#01 5.14 2.4941.04 14 2.8 4.0851.02 1. 5E01 3.79 2.2771*04is 3.0 2.270E#02 1.72EOI 7.59 2.499E*04 1 3.0 2.814E*02 1.3E01 5.35 2.202E-04Is 3.2 1.347E+02 1.72E+01 12.78 2.5011*04 16 3.2 2.058E02 1.51E*01 7.31 2.286E*0417 3.4 1.017E+02 1.74E*01 17.14 2.5041+04 17 3.4 1.455E02 1.50E+01 10.31 2.289E04is 3.6 9.6631.O 1.79E+01 20.56 2.503E*04 1o 3.6 9.774E.,1 1.31E+01 17.22 2.291E,04 Is 3.8 7.360E01 1.82E01 24.69 2.507E.04 19 3.8 8.250E01 1.37E+01 19.03 2.293E-0420 4.0 7.774E|01 1.85E*O1 23.76 2.508O.04 20 4.0 1.099E., 2 1.601.jl 14.9 2.295E*v421 4.2 1.077E*02 1.88E+01 17.46 2.1OE-04 21 4.2 1.279E02 1.591*01 12.42 Z.29861*)422 4.4 1.435E*02 1.91E*01 13.15 2.513E.04 22 4.4 1.254E-02 1.371*01 12.49 2.300E.0423 4.6 1.419 02 1.93E*01 12.92 2.516E04 23 4.6 1.251E02 1.S5E*1. 12.40 2.303E.0424 4.8 1.145102 1.73E01 15.08 2.318E*04 24 4.8 1.3911.02 1.50E*01 !0.75 2.305E.04 25 5.0 1.132E*02 1.631E01 14.19 2.321E-04 25 5.0 1.444E+02 1.39E01 9.60 Z.3091*0426 5.2 1.2471*02 1.46E#01 11.74 2.5231*04 26 5.2 1.298E02 1.28E*01 9.85 Z.311E 0427 5.4 1.054E#02 1.30E*01 12.29 2.523E*04 27 S.4 1.089E.02 1.181*01 10.82 2.313E+0420 5.6 6.91E*01 1.181*01 17.10 2.527E*04 29 5.6 8.909E01 i.091*01 12.14 2.31.E 0429 5.1 5.119E*01 1.14E#01 22.22 2.5291*04 29 5.8 6.8691+01 3.OIEO1 14.77 2.316E0430 1.0 5.2501*01 I.191E01 22.72 2.5291*04 30 6.0 3.342E.01 I.OE*01 18.87 2.317E+0431 6.2 4.429E#01 1.25+O3 29.19 2.330E.04 3t 6.2 4.0961.01 9.76E+00 23.8? 2.319E0432 6.4 2.573E*01 1.191*01 46.36 2.530E+04 32 6.4 3.505E*01 9.0OE0 25.69 Z.3196+0433 6.6 1.477E+01 1.14E#01 76.97 2.5301*04 33 6.6 3.442E01 9.35E00 24.Z5 2.319E0434 6.1 1.417E+01 1.06E*01 75.00 2.331E-04 34 6.8 3.359E01 7.731*00 23.02 :.320E0435 7.0 2.0571*01 9.ZE*00 45.12 2.531E+04 35 7.0 2.833E+01 7.231*00 25.51 2.321E0436 7.2 2.6921*01 9.13E*00 33.90 2.532E*04 36 7.2 2.003E+01 6.92E00 34.56 2.32!E.04 37 7.4 2.365E*01 1.021*01 43.09 2.5321*04 37 7.4 1.58E03 6.70E*00 42.31 2.32!E0439 7.6 1.419E1O 9.62E00 67.80 2.532E*04 38 7.6 1.5331E01 6.35E*00 41.48 2.322E*04 39 7.8 9.0171*00 7.37E+00 91.00 2.5331.04 39 7.8 1.353E*01 6.04*00 44.64 2.322E+0440 8.0 6.2121*00 6.79E*00 109.35 2.333E.04 40 9.0 1.117E-01 5.95E 00 53.26 2.322E.0441 8.2 5.333E+00 0.441*00 158.16 2.533E*04 41 8.2 1.082E01 6.57E+00 60.69 2.322E+0442 8.4 4.9899100 9.53E*00 191.00 2.533*04 42 0.4 1.IIOE01 7.361*00 66.33 2.323E.0443 8.6 6.473E*00 9.52E+00 131.63 2.5331*04 43 9.6 9.752E00 6.92E-00 69.96 2.323E0444 8.8 7.33E5100 6.251*00 82.74 2.533E+04 44 9.8 9.273E+00 533E*00 62.24 2.323E0445 9.0 5.444E*00 4.69E*00 95.90 2.533E+04 45 9.0 7.488E.00 3.91E*00 52.16 2.3:3,)4"46 9.2 2.310E+00 4.24E+00 183.52 2.533E*04 46 9.2 6.272E100 3.28E+00 !2.34 2.323E*0447 9.4 5.557E-01 4.6E*00 747.70 2.533*04 47 9.4 4.350E.00 2.67E*00 63.00 2.323E*0448 9.6 .ZOE-02 3.916 006304.77 2.533E.04 49 9.6 3.602E+00 2.66E*00 73.93 2.323E*0449 9.8 0.000E-01 3.46C*00 999.99 2.533E+04 49 9.8 3.249E*00 2.501*00 77.09 2.324E0450 10.0 0.OOOE-0 3.02E*00 999.99 2.331*04 30 10.0 2.431E#00 2.26E*00 93.12 2.3241.04
%"
-69-
APPENDIX D
LISTED FINE-GROUP GAMMA-RAY SPECTRA
~
-70-
APPENDIX D: LISTED FINE-GROUP GAMMA-RAY SPECTRA
Ganna-ray data corresponding to the plotted spectra of Appendix B arelisted on the following pages. The data have been obtained using an NE-213organic scintillator and unfolded using DREO techniques. The spectra arelisted in 100 KeV increments from 300 KeV to 8 MeV, and normalized to unitsof "photons per cm2 .MeV.kWh". As in Appendix B, there is no "Table D-1",since gamma-ray determinations at a range of 15 meters were prohibited dueto excessive fission-product background.
%!
5. %
..
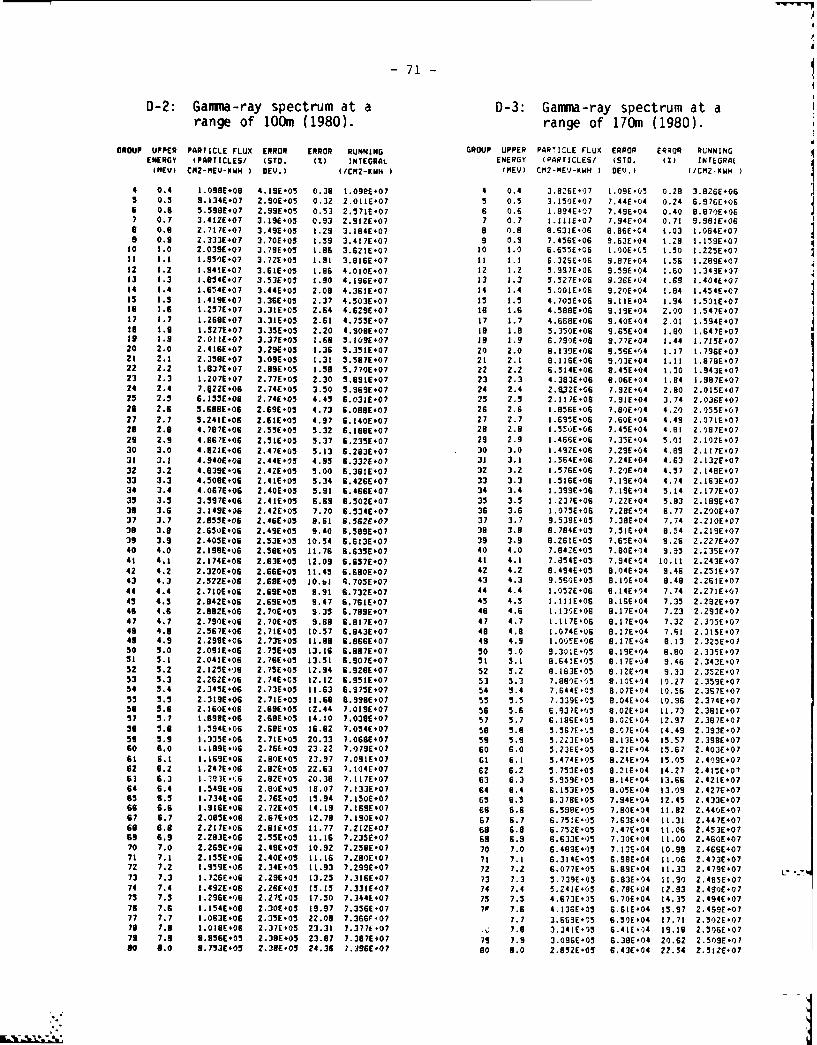
- 71 -
D-2: Gamma-ray spectrum at a D-3: Gamma-ray spectrum at arange of 100m (1980). range of 170m (1980).
GROUP UPPER PARTICLE FLUX ERROR ERROR RUNNING GROUP UPPER PARTICLE FLUX ERROR ERROR RUNNING ENERGY (PARTICLES/ (5T0. (Z) INTEGRAL ENERGY (PARTICLES/ (ST0. (Z) INTEGRAL"% '("EV) CM2-"E -KWH ) EV. ) (/CNZ-KWH ) (MM U CM2-ME -KWH ) DEV. ) (/CM2-KWH )i
4 0.4 1.098609 4.19605 0.38 1.098E.07 4 0.4 3.82E)7 1.096.05 0.28 3.826E065 0.5 9.1346.07 2.90605 0.32 2.0116*07 5 0.5 3.150E-07 7.44604 0.24 6.976E606 . 0.6 5.598E.07 2.99605 0.53 2.3716.07 6 0.6 1.894607 7.496*04 0.40 8.970E%067 0.7 3.412607 3.19603 0.93 2.9126.07 7 0.7 2.IIIE-07 7.94E-04 0.71 9.9816.06" 0.8 2.7176-07 3.496+05 1.29 3.184E+07 8 0.9 8.631E.06 8.866E04 1.03 1.0846+079 0.9 2.333E-07 3.70E605 1.59 3.417E07 9 0.9 7.4566.06 9.63604 1.29 1.139E+07to 1.0 2.0396.07 3.79E+60 1.86 3.6z2E+07 20 1.0 6.655E-06 1.00E-C t.50 t.225E.07 I! 1.1 1.950E07 3.72E+03 1.91 3.8166*07 i 1.1 6.3266E06 9.87E*04 1.56 1.286E+0712 I.Z 1.941607 3.61 E05 1.88 4.010607 12 1.2 5.9976.06 9.59604 1.60 1.343E0713 1.3 1.054E.07 3.33E05 1.90 4.196E.07 1.3 5.527E.06 9.36E.04 1.69 1.404E40714 1.4 1.654E-07 3.44E+05 2.08 4.361E-07 14 1.4 5.001E06 9.20E+04 1.84 1.454607
25 1.5 1.419E*07 3.36E*05 2.37 4.503E#07 is 1.5 4.705E.06 9.11E.04 1.94 1.501E.076 1.6 1.237E+07 3.31E+05 2.64 4.629E07 18 1.6 4.588E06 9.19E+04 2.00 1.54760717 1.7 1.268E07 3.31E*05 2.61 4.7556E07 17 1.7 4.668E*06 9.40E-04 2.01 1.594E407to 1.9 1.5276.07 3.35E-05 2.20 4.9096E07 18 1.8 5.350606 9.656+04 2.80 1.647607Is 2.3 2.011E.07 3.37E-03 1.68 5.1096.07 J9 1.9 6.790606 9.77604 1.44 1.715E0720 2.0 2.416E07 3.29E60 1.36 5.356E07 20 2.0 8.139E06 9.56E-04 1.17 1.796E0721 2.1 2.358E.07 3.09E*05 1.31 5.587E+07 21 2.1 B.116E06 9.03E*04 1.11 1.870E0722 2.2 t.8376.07 2.89E.05 1.59 5.7706 07 22 2.2 6.314E-06 8.456+04 t.30 1.94360723 2.3 1.207607 2.77E.05 2.30 5.891E07 23 2.3 4.3836.06 8.06E 04 1.84 1.98760724 2.4 7.@226*06 2.74E05 3.50 5.969607 24 2.4 2.32E06 7.92E*04 Z.80 2.015E072 .5. 6.156.E0 2.74603 4.45 6.031607 25 2.5 2.117E06 7.91E.04 3,74 2.036E07
26 2.6 5.686E.06 2.69E*OS 4.73 6.0886.07 26 2.6 1.856E06 7.80E*04 4.20 2.055E0727 2.7 5.241E.06 2.6IE+05 4.97 6.1406*07 27 2.7 1.695E06 7.60E-04 4.49 2.071E0729 2.8 4.787E.06 2.55[*05 5.32 6.189E07 28 2.8 1.55)E06 7.45E+04 4.81 2.087E+07 29 2.9 4.667606 2.IE*05 5.37 6.2356.07 29 2.9 2.466E606 7.35604 5.01 2.1026.0730 3.0 4.821E+06 2.47605 5.13 6.283E#07 30 3.0 1.492E06 7.29604 4.89 2.117607 31 3.1 4.940E06 2.44E-05 4.95 6.332E#07 31 3.1 1.564E06 7.24E.04 4.63 2.132E0732 3.2 4.8396.06 2.42E05 5.00 6.381E.07 32 3.2 1.376E06 7.206.04 4.57 2.1486E0733 3.3 4.508606 2.41E+03 5.34 6.426607 33 3.3 .516E-06 7.196+04 4.74 2.16360734 3.4 4.0676*06 2.406*05 5.91 6.466E07 34 3.4 1.399606 7.196+04 5.14 2.177E07 35 3.5 3.597E06 2.41E*0 6.69 6.502E#07 35 3.5 2.2376 06 7.22E+04 5.83 2.18960739 3.6 3.149E+06 2.426.03 7.70 6.3346.07 36 3.6 1.0756.06 7.28E-04 6.77 2.200607 37 3.7 2.8556.06 2.46E.05 8.61 6.5626.07 37 3.7 9.538605 7.38E-04 7.74 2.21060738 3.8 2.6506.06 2.49605 9.40 6.589E+07 38 3.8 8.784603 7.51604 8.54 2.2196.07 39 3.9 2.4056.06 2.53E03 10.54 6.613607 39 3.9 B.ZIE05 7.66604 9.26 2.2276.0740 4.0 2.198E06 2.58E05 11.76 6.635E*07 40 4.0 7.842E05 7.80E+04 9.95 2.235E0741 4.1 2.1746.06 2.63E*05 12.09 6.6576+07 41 4.1 7.854605 7.94E04 10.11 2.243E0742 4.2 2.320606 2.66E+05 21.45 6.680607 42 4.2 8.494E03 8.04604 9.46 2.2516+0743 4.3 2.522E.06 2.68603 10.bl q.7056.07 43 4.3 9.5606+05 8.126.04 8.48 2.226E0744 4.4 2.710E.06 2.69E605 9.91 6.7326.07 44 4.4 1.032E06 8.14E+04 7.74 2.271E+0745 4.5 2.642E06 2.69605 9.47 6.7616.07 45 4.5 1.11E06 B.IGE+04 7.35 2.2826.0746 4.6 2.882E06 2.70605 9.35 6.789E.07 46 4.6 1.130606 0.17E-04 7.23 2.29360747 4.7 2.7906+06 2.70E-03 9.69 6.817E.07 47 4.7 1.117E*06 9.17604 7.32 2.3056.0749 4.9 2.567E06 2.71E605 10.57 6.843E+07 49 4.8 1.074E06 8.176*04 7.1 2.312E0749 4.9 2.299E.06 2.73E*05 11.89 6.866E07 49 4.9 1.00!E-06 8.17604 8.13 2.3256.0750 5.0 2.09IE.06 2.756E05 13.16 6.9876*07 50 5.0 9.301E-03 8.196*04 8.80 2.3356.0751 5.1 Z.041E#06 2.76E*05 13.51 6.907E.07 51 5.1 8.641E-05 8.17E04 9.46 2.3436+075z 5.2 2.123E.06 2.75E*05 12.94 6.928E+07 52 5.2 8.l63E05 B.IZE-04 9.33 2.352E0753 5.3 2.262E06 2.74E05 12.12 6.95E07 53 5.3 7.8806.0 8.10604 10.27 2.3596.07 54 5.4 2.3456E06 2.73E*05 11.63 6.975E07 54 5.4 7.644E.05 8.07E*04 10.56 Z.37E075- 5.5 2.319E.06 2.71E-03 11.69 6.9986.07 55 5.5 7.339E05 8.04604 10.96 2.374E.0758 5.6 2.160606 2.696*05 12.44 7.019607 56 5.6 6.937605 8.02604 11.73 2.38160757 5.7 1.8986.06 2.69605 24.20 7.0306.07 57 5.7 6.166.05 9.02E:04 12.37 2.387E+0756 1.8 E.946.06 2.69E*05 26.92 7.05 4607 58 5.9 5.167E., 5 8.07604 14.49 2.393607 59 5.9 1.3356E06 2.716*05 20.33 7.0686E07 59 5.9 5.,22E)05 8.13604 25.57 2.3986*07s0 .0 1.1996.06 2.766*03 23.22 7.079607 60 6.0 5.2366.05 9.216*04 15.67 2.403607
61 6.1 1.169E06 2.806 05 23.97 7.0916'07 61 6.1 3.474695 9.Z4E 04 15.05 2.4096.0762 9.2 1.2476.06 2.82605 22.63 7.104E*07 62 6.2 5.753E05 8.21E-04 14.27 2.415E+076- 6.3 I.0336.;6 2.82E 05 20.38 7.117607 63 6.3 5.9596.03 8.14604 13.66 2.42160764 6.4 1.5496.06 2.80E405 28.07 7.133E07 64 6.4 6.133E-05 8.056E04 13.09 2.4276*0765 6.5 1.7346.06 2.766 05 t5.94 7.1506.07 65 6.5 6.3786E05 7.94604 12.45 2.43360766 6.6 1.916*06 2.72E*05 14.19 7.169607 66 6.6 6.3986'05 7.80E*04 11.82 2.440E0767 6.7 2.0856E06 2.676.0S 22.79 7.1906.07 67 6.7 6.751E*05 7.63604 11.31 2.4476.07so 6.8 Z.Z7E06 Z.62E*05 11.77 7.Zl2E07 68 6.8 6.752E05 7.47604 1.06 2.4536.07 69 6.9 2.2936.06 2.5S5E05 11.16 7.235607 69 6.9 6.6336*05 7.30604 11.00 2.460E+0770 7.0 2.269606 2.486*05 10.92 7.2586.07 70 7.0 6.4896*05 7.136.04 10.99 2.466E0771 7.1 2.2556.06 2.406.05 1.16 7.Z806'07 71 7.1 6.3146.05 696.E04 11.06 2.4736.0772 7.2 2.9596.06 2.346*05 11.93 7.2996.07 72 7.2 6.077E-05 6.896*04 11.33 2.479E0773 7.3 1.726606 2.29E-01 13.25 7.3166.07 73 7.3 3.739E-05 6.86.04 11.90 2.4856.0774 7.4 1.492E.06 Z.ZO6*05 15.15 7.33[E07 74 7.4 5.Z41E.05 6.79604 12.93 2.4906.0775 7.5 1.296E06 2.27E,03 17.50 7.3446*07 75 7.5 4.6736.05 6.70604 t4.35 2.49460779 7.6 1.1546.06 2.30E+05 19.97 7.356E+07 7V 7.6 4.1366.05 G.6IE*04 15.97 2.49960777 7.7 1.063E06 2.336E05 22.09 7.366F-07 7.7 3.66G3E05 6.50E*04 17.72 2.50ZE*0776 7.8 2.0t6.06 2.376*05 23.31 7.377607 .. 7.9 3.3416.05 6.416*04 19.19 2.5066.07
79 7.9 9.956605 2.39E*05 23.87 7.397E07 79 7.9 3.0966.05 6.386*04 20.62 2.509E0',
80 8.0 9.753E.03 2.386*05 24.36 7.3966.07 0o 8.0 Z.85ZE05 6.43604 22.54 Z.512E07
..
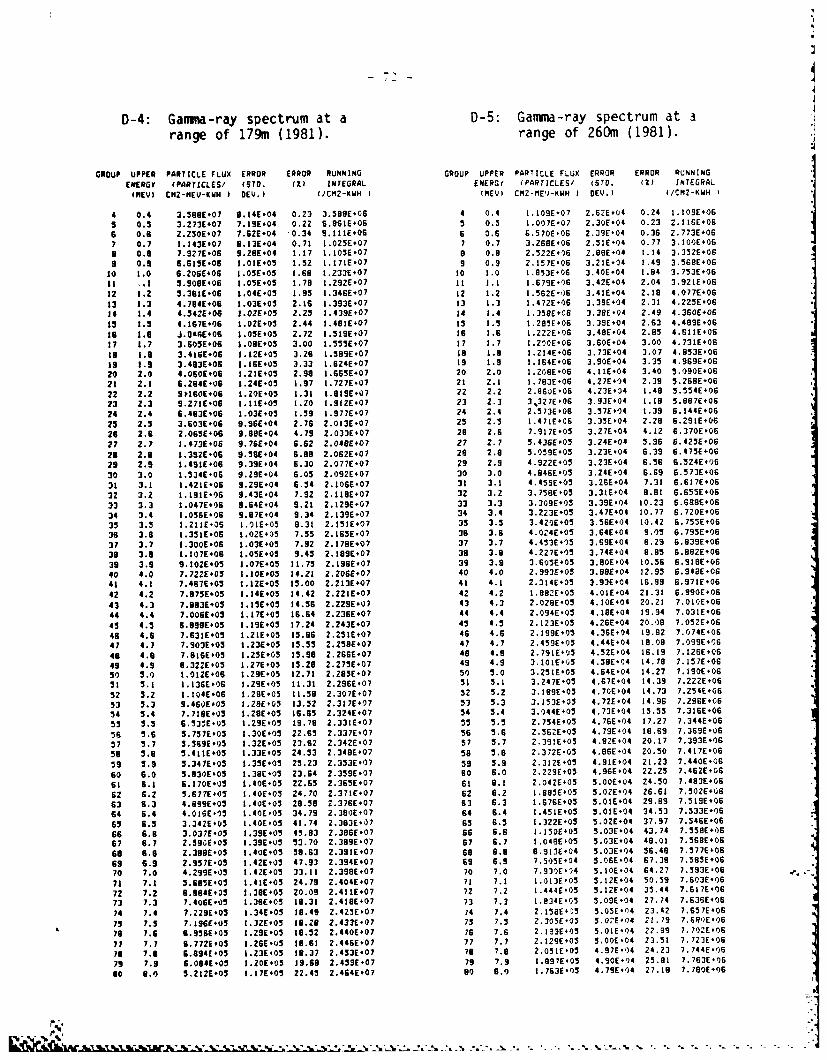
72
D-4: Gammna-ray spectrum at a D-5: Gamma-ray spectrum at 3range of 179im (1981). range of 260m (1981).
GROUP UPPER PARTICLE FLUX ERROR ERROR RUNNING GROUP UPPER PARTICLE FLUX ERROR ERROR RUNNINGENERGY (PART'ICLES/ (570. (%I INTEGRAL ENERGf (PARTICLES/ (SID. (Z? INTEGRALIIIE'J CMZ-MEY-KWM D EV.) (JCM2-KhIH I(3)60) CM2-M)-(IH IDEV.) (/CM2-KWdHI
4 0.4 3.589E#07 9.t4E.04 0.23 3.589E-06 4 0.4 I.I09E-07 2.62E.04 0.24 1.103E-063 0.5 3.273E407 7.19E.04 0.22 6.861E-06 5 0.5 1.007E-07 2.30E-04 0.23 2.1166*066 0.6 2.230E.07 7.62E+04 0.34 9.113E.06 6 0.6 6.570E+06 2.39E-04 0.36 2.773E*067 0.7 1.143E+07 0.13E-04 0.71 1.025E+07 7 0.7 3.268E+06 2.31E-04 0.77 3.100E+068 0.9 7.927E-06 9.20E*04 1.17 1.105E+07 a 0.8 2.322E+06 Z.BBE.04 1.14 3.332E.0609 0.9 6.635E.06 I.03E+05 1.52 1.171E-07 9 0.9 2.157E-06 3.21E+04 1.49 3.568E+061o 1.0 6.2066.06 1.OSE'05 1.69 I.Z33E*07 10 1.0 I.8536.06 3.40E-04 1.84 3.753E.06it 1.1 5.900E+06 1.05E+05 1.78 1.292E+07 it 1.1 3.6796.06 3.42E-04 2.04 3.921E.06
22 12136606 10E 1..5 33460 12 1.2 1.562E-06 3.41E-04 2.16 4.0776.06
33 3.3 4.794E.06 1.03E*05 2.16 1.393E+07 13 1.3 1.472E-06 3.39E+04 2.31 4.223E+0614 34 4.342E#06 1.02E+05 2.25 1.439E+07 14 3.4 1.3586.06 3.38E-04 2.49 4.360E.06
15 3 4.367E-06 1.02E+03 2.44 1.401E*07 is 13 1.283E-06 3.39E+04 2.63 4.489E.0639 1.9 J.1.O'E#06 1.056*05 2.72 1.519E+07 16 1.6 1.22ZE-06 3.48E+04 2.95 4.6116+0627 1.7 3.605E+06 l.086.05 3.00 1.3535E+07 17 1.7 1.200E-06 3.60E-04 3.00 4.731E*06to 1.9 3.4166.06 3.12E.05 3.26 1.389E.07 Is 1.8 l.Z14E+O6 3.73E+04 3.07 4.853E406
is 2.9 3.493E+06 3.366*05 3.33 1.624E.07 39 1.9 1.164E-06 3.90E-04 3.35 4.969E+06 20 2.0 4.060E-06 1.236*05 2.99 3.6656.07 20 2.0 1.208E-06 4.11E-04 3.40 5.090E*06
23 2.1 6.264E.06 1.24E.05 2.97 1.727E.0721 .1 .73-6 47Ef Z952B-022 2.2 91-IOE-06 1.20E-03 3.31 1.919E,)7 22 2.2 2.960E+06 4.23E-04 1.48 5.5546.06
73 2.3 9.271E.06 I.IIE+O5 1.20 1.912E+07 23 2.3 3,327E,06 3.93E+04 1.39 5.8876.06 2.4 6.483E+06 1.-*5 15 .7607 24 2.4 2.57]E.06 3.37E+04 1.39 6.144E+06
25 2.5 3.603E.06 9.966*04 2.76 2.013E.07 25 2.5 1.471E-06 3.33E+04 2.28 6.291E+06
26 2.6 2.065E.06 9.88E+04 4.79 2.033E+07 29 2.6 7.917E.05 3.27E-04 4.12 6.370E+0627 2.7 1.473E,06 9.76E+04 6.62 2.049E#07 27 2.7 5.4366+05 3.24E-04 5.96 6.425E-06
29 2.9 1.352E-06 9.3604 6.99 2.062E*07 29 2.9 5.05SE405 3.23E+04 6.39 6.473E+06
29 2.9 1.491E#06 9.39E#04 6.30 2.077E-07 29 2.9 4.922E+05 3.23E-04 6.56 6.324E.06
30 3.0 1.534E-06 9.29E.04 6.05 2.092E+07 30 3.0 4.946E-05 3.24E-04 6.69 6.573E.06
31 3.1 1.421E-06 9.29E.04 6.54 2.106E.07 31 3.1 4.4596*05 3.26E+04 7.31 6.617E+06
32 3.2 1.191E-06 9.43E'04 7.92 2.319E+07 32 3.2 3.7586.05 3.31E+04 9.91 6.6556.0fi
33 3.3 1.047E#06 9.64E+04 9.23 Z.129E.07 33 3.3 3.30SE.05 3. 3SE-04 30.23 6.688E+06
40 4.0 1.21E-05 1.0E+05 84.21 2.151E+07 40 4.0 2.9936.05 3.56E04 12.95 6.755E+06 41 4.1 1.331E+06 t.IZE*05 350 2.163E07 3 4.1 4.024E+05 3.96E04 16.99 6.916*06
42 4.2 7.975E.05 1.03E+05 74.42 2.178E*07 42 4.2 4. 453E+05 3.O9E+04 23 6.890E*063 4.0 7936 I.35605 34.56 2.289E-07 3 . 4.3 227E-035 3 4E04 20.25 7.012E06
44 4.4 7.10066.0 1.07E*05 36.64 2.196E+07 44 4.4 3.605E605 4.186*04 39.94 6.01BE06 45 4.0 6.9E05 316*5 3.24 2.206#07 45 4.5 2.923E-05 4.28E+04 12.95 7.0526.06 41. 4.6 7.467E+03 1.23E'05 15.96 2.213E+07 46 4.6 2.314E-05 3.93E-04 39.82 6.974E.06
43 4.7 7.9036.05 I .23605 15.55 2.229E+07 47 4.7 2.4596.05 4.44E+04 18.09 7.0996.06
44 4.9 7.8166.05 1.17E+05 15.94 2.236E607 46 4.9 2.094E-05 4.S8E+04 16.94 7.016606
49 4.9 9.3226*05 3.276.05 15.29 2.275E+07 49 4.9 2.1016,jS 4586.*04 14.09 7.052E-06
5o 5.0) 1.012E#06 1.29E-05 32.71 2.28SE.07 51) 5.0 3.251E405 4 .64E+04 14.27 7.190E.0651 5.1 1.136E.06 I.29E.05 13.33 2.296E.07 51 5.1 3.247E+03 4 .67E+04 34.39 7.2226. 06
52 5.2 1.104E.06 1.29E-05 31.58 2. 3076.-07 52 5.2 3.396*05 4 .70E +04 14.73 7.254E+0653 5.3 9.4606.05 1.2SE'05 13.52 2.317E+07 53 5.3 3.1536.05 4,72E-04 34.96 7.296E+0654 5.4 7.719E+03 1.28E.05 36.65 2.324E.07 54 5.4 3.0446.05 4.73E-04 35.55 7.316E.0655 5.5 6.3E-05 1.Z9E.03 19.79 2.331E.07 55 5.5 2.754E+03 4.76E-04 37.27 7.344E.06
56 56 5.757E:05 1.30E+03 22.63 2.337E+07 56 5.6 2.3&ZE.03 4.79E-04 18.69 7.363E+06
57 57 5 43E#95 ::33E:05 24:531 2.342E407 59 5.8 2.391E#03 4.:.7E-04 20.:50 7.3176'06
59 5. .3E0 1.3#325.23 2.353E+07 59 5.9 2.312E+05 4.91E-04 21.23 7.440E-0660 9.0 5.030E-03 1.38E-05 23.64 2.359E-07 60 6.0 2.2296.05 4.96E-04 22.25 7.462E+06.-
63 6.3 6.170E*05 1.40E.05 22.65 2.363E+07 61 6.1 2.042E-05 5.OOE#04 24.50 7.483E+0662 9.2 5.6776-01 3.406*05 24.70 2.371E-07 62 6.2 3.8956.05 3.02E-04 26.61 7.SOZE+*U663 6.3 4.999E+05 1.40E-05 29.59 2.3766*07 63 6.3 1.676E405 5.01E.04 29.89 7.5196.0664 6.4 4.0166.05 1.40E-05 34.79 2.380E.07 64 6.4 1.431E+05 3.01E-04 34.53 7.333E0665 6.5 3.342E#05 1.40E-03 41.74 2.383E.07 65 6.5 3.322E.05 5.OZE.04 37.97 7.54SE*06
66 6.6 3.0376.05 1.39E#05 45.83 2.3866.07 fig 6.6 3.150E+D05,S03E-04 43.74 7.5586.06S67 6.7 2.59..605 1.396.05 53.70 2.389E.07 67 6.7 3.0496.05 5.03E-04 49.01 7.5686.0666 9.9 2.3986*05 1.40E+03 59.63 2.391E+07 69 6.9 8.913E-04 5.03E+04 56.49 7.577E-0669 6.9 2.957E-05 i.42E.0S 47.93 2.394E.07 69 6.9 7.5)56.04 5.06E+04 67.39 7.5856.06.70 7.0 4.299E.03 1.42E#03 33.13 2.3986.07 70 7.0 7.931E.04 3.10E-04 64.27 7.393E-06
73 7.1 3.6856.05 1.41E-05 24.79 2.404E.07 71 7.3 1.0133E05 5.12E+04 50.59 7.6036.06G72 7.2 6.9846.05 1.39E.03 20.09 2.416.07 72 7.2 1.444E#05 5.1ZE*04 35.44 7.617E+0673 7.3 7.406E-05 1.36E+05 19.31 2.418E.07 73 7.3 1.834E-05 3.09E-04 27.74 7.636E.06S74 7.4 7.229E*0S 1.34E#03 39.49 2.423E*07 74 7.4 2.158E*')5 5.056.04 23.42 7.657E-0673 7.3 7.3966.05 1.3ZE.05 16.28 2.433E.07 75 7.5 2.70SC.05 5.07E-()4 21.79 7. GR') )676 7.6 6.9566.05 1.29E#05 39.52 2.440E#07 79 7.6 2.183E.05 S.03E-04 22.89 7.702E#06
77 7.7 6.772f.05 1.26E.'05 39.63 2.446E+07 77 7.7 2.129E.05 5.00E.04 23.51 7.723E.06
72 7.S 6.6946.05 1.23E-03 36.37 2.433E407 79 7.9 2.051E.05 4 .97E -04 24.23 7.744E+9679 7.9 6,084E-03 3.20E.oS 19.69 2.459E.07 79 7.9 1.8976.05 4.90E-04 25.81 7.763E.06go 9.0 5.2326.05 3.17E*05 22.45 2.464E-07 90 8.0) 3.7636.05 4.79E*04 27.39 7.706*06)
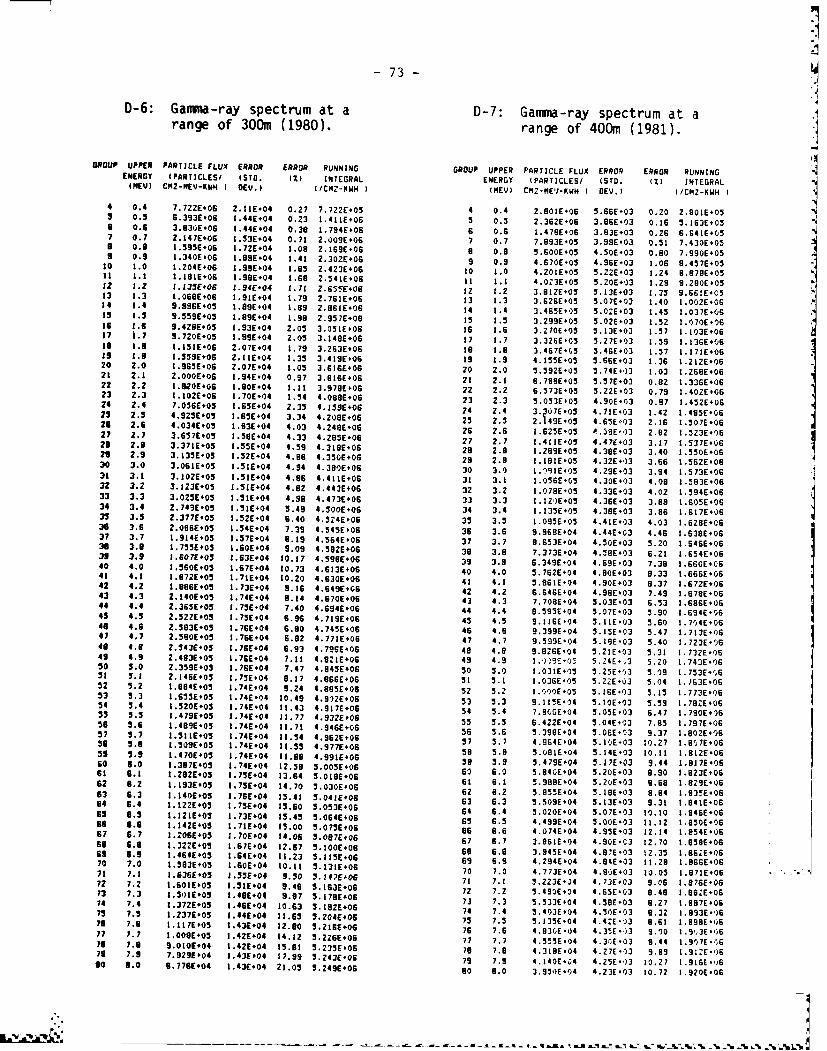
73 -
D-6: Gamma-ray spectrum at a D-7: Gamma-ray spectrum at arange of 300m (1980). range of 400m (1981).
GROUP UPPER PARTICLE FLUX ERROR ERROR RUNNING GROUP UPPER PARTICLE FLUX ERRO ERROR RUNNINGENERGY (PARTICLES, (S0. (2) INTEGRAL ENERGY (PARTICLES/ (TD. (2) INTEGRAL(MEV ) CM2-NEV-KMH ) 0EV.) (/CNZ-KWH ( 1MEV) CMZ-ME',-KWH D 0EV.) (/CNZ-KWH
4 0.4 7.7Z2E*06 z.IIE.04 0.27 7.722E*03 0.; 2.!01E-06 5.66E-03 0.20 2.801E+05 '5 0.5 6.393E#06 1.44E+04 O.Z3 1.4116.06 5 0.5 2.36ZE06 3.E66-03 0.16 5.163E+05 6 0.6 3.83,)E.06 1.44E+04 0.38 1.794E#06 6 0.6 1.478E606 3.83E-03 0.26 6.6416+05 - 7 07 Z.147E*06 1.53E+04 0.71 2.009E,06 7 0.7 7.8936 05 3.99E-03 0.51 7.430E+05
0.9 a.960 .Z*4 10 .660 0.8 5.600E-05 4.50E-03 0.80 7.990E+05 .O0. I.340E#06 1.89E604 1.41 2.3OZE*06 9 0.9 4.670E-05 4.96E+03 1.06 8.457E*0510 1.0 |.2046*06 1.99604 1.65 Z.423E(06 10 1.0 4.201E+05 5.22E+03 1.24 8.879E'05I . 1.9 04 .68 2.541E.06 (1 1.1 4.023605 .ZOE+03 1.29 9.Z606.0512 1.2 1.7 Z.651E06 12 1.2 3.IZE.05 5.13603 1.35 9.6616.523 1.3 .0696E+06 I.,(E.04 1.79 2.761E06 23 1.3 3.626605 5.07E.03 1.40 .OOZE.06
I4 1. .. 89 2.616+06 24 1.4 3.465E.)5 5.026+03 1.45 1.037E0625 2.5 9.559E+05 (.89E604 1.98 2.957E-06 15 1.3 3.Z99605 5.02E+03 1.52 1.070E+06I 1.6 9.4Z9605 .93E*04 2.05 3.05606 16 1.6 3.Z70E-05 5.13E-03 1.57 1.10360617 1.7 9.720E+05 1.99E.04 2.05 3.148E.06 17 1.7 3.326E05 5.27E03 1.59 2.1366.f629 1.8 1.151E.06 2.07E04 1.79 3.263E+06 i8 (.8 3.467605 5.46E-03 1.57 1.171E+06Is I.9 1.559E+06 Z.IIE.04 1.35 3.419E606 is 1.9 4.135E*05 5.666+03 1.36 1.21260620 2.0 1.965E06 2.07E604 1.05 3.6166.06 20 2.0 5.592E05 5.746*03 2.03 2.269E.0622 2. 2 000E06 .94E.04 0.97 3.816E+06 22 2.1 6.788605 5.57603 0.82 2.3366.0622 2.2 2.902E006 (.e0E604 1.12 3.976E.06 2Z 2.2 6.573605 5.22E.03 0.79 1.40260623 2.3 7.0E06 2.706E+04 1.54 4.088E06 23 2.3 5.053E*05 4.906.03 0.97 1.452E0624 2.4 7.056605 .656+04 2.35 4.1596.06 24 Z.4 3.?07E,05 4.71;603 ;.4Z .4856E0625 2.5 4.93E+05 1.65E04 3.34 4.208E,06 22 .5 2.149E.05 4.6 E 03 2.26 .5076.0626 2.6 4.034E05 .636.04 4.03 4.249E.06 26 2.6 1.623E+05 4.59E,03 2.82 I.5Z36.0627 2.7 3.6576.05 .E6.04 4.33 4.295606 27 2.7 1.411E205 4.476*03 3.17 1.537E0620 2.9 3.371E#05 1.55E04 4.59 4.318E06 29 2.8 1.289605 4.38E.03 3.40 1.55060629 2.9 3.051 E .52E.04 4.86 4.350E 06 29 2.9 1.181E+05 4.32E+03 3.66 1.562E0630 30 .61* S 5IE-04 4.94 4.3806.06. 30 3.0 1.*?91E.05 4.296,03 3.94 2.5736.06a
32 3.1 3.1ZE05 I.51E04 4.86 4.41E+06 31 3.2 1.0566'05 4.30E+03 4.08 1.583E+0633 3.2 3.1236.05 1.5EE004 4.92 4.4436.06 32 3.2 1.078E-05 4.336+03 4.02 2.5946.0633 3.3 3.0256 I.1IE*04 4.98 4.4736.06 33 3.3 1.t2)E*05 4.36E-03 3.89 1.60560634 3.4 2.743E605 1.51E04 5.49 4.5006.06 34 3.4 1.135E05 4.38E-03 3.86 1.617E06315 3.5 Z.377E+05 1.32E604 6.40 4.524E06 35 3.5 1.095605 4.4E+,03 4.03 1.6BE06" "36 3.6 2.096E05 1.54E04 7.39 4.545E606 36 3.6 9.968E.04 4.44E603 4.46 1.63860637 3.7 1.914E05 1.37E+04 0.19 4.564606 37 3.7 8.653E+04 4.50603 5.20 1.64660636 3.8 1.7556.05 1.606+04 9.09 4.5ZE.06 38 3.8 7.3736'04 4.586+03 6.21 .6546.0639 3., ,.6076.0, 2.636+04 10.17 4.596.06 39 3.9 639604 4.69.03 739 6606.06140 4.0 .560E03 1.67E04 (0.73 4.613E06 40 4.0 5.762604 4.80603 8.33 1.666E0642 4.212.9726.05 2.726,04 1.0 .660641 4.1 3.861E,04 4.906+03 8.37 1.6726.0642 4.2 1.86605 1.73E04 9.16 4.649E06 42 4.2 6.646E04 4.986E03 7.49 .678E06
43 4.3 2.406E05 1.74E04 9.4 4.6706+06 43 4.3 7.708E*04 5.03E-03 6.53 1.6866E0644 4.4 2.3656.05 I.75E04 7. 4.4.694606 44 4.4 8.593E.04 5.07603 5.90 1.694E0645 4.5 2.522E05 2.7E*04 6.96 4.719E06 45 4.5 9.116E04 5.22E03 5.60 1.70460646 4.6 2.5936.05 2.76E04 6.80 4.7456+06 46 4.6 9.399E04 5.15E+03 5.47 1.713E0647 4.7 2.580E-05 1.766.04 6.82 4.771E06 47 4.7 9.599E604 5.19E-03 5.40 2.723606"46 4.9 2.5436.05 .766+04 6.93 4.796E06 48 4.9 9.826604 5.22E03 5.31 1.732E06149 4.9 2.4936.05 .766+04 7.11 4.8226.06 49 4.9 1.')9Eo05 5.24E.-3 5.Z0 1.7436.06"50 .0 2.359605 .76604 7.47 4.4 5606 50 5.0 1.031E605 5.25E-03 5.09 1.753E6.6 52 .1 2.46 605 .75E+04 9.17 4. 666E 06 51 5.2 1.036E605 5.ZZE 03 5.04 1.163E+06
52 5.2 1.694603 1.746+04 9.24 4.885E-06 52 5.2 2..00E05 5.16E-03 5.15 1.7736+0653 5.3 .653E50O 1.746+04 10.49 4.902+E06 53 5.3 9.21t*04 5.I0 03 5.9 .7826"06
54 5.4 2.52E0.05 1.746+04 22.43 4.917606 54 5.4 7.9066.04 5.056.03 6.47 1.790E*0655 5.5 1.479E-05 (746.04 12.77 4.9326.06 55 5.5 6.422E04 5.04E-03 7.85 1.797E0656 5.6 !.4896'05 1.74604 1.71 4.946E+06 56 5.6 5.396E-04 5.06E03 9.37 .80ZE+0657 5.7 1.9E#05 (.746+04 22.54 4.9626.06 57 5.7 4.964604 5.I06.03 10.27 1.8076+06
5.9 2.5096.05 1.746+04 11.55 4.977E+0659 .9 1.4706 05 1.746 04 1.96 4.991606 58 .8 5.081 -6 04 5.146 03 10.1 .8I E*06
60 6.0 1.39 7 605 1.746 04 12.5 8 5.0056 06 59 . 9 5.476 04 5 .176 03 9.44 1. 17 6E 0662 6.1 1.282605 1.756+04 13.64 5.018E.06 6 6.0 5.840E.04 5.20E+03 .90 1.82360662 6.2 1.193E+05 1.75E04 14.70 5.030E+06 61 6.1 5.988E04 5.20E-03 8.68 2929E0663 6.3 1.140E605 1.76E+04 (5.41 5.041E#06 63 6.3 5.509E04 5.13603 9.31 184E6O64 6.4 2.1226.05 (.756+04 15.60 5.0536+06 64 6.4 5.0206.04 5.07E-03 20.10 2.8466+0665 6.5 1.142605 1.736+04 2.5 .04+665 6.5 4.4996.04 5.00E-03 12.12 1.8506.066 6 .6 1.2426+05 (.726+04 15.00 5.0756+06 66 6.6 4.074E-04 4.95603 (2.14 1.854E-0667 6.7 2.2066+05 1.706+04 14.06 5.087E+06 67 6.7 3.66*04 4.S06.03 22.70 1.586.0668 6.9 1.322605 1.676+04 12.67 5.100E+06 68 6.7 3.96*04 4.80E-03 12.35 1.8626+0669 6.9 (.4646+05 1.64E+04 11.23 3.1156+06 69 6.9 3.945E.04 4.67E-03 12.35 .66+ZE067069 6.9 4.1945004 4.6E.03 11.28 5.166.0672 7.2 (.636E*05 (.560E04 9.50 5 .134E06 70 7.0 4.773E04
4.S603 10.05 2.871E06
7 7.2 2.6502605 2.1704 9.46 01 7.1 3.2Z3E64 4.73E*03 9.06 .8766*0673 7.3 1.5016+05 2.48E604 9.97 5.1636+06 72 7.Z 5.490604 4.65603 9.48 1.962E+0674 7.4 1.372E+05 2.466+04 9.67 5.17606 73 7.3 5.5336*04 4.386E03 9.27 ,987E0674 7.4 1.237E#05 1.44E#04 10.63 $.!926 0. 74 7.4 3.403C-04 4.-0E.03 8.32 1.936')67 7.6 2.2376.05 2.446+04 11.65 3.2046+06 75 7.5 5.1356.04 4.4260'3 8.61 1.8986E"76 7.6 I.11E60S 1.43E+04 12.80 5-.2166+06 76 7.6 4.8306.04 4.326.,3 9.00 .9.36-.677 7.7 1.008605 1.42E04 14.12 5.226E06 77 7.7 4.55E.04 4.3 M 03 9.44 1.907606 76 7.9 9.0101+04 1.42E*04 25.82 5.2356,06 78 7.7 4.3!8E04 4.37E03 9.89 2.9126-0679 7.9 7.929604 1.436#04 17.99 3.Z436.06 79 7.9 4.1406.04 4.256.03 20.27 1.g91E06 s0 6.0 6.7766.04 1.43[+04 21.05 5.249E-06 90 8.0 3.9)E04 4.25E 03 10.72 .92G066
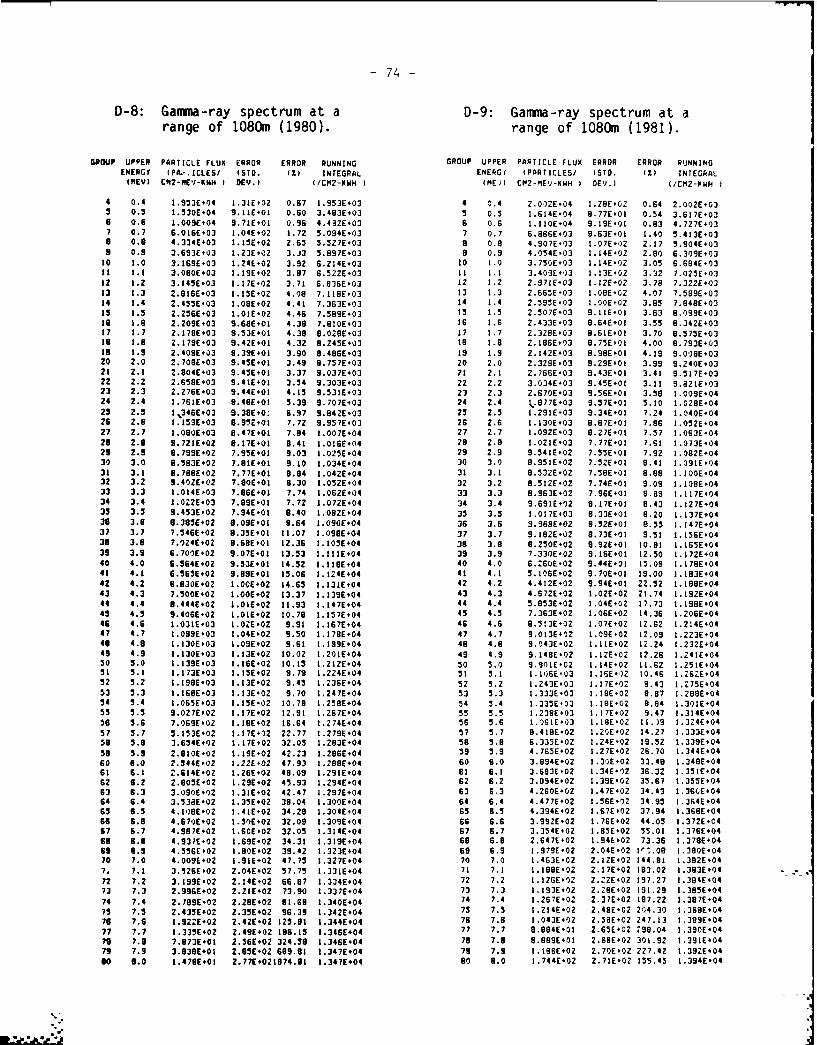
- 74-
D-8: Gamma-ray spectrum at a D-9: Gamma-ray spectrum at arange of 1080m (1980). range of 1080m (1981).
GROUP UPPER PARTICLE FLUX ERROR ERROR RUNNING GROUP UPPER PARTICLE FLUX ERROR ERROR RUNNING ENERGY IPA,. ICLES/ (STD. (1) INTEGRAL ENERGY (PARTICLES/ (ST . (2) INTEGRAL
E (EUI CN2-IMEJ-KWH I DEV.) (I/CMZ-KWH I (ME)) CMZ-MEJ-KWH ) DEV.) (ICM2-KWH.'
4 0.4 1.953E.04 1.31E02 0.67 1.953E+03 4 0.4 Z.07ZE.04 1.29E OZ 0.64 2.002E.030.5 1.530E+04 9.1IE01 0.60 3.463E*03 5 0.5 1.614E.04 8.77E*01 0.54 3.617E+03
6 0.6 I.OOE-04 9.71E*01 0.96 4.432E.03 6 0.6 1.IIOE-04 9.19E*01 0.83 4.727E*037 0.7 6.016E03 1.04EOZ 1.72 3.094E.03 7 0.7 6.9666.03 9.63E O1 1.40 5.413E.038 0.6 4.334E#03 1.15E02 Z.65 5.527E-03 a 0.8 4.907E,03 1.07E+02 2.17 5.904E+039 0.9 3.693E03 1.23E.02 3.33 3.897E*03 9 0.9 4.054E,03 1.14E02 2.80 6.309E4031 10 1.0 3.169E 03 1.24EOZ 3.92 6.214E03 10 1.0 3.750E.03 1.14E-02 3.05 6.684E.03It 1.1 3.0906.03 1.19E#02 3.97 6.5ZE.03 11 1.1 3.409E-1,3 1.I3E4O2 3.32 7.025E+0312 1.2 3.145E.03 1.17E-02 3.71 6.836E+03 12 1.2 2.971E403 1.12E+02 3.78 7.322E+1)313 1.3 2.916E-03 .ISE02 4.08 7.11E.03 13 1.3 2.665E03 I.OBE.02 4.07 7.589E.0314 1.4 2.433E-03 1.OBE02 4.41 7.363E03 14 1.4 2.595E.03 1.00E*02 3.85 7.848E+031S 1.5 2.256E*03 I.OIE-OZ 4.46 7.589E.03 15 1.5 2.307E-03 9.IIE.0I 3.63 8.099E+03Is 1.6 2.209E+03 9.689*01 4.38 7.810E+03 16 1.6 Z.433E03 8.64E+01 3.55 8.342E*0317 1.7 2.178E03 9.33E+01 4.39 6.028E+03 17 1.7 Z.328E*03 8.61E+0I 3.70 8.573E.0319 1.9 2.179E03 9.4ZE*01 4.32 8.Z45E03 19 1.9 2.186E,03 8.75E01 4.00 8.793E+03is 1.9 2.4096E03 9.39E01 3.90 8.486E03 19 1.9 2.142E-03 9.99E+01 4.19 9.000690320 2.0 2.7096.03 9.45E+01 3.49 9.757E03 20 2.0 2.329E03 9.29E*01 3.99 9.240E.0321 2.1 2.804E.03 9.45E+01 3.37 9.037E+03 71 2.1 2.766E-03 9.43E-01 3.41 9.517E-0322 2.2 2.6586.03 9.41E01 3.54 9.303E03 22 2.2 3.034E*03 9.45E+01 3.11 9.921E.0323 2.3 2.276E.03 9.44E.01 4.15 9.531E403 23 2.3 2.670E+03 9.56E+01 3.58 l.009E*0424 2.4 1.761E.03 9.48E-01 5.39 9.707E+03 24 2.4 k.9776.03 9.57E-01 51 .2E02 5 2. 5 1,346E+03 9.389E 0 : 6.97 9.842 6E 03 25 2. 5 . 91 03 9.34 *01 7.24 1.040 E04
26 2.6 1.159E03 8.93E01 7.72 9.957903 26 2.6 1.130E-03 9.37*01 7.86 1.052E04
27 2.7 1.0906E03 8.47E01 7,94 1.007E+04 27 2.7 1.092E+03 8.27E01 7.57 1.063E.0429 2.9 9.721E.02 8.17E.01 6.41 1.016E+04 29 2.8 1.021E.03 7.77601 7.6 1.073E04"29 2.9 0.7999E 0Z 7.95E+01 9.03 1.025E 04 29 2.9 . #1E-03 7.55E 01 7.92 1.082E 04
30 3. . 3~o 76E*l 9.10 1.034E#04 30 3.0 8.951E-02 7.5ZE+O! 9,41 1.09LE.04-'''.-.
31 3.1 9.7899E02 7.77E*01 9.84 1.042E04 31 3.1 8.5326.02 7.5BE.01 9.88 .IOOE.0432 3.2 9.40ZE.02 7.80E-01 8.30 1.052E04 32 3.2 8.51ZE-02 7.74E+01 9.09 1.108E0433 3.3 1.014E,03 7.866+01 7.74 I.06ZE04 33 3.3 8.963E+02 7.96E-01 8.89 1.117E#0434 3.4 1.453E03 7.99E01 7.72 1.072E04 34 3.4 9.691E.02 8.17E+01 8.43 1.127E-0435 3.5 9.453E.02 7.946*01 9.40 1.0626.04 35 3.5 1.017E03 8.33E401 9.20 1.137E+0436 3.9 9.385E+02 8.09E#01 9.64 1.090E.04 36 3.6 9.968E#02 9.52E-01 8.55 1.147E0437 3.7 7.546E.02 8.35E*01 11.07 1.0989E04 37 3.7 9.18ZE02 8.73E-01 9.51 1.1566.0436 3.9 7.Z4E02 8.66E+01 12.36 1.103E+04 36 3.8 8.250E-02 8.92E*01 10.81 1.165E*0439 3.9 6.700E#02 9.07E:0I 13.53 1.111E+04 39 3.9 7.330E-02 9.IGE01 12,50 1.172E+0440 4.0 6.564E+02 9.53E*01 14.32 1.119E+04 40 4.0 G.260E+02 9.44E#01 15-09 1.17SE 04
41 4.1 6.563E*02 9.99E.0I 15.06 1.124E*04 41 4.1 5.106E.02 9.70E*01 19.00 1.183E+0442 4.2 6.830E.02 1.00E*02 14.65 1.131E+04 42 4.2 4.412E*02 9.94E-01 22.52 1.I8090443 4.3 7.500.02 1.0o0+02 13.37 1.139E.04 43 4.3 4.672E.02 I.OZE.02 21.74 1.19ZE+0444 4.4 0.444.0Z 1.OIE02 11.93 I.147E*04 44 4.4 5.953E-02 1.04E*02 17.73 1.1966E0445 4.5 9.4066.02 I.OIE02 10.79 1.157E+04 45 4.3 7.363E02 1.06E02 14.36 1.206E0446 4.6 1.031E-03 I.OZE02* 9.91 1.167E*04 46 4.6 8.513E-02 1.07E*02 IZ.62 1.214E0447 4.7 1.0996*03 I.04E+02 9.50 1.178E+04 47 4.7 9.013E*02 .09E*02 12.09 1.223E0441 4.9 I.130E+03 1.09E+02 9.61 1.19E04 48 4.8 9.043E-02 .IIE.02 12.24 1.23*04
49 4.9 1.130E.03 1.13E*02 10.OZ 1.201E+04 49 4.9 9.148E02 1.IZE02 12.26 1.241E.0450 5.0 1.139E#03 1.16E02 10.15 1.212E+04 50 5.0 9.901E.02 I.14EOZ 11.62 1.2516E04SI 5.1 1.173E.03 1.15E02 9.79 1.224E04 51 5.1 1.106E#03 1.16*E02 10.46 1.26,E0452 5.2 1.198603 I.I3E*02 9.45 1.236E04 52 5.2 1.243E03 1.17E*02 9.43 1.275E+0453 5.3 1.168E03 1.13E+0Z 9.70 1.247E04 53 5.3 1.333E+03 I.lBE02 8.87 1.288E04 54 5.4 1.065E+03 t.1SE.02 10.78 1.25E.04 54 5.4 1.335E03 l.IBE.02 6.84 1.301E-0455 5.5 9.027E.02 1.17E02 12.91 1.267E.04 55 5.5 1.2386.03 1.17E02 9.47 1.314E40456 5.6 7.069E.02 I.16E02 16.64 1.274E-04 56 5.6 I.O6E103 I.19E,02 11.)9 1.3246.0457 5.7 5.133E#02 1.17E-02 22.77 1.279E04 57 5.7 9.416E02 I.209*02 14.27 1.333E*0458 5.9 3.654E.02 1.17E-02 32.05 1.283E.04 56 5.9 6.333E502 1.24E-02 19.52 1.339E0459 5.9 Z.IOE*OZ t.19E*02 42.23 1.2866.04 59 5.9 4.765E.02 1.27E*02 26.70 1.344E40460 6.0 2.544E02 1.22E-02 47.93 1.2886.04 60 6.0 3.894E02 1.30E02 33.49 1.3486.0461 6.1 2.6141.01 1.26 OZ 49.09 1.291E.04 61 6.1 3.683E-02 1.34E*02 36.32 1.3516.0462 6.2 3.9056*O2 .29E*02 45.93 1.2946.04 62 6.2 3.8946.02 1.39E02 35.67 1.3556.0463 6.3 3.090E.02 1.31E*02 42.47 1.297E#04 63 6.3 4.260E*0Z 1.47E02 34.43 1.36GE60464 6.4 3.538E02 1.35E*02 39.04 1.300E#04 64 6.4 4.477E02 1.56E92 34.95 1.364E-0465 6.5 4.1086.02 1.41E+02 34.29 1.304E-04 65 6.5 4.3946+02 1.67E*02 37.94 1.369E0466 6.9 4.67-)E02 1.3(*02 32.09 1.309E04 66 6.6 3.99ZE02 1.76E*02 44.05 1.372E-0467 6.7 4.987E.02 l.60EOZ 32.05 1.314E.04 67 6.7 3.354E02 1.85E*02 5.01 .3766.0469 6.9 4.937.02 l.69.E02 34.31 1.319E+04 69 6.9 2.647E#02 I.94EOZ 73.36 1.376E0469 9.9 4.556E02 I.90E02 39.42 1.3236.04 69 6.9 1.979E*02 2.04E02 1P, 08 1.3906.0470 7.0 4.009E.02 1.91E+02 47.75 1.327E#04 70 7.0 1.4G3E02 2.129*02 144.81 1.382E.04 7. 7.1 3.526E602 2.04E#02 57.75 1.331E+04 71 7.1 1.186E.02 2.17E*02 183.02 1.393E.0472 7.2 3.1996.02 2.14E.02 66.97 1.334E+04 72 7.2 1.12E6*02 2.22E02 197.27 1.384[-04 73 7.3 2.996*02 2.21E*02 73.90 1.337E-04 73 7.3 1.193E02 2.28E02 191.29 1.395E0474 7.4 2.799E+02 2.29E.02 91.68 1.3406.04 74 7.4 1.267E-02 2.37E02 197.22 1.367[-0473 7.5 2.433E02 2.35E+02 96.39 1.342E04 75 7.5 1.214E02 2.46E02 204.30 1.368E0476 7.6 1.922E02 2.42E02 125.61 1.344E+04 76 7.6 1.043E02 2.38E02 247.13 1.3896*0477 7.7 1.335E602 2.49E+02 196.15 1.3466.04 77 7.7 8.884E-01 2.65E-02 298.04 1.3906.0479 7.9 7.73E#01 2.S6E*02 324.9 1.346*04 79 7.9 8.69 *E01 2.6 96902 301.92 1.391604
79 7.9 3.838E+01 Z.65E*02 699.91 1.347E+04 79 7.9 1.I966E02 Z.70E02 227.42 1.39ZE*04so 9.0 1.479.01 2.776.021974.91 1.347E.04 60 9.0 1.744E02 2.71E*02 155.45 1.3946*04
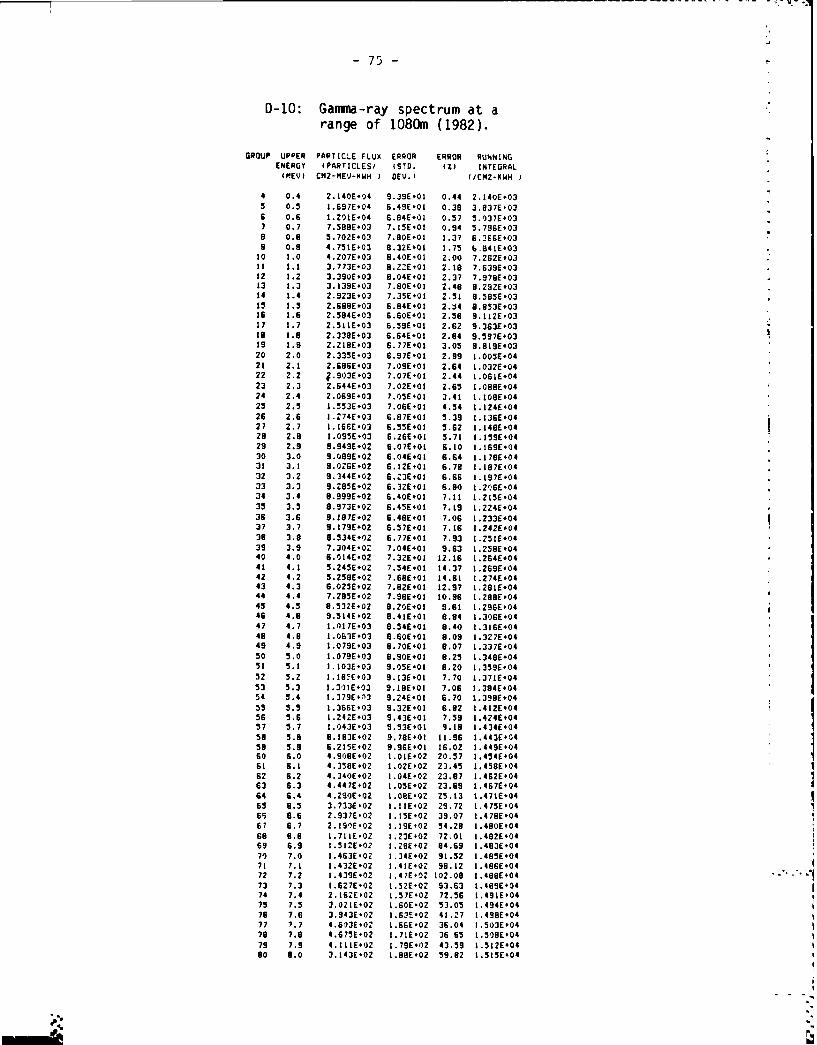
-75-
D-10: Gamma-ray spectrum at arange of 1080m (1982).
GROUP UPPER PART ICLE FLUX ERROR ERROR RUN4NING ENERGY (PARTICLES/ (STD. 1%) INTEGRAL(P60) CM2-ME-KWH DEV6.) 2/CM2-KWH J
4 0.4 2.140E-04 9.JSE.01 0.44 2.140E.035 0.5 1.697E.04 6.49E-01 0.38 3.837E,036 0.6 1.201E-04 6.84E-01 0.57 5.037E#037 0.7 7.5886.03 7.15E+01 0.94 5.79SE.03a 0.9 5.702E+03 7.80E-01 2.37 6.266E*03 .8 0.8 4.751E+03 6.32E+01 1.75 6,841E-0310 1.0 4.2076.03 8.40E-01 2.00 7.262E+0322 1.2 3.773E-03 8.22E.0l 2.18 7.6396.0314 2 2.2 3.390E.03 8.04E+01 2.37 7.978E#0313 1.3 3.139E+03 7.80E*0i 2.40 9.2926.0314 1.4 2.923E+03 7.35E+01 2.51 8.5836.03i5 2.5 2.688E+03 6.84E+01 2 .t4 8.853E+03is2 1.6 2.504E.03 6.60E*01 2.56 9.1126.0317 1.7 2.5116.03 6.59E-01 2.62 9.363E.03is 1.8 2.338E+03 6.64E-01 2.84 9.5976+0329 1.9 2.2286.03 6.77E*01 3.05 9.8196.0320 2.0 2.3356.03 6.97E+01 2.99 1.005E-0421 2.1 2.6866.03 7.096*02 2.64 1.032E.0422 2.2 W.903E.03 7.07E~01 2.44 1.0616.0423 2.3 2.644E.03 7.02E-01 2.65 1.0886.0424 2.4 2.069E.03 7.03E-01 3.41 1.1086.0425 2.5 1.533603 7.06E+01 4.54 1.124E.0426 2.6 2.2746.03 6.876*02 5.39 1.136E#0427 2.7 1.166E-03 6.356.0 5.62 2.248E.0428 2.9 1.095E+03 6.26E+01 5.71 1.159E#0429 2.9 9.9496.02 6.07E-01 6.10 2.1696.0430 3.0 9.089E.02 6.04E*02 6.64 2.2786.0432 3.1 9.0266.02 6.12E601 6.7e 2.2876.04 32 3.2 9.344E.02 6.Z36*02 6.66 1.197E.04 33 3.3 9.2856.02 6.32E.01 6.0 -2'60434 3.4 8.999E+02 6.40E*02 7.11 1.215E.0435 3.5 8.973E+02 6.45E.01 7.19 1.224E.0436 3.6 9.187E.02 6.48E*01 7.06 1.233E.0437 3.7 9.2796.02 6.576*01 7.16 1.242E.0438 3.8 8.5346.02 6.77E-01 7.93 1.2516.0439 3.9 7.304E.02 7.04E+01 9.63 1.2586.0440 4.0 6.014E.02 7.32E+01 22.16 1.2646*04
41 4. 3.2456*02Z 7.546*01 24.37 1.269E#04
42 :42 5.2586*02 7.686*0; 24.6,a 1 1746*0443 43 6.022O 7.8 0 22.9 1.2816*0444 4.4 7.2856.02 7.99E*02 20.96 1.288E*0445 4.5 8.532E.02 8.2r06402 9.61 2.2966*0446 4.6 9.514E-02 8.41E-01 83.84 1.306E+0447 4.7 2.02176.03 8.546*02 8.40 2.3266.0448 4.8 2.0616.03 8.606*02 8.09 1.3276#0449 4.9 1.079E.03 8.706*01 8.07 1.337E.0450 5.0 1.079E.03 8.90E+01 8.25 1.348E+0451 5.1 2.1036.03 9.05E-01 8.20 2.359E+04 52 5.2 '.18VE.03 9.236*02 7.70 1.371E*04
*53 5.3 2.3,)16.03 9 .I8E+0 7.06 2.3846.0454 5.4 2.3796.73 9.246*02 6.70 1.3986.0455 5.5 1.3666#03 9.32E+01 6.82 1.4126+0456 5.6 1.2426*03 9.43E#01 7.59 2.4246.04
*57 5.7 2.0436.03 9.536*01 9.29 1.434E#0458 5.8 8.183E-02 9.76E-01 12.96 1.443E#04
59 5.9 6.2156.02 9.96E+01 26.02 2.449E.04 60 6.0 4.9086.02 2.02E-02 20.57 2.4546.0461 6.1 4.3!86.02 2.026'02 23.45 1.4586*0462 6.2 4.340E.02 1.04E-02 23.87 1.462E#0463 6.3 4.447E*02 2.056*02 23.69 1.467E+04164 6.4 4.29()E.02 1.08602 25.13 1.4116*04 ~65 6.5 3.733E-02 2.226.02 29.72 1.4756.0465r 6.6 2.937E.02 2.156*02 39.07 2.4786.0467 6.7 2.19')E#02 1.29E*02 54.283 2.4806*0468 . 1.71260 1.2302 72.012.8.0
69 6. 252602 .28E+02 84.69 1483E.0470 7.0 1.463E.02 2.346.02 91.52 1.4856*04
~171 7.2 :.4326:02 ::41E-02 98.12 1.860472 7. 2.39E.02 .47E-02 202.0 1.488E.04 73 7.3 1.627E*02 1.52E-02 93.63 1.4896.0474 7.4 2.162E.02 1.57E*02 72.56 1.491E#0475 7.5 3.02[E*02 1.60E-02 53.05 1.494E#04 76 7.6 3.943E.02 1.63E*02 42.27 2.4986.04II%..PN,77 7.7 4.603E-02 1.666.02 36.04 2.503E.04 78 7.8 4.673E-02 1.71E-02 36 65 1.386*04 79 7.9 4.2126.02 1.79E.'02 43.59 2.512604so 8.0 3.2436.02 1.98E602 59.82 1.515E*04
-77-
%. %*
S.% .1-- .Zk" -
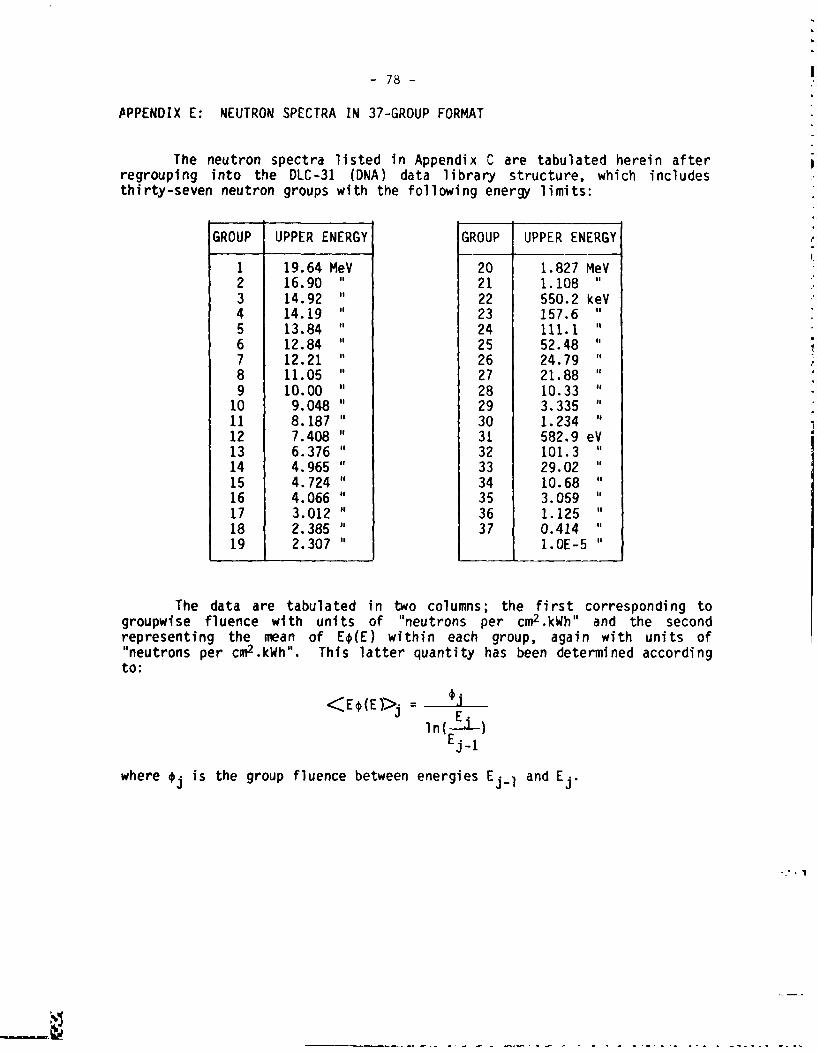
-78-4_
APPENDIX E: NEUTRON SPECTRA IN 37-GROUP FORMAT
The neutron spectra listed in Appendix C are tabulated herein afterregrouping into the DLC-31 (DNA) data library structure, which includesthirty-seven neutron groups with the following energy limits:
GROUP UPPER ENERGY GROUP UPPER ENERGY
1 19.64 MeV 20 1.827 MeV2 16.90 21 1.1083 14.92 " 22 550.2 keV4 14.19 " 23 157.65 13.84 " 24 111.16 12.84 " 25 52.487 12.21 " 26 24.79 "8 11.05 " 27 21.889 10.00 " 28 10.3310 9.048 " 29 3.33511 8.187 " 30 1.234 "12 7.408 " 31 582.9 eV13 6.376 " 32 101.3 "14 4.965 " 33 29.02 "15 4.724 34 10.6816 4.066 35 3.05917 3.012 ' 36 1.12518 2.385 " 37 0.41419 2.307 " 1•OE-5
The data are tabulated in two columns; the first corresponding togroupwise fluence with units of "neutrons per cm2.kWh ' and the second
representing the mean of EO(E) within each group, again with units of"neutrons per cm2 .kWh". This latter quantity has been determined accordingto:
="- ~<E (E>}j= C
E, _ j-1
where fj is the group fluence between energies Ej1 and Ej.
%% %
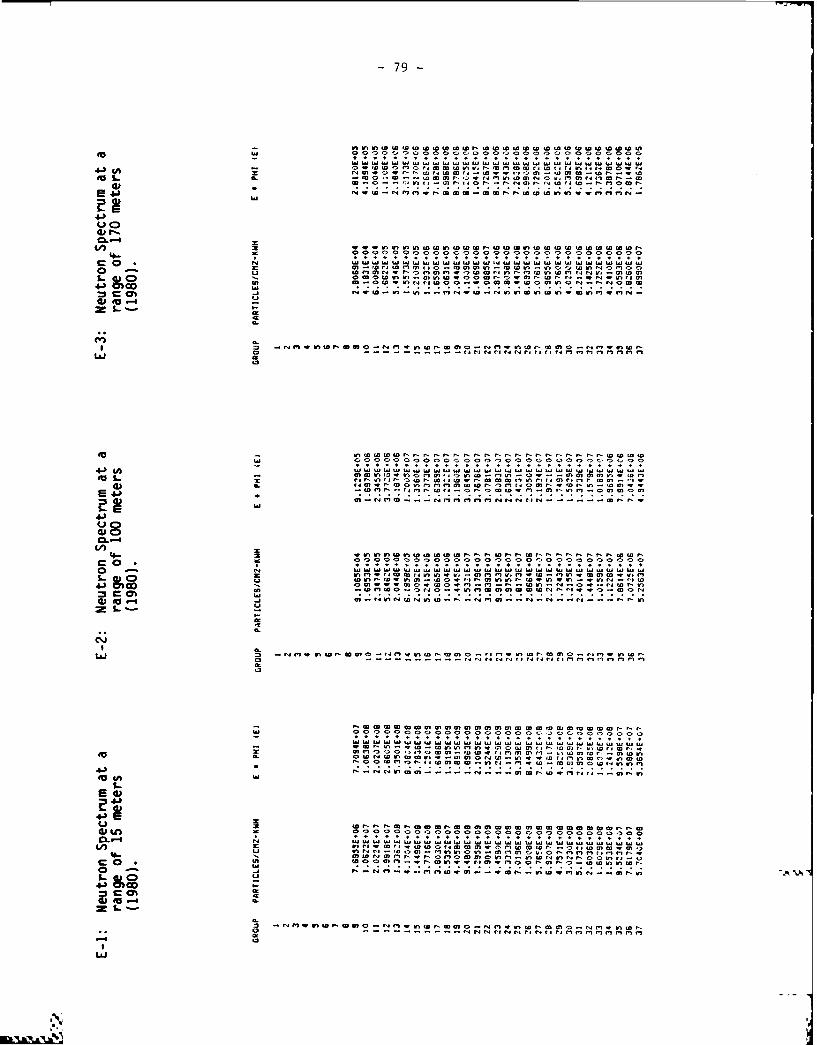
-79 -
0) WI La tot aL oI atoL at oL otot oL ot
o a LW 11w I . ; nor mt ma,. ,- W G tl Ca to C dw. n ( aW100 ta..
a'
4J0(
to I-
= 4C ar.- -
s- N.4J4
Q#4
r_ 0
C 0% w .. . .. e. - D W. . . . . . . . . .. . . . . . . . . . .
~ ( Lc a
4,, =0 I~~ 0 NL ~ ~~~ Uaaa ~ ~ ~~~~ Waaa L~~~~~~~~E~ ~ ~ ~ ~ ~~~~Q nOCV!mtm.1~.eo-l.0W1.0,0 ~~u tn-t.fo 5 4et.0 lm- a W..ea C41 Go
= 0Wt W . o -ne-M.ed-.et e.-to to -0eJ0 mn rrn ~ t e~-d.CDW~-2e ' L
C - 1-VNant--N - - - - - -
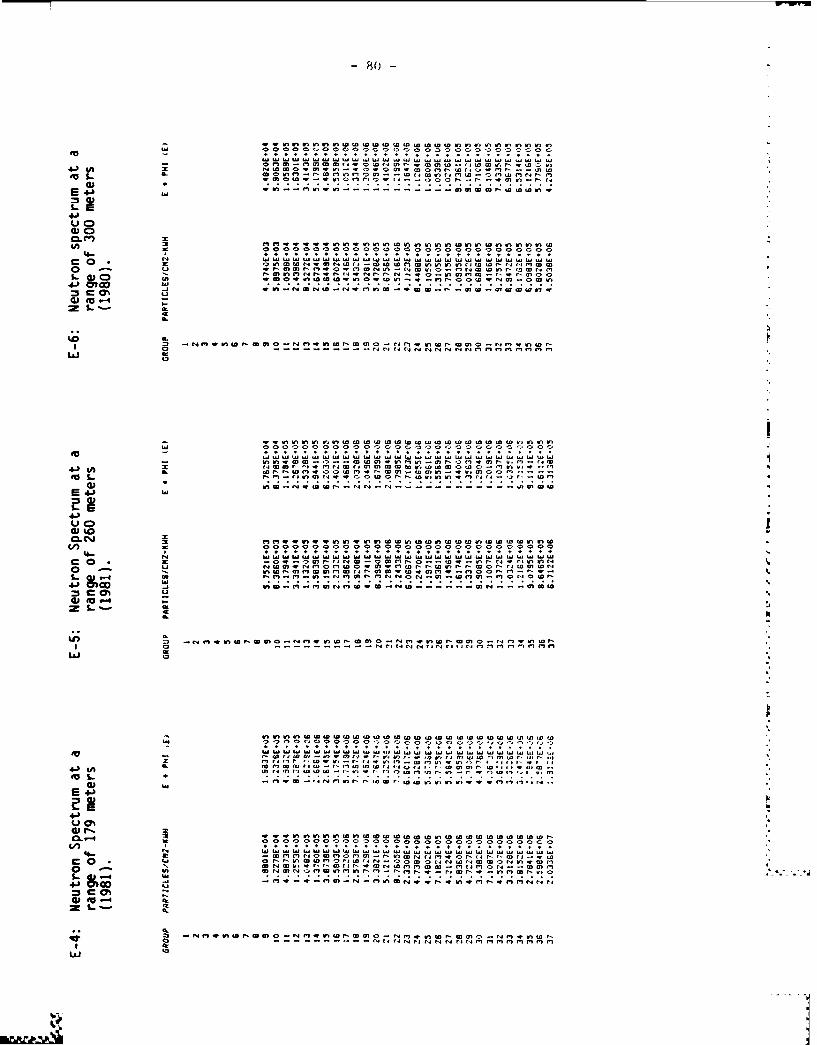
80 -A
0.- 0 000 . . . . . . . . . . . . . . . . . . . . . . . . . . .
4L€._ v o A m
In w m
0 L C fitoofifto~g~...t t.C,.
o. "S°
a.0
4, 4mo wo ooo .,..
CMjw n *i fto n)0WC wtwtowo&2
mr~eetn fi fiflf w toW nf it ito ffnl rto
LI ~ ~ ~ ~1 1; -0O - -e - -r - - -I - - -tt o- o - omomat
4J4
u1: Cou%
CL C4
4) i ' e i m co fi mo to t t to to t. lD to t- t t o t to ,r) - -t - -
4. ; • . .. • . ._ ._ ... . . . .. . . . . .
E J ..6
ON
o.In. .. W )-O- -a 0. -. 0 -.ot -to.
too
4.l)
0
~.C ttJ
"6 ONo 0) C NC) N ) o ie..O 0 N t
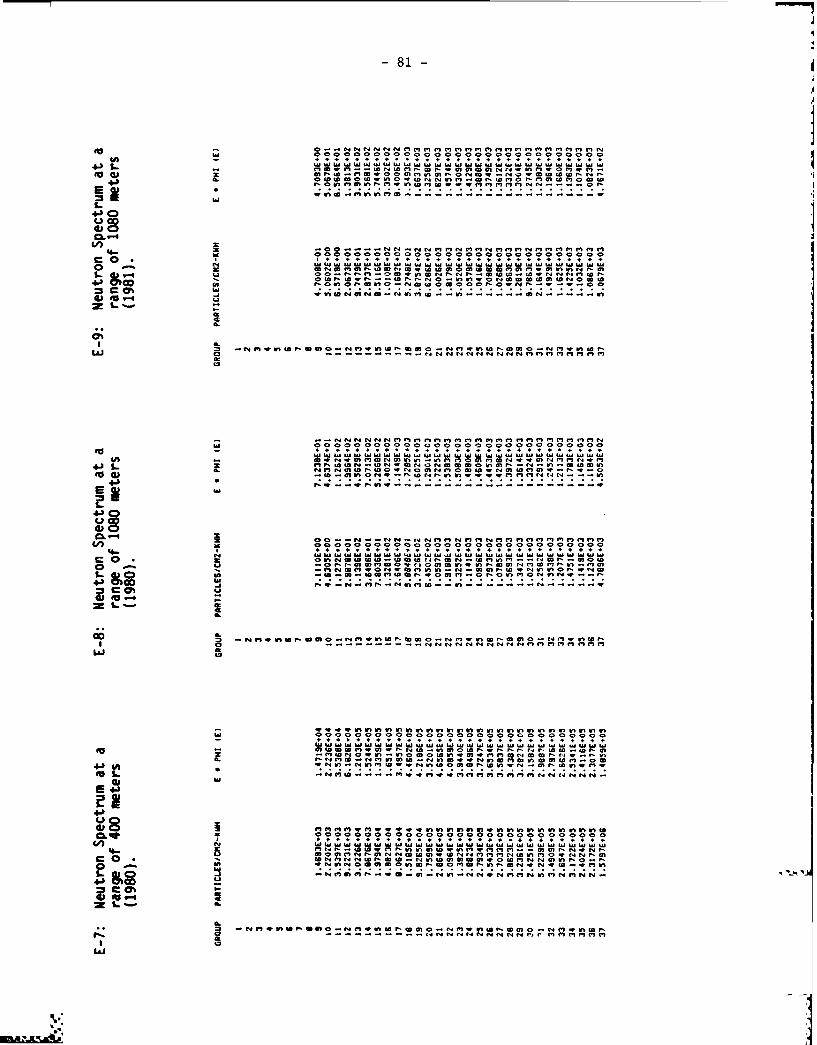
-81-
.n . .. . . .. .. ... ... .. . . *
40 a. 't~WS0W ~ N roo WW 0 WfiW mossn-) nW ,,wI,., r n--.-
C.-44O .4 -.-cn x
4-L n"I nmI
* ~~~~~~ ~Ica 0 0 : O ? O 00000000 0000w* +0
3c 003 riwwww t ow L0NN n Gw ww wi~N n WIw w5 .v -G 0W WN- NN 0nq N w1 W w in r X
I a
IL-4a,1
SM 00000000 0000000000 0000 0 0
M~f m 'lr"
4i0 W ----- -----
E.I41 00CD
4/)~~~~~~~ + +eo oo o o o oo o o o oS~~~.~ ,, W.. . . . w ., * . . 4
r- r. P1n CD m w0 v a 0U n Imn t)n Mn0 *N ~ i 5n a..14 t!.= al 'ASO O O O C N *
to .9 tC r 0CN5*~N~-.I bSV!-- - - - - - - -41 Go
a. es nw oo- MWWNN w=-"M nNNNNM fl"Q lflflfMW-P - - --
- *W5*000 C0 ~ i00 gC0 nnanWi SSWIVS vSV
a0. N 0 W - . 0000So,. ..00
4-
41,U8I
(n fn 0000000000000000000000000000mCL nW* +.0
W.O .. r'. WNS)t~ IW AI w~05
0M6 W e IN 0 W0minO co OI9 mWNW N P WC4 W a m
ILn.J NN *00..NweNN NNI=tN .
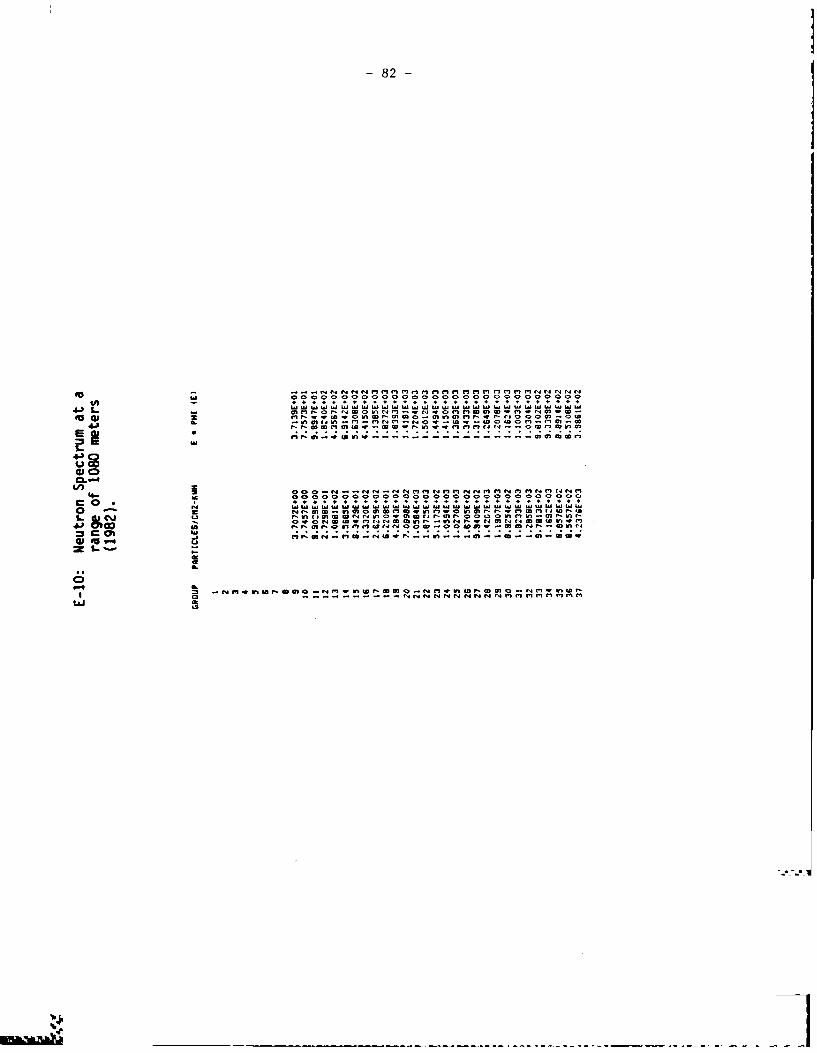
-82-
:+4+ww.
06-4
4)rUv -cm- MW w ~ m -
LJ0
e, I.. * ... .. -. ' ... . . . .
- m,.,.m-83 -
."...
APPENDIX F GAt44A-RAY SPECTRA IN 21-GROUP FORMAT
'j.' I I
S
,. :
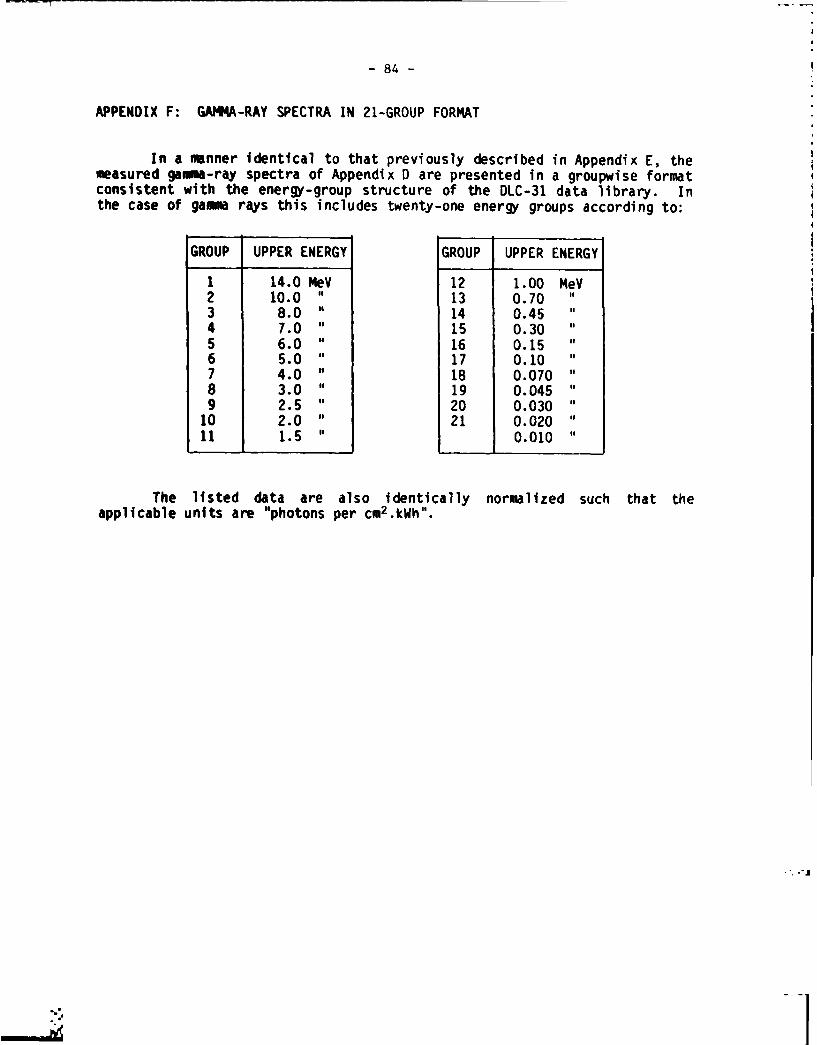
APPENDIX F: GAMMA-RAY SPECTRA IN 21-GROUP FORMAT
In a manner identical to that previously described in Appendix E, themeasured gamma-ray spectra of Appendix D are presented in a groupwise formatconsistent with the energy-group structure of the DLC-31 data library. Inthe case of gamma rays this includes twenty-one energy groups according to:
GROUP UPPER ENERGY GROUP UPPER ENERGY
1 14.0 MeV 12 1.00 MeV2 10.0 " 13 0.703 8.0 " 14 0.454 7.0 " 15 0.30 "5 6.0 " 16 0.156 5.0 " 17 0.107 4.0 " 18 0.070
3.0 " 19 0.0459 2.5 " 20 0.03010 2.0 " 21 0.02011 1.5 " 0.010
The listed data are also identically normalized such that theapplicable units are "photons per cm2 .kWh".
.:.: :.$
i..,':::
4-o
.. 4. * 4 --... . . % % 9 .: s pj
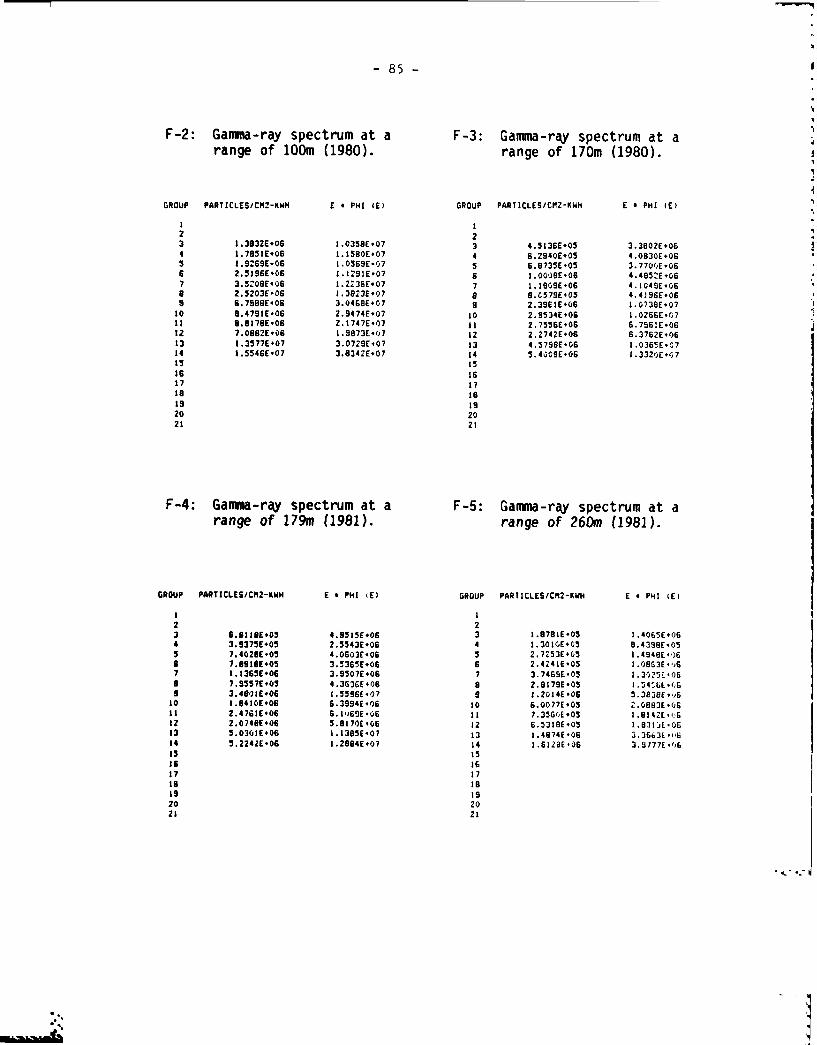
-85-*I..
F-2: Gamma-ray spectrum at a F-3: Gamma-ray spectrum at arange of lOOm (1980). range of 170m (1980).
GROUP PARTICLES/CM2-KWH E PHI (E) GROUP PARTICLES/CM2-KWH E PHI (E)
2 23 1.3:32E+06 1.0358E,07 3 4.5136E*05 3.3002E.064 ,.7 5E40o .BoOE-07 4 6.2S40E+05 4.0830.065 2.9269E-06 i.0569E-07 5 6.8735E-05 3.770(E.06S 2.'I9SE.0S 1.1291E-07 6 1.000B£.06 4.4852£067 3. SOSE406 .2'38E.07 7 1. 19SE06 4.1049E.06S 2. 5203E:06 I,3823E.+7 G .C579E+05 4.4ISSE.0"
75E 6756E06 3.04G6E+7 9 2.39C1E#06 .0738E0710 :.4791E,06 2.9474E*07 10 2.9534E 06 1.026GEE- 07II 9.9176E'06 2.I747E*07 i.7556E-06 6.7561E-0612 7.Oe82E*v6 l.9673+*07 12 2.274ZE.06 6 3762E.06
13 1.3577E*07 3 072SE*07 13 4.579SE.06 C 036,E:0714 1.5546E-07 3 .34zE.07 14 5.4009E.06 1.332'£ '7 25 17
Is 1617 17
ISis I9 IS20 2021 21
'A.--..,-
F-4: Gamma-ray spectrum at a F-5: Gamma-ray spectrum at arange of 179m (1981). range of 260m (1981).
GROUP PARTICLES/CMZ-KhH E PHI (E) GROUP PARTICLES/CM2-KWH E * PHI CE)
I I2 23 6.E1ISJ*05 4.SSISE.06 3 1.8781E-05 1.4065E064 3.9375E.05 2.5543E-06 4 I.301;E'05 S.4396E.05 3 7 402:E-0S 4.0603E+06 5 .7053E48E5 :.:4)46E6 6 7.091 E.05 3.5365E.06 6 2.4241E-05 1.SG3E *I7 1.1365E+06 3.9507E.06 7 3.746'E"05 1.3'J5t.06" 7.9557E405 4.363GE'06 S 2.SI79E-05 1.54 b.IL,-G9 3.4B6IE.06 1.5396E.07 S 1.2014E-06 5.3238E.,6
to I.S4IOE.O6 6.3994E06 10 6.0077E#03 2.08B3E:,06lII 2. 4762'06 6.1')69E.u6 IC 7.35GOE*05 1.81I42..6
2.0748E.06 5.8170 E06 12 6.531SE.05 1.831.O613 5.0301E*06 1.1385E-07 13 i.4874E*06 3.3663E ol"
14 5.2242E-06 1.2884E.07 14 l.612;+E,0 3. 9777E -()6 is 15
17 17
IS C916 20
4 %
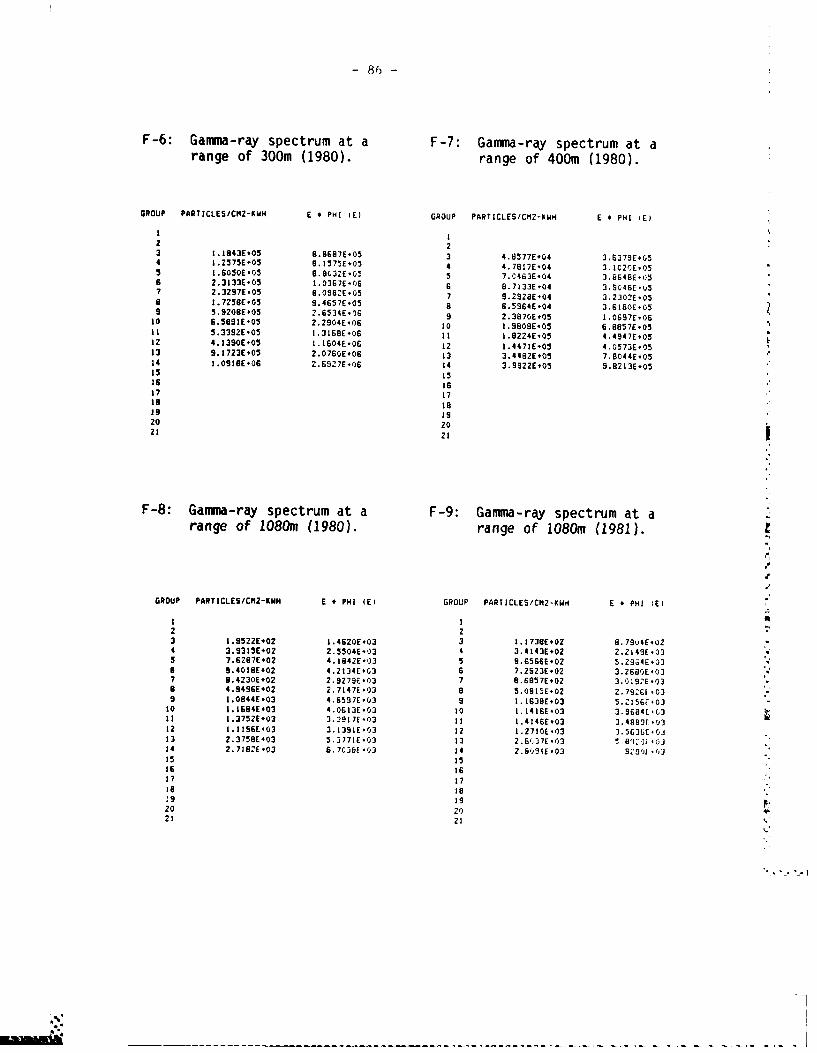
-86-
F -6: Gamma-ray spectrum at a F-7: Gamma-ray spectrum at arange of 300m (1980). range of 400m (1980).
GROUP PARTICLES/CMZ-KWdH E *PHI IE) GROUP PARTICLESCM2-KWHj E *PHI~ (E)
I I2 2
3 2283E.O5 a.8687E-05 3 4.8577E+04 3.6379E+05.4 .55E+05 9:1575E+05 4 4.7817E*O4 3.1020E-058 .00EO .03,E-05 5 7.C463E.O4 3.864SE:65
6 2.3133E-03 I 0367E:(J6 6 8.7:33E-04 3.9046E Q57 2.3 297E-05 8:096'E 05 7 B;592SE-04 J.3:BSE +05
27256E.05 9.465;E.059 592SE~5 .654Eo69 2.387GE-05 1.0697E+06
10 6.5091E-05 2.2904E-06 10 1.980SE.05 6.8857E-05 It 5.3392E-05 1.316BE*-j6 22 1.8224E,05 4.4947E-0512 4.1390E.05 2.1604E'06 12 1.4471E-05 4.0573E-0513 9.1723E-05 2.0760E-06 13 3.4482E+03 7.8044E-054 1.091SE.O6 2.6927E.C06 14 3.9822E+05 9.8213E-05.-Is 15
17 1 7
F-8: Gamma-ray spectrum at a F-9: Gamma-ray spectrum at a
2 2
3 e 190 03 rangef00 (19 02
22 2220-2297S-37865E-2309E0
it8 Gamma-ray3 spectrum 0 at a.16E0 F-9.Gmm-ry petrm trage 3f 75E083 (180. range3 3 2* 1 7E 2083 (181). 1o
is~~ 1" 5
GROUP PATICLES/CN-KWH E * PHI (F.) GROUP PARTCLES/CM2-pH E * PHI E)
20 2021 21
% %.-
3 I. 043{',, O2 . 4GZ87E.05 3 2.38577 .O 8J. 79j',,.u2
4 .2 5E02 . 550E0 4 41 :E04 3. 224E.0".%"i .60E02 .8 2E.03 5 7.6566E60 .24BE0 2 . 2E02 . 23E.C 3 7 .292E0 3.20E.03
7 .4230E£* 0 Z 9 7 05 7 6 5E 0 3. 16I92E.-_-O3-J
9 .944E 03 .54E'C 9 2.63803 5 .6)O30 2.689 .03 .623E.03 20 .1260 603 6 8E0
1 [ .352 '03 .3 6 .03 22 . 44E03 4. 4887E+2 .1 5 0 3,0 .29604E* 12 1. 47!E"03 .53UE5 13 .758£ 03 .T 72E.O 3 13 3.4'27',,0 7.804E',0i 4 1.182603 .7C37E. 3 4 .92E04.6.0-5'""'3'""
25 1 5,"." 7 17
8 18 20 2021 21
2 2b
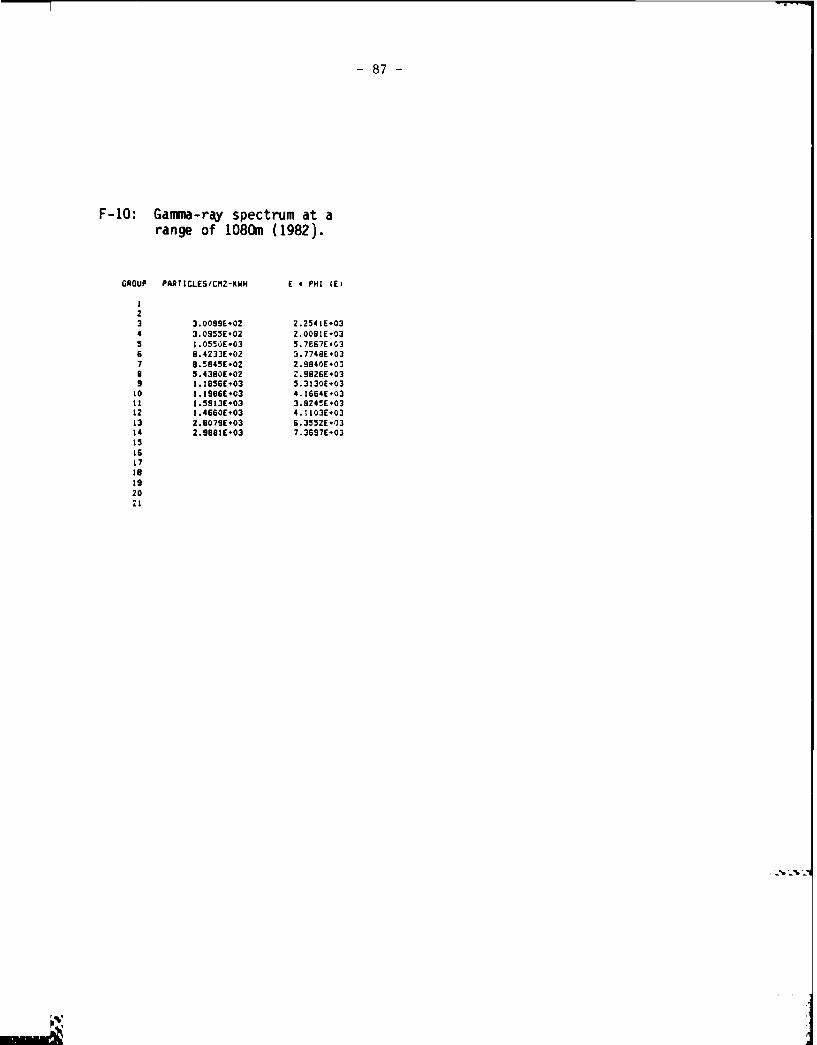
-87-
F-10: Gammna-ray spectrum at arange of 1080m (1982).
GROUP PARTICLES/CM2-RWH E *PHI (E)
23 3.009SE.02 2.2541E-034 3.0953E#02 2.OOSIE-033 1.5SOE.03 S.7667E*G3
6 64233E+02 3.7748E*037*5845E 02 2.984OE.O B .4 380E ,02 z.99GE-03%
9I.:SS6E.03 5.3130E+0310 4.960 41 66:E:03it .51E 03 3 .924 E 031 2 1.4660E '03 4 .110;E 0313 2.8079E ,03 6 .3352E 0314 2.9891E ,03 7.3697E +03
17
20"1
VV
% %p
27.
- 89 - ~DVd SflOIA~&id
APPENDIX GSUMMARY OF FREE-FIELD INTEGRAL MEASUREMENTS
- 90 -
APPENDIX G: SUMMARY OF FREE-FIELD INTEGRAL MEASUREMENTS
Included in this appendix are integral measurements obtained underfree-field conditions at APRF since 1979 and subsequently reported by APRD,WWD and DREO as well as some more recent and as yet unreported measurementsby APRD and DREO. Quantities tabulated include neutron, gamma-ray and totalkermas as well as neutron fluence above 3 MeV energy. Data obtained usingboth integral detectors such as ion-chambers and proportional counters, andalso data resulting from integration of measured particle spectra areincluded. Normalization in all cases has been made to kilowatt-hours andeach quantity has been multiplied by 4nr 2 , where r is the source-to-detectordistance. This converts the measured fluence to units of "neutrons per kWh"and kerma to "rad.cm2 per kWh". In so doing that portion of the observedvariation with distance due strictly to geometric attenuation is eliminated,leaving only the effects of scatter and absorption.
Thirty-two measurements of neutron fluence above 3 MeV are listed, asare thirty-six of neutron kerma, thirty-one of gamma-ray kerma, and thirtyof total kerma. Neutron fluence above 3 MeV has been measured using bothactivation of sulfur tablets (APRO) and integration of NE-213 determinationsof neutron spectra (APRD, WWD, DREO). Neutron kerma has been measuredvariously by six techniques, namely: difference between tissue-equivalention-chamber and Geiger-Miller counter doses (APRD), NE-213 spectroscopyabove 550 keV with proton-recoil spectroscopy below 550 keV (APRD), pure NE-213 spectroscopy above 550 keV (WWD), microdosimetry using a Rossi-typetissue-equivalent proportional counter (DREO), NE-213 spectroscopy above 600keV with boron-triflouride parametric analysis below 600 keV (DREO), andfinally Bonner-ball few-group spectroscopy (APRD). Five of the above-mentioned techniques account for essentially all of the incident neutronkerma, however it should be noted that pure NE-213 determinations above 550keV energy only account for approximately sixty-five percent of the totalneutron kerma, the remainder falling below the lower detection threshold (inthe particular neutron envircnment typical of APRD).
Gamma-ray kerma has been determined directly using Geiger-Mllercounters (APRD), NE-213 spectroscopy (WWD, DREO) and microdosimetrictechniques (DREO). Indirect measurement has also 'een made by subtractingBonner-ball neutron kerma determinations from ion-chamber measurements oftotal kerma. NE-213 determinations are deficient in that gamma-rays ofenergy less than 450 keV (WWD) or 300 keV (DREO) are not detected,conseqently the estimation of gamma-kerma does not reflect that portionfalling below these energies. The specific contribution to kerma below theNE-213 threshold is, however, small (of the order of 5%) and in comparisonto the other methods experience has shown that NE-213 estimations tend infact to be somewhat higher than GM counter measurements at short ranges, butequally lower at longer ranges. Based on the listed observations it istherefore concluded that the non-zero detection threshold of NE-213 does notbias the measurement of gamma-ray kerma unduly, or in excess of estimatedexperimental errors from other sources. It is indicated, however, that thespectral response of NE-213 and GM detectors are not entirely consistent.To date sufficient information from the other independent methods requiredto resolve this discrepancy is not available.
.*1*8
% %Z
%I
- 91 -
Total kerma (neutron plus gamma-ray) has been variously determined byemploying four independent methods, namely: tissue-equivalent ion chamber(APRD), microdosimetric tissue-equivalent proportional chamber (DREO), combination of neutron and gamma kermas measured using NE-213 and BF.detectors (DREO), and addition of Bonner-ball neutron and GM gamma-raydeterminations (APRD). Consistency between these methods is excellent atall ranges - surprisingly so in consideration that all four systems differin design, calibration technique, and analytical methods. No significantlyconsistent variations are apparent in the measured data.
Averaged integral quantities as functions of .range are also listed(Table G-2) on the last page of this appendix. For each range averages ofall experimental measurements of each of the four integral quantitiesmentioned earlier are shown, with two exceptions. Measurements made atranges of 179m and 260m are excluded as the reactor was physically locatedinside its silo at the time. Although the aluminum silo represents aminimal perturbation, in the interests of consistency only data obtainedwith the rt . -tor outside have been included. Also excluded fromcontribution to these averages are measurements of neutron kerma obtainedwith pure NE-213 systems, due to the previously-noted loss of informationbelow 550 KeV.
Within parentheses after each listed average is shown the standarddeviation (sample) of the measurements with respect to the calculated meanvalue, expressed as a percentage of said mean. Thus, these deviations yield an indiction of the self-consistency of the measured data, at each range andfor each quantity. Generally, these deviations indicate that there is verygood consistency within the measurements, particularly so in light of theextended period of experimentation (five years), differences in technique,and inescapable variations in weather conditions and soil moisture content.The best consistency is evident in determination of total kerma (3 to 6%),other quantities being somewhat less consistently-measured (about 5 to 10%).
% .
4.,,
....
•-
; " "."""" " " '"" "'i' ''".-. ---. ", ."-"."-."-. ."," T- . ."-'-"-'" . .L ,".?'
"" " .'- '", .":."- ''' -.:,?:"'.'-''- .. '..-.'''-. .- . " "" - - - .
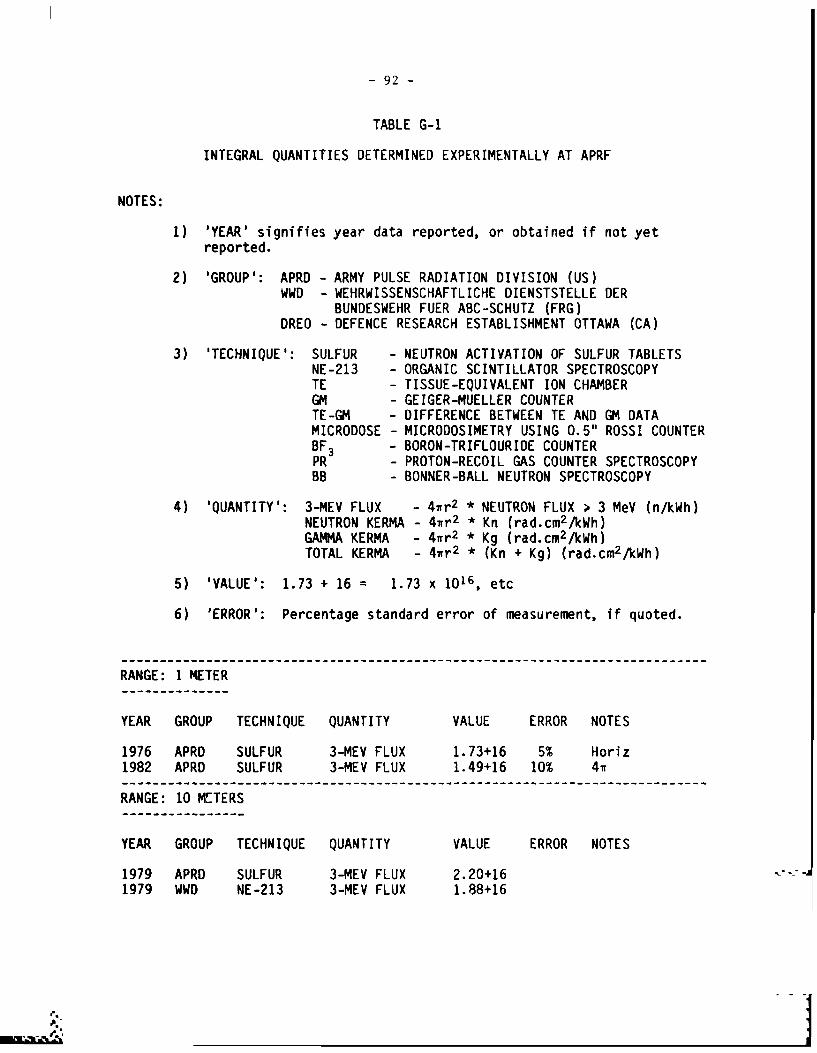
-92-
TABLE G-1
INTEGRAL QUANTITIES DETERMINED EXPERIMENTALLY AT APRF
NOTES:
1) 'YEAR' signifies year data reported, or obtained if not yetreported.
2) 'GROUP': APRD - ARMY PULSE RADIATION DIVISION (US)WWD - WEHRWISSENSCHAFTLICHE DIENSTSTELLE DER
BUNDESWEHR FUER ABC-SCHUTZ (FRG)DREO - DEFENCE RESEARCH ESTABLISHMENT OTTAWA (CA)
3) 'TECHNIQUE': SULFUR - NEUTRON ACTIVATION OF SULFUR TABLETSNE-213 - ORGANIC SCINTILLATOR SPECTROSCOPYTE - TISSUE-EQUIVALENT ION CHAMBERGM - GEIGER-MUELLER COUNTERTE-GM - DIFFERENCE BETWEEN TE AND GM DATAMICRODOSE - MICRODOSIMETRY USING 0.5" ROSSI COUNTERBF3 - BORON-TRIFLOURIDE COUNTERPR - PROTON-RECOIL GAS COUNTER SPECTROSCOPYBB - BONNER-BALL NEUTRON SPECTROSCOPY
4)'QANIT':3-MEV FLUX -4irr2
*NEUTRON FLUX > 3 MeV (n/kWh)
NEUTRON KERMA -4irr2 *Kn (rad.CM2/kWh)
.5,,GAMMA KERMA - ir2 *Kg (rad-CM2/kWh) TOTAL KERMA -4irr
2 *(Kn + Kg) (rad-CM2/kWh)
5) 'VALUE': 1.73 + 16 = 1.73 x 10¹⁶ etc
6) 'ERROR': Percentage standard error of measurement, if quoted.
RANGE: 1 METER
YEAR GROUP TECHNIQUE QUANTITY VALUE ERROR NOTES
1976 APRD SULFUR 3-MEV FLUX 1.73+16 5% Horiz1982 APRD SULFUR 3-MEV FLUX 1.49+16 10% 4w
- - - - - - - - - - - - - - - - - -- - - - - - - - - - - - - - - - - - - - - - - - - - - - - - - - - - -*-- - - -
RANGE: 10 METERS
YEAR GROUP TECHNIQUE QUANTITY VALUE ERROR NOTES
1979 APRO SULFUR 3-MEV FLUX 2.20+16 1979 WWD NE-213 3-MEV FLUX 1.88+16
% 7~4 .
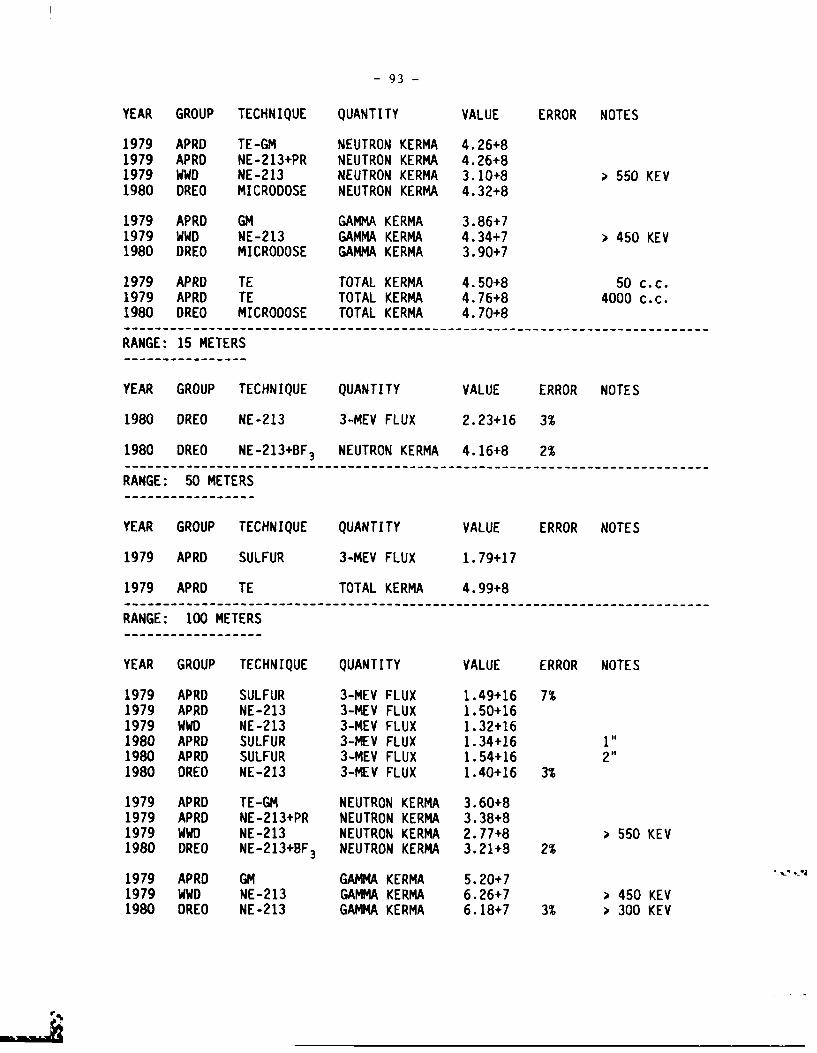
-93-
YEAR GROUP TECHNIQUE QUANTITY VALUE ERROR NOTES
1979 APRD TE-GM NEUTRON KERMA 4.26+81979 APRO NE-213+PR NEUTRON KERMA 4.26+81979 WWD NE-213 NEUTRON KERMA 3.10+8 > 550 KEV1980 DREO MICRODOSE NEUTRON KERMA 4.32+8
1979 APRD GM GAMMA KERMA 3.86+71979 WWD NE-213 GAMMA KERMA 4.34+7 > 450 KEV1980 DREO MICRODOSE GAMMA KERMA 3.90+7
1979 APRD TE TOTAL KERMA 4.50+8 50 c.c.1979 APRD TE TOTAL KERMA 4.76+8 4000 c.c.1980 DREO MICRODOSE TOTAL KERMA 4.70+8
RANGE: 15 METERS
YEAR GROUP TECHNIQUE QUANTITY VALUE ERROR NOTES
1980 DREO NE-213 3-MEV FLUX 2.23+16 3%
1980 DREO NE-213+BF 3 NEUTRON KERMA 4.16+8 2%
RANGE: 50 METERS
YEAR GROUP TECHNIQUE QUANTITY VALUE ERROR NOTES
1979 APRD SULFUR 3-MEV FLUX 1.79+17
1979 APRD TE TOTAL KERMA 4.99+8
RANGE: 100 METERS
YEAR GROUP TECHNIQUE QUANTITY VALUE ERROR NOTES
1979 APRD SULFUR 3-MEV FLUX 1.49+16 7%1979 APRD NE-213 3-MEV FLUX 1.50+161979 WWD NE-213 3-MEV FLUX 1.32+161980 APRD SULFUR 3-MEV FLUX 1.34+16 1"1980 APRO SULFUR 3-MEV FLUX 1.54+16 2""1980 DREO NE-213 3-MEV FLUX 1.40+16 3%
1979 APRD TE-GM NEUTRON KERMA 3.60+81979 APRD NE-213+PR NEUTRON KERMA 3.38+81979 WWD NE-213 NEUTRON KERMA 2.77+8 > 550 KEV1980 DREO NE-213+BF3 NEUTRON KERMA 3.21+8 2%
1979 APRO GM GAMMA KERMA 5.20+71979 WWD NE-213 GAMMA KERMA 6.26+7 > 450 KEV1980 DREO NE-213 GAMMA KERMA 6.18+7 3% > 300 KEV
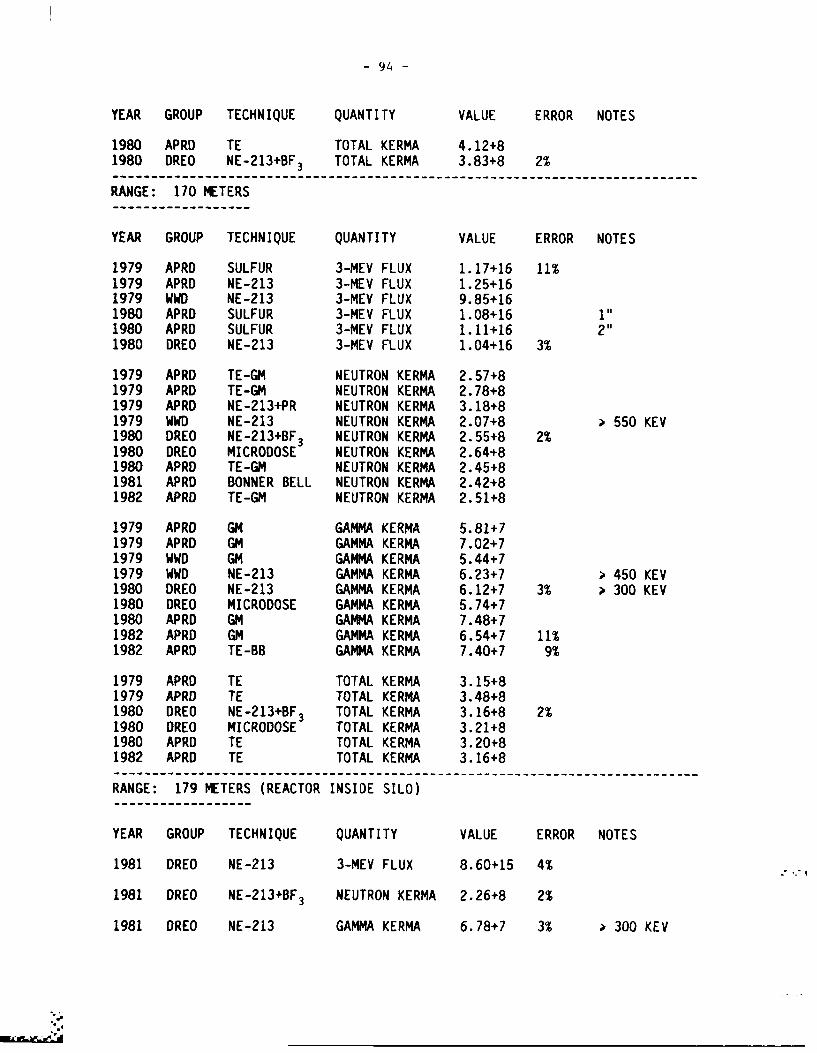
-94-
YEAR GROUP TECHNIQUE QUANTITY VALUE ERROR NOTES
1980 APRD TE TOTAL KERMA 4.12+81980 DREO NE-213+BF 3 TOTAL KERMA 3.83+8 2%
RANGE: 170 METERS
YEAR GROUP TECHNIQUE QUANTITY VALUE ERROR NOTES
1979 APRD SULFUR 3-MEV FLUX 1.17+16 11%1979 APRD NE-213 3-MEV FLUX 1.25+161979 WWD NE-213 3-MEV FLUX 9.85+161980 APRD SULFUR 3-MEV FLUX 1.08+16 1"1980 APRO SULFUR 3-MEV FLUX 1.11+16 2"1980 DREO NE-213 3-MEV FLUX 1.04+16 3%
9 APRD TE-GM NEUTRON KERMA 2.57+81979 APRD TE-GM NEUTRON KERMA 2.78+8
1979 APRD NE-213+PR NEUTRON KERMA 3.18+81979 WWD NE-213 NEUTRON KERMA 2.07+8 > 550 KEV1980 DREO NE-213+BF 3 NEUTRON KERMA 2.55+8 2%1980 DREO MICRODOSE NEUTRON KERMA 2.64+81980 APRD TE-GM NEUTRON KERMA 2.45+81981 APRD BONNER BELL NEUTRON KERMA 2.42+81982 APRD TE-GM NEUTRON KERMA 2.51+81G51979 APRO GM GAMMA KERMA 5.81+71979 APRD GM GAMMA KERMA 7.02+71979 WWD GM GAMMA KERMA 5.44+71979 WWD NE-213 GAMMA KERMA 6.23+7 > 450 KEV1980 DREO NE-213 GAMMA KERMA 6.12+7 3% • 300 KEV1980 DREO MICRODOSE GAMMA KERMA 5.74+71980 APRD GM GAMMA KERMA 7.48+71982 APRD GM GAMMA KERMA 6.54+7 11%1982 APRD TE-BB GAMMA KERMA 7.40+7 9%
1979 APRO TE TOTAL KERMA 3.15+81979 APRD TE TOTAL KERMA 3.48+81980 DREO NE-213+BF 3 TOTAL KERMA 3.16+8 2%1980 DREO MICRODOSE TOTAL KERMA 3.21+81980 APRD TE TOTAL KERMA 3.20+81982 APRO TE TOTAL KERMA 3.16+8
RANGE: 179 METERS (REACTOR INSIDE SILO)
YEAR GROUP TECHNIQUE QUANTITY VALUE ERROR NOTES
1981 DREO NE-213 3-MEV FLUX 8.60+15 4%
1981 DREO NE-213+BF3 NEUTRON KERMA 2.26+8 2%
1981 DREO NE-213 GAMMA KERMA 6.78+7 3% • 300 KEV
./.
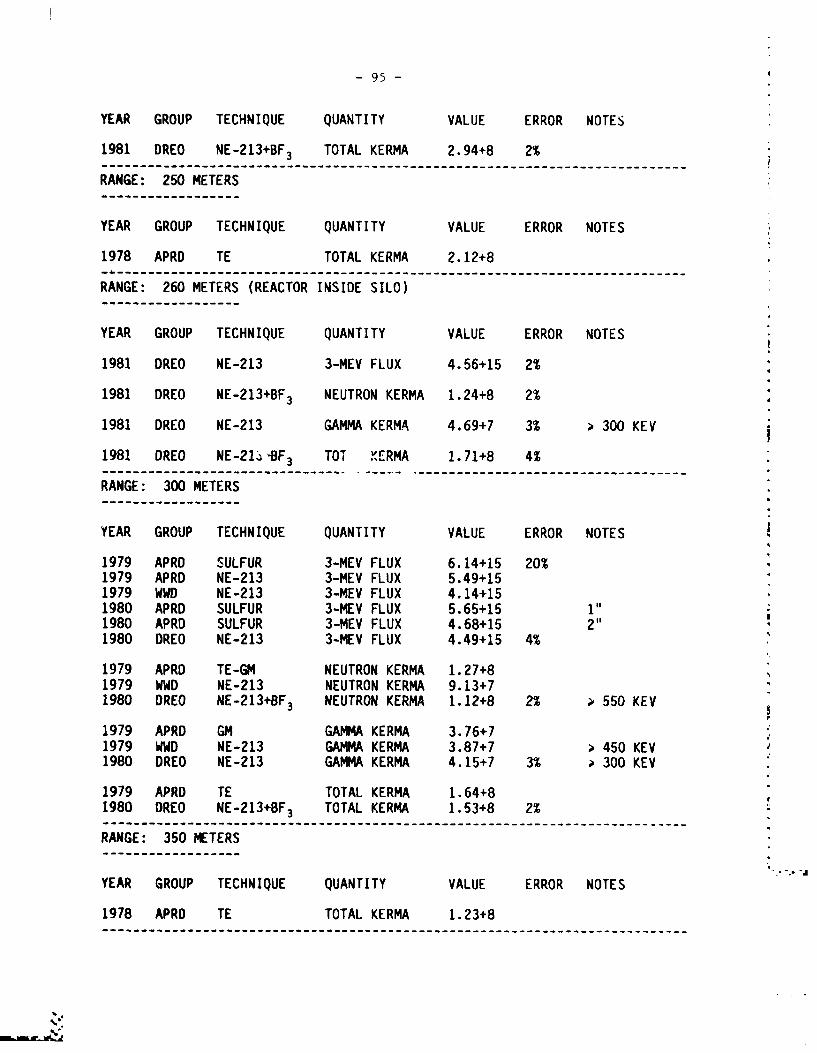
t
-95-
YEAR GROUP TECHNIQUE QUANTITY VALUE ERROR NOTES
1981 DREO NE-213+BF 3 TOTAL KERMA 2.94+8 2%
RANGE: 250 METERS
YEAR GROUP TECHNIQUE QUANTITY VALUE ERROR NOTES
1978 APRD TE TOTAL KERMA 2.12+8 -------------------------------------------------------------------------RANGE: 260 METERS (REACTOR INSIDE SILO)
YEAR GROUP TECHNIQUE QUANTITY VALUE ERROR NOTES
1981 DREO NE-213 3-MEV FLUX 4.56+15 2%1981 DREO NE-213+BF3 NEUTRON KERMA 1.24+8 2%
1981 DREO NE-213 GAMMA KERMA 4.69+7 3% 300 KEV
1981 DREO NE-21L ,BF3 TOT K'ERMA 1.71+8 4%
RANGE: 300 METERS-- -- -- -- -- --
YEAR GROUP TECHNIQUE QUANTITY VALUE ERROR NOTES
1979 APRD SULFUR 3-MEV FLUX 6.14+15 20% 1979 APRD NE-213 3-MEV FLUX 5.49+151979 WWD NE-213 3-MEV FLUX 4.14+151980 APRD SULFUR 3-MEV FLUX 5.65+15 1"1980 APRD SULFUR 3-MEV FLUX 4.68+15 2"1980 DREO NE-213 3-MEV FLUX 4.49+15 4%
1979 APRD TE-GM NEUTRON KERMA 1.27+81979 WWD NE-213 NEUTRON KERMA 9.13+71980 DREO NE-213+BF3 NEUTRON KERMA 1.12+8 2% 550 KEV
1979 APRD GM GAMMA KERMA 3.76+71979 WWD NE-213 GAMMA KERMA 3.87+7 > 450 KEV1980 DREO NE-213 GAMMA KERMA 4.15+7 3% > 300 KEV
1979 APRD TE TOTAL KERMA 1.64+81980 DREG NE-213+BF 3 TOTAL KERMA 1.53+8 2%--------------------------------------------------------------------------RANGE: 350 METERS. . . . . . . . ..
YEAR GROUP TECHNIQUE QUANTITY VALUE ERROR NOTES
1978 APRD TE TOTAL KERMA 1.23+8-- - - --
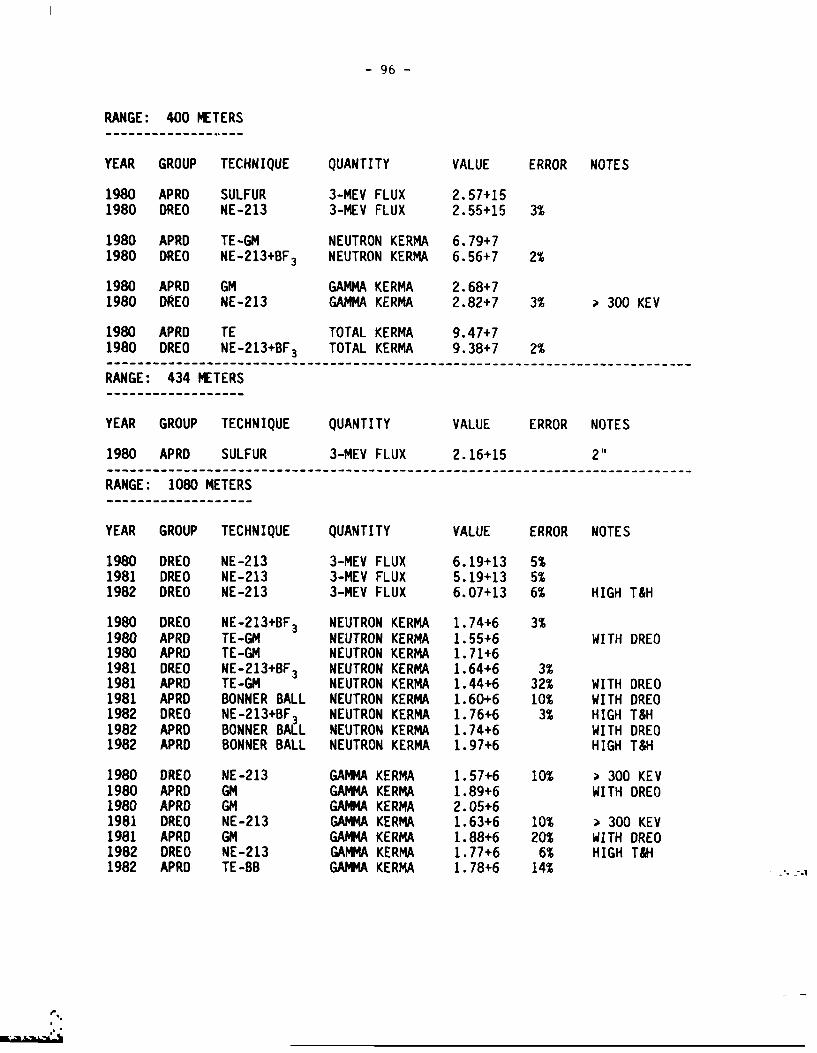
-96-
RANGE: 400u METERS
YEAR GROUP TECHNIQUE QUANTITY VALUE ERROR NOTES
1980 APRO SULFUR 3-MEV FLUX 2.57+151980 DREO NE-213 3-MEV FLUX 2.55+15 3%
1980 APRD TE-G4 NEUTRON KERMA 6.79+71980 DREO NE-213+BF3 NEUTRON KERMA 6.56+7 2%
1980 APRD GM GAMMA KERMA 2.68+71980 DREO NE-213 GAMMA KERMA 2.82+7 3% > 300 KEV
1980 APRO TE TOTAL KERMA 9.47+71980 DREO NE-213+BF3 TOTAL KERMA 9.38+7 2%
RANGE: 434 METERS- - - - - - - - - - -
YEAR GROUP TECHNIQUE QUANTITY VALUE ERROR NOTES
1980 APRD SULFUR 3-MEV FLUX 2.16+15 2"1
4 RANGE: 1080 METERS
YEAR GROUP TECHNIQUE QUANTITY VALUE ERROR NOTES
1980 DREO NE-213 3-MEV FLUX 6.19+13 5%1981 DREO NE-213 3-MEV FLUX 5.19+13 5% 1982 DREO NE-213 3-MEV FLUX 6.07+13 6% HIGH T&H
1980 DREO NE-213+BF3 NEUTRON KERMA 1.74+6 3%*54.1980 APRO TE-GM NEUTRON KERMA 1.55+6 WITH DREO
1980 APRD TE-GM NEUTRON KERMA 1.71+61981 DREO NE-213+BF3 NEUTRON KERMA 1.64+6 3%1981 APRD TE-GM NEUTRON KERMA 1.44+6 32% WITH OREO1981 APRD BONNER BALL NEUTRON KERMA 1.60+6 10% WITH DREO'4-1982 DREO NE-213+BF3 NEUTRON KERMA 1.76+6 3% HIGH T&H
198 ARO BONERBAL EURONKEMA 1.4+6WIH RE1982 APRO BONNER BALL NEUTRON KERMA 1.74+6 HIGH T&HO192 AR ONRBAL NURNKRA .76HG &
980 DREO NE-213 GAMMA KERMA 1.57+6 10% 300 KEY1980 APRD GM GAMMA KERMA 1.89+6 WITH DREG1980 APRO GM GAMMA KERMA 2.05+61981 DREO NE-213 GAMMA KERMA 1.63+6 10% 300 KEV1981 APRO GM GAMMA KERMA 1.88+6 20% WITH DREO1982 DREO NE-213 GAMMA KERMA 1.77+6 6% HIGH T8H1982 APRD TE-BB GAMMA KERMA 1.78+6 14%
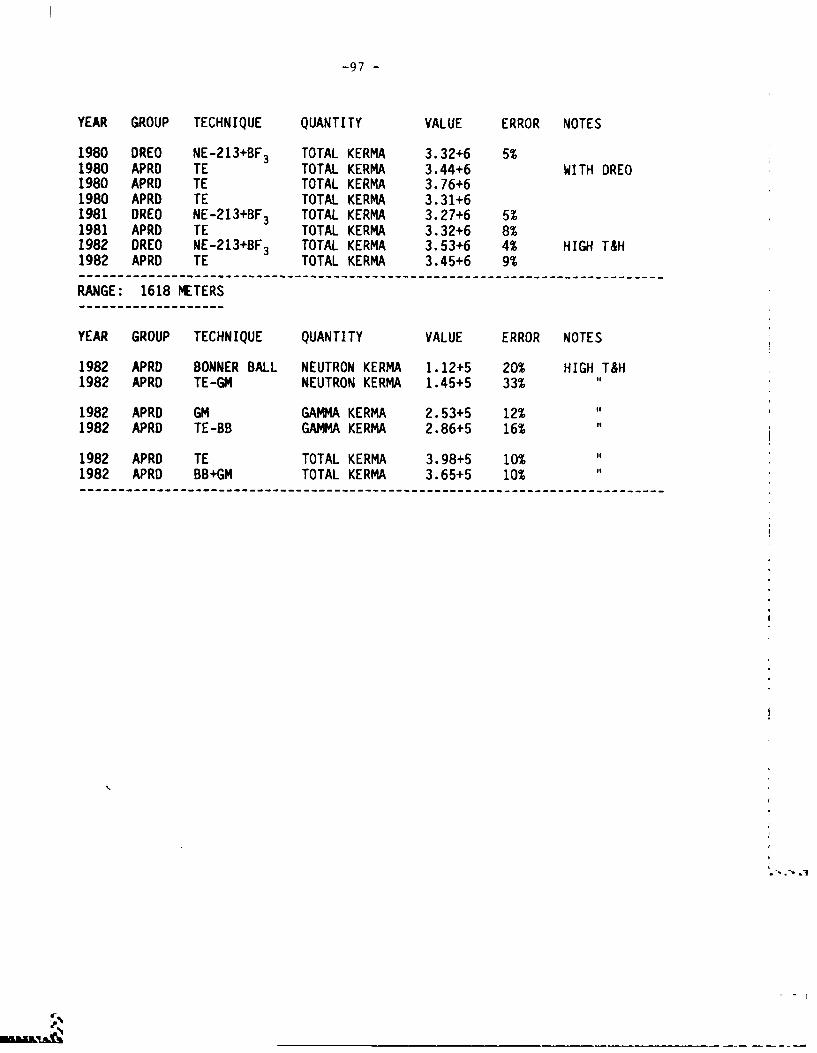
-97 -
YEAR GROUP TECHNIQUE QUANTITY VALUE ERROR NOTES
1980 DREO NE-213+BF 3 TOTAL KERMA 3.32+6 5%1980 APRD TE TOTAL KERMA 3.44+6 WITH DREO
APRO TE TOTAL KERMA 3.76+61980 APRD TE TOTAL KERMA 3.31+61981 DREO NE-213+BF 3 TOTAL KERMA 3.27+6 5%1981 APRD TE TOTAL KERMA 3.32+6 8%1982 DREO NE-213+BF3 TOTAL KERMA 3.53+6 4% HIGH T&H1982 APRD TE TOTAL KERMA 3.45+6 9%
° - - - - - - - - -- - - - - - - - - -- - - - - - - -----------.. .-.-------. - . -.-.-- _... . . . . .. . . .. . . . . .
RANGE: 1618 METERS
YEAR GROUP TECHNIQUE QUANTITY VALUE ERROR NOTES
1982 APRD BONNER BALL NEUTRON KERMA 1.12+5 20% HIGH T&H1982 APRD TE-GM NEUTRON KERMA 1.45+5 33%
1982 APRD GM GAMMA KERMA 2.53+5 12%1982 APRD TE-BB GAMMA KERMA 2.86+5 16%
1982 APRD TE TOTAL KERMA 3.98+5 10%1982 APRD BB+GM TOTAL KERMA 3.65+5 10%
,P
~ii
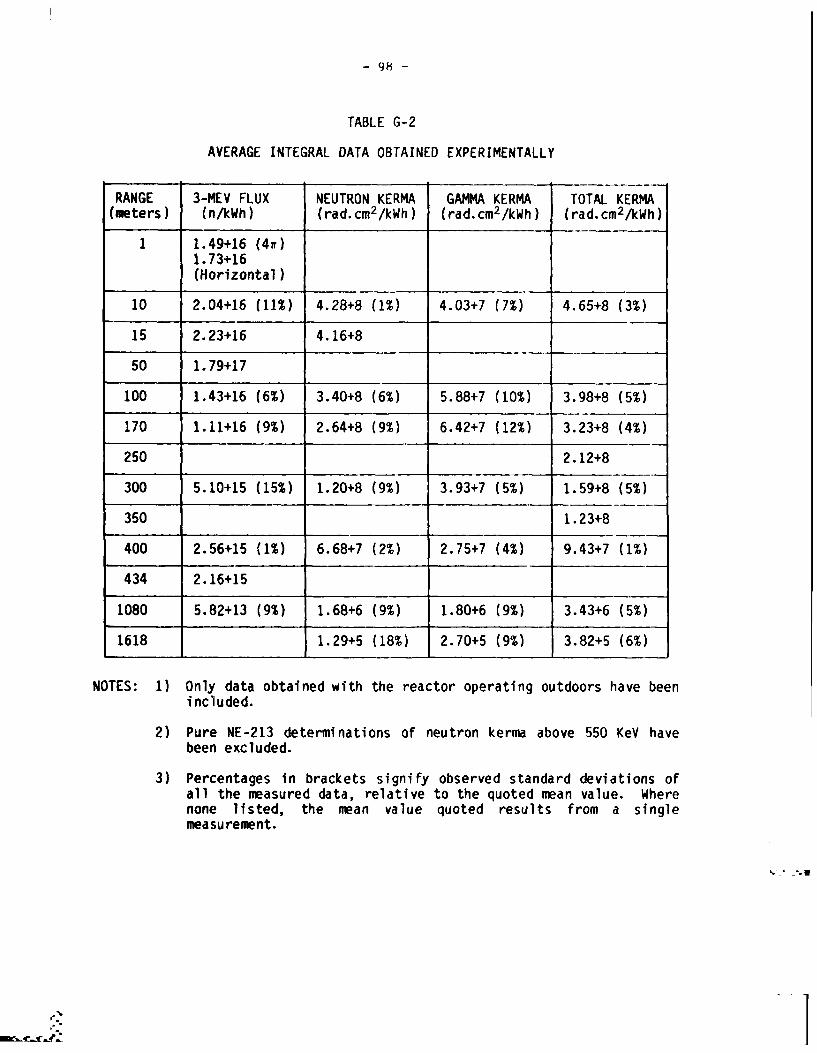
-98-
TABLE G.-2
AVERAGE INTEGRAL DATA OBTAINED EXPERIMENTALLY
RANGE 3-MEV FLUX NEUTRON KERMA GAMMA KERMA TOTAL KERMA (meters) (n/kWh) (rad.cm2 /kWh) (rad.CM 2 /kWh) (rad.CM 2 /kWh)
1 1.49+16 (40w) 1. 73+16(Horizontal)
10 2.04+16 (11%) 4.28+8 01%) 4.03+7 (7%) 4.65+8 (3%)
15 2.3+164.16+8
so~ 1.7917
100 1.43+16 (6%) 3.40+8 (6%) 5.88+7 (10%) 3.98+8 (5%)
170 1.11+16 (9%) 2.64+8 (9%) 6.42+7 (12%) 3.23+8 (4%)
'250 2.12+840300 5.10+15 (15%) 1.20+8 (9%) 3.93+7 (5%) 1.59+8 (5%)
350 1.23+8
400 2.56+15 (1%) 6.68+7 (2%) 2.75+7 (4%) 9.43+7 (1%)
434 2.16+15
080 5.82+13 (9%) 1.68+6 (9%) 1.80+6 (9%) 3.43+6 (5%)
1618 1.29+5 (18%) 2.70+5 (9%) 3.82+5 (6%)
NOTES: 1) Only data obtained with the reactor operating outdoors have beenincluded.
2) Pure NE-213 determinations of neutron kerma above 550 KeV have? been excluded.
3) Percentages in brackets signify observed standard deviations ofall the measured data, relative to the quoted mean value. Wherenone listed, the mean value quoted results from a singlemeasurement.
Z:,
o:
d ~~- 99 -
I
.. ,-
.
.
" ~APPENDIX H ~~~~THEORET ICALLY-CALCULATED INTEGRAL QUANT IT IES"""
.4-,
- 100-
APPENDIX H: THEORETICALLY-CALCULATED INTEGRAL QUANTITIES
Theoretically-calculated values of neutron fluence above 3 MeV and neutron, gamma-ray and total kerma available as of the date of this reportinclude those determined at ORNL (1978), DREO (1980), SAI (1982) and LLNL(1982). Theoretical values for these quantities are listed in Table H-1 atthe five ranges at which the majority of measurements were performed, namely100, 170, 300, 400 and 1080 meters. Where quantities have been calculatedat points differing in range to the experiments, these have beeninterpolated in a semi-logarithmic manner as a correction to thecalculations. Also shown for comparison are the mean values of thosemeasured quantities previously listed in Table G-2.
In Table H-2 the ratios of calculated value to mean experimentalmeasurement are also shown for each range and quantity. To assist inassessing the significance of individual calculated-to-experimentaldifferences, the relative standard deviations of the measurements from TableG-2 are also shown for each range and quantity.
Mean values of the ratios, averaged in an unweighted manner over thefive ground ranges listed, are also shown for each quantity and calculation.A mean ratio departing significantly from the value '1' would thus indicatethat a particular calculation systematically over- or under-predicts corresponding experimental results. The level of significance may be judgedby comparing the calculated root-mean-square deviation from the value I (shown also immediately below each mean ratio) with comparable r.m.s.deviations observed within the measurements themselves, also listed. Thus, a comparison is made between the degree of "scatter" of the calculationsabout the mean experimental values and the degree of "scatter" exhibited bythe experiments themselves about their own mean values.
For example, earlier ORNL and DREO calculations appear to under--w%predict neutron fluence above 3 MeV by a systematic thirty percent. Thecalculated r.m.s. deviations in the range of 0.35 are in excess by more thana factor of three than the observed r.m.s. deviations in the experimentaldata, thus it must be concluded that the above-noted under-prediction is ofsignificant magnitude. In contrast, the calculated values of neutron,gamma-ray, and total kerma are in much better agreement with theexperiments, especially so in the case of SAI and LLNL results. The earliercalculations of ORNL and DREO appear to be somewhat deficient in thedetermination of gamma-ray kerma and consequently also of total kerma to theextent that gamma-ray kerma contributes to this quantity. The calculationsby SAI exhibit somewhat lower r.m.s. deviations than do those of LLNL, andalso better calculated-to-experimental mean ratios. The variationsattributed to the SAI results are consistent with the observed variations in the experimental values themselves, thus indicating that there is nostatistically-significant difference between SAI predictions andexperimental dosimetry.
'V. F,, .% ... . .. q t * - -'B .U '.•
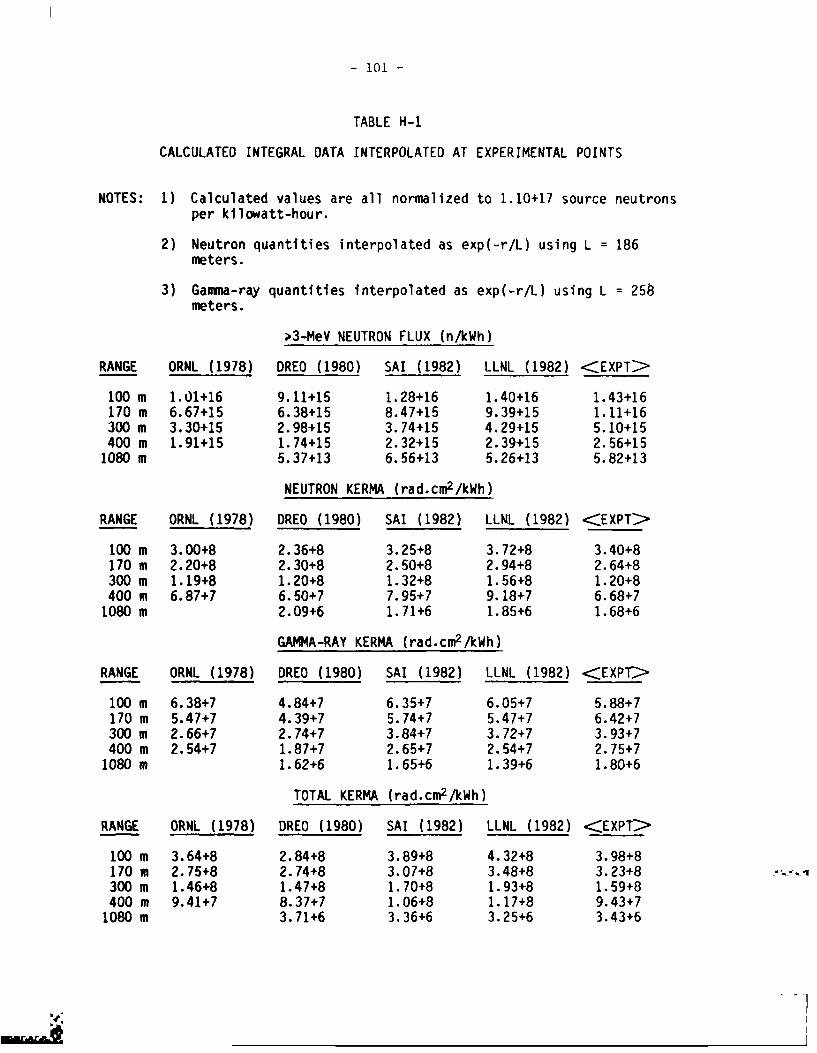
-101-
TABLE H-1
CALCULATED INTEGRAL DATA INTERPOLATED AT EXPERIMENTAL POINTS
NOTES: 1) Calculated values are all normalized to 1.10+17 source neutronsper kilowatt-hour.
2) Neutron quantities interpolated as exp(-rIL) using L =186meters.
3) Gammna-ray quantities interpolated as exp(-r/L) using L =258* . meters.
>3-MeV NEUTRON FLUX (n/kWh)
RANGE ORNL (1978) DREO (1980) SAI (1982) LLNL (1982) <EXPT>
100 mn 1.01+16 9. 11+15 1.28+16 1.40+16 1.43+16170 mn 6.67+15 6.38+15 8.47+15 9.39+15 1.11+16300 mn 3. 30+15 2.98+15 3.74+15 4. 29+15 5. 10+15400 mn 1.91+15 1.74+15 2.32+15 2.39+15 2.56+151080 mn 5.37+13 6.56+13 5.26+13 5.82+13
NEUTRON KERMA (rad.cin2/kWh)
RANGE ORNL (1978) DREO (1980) SAI (1982) LLNL (1982) <EXPT>
100 mn 3.00+8 2.36+8 3.25+8 3.72+8 3.40+8170 mn 2.20+8 2.30+8 2.50+8 2.94+8 2.64+8300 mn 1.19+8 1.20+8 1.32+8 1.56+8 1.20+8400 m 6.87+7 6.50+7 7.95+7 9.18+7 6.68+71080 m 2.09+6 1.71+6 1.85+6 1.68+6
GAMMA-RAY KERMA (rad.cin2/Wh)
RANGE ORNL (1978) DREO (1980) SAI (1982) LLNL (1982) <EXPT>
100 mn 6.38+7 4.84+7 6.35+7 6.05+7 5.88+7170 in 5.47+7 4.39+7 5.74+7 5.47+7 6.42+7300 mn 2.66+7 2. 74+7 3.84+7 3. 72+7 3. 93+7400 m 2.54+7 1.87+7 2.65+7 2.54+7 2.75+71080 m 1.62+6 1.65+6 1.39+6 1.80+6
TOTAL KERMA (rad-CM2/kWh)
RANGE ORNL (1978) DREO (1980) SAI (1982) LLNL (1982) <EXPT>
100 m 3.64+8 2.84+8 3.89+8 4.32+8 3.98+8170 mn 2. 75+8 2. 74+8 3.07+8 3.48+8 3.23+8 300 mn 1.46+8 1.47+8 1.70+8 1.93+8 1.59+8400 m 9.41+7 8.37+7 1.06+8 1.17+8 9.43+71080 mn 3.71+6 3.36+6 3.25+6 3.43+6
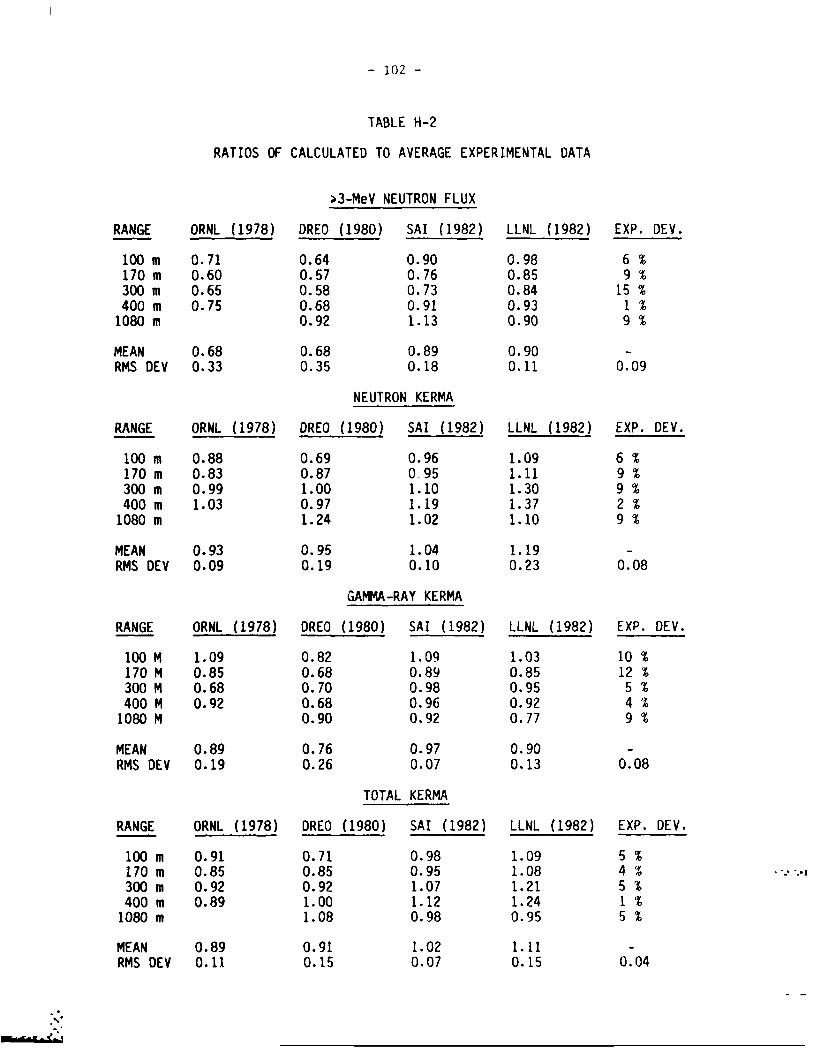
- 102-
TABLE H-2
RATIOS OF CALCULATED TO AVERAGE EXPERIMENTAL DATA
" 3-MeV NEUTRON FLUX
RANGE ORNL (1978) DREO (1980) SAI (1982) LLNL (1982) EXP. DEV.
100 m 0.71 0.64 0.90 0.98 6% 170 m 0.60 0.57 0.76 0.85 9 %300 m 0.65 0.58 0.73 0.84 15 %400 m 0.75 0.68 0.91 0.93 1 %1080 m 0.92 1.13 0.90 9 %
MEAN 0.68 0.68 0.89 0.90 -RMS DEV 0.33 0.35 0.18 0.11 0.09
NEUTRON KERMA
RANGE ORNL (1978) DREO (1980) SAI (1982) LLNL (1982) EXP. DEV.
100 m 0.88 0.69 0.96 1.09 6 %170 m 0.83 0.87 0-95 1.11 9 %300 m 0.99 1.00 1.10 1.30 9 %400 m 1.03 0.97 1.19 1.37 2 %1080 m 1.24 1.02 1.10 9 %
MEAN 0.93 0.95 1.04 1.19 -RMS DEV 0.09 0.19 0.10 0.23 0.08
GAMMA-RAY KERMA
RANGE ORNL (1978) DREO (1980) SAI (1982) LLNL (1982) EXP. DEV.
100 M 1.09 0.82 1.09 1.03 10 %170 M 0.85 0.68 0.89 0.85 12 %"300 M 0.68 0.70 0.98 0.95 5 %400 M 0.92 0.68 0.96 0.92 4 %,1080 M 0.90 0.92 0.77 9 %
MEAN 0.89 0.76 0.97 0.90 - .RMS DEV 0.19 0.26 0.07 0.13 0.08
TOTAL KERMA
RANGE ORNL (1978) DREO (1980) SAI (1982) LLNL (1982) EXP. DEV.
100 m 0.91 0.71 0.98 1.09 5 %170 m 0.85 0.85 0.95 1.08 4 %300 m 0.92 0.92 1.07 1.21 5 %400 m 0.89 1.00 1.12 1.24 1 %1080 m 1.08 0.98 0.95 5 %
MEAN 0.89 0.91 1.02 1.11 -RMS DEV 0.11 0.15 0.07 0.15 0.04
LS
- 103 -
APPENDIX IAPRF SOIL COMPOSITION
104 -
APPENDIX I: APRF SOIL COMPOSITION
During July 1982, soil samples were obtained at seven different distances from the APRF core, at a depth of ten centimeters below grade.This particular depth was chosen as it corresponds roughly to a mean-free-path for fast neutrons in earth.
Density and moisture content determinations were made at REOfollowing which elemental analyses were performed by outside laboratories,the results being listed in Table I-I. Analysis for carbon, hydrogen,nitrogen, oxygen and silicon were performed by Beak Analytical Services ofToronto, the remaining elemental concentrations being determined by Bondar-Clegg and Company of Ottawa. In addition to individual concentrations forelements within each soil sample, also listed are mean concentrations ofeach element averaged over all seven soil samples.
Although the elements chosen for analysis comprise 98.9% by weight ofthe earth's crust, it is surprising that the average concentrations of theseelements total only 74.9%. Two explanations for this discrepancy arepossible - either the "missing" elements comprise the remaining 25.1 wt-%;or one or more of the elemental concentrations has been seriouslyunderestimated. Of these two alternatives the latter is considered the morelikely.
In particular the concentrations listed for silicon (mean of 14.7 wt-%) appear low for two reasons. According to the 49th Edition of theChemical Rubber Company's "Handbook of Chemistry and Physics", 27.7 wt-% ofthe earth's crust is composed of silicon and that average igneous rocks,shales and sediments contain approximately 58 wt-% silicon dioxide (of which27 wt-% would be due to silicon). It would therefore seem reasonable toincrease the average silicon determination by 13 wt-%. Secondly, theanalysed oxygen soil content of 36.3 wt-% is in excess by 11.6 wt-% of thatrequired to completely oxidize all of the other constituents. If this"extra" oxygen were chemically -B-und to silicon the additional siliconrequired would amount to 13.3 wt-%, which is also consistent with the first consideration cited above.
Assuming that the listed concentrations of silicon were thereforeincreased by 13 wt-% to 27.7 wt-%, the total concentration of the nineteenelements would become 87.9 wt-%, for a shortfall of only 12.1 wt-%. Sinceno other inconsistency is immediately obvious, it would thus seemunavoidable to further increase all the analyses listed by a factor of 1.14,to make up for this shortfall. -
Following this procedure, absolute elemental concentrations arelisted in Table 1-2 in units of atoms per barn-cm (or atoms per cm x"10- ) For comparison earlier results quoted by APRO and WWD are alsoshown. Note that DREO estimates of hydrogen and oxygen concentrations aregenerally lower than either the APRD or WWD results. This arises as aconsequence of the season during which soil sampling was performed. Toth
APRD and WWD samples were obtained in the spring (March 1978) and would be expected to be of somewhat higher moisture content than the DREO samplingduring the summer (July 1982).
--6... *b "o
" , ,. ., -.- , -,. ...- .,- . . ,; -. . .- , -.. ,-, ,,, . ., .. .. . ,., ,, . . .. .-
-105-
Also listed in Table 1-2 are total densities calculated on the basisof individually-listed elemental concentrations in comparison to directmeasurements by physical methods. These compare identically in the case ofDREO results since normalization to 100% of the measured density was forced,
as previously discussed. Conversely an overevaluation is apparent in theAPRD results, indicating that one or more of the elemental analyses listedwas excessive. It is not known whether WWD results were renormalized to a
-. 100 wt-% total or not, given the good agreement between calculated andmeasured density.
Z .4%.
4.. i5
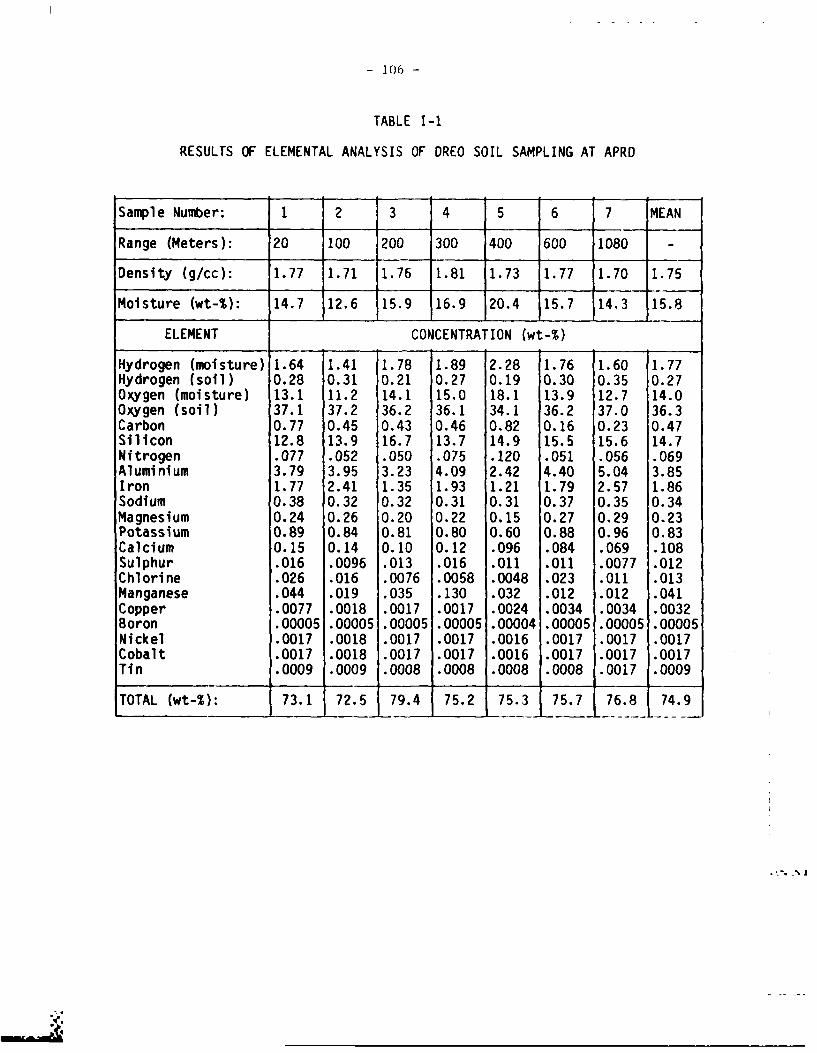
- 106-
TABLE I-1
RESULTS OF ELEMENTAL ANALYSIS OF DREO SOIL SAMPLING AT APRD
Sample Number: 1 2 3 4 5 6 7 MEAN
Range (Meters): 20 100 200 300 400 600 1080 -
Density (g/cc): 1.77 1.71 1.76 1.81 1.73 1.77 1.70 1.75
Moisture (wt-%): 14.7 12.6 15.9 16.9 20.4 15.7 14.3 15.8
ELEMENT CONCENTRATION (wt-%)
Hydrogen (moisture) 1.64 1.41 1.78 1.89 2.28 1.76 1.60 1.77Hydrogen (soil) 0.28 0.31 0.21 0.27 0.19 0.30 0.35 0.27Oxygen (moisture) 13.1 11.2 14.1 15.0 18.1 13.9 12.7 14.0Oxygen (soil) 37.1 37.2 36.2 36.1 34.1 36.2 37.0 36.3Carbon 0.77 0.45 0.43 0.46 0.82 0.16 0.23 0.47Silicon 12.8 13.9 16.7 13.7 14.9 15.5 15.6 14.7Nitrogen .077 .052 .050 .075 .120 .051 .056 .069Aluminium 3.79 3.95 3.23 4.09 2.42 4.40 5.04 3.85Iron 1.77 2.41 1.35 1.93 1.21 1.79 2.57 1.86 Sodium 0.38 0.32 0.32 0.31 0.31 0.37 0.35 0.34Magnesium 0.24 0.26 0.20 0.22 0.15 0.27 0.29 0.23Potassium 0.89 0.84 0.81 0.80 0.60 0.88 0.96 0.83Calcium 0.15 0.14 0.10 0.12 .096 .084 .069 .108Sulphur .016 .0096 .013 .016 .011 .011 .0077 .012Chlorine .026 .016 .0076 .0058 .0048 .023 .011 .013Manganese .044 .019 .035 .130 .032 .012 .012 .041Copper .0077 .0018 .0017 .0017 .0024 .0034 .0034 .0032Boron .00005 .00005 .00005 .00005 .00004 .00005 .00005 .00005Nickel .0017 .0018 .0017 .0017 .0016 .0017 .0017 .0017Cobalt .0017 .0018 .0017 .0017 .0016 .0017 .0017 .0017Tin .00 .0009 .0008 .0008 .0008 .0008 .0017 .0009
TOTAL (wt-%): 73.1 72.5 79.4 75.2 75.3 75.7 76.8 74.9
S-."
V"
V.%
w ,,,, w -4 . , , , . - , , - -" , '. .. '' .'. .-. . . .- " . .. -" - ,.' -" -" ." .
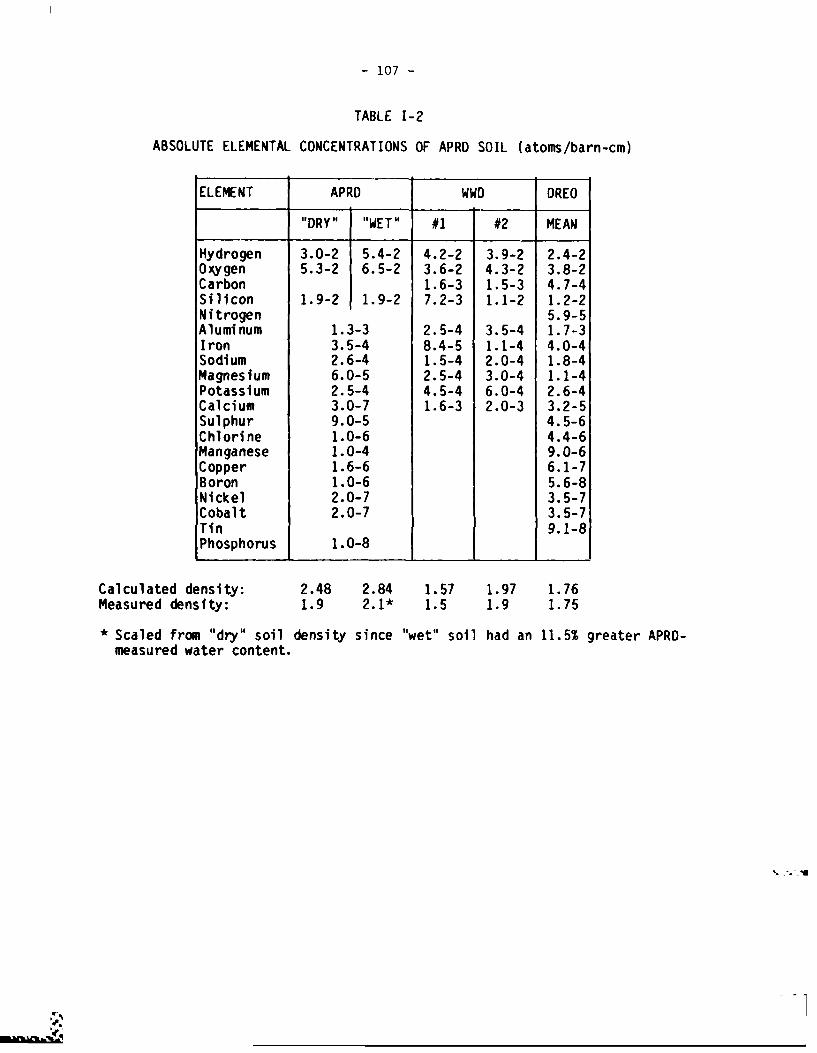
- 107
TABLE 1-2
ABSOLUTE ELEMENTAL CONCENTRATIONS OF APRD SOIL (atoms/barn-cm)
ELEMENT APRO WWD DREO
"DRY" "WET" #1 #2 MEAN
Hydrogen 3.0-2 5.4-2 4.2-2 3.9-2 2.4-2 Oxygen 5.3-2 6.5-2 3.6-2 4.3-2 3.8-2Carbon 1.6-3 1.5-3 4.7-4Silicon 1.9-2 1.9-2 7.2-3 1.1-2 1.2-2Nitrogen 5.9-5Aluminum 1.3-3 2.5-4 3.5-4 1.7-3Iron 3.5-4 8.4-5 1.1-4 4.0-4 Sodium 2.6-4 1.5-4 2.0-4 1.8-4Magnesium 6.0-5 2.5-4 3.0-4 1.1-4Potassium 2.5-4 4.5-4 6.0-4 2.6-4Calcium 3.0-7 1.6-3 2.0-3 3.2-5Sulphur 9.0-5 4.5-6Chlorine 1.0-6 4.4-6Manganese 1.0-4 9.0-6Copper 1.6-6 6.1-7Boron 1.0-6 5.6-8Nickel 2.0-7 3.5-7Cobalt 2.0-7 3.5-7
Tin 9.1-8Phosphorus 1.0-8
Calculated density: 2.48 2.84 1.57 1.97 1.76Measured density: 1.9 2.1* 1.5 1.9 1.75
* Scaled from "dry" soil density since "wet" soil had an 11.5% greater APRD-measured water content.
s*-.
* .1.o
N-%
* *. . . . . . . .
-109-
.44
APEDI
NEUTON ND GMMARAY PECRA FOM f25
%
- 110-
APPENDIX J: NEUTRON AND GAMMA-RAY SPECTRA FROM Cf2 5 2
Neutrons emitted by Cf2 5 2 sources are often utilized to verify the correct operation of fast-neutron spectrometers since the particularspectrum is known to be approximately Maxwellian in shape [1], at aneffective temperature of 1.41 MeV. The DREO NE-213 scintillator has forthis reason been exposed to the APRD Cf2 5 2 source on two occasions, onceduring 1980 [2] and more recently on 26 Oct 1981. The 1981 measurement wasperformed inside the APRD silo at a height of 125 cm above the borated- concrete floor, and at a source-to-detector separation of 100 cm (± 1 cm).The total observation time was two hours, during which the shut-down reactorcore was kept confined within its shielded enclosure beneath the floor.
The unfolded neutron spectrum so determined is shown in Figure J-1,plotted in such a manner as to reproduce a Maxwellian-like spectrum as astraight line, namely by dividing the energy-dependent flux by the square-root of the energy. The line plotted in comparison to the experimentalpoints has been fitted to the measured data such that the neutron flux may be represented by:
O(E) 143 /-E e-E/1 42 7
where the units of * are neutrons per cm2.MeV.sec if E is measured in MeV.The effective temperature of 1.427 MeV is consistent with previous
observations, and integration of the parametric Maxwellian from zero toinfinity yields a total fluence at the point of observation of 215 neutrons per cm2 .sec. Multiplying by 4,r 2 thus indicates an effective neutronemission rate of 2.70 x 10' neutrons per second. This source had previouslybeen calibrated by the manufacturer (Monsanto) as emitting 4.44 x 10⁷ (±3%)neutrons per second on 11 Jan 1980. Correcting for source decay during theintervening period using a half-life of 2.65 years, the expected yield onthe date of measurement was 2.78 x 10⁷ neutrons per second. Thus thedifference between DREO measurement and source calibration was 3%, comparable to the initial calibration uncertainty of 3% and an estimatedDREO uncertainty of 4%.
The evidence of a slight departure from purely Maxwellian shape below2 MeV is also fully consistent with that previously observed using neutrontime-of-flight spectroscopy [I].
Gamma-rays from Cf2 52 are less useful in terms of detector calibration since there is no simple spectral representation and the totalemission rate depends partially on fission product buildup (and hence age)within the source. Secondary gamma-rays produced following neutronabsorption within the source encapsulation and surrounding structures addalso to the uncertainties. The unfolded gamma-ray spectrum obtained alsoduring the measurement on 26 Oct 1981 and shown in Figure J-2, isnevertheless consistent with the results of other investigators.
* t
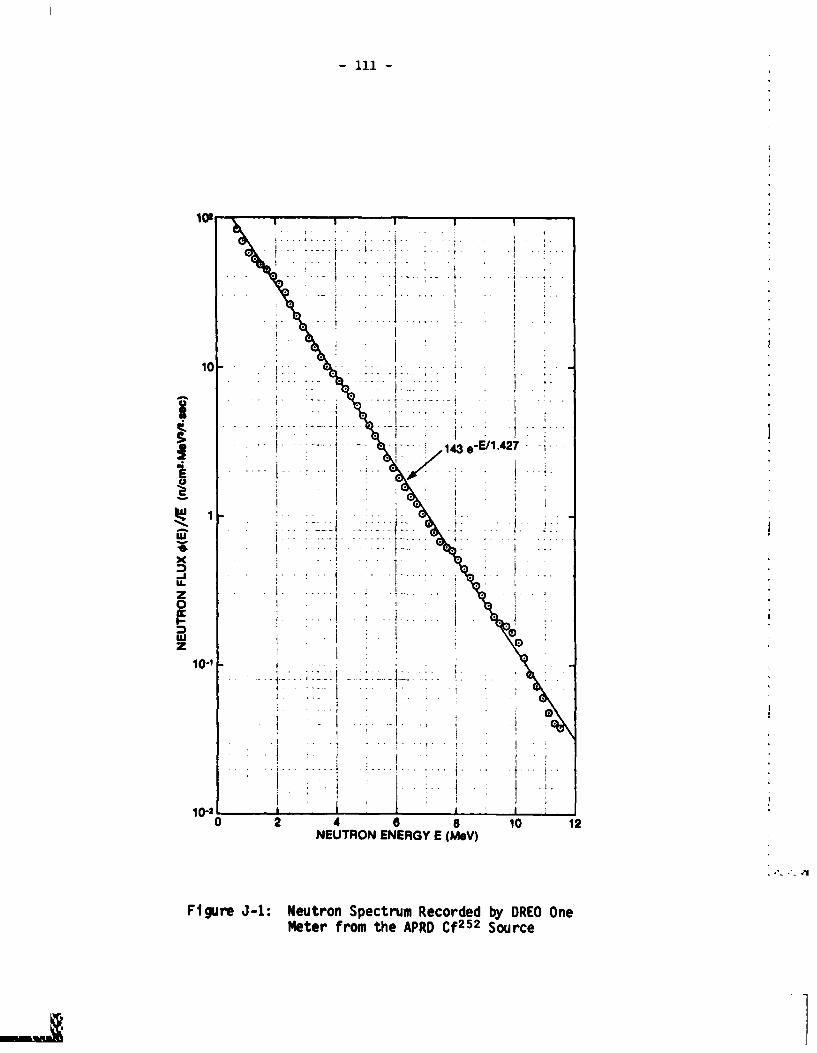
~10
-'IjzS
10-2 L.
, .. . ! i" - . ".
" ] .. . .. . .. ... ....... . ;........ . .... .. .
0 .. . . . . . . .• • -e -. . . . -.-i . . . . I . . . . .
Fgr J- : - Spectrum R b O
M fro the .
5 0 - . f .. .
9*. .. . . . . .. . . .. . . . ...-
-EUT-. EN RG E MV ..
..
U-.' $'1*..
. .%'.
" . " -', .' ' - . . . .. . ... .0 .I.,'' " - ' " " " " " " " ; " ' ' ' " " " ' " " "
,,,, . ¢ .o . '..'. -.... ,% -..... . . .'- . .-.. "€ -. ,. .
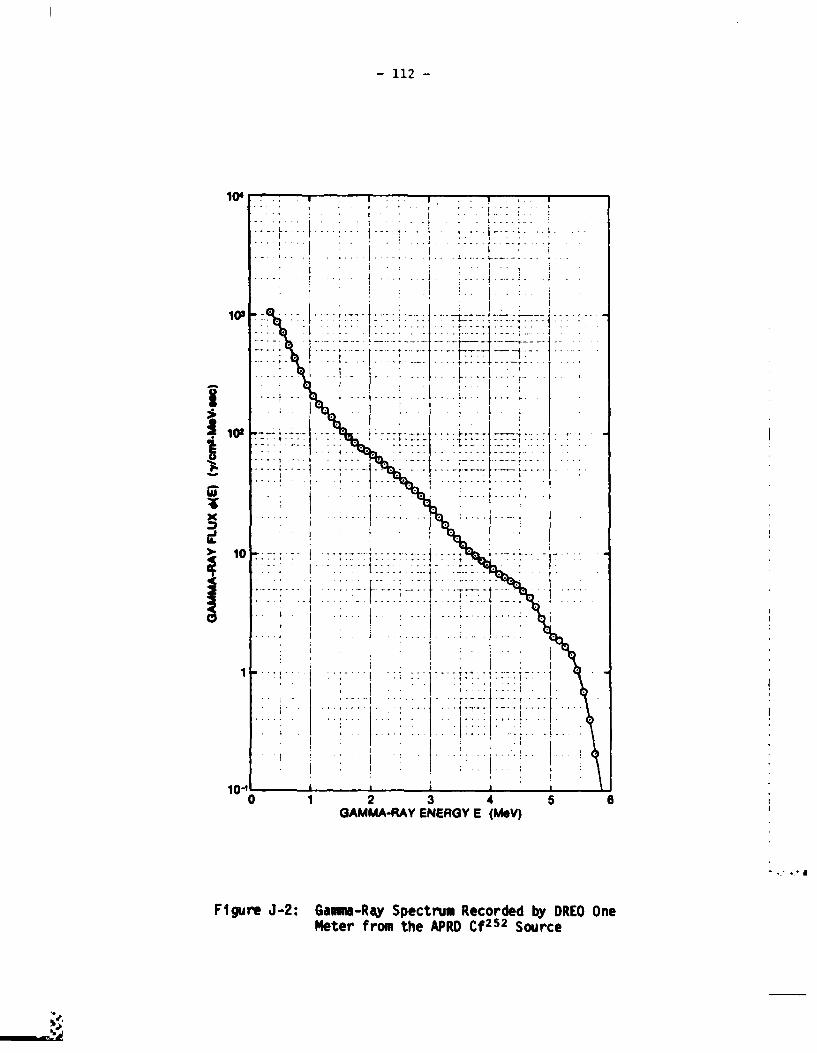
............
10---- --112 --
-- T
l~a10'1
0 4 324.
. IL
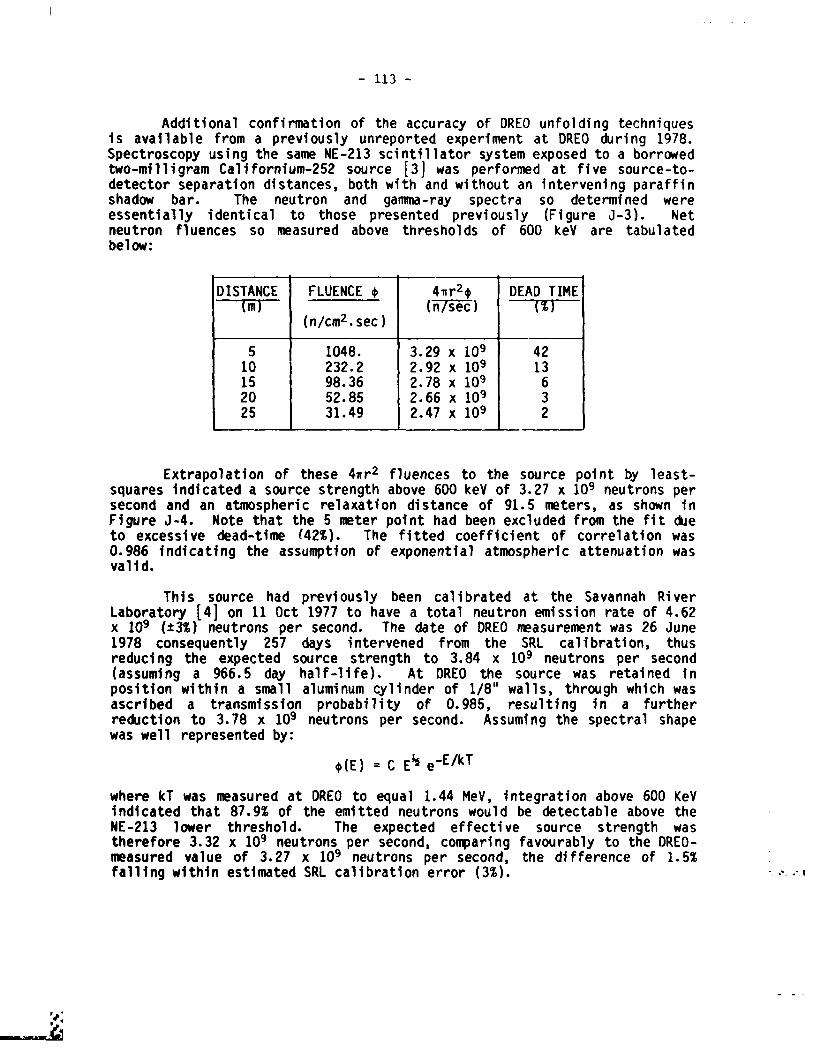
-113-
Additional confirmation of the accuracy of DREO unfolding techniques is available from a previously unreported experiment at DREO during 1978.Spectroscopy using the same NE-213 scintillator system exposed to a borrowed two-milligram Californium-252 source [3] was performed at five source-to-detector separation distances, both with and without an intervening paraffinshadow bar. The neutron and gamma-ray spectra so determined wereessentially identical to those presented previously (Figure J-3). Netneutron fluences so measured above thresholds of 600 keY are tabulatedbelow:
DISTANCE FLUENCE * 4,r2$ DEAD TIME(m)m (nisec) ( TF'
(n/cm2 .sec)
5 1048. 3.29 x 10⁹ 42 10 232.2 2.92 x 10⁹ 1315 98.36 2.78 x 10⁹ 620 52.85 2.66 x 10 325 31.49 2.47 x 10⁹ 2
Extrapolation of these 4wr 2 fluences to the source point by least-squares indicated a source strength above 600 keY of 3.27 x i09 neutrons persecond and an atmospheric relaxation distance of 91.5 meters, as shown inFigure J-4. Note that the 5 meter point had been excluded from the fit dueto excessive dead-time (42%). The fitted coefficient of correlation was0.986 indicating the assumption of exponential atmospheric attenuation wasvalid.
This source had previously been calibrated at the Savannah RiverLaboratory [4] on 11 Oct 1977 to have a total neutron emission rate of 4.62x 10⁹ (3%) neutrons per second. The date of DREO measurement was 26 June1978 consequently 257 days intervened from the SRL calibration, thusreducing the expected source strength to 3.84 x 10⁹ neutrons per second(assuming a 966.5 day half-life). At DREO the source was retained inposition within a small aluminum cylinder of 1/8" walls, through which wasascribed a transmission probability of 0.985, resulting in a furtherreduction to 3.78 x 10⁹ neutrons per second. Assuming the spectral shapewas well represented by:
(E) C Eh e-E/kTC.E..•
where kT was measured at DREO to equal 1.44 MeV, integration above 600 KeVindicated that 87.9% of the emitted neutrons would be detectable above theNE-213 lower threshold. The expected effective source strength wastherefore 3.32 x 10⁹ neutrons per second, comparing favourably to the DREO-measured value of 3.27 x 10⁹ neutrons per second, the difference of 1.5%falling within estimated SRL calibration error (3%).
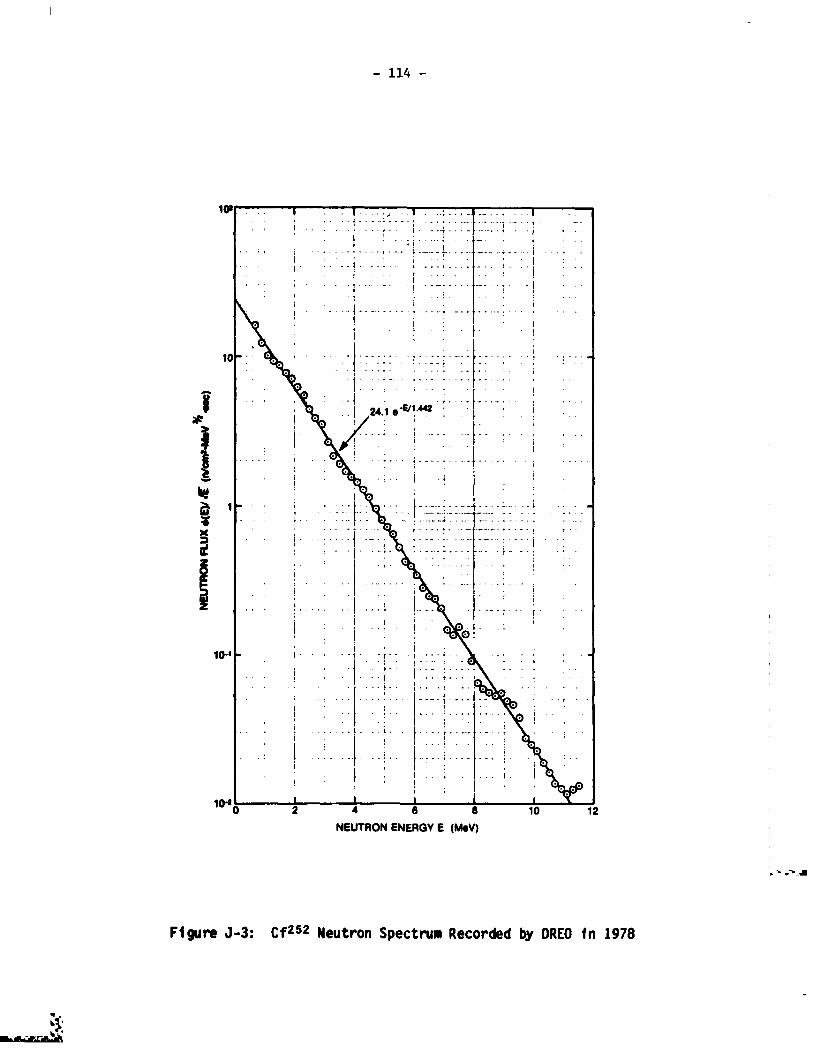
-114-
4.o
.
10 f
.........................
10 2. . . 10 12
-14 NUTRO ENEGY E(M@V
FiueJ3 f5 eurnSetu eore yDE n17
1%
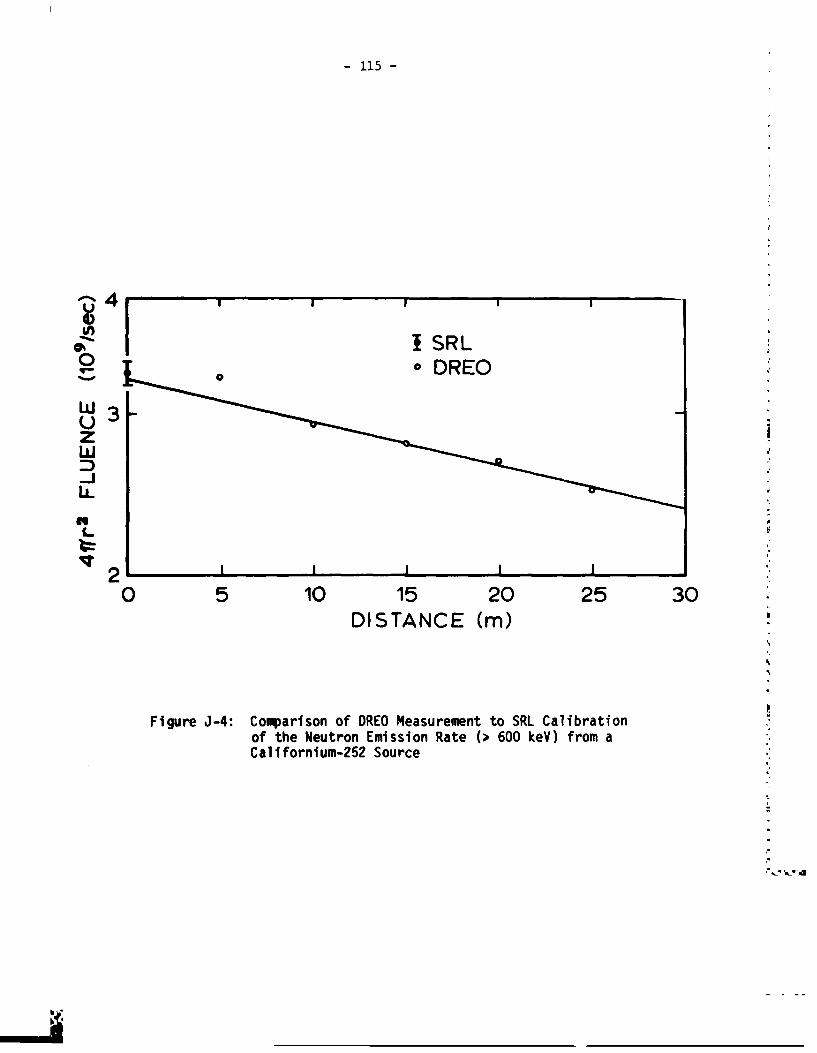
-115-
00
z w
L
2 5 10 15 20 25 3DISTANCE (in)
Figure J-4: Comparison of DREO Measurement to SRL Calibrationof the Neutron Emission Rate (600 keY) from a
4' Call fornium-252 Source
-116-References to Appendix J
[1] L. Green, J.A. Mitchell and N.M. Steen, "The Californium-252 FissionNeutron Spectr,'m from 0.5 to 13 MeV, Nuclear Science and Engineering,50, 257-272, (1973).
[2] H.A. Robitalille, and B.E. Hoffarth, "A Comparison of Measured andCalculated Air-Transported Radiation from a Fast Unshielded Nuclear-Reactor", Defence Research Establishment Ottawa, DREO Report No. 835,(1980).
[3] L.G.I. Bennet, "Evaluation of Transportable Neutron Radiography", RoyalMilitary College of Canada, (Aug. 1979).
[4] J.M. Boswell, "252-Cb,'fornium Source Cal ibrati on; SourceIdentification Number CR-Cf-318c", Savannah River Laboratory, (20 Oct. 1977).
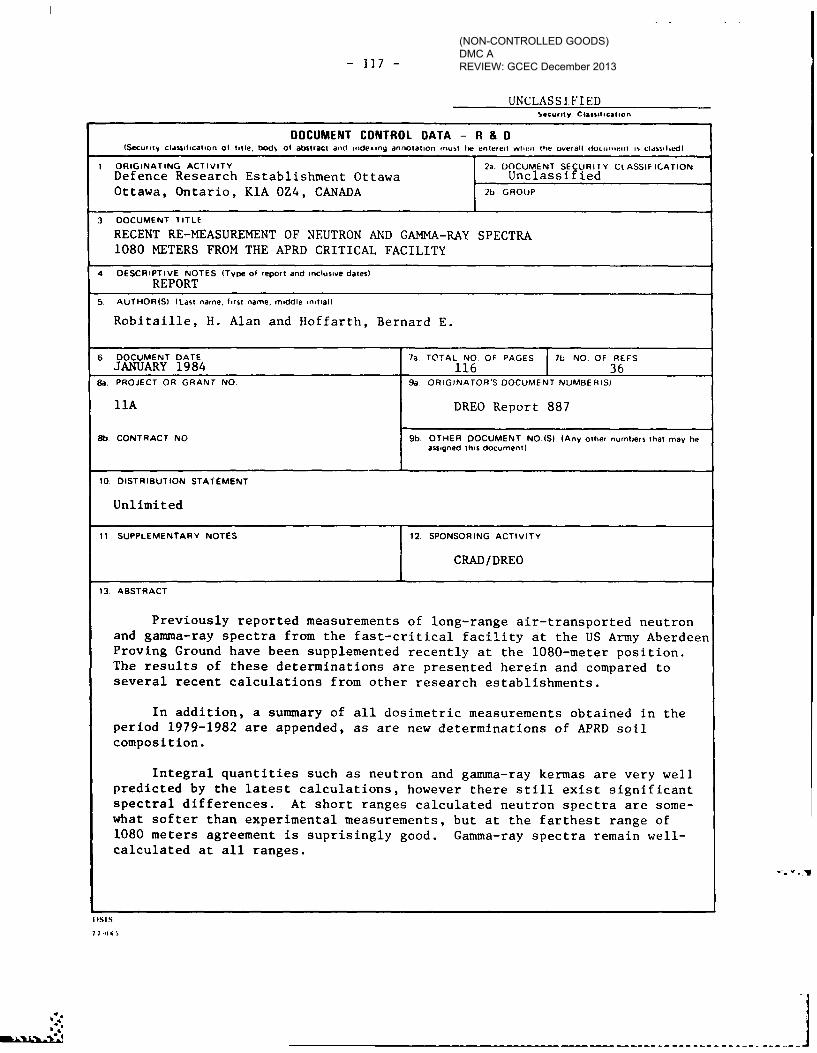
- 117 -
UNCLASSIFIEDS.curity Classifcat,on
• '.-DOCUMENT CONTROL DATA -R & 0 {~Security ciasa,*ication of title, bocl , of abstrac:t anld indexing annotation inust te entered wheii, the oveiall dtOLuliiit is cldwhded)
I ORIGINATING ACTIVITY 2a. DOCUMENT SECURITY CLASSIFICATIONDefence Research Establishment Ottawa Unclassified
Ottawa, Ontario, KIA OZ4, CANADA 2b GROUP
3 DOCUMENT TITLE•--
RECENT RE-MEASUREMENT OF NEUTRON AND GAMMA-RAY SPECTRA1080 METERS FROM THE APRD CRITICAL FACILITY
4 DESCRIPTIVE NOTES ITvpe of report and inclusive dates)REPORT
5 AUTHORIS) lLast name. first name, middle initial)
Robitaille, H. Alan and Hoffarth, Bernard E.
6 DOCUMENT DATE 7a. TOTAL NO OF PAGES 7b NO. OF REFS
JANUARY 1984 116 368a. PROJECT OR GRANT NO. 9a ORIGINATOR'S DOCUMENT NUMBERIS)
1 1A DREO Report 887
8W CONTRACT NO 9b. OTHER DOCUMENT NO(S) (Any other numbers that may heassigned this document)
10 DISTRIBUTION STATIEMENT
Unlimited
11 SUPPLEMENTARY NOTES 12. SPONSORING ACTIVITY
._______________CRADiDREO
13 ABSTRACT
Previously reported measurements of long-range air-transported neutronand gamma-ray spectra from the fast-critical facility at the US Army AberdeenProving Ground have been supplemented recently at the 1080-meter position.The results of these determinations are presented herein and compared toseveral recent calculations from other research establishments.
In addition, a summary of all dosimetric measurements obtained in the period 1979-1982 are appended, as are new determinations of APRD soilcomposition.
Integral quantities such as neutron and gamma-ray kermas are very wellpredicted by the latest calculations, however there still exist significantspectral differences. At short ranges calculated neutron spectra are some-what softer than experimental measurements, but at the farthest range of1080 meters agreement is suprisingly good. Gamma-ray spectra remain well-calculated at all ranges.
I SIS
- . . . . . . . . . ..'
%.. . . . . .. . . . . . . . . . . . . . . . . . . . . . .
*5. '- ... .",'.'-'. ** -
(NON-CONTROLLED GOODS)DMC AREVIEW: GCEC December 2013
118-S.o
UNCLASSIFIEDSecurity Classification-
KEY WORDS
NEUTRONGAMMA-RAYSPECTROSCOPYCRITICAL FACILITYRADIATIONDOSIMETRYRADIATION TRANSPORT
INSTRUCTIONS
1 1. ORIGINATING ACTIVITY. Enter the name and address of the 9b. OTHER DOCUMENT NUMBER(S). If the document has beenorganization issuing the document. assigned any other document numbers (either by the originator
or by the sponsor), also enter this number(s).2a. DOCUMENT SECURITY CLASSIFICATION: Enter the overall
security classification of the document including special warning 10. DISTRIBUTION STATEMENT. Enter any timitations Onterms whenever applicable. further dissemination of the document. other than those imposed
by security classification, using standard statements such as2b. GROUP: Enter security reclassification group number. The three
groups are defined in Appendix 'M" of the ORB Security Regulations. (1) "Oualitied requesters may obtain copies of thisdocument from their defence documentation center
3. DOCUMENT TITLE: Enter the complete document title in allcapital letters. Titles in all cases should be unclassified. If a (2) "Announcement and dissemination of this documentsufficiently desciptive titte cannot be selected without classii, is not authorized without prior approval fromcation, show title classification with the usual one-capital-letter originating activity." abbreviation in parentheses immediately following the title.
11. SUPPLEMENTARY NOTES Use for additional explanatory4. DESCRIPTIVE NOTES: Enter the category of document, e.g. notes.
technical report, technical note or technical letter. If appropri -.ate, enter the type of document, e.g. interim, progress, 12. SPONSORING ACTIVITY Enter the name of the departme iifisummery. annual or final. Give the inclusive dates when a protect office or laboratory sponsoring the research andspecific reporting period is covered, development. Include address.
5. AUTHOR(S): Enter the namels) of authorls) as shown on or 13. ABSTRACT: Enter an abstract giving a bief and factualin the document. Enter last name, first name, middle initial. summary of the document, even though it may also appsear1f military, show rank. The name of the principal author is an elsewhere in the body of the document itself It is highlyabsolute minimum requirement. itesirable that the atstract of classilied ilocum:rnis lie uri.il..%"
lied. Each paragraph of the abstract shall end with aii6. DOCUMENT DATE: Enter the date (month. year) of indication of the security i.lassification of the information
Establishment approval for publication of the document, in the paragraph (unless the document itself is unhlassili:.il)represented as ITS), (S). (C (RI. o (U)
7a TOTAL NUMBER OF PAGES The total page count shouldfollow normal pagnatlion procedures. i.e.. enter the number The length of the abstract should lie limited to 20 single spacedof pages containing information, standard typewritten lines. 71,3 inches long
7b. NUMBER OF REFERENCES: Enter the total number of 14. KEY WORDS: Key words are technically meaningful terms orreferences cited in the document. short phrases that characterize a document and could be helpful
in cataloging the document. Key words should be selected so8a. PROJECT OR GRANT NUMBER: If appropriate, enter the that no security classification is required. Identifiers. such as
applicable research and development protect or grant number equipment model designation, trade name, military protect codeinder which the document was written, name. geographic location, may be used as key words but will
be followed by an indication of technical contest.Sb. CONTRACT NUMBER If appropriate, enter the applicable
number under which the document was written.
go. ORIGINATOR'S DOCUMENT NUMBER(S) Enter theofficial document number by which the document will beidentified and controlled by the originating activity. Thisnumber must be unique to this documentO
op. 'I 0 '.*i*V .*
5