recent developments in rural road design in...
TRANSCRIPT

8
effort corresponding to the nominal case, $600/km, would reduc.:e lh" nel value of th!! road program by only about 3.5 percent.
In summary, it has been seen that, around the optimum, the net value of a road program is remarkably insensitive to the level of effort. In general, for road improvement projects that are of fairly low cost, such as around $10, 000/km, the optimum level of effort will fall between $400/km and $600/km; this is on or slightly above the rapid-rural-appraisal level of effort. For more expensive road projects, such as those costing around $35, 000/km, the optimum level of effort is about $1, 100/km and comparable to an in-depth survey of level of effort. However, for the high-cost projects, the value of the road program is so insensitive to the level of effort that the use of rapid rural appraisal techniques would result in only a minor reduction in the net value of the road program.
REFERENCES
1. G.W. Anderson and C.G. Vandervoort. Rural Roads Evaluation summary Report. AID Program Evalua-
Transportation Research Record 1055
tion Report 5. U.S. Agency for International Development, We:rnhlnytun, D.C., Md1d1 1982.
2 . C. Carnemark, J. Biderman, and D. Bovet. The Economic Analysis of Rural Road Projects. Staff Working Paper 241. world Bank, Washington, D.C., Aug. 1976.
3. s. Conlin ands. Wiggins. Rapid Rural Appraisal: A Review of the December 1979 Conference and Its Papers. Land Resources Development Center, Overseas Development Administration, Surrey, England, Dec. 1979.
The views and judgments expressed in this paper are those of the author and do not necessarily reflect those of the U.S. Department of Transportation.
Publication of this paper sponsored by Committee on Low Volume Roads.
Recent Developments In Rural Road Design In Australia
C. J. HOBAN
ABSTRACT
Two-lane roads make up the bulk of the rural road system in Australia and carry most of the travel between major cities. A number of developments in the geometric design of these roads are discussed, with particular reference to the contributions made by the Australian Road Research Board. Some of the major changes have been a greater emphasis on alignment consistency, the growing use of auxiliary lanes, and the move toward partial sealing of shoulders. Some details of new design guidelines are presented. Partial shoulder sealing was introduced primarily to reduce maintenance costs but has since been found to have safety and operational benefits. A survey of shoulder use has provided information on the probability of meeting stopped vehicles on the roadside and given some recommendations on shoulder and rest area design. Traffic simulation has been used to evaluate alternative road improvement strategies, including alignment changes and the use of auxiliary lanes. The TRARR simulation model is now being used by several state road authorities for planning and investigation studies. A consideration of accidents and road geometry is an underlying theme of the research on all of these topics.
Approaches to the geometric design of rural roads in Australia have undergone a number of changes in recent years. The emphasis has shifted from the rigid application of design standards to a greater awareness of the specific objectives for a given project and the alternative methods for achieving
these. Many design standards have been critically reviewed, and particular attention has been paid to the cost-effectiveness of alternative road improvement options.
A number of these changes are discussed, with particular reference to the contributions made by the Australian Road Research Board (ARRB) and the continuing research in this area. For simplicity, only the geometric aspects of road design for isolated road sections away from intersections and towns are considered.
Australian Road Research Board, 500 Burwood Highway, Vermont South, Victoria 3133, Australia.
Hoban 9
TABLE 1 Comparative Statistics for Australia and North America, 1979
Mileage/ I, 000 Roads Automobiles
Country Area Population (x 106 km 2
) (x 106)
Freeways Population (x 106 km) (x 103 km) (no./km) (km)
BACKGROUND
Australia United States Canada
7.7 9.4 9.9
14.5 226.4
23.6
0.87 6.25 0.89
Australia has a land area almost as large as that of the United States (excluding Alaska and Hawaii) but with a population of only 15 million. A large proportion of the population lives within a few large cities in the Southeast. Outside the cities, the majority of travel occurs on two-lane roads, which thus represent the principal means of long-distance regional and intercity travel and include most of the National Highway network. Some comparative statistics are presented in Table 1.
During the 1960s and 1970s, road design practice in Australia was largely based on well-established high geometric standards. For major two-lane rural highways, these called for wide cross sections and high design speeds for vertical and horizontal alignment. As traffic volumes grew, these roads were converted to four-lane freeways with full access control.
In the mid-1970s, however, it was becoming apparent that only a small proportion of required road improvements could be undertaken with available road funds. This was leading to a network with some sections of high-standard road and a growing backlog of substandard road lengths.
With this background, road practitioners and researchers took a renewed interest in the objectives of rural road designs and the most cost-effective means of achieving those objectives. This interest culminated in 1980 with the workshop on the Economics of Road Design Standards (!) and the publication of the Interim Guide to the Geometric Design of Rural Roads (~) by the National Association of Australian State Road Authorities (NAASRA). In both these publications a need for changes to the prevailing philosophies of rural road design was recognized. The process of review and change is continuing, and
120
,_
1.0 6.8 60.0 82.0 18.7 27.6
4.9 10.8 37.7
a revised version of the NAASRA Interim Guide will be published in 1986.
ALIGNMENT CONSISTENCY
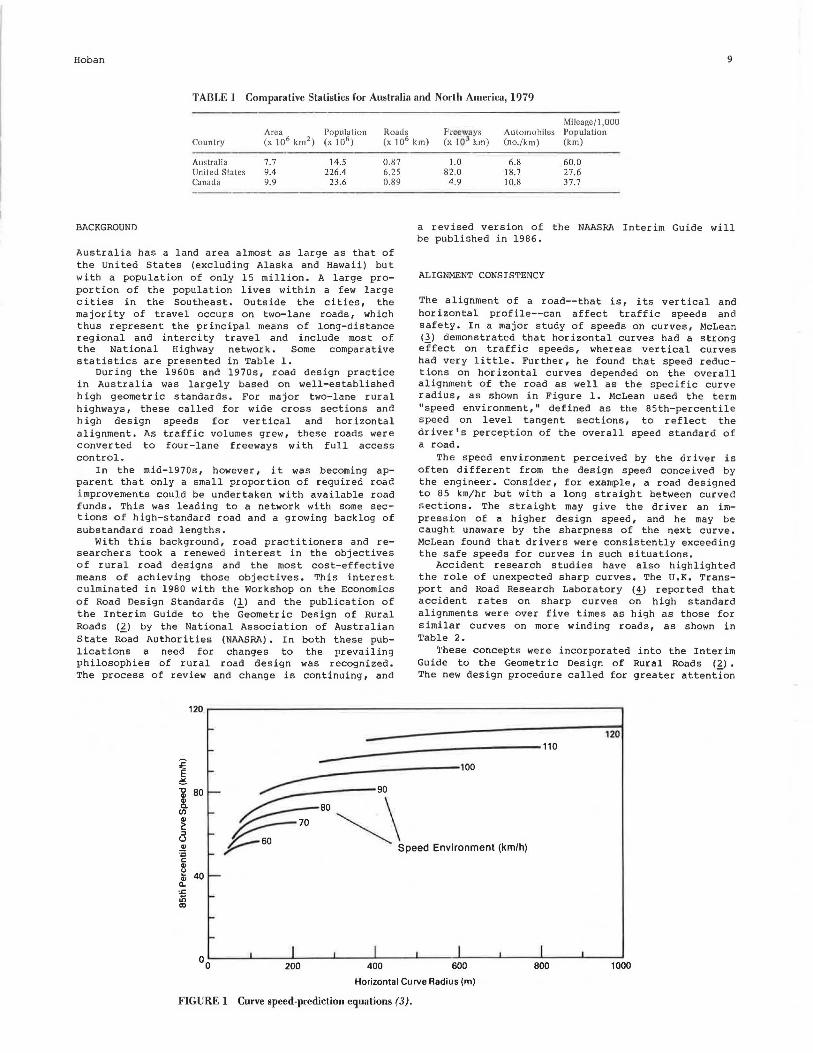
The alignment of a road--that is, its vertical and horizontal profile--can affect traffic speeds and safety. In a major study of speeds on curves, McLean (3) demonstrated that horizontal curves had a strong effect on traffic speeds, whereas vertical curves had very little. Further, he found that speed reductions on horizontal curves depended on the overall alignment of the road as well as the specific curve radius, as shown in Figure 1. McLean used the term "speed environment," defined as the 85th-percentile speed on level tangent sections, to reflect the driver's perception of the overall speed standard of a road.
The speed environment perceived by the driver is often different from the design speed conceived by the engineer. Consider, for example, a road designed to 85 km/hr but with a long straight between curved sections. The straight may give the driver an impression of a higher design speed, and he may be caught unaware by the sharpness of the next curve. McLean found that drivers were consistently exceeding the safe speeds for curves in such situations.
Accident research studies have also highlighted the role of unexpected sharp curves. The U.K. Transport and Road Research Laboratory (4) reported that accident rates on sharp curves o~ high standard alignments were over five times as high as those for similar curves on more winding roads, as shown in Table 2.
These concepts were incorporated into the Interim Guide to the Geometric Design of Rural Roads (2) • '.!'he new design procedure called for greater attention
120
-;E
------------110 ~
E -~ "C 80 -Cl) Cl) Q.
(/) ,_ Cl)
i! ::i ,_ u ~ ~
,_
~---------100
#-;-::::.\.,, E"<imomoot (km/h)
Cl)
~ 40 -Cl) Cl. ".I: .;; ,_ co
._
,_
00 I I I
800 I
200 400 I l I I I
600 1000
Horizontal Curve Radius (m)
FIGURE 1 Curve speed-prediction equations (3)-

10 Transportation Research Record 1055
TABLE 2 Nonintersection Injury Accident Rates on Straights and Curves (4)
Bend
Radius 5,000- Radius 2,000-Avg Straight3 2,000 ft 1,000 ft Radius < 1,000 ft Total Curvature (degrees/ mi) AMVM NOA AMVM NOA AMVM NOA AMVM NOA AMVM NOA
0-40 1.2 284 1.2 33 1.U 4 ~.6 18 1.3 339 40-80 0.9 142 0,9 37 0.9 23 1. 5 14 0.9 216 80-120 0.7 69 0.5 11 0.9 16 1.6 24 0.8 120 > 120 0.4 I 5 0.5 3 1.0 19 1.2 19 0.7 56
Total 1.0 510 0.9 84 1. 0 62 1.8 75 1.0 731
Note : AMVM = accidents per million vehicle miles ; NOA = number of accidents. 3Bends with radius more than S,000 rt included .
to consistency of alignment from the driver's point of view, and recommended that
1. On long straights, the design speed be take n as the speed environment:
2 . Design speeds on successive road elements not normally differ by more than 10 km/hr and definitely not more than 15 km/hr:
3. Where larger changes are unavoidable, more gradual change be accompli i>hed with a sequence of horizontal curves: and
4. Special attention be paid to curves at the end of long straight road sections.
In the current review of the guide it is recognized that it will sometimes be impossible to achieve consistent road geometry_ In these situations, the use of traffic management techniques such as warning signs or speed zoning is recommended to alert drivers to an unexpected change in geometric standard.
AUXILIARY LANES
A major change i n rural r oad design practice in Australia in recent years has been the growing us e of auxiliary lanes. These were initially provided on long steep grades to overcome delays and bottlenecks caused by slow trucks. They are now being used at a wide range of locations to break up bunched vehicles and improve the quality of service on a road. The term "auxiliary lane" is used here to include overt11king 111neR, climbing 111ne!'I, neRcenning laneR, 11nn short passing bays.
When an additional lane is provided over a short length of road to increase overtaking opportunities, benefits should be experienced for some distance upstream and downstream of the added lane. If advance notice is given to drivers, say, 1, 2, and 3 km be-
100
:;:-E 90 ~ 'O Q> Q> 80 a.
Cl)
c: "' Q> 70 ~
60
~
0 2 3
Position (km)
(al Two Lanes to Four Lanes
4 5
fore the overtaking lane, their overtaking behavior over this upstream section is likely to be more relaxed and safe, because marginal overtaking maneuvers are less likely to be attempted. Because the overtaking lane breaks up bunched traffic, downstream traffic should experience higher average speeds and an improved quality of service. The benefits of the s hort extra lane can thus extend for a number of kilometers downstream.
'l'o investigate traffic behavior on an overtaking lane, the author (2_) measured changes in traffic performance near transitions between two- and fourlane rural roads. The transitions were in fairly level terrain, and some results are presented in Figure 2, On entry to the four-lane road section, it is shown that speed continued to improve over a dist anc e of 2.2 km, bu t ha lf of the observed benefits occurred within the first 400 m. The deterioration in traffic speed on return to the two-lane road (at a second site many kilometers downstream) was considerably more gradual.
A number of studies in Australia have used traffic simulation to estimate the benefits in traffic operations that could be expected from the provision of auxiliary lanes. An example is discussed in the section on simulation of road improvement strategies. In each case, the studies indicated that substantial benefits in traffic operations could be achieved at quite low costs. A two-lane road with regular auxiliary lanes in effect provided an intermediate level of service between two- and four-lane roads. The term "two-and-a-half-lane roAn" wi'ls coined to describe this type of road.
A major review of auxiliary-lane research and design practice in Australia and Canada has recently been completed (§), which highlighted many areas of similarity between the two countries, although there are some differences in lengths, signing, and barrier
100
J:. e 90 .><
'O
~ 80 n
Cl)
c: ~ 70 ~
60
-------0 2 3
Position (km)
(bl Four Lanes to Two Lanes
4 5
FIGURE 2 Changes in traffic speed on transitions between two-lane and four-lane rural roads (5).
Hoban 11
lining practice. Also, Australian research on this topic was compared with results from Canada (2 ) and the United States (!!_,2_).
GUIDELINES FOR AUXILIARY-LANE DESIGN
In the current review of the Australian design guide (£) , the section on auxiliary lanes is being substantially expanded and modified to incorporate the results of recent research and experience. Some key provisions of the draft guidelines are described in the following paragraphs.
Justification
The justification for an auxiliary lane is based on an evaluation of a significant length of road rather than on an isolated location. The basic evaluation assesses the need for overtaking opportunities and depends on traffic volume, the percentage of slow vehicles in the traffic stream, and the availability of overtaking opportunities in the surrounding terrain.
TABLE 3 Recommended Minimum Volume Guidelines for Overtaking Lanes
Overtaking Opportunities over Current-Year Design-Preceding 5 km' Hour Volume< by
Percentage of Slow Percent of Road Vehiclesd Provi1ling
Description Ov~rto kingb 10 20
Excellent 70-100 850 750 650 Good 30-70 680 600 520 Moderate 10-30 500 450 400 Occasional 5-10 340 300 260 Restricted 0-5 230 200 170 Very restricted 0 140 120 100
3Depending on road length being evaluated, this dislance could range from 3 to 10 km.
bThesc percentages are based on a much more demanding criterion than lhe 1,500 ft used in the Highway Capacity Manual (10). See NAAS RA Interim GulJ< (2).
~V C"hldc.s per hour, both di rC'ctlons. In cluding light trucks and enrA towing traiJers, caravans, and boats.
Draft volume guidelines are presented in Table 3. These are appropriate for short low-cost auxiliary lanes at spacings of 10 to 15 km or more. Climbing lanes, descending lanes, and passing bays are then regarded as special cases that may justify auxiliary lanes at lower traffic volumes. Where grades are steep and long enough to reduce a design truck speed to 40 km/hr, for example, the volume guidelines may be reduced by specified reduction factors.
Table 4 presents a range of auxiliary lane lengths appropriate for both grades and level terrain. As a general rule, it is considered more cost-effective to construct two short auxiliary lanes several kilometers apart than one long one in excess of the normal maximum length. If long bunches occur at a given location, the provision of several auxiliary lanes at regular spacings should break them up before they become very extensive.
On grades, auxiliary lane length is often cons trained by the choice of appropriate starting and termination points. These constraints can lead to long or expensive climbing-lane proposals. Because the volume guidelines in Table 3 are based on bene-
TABLE 4 Auxiliary Lane Lengths
Auxiliary Lane Length, Including Taper (m) Design Total Speed' Taper Normal (km/hr) (m) Minimum Recommended Maximum
so 125 200 350 450 60 150 250 400 550 70 175 300 500 650 80 200 400 600 850 90 225 500 700 1,000
100 250 600 800 1,200
3 For the section on which the auxiliary Jane is constructed.
fit-cost analysis, they may not be applicable to more expensive proposals. When climbing-lane proposals exceed 1,200 m in length or have construction costs well above those for surrounding terrain, consideration may be given to the use of partial climbing lanes or, in extreme cases, short passing bays. Alternatively, if the grade delays are not excessive, it may be appropriate to construct a lower-cost auxiliary lane away from the grade.
Location
The choice between grade and nongrade locations should take account of relative costs, delays on the grade, and the nature of traffic demand on the road. If significant bunching occurs for several kilometers along a route, an auxiliary lane at any location is likely to produce substantial benefits. In other cases, the major problem could be truck crawl speeds at specific locations, and the solution may need to be provided where the problem occurs.
Spacing
On a road with no auxiliary lanes, it is most costeffective initially to place auxiliary lanes well apart rather than to have several close together. A spacing of 10 to 15 km or more is appropriate for this approach. As traffic volumes grow, or where a larger improvement in traffic operations is required, additional auxiliary lanes may be provided at spacings as close as 3 to 5 km.
Approach to Design
Auxiliary lanes may be provided at regular spacings to upgrade traffic operations over a long section of road. Locations should be chosen where possible to minimize construction costs, and a mixture of climbing and overtaking lanes is often appropriate. Some important considerations are the following:
1. Starting and termination points should be clearly visible to drivers, and tapers should be adequate to allow smooth lane changing.
2. Merges should, where possible, be located so as to minimize speed differences between fast and slow vehicles.
3. Advance notice is desirable for several kilometers upstream of an auxiliary lane.
4. For traffic in the opposing direction to that of an auxiliary lane, barrier lines to restrict overtaking should generally follow normal practice for two-lane roads. (This would often allow the opposing traffic to make some use of the auxiliary lane for overtaking.) The use of more restrictive barrier lining practice may be appropriate in some circumstances (such as high volumes) , but should not be too widespread.
12
When auxiliary lanes are not constructed on grades, they should be located ~o as to appear appropriate to drivers. Sites with curved alignment and restricted sight distance are generally preferable to straight sections with long sight distance. Curves with lower safe speeds should be avoided, however, because these are not appropriate locations for overtaking.
SHOULDER DESIGN
At the request of the NAASRA Road Design Committee, ARRB has recently investigated many aspects of shoulder design for two-lane rural roads. The project considered the effects of shoulder width and sealing, and incorporated five main tasks:
1. A literature review of the effects on both traffic operations and safety;
2. A more detailed investigation of the effects on road accidents;
3. A field study of vehicle lateral placement on the road and its variation with lane width, shoulder width, and shoulder type;
4. A survey of state road authority divisions to determine current practice and attitudes regarding shoulder construction, maintenance, and use by vehicles; and
5. A field survey of the extent and nature of use of road shoulders by stationary vehicles.
Literature Review
Armour and McLean (Jd) found that much of the literature on road shoulders was over 20 years old and that the effect of shoulder width on accidents was still unclear. Sealed shoulders were found to have better safety records than gravel shoulders for a wide range of traffic volumes and shoulder widths. The accident reductions achieved through shoulder improvements were mainly in run-off-road and opposing-direction accidentlol. The role or Lhe shoulder in providing a stand-clear area for stopped vehicles did not appear to produce significant safety benefits.
On the ,basis of overseas research, Armour and McLean (11) argued that narrow sealed shoulders may be appropriate for many Australian highways. The benefits would include reduced maintenance costs, a reduction in loss-of-control accidents associated with gravel shoulders, and the possibility that slow-moving vehicles could pull to the left to be overtaken. Armour and McLean suggested that, because nondiscretionary stops are fairly rare on rural roads, continuous wide shoulders may not be necessary on all roads.
Shoulders and Accidents
A more detailed study of shoulders and accidents was reported by Armour (12), who used the fatal-accident report forms completed by engineers of the Department of Main Roads (DMR) in New South Wales and the computerized road inventory developed for the NAASRA Roads Study (13) •
Armour (12) considered fatal accidents on undivided ruralhighways with a 100 km/hr speed limit (the normal state limit) from 1980 to 1982. The frequency of accidents on roads with various shoulder types was compared with the frequency of travel on these road sections, using the road inventory information. Armour found that the DMR forms covered only 55 percent of fatal accidents reported by the police
Transportation Research Record 1055
TABLE 5 Relative Accident Rates by Shoulder Type and Road Geomelry ( 12)
Shoulder Type
Geometry Unsealed Sealed
Horizontal Straight 1.0 0.3 Curved 5.9 1.5
Vertical Flat 1.1 0.4 Grade 5.6 1. 2
All 1.8 0.6
All
0.7 3.5
0.8 3.0
for state highways over that period, but provided an unbiased sample of all accidents. She therefore expressed her results as "relative accident rates," assuming a rate of 1.0 for straight roads with unsealed shoulders.
The results of this study are presented in Table 5. Overall, the relative accident rates were 1. 8 on roads with unsealed shoulders and 0.6 on roads with sealed shoulders. This indicates that accidents occurred three times as often with unsealed shoulders than with sealed shoulders. When grades and curves are isolated, the difference is even more pronounced. That is, the accident rate on curves and grades wit h unsealed shoulders was roughly four times that on similar road sections with sealed shoulders.
Investigating these relationships further, Armour (12) noted that roads with sealed shoulders may have b;;n reconstructed more recently, and thus incorporated better road geometry, pavement, or surroundings than the roads with unsealed shoulders. An assessment of the frequency of various types of curves and grades, however, revealed similar results for both road types.
A closer examination of accident report forms, however, showed that loss of control on the gravel shoulder was a contributing factor to 17 percent of all accidents and 50 percent of run-off-road accidents. This examination also showed that parked vehicles and vehicles overtaking on the left were not a significant accident factor.
Vehicle Lateral Placement
In the third stage of this project, Armour <..!.!> reported on a field study of the effects of road cross section on vehicle lateral placement. Vehicles were observed on the road at 19 rural highway sites, including 11 in the state of Victoria and 6 in Queensland. The sites included a range of shoulder types, shoulder widths, lane widths, and delineation treatments. The major findings of this study were as follows:
1. The main factors affecting lateral placement at the sites were shoulder type and lane width;
2. A lateral shift of 0.15 m away from the center line was produced by either increasing lane width from 3. 2 to 3. 7 m or sealing or partly sealing the shoulders;
3. There was a significant variation in lateral placement between vehicles alone on the road and those meeting other vehicles; that is, vehicles moved farther from the center line when opposing vehicles were in the vicinity;
4. The effect of unsealed shoulder width was unclear;
5. No effect of edge lines on lateral placement was detected; however, all studies were conducted in

Hoban
daylight and night behavior with regard to edge lines may be differenti and
6. No difference was found in the lateral placement data from the two states.
Vehicle lateral placement is sometimes regarded as a measure of driver comfort and safety. If this is the case, the provision of wider lanes (up to 3.7 m) or sealed shoulders will increase the spacing between opposing vehicles and improve comfort and safety. The sealed shoulders investigated in this study had widths of 1.2 to 1.5 m.
Current Shoulder Design Practice and Attitudes
With the support of the NAASRA Road Design Committee, a questionnaire survey was circulated to engineers of each state road authority in Australia. A total of 94 questionnaires was circulated to all district, divisional, and regional engineers and head office sections responsible for road design. Sixty-nine of these were returned by July 1984, although some did not contain replies to all questions.
The results of this survey (15) provide a useful summary of current practice and attitudes to road shoulders. Some interesting results were the following:
l. On existing rural roads, both wide and narrow shoulders are used, and the majority are unsealed. On new construction, however, about half of the replies indicated that sealed shoulders are provided on over 50 percent of new work.
2. Of those divisions providing sealed shoulders, half provided them at volumes below 500 vehicles/day and 94 percent provided them at volumes below 3 ,000 vehicles/day. Sixty-eight percent of divisions always provide full-strength pavement under sealed shoulders.
3. Two questions asked for general opinions on construction and maintenance costs. The majority of respondents believed that sealed shoulders only slightly increase construction costs and substantially reduce maintenance costs. Those respondents actually using sealed shoulders particularly supported these views.
4. There was general agreement that although sealed shoulders would be used by moving vehicles, this was not desirable and should not be encouraged. It was stated that sealed shoulders should be designed for traditional shoulder functions and should not be used as an alternative to providing extra traffic lanes.
5. The most common delineation treatment with both shoulder types was edge lining. About 28 percent of respondents believed that edge lines reduced maintenance costs of unsealed shouldersi of divisions using edge lines with unsealed shoulders, 49 percent believed that they reduced maintenance costs. A number of respondents commented that edge lines had safety benefits.
SHOULDER USE
The final component of this project consisted of a field survey of vehicles stopped on the road shoulder. This survey has recently been undertaken in six regions of Queensland, with considerable assistance from the Main Roads Department.
The survey involved drivers traveling over predetermined routes with known traffic volumes and noting all vehicles stopped by the roadside in rural areas. If the driver was present, a short questionnaire was administered to determine whether the stop
13
was discretionary or unavoidable, how far the vehicle might have traveled before stopping, and the driver's knowledge of nearby rest areas. Information on the placement of the vehicle relative to the traffic lane and shoulder was also recorded.
Details of the survey procedure and results are given by Charlesworth (_!i). Some of the key findings were as follows:
l. A total of 283 stopped vehicles was recorded in almost 6,000 km surveyed. This gave an average of one stationary vehicle met per 21 km traveled. The frequency of stationary vehicles increased with traffic volume.
2. The distribution of reasons for stopping is shown in Table 6. Sixty-five percent of stopped vehicles were parked completely off the road carriageway, that is, clear of both the traffic lane and shoulder. The majority of these were service vehicles (e.g., telephone or gas) or those parked outside houses, farms, and schools. The frequency of stopped vehicles met on the carriageway was one every 62 km. Most of these vehicles were on the shoulder. Only three were fully on the traffic lane and five straddled lane and shoulder.
3. Table 7 shows a clear relationship between the proportion of vehicles off the carriageway and the duration of stop. Vehicles stopped for a long time were most likely to be off the carriageway.
4. Roads with fewer rest areas had more discretionary stops but a similar number of breakdown stops relative to roads with more frequent rest areas.
5. Discretionary stops not related to specific locations accounted for 33 percent of vehicles stopped on the carriageway. The results of this study indicate that better publicity about rest areas may reduce this number.
6. A disabled vehicle was met on the carriageway, on average, every 180 km driven. Forty-seven percent of disabled vehicles could have been driven further.
Charlesworth <!§) reported two measures of the interaction between moving traffic and stopped vehicles. These were vehicles met per kilometer of travel
TABLE 6 Distribution of Reasons for Stopping (16)
Location of Vehicle
Off On Reason for Stopping Carriageway Carriageway Total
Service 56 4 60 Outside property 60 12 73 Breakdown 20 23 43 Leisure or refreshments 17 18 35 Other discretionary 3 14 17 Other location (specific) 14 13 27 Unknown 15 13 28
Total 185 97 283
TABLE 7 Percentage of Vehicles off Carriageway and Estimated Duration for Different Types of Stops (16)
Percent of Estimated Vehicles off Duration Sample
Type of Stop Carriageway of Stop Size
Service 93 5.5 hr 20 Outside house 88 4.0 hr 9 Leisure 51 25 min 35 Breakdown 53 16 min 28 Location (specific) 52 14 min 5 Outside business 18 11 min 5 Other discretionary 18 7 min 14
14
by one driver and vehicles met per kilometer per hour at a given trattic volume. She recommended that road designers give particular attention to shoulder and roadside design at locations where drivers are likely to stop. Improving the frequency and attractiveness of, and information about, rest areas was also recommended as a way of reducing discretionary stops on the roadside.
SIMULATION OF ALTERNATIVE ROAD IMPROVEMENT STRATEGIES
A number of studies have been undertaken at ARRB to investigate alternative strategies for rural road improvement. McLean (17) used a single-vehicle simulation model to examine the cost implications of various design speed standards in hilly terrain. Briefly, his findings were as follows:
1. With the cost parameters typically employed for economic assessment of road projects in Australia, travel time costs for cars were about three times those for fuel consumption, whereas these two cost components were about equal for trucks.
2. In hilly terrain, a design speed increase of 20 km/hr in the range 50 to 90 km/hr represents
• A doubling of earthworks, • A 10 percent decrease in car travel time, • A 7 percent decrease in truck travel time, • A 0 to 10 percent decrease in car fuel
consumption, and • A 2 to 5 percent decrease in truck fuel
consumption. 3. In terms of trade-offs between standards for
horizontal and vertical alignment, trucks gain relatively more from improved vertical geometry, whereas cars gain relatively more from improved horizontal geometry.
More recently, a detailed microscopic simulation model has been used to evaluate road improvement alternatives. The TRARR rural traffic simulation model (~) was developed at ARRB, and copies have been provided to over a dozen organizations both inside and outside Australia. Several Australian state road authorities are using the model for planning future road programs and evaluating alternative design standards. Some specific applications are described by Robinson (.!2_), Hoban (.3..Q_), and Cox (21).
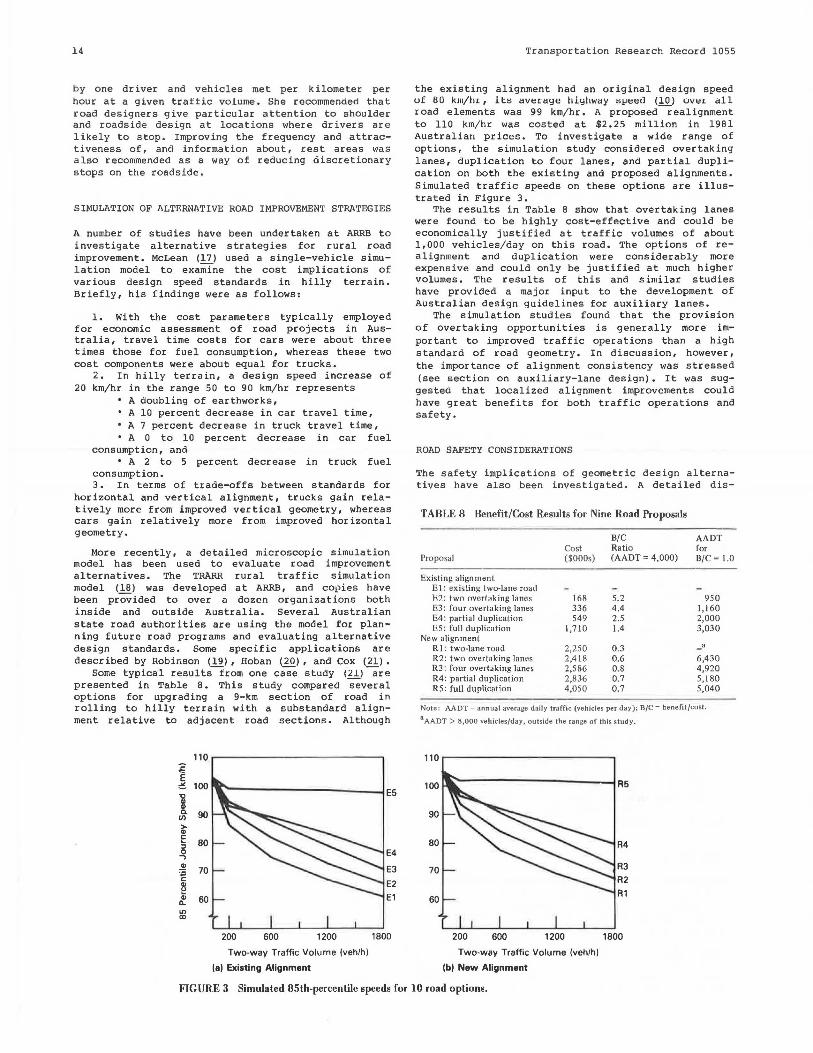
Some typical results from one case study (~1) are presented in Table 8. This study compared several options for upgrading a 9-km section of road in rolling to hilly terrain with a substandard alignment relative to adjacent road sections. Although
110
~ :!! 100 ~
E5 Cl> a. 90 en > Cl> c :; 80 0 E4 -, ~ 70 E3 ·~
E2 Cl> !:
El .. 60 0..
"' "' 200 600 1200 1800
Two-way Traffic Volume (veh/h)
(a) Existing Alignment
Transportation Research Record 1055
the existing alignment had an original design speed of 80 k111/l11, ito; averaye liiyhway o;1Jeetl (10) uveL <tll road elements was 99 km/hr. A proposedrealignment to llO km/hr was costed at $2.25 million in 1981 Australian prices. To investigate a wide range of options, the simulation study considered overtaking lanes, duplication to four lanes, and partial duplication on both the existing and proposed alignments. Simulated traffic speeds on these options are illustrated in Figure 3.
The results in Table 8 show that overtaking lanes were found to be highly cost-effective and could be economically justified at traffic volumes of about 1,000 vehicles/day on this road. The options of realignment and duplication were considerably more expensive and could only be justified at much higher volumes. The results of this and similar studies have provided a major input to the development of Australian design guidelines for auxiliary lanes.
The simulation studies found that the provision of overtaking opportunities is generally more important to improved traffic operations than a high standard of road geometry, In discussion, however, the importance of alignment consistency was stressed (see section on auxiliary-lane design). It was suggested that localized alignment improvements could have great benefits for both traffic operations and safety.
ROAD SAFETY CONSIDERATIONS
The safety implications of geometric design alternatives have also been investigated. A detailed dis-
TABLE 8 Benefit/Cost Results for Nine Road Proposals
B/C AADT Cost Ratio for
Proposal ($000s) (AADT = 4,000) B/C = 1.0
Existing alignment EI: existing two-lane road F.?.: two overteking lenes lliR 5.2 9SO E3: four overtaking lanes 336 4.4 1,160 E4 : partial duplication S49 2.S 2,000 ES: full duplication 1,710 1.4 3,030
New alignment Rl: two-lane road 2,2SO 0.3 -· R 2: two overtaking lanes 2,4 18 0.6 6,430 R3: four overtaking lanes 2,586 0.8 4,920 R4: partial duplication 2,836 0.7 S,180 RS: full duplication 4,0SO 0.7 5,040
Note: AADT =ann ual average da il y t raffic (vehicles per day); B/C = benefit/cost. 9AADT > 8,000 vehicles/day, outside the range of th is stud y.
110
100 R5
90
80 R4
70 R3 R2
60 Rl
200 600 1200 1800
Two-way Traffic Volume (veh/h)
(b) New Alignment
F1GURE 3 Simulated 85th-percentile speeds for 10 road options.

Hoban
cussion of this topic is beyond the scope of this paper, but useful Australian reviews have been made (~-24). These have drawn heavily from U.S. research studies (25-~) and reinforce many of the recommendations already made in this paper. They indicate, for example, that road safety may be improved by actions such as
l. Realignment of road sections with sharp curves and steep grades, especially where these are below the standard of adjacent road sections;
2. Increasing lane width, at least up to 3. 4 m, or providing additional lanes;
3. Sealing road shoulders and increasing shoulder width;
4. Adding auxiliary lanes; 5. Controlling access to a road; 6. Providing gentle batter slopes and removing
fixed objects or installing guard fence to protect motorists from hazards; and
7. Providing special facilities for runway trucks on steep downgrades.
Road safety improvements are sometimes considered as a relatively low-cost alternative to major realignment of a problem section of road.
SUMMARY
In recent years, road design practice in Australia has placed greater emphasis on selecting cost-effect ive solutions to particular road problems. This has required a move away from the rigid application of design standards and a critical review of road improvement needs. A particular feature of evolving road design practice is a reduced emphasis on a high alignment design speed. Improved alignment is generally quite expensive, and if funds are limited, it may not be the most cost-effective approach in many cases.
As an alternative, primary emphasis is placed on consistency of the road environment as seen by the driver. Greater consistency may be achieved by localized alignment improvements, and large changes in speed environment should where possible be introduced in stages. As a last resort, traffic management measures such as signs and road markings should be used to alert drivers to unexpected road features.
A second element of evolving design practice is a much greater emphasis on provision for overtaking. Auxiliary lanes are now being provided at both grade and level locations on Australian highways, giving substantial improvements in traffic performance. Cost is an important factor in decisions about auxiliary-lane locations, and other guidelines are included in this paper.
The use of partial (l.O to 1.5 m) sealed shoulders on Australian rural highways is also growing. These provide for substantial accident reductions, reduced maintenance costs, and improved driver level of service. The need for gravel shoulder adjacent to the narrow seal is uncertain, and a recent study of stopped vehicles on road shoulders gives some information on the requirements of these vehicles and the expected frequencies of meeting them on a given road.
The alignment and cross section of a road can be designed to minimize the possibilities and severities of road accidents. However, an ideal design may be extremely expensive and often not practical in particular circumstances. The provision of guard fence and runaway-vehicle facilities can be a cost-effective alternative approach.
15
REFERENCES
1. Proceedings of the Workshop on Economics of Road Design Standards. Bureau of Transport Economics, Canberra, Australia, 1980.
2. Interim Guide to the Geometric Design of Rural Roads. National Association of Australian State Road Authorities, Sydney, New South Wales, Australia, 1980.
3. J .R. McLean. Review of the Design Speed Concept. Australian Road Research, Vol. 8, No. l, 1978, pp. 3-16.
4. Research on Road Traffic. u.K. Transport and Road Research Laboratory, Crowthorne, Berkshire, England, 1965.
5. C.J. Hoban. Traffic Performance on Transition Between Two-Lane and Four-Lane Rural Roads. Proc., 10th ARRB Conference, Vol. 10, No. 4, 1980, pp. 33-42.
6. C.J. Hoban and J.F. Morrall. Overtaking Lane Practice in Canada and Australia. Internal Report AIR 359-15. Australian Road Research Board, Vermont South, Victoria, 1985.
7. J.F. Morrall and L. Blight. Evaluation of Test Passing Lanes on the Trans-Canada Highway in Banff National Park. Proc., International Transport Congress, Roads and Transportation Association of Canada, Ottawa, Ontario, 1984.
8. D.W. Harwood, A.O. St. John, and D.L. Warren. Operational and Safety Effectiveness of Passing Lanes on Two-Lane Highways. In Transportation Research Record 1026, TRB, National Research Council, Washington, D.C., 1985, pp. 31-39.
9. T.L. Botha and A.O. May. A Decision-Making Framework for the Evaluation of Climbing Lanes. Proc., 8th International Symposium on Transportation and Traffic Theory, Toronto, Ontario, Canada, 1981, pp. 91-120.
10. Highway Capacity Manual. Special Report 87, HRB, National Research Council, Washington, D.C., 1965.
11. M. Armour and J.R. McLean. The Effect of Shoulder Width and Type on Rural Traffic Safety. Australian Road Research, Vol. 13, No. 4, 1983, pp. 259-270.
12. M. Armour. The Effect of Shoulder Design on Fatal Accident Rates. Proc., 12th ARRB Conference, Vol. 12, No. 5, 1984, pp. 49-62.
13. The NAASRA Roads Study. National Association of Australian State Road Authorities, Sydney, New South Wales, Australia, 1984.
14. M. Armour. The Effect of Road Cross-Section on Vehicle Lateral Placement. Australian Road Research, Vol. 15, No. l, 1985, pp. 30-40.
15. M. Armour. Survey of Current Shoulder Design Practice. Internal Report AIR 404-3. Australian Road Research Board, Vermont South, Victoria, 1984.
16. K. Charlesworth. The Use of Road Shoulders by Stationary Vehicles. Internal Report AIR 404-4. Australian Road Research Board, Vermount South, Victoria, 1984.
17. J.R. McLean. Cost Implications of Design Speed Standards. Research Report AAR 112. Australian Road Research Board, Vermont South, Victoria, 1980.
18. C.J. Hoban, G.J. Fawcett, and G.K. Robinson. A Model for Simulating Traffic on Rural Roads: User Guide and Manual for TRARR Version 3.0. Terminal Manual ATM lOA. Australian Road Research Board, Vermont South, Victoria, 1985.
19. G.K. Robinson. Use of a Traffic Simulation Model To Formulate a Climbing Lane Warrant. Internal Report AIR 290-1. Australian Road Research Board, Vermont South, Victoria, 1980.
16
20. C.J. Hoban. The Two and Half Lane Rural Road. Proc., 11th ARRB Conterence, Vol. 11, No. 4, 1982, pp. 59-70.
21. R.L. Cox. A Simulation Study of Road Improvement Alternatives for the Bruce Highway from Cabbage Tree Creek to Kolan River. Presented at workshop on Rural Traffic Simulation. Australian Road Research Board, Vermont South, Victoria, 1983.
22. Sinclair, Knight and Partners. A Review of Road Design in Relation to Road Safety. Report NR 11. Australian Department of Transport, Canberra, 1973.
23. C.J. Boughton. Accidents and Geometric Design. Research Report ARR 44. Australian Road Research Board, Vermont South, Victoria, 1975.
24. J.R. McLean. The Principles of Geometric Road Design. Proc., ARRB 21st Regional Symposium, Darwin, Northern Territory, Australia, 1983, pp. 1-20.
Transportation Research Record 1055
25. D. Solomon. Accidents on Main Rural Highways Helated to Speed, Driver and Vehicle. Bureau u( Public Roads, u.s. Department of Commerce, 1964.
26. R.E. Jorgensen. Evaluation of Criteria for Safety Improvements on the Highway. Bureau of Public Roads, u.s. Department of Commerce, 1966.
27. Synthesis of Safety Research to Traffic Control and Roadway Elements, Report TS-82-232. FHWA, U.S. Department of Transportation, 1982.
28. c.v. Zegeer, R.C. Deen, and J.G. Mayes. Effect of Lane and Shoulder Widths on Accident Reduction and rural Two-Lane Roads. In Transportation Research Record 806, TRB, National Research Council, Washington, D.C., 1981, pp. 33-43.
Publication of this paper sponsored by Committee on Geometric Design.