recent developments of feed-in systems in the eu - a research paper for the international feed
TRANSCRIPT
1
Recent developments of feed-in systems in the EU – A research paper for the International Feed-In Cooperation
January 2012
A report commissioned by the Ministry for the Environment, Nature Conservation and Nuclear Safety (BMU) Authors:
Mario Ragwitz, Jenny Winkler (Fraunhofer ISI)
Corinna Klessmann, Malte Gephart (Ecofys)
Gustav Resch (EEG, TU Vienna)

2
3
1. Introduction
Following Directive 2009/28/EC the national support mechanisms for renewables in the EU member states have been published in the National Renewable Energy Action Plans (NREAPs), which also include indicative trajectories regarding the share of RES in electricity, heat and transport energy consumption.
With regards to RES-E, the most frequently implemented support instruments in the EU-27 are feed-in systems.1
This report intends to give an overview of successful European feed-in tariffs up to date. It identifies best practice designs for feed-in tariffs. Furthermore, it introduces and compares feed-in premium designs of different European countries. As most of these systems are still very young, best practices for feed-in premiums cannot yet be identified.
These systems have proven to be effective and efficient in supporting renewable electricity generation in many European countries. Two options are available: the feed-in tariff, which guarantees a fixed price per kWh electricity, or the feed-in premium, which is paid on top of the market price for electricity. Over the last years, a trend towards feed-in premiums can be observed.
The report is part of the efforts of the International Feed-in Cooperation (IFIC) which has been initiated by the governments of Spain and Germany in 2004 to promote the exchange of experience and to improve the feed-in system design in the EU and other countries. Slovenia joined the IFIC in 2007 and Greece in January 2012. The report “Evaluation of different feed-in tariff design options – Best practice paper for the International Feed-In Cooperation” (Klein et al. 2010), available online at the Feed-In Cooperation’s website www.feed-in-cooperation.org, provides additional information about feed-in systems in the European Union. It will be updated in October 2012.
2. Feed-in schemes are the most common support
scheme in Europe
EU member states use feed-in systems, quota obligations with tradable green certificates, investment grants and tax incentives to support renewable electricity generation. As shown in the map in Figure 1, feed-in systems are the most commonly used RES-E support scheme in Europe. The number of countries using feed-in
1 While this paper focuses on the EU, feed-in systems are used as support instrument for
renewable energies across the world; for a global overview of renewable energy policies, see for example www.ren21.net
4
systems has increased steadily from 9 states in 2000 to 18 in 2005 and 24 in 2012. 20 out of 27 member states use feed-in systems as main support instrument; four more member states as supporting instrument for certain RES-E technologies.
Recently, also Member states with quota systems have introduced feed-in tariffs in combination with their quotas. Italy and the United Kingdom, for example, introduced a feed-in tariff for small scale installations and Belgium one for PV in 2010. Furthermore, Finland moved from its investment grant support to a feed-in premium in 2011.
The use of feed-in premiums has been increasing across Europe. Under feed-in premium regimes, renewable electricity generators receive a feed-in support payment in addition to their revenues from selling electricity in the spot market. Currently, the Czech Republic, Denmark, Estonia, Finland, Germany, Italy, the Netherlands, Slovakia, Slovenia and Spain use feed-in premiums in combination with other support instruments or as the main support tool for renewable electricity. The United Kingdom plans the introduction of a similar scheme.

5
Figure 1 Map of EU countries according to their support mechanisms for RES-E

6
3. Feed-in systems are an effective support instrument
Countries using feed-in tariffs have been responsible for the majority of newly installed wind onshore and photovoltaics capacity in Europe. 93% of all wind onshore capacity and nearly 100% of all photovoltaics capacity installed by the end of 2010 in Europe were initiated by feed-in tariff systems. Also in overall terms countries using feed-in tariffs have had a leading role in developing renewables in Europe: 78% of new renewable electricity generation added between 1999 and 2009 was contributed by these countries while their electricity consumption only comprises 62% of total EU-27 electricity consumption.
Figure 2 Comparison of the installed capacities (in GW) of biomass electricity, wind on-
shore and photovoltaics (PV) in the EU-27 and in countries using feed-in tariffs

7
Figure 3 Comparison of the electricity generation (in TWh) of biomass electricity, wind
on-shore and PV in the EU-27 and in countries using feed-in tariffs
The positive impact of a feed-in tariff on wind energy deployment is demonstrated by best-practice countries, particularly Spain, Germany, Denmark and Portugal. Germany has seen a strong increase in installed wind energy over the last ten years: the installed capacity increased from 4442 MW in 1999 to 18415 W in 2005 to 27214 MW in 2010. By the end of 2010, wind energy accounted for 9.3% of German electricity production; in Spain, 14.4% of the electricity supply was provided by wind, in Portugal 14,8% and in Denmark even 24%. The feed-in tariff also had a strong impact on the wind energy market in Portugal. By the end of 2010, wind energy capacity increased to 3898 MW. Also Greece has seen a strong increase, but starting from a lower installed capacity. In 1999, 112 MW wind capacity were installed in Greece, rising to 1208 MW in 2010. Bulgaria, which introduced a feed-in system for wind installations in 2007, increased its wind power capacity to 375 MW in 2010. In France the installed capacity of onshore wind increased from 222 MW in 2003 to 5660 MW in 20102
2 EWEA 2011: Wind in power 2010 European Statistics,
.
http://www.ewea.org/fileadmin/ewea_documents/documents/statistics/EWEA_Annual_Statistics_2010.pdf
Eur’observer 2011: Wind power barometer, http://www.eurobserv-er.org/pdf/baro201.pdf
8
In most of the countries with significant PV deployment, the vast majority of installations have occurred following the introduction of a feed-in scheme. The strong growth in Germany and formerly Spain are the clearest indicators, but also tariff introductions in Italy, France, Portugal, Czech Republic and Slovenia have led to a strong stimulation of previously insignificant markets for PV. The UK is the most recent example with an increase in PV capacity from 30 MW in 2009 to 75 MW in 2010.
European PV installations reached 29327,7 MWp in 2010, which was an increase of almost 120% compared to 2009.3
60% of electricity generated from solid biomass was produced in countries with feed-in systems in 2010
In Germany, the installed PV capacity increased from 1910 MW in 2005 to 6019 MW in 2008 and 17370 MW in 2010. Italy increased its PV capacity from 458 MW in 2008 to 3479 MW in 2010. In the Czech Republic, the capacity increased from 55 MW to 1953 MW from 2008 to 2010, in France from 104 to 1054 MW, in Greece from 19 MW to 205 MW in 2010 and in Slovakia from zero MW in 2009 to 144 MW in 2010.
4
4. Well designed feed-in schemes are a cost efficient support instrument
. However, in contrast to PV and wind, countries with quota systems are equally successful in incentivizing biomass based RES-E generation when compared to countries with feed-in systems. Due to the high share of fuel costs in total generation costs the long term investment security given by feed-in systems is less relevant in the case of biomass technologies.
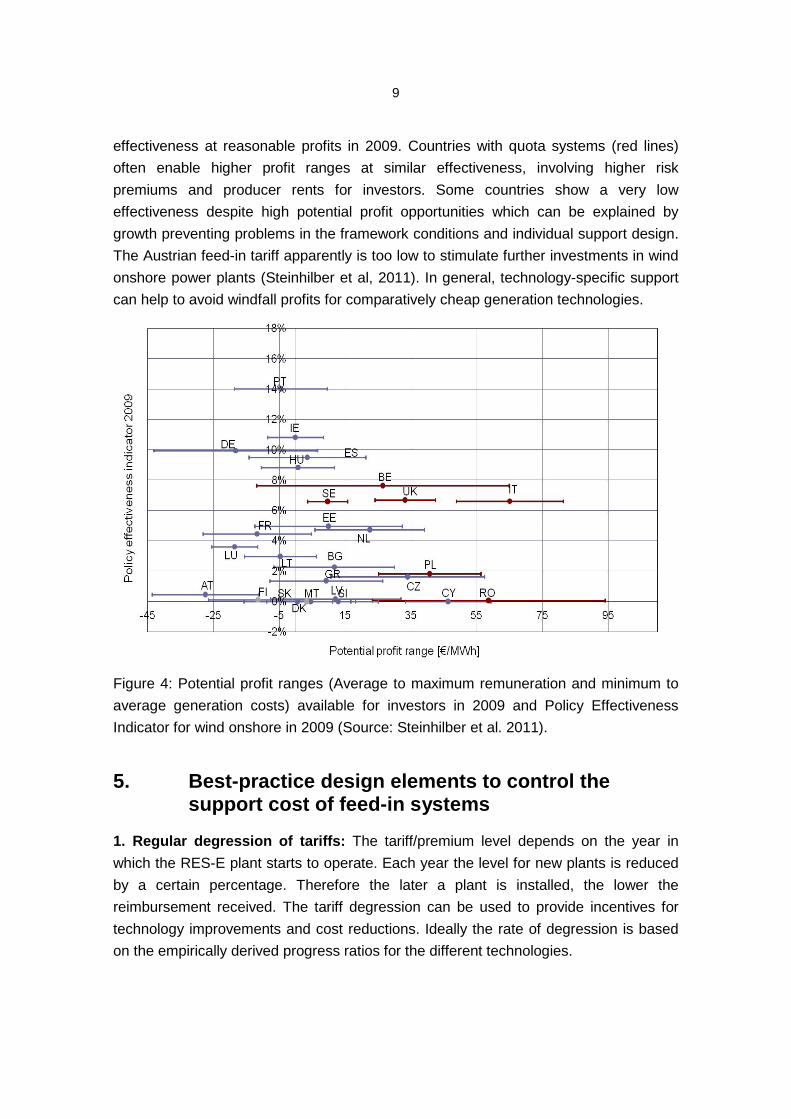
Feed-in schemes, when designed in an adequate way, have proven to be not only an effective but also a cost-efficient support mechanism for RES-E. Figure 4 shows a comparison of different countries regarding the efficiency of support instruments for wind onshore. The figure relates the effectiveness of a country’s policy to the profit range for RES-E generators (the profit range is calculated with a default interest rate of 6.5% (+2.1% inflation); see Steinhilber et al. 20115
3 Eur’observer 2011: Photovoltaic Barometer.
for details). The lower the generator’s profit, the lower the support costs to consumers. The figure shows that in general, countries with feed-in systems (blue lines) have achieved a rather high policy
http://www.eurobserv-er.org/pdf/baro202.pdf 4 Eur’observer 2012: Solid biomass barometer, http://www.eurobserv-
er.org/pdf/biomasse_2011.pdf 5 Steinhilber et al., 2011: Indicators assessing the performance of renewable energy support
policies in 27 Member States, http://www.reshaping-res-policy.eu/downloads/RE-Shaping%20D17_Report_update%202011_final.pdf
9
effectiveness at reasonable profits in 2009. Countries with quota systems (red lines) often enable higher profit ranges at similar effectiveness, involving higher risk premiums and producer rents for investors. Some countries show a very low effectiveness despite high potential profit opportunities which can be explained by growth preventing problems in the framework conditions and individual support design. The Austrian feed-in tariff apparently is too low to stimulate further investments in wind onshore power plants (Steinhilber et al, 2011). In general, technology-specific support can help to avoid windfall profits for comparatively cheap generation technologies.
Figure 4: Potential profit ranges (Average to maximum remuneration and minimum to average generation costs) available for investors in 2009 and Policy Effectiveness Indicator for wind onshore in 2009 (Source: Steinhilber et al. 2011).
5. Best-practice design elements to control the
support cost of feed-in systems
1. Regular degression of tariffs: The tariff/premium level depends on the year in which the RES-E plant starts to operate. Each year the level for new plants is reduced by a certain percentage. Therefore the later a plant is installed, the lower the reimbursement received. The tariff degression can be used to provide incentives for technology improvements and cost reductions. Ideally the rate of degression is based on the empirically derived progress ratios for the different technologies.

10
At the moment, among other countries, Germany, Greece, Slovenia and Spain have implemented mechanisms to regularly reduce the tariff rates. Some countries have fixed a regular yearly degresssion rate, others decide annually about the reduction in tariff rates (which introduces a small risk element into the support mechanism).
2. Growth corridors and caps: Many EU Member states want to support a broad basket of technologies, including the currently more expensive ones, but are afraid that support costs may increase uncontrollably. Some countries set caps, limiting the amount of annual installations to a certain capacity or financial amount. The downside of caps is the reduced investment stability for market parties and a frequent stop-and-go in the market. Another option is to set growth corridors with continuous automatic adjustments of tariffs. This preserves investment stability to a higher degree but may be less effective in limiting the increase of support expenditures.
A growth corridor or growth path is the amount of renewable capacity a country would like to see installed in a given year (e.g. 800-1.200 MW, or 1.000 MW) or part of a year (e.g. 200-300 MW per three month). In case growth is in line with that growth corridor the normal tariff degression would apply (e.g. minus 10% per year). In case growth is stronger than envisaged, the tariff degression is increased (e.g. minus 1% per 10% overshoot). In case of less growth than envisaged, tariff degression is decreased. The higher the frequency of adjustments (e.g. once in three month instead of once a year) and the higher the increase of tariff degression in case of overshoot, the higher the control on support cost but the lower the investment stability. Germany currently uses this system in the case of photovoltaics, whereas Spain applies a fixed cap for the annual installed capacity.
3. Stepped tariff design: A stepped tariff design is a way to avoid windfall profits. Under the design, the level of the tariff depends on the specific resource condition of the individual plant. Especially the costs of electricity from wind energy vary significantly depending on the wind yield, which is taken into account by such a tariff design. In the Netherlands, Portugal, Denmark, France and Germany concepts are applied where the feed-in tariff (FIT) level depends on the local conditions at the plant site. In the first four countries in this list the guaranteed payment of a higher tariff level is limited to a maximum energy output of a plant. A lower level of the tariff applies, when this amount of power output is reached. In Germany the support for wind energy is defined based on a reference yield. Operators of onshore wind turbines receive a fixed FIT during the first five years after the plant has started operating. The German Renewable Energy Act ("Erneuerbare-Energien-Gesetz", EEG) defines a reference wind turbine, which is located at a site with a wind speed of 5.5 m/s in an altitude of 30 meters. This reference turbine would generate a so-called reference yield in a five-

11
year-period. If a wind turbine produces at least 150% of this reference yield within the first five years of operation, the tariff level will be reduced for the remaining 15 years of support. However, for each 0.75% the generated electricity stays below the reference yield, the higher starting tariff will be paid for two further months. In consequence, wind power plants with average wind conditions receive the higher tariff for the full 20 years, while good wind sites will receive the reduced tariff after a certain number of years. This means that the use of wind energy to generate electricity is not restricted to locations with very good wind conditions but that sites with less favourable conditions can also be exploited.
4. Support for autoproducers through net metering was introduced in a number of countries with the aim to decrease the grid load and also to limit the support expenditures. The most prominent example for this policy is Italy, which revised its former Net Metering policy in 2009 and introduced a law which allows RES-E plants with a nominal power of up to 20 kW, plants with a capacity up to 200 kW that started production after 31.12.2007 and high-efficiency CHP plants up to 200 kW to apply Net Metering. Under this scheme, the producer is able to compensate the value of electricity consumed with the value of the electricity produced in different periods, thus reducing the producer’s electricity bill. Therefore, there is no direct remuneration for (excess) electricity fed into the grid but an exchange of the value of electricity consumed and produced.
5. Tenders to establish the level of support: In the Netherlands, the main support instrument used is a feed-in premium. The design of the support system has an innovative component: Every year, a certain budget is defined for supporting renewables. This budget is allocated to generators in tender rounds. The maximum support level is increased over the rounds. However, if the full budget is spent in the first round, the later tender rounds are not realized. Thus, generators are incentivised to bid into the market at low costs. However, this kind of renewable support aims mainly at stimulating more mature technologies. More expensive, innovative technologies are hardly incentivised in this scheme.
6. In Austria, a big number of renewable installations are on the waiting list due to previous budget ceilings. The government now offers these installations to accept a cheaper tariff instead of remaining on the waiting list. This might be an innovative solution for countries in a similar situation.

12
6. Improving market and grid integration of renewables with feed-in systems
One of the potential disadvantages of fixed feed-in tariffs is the fact that the transmission system operators (TSOs) are responsible for integrating the renewable electricity into the market. Without special arrangements with the TSO, renewable production under this support scheme does not react to demand fluctuations or electricity spot market prices. Therefore, especially with an increasing share of renewable production, other support mechanisms that make renewable producers responsible for electricity sale, gain interest. Among the feed-in systems, the feed-in premium where the generator receives a premium in addition to the income from regular electricity markets is one possible way to improve the response of RES-E producers to market signals and allow a higher demand orientation of renewable electricity generation. Depending on the detailed design of the premium option the risk for the RES-E producers may be larger and over- and undercompensation may occur, but there are design options to reduce these negative effects (see below). Generally speaking, the feed-in premium design options are rather innovative instruments that aim to combine the major advantages of feed-in systems with a higher demand orientation and market compatibility of RES generation.
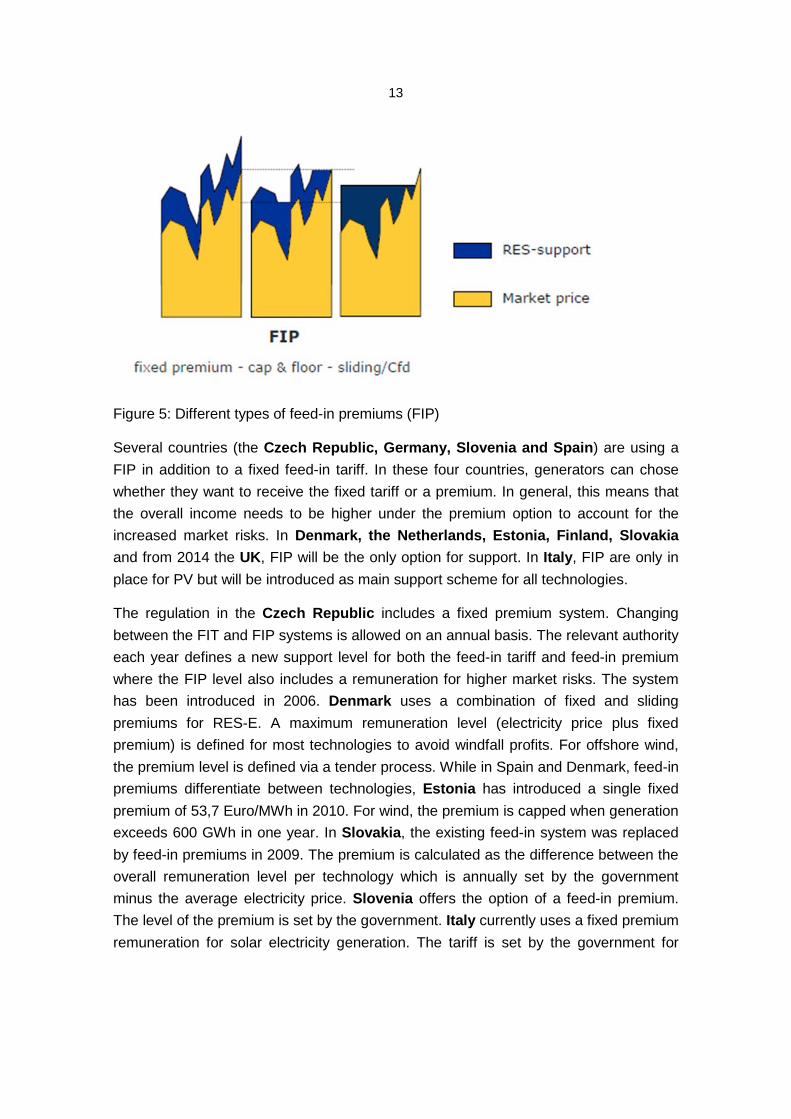
In general, three main types of feed-in premiums exist (see Figure 5): In the case of a fixed premium, the premium does not depend on the average electricity price in the power market. Thus, the revenue risk when compared to FIT is increased as the renewable generators bear all price risks from the electricity market. Furthermore, from the perspective of providing an optimal support level, over- and undercompensation may occur. A feed-in premium with cap and floor prices reduces revenue risks and surpluses as only a certain income range is allowed for under this model. In case of the sliding premium or contract for difference (CfD), where the premium is a function of the average electricity price, the revenue risk does not necessarily increase.
13
Figure 5: Different types of feed-in premiums (FIP)
Several countries (the Czech Republic, Germany, Slovenia and Spain) are using a FIP in addition to a fixed feed-in tariff. In these four countries, generators can chose whether they want to receive the fixed tariff or a premium. In general, this means that the overall income needs to be higher under the premium option to account for the increased market risks. In Denmark, the Netherlands, Estonia, Finland, Slovakia and from 2014 the UK, FIP will be the only option for support. In Italy, FIP are only in place for PV but will be introduced as main support scheme for all technologies.
The regulation in the Czech Republic includes a fixed premium system. Changing between the FIT and FIP systems is allowed on an annual basis. The relevant authority each year defines a new support level for both the feed-in tariff and feed-in premium where the FIP level also includes a remuneration for higher market risks. The system has been introduced in 2006. Denmark uses a combination of fixed and sliding premiums for RES-E. A maximum remuneration level (electricity price plus fixed premium) is defined for most technologies to avoid windfall profits. For offshore wind, the premium level is defined via a tender process. While in Spain and Denmark, feed-in premiums differentiate between technologies, Estonia has introduced a single fixed premium of 53,7 Euro/MWh in 2010. For wind, the premium is capped when generation exceeds 600 GWh in one year. In Slovakia, the existing feed-in system was replaced by feed-in premiums in 2009. The premium is calculated as the difference between the overall remuneration level per technology which is annually set by the government minus the average electricity price. Slovenia offers the option of a feed-in premium. The level of the premium is set by the government. Italy currently uses a fixed premium remuneration for solar electricity generation. The tariff is set by the government for
14
each year and depends on size and technology of the solar unit. The future support scheme will combine tenders and FIP for larger installations of all technologies.
Spain uses voluntary FIP with a cap-and-floor system. The premium is calculated based on the hourly average electricity price using the cap and floor. Generators can chose annually between the fixed and premium system. More than 90% of wind generators have opted for FIP- support.
In Finland, the premium is calculated based on a pre-defined target price per technology minus the market price average over a three month period. The target price for wind power is 83.50 €/MWh, for biogas electricity 133.5 €/MWh. The FIP is available for wind, woodchips, woodfuels and biogas power plants. 30 Euros/MWh are taken as a minimum market price thus the regulation includes a downward risk for generators.
The sliding premium used in the Netherlands is determined based on tenders. The first tender round each year allows bids of all technologies up to a total remuneration level of 9c/kWh (with a maximum for waste incinerators of 6.2 c/kWh). The maximum bid value increases with each round with specific restrictions for each technology. However, as the annual budget is capped, the second to fifth round are not necessarily realised. The Dutch system aims primarily at the cost-efficient achievement of 2020 targets and less at inducing technological learning.
In Germany, the calculation is based on the difference between the Feed-in Tariff and the average monthly electricity price. The electricity price is corrected by a technology specific profile factor to account for the fact that some renewable technologies (such as wind) earn an on average lower income than the average producer at the electricity market while others such as solar earn more due to their different feed-in characteristics and influence on electricity prices. A management premium is paid in addition to compensate for marketing costs and balancing risks. Generators can chose between FIT and FIP on a monthly basis. By 2014, the market premium scheme will become obligatory for operators of biogas plants of capacities greater than 750 kW who can also benefit from an additional flexibility premium if they agree to produce electricity when needed. The FIP option opens the possibility to participate in the balancing market.
The UK plans to introduce a feed-in premium system with contracts for difference in 2014. This system will replace the renewable obligation in 2017. Until then, new plants can chose between both options.
15
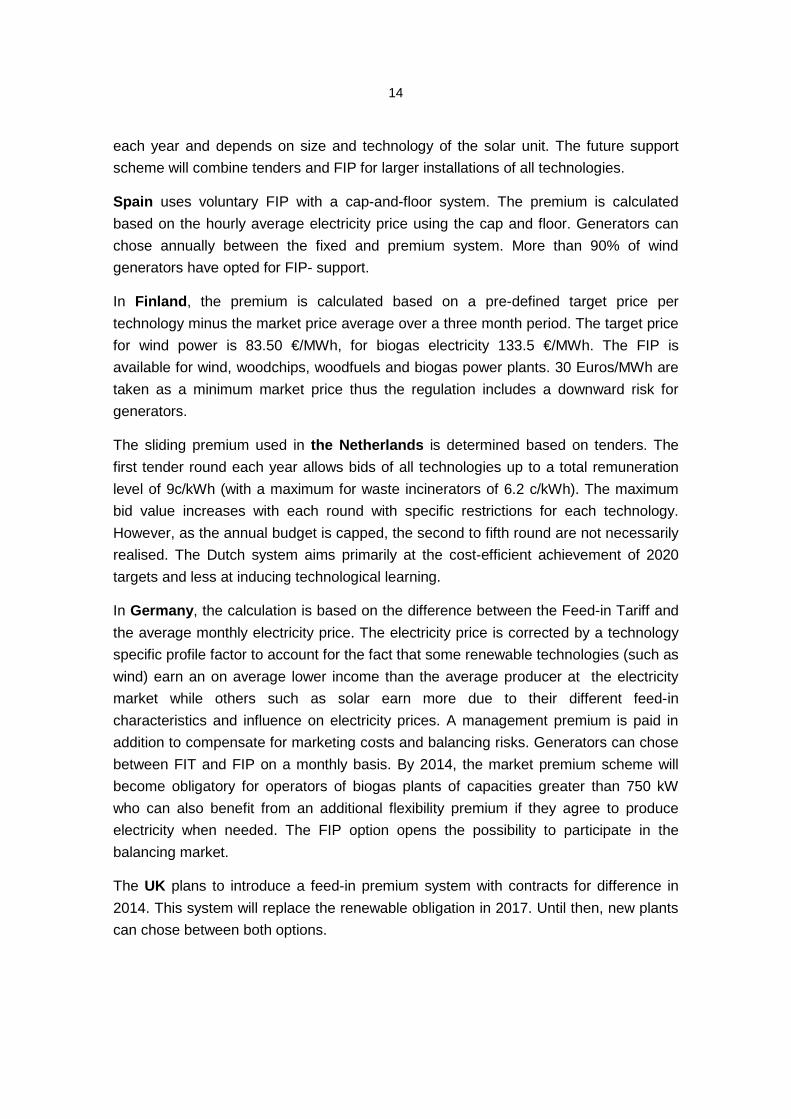
Table 1 shows an overview of the different feed-in premium systems. While there is a European trend towards this type of support instrument, it can be observed that considerable differences exist between the countries regarding options, total remuneration levels, calculation methods and objectives of the schemes. Therefore, it remains to be seen over the next years which systems prove to be most effective and efficient regarding the support of renewables. However, many of the best practice design elements for fixed feed-in tariffs will also be relevant for FIP systems. Country Type Since Choice
FIT/FIP Total remuneration wind onshore 2012
Support dura-tion (years)
Definition of support level
Technology specific
Relevant electricity price
CZ Fixed 2006 Yearly 73 €/MWh + electricity price
20 Govern-ment
Yes Actual
DK Fixed 2009 No 36.6 €/MWh + electricity price; maximum for utility companies 57.4 €/MWh
10-20 Govern-ment, tender offshore
Yes Actual
EE Fixed 2010 No 53.7 €/MWh + electricity price
Govern-ment
No Actual
FI Sliding 2011 No 83.50 €/MWh Govern-ment
Yes Three month average
DE Sliding 2012 Monthly 101.3 €/MWh (in the first 5-20 years, depending on yield; after that 48.7 base tariff; available bonus: 4.8-9.8)
20 Govern-ment
Yes Monthly average
IT Fixed 2007 No n/a 20 Govern-ment
Yes Actual
NL Sliding 2009 No 90-96 €/MWh 12-15 Tender Partially Annual average
SK Fixed 2009 No 80.91 €/MWh (2011)
15 Govern-ment
Yes ?
SL Fixed 2009 41.05 – 52.88 €/MWh + electricity price
15 Govern-ment
Yes ?
ES Cap-and-floor
2007 Yearly 76.975 – 91.737 €/MWh
25 Govern-ment
Yes Hourly average
UK CfD Sliding
2014 Choice FIP/RO until 2017
n/a 20? Govern-ment
Yes Tbd
Table 1: Comparison of European FIP systems
Steadily increasing shares of renewable energies in electricity generation also lead to the need to take these energy sources into account when managing the grid. Due to the large share of wind energy, Denmark and Germany have been pioneers in this area. In Germany, onshore wind turbines built between 01.01.2009 and 01.01.2014
16
have to fulfil certain technical standards in the field of reactive and real power in order to be connected to the grid and receive the feed-in tariff. Their feed-in tariff increases by 0.5 €ct/kWh, this extra bonus is called “Systemdienstleistungs-Bonus” (system service bonus). In addition, the revised act also introduces an incentive for older turbines to be retrofitted on a voluntary basis. If turbines built between 2002 and 2008 are upgraded to fulfil the technical standards for new turbines until the end of 2010, they receive an extra bonus on top of their feed-in tariff of 0.7 €ct/kWh for five years.
7. Summary & Outlook
The use of feed-in tariffs is increasing in the EU as policy instrument to support renewable energies as sources for electricity production. After only nine EU Member states having started with a feed-in system in 2000, today 20 countries are applying feed-in schemes as main RES supporting instrument and four more countries as a supplementary instrument for selected technologies and plant sizes.
Feed-in systems have been proven to be flexible on the adjustment to market developments. It is therefore important that they are designed smartly to support renewables in a cost efficient way. Among others, this can be achieved by implementing stepped tariff design, a regular degression of tariffs, the combination with tendering approaches for large plants or the introduction of growth corridors for more expensive technologies. Feed-in premiums might be helpful to improve the market integration of renewables. Their development needs to be monitored closely in order to identify best practices.
EU Directive 2009/28/EC enables the cooperation between different member stated to achieve their national binding renewable energy targets. As the first international market for renewables certificated between Sweden and Norway has already started operation in January 2012, it will be interesting to develop possibilities to internationalize feed-in systems without neglecting the national benefits inherent to the development of renewables such as local value creation.
However, support systems alone cannot guarantee a strong and successful development of renewable electricity production. Challenges still lie in the alleviation of administrative barriers and the electricity grid expansion to integrate an increasing share of renewable electricity.