recent k-12 studies - virginia senate finance...
TRANSCRIPT
Senate Finance Committee
Recent K-12 Studies
October 22, 2015
JLARC
In this presentation
Summary of recent JLARC K-12 work
Summary of research on cost-effective instruction
Online learning
Spending and funding
Spending impact
2
JLARC
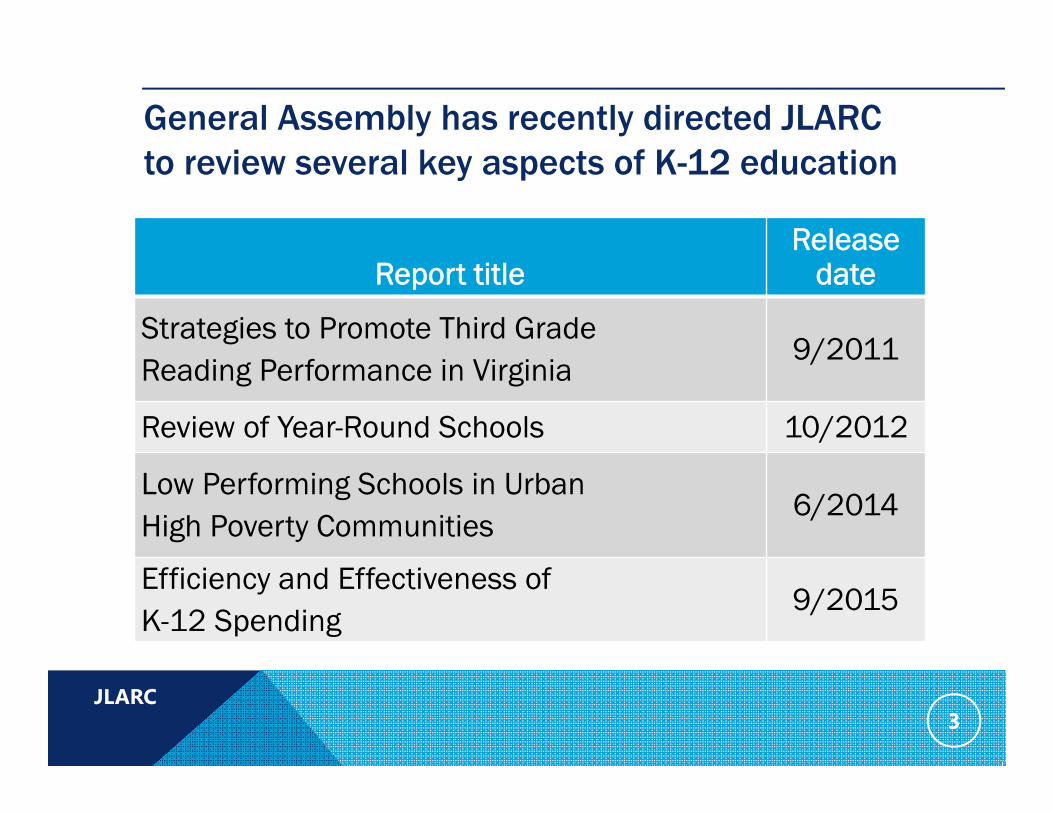
General Assembly has recently directed JLARC to review several key aspects of K-12 education
3
Report titleRelease
date
Strategies to Promote Third GradeReading Performance in Virginia
9/2011
Review of Year-Round Schools 10/2012
Low Performing Schools in UrbanHigh Poverty Communities
6/2014
Efficiency and Effectiveness ofK-12 Spending
9/2015
JLARC
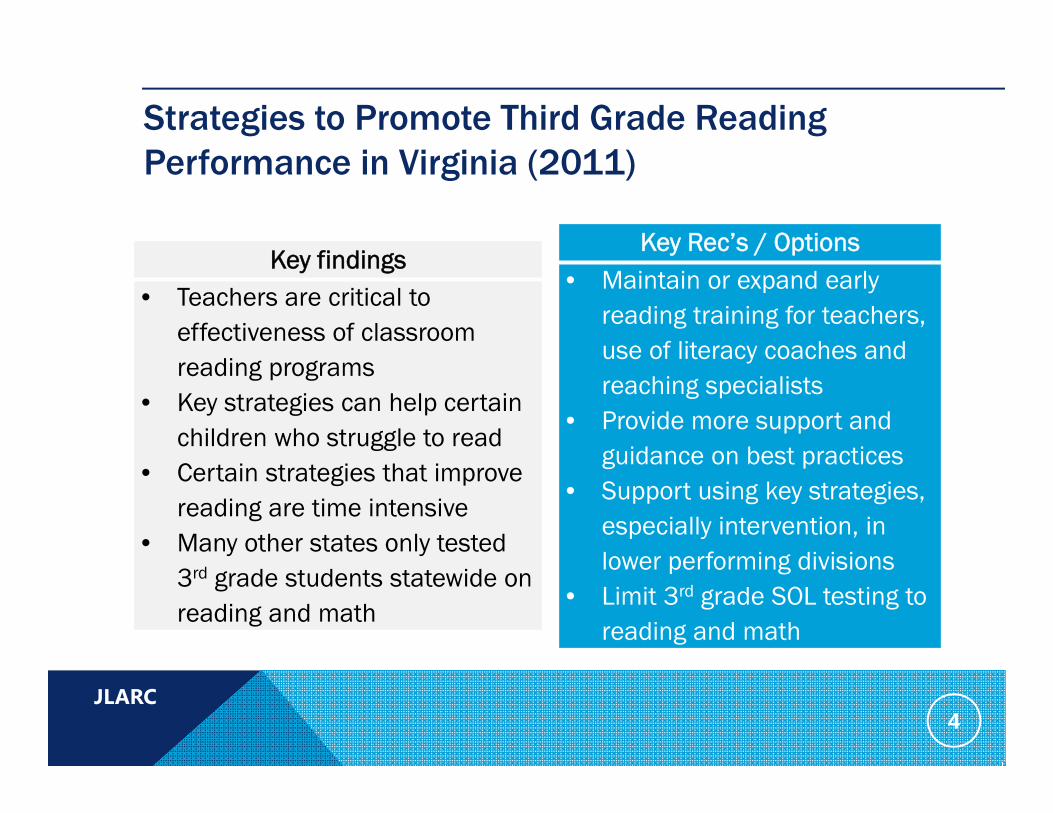
Strategies to Promote Third Grade Reading Performance in Virginia (2011)
4
Key findings• Teachers are critical to
effectiveness of classroom reading programs
• Key strategies can help certain children who struggle to read
• Certain strategies that improve reading are time intensive
• Many other states only tested 3rd grade students statewide on reading and math
Key Rec’s / Options• Maintain or expand early
reading training for teachers,use of literacy coaches and reaching specialists
• Provide more support and guidance on best practices
• Support using key strategies, especially intervention, in lower performing divisions
• Limit 3rd grade SOL testing to reading and math

JLARC
Review of Year-Round Schools (2012)
5
Key findings• Year round schools do not necessarily
improve the test scores of the generalstudent population
• Test scores of certain students (esp. black and LEP students) do seem to improve due to the (1) shorter summer breaks and (2) opportunities for remediation during intersession
• Year round schools tended to cost about 3% more than traditional schools
• Effective principals and teachers and use of recommended instructional practices still matter, regardless of school calendar
Key OptionCertain Virginia divisions--especially those with high percentages of black or LEP students--may want to consider year-round schools as a way to improve performance
JLARC
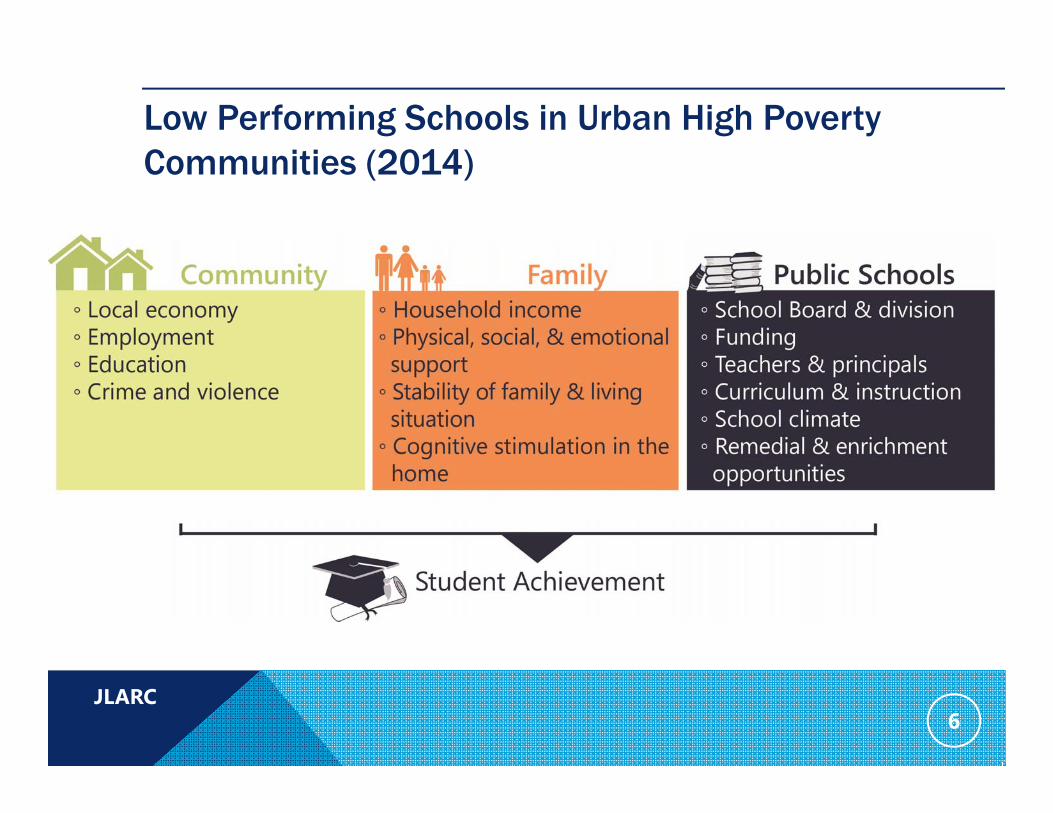
Low Performing Schools in Urban High Poverty Communities (2014)
6
JLARC
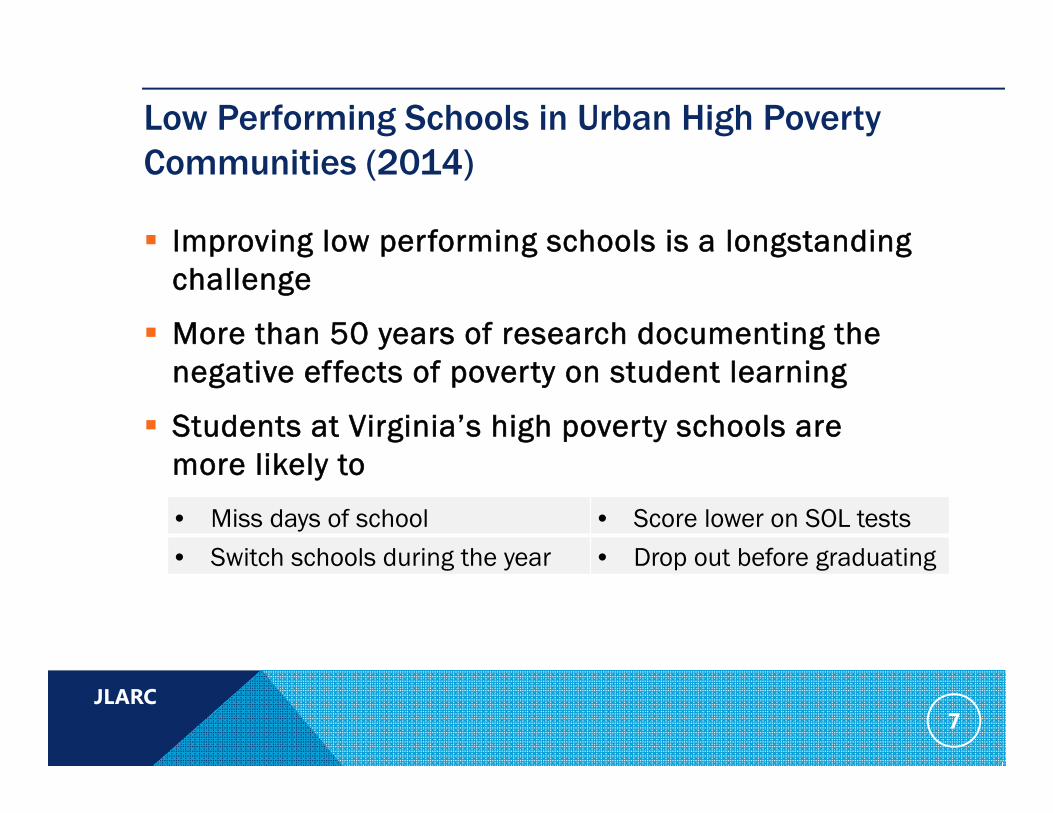
Low Performing Schools in Urban High Poverty Communities (2014)
7
Improving low performing schools is a longstanding challenge
More than 50 years of research documenting the negative effects of poverty on student learning
Students at Virginia’s high poverty schools are more likely to
• Miss days of school • Score lower on SOL tests
• Switch schools during the year • Drop out before graduating
JLARC
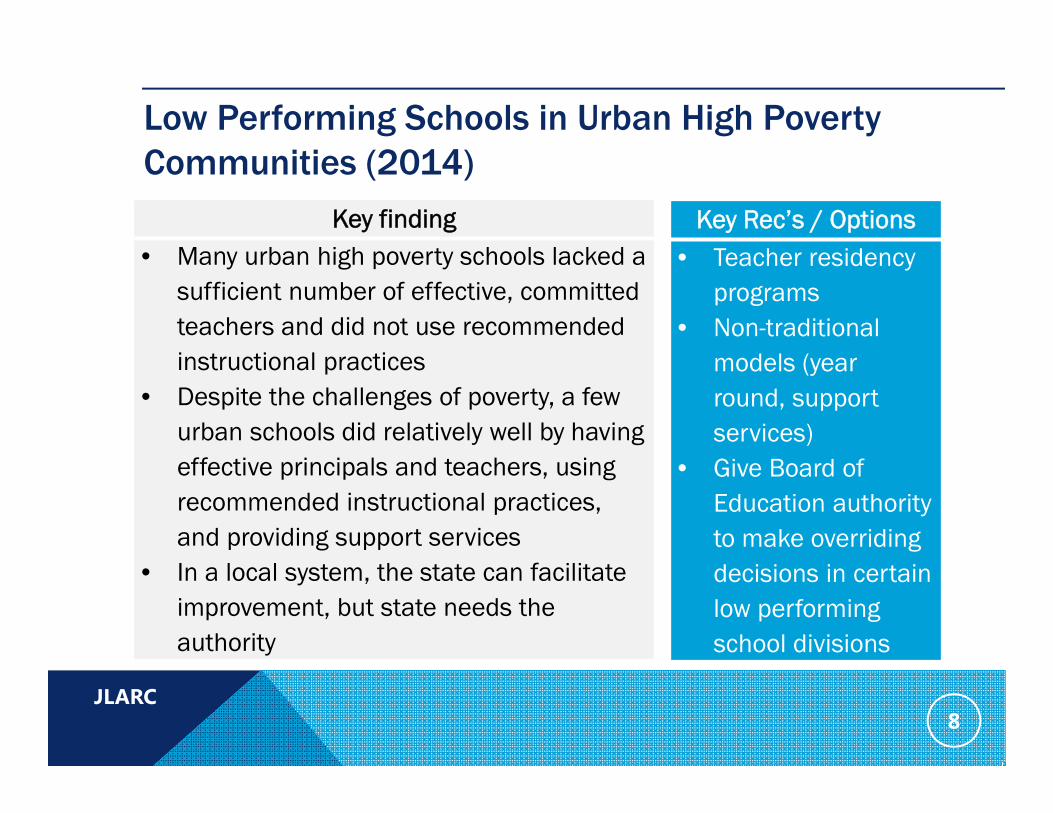
Low Performing Schools in Urban High Poverty Communities (2014)
8
Key finding• Many urban high poverty schools lacked a
sufficient number of effective, committed teachers and did not use recommended instructional practices
• Despite the challenges of poverty, a few urban schools did relatively well by having effective principals and teachers, using recommended instructional practices, and providing support services
• In a local system, the state can facilitate improvement, but state needs the authority
Key Rec’s / Options• Teacher residency
programs• Non-traditional
models (year round, support services)
• Give Board of Education authority to make overriding decisions in certain low performing school divisions
JLARC
In this presentation
Summary of recent JLARC K-12 work
Summary of research on cost-effective instruction
Online learning
Spending and funding
Spending impact
9
JLARC
JLARC reviewed about 200 research studies as part of its Sept. 2015 study of K-12 spending
Most published within the last 5 years
High quality only
Broad review: all strategies to increase achievement
10
JLARC
Key takeaways from review of research
The quality of teaching is the most important factor within schools
Increasing the achievement of low-performing students is cost effective
11
JLARC
Research finds that good teachers change lives
Replacing the bottom 5 percent of teachers with an average teacher would increase students’ lifetime earnings by $250,000 per classroom.
Increase college attendance, other benefits to society
12
Source: Chetty 2014
JLARC
Research finds that teachers can improve over time
Teaching quality = instructional practice, classroom management, emotional support
Most teachers improve over time, but effective teachers can be identified early
One-on-one assessment and coaching, more intensive for the newest teachers
13
JLARC
Research shows ways to identify and retain the most effective teachers
Identifying quality teachers: principals’ assessments, test scores, and student surveys
Reducing teacher turnover
Financial incentives to reduce turnover
14
JLARC
Research shows benefit of increasing achievement of low-performing students
Low-performing students have more room to grow larger impact on overall student achievement
Student level and schoolwide approaches
Improve the quality of teaching for low-performing students
Financial incentives to teach low-performing students
15
JLARC
In this presentation
Summary of recent JLARC K-12 work
Summary of research on cost-effective instruction
Online learning
Spending and funding
Spending impact
16
JLARC
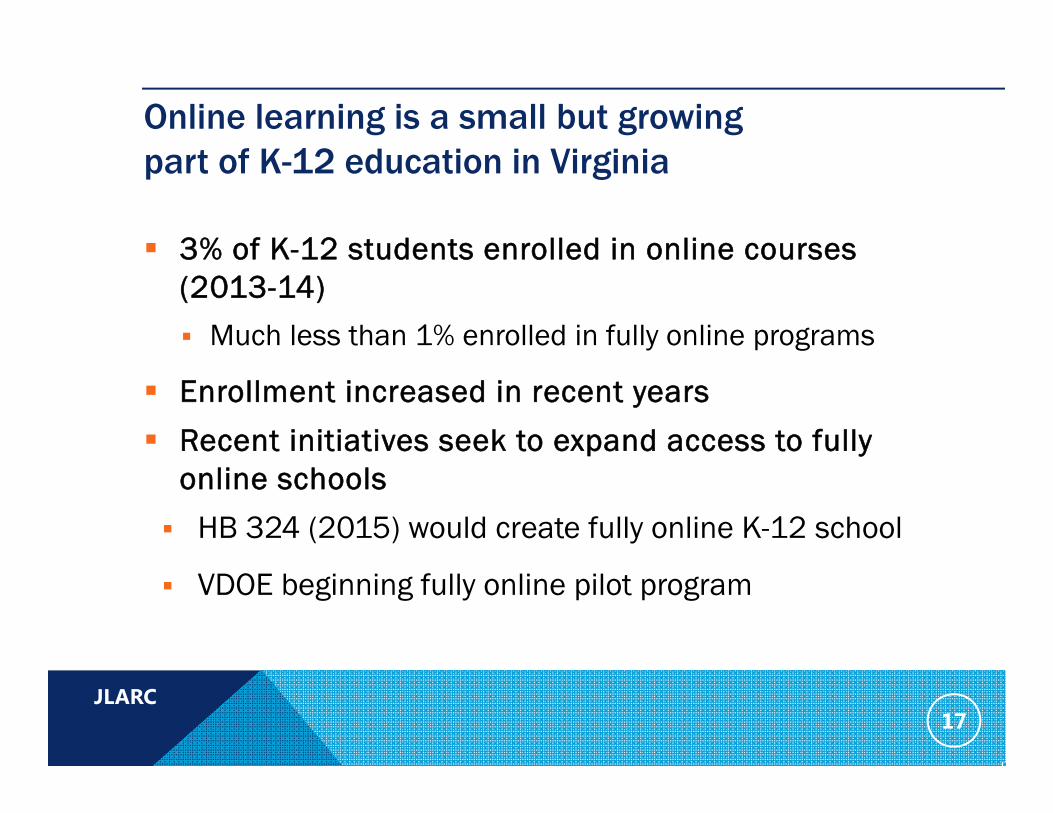
Online learning is a small but growing part of K-12 education in Virginia
3% of K-12 students enrolled in online courses (2013-14)
Much less than 1% enrolled in fully online programs
Enrollment increased in recent years
Recent initiatives seek to expand access to fully online schools
HB 324 (2015) would create fully online K-12 school
VDOE beginning fully online pilot program
17
JLARC
Online learning increases educational opportunity, but effectiveness varies
Broader array of educational options available
Enables students to take broader set of courses
Most feasible or beneficial option for certain students
Most effective for students with strong motivation and time management
Other students may need additional support
18
JLARC
Online learning programs cost less than physical schools
Most states:
fully online schools funded at 2/3 of physical schools
Online industry:
fully online schools should be funded slightly less than physical schools
Cost of online programs varies
Educational services
Enrollment
Instructional staffing and compensation levels
19
JLARC
Minimal information about cost and effectiveness of online learning in Virginia
No accurate method for estimating cost of fully online schools
Cost to the state will depend on educational services provided
No reliable information comparing achievement in online and physical schools
20
JLARC
State should take incremental approach to fully online schools
Incremental approach allows state to determine whether fully online learning is sound policy
State should use incremental approach to
Assess student achievement
determine cost to online providers of operating fully online schools
better understand services needed to support online students
21
JLARC
Recommendations
VDOE should
develop a methodology for estimating the cost of fully online schools
annually compare the achievement of students in Virtual Virginia with students in physical schools
22
JLARC
In this presentation
Summary of recent JLARC K-12 work
Summary of research on cost-effective instruction
Online learning
Spending and funding trends and rankings
Spending impact
23
JLARC
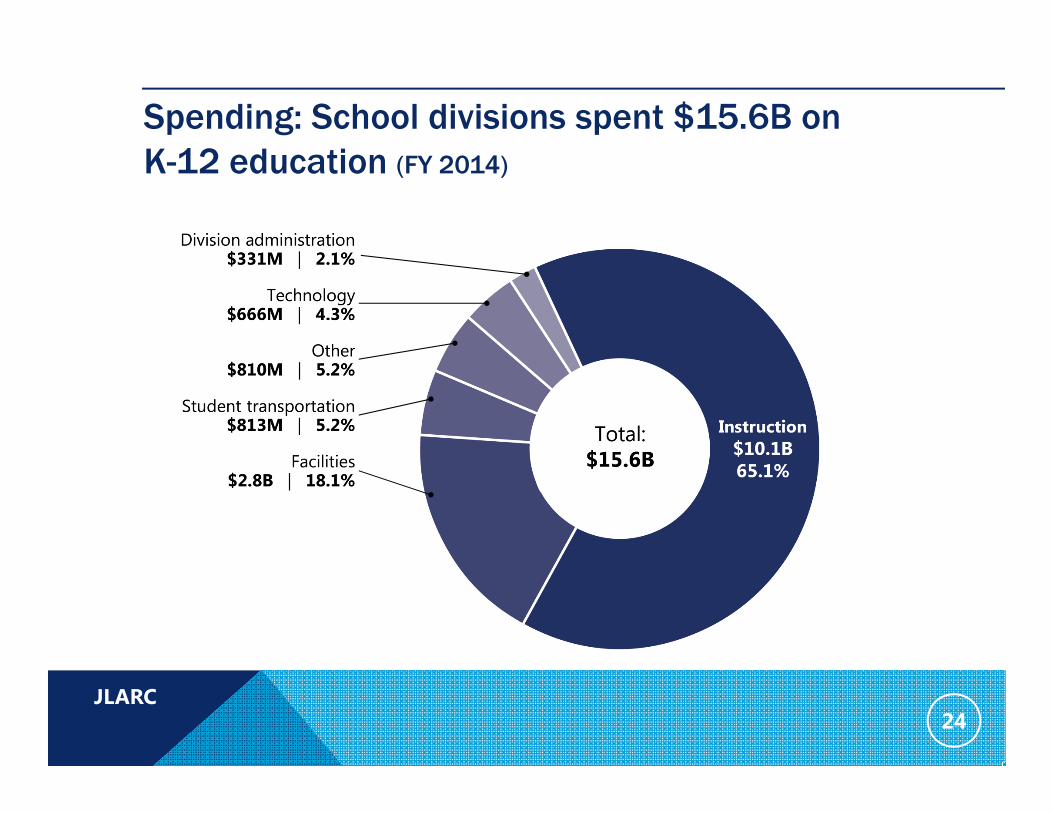
Spending: School divisions spent $15.6B onK-12 education (FY 2014)
24
JLARC
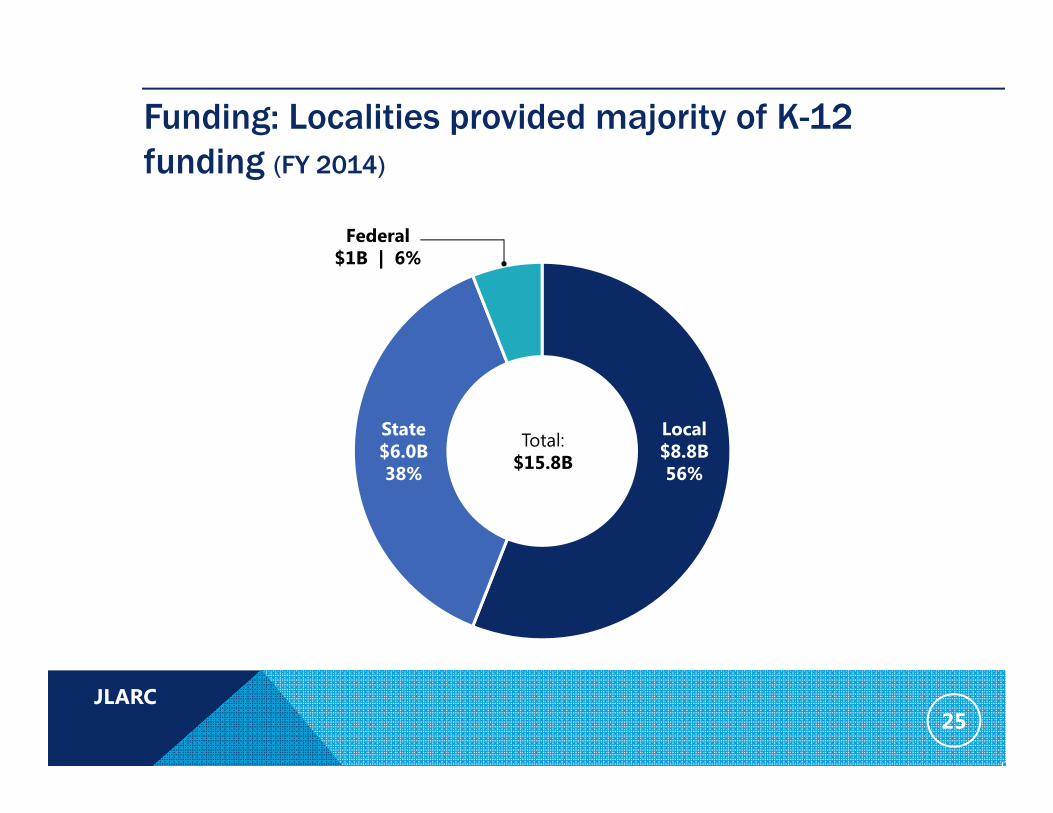
Funding: Localities provided majority of K-12 funding (FY 2014)
Federal$1B | 6%
State$6.0B38%
Local$8.8B56%
Total:$15.8B
25

JLARC
Funding: State and local funding declined for many school divisions (FY 2005–FY 2014)
State funding per student declined an average of 13%
State funding declined for 116 divisions
Local funding per student declined an average of 5%
Local funding declined for 79 divisions
26
JLARC
Spending & funding: Virginia’s national rankings (FY 2013)
27
Total spending = 23rd
% funding from state = 39th
% funding from localities =11th
JLARC
Spending: Total spending per student declined (FY 2005–FY 2014)
Divisions spent 7% less per student, adjusted for inflation (FY 2005–FY 2014)
Health insurance spending increased 66%
Health spending increased from $665M to $1.1B
28
JLARC
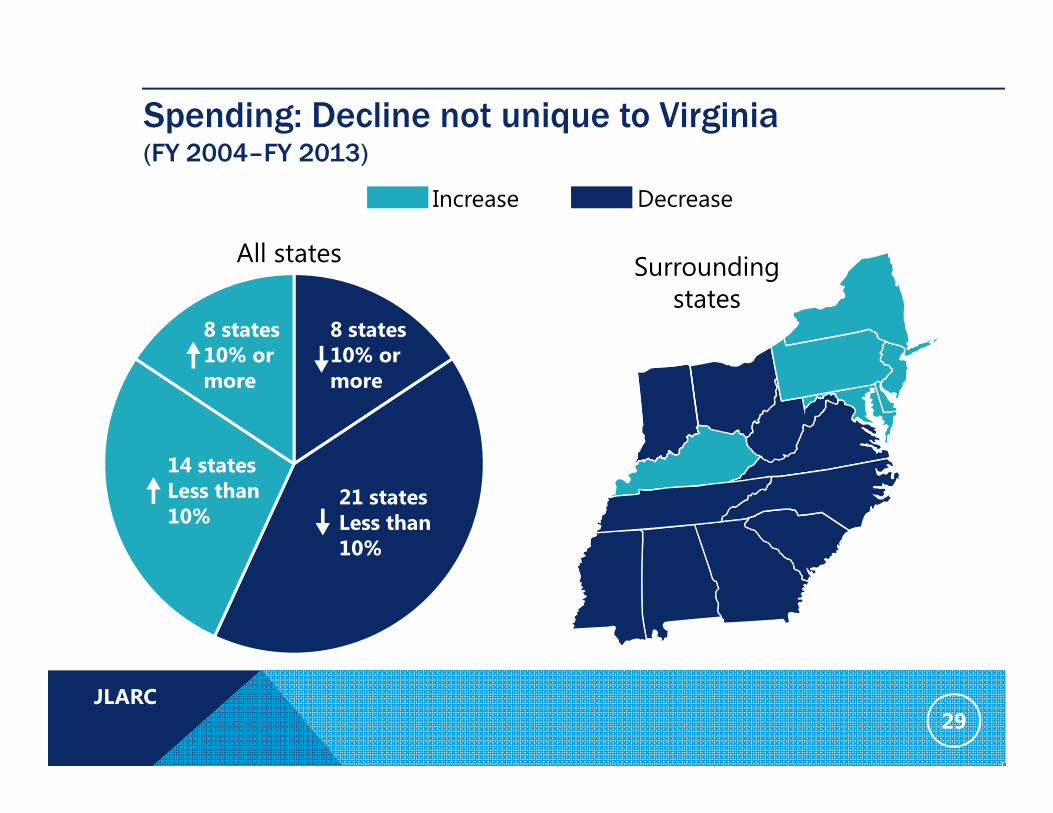
Spending: Decline not unique to Virginia(FY 2004–FY 2013)
8 states 10% or more
21 states Less than 10%
8 states 10% or more
14 states Less than 10%
Increase Decrease
29
All states Surrounding
states
JLARC
Spending: Likely increased in FY 2015 and will likely increase again in FY 2016
General Assembly recently increased K-12 funding
FY 2015 = $204 million
FY 2016 = $293 million
FY 2015 spending data available later this Fall
30
JLARC
In this presentation
Summary of recent JLARC K-12 work
Summary of research on cost-effective instruction
Online learning
Spending and funding trends and rankings
Spending impact
31
JLARC
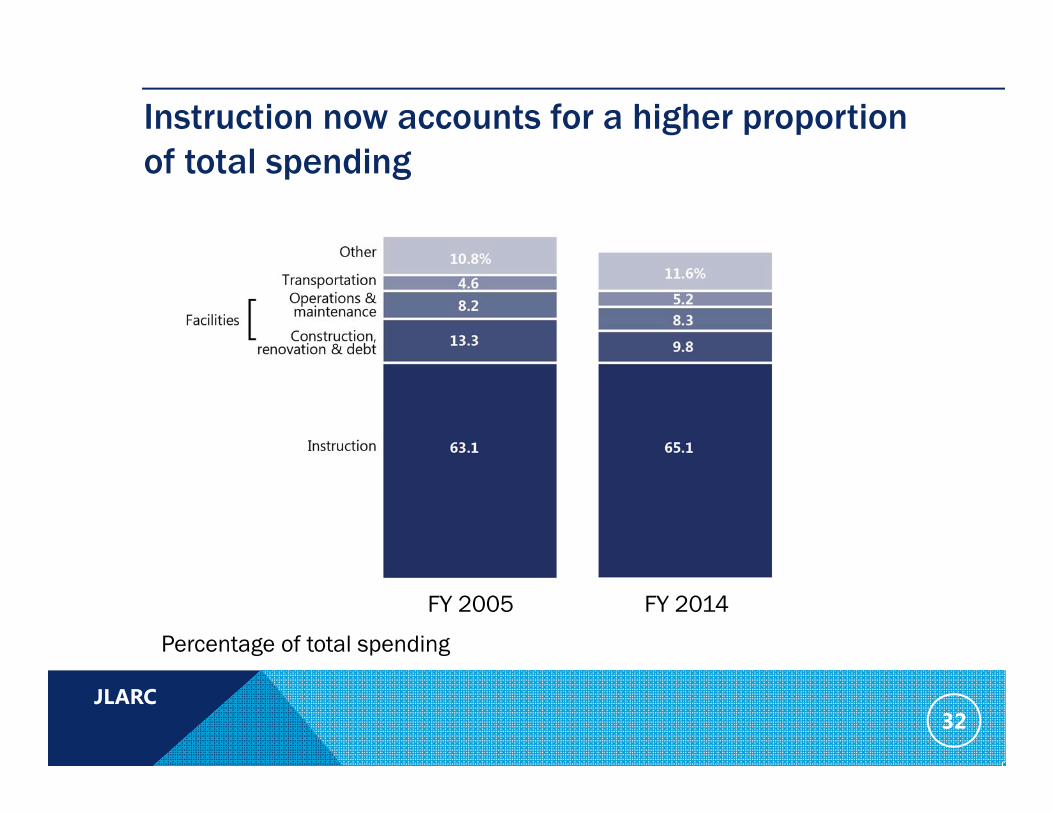
Instruction now accounts for a higher proportion of total spending
32
FY 2005
Percentage of total spending
FY 2014
JLARC
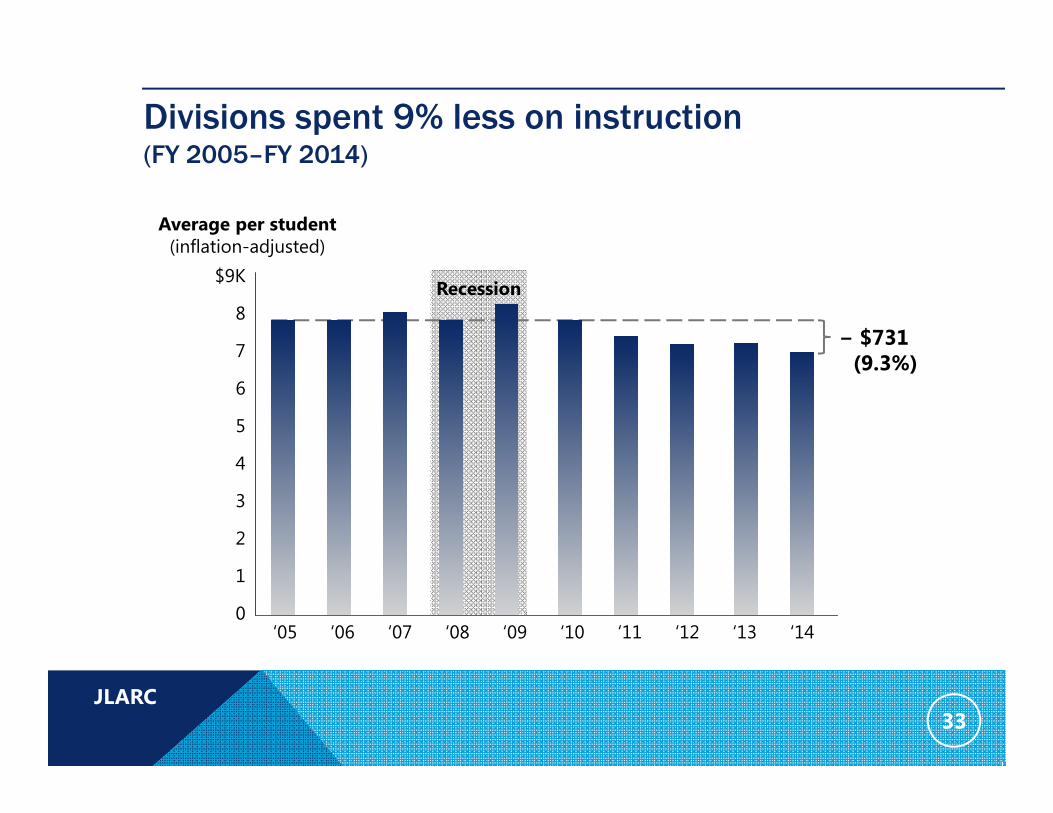
Divisions spent 9% less on instruction (FY 2005–FY 2014)
‘05 ‘06 ‘07 ‘08 ‘09 ‘10 ‘11 ‘12 ‘13 ‘14
$9K
8
7
6
5
4
3
2
1
0
Average per student (inflation-adjusted)
− $731 (9.3%)
Recession
33

JLARC
Divisions used several approaches to reduce instructional spending per student
Employing fewer teachers per student
Limiting salary growth
Requiring teachers to pay a higher percentage of benefit costs
34
JLARC
Divisions report reduced spending hindered instructional effectiveness
Divisions report more difficulty providing quality instruction with larger class sizes
Rising percentage of students with limited English proficiency and living in poverty
Lower salary increases and reduced benefits may have hindered teacher recruitment and retention
Reduced instructional support may be hindering instructional effectiveness
35
JLARC
RecommendationThe General Assembly may wish to consider amending the Code of Virginia to require the Superintendent of Public Instruction to track teacher turnover.
36
OptionThe General Assembly could appropriate funds to VDOE for additional state staff to provide teacher support to school divisions in most need of assistance.
JLARC
Divisions spent less on facilities and about the same on transportation (FY 2005–FY 2014)
Divisions spent
7.9% less to operate and maintain facilities
31% less to renovate and construct facilities
Transportation spending stayed the same despite rising fuel costs
Fuel prices increased 92%
37
JLARC
Divisions reported some approaches used hindered efficiency and effectiveness
75% of divisions deferred non-emergency facilities maintenance
Divisions report increased costs, more system failures, and inadequate technology infrastructure
Nearly 80% of divisions deferred bus purchases
Divisions report increased costs and lower reliability
No measurable impact on safety yet
38
JLARC
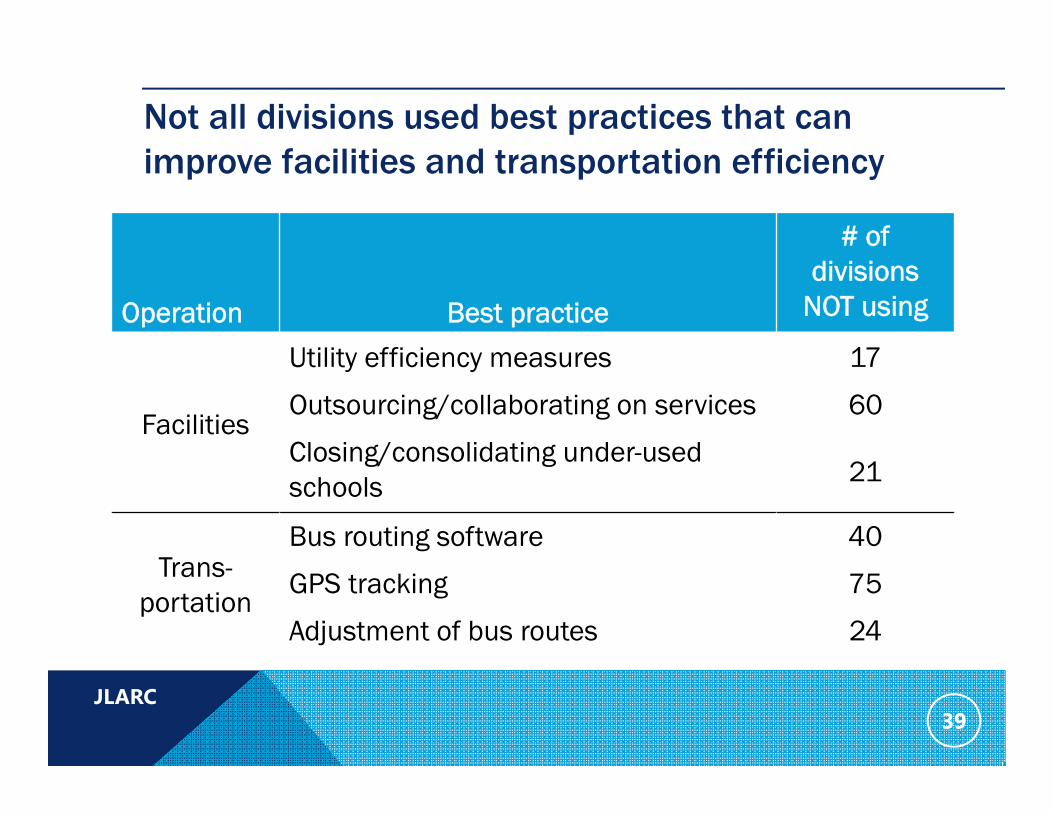
Not all divisions used best practices that can improve facilities and transportation efficiency
Operation Best practice
# of divisions
NOT using
Facilities
Utility efficiency measures 17
Outsourcing/collaborating on services 60
Closing/consolidating under-used schools 21
39
Trans-portation
Bus routing software 40
GPS tracking 75
Adjustment of bus routes 24

JLARC
Recommendations
VDOE should provide facilities management and transportation management expertise to school divisions. Expertise should include guidance and information about best practices.
The General Assembly may wish to consider appropriating funds for VDOE to employ up to three facilities staff, and up to three transportation staff, to provide expertise.
40

JLARCJLARC http://jlarc.virginia.gov/(804) 786-1258
JLARC staff
Justin Brown, Associate Director
Jamie Bitz, Chief Legislative Analyst
Dr. Erik Beecroft, Chief Methodologist
Kimberly Sarte, Assistant Director for Ongoing Oversight and Fiscal Analysis
41