recent seismicity detection increase in the santorini...
TRANSCRIPT
Nat Hazards Earth Syst Sci 12 859ndash866 2012wwwnat-hazards-earth-syst-scinet128592012doi105194nhess-12-859-2012copy Author(s) 2012 CC Attribution 30 License
Natural Hazardsand Earth
System Sciences
Recent seismicity detection increase in the Santorini volcanicisland complex
G Chouliaras G Drakatos K Makropoulos and N S Melis
Institute of Geodynamics National Observatory of Athens PO Box 20048 Athens 11810 Greece
Correspondence toG Chouliaras (gchoulnoagr)
Received 18 January 2012 ndash Revised 14 March 2012 ndash Accepted 16 March 2012 ndash Published 2 April 2012
Abstract Santorini is the most active volcanic complex inthe South Aegean Volcanic Arc To improve the seismolog-ical network detectability of the seismicity in this regionthe Institute of Geodynamics of the National Observatoryof Athens (NOA) recently installed 4 portable seismologicalstations supplementary to the 3 permanent stations operatingin the region The addition of these stations has significantlyimproved the detectability and reporting of the local seismicactivity in the NOA instrumental seismicity catalogue
In this study we analyze quantitatively the seismicity ofthe Santorini volcanic complex The results indicate a re-cent significant reporting increase mainly for events of smallmagnitude and an increase in the seismicity rate by more than100 The mapping of the statistical significance of the ratechange with the z-value method reveals that the rate increaseexists primarily in the active fault zone perpendicular to theextensional tectonic stress regime that characterizes this re-gion
The spatial distribution of the b-value around the volcaniccomplex indicates a low b-value distribution parallel to theextensional stress field while the b-value cross section of thevolcanic complex indicates relatively high b-values under thecaldera and a significant b-value decrease with depth
These results are found to be in general agreement with theresults from other volcanic regions and they encourage fur-ther investigations concerning the seismic and volcanic haz-ard and risk estimates for the Santorini volcanic complex us-ing the NOA earthquake catalogue
1 Introduction
The Santorini volcanic island complex in the Greek volcanicarc is comprised of five islands known as Thera TherasiaAspronisi Palea Kameni and Nea Kameni (Fig 1) Theseislands constitute a compound volcano caldera formed in1640 BC (Fytikas et al 1984) Since the formation of the
caldera thirteen eruptions are known to have occurred in197 BC 19 AD 46 726 1457 1508 1573 1650 17071866 1925 1939 and 1950 The historical seismicity recordof Santorini includes 3 strong main shocks in 1650 withM = 60 1866 withM = 61 and 1919 withM = 60 (Pa-pazachos and Papazachou 2003)
In order to improve the detection of the local seismic-ity in Santorini the Institute of Geodynamics of the Na-tional Observatory of Athens (NOA) in cooperation with theGeophysical Laboratories of the University of Athens andThessaloniki installed a network of 8 telemetric seismologi-cal stations in 1994 The seismological data from this net-work identified two clusters of epicenters one in the Ka-meni caldera and one in the Columbo submarine volcano tothe northeast (Panagiotopoulos et al 1996) An increase inthe seismic activity was observed in 1995 and this activityreached a maximum on 27 May 1996 with a swarm of shockswith magnitudesM = 38minus42 Stavrakakis et al (1996) de-termined the source spectra of the strongest shocks in thissequence and the seismic source parameters indicate a con-stant source radius irrespective of the source energy Thisresult is consistent with similar results from other volcanicareas due to the volcanic processes
The first permanent seismological station on Santorini wasinstalled by NOA in 1997 and in 2010 and 2011 two per-manent seismological stations were also installed on thenearby volcanic island of Milos (httpbbnetgeinnoagrNOA HLindexphpreal-time-plottinghl-network) In addi-tion to the permanent seismological stations NOA installeda portable seismological network comprising of four broad-band stations on Santorini in June 2011 This portable net-work transmits in real time waveform data that are incor-porated in the everyday analysis and the earthquake cat-alogue of NOA thus significantly increasing the reportingof small seismic events (httpbbnetgeinnoagrNOAHLindexphpreal-time-plottingsantorini-network)
Published by Copernicus Publications on behalf of the European Geosciences Union
860 G Chouliaras et al Recent seismicity detection increase in the Santorini volcanic island complex
Fig 1 Tectonic map of the Santorini volcanic island complex iscomprised of five islands known as Thera Therasia AspronisiPalea Kameni Nea Kameni and the Kameni and Columbo faultlines (after Heiken and McCoy 1984)
Earthquake catalogues are not simple lists but rathercomplex data sets containing both natural and man-madechanges During any period the seismologists responsi-ble for a seismic network may improve the ability to de-tect or to locate events more accurately by adding more sta-tions improving signal to noise conditions improving thesignal processing and the magnitude calculation and theymay also proceed to uninstall certain stations These man-made artifacts in earthquake catalogues are apparent changesin the seismicity rate and mask the true estimation of tec-tonic seismicity patterns and the seismic hazard and riskestimates (Habermann 1982 1987 1991 Habermann andCraig 1988 Zuninga and Wiemer 1999 Tormann et al2010) Habermann (1982) was first to introduce a quanti-tative technique for identifying man-made artifacts in cata-
Fig 2 Seismicity recorded in the Santorini region from 1966 tothe end of 2011 (14 December) from the earthquake catalog of theNational Observatory of Athens
logues with the magnitude signature method which provedto be a valuable discriminator between natural and artificialvariations in seismicity The method efficiency to identify de-tection changes reporting changes and systematic changes inmagnitudes has been tested for several earthquake catalogues(Habermann 1987 1991) More recent techniques for de-tecting artificial seismicity in earthquake catalogues use thespatial mapping of seismicity rate and frequency magnitudedistribution (Wiemer and Wyss 1994 Zuninga and Wyss1995 Zuninga and Wiemer 1999 Zuninga et al 2005)
In this publication the recent increase in the seismicity ofSantorini is analyzed using the NOA earthquake catalogueto evaluate whether the detection increase is due to natu-ral (earthquake preparation) or due to artificial (man-made)causes
2 Data analysis and results
In this study we investigate quantitatively the seismicity cat-alogue of NOA (httpwwwgeinnoagrservicescathtml) forthe Santorini region using the ZMAPIASPEI software pack-age in order to present reproducible results (Wiemer 2001)
The seismicity map of the region surrounding the volcaniccomplex (Fig 2) reveals two separate clusters of seismicevents one in the caldera and one just to the north with aNE-SW epicentral distribution at the Kameni and Columbofaults respectively This data set contains 911 events from1966 until the end of 2011 with a magnitude rangeML (lo-cal) = 1ndash5 and hypocentral depths from 1 to 167 km
The blue curve in Fig 3 shows the time evolution of the cu-mulative seismicity for this region A power law increase inthe reported seismicity is observed in general with the NOAseismicity catalogue due to the expansion of the seismologi-cal network and the improvement in detecting seismic events
Nat Hazards Earth Syst Sci 12 859ndash866 2012 wwwnat-hazards-earth-syst-scinet128592012
G Chouliaras et al Recent seismicity detection increase in the Santorini volcanic island complex 861
Fig 3 Cumulative seismicity curves of the Santorini region as afunction of time Clustered (blue curve) vs Declustered (red curve)
in recent years (Chouliaras 2009) The sudden increasesin the seismicity for the Santorini region are due to the oc-currence of seismicity swarms and also due to the seismicsequence of the largest recent earthquake on 26 June 2009with a magnitudeML = 5 to the NE of Thera island alongthe Columbo fault line
In order to study seismicity rates one must separate de-pendant events such as swarms and aftershocks from theindependent events For this reason we apply Reasen-bergrsquos (1985) declustering algorithm to the NOA earthquakecatalogue for the Santorini region in order to determine thedeclustered cumulative curve (marked in red) in Fig 3 Thiscurve contains 532 events and appears much smoother thusindicating that the earthquake clusters have been removed ef-fectively
It is apparent from the clustered catalog cumulative curvein Fig 3 that more than 30 of the events were detected inthe period after the year 2010 and this rate change is investi-gated with the method of Zuninga and Wiemer (1999) Theseismicity rate of the declustered catalogue for a backgroundperiod from 2005 until 2010 is compared to the rate for therecent period from 2010 until the end of 2011 (14 Decem-ber 2011) in Fig 4a and b By comparing the cumulative andthe noncumulative frequency-magnitude distribution curves(normalized by the duration of the time periods) we deter-mine a rate increase of more than 100 for the recent periodand this increase is noticed mainly for events withML lt 3The magnitude shift between the two periods for magnitudeswith ML lt 3 (Fig 4b) may be due to the improvements inNOA magnitude reporting procedures as of February 2011
(a)
(b)
(c)
Fig 4 Comparison of the rates as a function of magnitude for thetwo periods which are printed at the top The numbers are normal-ized by the duration of the periods(a) Frequency-magnitude curve(b) Non-cumulative numbers of events as a function of magnitude(c) Magnitude signature
Since the rate increase for the recent period is found tobe magnitude-dependant the magnitude signature method(Habermann 1987) is employed in order to analyze the re-sults in the magnitude domain Magnitude signatures deter-mine the significance of the rate change between two timeperiods as a function of magnitude In order to determine thedifference between the means of each period the most gen-eral of the parametric statistical tests is applied to the datanamely the z-test The two rates are compared using the for-mula Eq (1) that defines the normal deviate z as
Z = (M1minusM2)((S12N1)+(S22N2))12 (1)
wwwnat-hazards-earth-syst-scinet128592012 Nat Hazards Earth Syst Sci 12 859ndash866 2012
862 G Chouliaras et al Recent seismicity detection increase in the Santorini volcanic island complex
Fig 5 Z-value map showing the rate changes after the recent pe-riod of detection increase (note that negative z-values by definitionindicate seismicity rate increases)
Fig 6 The maximum of the derivative of the frequency magnitudedistribution of the declustered catalogue is used to determine themagnitude of completeness (green curve) and the b-value is deter-mined by the weighted least squares method (red curve)
whereM1 M2 are the mean rates during the two periodsS1 S2 the respective statistical deviations andN1 N2 therespective number of samples The resulting z-value is in-terpreted in terms of significance as the number of stan-dard deviations from the mean of a standard distribution
Fig 7 The temporal variation of theMc in NOA seismicity cata-logue for Santorini
(ie z = 164 is 90 significancez = 196 is 95 signifi-cancez = 257 is 99 significance)
Figure 4c shows the magnitude signature for the two pe-riods of investigation The z-value in the vertical axis haspositive values in the upper part of the plot thus indicatinga rate decrease whereas the opposite holds for the lower partof the plot with negative values indicating a rate increaseThe horizontal axis indicates the magnitude band for whichthe calculation is made Magnitude bands on the left side in-clude events with magnitudes less than those shown on theaxis and magnitude bands on the right side include eventswith magnitudes greater than those shown on the axis
There are different characteristic magnitude signatures foreach type of seismicity rate change Detection changes re-porting changes and magnitude shifts have different and dis-tinct characteristic appearances on a magnitude signature andfor this reason our result in Fig 4c is compared with actualand theoretical magnitude signatures This comparison indi-cates that the Santorini magnitude signature is in good agree-ment with the magnitude signatures determined from peri-ods of detection increases due to the additional installationof seismological network stations (see Figs 2 3 in Haber-mann 1987) Characteristic for this increase are the nega-tive z-values for smaller events on the left side of the plotand less significant change (smaller z-values) for the largerevents on the right side of the plot Another interesting resultin Fig 4c is the occurrence of z-values of opposite signs onthe opposite sides of the magnitude signature indicative ofa magnitude shift for events of small magnitudes (M lt 35)(see Figs 11 16 17 in Habermann 1987)
In order to investigate the spatial dependence of the ratechange shown in Figs 4andashc we mapped the z-value for theSantorini region using the gridding technique of Wiemer andWyss (2002) in Fig 5 A significant rate increase (negativez-values) is observed over Kameni and Thera islands andthis increase is elongated in a NE-SW direction from theColumbo fault almost perpendicular to the NNWndashSSE ex-tensional stress regime of the region The pattern resembles
Nat Hazards Earth Syst Sci 12 859ndash866 2012 wwwnat-hazards-earth-syst-scinet128592012
G Chouliaras et al Recent seismicity detection increase in the Santorini volcanic island complex 863
a Coulomb stress pattern and this agrees with the results ofmore detailed studies that show that the pattern of increasedor decreased seismicity accordingly follows the advancementor retardation of faulting by the Coulomb fracture criteria(Stein et al 1992 Wyss and Wiemer 2000)
The inverse relationship between the b-value and the stressregime has been validated by laboratory tests on rock speci-mens (Mogi 1962 Scholz 1968) as well as by quantitativestudies of earthquake catalogues from different regions of theworld with different stress regimes (Smith 1981 Hauksson1990 Frohlich and Davis 1993 Wiemer and Wyss 1997Kagan 2002 Schorlemmer et al 2004 Schorlemmer andWiemer 2005a b) In volcanic regions a characteristic highb-value has been reported and this is attributed to the phe-nomenon of creep in the magma chamber due to the migra-tion of fluid or magma (Wyss et al 1997 2001 Wiemer etal 1998)
Assuming that earthquake magnitudes obey theGutenberg-Richter law (Gutenberg and Richter 1944)we determined magnitude of completeness (Mc) and theb-value (b) for the declustered seismicity catalogue of San-torini by the use of the weighted least squares (WLS) fittingmethod and the FMD curve as shown in Fig 6 (Wiemer2001) The magnitude of completeness (Mc) is defined asthe lowest magnitude at which all earthquakes in a spacendash time volume are reliably detected by a seismologicalnetwork (Rydelek and Sacks 1989 Taylor et al 1990Wiemer and Wyss 2000 Woessner and Wiemer 2005)Mc is an important parameter for statistical investigationsin seismology and it is traditionally determined from themaximum point of the derivative of the FMD (marked ingreen) curve in Fig 6 (Wiemer 2001) This procedureyields a value ofMc = 34 andb = 147 for the declusteredearthquake catalogue of the Santorini region
Changes in the detection and reporting of a seismologi-cal network may cause theMc and the b-value to vary soit is important to study the temporal dependence ofMc forthe Santorini area before and after the observed rate increaseshown in Fig 4 To determine theMc as a function of timefor the NOA declustered catalogue we employed the methodof Wiemer (2001) and in Fig 7 we observeed aMc variationfrom 34 to 36 until the year 1994
In 1994 the NOA seismological network of 18 ana-log short period stations was complemented with 9 ad-ditional permanent digital short period stations and after1997 the analog seismological network began to be up-graded with new installations of digital broadband stationsPresently the NOA Hellenic Broadband Seismological Net-work (NOA HL) consists of 56 stations that provide realtime waveform and parametric data (httpbbnetgeinnoagrNOA HLindexphpreal-time-plototinghl-network) Theseismological network station increase was complementedwith improvements in the analysis software and in the report-ing procedures as of February 2011 and this has resulted in asignificant improvement in the detection of seismic events in
Fig 8 b-value map showing the spatial variation in the Santoriniisland volcanic complex from 1966 till 2012 calculated from thedeclustered seismicity catalogue of NOA
Greece This improvement may be seen in Fig 7 in whichwe observe a decrease in theMc to a value ofMc = 3 beforethe year 2010 and after that a very sharp decrease toMc = 2towards the end of 2011
The b-value exhibits heterogeneities in time and spacedepending on the stress patterns and in this way it acts asa stress meter (Schorlemmer and Wiemer 2005b) For theSantorini volcanic complex we mapped the spatial distribu-tion of the b-value using the declustered NOA catalogue withMc gt 35 from 1966 to the end of 2011 and the gridding tech-nique of Wiemer and Wyss (2002) In Fig 8 we note a b-value variation from 085 to 135 and a zone of low b-values(appearing in blue) that trends NNWndashSSE crossing the vol-canic islands and separating the two zones of higher b-values(appearing in red) to the East and to the West This alignmentof the low b-value zone is found to follow the NNWndashSSE ex-tensional stress field orientation for this region (Fytikas et al1990 Vougioukalakis et al 1995 Mountrakis et al 1996)
Concerning the Santorini region an increase in the re-ported events in the NOA seismicity catalogue occurred af-ter the installation of two permanent seismological stationson the nearby island of Milos in 2010 and 2011 and alsoafter the installation of the portable network of four broadband seismological stations in June 2011 The significantdetection improvement results in a change of theMc and thischange will result in a different b-value distribution map forthis region for the recent period
To investigate the recent b-value distribution we used theNOA catalogue to determine the spatial dependence of theb-value in the cross section of the main seismic activity inFig 9a The cross section of the main seismic activity con-tains 160 events withMc gt2 between 2010 and the end of
wwwnat-hazards-earth-syst-scinet128592012 Nat Hazards Earth Syst Sci 12 859ndash866 2012
864 G Chouliaras et al Recent seismicity detection increase in the Santorini volcanic island complex
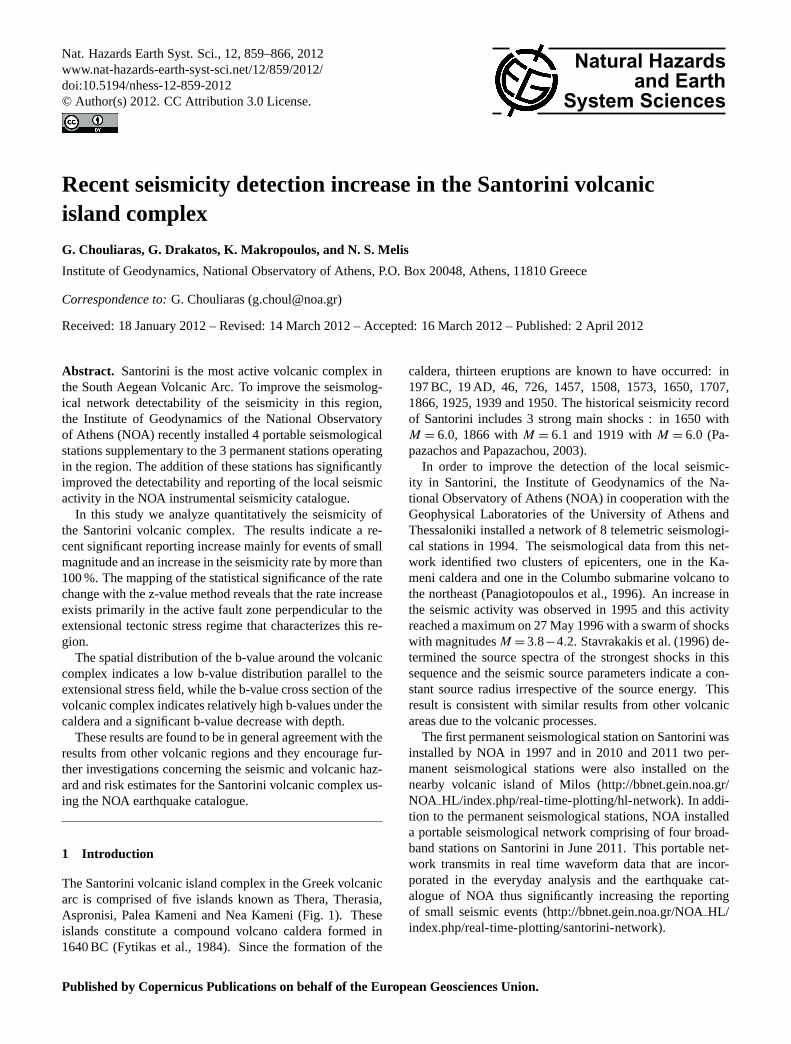
Fig 9 b-value cross section showing the spatial variation after thedetection increases in 2010 and 2011 along a NE-SW profile acrossthe volcanic complex
2011 in a NNEndashSSW distribution parallel to the faulting ori-entation and perpendicular to the extensional stress field Wefound the main clusters of seismic activity in the Kameni andColumbo active faults while on either side away from thevolcanic complex we observed a more diffused seismicitypattern
Figure 9b shows the b-value cross section to a 40 km depthrange and this reveals a significant lateral and vertical het-erogeneity around and beneath the volcanic complex withb-values ranging from 07 to 13 Relatively higher b-values(09ndash13) are observed under the volcanic complex to a 15 kmdepth and lower b-values (07ndash09) are observed laterally oneither side The high b-values near the surface show a de-crease with depth in an inverted cone distribution This b-value distribution is generally in agreement with results fromother volcanic areas (Mt St Hellens Mt Spurr TokohukuKilauea) that report higher b-values (up tob = 2) near thesurface due to the low ambient stress and the highly frac-
tured environment around the magma chamber The decreaseof the b-value with depth is mainly due to the increases instress pore pressure and the thermal gradient (Wiemer andMcNutt 1997 Wiemer and Wyss 1997 Wyss et al 2001)
3 Discussion and conclusions
In this study we used the NOA seismicity catalogue to quan-tify valuable parameters such as the magnitude of complete-ness and the b-value from the frequency-magnitude relationas well as the recent seismicity rate change (z-value) for theSantorini volcanic complex
Many studies have reported anomalies in the seismicityrate during earthquake and volcanic preparation processesTo reveal possible spatial and temporal rate anomalies onemust first carefully analyze the employed earthquake cata-logue and identify any possible artificiality due to man-madechanges This artificiality exists in all catalogues and it de-pends on the increases or decreases in the detection result-ing from the installation or removal of seismic stations aswell as to possible changes in the operative procedures andreporting of the seismological network operator which maychange with time
As part of the detection improvements of the NOA seis-mological network in the vicinity of the Santorini volcanicisland complex a local network of 4 portable broad bandseismic stations was installed in June 2011 to supplement thefirst permanent station that was installed on Thera island in1997 In 2010 and 2011 two other permanent stations werealso installed on the nearby volcanic island of Milos and asa result the detectability and reporting of the local seismicityin the NOA seismicity catalogue improved significantly
The NOA seismicity catalogue contains more than900 events for the region surrounding the Santorini islandsfrom 1966 till the end of 2011 and more than 30 of theseevents were detected after the installation of additional seis-mological stations in 2010 and 2011
Quantitative analysis of the normalized cumulative andnoncumulative FMD curves for the period before and af-ter the new seismological station installations reveals a seis-micity rate increase of more than 100 for the investi-gated region This increase concerns mainly small magnitude(M lt 3) earthquakes and is also confirmed by the negative z-value determined by the magnitude signature method
The significance of the rate change is mapped using the z-value method and we found the rate increase to mainly existin the Kameni and Columbo faults in a NNEndashSSW directionparallel to the active faults and perpendicular to the NNWndashSSE extensional stress direction
The frequency-magnitude distribution of the NOA seis-micity catalogue for the region surrounding the volcaniccomplex determined bulk values forMc = 34 and b =
147 for the entire declustered catalogue Improvements inthe NOA seismic network detectability by the increase of
Nat Hazards Earth Syst Sci 12 859ndash866 2012 wwwnat-hazards-earth-syst-scinet128592012
G Chouliaras et al Recent seismicity detection increase in the Santorini volcanic island complex 865
local seismic stations and the improved magnitude reportingcaused theMc and the b-value to vary with time from a valueof Mc = 35 in 1966 toMc asymp 2 at the end of 2011
Using the declustered catalogue data from 1966 till theend of 2011 we determined a b-value map that indicates alow b-value zone across the volcanic complex in a NNWndashSSE direction parallel to the dominant extensional stressand higher b-values on either side
The recent seismological data after the additional stationinstallations in 2010 and 2011 have significantly lowerMc(gt2) and 160 of these events were used to determine a b-value cross section along the direction of the principal seis-mic activity of the region (NNEndashSSW) The b-value crosssection across the volcanic complex indicates prominent ver-tical and lateral heterogeneities The distribution pattern ofb-values map the Santorini volcanic complex with relativelyhigh b-values in the top fifteen kilometers and decreasing b-values with depth and lateral distance (on either side of thecomplex)
The recent b-value distribution on Santorini is in quali-tative agreement with reported b-value maps determined inother volcanic regions in which mapping of the magmachamber was attempted for earthquake hazard and risk es-timation and eruption forecasting Nevertheless differentpatterns of high b-values exist for different volcanic areasmainly due to the different magmatic composition and styleof eruption
The forecasting of volcanic eruptions has a distinct ad-vantage to the forecasting of earthquakes In volcanoes themagma moves upwards from a depth and this movement canbe detected with many different methods (ie seismicitygeodesy electromagnetism chemistry of fumaroles gasesgases in soils conductivity)
A combination of many methods might eventually leadto a better understanding of the preparatory process of vol-canic activity In a recent review paper De Lauro etal (2011) stated that the Independent Component Analy-sis (ICA) method of deconvolution of seismic waveformsand the Natural Time Analysis method of analyzing seis-mic activity (Varotsos et al 2011) have success in themonitoring and forecasting of volcanic processes in Strom-boli (Italy) Erebus (Antarctica) Volcan de Colima (Mexico)and Izu (Japan)
In this study we investigated the seismicity of the San-torini volcanic island complex using the earthquake cata-logue of NOA in order to contribute to the mosaic of a vol-canic and seismic hazard estimates for Santorini The lim-ited and diffused seismicity of the region does not allow for amore detailed temporal and spatial investigation at this pointHowever it is apparent that the detectability and reporting ofthe NOA seismological network in the Santorini region haverecently improved and the seismological data will prove tobe valuable for future research studies
AcknowledgementsThe authors would like to thank the tworeviewers for their constructive comments and the editorial staff fortheir assistance in the editing processes
Edited by M E ContadakisReviewed by A P V Kouskouna and another anonymous referee
References
Chouliaras G Investigating the earthquake catalog of the NationalObservatory of Athens Nat Hazards Earth Syst Sci 9 905ndash912doi105194nhess-9-905-2009 2009
De Lauro E De Martino S Falanga M and Palo M Self-sustained vibrations in volcanic areas extracted by IndependentComponent Analysis a review and new results Nonlin Pro-cesses Geophys 18 925ndash940doi105194npg-18-925-20112011
Frohlich C and Davis S C Teleseismic b values or much adoabout 10 J Geophys Res 98 631ndash644 1993
Fytikas M Innocenti F Manetti P Mazzuoli R Peccerillo Aand Villari L Tertiary to Quaternary evolution of volcanism inthe Aegean region Geol Soc London Spec Publ 17 687ndash6991984
Fytikas M Kolios N and Vougioukalakis G Post-Minoan Vol-canic Activity of the Santorini Volcano Volcanic hazard andrisk forecasting possibilities In Thera and the Aegean WorldIII Vol 2 The Thera Foundation London 183ndash198 1990
Gutenberg B and Richter C F Frequency of earthquakes in Cal-ifornia B Seismol Soc Am 34 185ndash188 1944
Habermann R E Consistency of teleseismic reporting since 1963B Seism Soc Am 72 93ndash112 1982
Habermann R E Man-made changes of seismicity rates BSeism Soc Am 77 141ndash159 1987
Habermann R E and Craig M S Comparison of Berkeley andCALNET magnitude estimates as a means of evaluating temporalconsistency of magnitudes in California B Seismol Soc Am78 1255ndash1267 1988
Habermann R E Seismicity rate variations and systematic changesin magnitudes in teleseismic catalogues Tectonophysics 193277ndash289 1991
Hauksson E Earthquakes faulting and stress in theLos Angeles basin J Geophys Res 95 15365ndash15394doi101029JB095iB10p15365 1990
Heiken G and McCoy F Caldera development during the Mi-noan eruption Thera Cyclades Greece J Geophys Res 89B-108441-8462 1984
Heiken G and McCoy F Precursory activity to the Minoan Erup-tion Thera Greece In Thera and the Aegean World III 2 TheThera Foundation London 79ndash88 1990
Kagan Y Y Seismic moment distribution revisited I Statisticalresults Geophys J Int 148 520ndash541 2002
Mogi K Magnitudendashfrequency relations for elastic shocks accom-panying fractures of various materials and some related problemsin earthquakes Bull Earthquake Res Inst Univ Tokyo 40 831ndash853 1962
Mountrakis D M Pavlides S B Chatzipetros A MeletlidisS Tranos M D Vougioukalakis G and Kilias A A Ac-tive deformation of Santorini Proceedings of 2nd Workshop on
wwwnat-hazards-earth-syst-scinet128592012 Nat Hazards Earth Syst Sci 12 859ndash866 2012
866 G Chouliaras et al Recent seismicity detection increase in the Santorini volcanic island complex
European Laboratory Volcanoes Santorini Greece 13ndash22 2ndash4 May 1996
Papazachos B C and Papazachou C B The Earthquakes ofGreece edited by Ziti Thessaloniki 2003 (in Greek)
Panagiotopoulos D G Stavrakakis G Makropoulos K Pa-panastasiou D Papazachos C Savvaidis A and KaragianniD Seismic monitoring at the Santorini Volcano Proceedingsof 2nd Workshop on European Laboratory Volcanoes SantoriniGreece 311ndash324 2ndash4 May 1996
Reasenberg P A Second-order moment of Central CaliforniaSeismicity 1969ndash1982 J Geophys Res 90 5479ndash5495 1985
Rydelek P A and Sacks I S Testing the completeness of earth-quake catalogs and the hypothesis of self-similarity Nature 337251ndash253 1989
Scholz C H The frequencyndashmagnitude relation of microfractur-ing in rock and its relation to earthquakes B Seismol Soc Am58 399ndash415 1968
Schorlemmer D and Wiemer S Microseismicity data fore-cast rupture area Nature 434 1086doi1010384341086a28 April 2005a
Schorlemmer D and Wiemer S Variation of earthquake-size dis-tribution across different stress regimes Nature 437 539ndash542doi101038nature04094 22 September 2005b
Schorlemmer D Wiemer S and Wyss M Earthquake statisticsat Parkfield 1 Stationarity of b-values J Geophys Res 109B12307doi1010292004JB003234 2004
Smith W D The b-values as an earthquake precursor Nature 289136ndash139 1981
Taylor D A Snoke J A Sacks I S and Takanami T Nonlin-ear frequency magnitude relationship for the Hokkaido cornerJapan B Seism Soc Am 80 340ndash353 1990
Stavrakakis G Chouliaras G and Sachpazi M Recent seis-mic activity along the Hellenic Volcanic Arc Proceedings of2nd Workshop on European Laboratory Volcanoes SantoriniGreece 325ndash338 2ndash4 May 1996
Stein R S King G C P and Lin J Change in failure stress onthe southern San Andreas Fault caused by the 1992 magnitude74 Lander earthquake Science 258 1328ndash1332 1992
Tormann T Wiemer S and Hauksson E Changes of ReportingRates in the Southern California Earthquake Catalog Introducedby a New Definition of ML B Seismol Soc Am 100 1733ndash1742doi1017850120090124 2010
Varotsos P A Sarlis N V and Skordas E S NaturalTime Analysis The New View of Time Precursory Seis-mic Electric Signals Earthquakes and other Complex Time Se-ries Springer Praxis Books Springer-Verlag Berlin Heidel-berg httpwwwspringercomearth+sciences+and+geographynatural+hazardsbook978-3-642-16448-4 2011
Vougioukalakis G Francalanchi L Serana A and MitropoulosD The 1649ndash1650 Coloumbo submarine volcano activity San-torini Greece in The European Laboratory Volcanoes Work-shop Proceedings edited by Barberi F Casale R and FrattaM European Commission European Science Foundation Lux-emburg 189ndash192 1995
Wiemer S A software package to analyze seismicity ZMAPSeismol Res Lett 72 374ndash383 2001
Wiemer S and Wyss M Seismic quiescence before the Landers(M=75) and Big Bear (65) 1992 earthquakes B Seism SocAm 84 900ndash916 1994
Wiemer S and Wyss M Mapping the frequencyndashmagnitude dis-tribution in asperities An improved technique to calculate recur-rence times J Geophys Res 102 15115ndash15128 1997
Wiemer S and McNutt S Variation in the frequency-magnitudedistribution with depth in two volcanic areas Mount St He-lens Washington and Mt Spurr Alaska Geophys Res Lett24 189ndash192 1997
Wiemer S and Wyss M Minimum magnitude of completenessin earthquake catalogues examples from Alaska the westernUnited States and Japan B Seism Soc Am 90 859ndash869 2000
Wiemer S and Wyss M Mapping spatial variability of thefrequency-magnitude distribution of earthquakes Adv Geo-phys 45 259ndash302 2002
Wiemer S McNutt S R and Wyss M Temporal and three-dimensional spatial analysis of the frequency-magnitude distri-bution near Long Valley caldera California Geophys J Int134 409ndash421 1998
Woessner J and Wiemer S Assessing the quality of earth-quake catalogues estimating the magnitude of completenessand its uncertainty B Seismol Soc Am 95 684ndash698doi1017850120040007 2005
Wyss M Shimazaki K and Wiemer S Mapping active magmachambers by b-values beneath the Off-Ito Volcano Japan J Geo-phys Res 102 413ndash422 1997
Wyss M and Wiemer S Change in the Probability for earth-quakes in Southern California Due to the Landers Magnitude 73Earthquake Nature 290 1334ndash1338 2000
Wyss M Klein F Nagamine K and Wiemer S Anomalouslyhi b-values in the South Flank of Kilauea volcano Hawaii evi-dence for the distribution of magma below Kilauea East rift zoneJ Volcanol Geotherm Res 106 23ndash37 2001
Zuninga F R Reyners M and Villamor P Temporal variationsof the earthquake data in the catalogue of seismicity of NewZealand Bulletin of the New Zealand Society for EarthquakeEngineering 38 87ndash105 2005
Zuninga F R and Wiemer S Seismicity patterns are they alwaysrelated to natural causes Pure Appl Geophys 155 713ndash7261999
Zuninga F R and Wyss M Inadvertent changes in magnitude re-ported in earthquake catalogues influence on b-value estimatesB Seismol Soc Am 85 1858ndash1866 1995
Nat Hazards Earth Syst Sci 12 859ndash866 2012 wwwnat-hazards-earth-syst-scinet128592012

860 G Chouliaras et al Recent seismicity detection increase in the Santorini volcanic island complex
Fig 1 Tectonic map of the Santorini volcanic island complex iscomprised of five islands known as Thera Therasia AspronisiPalea Kameni Nea Kameni and the Kameni and Columbo faultlines (after Heiken and McCoy 1984)
Earthquake catalogues are not simple lists but rathercomplex data sets containing both natural and man-madechanges During any period the seismologists responsi-ble for a seismic network may improve the ability to de-tect or to locate events more accurately by adding more sta-tions improving signal to noise conditions improving thesignal processing and the magnitude calculation and theymay also proceed to uninstall certain stations These man-made artifacts in earthquake catalogues are apparent changesin the seismicity rate and mask the true estimation of tec-tonic seismicity patterns and the seismic hazard and riskestimates (Habermann 1982 1987 1991 Habermann andCraig 1988 Zuninga and Wiemer 1999 Tormann et al2010) Habermann (1982) was first to introduce a quanti-tative technique for identifying man-made artifacts in cata-
Fig 2 Seismicity recorded in the Santorini region from 1966 tothe end of 2011 (14 December) from the earthquake catalog of theNational Observatory of Athens
logues with the magnitude signature method which provedto be a valuable discriminator between natural and artificialvariations in seismicity The method efficiency to identify de-tection changes reporting changes and systematic changes inmagnitudes has been tested for several earthquake catalogues(Habermann 1987 1991) More recent techniques for de-tecting artificial seismicity in earthquake catalogues use thespatial mapping of seismicity rate and frequency magnitudedistribution (Wiemer and Wyss 1994 Zuninga and Wyss1995 Zuninga and Wiemer 1999 Zuninga et al 2005)
In this publication the recent increase in the seismicity ofSantorini is analyzed using the NOA earthquake catalogueto evaluate whether the detection increase is due to natu-ral (earthquake preparation) or due to artificial (man-made)causes
2 Data analysis and results
In this study we investigate quantitatively the seismicity cat-alogue of NOA (httpwwwgeinnoagrservicescathtml) forthe Santorini region using the ZMAPIASPEI software pack-age in order to present reproducible results (Wiemer 2001)
The seismicity map of the region surrounding the volcaniccomplex (Fig 2) reveals two separate clusters of seismicevents one in the caldera and one just to the north with aNE-SW epicentral distribution at the Kameni and Columbofaults respectively This data set contains 911 events from1966 until the end of 2011 with a magnitude rangeML (lo-cal) = 1ndash5 and hypocentral depths from 1 to 167 km
The blue curve in Fig 3 shows the time evolution of the cu-mulative seismicity for this region A power law increase inthe reported seismicity is observed in general with the NOAseismicity catalogue due to the expansion of the seismologi-cal network and the improvement in detecting seismic events
Nat Hazards Earth Syst Sci 12 859ndash866 2012 wwwnat-hazards-earth-syst-scinet128592012
G Chouliaras et al Recent seismicity detection increase in the Santorini volcanic island complex 861
Fig 3 Cumulative seismicity curves of the Santorini region as afunction of time Clustered (blue curve) vs Declustered (red curve)
in recent years (Chouliaras 2009) The sudden increasesin the seismicity for the Santorini region are due to the oc-currence of seismicity swarms and also due to the seismicsequence of the largest recent earthquake on 26 June 2009with a magnitudeML = 5 to the NE of Thera island alongthe Columbo fault line
In order to study seismicity rates one must separate de-pendant events such as swarms and aftershocks from theindependent events For this reason we apply Reasen-bergrsquos (1985) declustering algorithm to the NOA earthquakecatalogue for the Santorini region in order to determine thedeclustered cumulative curve (marked in red) in Fig 3 Thiscurve contains 532 events and appears much smoother thusindicating that the earthquake clusters have been removed ef-fectively
It is apparent from the clustered catalog cumulative curvein Fig 3 that more than 30 of the events were detected inthe period after the year 2010 and this rate change is investi-gated with the method of Zuninga and Wiemer (1999) Theseismicity rate of the declustered catalogue for a backgroundperiod from 2005 until 2010 is compared to the rate for therecent period from 2010 until the end of 2011 (14 Decem-ber 2011) in Fig 4a and b By comparing the cumulative andthe noncumulative frequency-magnitude distribution curves(normalized by the duration of the time periods) we deter-mine a rate increase of more than 100 for the recent periodand this increase is noticed mainly for events withML lt 3The magnitude shift between the two periods for magnitudeswith ML lt 3 (Fig 4b) may be due to the improvements inNOA magnitude reporting procedures as of February 2011
(a)
(b)
(c)
Fig 4 Comparison of the rates as a function of magnitude for thetwo periods which are printed at the top The numbers are normal-ized by the duration of the periods(a) Frequency-magnitude curve(b) Non-cumulative numbers of events as a function of magnitude(c) Magnitude signature
Since the rate increase for the recent period is found tobe magnitude-dependant the magnitude signature method(Habermann 1987) is employed in order to analyze the re-sults in the magnitude domain Magnitude signatures deter-mine the significance of the rate change between two timeperiods as a function of magnitude In order to determine thedifference between the means of each period the most gen-eral of the parametric statistical tests is applied to the datanamely the z-test The two rates are compared using the for-mula Eq (1) that defines the normal deviate z as
Z = (M1minusM2)((S12N1)+(S22N2))12 (1)
wwwnat-hazards-earth-syst-scinet128592012 Nat Hazards Earth Syst Sci 12 859ndash866 2012
862 G Chouliaras et al Recent seismicity detection increase in the Santorini volcanic island complex
Fig 5 Z-value map showing the rate changes after the recent pe-riod of detection increase (note that negative z-values by definitionindicate seismicity rate increases)
Fig 6 The maximum of the derivative of the frequency magnitudedistribution of the declustered catalogue is used to determine themagnitude of completeness (green curve) and the b-value is deter-mined by the weighted least squares method (red curve)
whereM1 M2 are the mean rates during the two periodsS1 S2 the respective statistical deviations andN1 N2 therespective number of samples The resulting z-value is in-terpreted in terms of significance as the number of stan-dard deviations from the mean of a standard distribution
Fig 7 The temporal variation of theMc in NOA seismicity cata-logue for Santorini
(ie z = 164 is 90 significancez = 196 is 95 signifi-cancez = 257 is 99 significance)
Figure 4c shows the magnitude signature for the two pe-riods of investigation The z-value in the vertical axis haspositive values in the upper part of the plot thus indicatinga rate decrease whereas the opposite holds for the lower partof the plot with negative values indicating a rate increaseThe horizontal axis indicates the magnitude band for whichthe calculation is made Magnitude bands on the left side in-clude events with magnitudes less than those shown on theaxis and magnitude bands on the right side include eventswith magnitudes greater than those shown on the axis
There are different characteristic magnitude signatures foreach type of seismicity rate change Detection changes re-porting changes and magnitude shifts have different and dis-tinct characteristic appearances on a magnitude signature andfor this reason our result in Fig 4c is compared with actualand theoretical magnitude signatures This comparison indi-cates that the Santorini magnitude signature is in good agree-ment with the magnitude signatures determined from peri-ods of detection increases due to the additional installationof seismological network stations (see Figs 2 3 in Haber-mann 1987) Characteristic for this increase are the nega-tive z-values for smaller events on the left side of the plotand less significant change (smaller z-values) for the largerevents on the right side of the plot Another interesting resultin Fig 4c is the occurrence of z-values of opposite signs onthe opposite sides of the magnitude signature indicative ofa magnitude shift for events of small magnitudes (M lt 35)(see Figs 11 16 17 in Habermann 1987)
In order to investigate the spatial dependence of the ratechange shown in Figs 4andashc we mapped the z-value for theSantorini region using the gridding technique of Wiemer andWyss (2002) in Fig 5 A significant rate increase (negativez-values) is observed over Kameni and Thera islands andthis increase is elongated in a NE-SW direction from theColumbo fault almost perpendicular to the NNWndashSSE ex-tensional stress regime of the region The pattern resembles
Nat Hazards Earth Syst Sci 12 859ndash866 2012 wwwnat-hazards-earth-syst-scinet128592012
G Chouliaras et al Recent seismicity detection increase in the Santorini volcanic island complex 863
a Coulomb stress pattern and this agrees with the results ofmore detailed studies that show that the pattern of increasedor decreased seismicity accordingly follows the advancementor retardation of faulting by the Coulomb fracture criteria(Stein et al 1992 Wyss and Wiemer 2000)
The inverse relationship between the b-value and the stressregime has been validated by laboratory tests on rock speci-mens (Mogi 1962 Scholz 1968) as well as by quantitativestudies of earthquake catalogues from different regions of theworld with different stress regimes (Smith 1981 Hauksson1990 Frohlich and Davis 1993 Wiemer and Wyss 1997Kagan 2002 Schorlemmer et al 2004 Schorlemmer andWiemer 2005a b) In volcanic regions a characteristic highb-value has been reported and this is attributed to the phe-nomenon of creep in the magma chamber due to the migra-tion of fluid or magma (Wyss et al 1997 2001 Wiemer etal 1998)
Assuming that earthquake magnitudes obey theGutenberg-Richter law (Gutenberg and Richter 1944)we determined magnitude of completeness (Mc) and theb-value (b) for the declustered seismicity catalogue of San-torini by the use of the weighted least squares (WLS) fittingmethod and the FMD curve as shown in Fig 6 (Wiemer2001) The magnitude of completeness (Mc) is defined asthe lowest magnitude at which all earthquakes in a spacendash time volume are reliably detected by a seismologicalnetwork (Rydelek and Sacks 1989 Taylor et al 1990Wiemer and Wyss 2000 Woessner and Wiemer 2005)Mc is an important parameter for statistical investigationsin seismology and it is traditionally determined from themaximum point of the derivative of the FMD (marked ingreen) curve in Fig 6 (Wiemer 2001) This procedureyields a value ofMc = 34 andb = 147 for the declusteredearthquake catalogue of the Santorini region
Changes in the detection and reporting of a seismologi-cal network may cause theMc and the b-value to vary soit is important to study the temporal dependence ofMc forthe Santorini area before and after the observed rate increaseshown in Fig 4 To determine theMc as a function of timefor the NOA declustered catalogue we employed the methodof Wiemer (2001) and in Fig 7 we observeed aMc variationfrom 34 to 36 until the year 1994
In 1994 the NOA seismological network of 18 ana-log short period stations was complemented with 9 ad-ditional permanent digital short period stations and after1997 the analog seismological network began to be up-graded with new installations of digital broadband stationsPresently the NOA Hellenic Broadband Seismological Net-work (NOA HL) consists of 56 stations that provide realtime waveform and parametric data (httpbbnetgeinnoagrNOA HLindexphpreal-time-plototinghl-network) Theseismological network station increase was complementedwith improvements in the analysis software and in the report-ing procedures as of February 2011 and this has resulted in asignificant improvement in the detection of seismic events in
Fig 8 b-value map showing the spatial variation in the Santoriniisland volcanic complex from 1966 till 2012 calculated from thedeclustered seismicity catalogue of NOA
Greece This improvement may be seen in Fig 7 in whichwe observe a decrease in theMc to a value ofMc = 3 beforethe year 2010 and after that a very sharp decrease toMc = 2towards the end of 2011
The b-value exhibits heterogeneities in time and spacedepending on the stress patterns and in this way it acts asa stress meter (Schorlemmer and Wiemer 2005b) For theSantorini volcanic complex we mapped the spatial distribu-tion of the b-value using the declustered NOA catalogue withMc gt 35 from 1966 to the end of 2011 and the gridding tech-nique of Wiemer and Wyss (2002) In Fig 8 we note a b-value variation from 085 to 135 and a zone of low b-values(appearing in blue) that trends NNWndashSSE crossing the vol-canic islands and separating the two zones of higher b-values(appearing in red) to the East and to the West This alignmentof the low b-value zone is found to follow the NNWndashSSE ex-tensional stress field orientation for this region (Fytikas et al1990 Vougioukalakis et al 1995 Mountrakis et al 1996)
Concerning the Santorini region an increase in the re-ported events in the NOA seismicity catalogue occurred af-ter the installation of two permanent seismological stationson the nearby island of Milos in 2010 and 2011 and alsoafter the installation of the portable network of four broadband seismological stations in June 2011 The significantdetection improvement results in a change of theMc and thischange will result in a different b-value distribution map forthis region for the recent period
To investigate the recent b-value distribution we used theNOA catalogue to determine the spatial dependence of theb-value in the cross section of the main seismic activity inFig 9a The cross section of the main seismic activity con-tains 160 events withMc gt2 between 2010 and the end of
wwwnat-hazards-earth-syst-scinet128592012 Nat Hazards Earth Syst Sci 12 859ndash866 2012
864 G Chouliaras et al Recent seismicity detection increase in the Santorini volcanic island complex
Fig 9 b-value cross section showing the spatial variation after thedetection increases in 2010 and 2011 along a NE-SW profile acrossthe volcanic complex
2011 in a NNEndashSSW distribution parallel to the faulting ori-entation and perpendicular to the extensional stress field Wefound the main clusters of seismic activity in the Kameni andColumbo active faults while on either side away from thevolcanic complex we observed a more diffused seismicitypattern
Figure 9b shows the b-value cross section to a 40 km depthrange and this reveals a significant lateral and vertical het-erogeneity around and beneath the volcanic complex withb-values ranging from 07 to 13 Relatively higher b-values(09ndash13) are observed under the volcanic complex to a 15 kmdepth and lower b-values (07ndash09) are observed laterally oneither side The high b-values near the surface show a de-crease with depth in an inverted cone distribution This b-value distribution is generally in agreement with results fromother volcanic areas (Mt St Hellens Mt Spurr TokohukuKilauea) that report higher b-values (up tob = 2) near thesurface due to the low ambient stress and the highly frac-
tured environment around the magma chamber The decreaseof the b-value with depth is mainly due to the increases instress pore pressure and the thermal gradient (Wiemer andMcNutt 1997 Wiemer and Wyss 1997 Wyss et al 2001)
3 Discussion and conclusions
In this study we used the NOA seismicity catalogue to quan-tify valuable parameters such as the magnitude of complete-ness and the b-value from the frequency-magnitude relationas well as the recent seismicity rate change (z-value) for theSantorini volcanic complex
Many studies have reported anomalies in the seismicityrate during earthquake and volcanic preparation processesTo reveal possible spatial and temporal rate anomalies onemust first carefully analyze the employed earthquake cata-logue and identify any possible artificiality due to man-madechanges This artificiality exists in all catalogues and it de-pends on the increases or decreases in the detection result-ing from the installation or removal of seismic stations aswell as to possible changes in the operative procedures andreporting of the seismological network operator which maychange with time
As part of the detection improvements of the NOA seis-mological network in the vicinity of the Santorini volcanicisland complex a local network of 4 portable broad bandseismic stations was installed in June 2011 to supplement thefirst permanent station that was installed on Thera island in1997 In 2010 and 2011 two other permanent stations werealso installed on the nearby volcanic island of Milos and asa result the detectability and reporting of the local seismicityin the NOA seismicity catalogue improved significantly
The NOA seismicity catalogue contains more than900 events for the region surrounding the Santorini islandsfrom 1966 till the end of 2011 and more than 30 of theseevents were detected after the installation of additional seis-mological stations in 2010 and 2011
Quantitative analysis of the normalized cumulative andnoncumulative FMD curves for the period before and af-ter the new seismological station installations reveals a seis-micity rate increase of more than 100 for the investi-gated region This increase concerns mainly small magnitude(M lt 3) earthquakes and is also confirmed by the negative z-value determined by the magnitude signature method
The significance of the rate change is mapped using the z-value method and we found the rate increase to mainly existin the Kameni and Columbo faults in a NNEndashSSW directionparallel to the active faults and perpendicular to the NNWndashSSE extensional stress direction
The frequency-magnitude distribution of the NOA seis-micity catalogue for the region surrounding the volcaniccomplex determined bulk values forMc = 34 and b =
147 for the entire declustered catalogue Improvements inthe NOA seismic network detectability by the increase of
Nat Hazards Earth Syst Sci 12 859ndash866 2012 wwwnat-hazards-earth-syst-scinet128592012
G Chouliaras et al Recent seismicity detection increase in the Santorini volcanic island complex 865
local seismic stations and the improved magnitude reportingcaused theMc and the b-value to vary with time from a valueof Mc = 35 in 1966 toMc asymp 2 at the end of 2011
Using the declustered catalogue data from 1966 till theend of 2011 we determined a b-value map that indicates alow b-value zone across the volcanic complex in a NNWndashSSE direction parallel to the dominant extensional stressand higher b-values on either side
The recent seismological data after the additional stationinstallations in 2010 and 2011 have significantly lowerMc(gt2) and 160 of these events were used to determine a b-value cross section along the direction of the principal seis-mic activity of the region (NNEndashSSW) The b-value crosssection across the volcanic complex indicates prominent ver-tical and lateral heterogeneities The distribution pattern ofb-values map the Santorini volcanic complex with relativelyhigh b-values in the top fifteen kilometers and decreasing b-values with depth and lateral distance (on either side of thecomplex)
The recent b-value distribution on Santorini is in quali-tative agreement with reported b-value maps determined inother volcanic regions in which mapping of the magmachamber was attempted for earthquake hazard and risk es-timation and eruption forecasting Nevertheless differentpatterns of high b-values exist for different volcanic areasmainly due to the different magmatic composition and styleof eruption
The forecasting of volcanic eruptions has a distinct ad-vantage to the forecasting of earthquakes In volcanoes themagma moves upwards from a depth and this movement canbe detected with many different methods (ie seismicitygeodesy electromagnetism chemistry of fumaroles gasesgases in soils conductivity)
A combination of many methods might eventually leadto a better understanding of the preparatory process of vol-canic activity In a recent review paper De Lauro etal (2011) stated that the Independent Component Analy-sis (ICA) method of deconvolution of seismic waveformsand the Natural Time Analysis method of analyzing seis-mic activity (Varotsos et al 2011) have success in themonitoring and forecasting of volcanic processes in Strom-boli (Italy) Erebus (Antarctica) Volcan de Colima (Mexico)and Izu (Japan)
In this study we investigated the seismicity of the San-torini volcanic island complex using the earthquake cata-logue of NOA in order to contribute to the mosaic of a vol-canic and seismic hazard estimates for Santorini The lim-ited and diffused seismicity of the region does not allow for amore detailed temporal and spatial investigation at this pointHowever it is apparent that the detectability and reporting ofthe NOA seismological network in the Santorini region haverecently improved and the seismological data will prove tobe valuable for future research studies
AcknowledgementsThe authors would like to thank the tworeviewers for their constructive comments and the editorial staff fortheir assistance in the editing processes
Edited by M E ContadakisReviewed by A P V Kouskouna and another anonymous referee
References
Chouliaras G Investigating the earthquake catalog of the NationalObservatory of Athens Nat Hazards Earth Syst Sci 9 905ndash912doi105194nhess-9-905-2009 2009
De Lauro E De Martino S Falanga M and Palo M Self-sustained vibrations in volcanic areas extracted by IndependentComponent Analysis a review and new results Nonlin Pro-cesses Geophys 18 925ndash940doi105194npg-18-925-20112011
Frohlich C and Davis S C Teleseismic b values or much adoabout 10 J Geophys Res 98 631ndash644 1993
Fytikas M Innocenti F Manetti P Mazzuoli R Peccerillo Aand Villari L Tertiary to Quaternary evolution of volcanism inthe Aegean region Geol Soc London Spec Publ 17 687ndash6991984
Fytikas M Kolios N and Vougioukalakis G Post-Minoan Vol-canic Activity of the Santorini Volcano Volcanic hazard andrisk forecasting possibilities In Thera and the Aegean WorldIII Vol 2 The Thera Foundation London 183ndash198 1990
Gutenberg B and Richter C F Frequency of earthquakes in Cal-ifornia B Seismol Soc Am 34 185ndash188 1944
Habermann R E Consistency of teleseismic reporting since 1963B Seism Soc Am 72 93ndash112 1982
Habermann R E Man-made changes of seismicity rates BSeism Soc Am 77 141ndash159 1987
Habermann R E and Craig M S Comparison of Berkeley andCALNET magnitude estimates as a means of evaluating temporalconsistency of magnitudes in California B Seismol Soc Am78 1255ndash1267 1988
Habermann R E Seismicity rate variations and systematic changesin magnitudes in teleseismic catalogues Tectonophysics 193277ndash289 1991
Hauksson E Earthquakes faulting and stress in theLos Angeles basin J Geophys Res 95 15365ndash15394doi101029JB095iB10p15365 1990
Heiken G and McCoy F Caldera development during the Mi-noan eruption Thera Cyclades Greece J Geophys Res 89B-108441-8462 1984
Heiken G and McCoy F Precursory activity to the Minoan Erup-tion Thera Greece In Thera and the Aegean World III 2 TheThera Foundation London 79ndash88 1990
Kagan Y Y Seismic moment distribution revisited I Statisticalresults Geophys J Int 148 520ndash541 2002
Mogi K Magnitudendashfrequency relations for elastic shocks accom-panying fractures of various materials and some related problemsin earthquakes Bull Earthquake Res Inst Univ Tokyo 40 831ndash853 1962
Mountrakis D M Pavlides S B Chatzipetros A MeletlidisS Tranos M D Vougioukalakis G and Kilias A A Ac-tive deformation of Santorini Proceedings of 2nd Workshop on
wwwnat-hazards-earth-syst-scinet128592012 Nat Hazards Earth Syst Sci 12 859ndash866 2012
866 G Chouliaras et al Recent seismicity detection increase in the Santorini volcanic island complex
European Laboratory Volcanoes Santorini Greece 13ndash22 2ndash4 May 1996
Papazachos B C and Papazachou C B The Earthquakes ofGreece edited by Ziti Thessaloniki 2003 (in Greek)
Panagiotopoulos D G Stavrakakis G Makropoulos K Pa-panastasiou D Papazachos C Savvaidis A and KaragianniD Seismic monitoring at the Santorini Volcano Proceedingsof 2nd Workshop on European Laboratory Volcanoes SantoriniGreece 311ndash324 2ndash4 May 1996
Reasenberg P A Second-order moment of Central CaliforniaSeismicity 1969ndash1982 J Geophys Res 90 5479ndash5495 1985
Rydelek P A and Sacks I S Testing the completeness of earth-quake catalogs and the hypothesis of self-similarity Nature 337251ndash253 1989
Scholz C H The frequencyndashmagnitude relation of microfractur-ing in rock and its relation to earthquakes B Seismol Soc Am58 399ndash415 1968
Schorlemmer D and Wiemer S Microseismicity data fore-cast rupture area Nature 434 1086doi1010384341086a28 April 2005a
Schorlemmer D and Wiemer S Variation of earthquake-size dis-tribution across different stress regimes Nature 437 539ndash542doi101038nature04094 22 September 2005b
Schorlemmer D Wiemer S and Wyss M Earthquake statisticsat Parkfield 1 Stationarity of b-values J Geophys Res 109B12307doi1010292004JB003234 2004
Smith W D The b-values as an earthquake precursor Nature 289136ndash139 1981
Taylor D A Snoke J A Sacks I S and Takanami T Nonlin-ear frequency magnitude relationship for the Hokkaido cornerJapan B Seism Soc Am 80 340ndash353 1990
Stavrakakis G Chouliaras G and Sachpazi M Recent seis-mic activity along the Hellenic Volcanic Arc Proceedings of2nd Workshop on European Laboratory Volcanoes SantoriniGreece 325ndash338 2ndash4 May 1996
Stein R S King G C P and Lin J Change in failure stress onthe southern San Andreas Fault caused by the 1992 magnitude74 Lander earthquake Science 258 1328ndash1332 1992
Tormann T Wiemer S and Hauksson E Changes of ReportingRates in the Southern California Earthquake Catalog Introducedby a New Definition of ML B Seismol Soc Am 100 1733ndash1742doi1017850120090124 2010
Varotsos P A Sarlis N V and Skordas E S NaturalTime Analysis The New View of Time Precursory Seis-mic Electric Signals Earthquakes and other Complex Time Se-ries Springer Praxis Books Springer-Verlag Berlin Heidel-berg httpwwwspringercomearth+sciences+and+geographynatural+hazardsbook978-3-642-16448-4 2011
Vougioukalakis G Francalanchi L Serana A and MitropoulosD The 1649ndash1650 Coloumbo submarine volcano activity San-torini Greece in The European Laboratory Volcanoes Work-shop Proceedings edited by Barberi F Casale R and FrattaM European Commission European Science Foundation Lux-emburg 189ndash192 1995
Wiemer S A software package to analyze seismicity ZMAPSeismol Res Lett 72 374ndash383 2001
Wiemer S and Wyss M Seismic quiescence before the Landers(M=75) and Big Bear (65) 1992 earthquakes B Seism SocAm 84 900ndash916 1994
Wiemer S and Wyss M Mapping the frequencyndashmagnitude dis-tribution in asperities An improved technique to calculate recur-rence times J Geophys Res 102 15115ndash15128 1997
Wiemer S and McNutt S Variation in the frequency-magnitudedistribution with depth in two volcanic areas Mount St He-lens Washington and Mt Spurr Alaska Geophys Res Lett24 189ndash192 1997
Wiemer S and Wyss M Minimum magnitude of completenessin earthquake catalogues examples from Alaska the westernUnited States and Japan B Seism Soc Am 90 859ndash869 2000
Wiemer S and Wyss M Mapping spatial variability of thefrequency-magnitude distribution of earthquakes Adv Geo-phys 45 259ndash302 2002
Wiemer S McNutt S R and Wyss M Temporal and three-dimensional spatial analysis of the frequency-magnitude distri-bution near Long Valley caldera California Geophys J Int134 409ndash421 1998
Woessner J and Wiemer S Assessing the quality of earth-quake catalogues estimating the magnitude of completenessand its uncertainty B Seismol Soc Am 95 684ndash698doi1017850120040007 2005
Wyss M Shimazaki K and Wiemer S Mapping active magmachambers by b-values beneath the Off-Ito Volcano Japan J Geo-phys Res 102 413ndash422 1997
Wyss M and Wiemer S Change in the Probability for earth-quakes in Southern California Due to the Landers Magnitude 73Earthquake Nature 290 1334ndash1338 2000
Wyss M Klein F Nagamine K and Wiemer S Anomalouslyhi b-values in the South Flank of Kilauea volcano Hawaii evi-dence for the distribution of magma below Kilauea East rift zoneJ Volcanol Geotherm Res 106 23ndash37 2001
Zuninga F R Reyners M and Villamor P Temporal variationsof the earthquake data in the catalogue of seismicity of NewZealand Bulletin of the New Zealand Society for EarthquakeEngineering 38 87ndash105 2005
Zuninga F R and Wiemer S Seismicity patterns are they alwaysrelated to natural causes Pure Appl Geophys 155 713ndash7261999
Zuninga F R and Wyss M Inadvertent changes in magnitude re-ported in earthquake catalogues influence on b-value estimatesB Seismol Soc Am 85 1858ndash1866 1995
Nat Hazards Earth Syst Sci 12 859ndash866 2012 wwwnat-hazards-earth-syst-scinet128592012