recession briefing rda project managers meeting nov 2009 ben neild assistant director, slim
DESCRIPTION
Recession Briefing RDA Project Managers Meeting Nov 2009 Ben Neild Assistant Director, SLIM. UK GDP. Source: ONS. Unemployment, SW. Source: ONS / BBC. Employment Rate, SW. % Working age population in Employment. Source: LFS. Employment Rate, SW. - PowerPoint PPT PresentationTRANSCRIPT

www.swslim.org.uk
Recession Briefing
RDA Project Managers MeetingNov 2009
Ben NeildAssistant Director, SLIM

www.swslim.org.uk
UK GDP
Source: ONS

www.swslim.org.uk
Unemployment, SW
Source: ONS / BBC
www.swslim.org.uk
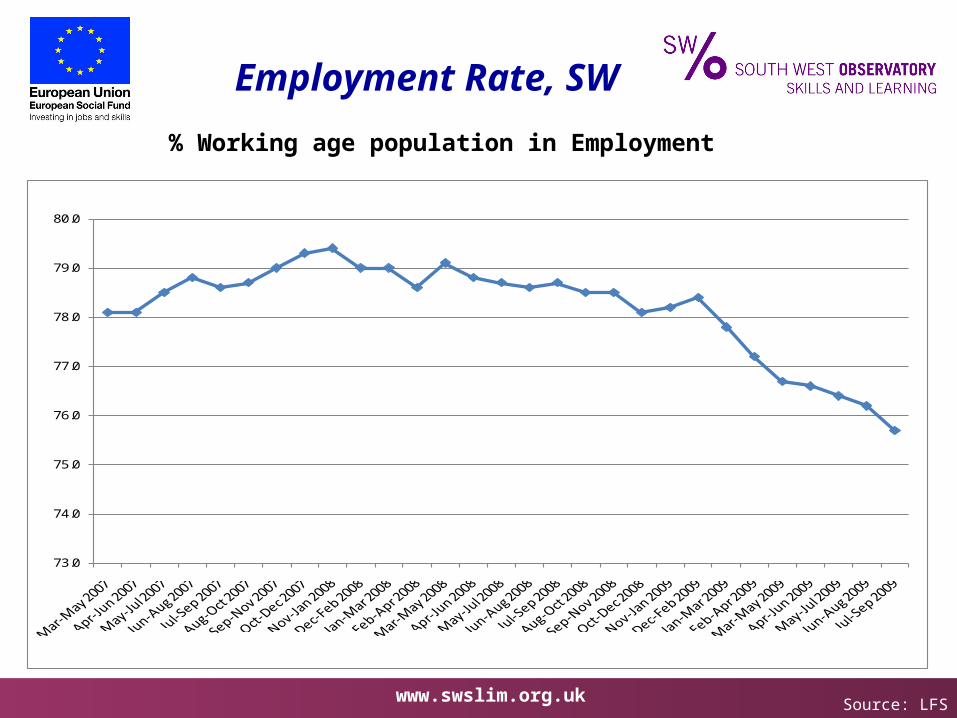
Employment Rate, SW
Source: LFS
% Working age population in Employment
73.0
74.0
75.0
76.0
77.0
78.0
79.0
80.0

www.swslim.org.uk
Employment Rate, SW
Source: LFS
% Working age population in Employment, May to July 2009
www.swslim.org.uk
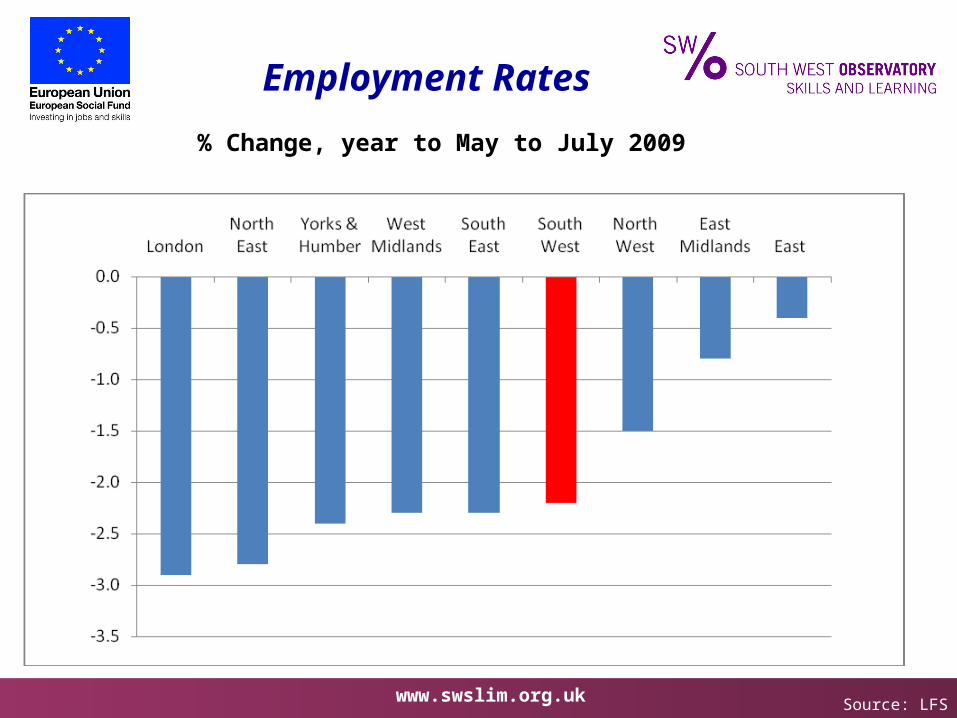
Employment Rates
Source: LFS
% Change, year to May to July 2009

www.swslim.org.uk
Unemployment, SW
Source: JC+ / NOMIS
4.03.8
4.0 4.04.2
4.44.8 4.8
5.15.3
5.8 5.86.2
6.46.7 6.6 6.6
1.3 1.3 1.3 1.4 1.5 1.6 1.71.9
2.12.5
2.93.1 3.1 3.1 3.0 3.0 3.0 3.0 2.9
0.0
1.0
2.0
3.0
4.0
5.0
6.0
7.0
8.0
Apr
-08
May
-08
Jun-
08
Jul-0
8
Aug
-08
Sep-
08
Oct
-08
Nov
-08
Dec
-08
Jan-
09
Feb-
09
Mar
-09
Apr
-09
May
-09
Jun-
09
Jul-0
9
Aug
-09
Sep-
09
Oct
-09
% W
orki
ng A
ge P
opul
ation
LFS Unemployment
Claimant Count

www.swslim.org.uk
Claimant Count
Source: JC+ / NOMIS
-4,000
-2,000
0
2,000
4,000
6,000
8,000
10,000
12,000
14,000
16,000
Jan-09 Feb-09 Mar-09 Apr-09 May-09 Jun-09 Jul-09 Aug-09 Sep-09 Oct-09
Adjusted
Unadjusted
SW, Adjusted & Unadjusted, Jan to Oct 2009

www.swslim.org.uk
Claimant Count Grown by regions
Source: JC+ / NOMIS
60
80
100
120
140
160
180
200
220
240
260
North East
North West
Yorkshire and The Humber
East Midlands
West Midlands
East
London
South East
South West
Indexed, April 08 = 100
www.swslim.org.uk
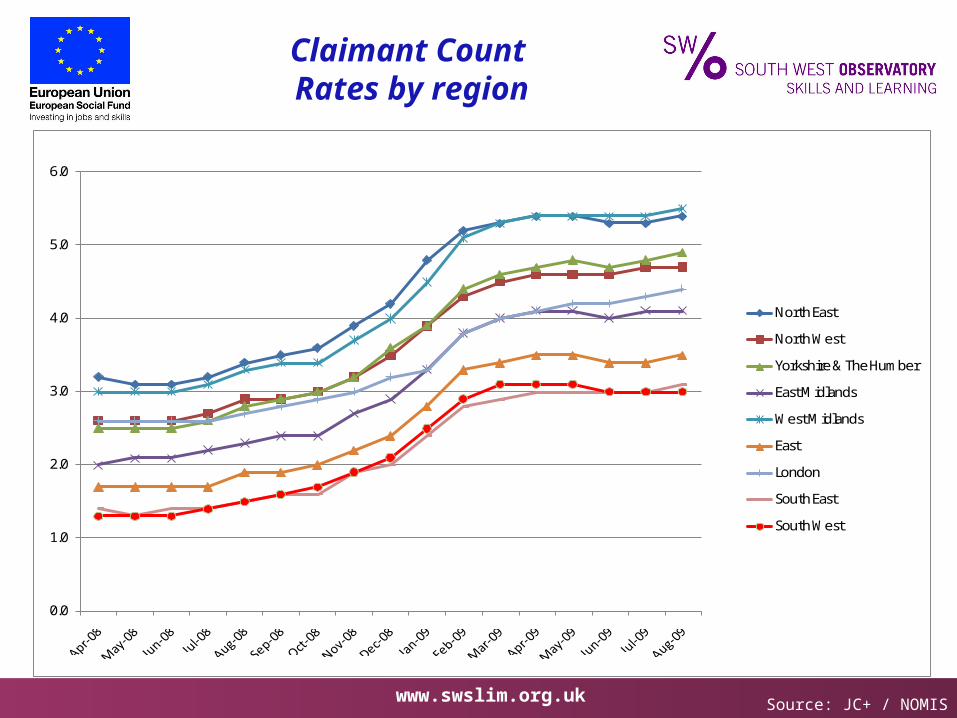
Claimant Count Rates by region
Source: JC+ / NOMIS
0.0
1.0
2.0
3.0
4.0
5.0
6.0
North East
North West
Yorkshire & The Humber
East Midlands
West Midlands
East
London
South East
South West

www.swslim.org.uk
Claim duration
Source: JC+ / NOMIS
-
50
100
150
200
250
300
350
> 6 months
> 1 year
< 6 months
www.swslim.org.uk
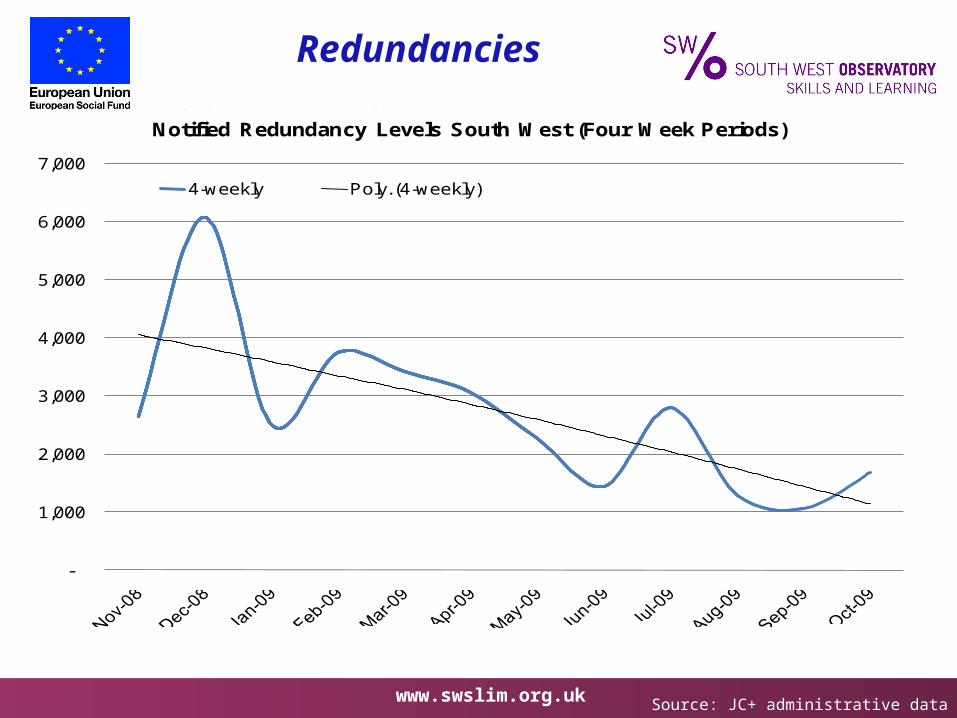
Redundancies
Source: JC+ administrative data
Notified redundancies each week, South West,1st Nov 2008 to 12th June 2009
-
1,000
2,000
3,000
4,000
5,000
6,000
7,000
Notified Redundancy Levels South West (Four Week Periods)
4-weekly Poly. (4-weekly)

www.swslim.org.uk
Vacancies
Source: JC+ / NOMIS
0
5,000
10,000
15,000
20,000
25,000
30,000
35,000
live unfilled vacancies
notified vacancies
www.swslim.org.uk
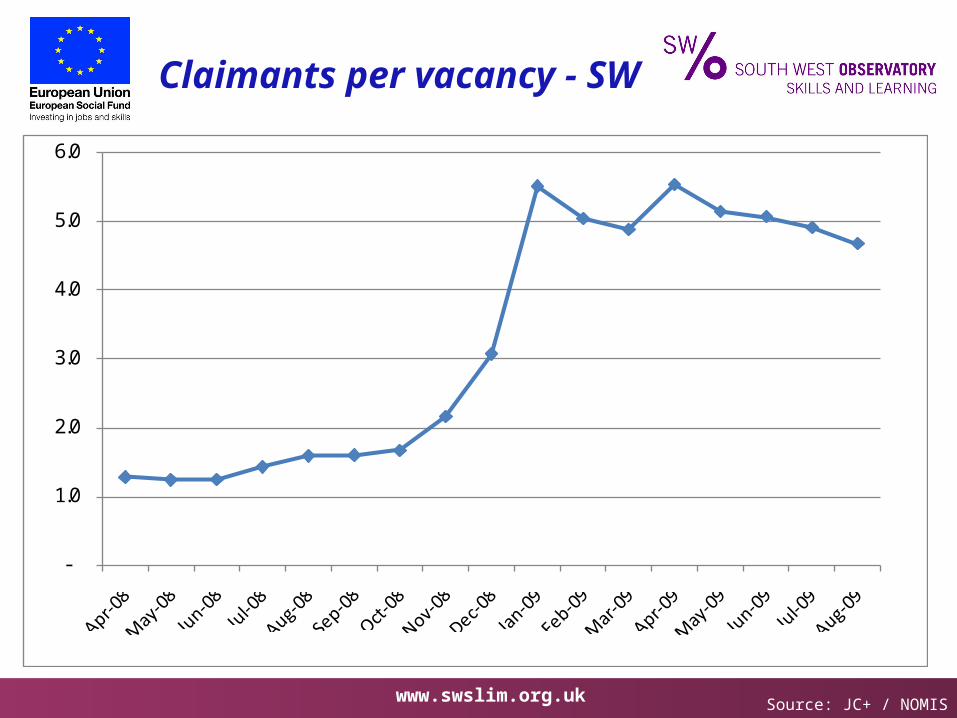
Claimants per vacancy - SW
Source: JC+ / NOMIS
-
1.0
2.0
3.0
4.0
5.0
6.0
www.swslim.org.uk
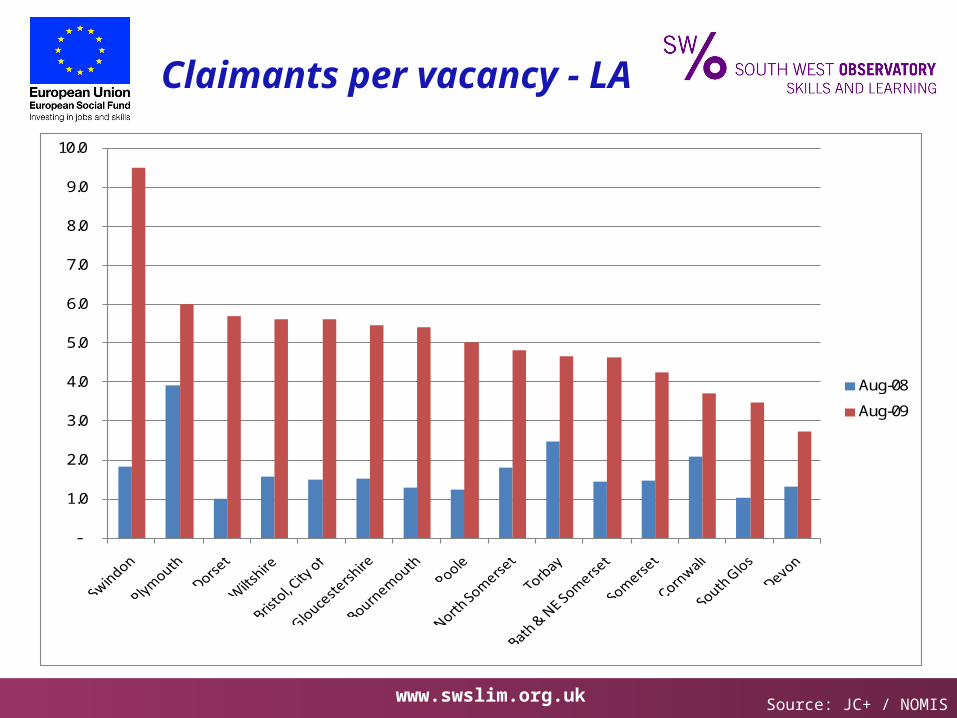
Claimants per vacancy - LA
Source: JC+ / NOMIS
-
1.0
2.0
3.0
4.0
5.0
6.0
7.0
8.0
9.0
10.0
Aug-08
Aug-09

www.swslim.org.uk
Gender - Employment Rates
Source: LFS
93.0
94.0
95.0
96.0
97.0
98.0
99.0
100.0
101.0
102.0
Aug-Oct 2008
Sep-Nov 2008
Oct-Dec 2008
Nov-Jan 2009
Dec-Feb 2009
Jan-Mar 2009
Feb-Apr 2009
Mar-May 2009
Apr-Jun 2009
May-Jul 2009
Men
Women
South West Employment Rate by gender, indexed, Aug 08 = 100
www.swslim.org.uk
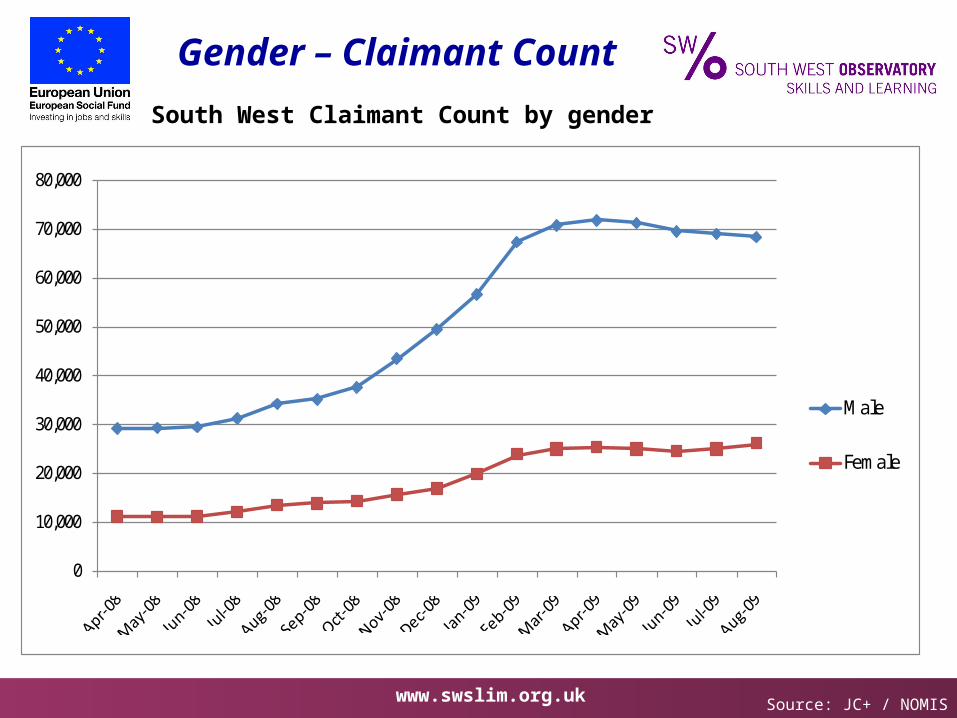
Gender – Claimant Count
Source: JC+ / NOMIS
0
10,000
20,000
30,000
40,000
50,000
60,000
70,000
80,000
Male
Female
South West Claimant Count by gender
www.swslim.org.uk Source: JC+ / NOMIS
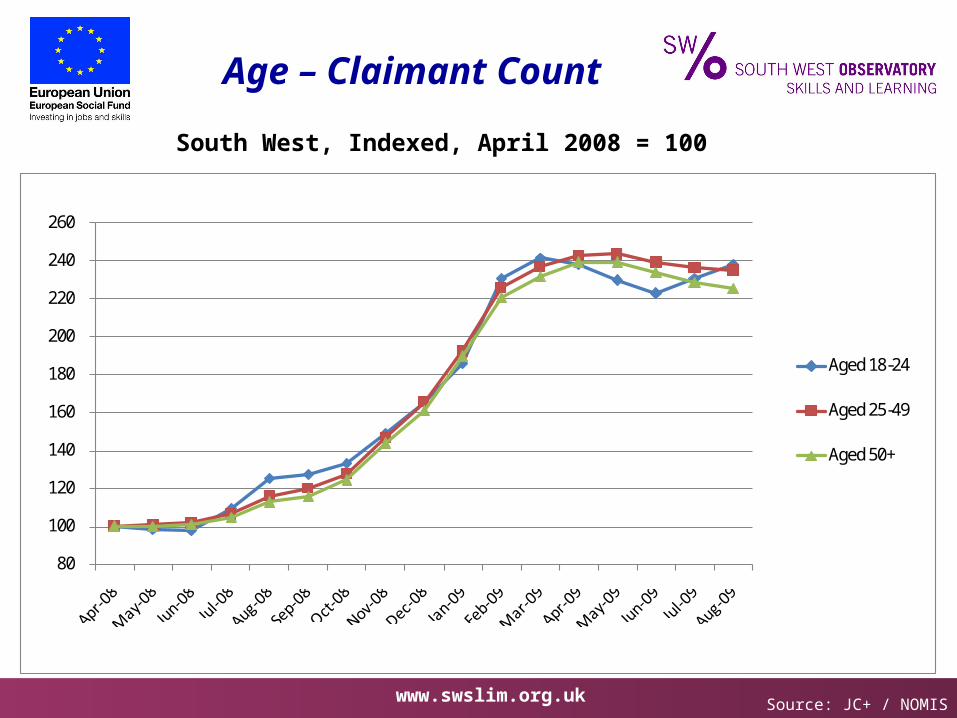
Age – Claimant Count
80
100
120
140
160
180
200
220
240
260
Aged 18-24
Aged 25-49
Aged 50+
South West, Indexed, April 2008 = 100

www.swslim.org.uk
Claimant Count by Age
Source: NOMIS / JC+
0.00%
1.00%
2.00%
3.00%
4.00%
5.00%
6.00%
7.00%
% p
opul
ation
Aug 08
Aug 09
+ 3% of age band

www.swslim.org.uk
Claimant Count20 to 24 yrs olds (Aug 09)
Source: NOMIS / JC+
0.0%
2.0%
4.0%
6.0%
8.0%
10.0%
12.0%
www.swslim.org.uk
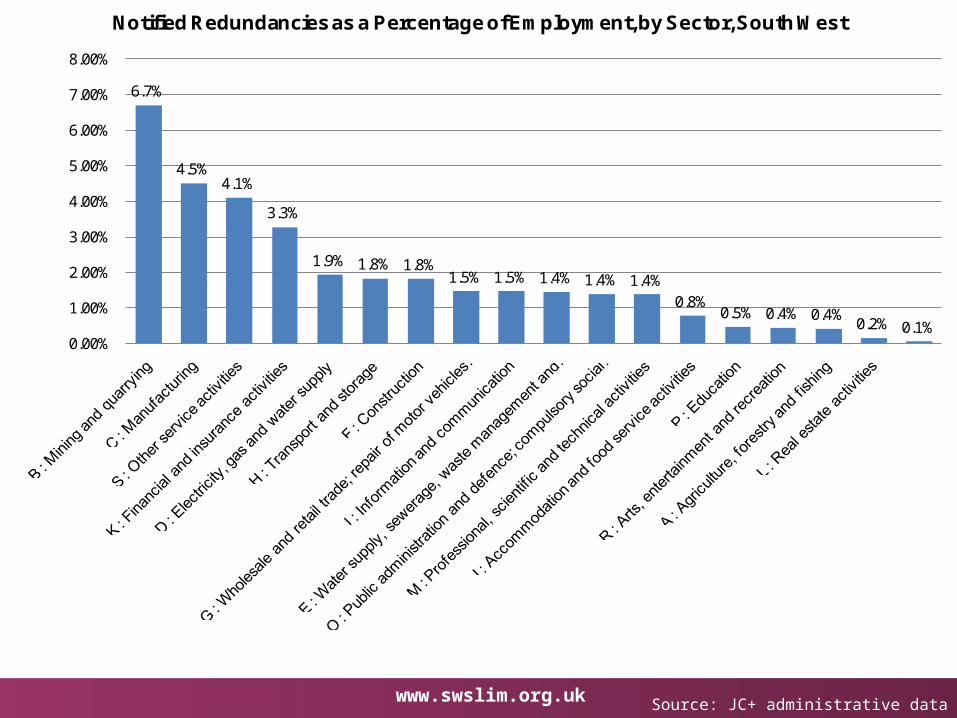
Impact on Sectors
Source: JC+ administrative data
6.7%
4.5%4.1%
3.3%
1.9% 1.8% 1.8%1.5% 1.5% 1.4% 1.4% 1.4%
0.8%0.5% 0.4% 0.4%
0.2% 0.1%0.00%
1.00%
2.00%
3.00%
4.00%
5.00%
6.00%
7.00%
8.00%
Notified Redundancies as a Percentage of Employment, by Sector, South West
www.swslim.org.uk
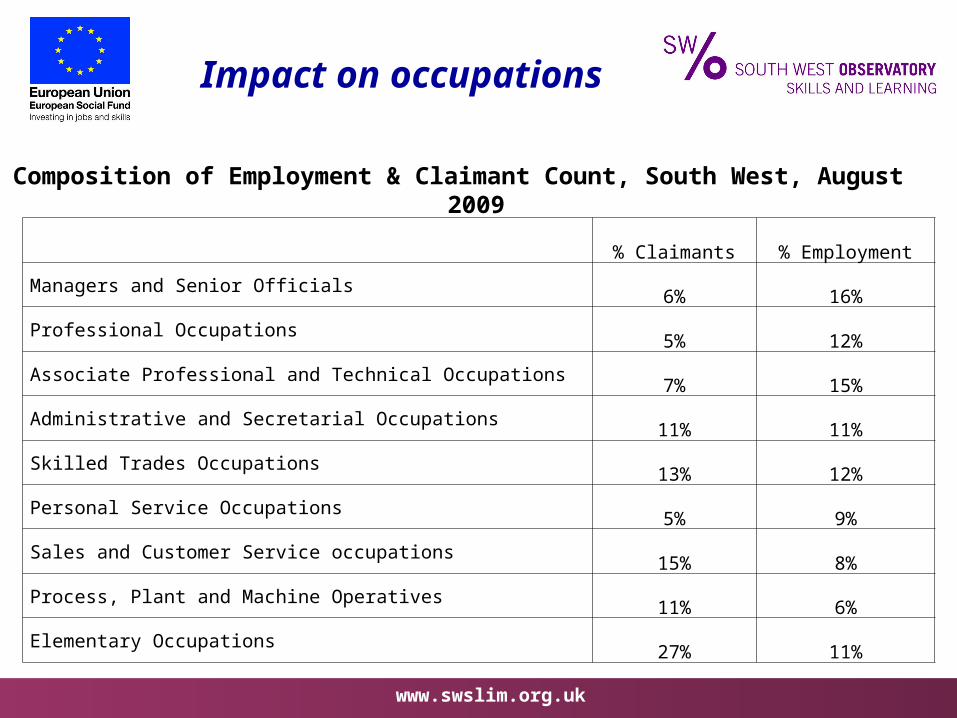
Impact on occupations
Composition of Employment & Claimant Count, South West, August 2009
% Claimants % Employment
Managers and Senior Officials6% 16%
Professional Occupations5% 12%
Associate Professional and Technical Occupations7% 15%
Administrative and Secretarial Occupations11% 11%
Skilled Trades Occupations13% 12%
Personal Service Occupations5% 9%
Sales and Customer Service occupations15% 8%
Process, Plant and Machine Operatives11% 6%
Elementary Occupations27% 11%

www.swslim.org.uk
Impact on occupationsChange over time
Composition of Claimant Count, South West, August 2008 & August 2009
Occupation Aug-08 Aug-09
Managers and Senior Officials 5.4% 6.1%
Professional Occupations 3.9% 4.5%
Associate Professional and Technical Occupations 6.4% 7.0%
Administrative and Secretarial Occupations 11.3% 10.9%
Skilled Trades Occupations 11.9% 13.2%
Personal Service Occupations 5.0% 5.1%
Sales and Customer Service occupations 15.1% 14.8%
Process, Plant and Machine Operatives 10.0% 10.8%
Elementary Occupations 30.8% 27.4%

www.swslim.org.uk
Unemployment Lagging Indicator
Source: LFS, ONS
GDP & Unemployment - 1990's
-1.5
-1
-0.5
0
0.5
1
1.5
2
1990 Q
1Q
2Q
3Q
41991 Q
1Q
2Q
3Q
41992 Q
1Q
2Q
3Q
41993 Q
1Q
2Q
3Q
41994 Q
1Q
2Q
3Q
41995 Q
1Q
2Q
3Q
41996 Q
1Q
2Q
3Q
41997 Q
1Q
2Q
3Q
41998 Q
1Q
2Q
3Q
41999 Q
1Q
2Q
3Q
42000 Q
1Q
2Q
3Q
42001 Q
1Q
2Q
3Q
42002 Q
1Q
2Q
3Q
42003 Q
1Q
2Q
3Q
4
GD
P G
row
th,
Qtr
on
Qtr
0
2
4
6
8
10
12
Un
em
plo
ym
en
t, %
of
16+
po
pu
lati
on
GDP
Unemployment
Estimates
19 Quarters of positive growth before unemployment returns to pre-
recession levels
We have now had 6 successive quarter s of negative growth