recidivism rates among the idaho department of …
TRANSCRIPT

RECIDIVISM RATES AMONG THE IDAHO DEPARTMENT OF CORRECTION’S SUPERVISED POPULATION
IDAHO STATISTICAL ANALYSIS CENTER PLANNING, GRANTS & RESEARCH
IDAHO STATE POLICE
In Collaboration With: Idaho Department of Correction
Idaho Supreme Court

2 | P a g e
Recidivism Rates among the Idaho Department of Correction’s
Supervised Population
Author
Thomas Strauss, MPA
Idaho Statistical Analysis Center
Planning, Grants & Research
Idaho State Police
For More Information
Email: [email protected]
Website: www.isp.idaho.gov/pgr/sac/
Published: October 2021
This project was supported by Grant No. 2017-BJ-CX-K005 awarded by the Bureau of Justice Statistics. The Bureau of Justice
Statistics is a component of the Office of Justice Programs at the U.S. Department of Justice, which also includes the Bureau of
Justice Assistance, the National Institute of Justice, the Office of Juvenile Justice and Delinquency Prevention, the Office for
Victims of Crime, and the Office of Sex Offender Sentencing, Monitoring, Apprehending, Registering, and Tracking. Points of view
or opinions in this document are those of the author and do not necessarily represent the official position or policies of the U.S.
Department of Justice, nor the Idaho State Police.

3 | P a g e
Table of Contents Executive Summary ............................................................................................................................................... 4
Introduction .......................................................................................................................................................... 5
Data Sources ....................................................................................................................................................... 10
Results ................................................................................................................................................................. 12
Conclusions and Policy Recommendations ......................................................................................................... 22
Appendix A: Failure and Hazard Functions .......................................................................................................... 25
Appendix B: Cox Regression Models ................................................................................................................... 31
4 | P a g e
Executive Summary Despite many efforts to control Idaho’s justice-involved population in recent years, the rate of Idaho citizens
under supervision due to a criminal conviction remains one of the highest in the western United States. One
major driver of the problem is criminal recidivism. According to data from the Idaho Department of Correction
(IDOC), the majority of their incarcerated population is comprised of individuals who failed to complete a
diversion program or a community supervision sentence. IDOC’s recidivism rates have become a benchmark
for describing recidivism in Idaho; however, IDOC’s jurisdiction is limited to those who have committed
felonies, and as such its definition of recidivism is only one part of the picture.
To begin filling in the rest of that picture, the Idaho Statistical Analysis Center (ISAC) used data from both IDOC
and the Idaho Supreme Court to calculate rates for five definitions of recidivism: (1) probation or parole
violation, (2) new criminal charge, (3) new criminal conviction, (4) new misdemeanor conviction, and (5) new
felony conviction. ISAC also used IDOC data on individual characteristics such as age, gender, race, and risk
score to construct statistical models to further our understanding of who is more likely to reoffend and when
subsequent offenses might happen. Individuals included in the study were those who had been under IDOC
supervision at any time between 2010 and 2017 and had been released to the community (including
supervised release; those who were only incarcerated and had not been released were excluded).
Key Findings How Idaho’s Supervision Rates Compare to Other Western States
At year-end 2017, Idaho had the highest rate of citizens under supervision (both in a facility and in the
community) in the Western U.S. for any type of criminal conviction; 1 in 25 adult Idahoans were in jail, prison,
or on probation or parole. Idaho’s prison incarceration rate was second highest in the West (only Arizona’s
incarceration rate was higher). This is in spite of the fact that throughout the 2010s, Idaho consistently had
one of the lowest violent and property crime rates in the West.
Characteristics of IDOC’s Population The vast majority of people sentenced to IDOC supervision between 2010 and 2017, either in a facility or on
felony probation, had only been sentenced for one crime type (83%). Nearly a third (31%) were sentenced to
IDOC supervision for a drug offense, the highest of any crime type. Nearly all (99.6%) had been on felony
probation and/or parole at least once. The average individual was under IDOC supervision for the first time,
White, male, in their late-20s when first sentenced to IDOC supervision, and classified as low-to-moderate risk
as determined by their LSI-R score.
Comparison of Recidivism Definitions Recidivism rates varied widely depending on the definition used. At the low end, statistical models predicted
10.1% were expected to commit a probation or parole violation within three years of being released to the
community. At the high end, 41.3% were expected to be charged with a new crime. Despite that range, the
expected timing of recidivism was relatively similar across definitions. About 40% of predicted recidivism
events were expected to occur in the first year, regardless of the type of recidivism. Models also indicated that
an individual’s age when they were released to the community and gender were significant predictors of
recidivism. Males were more likely than females to commit another offense, and those sentenced to IDOC at
younger ages were more likely to recidivate than those first sent to IDOC later in life.

5 | P a g e
Introduction The National Institute of Justice refers to recidivism as “…one of the most fundamental concepts in criminal
justice.”1 As such, researchers and policymakers have long been interested in determining how various aspects
of the criminal justice system affect recidivism rates. Broadly defined, recidivism rates measure how many
individuals commit another criminal act after coming into contact with the justice system. It is a metric that
has been studied in countless academic articles and program evaluations, is often considered one of the most
important factors in determining the success (or failure) of rehabilitative programs, and is routinely cited as an
indicator of how the justice system is performing in a given jurisdiction.
As the use of evidence-based practices (EBPs) has increased in the justice system, so too has the need for
reliable and relevant recidivism statistics. In Idaho, where Justice Reinvestment Initiative (JRI) legislation was
enacted in 2014, EBPs play a central role in how the justice system responds to justice-involved individuals.
Multiple sections of Idaho Code § 20, Chapter 2 require agencies across the justice system to incorporate EBPs
into their operations. EBPs guide decisions regarding programming both in and out of custody, whether to
grant parole to applicants, and sentencing through the use of pre-sentence investigations (PSIs).2 Additionally,
other sections now require routine reporting on the use of EBPs and recidivism rates to the state legislature.
Despite all the attention being paid to recidivism rates, one major question remains: What, exactly, constitutes
recidivism? Three measures have emerged as the most common: (1) a new arrest, (2) a new conviction, or (3)
a new sentence of incarceration and/or supervision. Precisely when an individual becomes “at risk” of
experiencing a recidivism event can depend on the project; often the clock starts upon release from custody or
supervision. However, the potential combinations of event definitions and time periods are numerous and
there is no consensus in the existing literature regarding whether a single, universal definition of recidivism
would be appropriate for all projects.
The lack of a universal definition has not prevented more specific definitions of recidivism from being codified
in law or administrative rule.3 In 2016, the Adult Felony Recidivism subcommittee of the Idaho Criminal Justice
Commission deliberated adopting a specific definition of recidivism by an adult felon that all of its member
agencies would use in their reporting and research projects. Although the definition was never adopted, the
concept of a standard statewide definition of recidivism that can be used across programs and agencies could
be appealing for those involved in decision-making and resource allocation at the state level.
In an effort to evaluate and compare different definitions of recidivism that might be useful to the state of
Idaho, this report seeks to address three main issues:
1. What administrative data is available for use in studying recidivism? What data is not available? Can
datasets from multiple agencies be combined to give us a bigger picture of recidivism?
2. What does recidivism currently look like in Idaho? How has JRI impacted recidivism rates? Are there
areas for improvement in assessing risk of recidivism?
3. Do recidivism rates change significantly if the definition is adjusted? Is it appropriate to impose one
definition, or should there be some flexibility to allow for different research contexts and questions?
1 National Institute of Justice. (2014, June 17). Recidivism. Retrieved from https://www.nij.gov/topics/corrections/recidivism/Pages/welcome.aspx 2 Notably, I.C. § 19-2517 also requires recidivism statistics to be included in all PSIs and establishes the definition of recidivism that must be used in these reports. 3 See Footnotes 1 and 2, and Vermont state law 28 V.S.A. § 4 for examples of specific recidivism definitions.
6 | P a g e
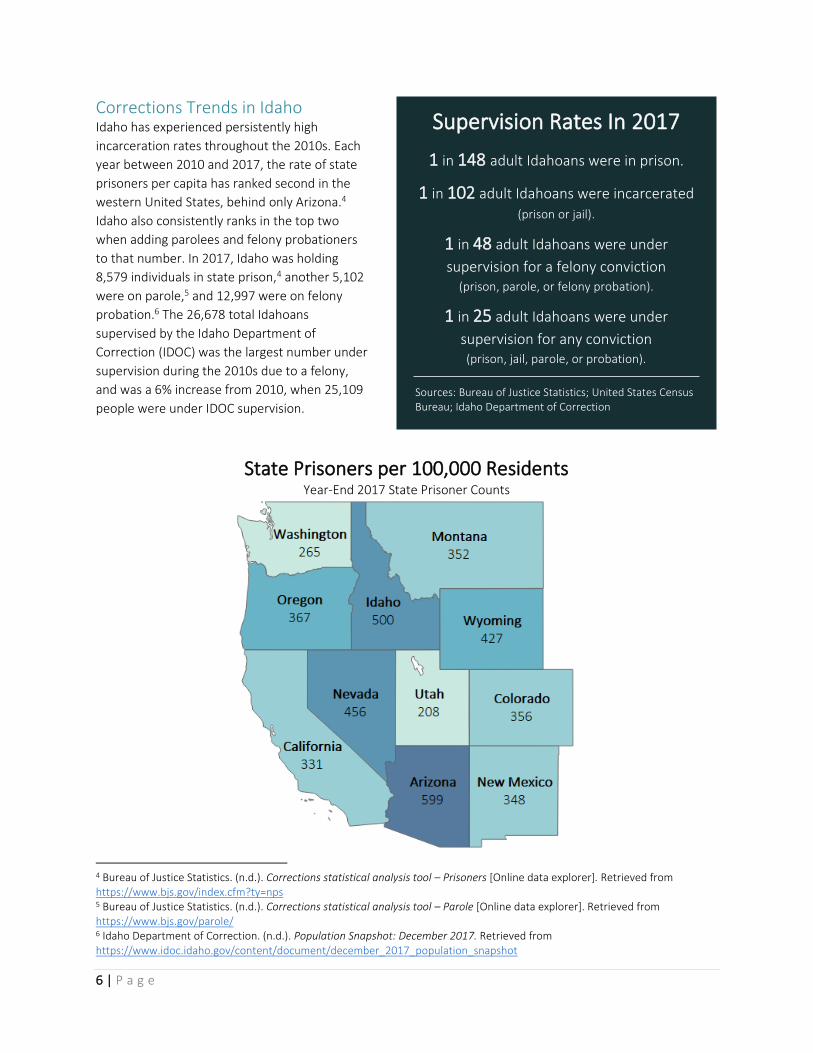
Corrections Trends in Idaho Idaho has experienced persistently high
incarceration rates throughout the 2010s. Each
year between 2010 and 2017, the rate of state
prisoners per capita has ranked second in the
western United States, behind only Arizona.4
Idaho also consistently ranks in the top two
when adding parolees and felony probationers
to that number. In 2017, Idaho was holding
8,579 individuals in state prison,4 another 5,102
were on parole,5 and 12,997 were on felony
probation.6 The 26,678 total Idahoans
supervised by the Idaho Department of
Correction (IDOC) was the largest number under
supervision during the 2010s due to a felony,
and was a 6% increase from 2010, when 25,109
people were under IDOC supervision.
4 Bureau of Justice Statistics. (n.d.). Corrections statistical analysis tool – Prisoners [Online data explorer]. Retrieved from https://www.bjs.gov/index.cfm?ty=nps 5 Bureau of Justice Statistics. (n.d.). Corrections statistical analysis tool – Parole [Online data explorer]. Retrieved from https://www.bjs.gov/parole/ 6 Idaho Department of Correction. (n.d.). Population Snapshot: December 2017. Retrieved from https://www.idoc.idaho.gov/content/document/december_2017_population_snapshot
Supervision Rates In 2017
1 in 148 adult Idahoans were in prison.
1 in 102 adult Idahoans were incarcerated (prison or jail).
1 in 48 adult Idahoans were under
supervision for a felony conviction (prison, parole, or felony probation).
1 in 25 adult Idahoans were under
supervision for any conviction (prison, jail, parole, or probation).
Sources: Bureau of Justice Statistics; United States Census Bureau; Idaho Department of Correction
State Prisoners per 100,000 Residents
Year-End 2017 State Prisoner Counts

7 | P a g e
If the number of individuals under IDOC supervision is an indicator of how strained the back end of the justice
system is in Idaho, crime rates paint a different picture of what is happening on the front end. Between 2010
and 2017, Idaho consistently ranked in the bottom three western states in terms of violent crime7, and had the
lowest rate of property crime8 each year.9,10,11
In an effort to reverse the state’s increasing incarceration rate, the Idaho legislature passed a JRI bill in 2014. A
partnership between the Bureau of Justice Assistance and the Pew Charitable Trusts, JRI seeks to lower prison
populations and associated costs by helping states address four main factors: (1) parole and probation
revocations, (2) sentencing practices, (3) ineffective community supervision, and (4) parole application denials
and processing delays.12 Although Idaho’s legislation did address all four of these factors, most of the changes
revolved around reducing the number of state prisoners who end up in custody due to a parole or probation
violation. Some notable sections of the JRI bill include targeting delivery of correctional programming to
moderate- and high-risk individuals,13 requiring IDOC and the Idaho Department of Health & Welfare to report
regularly on the state of correctional programming and the needs of IDOC’s population,14 mandating the use of
7 The FBI defines “violent crime” as murder, non-negligent manslaughter, rape, robbery, and aggravated assault. 8 The FBI defines “property crime” as burglary, larceny, and motor vehicle theft. 9 Bureau of Justice Statistics. (n.d.). Uniform crime reporting statistics [Online data explorer]. Retrieved from https://www.bjs.gov/ucrdata/ 10 Federal Bureau of Investigation. (n.d.). Crime in the United States by region, geographic division, and state, 2015-2016 [Data table]. Retrieved from https://ucr.fbi.gov/crime-in-the-u.s/2016/crime-in-the-u.s.-2016/tables/table-2 11 Federal Bureau of Investigation. (n.d.). Crime in the United States by region, geographic division, and state, 2016-2017 [Data
table]. Retrieved from https://ucr.fbi.gov/crime-in-the-u.s/2017/crime-in-the-u.s.-2017/topic-pages/tables/table-4 12 Urban Institute. (2014, January 27). Justice Reinvestment Initiative state assessment report. Retrieved from https://www.urban.org/research/publication/justice-reinvestment-initiative-state-assessment-report 13 I.C. § 19-2524. 14 I.C. § 20-216.
2,001
1,8741,635
473 511 500
221 215 226
0
500
1,000
1,500
2,000
2010 2011 2012 2013 2014 2015 2016 2017
Rat
e p
er 1
00
,00
0 R
esid
ents
Crime and Prisoner Rates in Idaho, 2010-2017
Property Crime State Prisoners Violent Crime

8 | P a g e
EBPs in community supervision,15 creating a Limited Supervision Unit within IDOC’s Division of Probation and
Parole,15 and adjusting the way the Division of Probation and Parole responds to technical violators.15,16
The JRI bill also requires IDOC to report to the legislature annually to inform policymakers on the effect JRI is
having on the justice system.17 To date, results have been mixed. The 2018 report indicated that IDOC’s prison
population has continued to increase, but it has increased at a slower rate than previously projected, and has
resulted in a cost-savings of over $21 million.18 However, parole and probation revocations continue to make
up a large proportion of the prison population. In 2017, on average, 51% of monthly admissions were
probation or parole violators. Since JRI took effect, 73% of those sentenced to IDOC custody with a “term”19
status were those who failed to complete probation, parole, or a rider20 program.
Because a majority of the state prison population in Idaho seems to be comprised of people who have had
previous involvement in the criminal justice system, recidivism metrics were written into the JRI legislation in
multiple places. PSI reports are now required to include recidivism statistics.21 IDOC also tracks revocations
and new crimes for those currently under their supervision. However, that is only one definition of recidivism
that could be used and is inherently limited in its scope. The following section explores some other possibilities
and some of the problems around defining recidivism.
Methodology of Recidivism Studies There are almost as many definitions of recidivism as there are studies of recidivism. The authors of the most
recent Bureau of Justice Statistics (BJS) recidivism study note that the definition of recidivism used for any
given study often hinges on the details of the research.22 Some factors to consider include the amount and
types of data available for use, what specific issue is being addressed by the project, and how much time is
available to complete the project. For example, the authors of the BJS study note that if they had chosen a 3-
year follow-up window (which is standard practice for most recidivism studies) instead of a 9-year window,
60% of the arrests they observed would not have been captured. They argued that by expanding the study
period, they were able to calculate a more accurate recidivism rate.
Other researchers have demonstrated the benefits of using a more detailed definition. In addition to
measuring recidivism events, a series of articles by Michael Ostermann demonstrates how recidivism rates and
characteristics of repeat offenders differ depending on the type of supervision and the type of recidivism event
is in question, among other factors. One notable finding from this series was that parolees released to
community supervision were significantly less likely to commit a new crime than those who were released
from prison without a term of community supervision, but this incapacitation effect of supervision
disappeared after parolees were discharged.23 In another study, Ostermann found that individuals released to
15 I.C. § 20-219. 16 I.C. § 20-229B. 17 I.C. § 20-250. 18 Idaho Department of Correction. (2018, February 1). Justice Reinvestment in Idaho: Impact on the state. Retrieved from https://www.idoc.idaho.gov/content/about_us/research_statistics 19 “Term” status indicates that an individual was committed, by the courts or Parole Commission, to a state prison. 20 The court can retain jurisdiction of an individual while that person completes the IDOC rider program, where he/she will participate in programming while being held in an IDOC facility. Upon completion, the court may decide whether to place the person on probation, in prison, or withhold judgement. 21 See Footnote 2 on page 1. 22 Alper, M. and Durose, M. R. (2018, May). 2018 update on prisoner recidivism: A 9-year follow-up period (2005-2014). Retrieved from https://www.bjs.gov/index.cfm?ty=pbdetail&iid=6266 23 Ostermann, M. (2013). Active supervision and its impact upon parolee recidivism rates. Crime & Delinquency, 59(4), 487-509.
9 | P a g e
discretionary parole were more likely to have their parole revoked than those under mandatory supervision.24
The more detailed analysis performed by Ostermann, in contrast to the broad definition used in the BJS study,
not only provided a different method of calculating recidivism rates, but also highlighted the effect that
community supervision may be having on recidivism.
Other studies have focused on how organizational factors can influence recidivism rates. In Connecticut,
researchers determined that a pilot program that provided intensive case management for high-risk
probationers significantly reduced the frequency of technical violations, but not the frequency of arrests.25
Another team in California found that controlling for “supervision regime”, a set of variables describing the
culture and workload of the California Department of Corrections and Rehabilitation, significantly improved
the ability to predict recidivism when included in statistical models.26
Although researchers can choose the definition that best suits their needs, a major limitation may stem from
the data itself. When relying on administrative data for research purposes, researchers are banking on the fact
that the same data sets being used for operational purposes will also be able to answer research questions.
However, this is not always true.27 Administrative data sets and case management systems are typically not
designed with researchers in mind. This could mean that the data is not detailed enough to answer some
research questions, or that the system is not tracking key pieces of information. The data could also be
ambiguous to the researcher, but not to the agency. For example, a corrections department may be tracking
how many former prisoners return to prison within a certain timeframe, but not a detailed reason for return
(e.g. technical violation, revocation for a new crime that was never prosecuted, or new conviction). When
attempting to track individuals across multiple data sets, data quality issues can hinder the ability to follow an
individual’s progress through the justice system; some data sets may not be able to be linked at all. Gaes and
colleagues27 caution researchers to be aware of the limitations their data sets may impose on their projects.
24 Ostermann, M. (2015). How do former inmates perform in the community? A survival analysis of rearrests, reconvictions, and technical parole violations. Crime & Delinquency, 61(2), 163-187. 25 Cox, S. M., Bantley, K., Roscoe, T., & Hill, B. (2008). The effects of Connecticut’s probation transition program on reducing technical violations. Justice Research and Policy, 10(1), 1-20. 26 Grattet, R., Lin, J., & Petersilia, J. (2011). Supervision regimes, risk, and official reactions to parolee deviance. Criminology, 49(2), 371-399. 27 Gaes, G. G., Luallen, J., Rhodes, W., & Edgerton, J. (2016). Classifying prisoner returns: A research note. Justice Research and Policy, 17(1), 48-70.

10 | P a g e
Data Sources The Idaho Statistical Analysis Center (ISAC) obtained administrative data from two state agencies. The Idaho
Department of Correction (IDOC) provided data on individuals under their supervision between January 1,
2010 and December 31, 2017. This data set included information on demographics, sentencing, supervision
status, movement and classification level within IDOC’s network of facilities, Level of Service Inventory –
Revised (LSI-R) scores, rehabilitative programming records, and probation/parole violations. After removing
individuals not eligible for inclusion in this study (those whose only contact with IDOC was a pre-sentence
investigation; and those who had been incarcerated, had no other contact with IDOC, and were not yet
released at the time of data collection), the study included 55,993 individuals.
The Idaho Supreme Court (ISC) subsequently attempted to match the list of individuals in IDOC’s data to
records in their system, which captures charge and case disposition information from courts within Idaho. ISC
was able to provide data for 43,724 individuals, which is 78% of the IDOC roster included in the study. Data
provided by ISC included number of charges, crime type, level (i.e. misdemeanor or felony), and charge filing
date(s) for each person, as well as amendments to and final disposition of those charges.
This report presents results from the analysis of those two data sets. IDOC data provides a rich source of
information on the characteristics of their population, while ISC data provides a mechanism for determining
recidivism rates after IDOC releases them back into their communities. Currently, IDOC tracks rates of re-
incarceration. However, this is the strictest definition of recidivism and does not capture the full range of
possible outcomes for individuals after they are released. Combining the two data sources allowed ISAC to
calculate rates for five definitions of recidivism, as well as evaluate whether other descriptive data collected by
IDOC can be used to predict who is most likely to re-offend.
Limitations All studies that rely primarily on administrative data are susceptible to data quality problems. Researchers are
reliant on the agencies from which they gather data to record all relevant information accurately and
completely. For this project, ISAC researchers, aided by the research teams at both IDOC and ISC, cleaned and
restructured the data, and any potential errors that remained were discussed with the contributing agencies
prior to analysis. However, the number of errors that went undiscovered is unknown. Similarly, some errors in
the original data were unable to be corrected and led to the removal of individuals from the study group that
would otherwise have been included.
Missing data can also present a problem in administrative data sets. In the IDOC data set, 2% of the study
sample had no sentencing records, and 4.7% were missing LSI-R scores. For these two variables, it is likely that
the data is missing because those people have been under IDOC supervision for long periods of time and the
data was not tracked when they first came to IDOC. Policy changes specifically around LSI-R assessments have
evolved over time, so those who are missing scores may not have ever had an assessment performed.
Over one-third (34.9%) of the sample had no record of being enrolled in rehabilitative programs. While that is
a large number on its face, it should be noted that IDOC only tracks these programs for those who are
incarcerated. Because IDOC administers the state prison and felony probation systems, a sizable percentage of
their population has never been incarcerated. Probationers may access programming as a result of court
orders or may pay out-of-pocket to access programs and services while on probation. IDOC’s database
currently does not have a mechanism for capturing programming accessed by probationers under these
circumstances. As a result, programming data can only be used to evaluate outcomes for those who have been
incarcerated at some point, and not for those who have only been on felony probation.

11 | P a g e
More than 20% of those under IDOC supervision during the study period were unable to be matched to
records in ISC’s database. Some reasons for mismatches between the two data systems include data entry
errors, name changes and/or aliases, common data points missing from one of the data sets, and interstate
compact supervisees (i.e. those who committed a crime in another state but are being supervised by IDOC)
being included in the IDOC data set. Individuals that could not be reliably matched in both data sets were
removed from the recidivism analysis. ISAC ran statistical tests comparing the characteristics of those who
were included versus those who were excluded and found that statistically significant group differences exist
for nearly every variable, including demographics and multiple indicators of prior criminal history. The
exclusion of those individuals further limits the strength of any conclusions drawn from the recidivism
analyses. Additionally, for the 78% that were able to be followed in ISC data, it is unknown how many charges
may have been excluded due to these same matching issues between the two data sources.
Another limitation of the original data stems from evolving data collection processes. During the study period,
both IDOC and ISC made significant changes to their data collection systems and processes. IDOC did not
maintain detailed records on circumstances surrounding probation and parole violations until late 2015, and
improved the level of detail in their programming records in 2017. Additionally, IDOC completely revamped
their rehabilitative programming following an effectiveness evaluation in 2015. ISAC researchers attempted to
restructure the data to keep as many variables as possible consistent throughout the study period; however,
some detail was lost in that process. Similarly, ISC implemented a new statewide record management system
just a few years prior to the start of this research project, which has presented the agency with its own set of
data management challenges. In both agencies, efforts to improve and streamline their data collection and
storage processes are ongoing and should result in improved data quality and ease of use of the administrative
data collected by both IDOC and ISC going forward.

12 | P a g e
Results The study sample was comprised of 55,993 individuals under IDOC supervision between January 1, 2010 and
December 31, 2017. In order to be included in the sample, they must have served at least one term of
community supervision (probation or parole) or were released from an IDOC institution during the study
period. Those who only served prison terms during the study period and had not been released prior to the
end of the study period, and thus were never at risk of recidivism, were excluded. Those whose only contact
with IDOC was as part of a pre-sentence investigation28 were also excluded from the sample.
Individual Characteristics
Demographics White males accounted for 55.1% of those under IDOC
supervision between 2010 and 2017. Overall, 76.3% were male
and 73.3% were white. Seven percent of the sample was listed
as “unknown race” or this information was missing.
The median age at which individuals first came in contact with
IDOC was 28.3 years (M = 31.2, SD = 11.0). Nearly half of those
in the study group (48.3%) were already under IDOC
supervision when the study period began; the other half were
sentenced to IDOC supervision after January 1, 2010.
Prior IDOC Supervision The majority under supervision between 2010 and 2017
(80.4%) were under IDOC supervision for the first time (their
first “supervision episode”). The remaining 19.6% had
previously been under IDOC supervision and had been
discharged after completing those sentences. Nine were on
their sixth supervision episode at the time of data collection.
IDOC assigns a status indicator to all individuals, notating the
type of supervision to which they have been sentenced. These
statuses are updated as they move through IDOC. Six of every
seven individuals under IDOC supervision (86%) had been
assigned probation status at least once (see “IDOC Status” chart
on page 13). Nearly half (47.8%) had at least one rider29 status,
38.1% had at least one term30 status, and 28.7% had at least
one parole status. The median number of statuses per person
was three (M = 4.1, SD = 3.3).
28 IDOC performs all pre-sentence investigations for the courts, regardless of whether or not the individual is ultimately sentenced to IDOC supervision. 29 See Footnote 20 for more information on riders. 30 See Footnote 19 for the definition of term status.
Gender Frequency Percent
Male 42,700 76.3%
Female 13,291 23.7%
Other 2 0.0%
Race
White 41,057 73.3%
Hispanic 7,383 13.2%
Native American 1,630 2.9%
Black 1,142 2.0%
Asian 304 0.5%
Other 471 0.8%
Unknown 4,006 7.2%
Age at First IDOC Contact
Under 18 362 0.7%
18-24 20,567 36.7%
25-34 17,848 31.9%
35-44 9,945 17.8%
45-54 5,184 9.3%
55+ 2,087 3.7%
Supervision Episodes
1st Episode 45,028 80.4%
2nd Episode 8,711 15.6%
3rd Episode 1,854 3.3%
4th Episode 340 0.6%
5th Episode 51 0.1%
6th Episode 9 0.0%
n = 55,993

13 | P a g e
Because individuals can be placed on concurrent statuses due to receiving sentences in multiple cases, status
is often not a good measure of exactly what type of supervision a given person is under at any given time.
Utilizing movement and location records, a more precise measure of time served both in an IDOC facility and
in the community was developed. Nearly all (99.6%) had been under community supervision (felony probation
or parole) at least once. The median31 total time spent on community supervision was 38.8 months (M = 46.8,
SD = 37.4). More than half (60.4%) had been incarcerated in an IDOC facility, with the median32 time served
being 22 months (M = 38.6, SD = 45.7). A small number (0.4%) had been incarcerated and discharged but were
never under community supervision.
31 Time under community supervision excludes 8,356 individuals (15% of those under community supervision) because they only had one location record, so duration could not be calculated. 32 Time incarcerated excludes 3,011 individuals (8.9% of those incarcerated) because they only had one location record, so duration could not be calculated.
86.0%
28.7%
47.8%
38.1%
Probation Status
Parole Status
Rider Status
Term Status
IDOC StatusAt Least One, At Any Time
99.6%
60.4%
60.1%
39.6%
0.4%
Community Supervision at Any Time
Incarceration at Any Time
Both Incarceration and Community Supervision
Community Supervision Only
Incarceration Only
Supervision TypesAt Least One, At Any Time

14 | P a g e
Due to the nature of IDOC’s sentencing data, it is difficult to determine the total number of charges for which
individuals were sentenced to IDOC supervision. However, IDOC does have the ability to track the number of
court cases for which each person received a felony sentence. The majority (70.8%) had only one case that
included a sentence to IDOC supervision (n = 54,874; M = 1.5; SD = 0.9); 10.2% had at least three cases. The
most frequent offense type that resulted in a felony sentence was drug offenses (43%), followed by property
offenses (31.8%), and violent offenses (22.3%). Most (83.1%) were sentenced to IDOC supervision for only one
offense type.
Risk Assessments IDOC uses the Level of Service Inventory – Revised (LSI-R) as its main risk assessment tool. The median LSI-R
score on supervisees’ first assessment was 23 (n = 53,377, M = 23.7, SD = 8.9). Additionally, IDOC uses LSI-R
domain33 scores to customize programming plans for its population. Scores are standardized in terms of the
percentage of possible points in each domain. For seven of the ten LSI-R domains, both the mean and median
scores were above the 40% threshold determined by IDOC to indicate an area of high criminogenic need.34
33 LSI-R domains include criminal history, education/employment, financial, family/marital, accommodation, leisure/recreation, companions, alcohol/drugs, emotional/personal, and attitudes. 34 Idaho Department of Correction. (2018, February 1). Justice Reinvestment in Idaho: Impact on the state. Retrieved from https://www.idoc.idaho.gov/content/about_us/research_statistics
13.1%
43.0%
31.8%
8.3%
22.3%
10.7%
31.4%
20.5%
6.6%
13.9%
Alcohol Drug Property Sexual Violent
Sentences by Offense Type
Percent with at least one offense Percent with no other offense types
18.8%
29.4%
24.2%
22.9%
Low (0-15)
Low/Moderate (16-23)
Moderate/High (24-30)
High (31+)
Initial LSI-R Scores
15 | P a g e
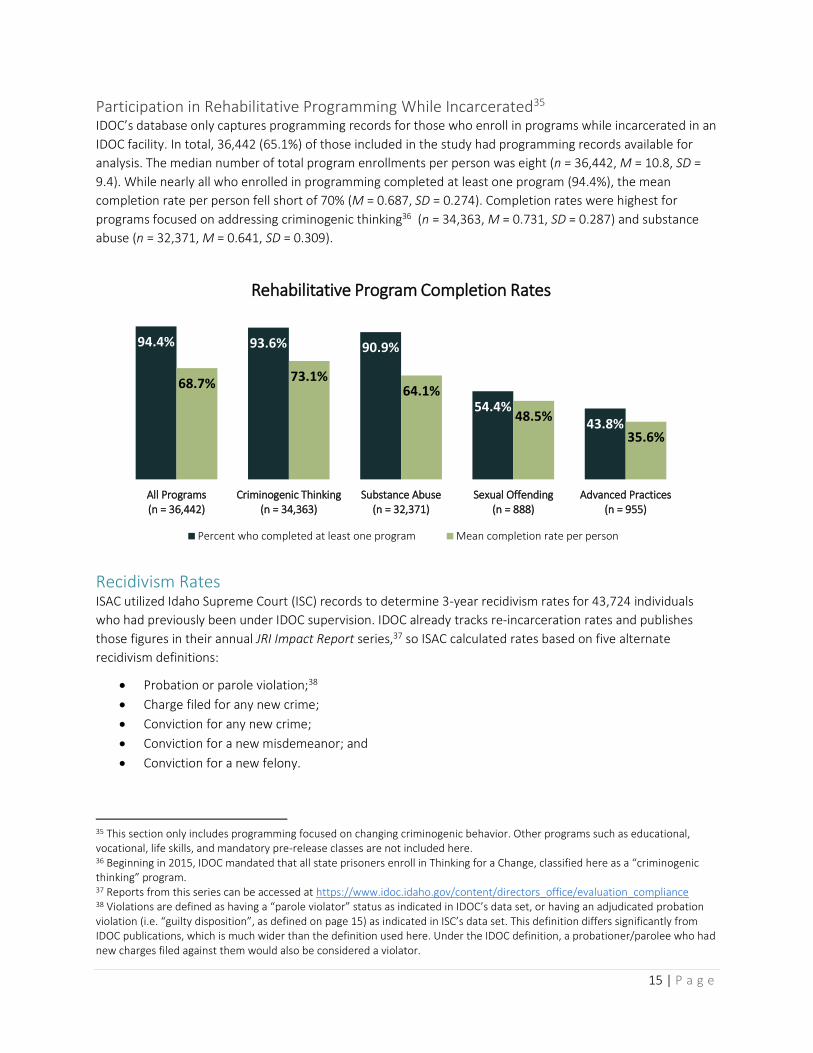
Participation in Rehabilitative Programming While Incarcerated35 IDOC’s database only captures programming records for those who enroll in programs while incarcerated in an
IDOC facility. In total, 36,442 (65.1%) of those included in the study had programming records available for
analysis. The median number of total program enrollments per person was eight (n = 36,442, M = 10.8, SD =
9.4). While nearly all who enrolled in programming completed at least one program (94.4%), the mean
completion rate per person fell short of 70% (M = 0.687, SD = 0.274). Completion rates were highest for
programs focused on addressing criminogenic thinking36 (n = 34,363, M = 0.731, SD = 0.287) and substance
abuse (n = 32,371, M = 0.641, SD = 0.309).
Recidivism Rates ISAC utilized Idaho Supreme Court (ISC) records to determine 3-year recidivism rates for 43,724 individuals
who had previously been under IDOC supervision. IDOC already tracks re-incarceration rates and publishes
those figures in their annual JRI Impact Report series,37 so ISAC calculated rates based on five alternate
recidivism definitions:
• Probation or parole violation;38
• Charge filed for any new crime;
• Conviction for any new crime;
• Conviction for a new misdemeanor; and
• Conviction for a new felony.
35 This section only includes programming focused on changing criminogenic behavior. Other programs such as educational, vocational, life skills, and mandatory pre-release classes are not included here. 36 Beginning in 2015, IDOC mandated that all state prisoners enroll in Thinking for a Change, classified here as a “criminogenic thinking” program. 37 Reports from this series can be accessed at https://www.idoc.idaho.gov/content/directors_office/evaluation_compliance 38 Violations are defined as having a “parole violator” status as indicated in IDOC’s data set, or having an adjudicated probation violation (i.e. “guilty disposition”, as defined on page 15) as indicated in ISC’s data set. This definition differs significantly from IDOC publications, which is much wider than the definition used here. Under the IDOC definition, a probationer/parolee who had new charges filed against them would also be considered a violator.
94.4% 93.6% 90.9%
54.4%43.8%
68.7% 73.1%64.1%
48.5%
35.6%
All Programs(n = 36,442)
Criminogenic Thinking(n = 34,363)
Substance Abuse(n = 32,371)
Sexual Offending(n = 888)
Advanced Practices(n = 955)
Rehabilitative Program Completion Rates
Percent who completed at least one program Mean completion rate per person

16 | P a g e
These categories are not mutually exclusive. Many individuals experienced recidivism events in multiple
categories, with 468 (1%) experiencing all five during the three-year follow-up period. For the purposes of this
study, ISAC’s definition of “conviction” is consistent with previous ISAC reports, which includes charges for
which ISC data indicates a disposition of “guilty”, “retained jurisdiction”,39 or “diversion or treatment”.40
Recidivism rates were calculated using multiple survival analysis tools. Due to the nature of the criminal justice
system, not all people are equally “at risk” of recidivism. For example, to be considered “at risk”, an individual
may be supervised in the community, but must not be incarcerated. IDOC’s data on movement and status
allowed ISAC to determine exactly when each person was “at risk”, and when they were not due to being re-
incarcerated. Survival analysis allows researchers to account for these gaps in “at risk” time, as well as predict
unobserved patterns due to individuals not being able to be observed for the entire study period (known as
“right-censoring”). Survival analysis also allows for the consideration of other factors that may be influencing
recidivism patterns, such as demographics and individual criminal histories.
The following analyses41 focus mainly on three statistical tests from the survival analysis toolbox: the Kaplan-
Meier failure function, the Nelson-Aalen cumulative hazard function, and Cox regression models. Failure and
hazard functions predict individuals’ risk of “failure”; in this case, recidivism. The failure function only allows
for one failure per person and can be interpreted as the percentage of the at-risk group who are predicted to
recidivate at least once during the study period. The failure function also indicates the predicted timing of that
first failure. The hazard function allows for repeated failures, or multiple recidivism events. Here, the function
is best thought of as the rate of recidivism events predicted within the study population at a given time. Cox
regression models examine possible predictors of failure. Combined with the hazard function, Cox regression
results can help researchers determine characteristics of those who are most likely to fail and how quickly
multiple failures might occur. All three statistics also take “at risk” time into account. Particularly, the failure
function can be compared to the actual number of observed failures to determine how right-censoring might
be hiding failure events that would have been observed if all individuals had been able to be followed for the
entire duration of the study.
39 ISC’s “retained jurisdiction” and IDOC’s “rider” status are equivalent. See Footnote 20 for more information on riders. 40 A “diversion or treatment” disposition typically indicates the defendant was referred to or enrolled in a problem-solving court program, such as drug court or mental health court. 41 Full results from all of the statistical models can be found in the Appendices.

17 | P a g e
Probation or Parole Violation42 Of the 43,724 individuals who were followed in ISC data, 3,775 (8.6%) committed at least one probation or
parole violation within three years of being placed on felony probation or released from an IDOC facility. The
Kaplan-Meier failure function for probation/parole violations is 0.101, meaning that had a full three-year
follow-up period been available for the entire group, the expected percentage with at least one violation is
10.1%.
The Nelson-Aalen cumulative hazard function of 0.107 indicates that a small number of individuals are
expected to commit at least two violations within the three-year period. Cox regression results indicate that
the model is predictive of recidivism when taking age at becoming at-risk, gender, race, and LSI-R score into
account; however, race was not a significant predictor. Males are 2.2 times more likely than females to commit
a probation or parole violation, and each one-year increase in age increases the risk of a probation/parole
violation by 0.4%. Similarly, each one-point increase in LSI-R score increases the risk of a violation by 0.4%.
42 Violations are defined as having a “parole violator” status as indicated in IDOC’s data set, or having an adjudicated probation
violation (i.e. “guilty disposition”, as defined on page 15) as indicated in ISC’s data set. This definition differs significantly from IDOC publications, which is much wider than the definition used here. Under the IDOC definition, a probationer/parolee who had new charges filed against them would also be considered a violator. It should be noted that 90% of those who violated probation or parole within three years also had new charges filed against them, meaning that the vast majority of probation/parole violators experienced multiple types of recidivism events as defined in this study.
0.086
0.101
0.107
0.000
0.020
0.040
0.060
0.080
0.100
0.120
0 1 2 3 4 5 6 7 8 9 10 11 12 13 14 15 16 17 18 19 20 21 22 23 24 25 26 27 28 29 30 31 32 33 34 35 36
Months At Risk
Three-Year Recidivism RatesProbation/Parole Violation
Actual Observations Failure Function Cumulative Hazard Function

18 | P a g e
Charge Filed for Any New Crime Of the 43,724 individuals who were followed in ISC data, 16,057 (36.7%) were charged with at least one new
crime within three years of being placed on felony probation or released from an IDOC facility. The Kaplan-
Meier failure function for new charges is 0.413, meaning that had a full three-year follow-up period been
available for the entire group, the expected percentage with at least one new charge is 41.3%.
The Nelson-Aalen cumulative hazard function of 0.533 indicates that some individuals are expected to be
charged with at least two new crimes within the three-year period. Cox regression results indicate that the
model is predictive of recidivism when taking age at becoming at-risk, gender, race, and LSI-R score into
account; however, only age and gender were significant predictors. Males are 27% more likely than females to
be charged with a new crime, and each one-year decrease in age increases the risk of a new charge by 2%.
0.367
0.413
0.533
0.000
0.100
0.200
0.300
0.400
0.500
0.600
0 1 2 3 4 5 6 7 8 9 10 11 12 13 14 15 16 17 18 19 20 21 22 23 24 25 26 27 28 29 30 31 32 33 34 35 36
Months At Risk
Three-Year Recidivism RatesNew Charge Filed
Actual Observations Failure Function Cumulative Hazard Function

19 | P a g e
Conviction for Any New Crime Of the 43,724 individuals who were followed in ISC data, 13,792 (31.5%) were convicted of at least one new
crime within three years of being placed on felony probation or released from an IDOC facility. The Kaplan-
Meier failure function for new convictions is 0.359, meaning that had a full three-year follow-up period been
available for the entire group, the expected percentage with at least one new conviction is 35.9%.
The Nelson-Aalen cumulative hazard function of 0.444 indicates that some individuals are expected to be
convicted of at least two new crimes within the three-year period. Cox regression results indicate that the
model is predictive of recidivism when taking age at becoming at-risk, gender, race, and LSI-R score into
account; however, only age and gender were significant predictors. Males are 30% more likely than females to
be convicted of a new crime, and each one-year decrease in age increases the risk of a new conviction by 2%.
0.315
0.359
0.444
0.000
0.050
0.100
0.150
0.200
0.250
0.300
0.350
0.400
0.450
0.500
0 1 2 3 4 5 6 7 8 9 10 11 12 13 14 15 16 17 18 19 20 21 22 23 24 25 26 27 28 29 30 31 32 33 34 35 36
Months At Risk
Three-Year Recidivism RatesNew Conviction
Actual Observations Failure Function Cumulative Hazard Function

20 | P a g e
Conviction for New Misdemeanor Of the 43,724 individuals who were followed in ISC data, 10,948 (25.0%) were convicted of at least one new
misdemeanor within three years of being placed on felony probation or released from an IDOC facility. The
Kaplan-Meier failure function for new misdemeanor convictions is 0.288, meaning that had a full three-year
follow-up period been available for the entire group, the expected percentage with at least one new
misdemeanor conviction is 28.8%.
The Nelson-Aalen cumulative hazard function of 0.340 indicates that some individuals are expected to be
convicted of at least two new misdemeanors within the three-year period. Cox regression results indicate that
the model is predictive of recidivism when taking age at becoming at-risk, gender, race, and LSI-R score into
account; however, LSI-R score was not a significant predictor. Males are 30% more likely than females to be
convicted of a new misdemeanor, non-Whites are 6% more likely to be convicted of a new misdemeanor, and
each one-year decrease in age increases the risk of a new misdemeanor conviction by 2%.
0.250
0.288
0.340
0.000
0.050
0.100
0.150
0.200
0.250
0.300
0.350
0.400
0 1 2 3 4 5 6 7 8 9 10 11 12 13 14 15 16 17 18 19 20 21 22 23 24 25 26 27 28 29 30 31 32 33 34 35 36
Months At Risk
Three-Year Recidivism RatesNew Misdemeanor Conviction
Actual Observations Failure Function Cumulative Hazard Function

21 | P a g e
Conviction for New Felony Of the 43,724 individuals who were followed in ISC data, 4,656 (10.7%) were convicted of at least one new
felony within three years of being placed on felony probation or released from an IDOC facility. The Kaplan-
Meier failure function for new felony convictions is 0.126, meaning that had a full three-year follow-up period
been available for the entire group, the expected percentage with at least one new felony conviction is 12.6%.
The Nelson-Aalen cumulative hazard function of 0.135 indicates that a small number of individuals are
expected to be convicted of at least two new felonies within the three-year period. Cox regression results
indicate that the model is predictive of recidivism when taking age at becoming at-risk, gender, race, and LSI-R
score into account; however, only age and gender were significant predictors. Males are 30% more likely than
females to be convicted of a new felony, and each one-year decrease in age increases the risk of a new felony
conviction by 2%.
0.106
0.126
0.135
0.000
0.020
0.040
0.060
0.080
0.100
0.120
0.140
0.160
0 1 2 3 4 5 6 7 8 9 10 11 12 13 14 15 16 17 18 19 20 21 22 23 24 25 26 27 28 29 30 31 32 33 34 35 36
Months At Risk
Three-Year Recidivism RatesNew Felony Conviction
Actual Observations Failure Function Cumulative Hazard Function

22 | P a g e
Conclusions and Policy Recommendations This study sought to fill gaps in knowledge of recidivism patterns among IDOC’s supervised population by
comparing multiple definitions of recidivism. Using data from two administrative data sets provided by the
Idaho Department of Correction (IDOC) and the Idaho Supreme Court (ISC), The Idaho Statistical Analysis
Center (ISAC) calculated recidivism rates and constructed predictive models for five definitions of recidivism,
all of which differ from IDOC’s current definition (i.e. incarceration in an IDOC facility).
Although the total number expected to recidivate43 varies widely depending on the type of offense that
qualifies as a recidivism event, patterns of reoffending are strikingly similar across the five definitions. Of those
who are expected to recidivate within three years of becoming “at risk”, about 40% are expected to do so
within their first year; roughly one-third will reoffend in year two, and just over a quarter will reoffend in year
three. This pattern is stable across all definitions evaluated by ISAC except for new felony convictions; in that
category, the timing of the first offense is spread more evenly throughout the three-year period, with slightly
fewer expected to occur in year one and slightly more in year two.
43 These comparisons utilize the Kaplan-Meier failure functions previously presented for each definition. Please see page 17 for a detailed definition of “probation/parole violation”, as the definition used here does not match IDOC’s definition. IDOC re-incarceration rates are an average of cohort rates between Fiscal Years 2010 and 2017, as presented in their JRI Impact Report series. IDOC does not report 2-year recidivism rates.
4.2%
17.5%
14.4%
11.5%
3.7%
14.6%
7.1%
30.9%
26.4%
20.9%
8.4%
10.1%
41.3%
35.9%
28.8%
12.6%
33.9%
Probation/Parole Violation
New Charge
New Conviction: Any
New Conviction: Misdemeanor
New Conviction: Felony
IDOC Re-incarceration
Comparison of Recidivism Definitions1-Year, 2-Year, and 3-Year Expected Failure Rates43
1 Year 2 Years 3 Years

23 | P a g e
IDOC’s own recidivism statistics, published annually in their JRI Impact Report series44, follow the same pattern,
despite the fact that those rates are calculated using a different method than that used by ISAC for this report.
IDOC calculates cohort rates based on year of release. The average one-year re-incarceration rate for those
released between Fiscal Years 2010 and 2017 was 14.6%, and the average three-year rate during the same
time was 33.9%. Those rates closely mirror the failure functions for any new conviction, indicating that the
patterns of reoffending predicted by the failure functions are a sound estimate of actual recidivism patterns
that exist in IDOC’s supervised and/or formerly incarcerated population.
Although nearly 45,000 people were able to be included in the recidivism analysis, concerns with data quality
and linking between data sets limited both the number that could be included in the recidivism analyses, as
well as the predictor variables included in the Cox regression analyses. Notably, the inability to include
rehabilitative programming data in the regression models because IDOC only captures programming data on
their incarcerated population means that a key piece of information was excluded from these models. The goal
of those programs is to reduce criminogenic needs, and by extension, recidivism. Based on these analyses, it is
unknown what effect, if any, the exclusion of that data point had on the models.
Based on the results of this study, ISAC makes the following recommendations:
1. Idaho’s definition of “recidivism” should be as broad as possible, and include multiple indicators.
As the advisory body to the Governor’s Office on criminal justice policy, ISAC believes it is appropriate
for the Idaho Criminal Justice Commission (ICJC) to adopt a definition of recidivism for use in
evaluating policy and making recommendations at the state level. However, the results of this study
indicate that the definition used can have a large impact on the rates that are calculated in recidivism
studies. Additionally, ICJC is comprised of agencies from various levels of government and all three
branches. Adopting a broad definition that includes multiple indicators of recidivism will allow
researchers the flexibility to evaluate many different contexts and research questions, which will give
policymakers much more detailed and complete information about patterns of reoffending in Idaho.
2. Current efforts to improve data collection and data sharing should be continued and prioritized.
Simply connecting IDOC’s existing data to one other existing data set (i.e. ISC’s data) provided a much
more comprehensive picture of recidivism in Idaho, despite the limitations described above. Both
IDOC and ISC are in the process of upgrading their data systems, which will further improve the quality
of both agencies’ data going forward. Another encouraging development in this area is the Criminal
Justice Integrated Data System, which was passed into law during the 2020 legislative session. Both
the improvement of data collection at the agency level and the implementation of a new system
meant to facilitate data sharing will increase access to high-quality data for research purposes,
strengthen the results of those projects, and provide better-quality information to policymakers.
3. Additional research is needed to fill in the full picture of recidivism in Idaho.
As Idaho’s population grows and its correctional system continues to be stretched to capacity, using
recidivism research to determine effective interventions for reducing reoffending will become even
more important than it is currently. While this report presents more information on recidivism than
was previously available, it only scratches the surface of potential research using existing data. Future
research could use these same definitions but concentrate on differences in recidivism patterns
between those who commit different types of crimes, for example. Other research might examine
44 IDOC’s JRI Impact Report series can be found at https://www.idoc.idaho.gov/content/directors_office/evaluation_compliance

24 | P a g e
whether patterns are different depending on which part of the state an individual is released to, what
types of supervision they have experienced (e.g. differences between probationers and parolees), or
what types of programming they completed while they were supervised. All of these areas were
outside the scope of this report but could possibly be examined using the same data sets.
Furthermore, as data systems and data sharing are improved in the near future, even more research
questions that are not feasible to study with current data will become easier to answer.

25 | P a g e
Appendix A: Failure and Hazard Functions The following sections present the results of statistical modeling based on the three-year follow-up period
utilizing Idaho Supreme Court records. Failure and cumulative hazard functions by month of expected failure,
as well as the rate of observed failures, for each of the five recidivism definitions evaluated for this project are
presented first. For each month, the “Observed Failures” column presents the number of people who
experienced their first recidivism event during that month, and the “Observed Rate” is the cumulative
recidivism rate observed in the Idaho Supreme Court data set. The “Failure Function” (Kaplan-Meier failure
function) represents the cumulative rate of first recidivism events as predicted by the models, and the
“Cumulative Hazard Function” (Nelson-Aalen cumulative hazard function) is the cumulative predicted rate of
recidivism events in the at-risk population when multiple events per person are allowed (the other rates allow
for only one event per person). When combined with the results of Cox regression models (see Appendix B),
predictions can be made about who is more likely to experience a recidivism event faster, as well as who is
more likely to recidivate.

26 | P a g e
Probation/Parole Violation Overall, 3,775 (8.6%) individuals committed at least one probation or parole violation within three years (see
page 17 for ISAC’s definition of “violation”). The Kaplan-Meier failure function at three years was 0.101; the
expected recidivism rate for this definition is 10.1%. The Nelson-Aalen cumulative hazard function was 0.107,
indicating that some individuals are predicted to commit multiple violations within three years.
Month Observed Failures Observed Rate Failure Function Cumulative Hazard Function
1 63 0.0014 0.0015 0.0015
2 143 0.0047 0.0048 0.0048
3 152 0.0082 0.0084 0.0084
4 171 0.0121 0.0124 0.0125
5 176 0.0161 0.0167 0.0168
6 164 0.0199 0.0206 0.0208
7 152 0.0234 0.0243 0.0246
8 169 0.0272 0.0284 0.0288
9 145 0.0305 0.0320 0.0325
10 113 0.0331 0.0348 0.0354
11 132 0.0361 0.0381 0.0388
12 140 0.0393 0.0416 0.0425
13 105 0.0417 0.0442 0.0452
14 109 0.0442 0.0470 0.0482
15 99 0.0465 0.0496 0.0508
16 109 0.0490 0.0524 0.0538
17 92 0.0511 0.0548 0.0564
18 87 0.0531 0.0571 0.0588
19 65 0.0546 0.0589 0.0607
20 94 0.0567 0.0614 0.0634
21 86 0.0587 0.0638 0.0659
22 83 0.0606 0.0661 0.0684
23 91 0.0627 0.0686 0.0711
24 87 0.0647 0.0711 0.0737
25 88 0.0667 0.0737 0.0765
26 90 0.0687 0.0764 0.0795
27 71 0.0704 0.0785 0.0818
28 82 0.0722 0.0811 0.0845
29 86 0.0742 0.0837 0.0874
30 87 0.0762 0.0865 0.0904
31 75 0.0779 0.0889 0.0931
32 82 0.0798 0.0916 0.0960
33 72 0.0814 0.0939 0.0986
34 76 0.0832 0.0965 0.1014
35 67 0.0847 0.0987 0.1040
36 72 0.0863 0.1012 0.1067

27 | P a g e
Charge Filed for Any New Crime Overall, 16,057 (36.7%) individuals were charged with at least one new crime within three years. The Kaplan-
Meier failure function at three years was 0.413; the expected recidivism rate for this definition is 41.3%. The
Nelson-Aalen cumulative hazard function was 0.533, indicating that some individuals are predicted to be
charged with at least two new crimes within three years.
Month Observed Failures Observed Rate Failure Function Cumulative Hazard Function
1 370 0.0085 0.0085 0.0086
2 492 0.0197 0.0200 0.0202
3 583 0.0330 0.0337 0.0343
4 712 0.0493 0.0506 0.0519
5 689 0.0651 0.0671 0.0694
6 726 0.0817 0.0844 0.0882
7 689 0.0975 0.1010 0.1065
8 646 0.1122 0.1166 0.1240
9 664 0.1274 0.1327 0.1424
10 589 0.1409 0.1471 0.1590
11 575 0.1540 0.1612 0.1757
12 551 0.1666 0.1747 0.1920
13 543 0.1791 0.1882 0.2084
14 490 0.1903 0.2004 0.2236
15 512 0.2020 0.2133 0.2398
16 454 0.2124 0.2248 0.2545
17 421 0.2220 0.2355 0.2684
18 442 0.2321 0.2468 0.2833
19 449 0.2424 0.2584 0.2988
20 417 0.2519 0.2692 0.3136
21 376 0.2605 0.2791 0.3271
22 349 0.2685 0.2883 0.3399
23 404 0.2777 0.2990 0.3551
24 383 0.2865 0.3093 0.3699
25 351 0.2945 0.3191 0.3842
26 318 0.3018 0.3281 0.3975
27 354 0.3099 0.3381 0.4126
28 304 0.3168 0.3469 0.4259
29 279 0.3232 0.3550 0.4383
30 297 0.3300 0.3636 0.4519
31 269 0.3362 0.3716 0.4644
32 281 0.3426 0.3800 0.4779
33 284 0.3491 0.3886 0.4918
34 263 0.3551 0.3966 0.5050
35 269 0.3612 0.4048 0.5187
36 262 0.3672 0.4130 0.5325

28 | P a g e
Conviction for Any New Crime Overall, 13,792 (31.5%) individuals were convicted of at least one new crime within three years. The Kaplan-
Meier failure function at three years was 0.359; the expected recidivism rate for this definition is 35.9%. The
Nelson-Aalen cumulative hazard function was 0.444, indicating that some individuals are predicted to be
convicted of at least two new crimes within three years.
Month Observed Failures Observed Rate Failure Function Cumulative Hazard Function
1 253 0.0058 0.0058 0.0058
2 375 0.0144 0.0146 0.0147
3 439 0.0244 0.0249 0.0252
4 565 0.0373 0.0383 0.0391
5 561 0.0502 0.0517 0.0531
6 603 0.0639 0.0662 0.0685
7 577 0.0771 0.0801 0.0835
8 554 0.0898 0.0936 0.0982
9 571 0.1029 0.1075 0.1136
10 493 0.1141 0.1195 0.1272
11 525 0.1262 0.1324 0.1420
12 471 0.1369 0.1441 0.1555
13 457 0.1474 0.1555 0.1689
14 439 0.1574 0.1665 0.1821
15 459 0.1679 0.1781 0.1961
16 409 0.1773 0.1885 0.2088
17 381 0.1860 0.1983 0.2209
18 386 0.1948 0.2082 0.2334
19 396 0.2039 0.2185 0.2465
20 373 0.2124 0.2283 0.2591
21 328 0.2199 0.2370 0.2705
22 324 0.2273 0.2457 0.2818
23 371 0.2358 0.2556 0.2952
24 322 0.2432 0.2644 0.3070
25 298 0.2500 0.2728 0.3185
26 293 0.2567 0.2812 0.3301
27 309 0.2637 0.2902 0.3426
28 266 0.2698 0.2979 0.3537
29 272 0.2760 0.3060 0.3651
30 261 0.2820 0.3137 0.3764
31 235 0.2874 0.3208 0.3867
32 254 0.2932 0.3285 0.3982
33 265 0.2993 0.3367 0.4104
34 232 0.3046 0.3439 0.4213
35 228 0.3098 0.3510 0.4323
36 247 0.3154 0.3589 0.4444

29 | P a g e
Conviction for New Misdemeanor Overall, 10,948 (25.0%) individuals were convicted of at least one new misdemeanor within three years. The
Kaplan-Meier failure function at three years was 0.288; the expected recidivism rate for this definition is
28.8%. The Nelson-Aalen cumulative hazard function was 0.340, indicating that some individuals are predicted
to be convicted of at least two new misdemeanors within three years.
Month Observed Failures Observed Rate Failure Function Cumulative Hazard Function
1 233 0.005 0.005 0.005
2 331 0.013 0.013 0.013
3 361 0.021 0.022 0.022
4 480 0.032 0.033 0.034
5 451 0.042 0.044 0.045
6 453 0.053 0.055 0.056
7 465 0.063 0.066 0.068
8 428 0.073 0.076 0.079
9 421 0.083 0.087 0.091
10 382 0.092 0.096 0.101
11 411 0.101 0.106 0.112
12 362 0.109 0.115 0.122
13 337 0.117 0.124 0.132
14 345 0.125 0.132 0.142
15 362 0.133 0.142 0.153
16 318 0.140 0.150 0.162
17 298 0.147 0.157 0.171
18 294 0.154 0.165 0.180
19 307 0.161 0.173 0.190
20 288 0.168 0.181 0.199
21 254 0.173 0.188 0.208
22 241 0.179 0.194 0.216
23 288 0.185 0.202 0.226
24 250 0.191 0.209 0.234
25 230 0.196 0.216 0.243
26 248 0.202 0.223 0.252
27 250 0.208 0.230 0.262
28 204 0.213 0.236 0.269
29 224 0.218 0.243 0.278
30 216 0.223 0.250 0.287
31 198 0.227 0.256 0.295
32 214 0.232 0.262 0.304
33 215 0.237 0.269 0.313
34 189 0.241 0.275 0.322
35 195 0.246 0.281 0.330
36 205 0.250 0.288 0.340

30 | P a g e
Conviction for New Felony Overall, 4,656 (10.6%) individuals were convicted of at least one new felony within three years. The Kaplan-
Meier failure function at three years was 0.126; the expected recidivism rate for this definition is 12.6%. The
Nelson-Aalen cumulative hazard function was 0.135, indicating that some individuals are predicted to be
convicted of at least two new felonies within three years.
Month Observed Failures Observed Rate Failure Function Cumulative Hazard Function
1 16 0.0004 0.0004 0.0004
2 44 0.0014 0.0014 0.0014
3 73 0.0030 0.0031 0.0031
4 95 0.0052 0.0054 0.0054
5 139 0.0084 0.0087 0.0087
6 170 0.0123 0.0128 0.0129
7 145 0.0156 0.0163 0.0164
8 159 0.0192 0.0202 0.0204
9 195 0.0237 0.0250 0.0253
10 156 0.0273 0.0288 0.0292
11 156 0.0308 0.0327 0.0332
12 157 0.0344 0.0366 0.0373
13 159 0.0381 0.0407 0.0416
14 156 0.0416 0.0446 0.0456
15 141 0.0448 0.0482 0.0494
16 161 0.0485 0.0524 0.0538
17 134 0.0516 0.0558 0.0575
18 157 0.0552 0.0600 0.0618
19 156 0.0588 0.0641 0.0663
20 147 0.0621 0.0681 0.0705
21 139 0.0653 0.0718 0.0745
22 145 0.0686 0.0758 0.0788
23 150 0.0720 0.0799 0.0833
24 144 0.0753 0.0839 0.0877
25 156 0.0789 0.0885 0.0926
26 131 0.0819 0.0923 0.0968
27 120 0.0846 0.0959 0.1008
28 125 0.0875 0.0996 0.1049
29 117 0.0902 0.1032 0.1089
30 107 0.0926 0.1065 0.1126
31 101 0.0949 0.1096 0.1161
32 97 0.0972 0.1127 0.1195
33 108 0.0996 0.1161 0.1234
34 113 0.1022 0.1198 0.1276
35 88 0.1042 0.1227 0.1309
36 99 0.1065 0.1260 0.1346

31 | P a g e
Appendix B: Cox Regression Models The second table in each section presents the results of Cox regression models. These models test four
predictors of recidivism (age at becoming at-risk for a recidivism event, gender, race, and LSI-R score closest to
becoming at-risk) for each of the five definitions, while also accounting for timing in a similar fashion as the
failure and hazard functions. It is important to note that some people were excluded from these regression
models if LSI-R scores were not available (4.7% of the total IDOC population did not have an LSI-R score
available). The effect of these exclusions from the models is unknown and presents a limitation on any
conclusions drawn from these analyses.
Probation/Parole Violation The overall probation/parole violation model (see page 17 for ISAC’s definition of “violation”) was statistically
significant (χ2 (4) = 345.82, p = .000, log likelihood = -39,019.683). Holding all other variables constant, the risk
of recidivism was 2.2 times higher for males than females (p = .000). Similarly, holding all other variables
constant, each one-year increase in age at becoming at-risk was associated with a 0.4% increase in the odds of
committing a probation or parole violation (p = .003), and each one-point increase in LSI-R score was
associated with a 0.4% increase in the odds of committing a violation.
95% Confidence Interval
Variable Hazard Ratio
p Lower Bound Upper Bound
Age at becoming at-risk 1.004 .003 1.001 1.007
Gender (1 = Male) 2.247 .000 2.042 2.474
Race (1 = White) 0.999 .979 0.927 1.077
LSI-R score closest to becoming at-risk 1.004 .027 1.000 1.008
n = 41,989
Charge Filed for Any New Crime The overall new charge model was statistically significant (χ2 (4) = 890.43, p = .000, log likelihood =
-162,789.48). Holding all other variables constant, the risk of recidivism was 27% higher for males than females
(p = .000). Similarly, holding all other variables constant, each one-year decrease in age at first IDOC contact
was associated with a 2% increase in the odds of being charged with a new crime (p = .000).
95% Confidence Interval
Variable Hazard Ratio
p Lower Bound Upper Bound
Age at becoming at-risk 0.980 .000 0.979 0.982
Gender (1 = Male) 1.273 .000 1.225 1.323
Race (1 = White) 0.988 .523 0.953 1.025
LSI-R score closest to becoming at-risk 1.000 .812 0.998 1.002
n = 41,989

32 | P a g e
Conviction for Any New Crime The overall new conviction model was statistically significant (χ2 (4) = 893.33, p = .000, log likelihood =
-140,117.06). Holding all other variables constant, the risk of recidivism was 30% higher for males than females
(p = .000). Similarly, holding all other variables constant, each one-year decrease in age at first IDOC contact
was associated with a 2% increase in the odds of being convicted of a new crime (p = .000).
95% Confidence Interval
Variable Hazard Ratio
p Lower Bound Upper Bound
Age at becoming at-risk 0.978 .000 0.977 0.980
Gender (1 = Male) 1.295 .000 1.242 1.351
Race (1 = White) 0.972 .149 0.934 1.010
LSI-R score closest to becoming at-risk 1.000 .741 0.998 1.002
n = 41,989
Conviction for New Misdemeanor The overall new misdemeanor conviction model was statistically significant (χ2 (4) = 871.74, p = .000, log
likelihood = -111,326.74). Holding all other variables constant, the risk of recidivism was 30% higher for males
than females (p = .000), and 6% higher for non-Whites than Whites (p = .004). Similarly, holding all other
variables constant, each one-year decrease in age at becoming at-risk was associated with a 2% increase in the
odds of being convicted of a new misdemeanor (p = .000).
95% Confidence Interval
Variable Hazard Ratio
p Lower Bound Upper Bound
Age at becoming at-risk 0.976 .000 0.974 0.977
Gender (1 = Male) 1.297 .000 1.237 1.359
Race (1 = White) 0.938 .004 0.898 0.980
LSI-R score closest to becoming at-risk 1.000 .735 0.998 1.002
n = 41,989
Conviction for New Felony The overall new felony conviction model was statistically significant (χ2 (4) = 250.04, p = .000, log likelihood =
-48,166.11). Holding all other variables constant, the risk of recidivism was 30% higher for males than females
(p = .000). Similarly, holding all other variables constant, each one-year decrease in age at becoming at-risk
was associated with a 2% increase in the odds being convicted of a new felony (p = .000).
95% Confidence Interval
Variable Hazard Ratio
p Lower Bound Upper Bound
Age at becoming at-risk 0.981 .000 0.978 0.984
Gender (1 = Male) 1.298 .000 1.207 1.395
Race (1 = White) 1.061 .087 0.991 1.136
LSI-R score closest to becoming at-risk 1.001 .609 0.998 1.004
n = 41,989