reclamation - usbr.gov pump outlet channel (dpoc): the dpoc drainage system consists of 24 wells...
TRANSCRIPT
RECLAMATIONManaging Water in the West
Calendar Year 2017

Colorado River Accounting andWater Use Report: Arizona, California, and Nevada
Calendar Year 2017
U.S. Department of the Interior Bureau of Reclamation Lower Colorado RegionBoulder Canyon Operations Office May 15, 2018

Mission Statements
Department of the Interior
The Department of the Interior protects and manages the Nation’s natural resources and cultural heritage; provides scientific and other information about those resources; and honors its trust responsibilities or special commitments to American Indians, Alaska Natives, and affiliated island communities.
Bureau of Reclamation
The mission of the Bureau of Reclamation is to manage, develop, and protect water and related resources in an environmentally and economically sound manner in the interest of the American public.

Table of Contents Location Map .............................................................................................................................. Frontispiece
Acronyms and Abbreviated Terms ............................................................................................................... 1
Glossary ........................................................................................................................................................ 2
Summary of Colorado River Water Accounting and Use Data .................................................................... 5
Monthly Storage Contents of the Colorado River System Reservoirs .......................................................... 7
Compilation of Records in Accordance with Article V of the Consolidated Decree of the United States Supreme Court in Arizona v California, 547 U.S. 150 (2006) ......................................... 8
Article V(A): Records of Releases of Water Through Regulatory Structures Controlled by the United States ............................................................................................................................................... 9
Article V(B): Records of Diversions, Return Flows, and Consumptive Use ............................................ 11
State of Arizona ..................................................................................................................................... 12
State of California .................................................................................................................................. 19
State of Nevada ...................................................................................................................................... 23
Article V(C): Records for the Disposition of Water Ordered but not Diverted ........................................ 25
State of Arizona ..................................................................................................................................... 26
State of California .................................................................................................................................. 28
Article V(D): Records of Deliveries to Mexico in Satisfaction of Part III of the 1944 Treaty Requirements, and Water Passing to Mexico in Excess of Treaty Requirements ..................................... 29
Article V(E): Records of Diversions and Consumptive Use of Water From the Mainstream of the
Gila and San Francisco Rivers for the Benefit of the Gila National Forest .............................................. 31
Information Provided in Addition to the Reporting Requirements of the Consolidated Decree ...... 32
Summary of Water Availability and Use by State .................................................................................... 33
Interstate Water Banking Within the States of Arizona, California, and Nevada ..................................... 36
Inadvertent Overruns and Paybacks Within the States of Arizona, California, and Nevada .................... 38
Lower Colorado Water Supply Project ..................................................................................................... 42
Conservation, Transfers, and Exchanges ................................................................................................... 44
Exhibit B to the Colorado River Water Delivery Agreement ................................................................... 50
Intentionally Created Surplus .................................................................................................................... 51
Documents and Letters Significant to the Delivery of and Accounting for the Use of Colorado River Water in Calendar Year 2017 .......................................................................................................... 54
Maps Identifying the General Location of Lower Colorado River Water Users ...................................... 59
I
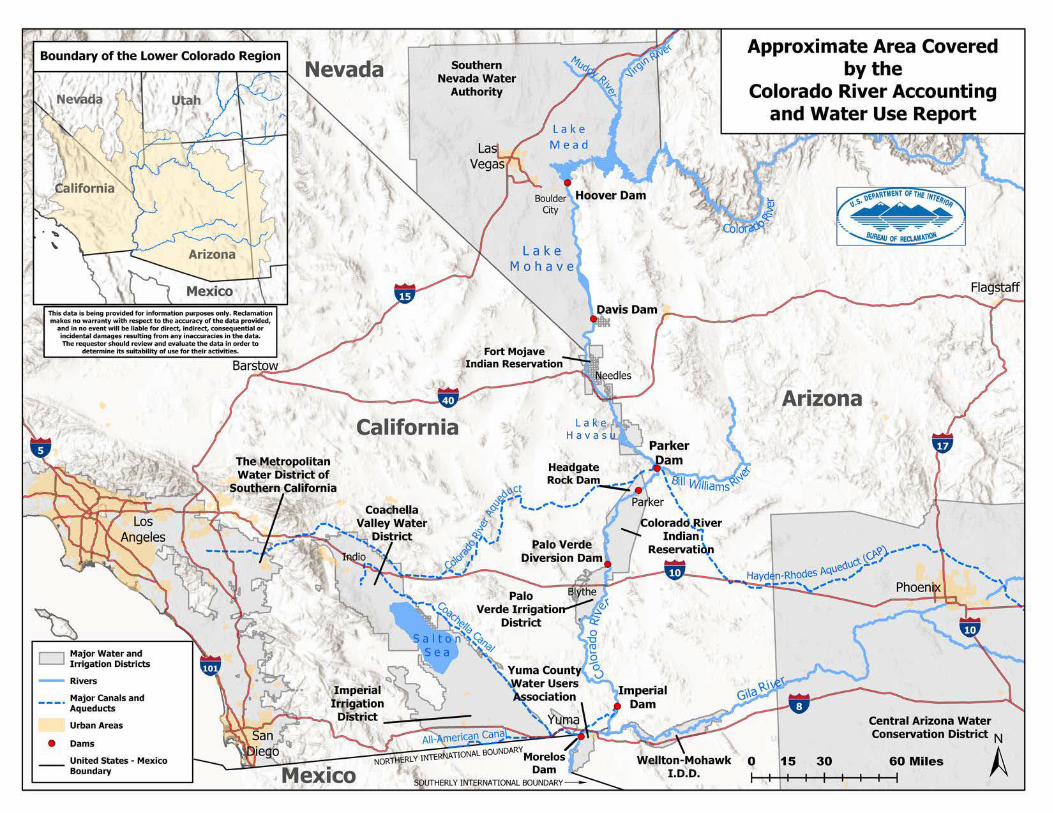
This data Is being provided for Information purposes only. Reclamation makes no warranty with respect: to the accuracy of the data provided,
and in no event will be liable for direct, lndfrect, con$e(luential or incidental damages resulting from any inaccuracies in the data. The requestor should review and evaluate the data in order to
determine its suitability of use for thejr activities.
.---, Major Water and L.......I Irrigation Districts
- Rivers
___• Major canals and Aqueducts
Urban Areas
• Dams
United States - Mexico Boundary
Approximate Area Covered Southern by the
Nevada Water I Authority Colorado River Accounting
and Water Use Report
California
Headgate Rock Dam
0~ct ,.;:,"i'"'• ..... __,,.... _..... ..__
Central Arizona Water Conservation District N
01--+-+1-+5---tf--3+-0-+--4-~60 Miles A
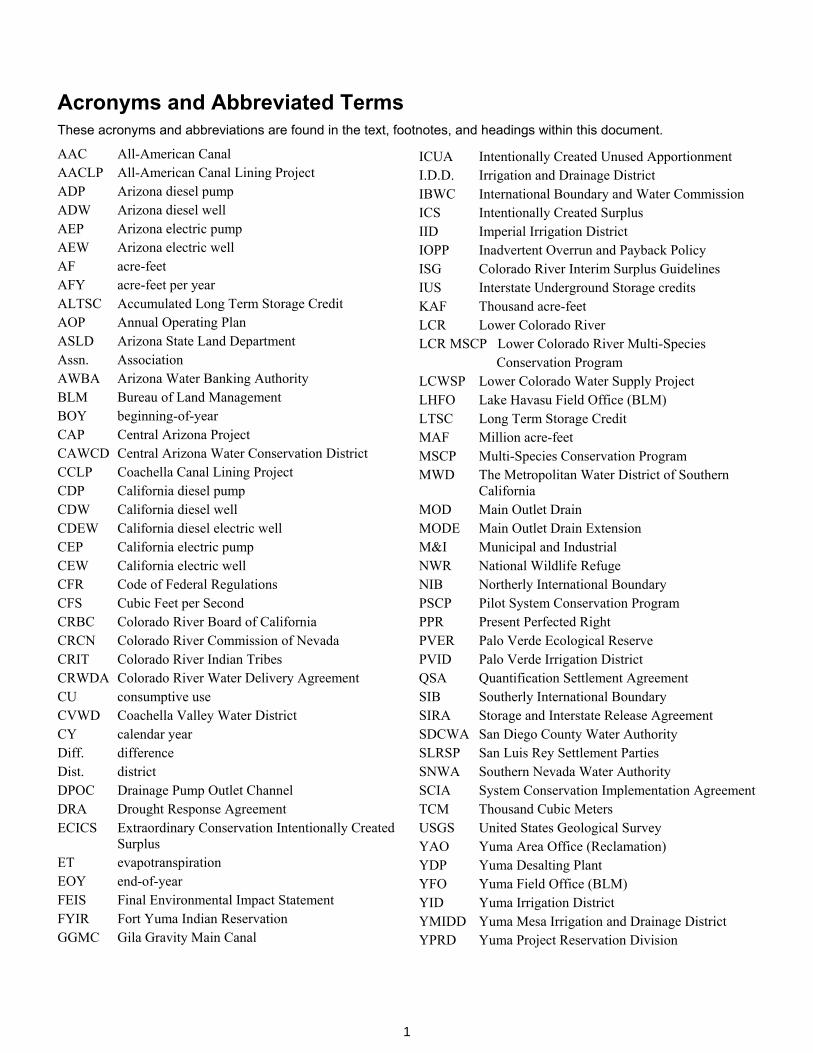
Acronyms and Abbreviated Terms These acronyms and abbreviations are found in the text, footnotes, and headings within this document.
AAC All-American Canal AACLP All-American Canal Lining Project ADP Arizona diesel pump ADW Arizona diesel well AEP Arizona electric pump AEW Arizona electric well AF acre-feet AFY acre-feet per year ALTSC Accumulated Long Term Storage Credit AOP Annual Operating Plan ASLD Arizona State Land Department Assn. Association AWBA Arizona Water Banking Authority BLM Bureau of Land Management BOY beginning-of-year CAP Central Arizona Project CAWCD Central Arizona Water Conservation District CCLP Coachella Canal Lining Project CDP California diesel pump CDW California diesel well CDEW California diesel electric well CEP California electric pump CEW California electric well CFR Code of Federal Regulations CFS Cubic Feet per Second CRBC Colorado River Board of California CRCN Colorado River Commission of Nevada CRIT Colorado River Indian Tribes CRWDA Colorado River Water Delivery Agreement CU consumptive use CVWD Coachella Valley Water District CY calendar year Diff. difference Dist. district DPOC Drainage Pump Outlet Channel DRA Drought Response Agreement ECICS Extraordinary Conservation Intentionally Created
Surplus ET evapotranspiration EOY end-of-year FEIS Final Environmental Impact Statement FYIR Fort Yuma Indian Reservation GGMC Gila Gravity Main Canal
ICUA Intentionally Created Unused Apportionment I.D.D. Irrigation and Drainage DistrictIBWC International Boundary and Water Commission ICS Intentionally Created Surplus IID Imperial Irrigation District IOPP Inadvertent Overrun and Payback Policy ISG Colorado River Interim Surplus Guidelines IUS Interstate Underground Storage credits KAF Thousand acre-feet LCR Lower Colorado River LCR MSCP Lower Colorado River Multi-Species
Conservation Program LCWSP Lower Colorado Water Supply Project LHFO Lake Havasu Field Office (BLM) LTSC Long Term Storage Credit MAF Million acre-feet MSCP Multi-Species Conservation Program MWD The Metropolitan Water District of Southern
California MOD Main Outlet Drain MODE Main Outlet Drain Extension M&I Municipal and Industrial NWR National Wildlife Refuge NIB Northerly International Boundary PSCP Pilot System Conservation Program PPR Present Perfected Right PVER Palo Verde Ecological Reserve PVID Palo Verde Irrigation District QSA Quantification Settlement Agreement SIB Southerly International Boundary SIRA Storage and Interstate Release Agreement SDCWA San Diego County Water Authority SLRSP San Luis Rey Settlement Parties SNWA Southern Nevada Water Authority SCIA System Conservation Implementation Agreement TCM Thousand Cubic Meters USGS United States Geological Survey YAO Yuma Area Office (Reclamation) YDP Yuma Desalting Plant YFO Yuma Field Office (BLM) YID Yuma Irrigation District YMIDD Yuma Mesa Irrigation and Drainage District YPRD Yuma Project Reservation Division
1
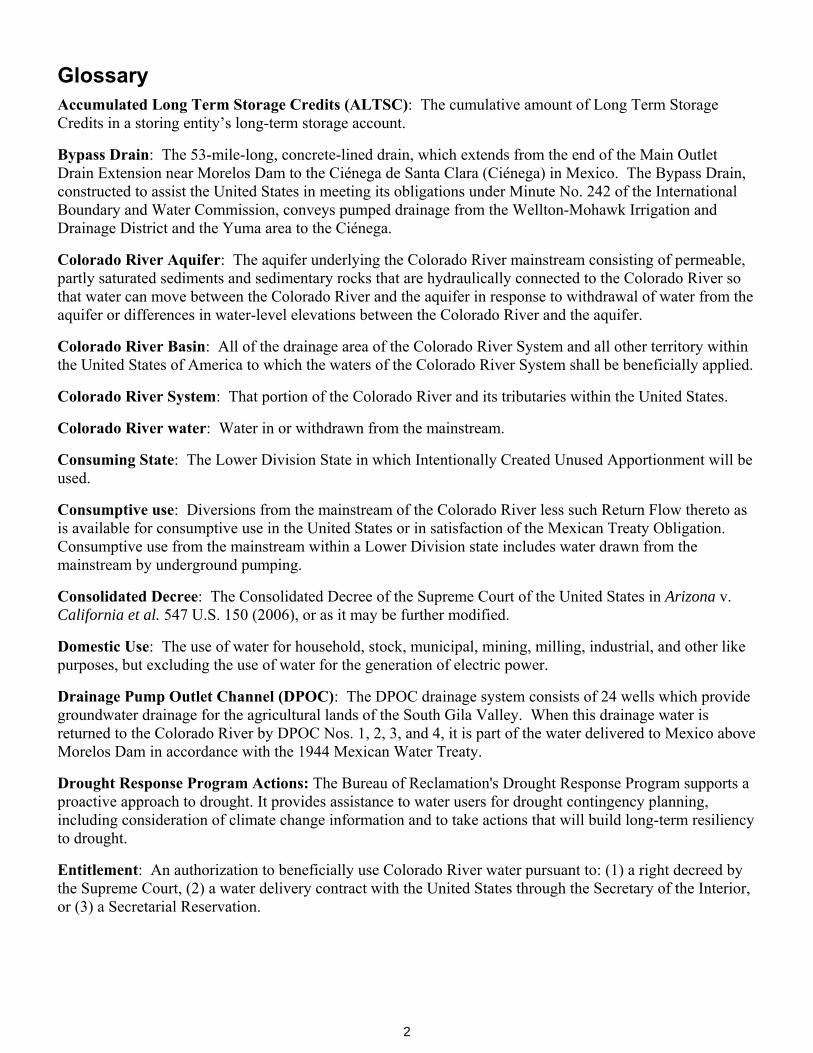
Glossary Accumulated Long Term Storage Credits (ALTSC): The cumulative amount of Long Term Storage Credits in a storing entity’s long-term storage account.
Bypass Drain: The 53-mile-long, concrete-lined drain, which extends from the end of the Main Outlet Drain Extension near Morelos Dam to the Ciénega de Santa Clara (Ciénega) in Mexico. The Bypass Drain, constructed to assist the United States in meeting its obligations under Minute No. 242 of the International Boundary and Water Commission, conveys pumped drainage from the Wellton-Mohawk Irrigation and Drainage District and the Yuma area to the Ciénega.
Colorado River Aquifer: The aquifer underlying the Colorado River mainstream consisting of permeable, partly saturated sediments and sedimentary rocks that are hydraulically connected to the Colorado River so that water can move between the Colorado River and the aquifer in response to withdrawal of water from the aquifer or differences in water-level elevations between the Colorado River and the aquifer.
Colorado River Basin: All of the drainage area of the Colorado River System and all other territory within the United States of America to which the waters of the Colorado River System shall be beneficially applied.
Colorado River System: That portion of the Colorado River and its tributaries within the United States.
Colorado River water: Water in or withdrawn from the mainstream.
Consuming State: The Lower Division State in which Intentionally Created Unused Apportionment will be used.
Consumptive use: Diversions from the mainstream of the Colorado River less such Return Flow thereto as is available for consumptive use in the United States or in satisfaction of the Mexican Treaty Obligation. Consumptive use from the mainstream within a Lower Division state includes water drawn from the mainstream by underground pumping.
Consolidated Decree: The Consolidated Decree of the Supreme Court of the United States in Arizona v. California et al. 547 U.S. 150 (2006), or as it may be further modified.
Domestic Use: The use of water for household, stock, municipal, mining, milling, industrial, and other like purposes, but excluding the use of water for the generation of electric power.
Drainage Pump Outlet Channel (DPOC): The DPOC drainage system consists of 24 wells which provide groundwater drainage for the agricultural lands of the South Gila Valley. When this drainage water is returned to the Colorado River by DPOC Nos. 1, 2, 3, and 4, it is part of the water delivered to Mexico above Morelos Dam in accordance with the 1944 Mexican Water Treaty.
Drought Response Program Actions: The Bureau of Reclamation's Drought Response Program supports a proactive approach to drought. It provides assistance to water users for drought contingency planning, including consideration of climate change information and to take actions that will build long-term resiliency to drought.
Entitlement: An authorization to beneficially use Colorado River water pursuant to: (1) a right decreed by the Supreme Court, (2) a water delivery contract with the United States through the Secretary of the Interior, or (3) a Secretarial Reservation.
2

Intentionally Created Unused Apportionment (ICUA): Unused apportionment developed consistent with the laws of the Storing State which exists solely as a result of, and would not exist except for, implementing a Storage and Interstate Release Agreement.
Inadvertent Overrun: Colorado River water diverted, pumped or received by an entitlement holder within the Lower Division States that is in excess of the water user's entitlement or approved water order for that year.
Lee Ferry: The point in the mainstream of the Colorado River one mile below the mouth of the Paria River that divides the upper and lower basins.
Live Storage: That part of the total reservoir capacity from which water can be withdrawn by gravity. This capacity is equal to the total capacity less the dead pool capacity. Dead pool is the storage volume in a reservoir that cannot be drained by gravity through a dam's outlet works, spillway, or power plant intake structures and can only be pumped out.
Lower Basin: Those parts of the States of Arizona, California, Nevada, New Mexico, and Utah within and from which waters naturally drain into the Colorado River System below Lee Ferry, and also all parts of said States located without the drainage area of the Colorado River System which are now or shall hereafter be beneficially served by waters diverted from the System below Lee Ferry.
Lower Division States: The States of Arizona, California, and Nevada.
Long Term Storage Credits (LTSC): Colorado River water that has been stored offstream pursuant to a Storage and Interstate Release Agreement and credited to a storer’s long-term storage account for use in future years.
Main Outlet Drain (MOD): A channel that conveys pumped groundwater drainage from the Wellton-Mohawk Valley to the Gila River near the confluence with the Colorado River.
Main Outlet Drain Extension (MODE): A 12-mile-long channel extending from the Main Outlet Drain that conveys drainage from the Wellton-Mohawk Irrigation and Drainage District and Yuma area to points above or below Morelos Dam. Under certain conditions it includes discharge from the DPOCs and YMC.
Mainstream: Mainstream means the main channel of the Colorado River downstream from Lee Ferry within the United States, including the reservoirs behind dams on the main channel, and Senator Wash Reservoir off the main channel.
Mexican Treaty Obligation: The United States obligation under the Treaty Between the United States of America and Mexico, “Utilization of Waters of the Colorado and Tijuana Rivers and of the Rio Grande” (1944 Mexican Water Treaty), signed February 3, 1944, including supplements to and obligations associated with Minutes of the International Boundary and Water Commission adopted pursuant to the 1944 Mexican Water Treaty.
Offstream Storage: Storage in a surface reservoir off of the mainstream or in a groundwater aquifer. Offstream storage includes indirect recharge when Colorado River water is exchanged for groundwater that otherwise would have been pumped and consumed.
Pilot System Conservation Program: A pilot program for funding the creation of Colorado River system water through voluntary water conservation and reductions in use.
3
Protective and Regulatory Pumping Unit – 242 Wellfield: A wellfield and delivery system located within a 5-mile-wide strip of land north of the United States/Mexico boundary in southwestern Arizona. The unit currently consists of 21 wells which intercept part of the groundwater underflow moving southward into Mexico from the Yuma Mesa in the United States. The groundwater recovered by the unit is collected in a conveyance system (the 242 Lateral) and is delivered to Mexico by the United States at the Southerly International Boundary as a portion of the Mexican Treaty Obligation.
Regulatory Structures: Hoover Dam, Davis Dam, Parker Dam, Headgate Rock Dam, Palo Verde Dam, Imperial Dam, Laguna Dam and all other dams and works on the mainstream controlled or operated by the United States regulating the flow of water in the mainstream or the diversion of water from the mainstream.
Return Flow: Mainstream water that has been diverted and which flows back to the Colorado River or the Colorado River Aquifer as measured or unmeasured flow, and is available for use in the United States or in satisfaction of the Mexican Treaty Obligation.
Storage and Interstate Release Agreement (SIRA): An agreement consistent with Title 43, CFR, Part 414 between the Secretary and authorized entities in two or more Lower Division States that addresses the details of: (1) Offstream storage of Colorado River water by a storing entity for future use within the Storing State; (2) Subsequent development of ICUA by the storing entity, consistent with the laws of the Storing State; (3) A request by the storing entity to the Secretary to release ICUA to the consuming entity; (4) Release of ICUA by the Secretary to the consuming entity; and (5) The inclusion of other entities that are determined by the Secretary and the storing entity and the consuming entity to be appropriate to the performance and enforcement of the agreement.
Storing State: A Lower Division State in which water is stored off the mainstream in accordance with a Storage and Interstate Release Agreement for future use in that State.
Unused Apportionment: Colorado River water within a Lower Division State's basic or surplus apportionment, or both, which is not otherwise put to beneficial consumptive use during that year within that State.
Upper Basin: Those parts of the States of Arizona, Colorado, New Mexico, Utah, and Wyoming within and from which waters naturally drain into the Colorado River System above Lee Ferry, and also all parts of said States located without the drainage area of the Colorado River System which are now or shall hereafter be beneficially served by waters diverted from the System above Lee Ferry.
Yuma Mesa Conduit: A 14.6-mile long pipeline which collects water from multiple wellfields that are part of the overall groundwater recovery and river regulation program for the Yuma area. The groundwater recovered from these wellfields is collected into the conduit and discharged either to the Yuma Desalting Plant, the MODE, the Southerly International Boundary with Mexico via the Yuma Main Drain, or the Colorado River via the Yuma Mesa Conduit Outlet, a discharge point approximately 6 miles upstream of Morelos Dam.
DISCLAIMER: Terms contained within this Glossary are defined to provide general information and are not intended to change, modify, or interpret the laws, rules, decrees, and treaties from which they are originally derived.
4
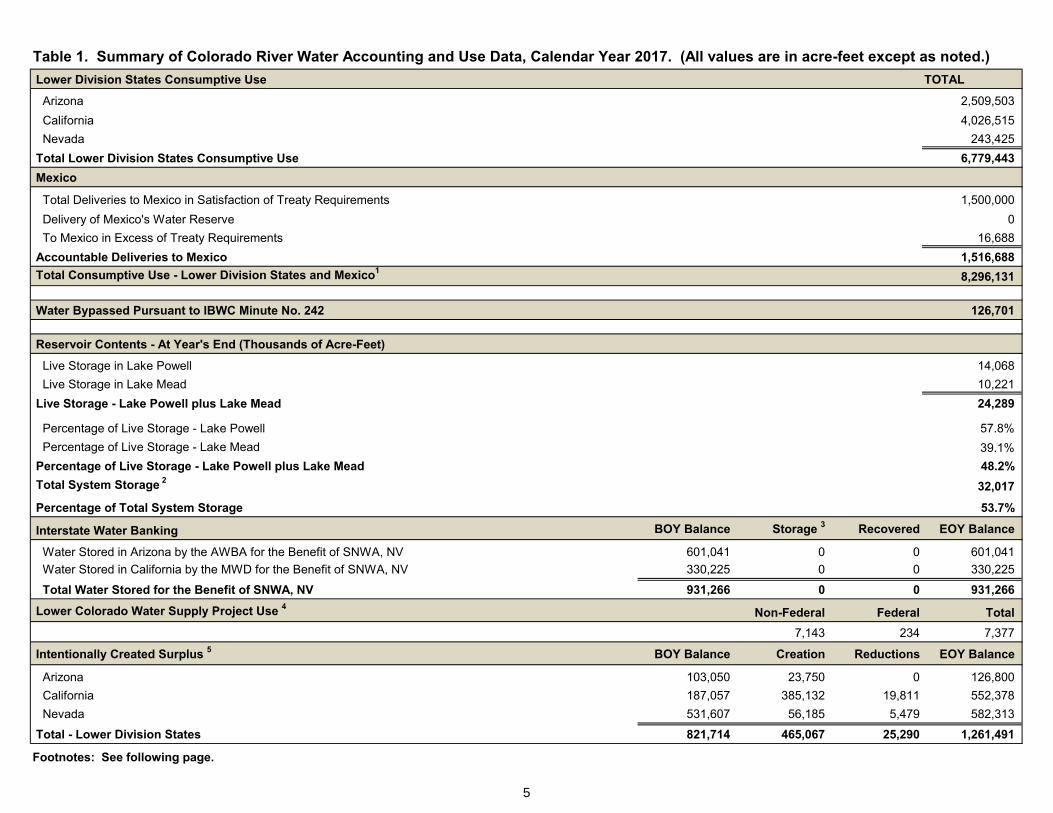
Table 1. Summary of Colorado River Water Accounting and Use Data, Calendar Year 2017. (All values are in acre-feet except as noted.)
Lower Division States Consumptive Use TOTAL
Arizona 2,509,503
California 4,026,515
Nevada 243,425
Total Lower Division States Consumptive Use 6,779,443
Mexico
Total Deliveries to Mexico in Satisfaction of Treaty Requirements 1,500,000
Delivery of Mexico's Water Reserve 0
To Mexico in Excess of Treaty Requirements 16,688
Accountable Deliveries to Mexico 1,516,688
Total Consumptive Use - Lower Division States and Mexico1 8,296,131
Water Bypassed Pursuant to IBWC Minute No. 242 126,701
Reservoir Contents - At Year's End (Thousands of Acre-Feet)
Live Storage in Lake Powell 14,068
Live Storage in Lake Mead 10,221
Live Storage - Lake Powell plus Lake Mead 24,289
Percentage of Live Storage - Lake Powell 57.8%
Percentage of Live Storage - Lake Mead 39.1%
Percentage of Live Storage - Lake Powell plus Lake Mead 48.2%
Total System Storage 2 32,017
Percentage of Total System Storage 53.7%
Interstate Water Banking BOY Balance Storage 3 Recovered EOY Balance
Water Stored in Arizona by the AWBA for the Benefit of SNWA, NV 601,041 0 0 601,041
Water Stored in California by the MWD for the Benefit of SNWA, NV 330,225 0 0 330,225
Total Water Stored for the Benefit of SNWA, NV 931,266 0 0 931,266
Lower Colorado Water Supply Project Use 4 Non-Federal Federal Total
7,143 234 7,377
Intentionally Created Surplus 5 BOY Balance Creation Reductions EOY Balance
Arizona 103,050 23,750 0 126,800
California 187,057 385,132 19,811 552,378
Nevada 531,607 56,185 5,479 582,313
Total - Lower Division States 821,714 465,067 25,290 1,261,491
Footnotes: See following page.
5
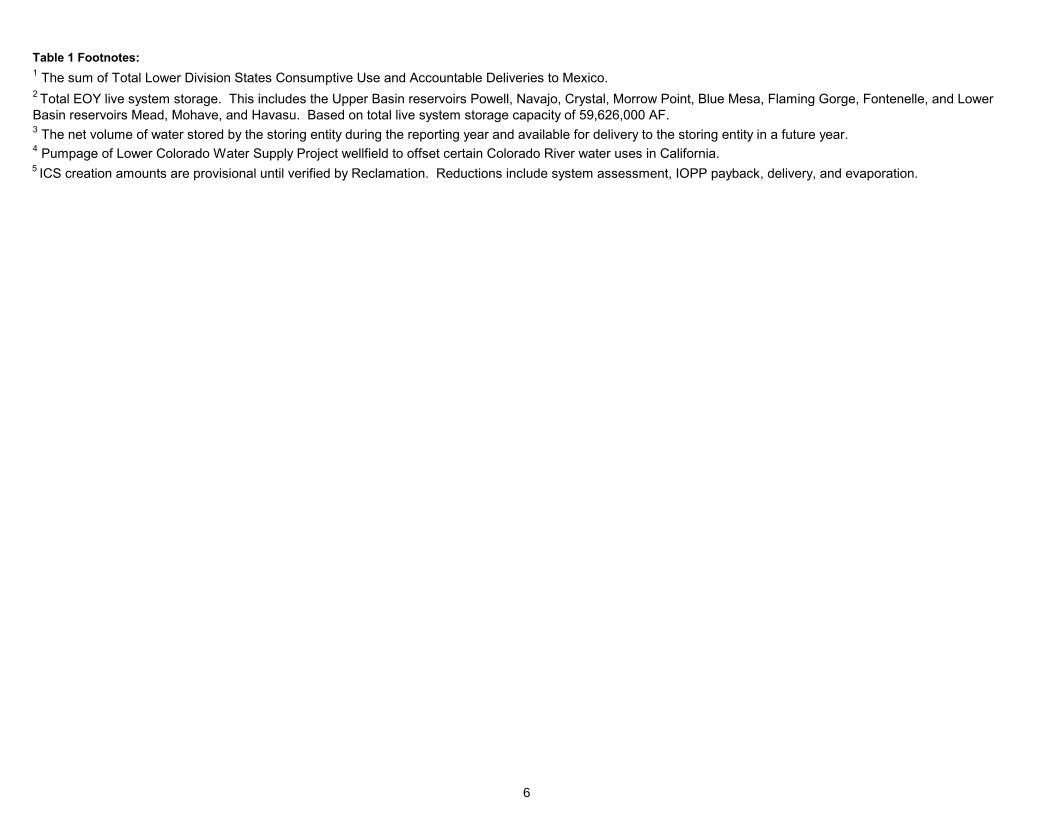
Table 1 Footnotes: 1 The sum of Total Lower Division States Consumptive Use and Accountable Deliveries to Mexico. 2 Total EOY live system storage. This includes the Upper Basin reservoirs Powell, Navajo, Crystal, Morrow Point, Blue Mesa, Flaming Gorge, Fontenelle, and Lower Basin reservoirs Mead, Mohave, and Havasu. Based on total live system storage capacity of 59,626,000 AF. 3 The net volume of water stored by the storing entity during the reporting year and available for delivery to the storing entity in a future year. 4 Pumpage of Lower Colorado Water Supply Project wellfield to offset certain Colorado River water uses in California. 5 ICS creation amounts are provisional until verified by Reclamation. Reductions include system assessment, IOPP payback, delivery, and evaporation.
6

2016 EOY Balance JAN FEB MAR APR MAY JUN JUL AUG SEP OCT NOV DEC CHANGE
1 End of Month Live Storage
Lake Powell2 Percentage of Lake Powell Live Storage
11,797
48.5%
11,359
46.7%
11,217
46.1%
11,364
46.7%
12,149
50.0%
13,667
56.2%
15,408
63.3%
15,385
63.3%
14,952
61.5%
14,664
60.3%
14,530
59.7%
14,332
58.9%
14,068
57.8%
2,271
9%
Lake Mead3 Percentage of Lake Mead Live Storage
10,079
38.6%
10,521
40.3%
10,838
41.5%
10,707
41.0%
10,420
39.9%
10,141
38.8%
9,971
38.2%
9,931
38.0%
10,131
38.8%
10,182
39.0%
10,202
39.1%
10,090
38.6%
10,221
39.1%
142
1%
Total Live Storage - Lake Powell and Lake MeadTotal Percent of Live Storage - Lake Powell and Lake Mead
21,87643.4%
21,88043.4%
22,05543.7%
22,07143.8%
22,56944.7%
23,80847.2%
25,37950.3%
25,31650.2%
25,08349.7%
24,84649.3%
24,73249.0%
24,42248.4%
24,28948.2%
2,4135%
Lake Mohave Lake Havasu
1,653573
1,712567
1,690586
1,718577
1,684594
1,719586
1,699588
1,744592
1,689585
1,603564
1,512548
1,619577
1,636557
-17-16
4 Reservoir Storage in the Lower Basin 5 Percentage of Live Storage in the Lower Basin
12,305
43.1%
12,800
44.8%
13,114
45.9%
13,002
45.5%
12,698
44.5%
12,446
43.6%
12,258
42.9%
12,267
43.0%
12,405
43.5%
12,349
43.3%
12,262
43.0%
12,286
43.0%
12,414
43.5%
109
0.4%
Lower Basin Storage plus Lake Powell 6
Percentage of Live Storage, Lower Basin plus Lake Powell 724,102
45.6%
24,159
45.7%
24,331
46.0%
24,366
46.1%
24,847
47.0%
26,113
49.4%
27,666
52.3%
27,652
52.3%
27,357
51.7%
27,013
51.1%
26,792
50.7%
26,618
50.3%
26,482
50.1%
2,380
5%
8 Total System Storage
Percentage of Total System Storage 929,451
49.4%
29,452
49.4%
29,625
49.7%
29,899
50.1%
30,440
51.1%
31,706
53.2%
33,705
56.5%
33,817
56.7%
33,428
56.1%
32,918
55.2%
32,610
54.7%
32,358
54.3%
32,017
53.7%
2,566
4%
Footnotes: 1 Actual values may differ from the displayed values due to rounding and being displayed to the nearest thousand acre-feet.2 Percentage of total live storage capacity available in Lake Powell. Based on total live storage capacity of 24,322,000 AF. 3 Percentage of total live storage capacity available in Lake Mead. Based on total live storage capacity of 26,120,000 AF. 4 The sum of end-of-month storage in reservoirs Mead, Mohave, and Havasu.5 The percentage of available live storage capacity held in the Lower Basin (Lakes Mead, Mohave and Havasu). Based on total live storage capacity of 28,549,000 AF. 6 The sum of end-of-month storage in Lake Powell (Upper Basin) and Lakes Mead, Mohave and Havasu (Lower Basin).7 The percentage of available total live storage capacity held in Lake Powell (Upper Basin) and Lakes Mead, Mohave, and Havasu (Lower Basin). Based on total live storage capacity of 52,871,000 AF.8 Total end-of-month system storage; includes Reclamation reservoirs in the Upper and Lower Basins of the Colorado River system. 9 The percentage of total end-of-month system storage. This includes the Upper Basin Lakes Powell, Navajo, Crystal, Morrow Point, Blue Mesa, Flaming Gorge, Fontenelle, and Lower Basin Lakes Mead, Mohave, and Havasu. Based on total live system storage capacity of 59,626,000 AF.
Table 2. Monthly Storage Contents of the Colorado River System Reservoirs, Calendar Year 2017. (Values in thousand acre-feet except as noted.)
7
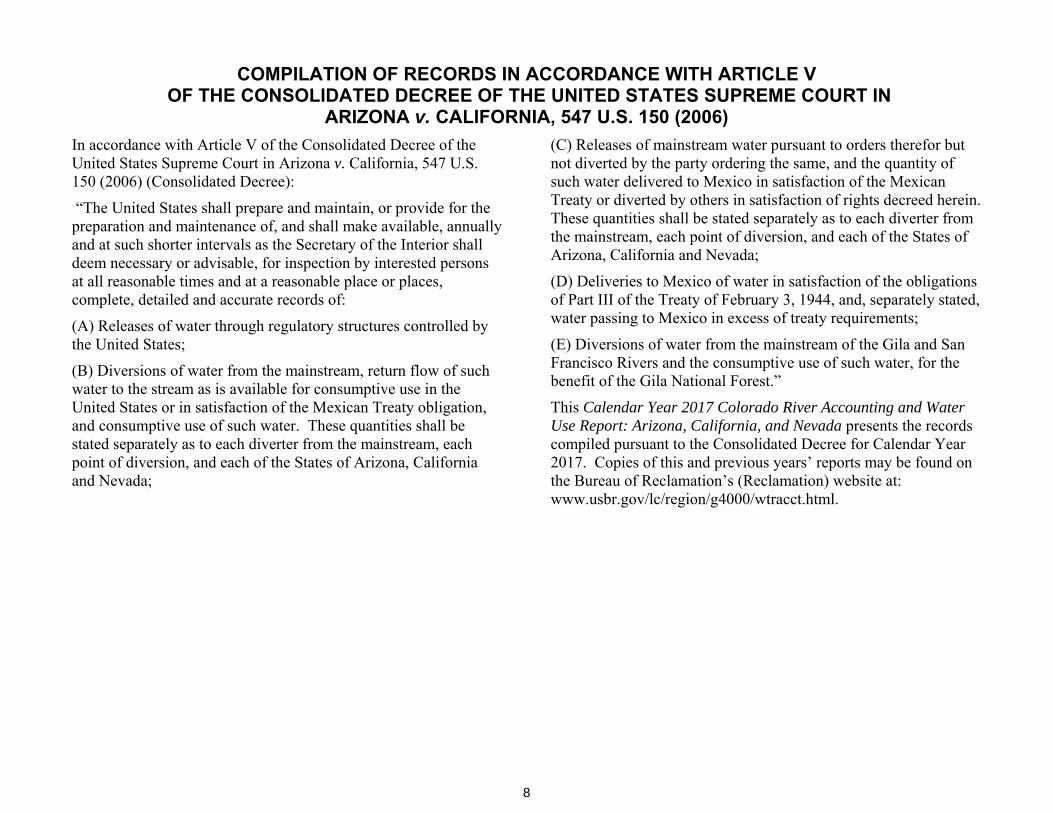
COMPILATION OF RECORDS IN ACCORDANCE WITH ARTICLE V OF THE CONSOLIDATED DECREE OF THE UNITED STATES SUPREME COURT IN
ARIZONA v. CALIFORNIA, 547 U.S. 150 (2006)
In accordance with Article V of the Consolidated Decree of the United States Supreme Court in Arizona v. California, 547 U.S. 150 (2006) (Consolidated Decree):
“The United States shall prepare and maintain, or provide for the preparation and maintenance of, and shall make available, annually and at such shorter intervals as the Secretary of the Interior shall deem necessary or advisable, for inspection by interested persons at all reasonable times and at a reasonable place or places, complete, detailed and accurate records of:
(A) Releases of water through regulatory structures controlled by the United States;
(B) Diversions of water from the mainstream, return flow of such water to the stream as is available for consumptive use in the United States or in satisfaction of the Mexican Treaty obligation, and consumptive use of such water. These quantities shall be stated separately as to each diverter from the mainstream, each point of diversion, and each of the States of Arizona, California and Nevada;
(C) Releases of mainstream water pursuant to orders therefor but not diverted by the party ordering the same, and the quantity of such water delivered to Mexico in satisfaction of the Mexican Treaty or diverted by others in satisfaction of rights decreed herein. These quantities shall be stated separately as to each diverter from the mainstream, each point of diversion, and each of the States of Arizona, California and Nevada;
(D) Deliveries to Mexico of water in satisfaction of the obligations of Part III of the Treaty of February 3, 1944, and, separately stated, water passing to Mexico in excess of treaty requirements;
(E) Diversions of water from the mainstream of the Gila and San Francisco Rivers and the consumptive use of such water, for the benefit of the Gila National Forest.”
This Calendar Year 2017 Colorado River Accounting and Water Use Report: Arizona, California, and Nevada presents the records compiled pursuant to the Consolidated Decree for Calendar Year 2017. Copies of this and previous years’ reports may be found on the Bureau of Reclamation’s (Reclamation) website at: www.usbr.gov/lc/region/g4000/wtracct.html.
8
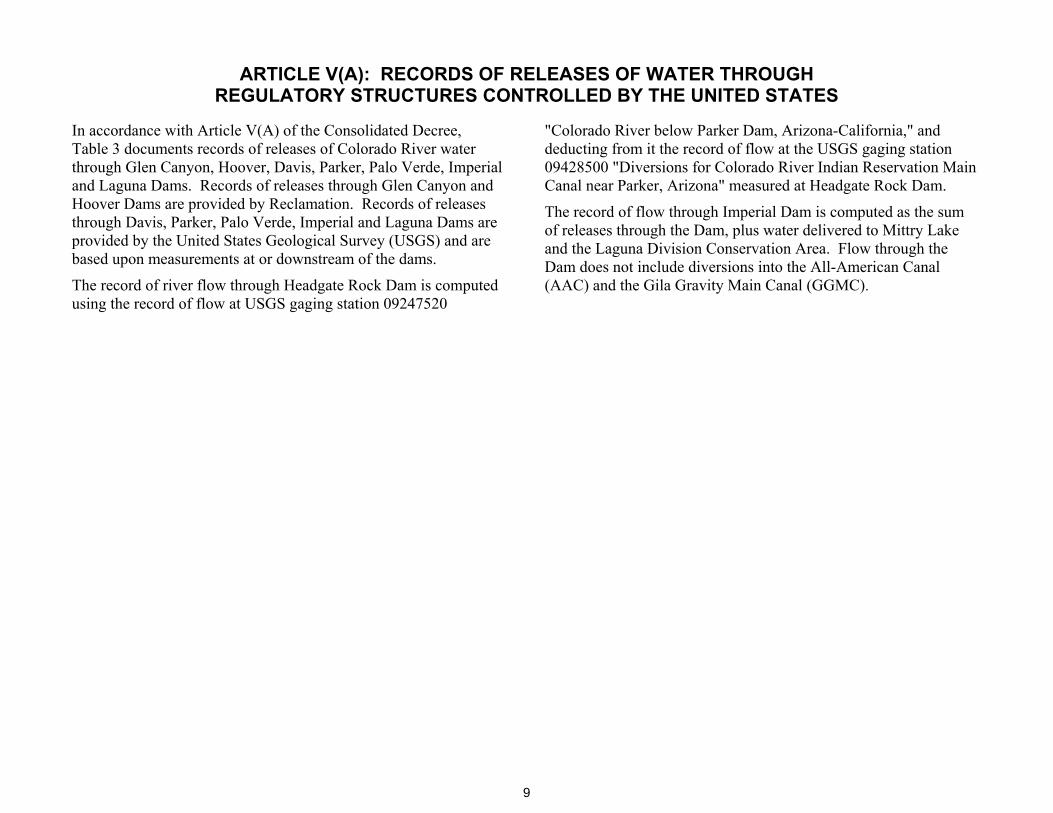
ARTICLE V(A): RECORDS OF RELEASES OF WATER THROUGH REGULATORY STRUCTURES CONTROLLED BY THE UNITED STATES
In accordance with Article V(A) of the Consolidated Decree, Table 3 documents records of releases of Colorado River water through Glen Canyon, Hoover, Davis, Parker, Palo Verde, Imperial and Laguna Dams. Records of releases through Glen Canyon and Hoover Dams are provided by Reclamation. Records of releases through Davis, Parker, Palo Verde, Imperial and Laguna Dams are provided by the United States Geological Survey (USGS) and are based upon measurements at or downstream of the dams.
The record of river flow through Headgate Rock Dam is computed using the record of flow at USGS gaging station 09247520
"Colorado River below Parker Dam, Arizona-California," and deducting from it the record of flow at the USGS gaging station 09428500 "Diversions for Colorado River Indian Reservation Main Canal near Parker, Arizona" measured at Headgate Rock Dam.
The record of flow through Imperial Dam is computed as the sum of releases through the Dam, plus water delivered to Mittry Lake and the Laguna Division Conservation Area. Flow through the Dam does not include diversions into the All-American Canal (AAC) and the Gila Gravity Main Canal (GGMC).
9

Table 3. Releases of Water Through Regulatory Structures Controlled by the United States, Calendar Year 2017. (Values are in acre-feet.)
STRUCTURE JAN FEB MAR APR MAY JUN JUL AUG SEP OCT NOV DEC TOTAL
Glen Canyon Dam 880,296 710,688 722,416 622,545 652,405 749,032 850,141 900,116 663,071 640,161 630,069 739,549 8,760,489
Hoover Dam 499,756 487,736 911,223 960,955 916,507 864,434 884,957 683,264 599,545 596,104 731,345 594,269 8,730,095
Davis Dam 428,100 499,000 878,900 991,200 873,600 873,900 836,200 755,800 711,400 687,800 615,400 574,300 8,725,600
Parker Dam 259,600 414,900 700,900 763,100 671,600 725,600 687,200 580,300 477,400 457,300 344,200 339,100 6,421,200
Headgate Rock Dam 249,657 388,240 649,910 692,320 603,310 652,150 612,680 514,750 425,380 412,850 317,780 309,291 5,828,318
Palo Verde Diversion Dam 213,800 321,300 529,000 565,300 480,300 500,100 504,300 422,200 383,900 380,500 294,400 280,900 4,876,000
Imperial Dam 30,190 19,500 43,280 25,119 26,170 16,450 16,170 25,720 42,120 14,320 18,470 14,010 291,519
GGMC Diversion for Mittry Lake 544 557 639 713 680 688 797 687 660 714 603 606 7,888
GGMC Diversion for Laguna Division Conservation Area 4,919 4,443 4,919 4,760 4,451 4,759 4,917 4,182 3,775 4,456 4,753 4,830 55,164
Sum of Imperial Dam, Mittry, and Laguna 35,653 24,500 48,838 30,592 31,301 21,897 21,884 30,589 46,555 19,490 23,826 19,446 354,571
Laguna Dam 34,700 24,430 44,370 26,200 30,230 21,130 26,770 30,840 41,250 19,690 21,960 20,060 341,630
10
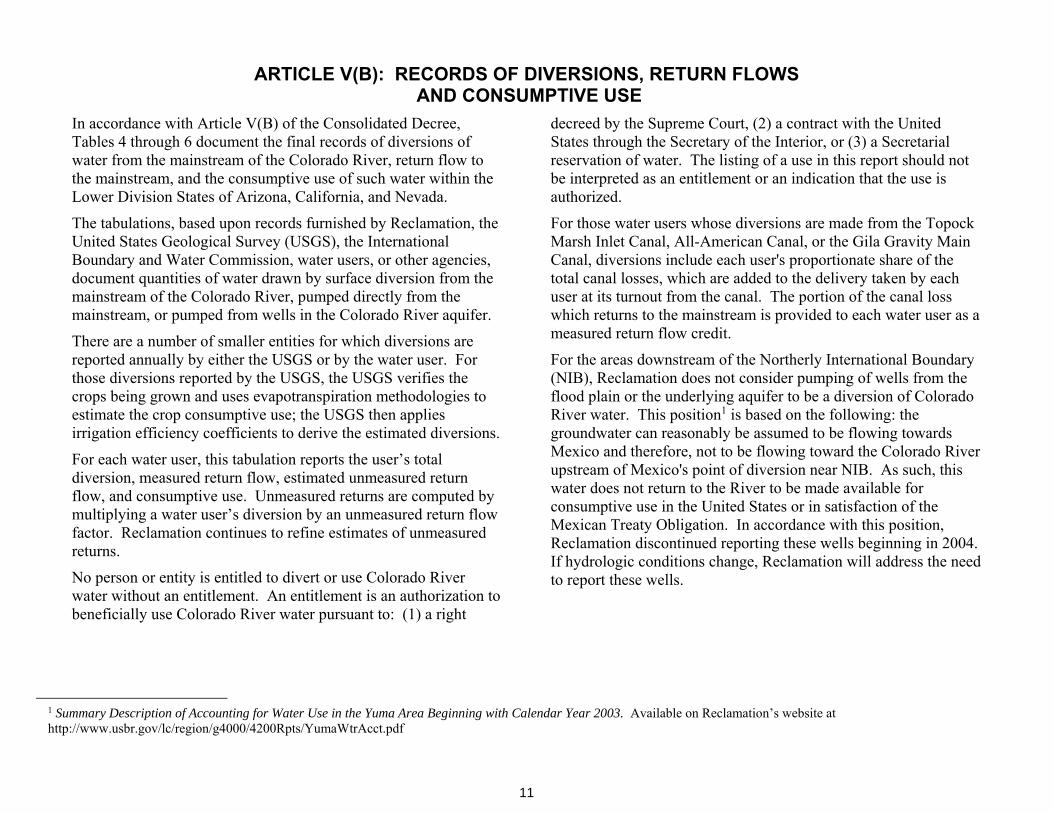
ARTICLE V(B): RECORDS OF DIVERSIONS, RETURN FLOWS AND CONSUMPTIVE USE
In accordance with Article V(B) of the Consolidated Decree, Tables 4 through 6 document the final records of diversions of water from the mainstream of the Colorado River, return flow to the mainstream, and the consumptive use of such water within the Lower Division States of Arizona, California, and Nevada.
The tabulations, based upon records furnished by Reclamation, the United States Geological Survey (USGS), the International Boundary and Water Commission, water users, or other agencies, document quantities of water drawn by surface diversion from the mainstream of the Colorado River, pumped directly from the mainstream, or pumped from wells in the Colorado River aquifer.
There are a number of smaller entities for which diversions are reported annually by either the USGS or by the water user. For those diversions reported by the USGS, the USGS verifies the crops being grown and uses evapotranspiration methodologies to estimate the crop consumptive use; the USGS then applies irrigation efficiency coefficients to derive the estimated diversions.
For each water user, this tabulation reports the user’s total diversion, measured return flow, estimated unmeasured return flow, and consumptive use. Unmeasured returns are computed by multiplying a water user’s diversion by an unmeasured return flow factor. Reclamation continues to refine estimates of unmeasured returns.
No person or entity is entitled to divert or use Colorado River water without an entitlement. An entitlement is an authorization to beneficially use Colorado River water pursuant to: (1) a right
decreed by the Supreme Court, (2) a contract with the United States through the Secretary of the Interior, or (3) a Secretarial reservation of water. The listing of a use in this report should not be interpreted as an entitlement or an indication that the use is authorized.
For those water users whose diversions are made from the Topock Marsh Inlet Canal, All-American Canal, or the Gila Gravity Main Canal, diversions include each user's proportionate share of the total canal losses, which are added to the delivery taken by each user at its turnout from the canal. The portion of the canal loss which returns to the mainstream is provided to each water user as a measured return flow credit.
For the areas downstream of the Northerly International Boundary (NIB), Reclamation does not consider pumping of wells from the flood plain or the underlying aquifer to be a diversion of Colorado River water. This position1 is based on the following: the groundwater can reasonably be assumed to be flowing towards Mexico and therefore, not to be flowing toward the Colorado River upstream of Mexico's point of diversion near NIB. As such, this water does not return to the River to be made available for consumptive use in the United States or in satisfaction of the Mexican Treaty Obligation. In accordance with this position, Reclamation discontinued reporting these wells beginning in 2004. If hydrologic conditions change, Reclamation will address the need to report these wells.
1 Summary Description of Accounting for Water Use in the Yuma Area Beginning with Calendar Year 2003. Available on Reclamation’s website at http://www.usbr.gov/lc/region/g4000/4200Rpts/YumaWtrAcct.pdf
11
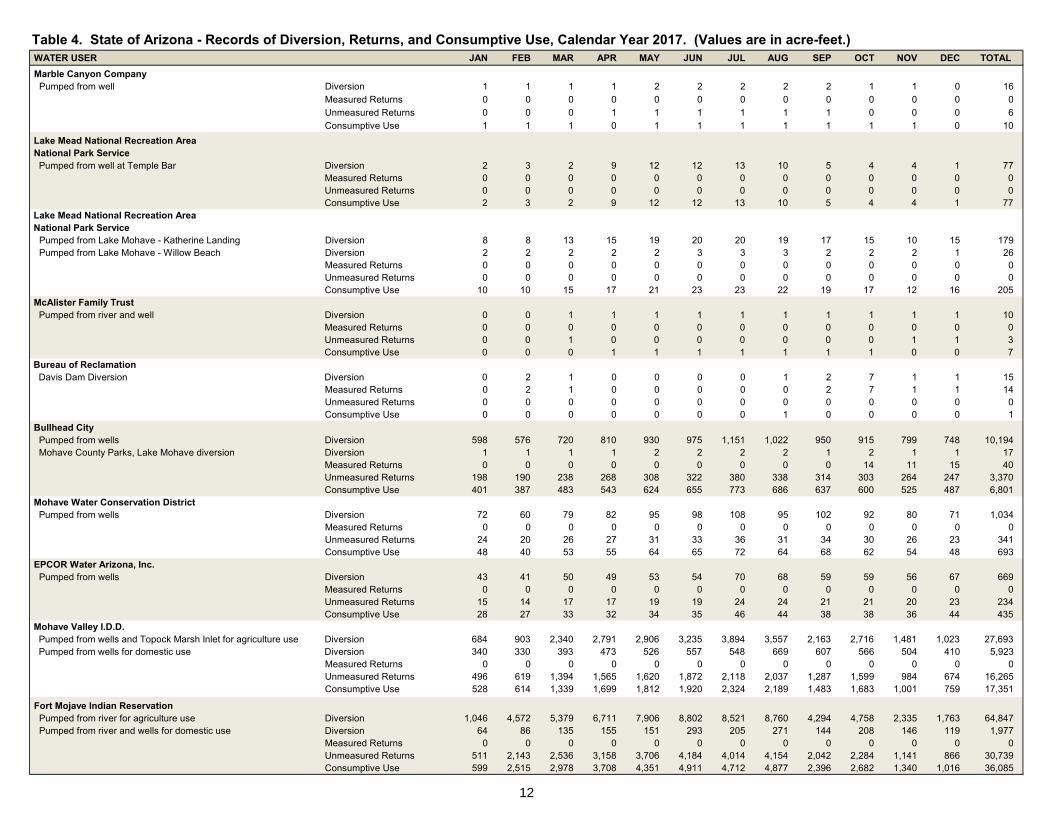
Table 4. State of Arizona - Records of Diversion, Returns, and Consumptive Use, Calendar Year 2017. (Values are in acre-feet.) WATER USER JAN FEB MAR APR MAY JUN JUL AUG SEP OCT NOV DEC TOTAL
Marble Canyon Company Pumped from well Diversion 1 1 1 1 2 2 2 2 2 1 1 0 16
Measured Returns 0 0 0 0 0 0 0 0 0 0 0 0 0 Unmeasured Returns 0 0 0 1 1 1 1 1 1 0 0 0 6 Consumptive Use 1 1 1 0 1 1 1 1 1 1 1 0 10
Lake Mead National Recreation Area National Park Service Pumped from well at Temple Bar Diversion 2 3 2 9 12 12 13 10 5 4 4 1 77
Measured Returns 0 0 0 0 0 0 0 0 0 0 0 0 0 Unmeasured Returns 0 0 0 0 0 0 0 0 0 0 0 0 0 Consumptive Use 2 3 2 9 12 12 13 10 5 4 4 1 77
Lake Mead National Recreation Area National Park Service Pumped from Lake Mohave - Katherine Landing Diversion 8 8 13 15 19 20 20 19 17 15 10 15 179 Pumped from Lake Mohave - Willow Beach Diversion 2 2 2 2 2 3 3 3 2 2 2 1 26
Measured Returns 0 0 0 0 0 0 0 0 0 0 0 0 0 Unmeasured Returns 0 0 0 0 0 0 0 0 0 0 0 0 0 Consumptive Use 10 10 15 17 21 23 23 22 19 17 12 16 205
McAlister Family Trust Pumped from river and well Diversion 0 0 1 1 1 1 1 1 1 1 1 1 10
Measured Returns 0 0 0 0 0 0 0 0 0 0 0 0 0 Unmeasured Returns 0 0 1 0 0 0 0 0 0 0 1 1 3 Consumptive Use 0 0 0 1 1 1 1 1 1 1 0 0 7
Bureau of Reclamation Davis Dam Diversion Diversion 0 2 1 0 0 0 0 1 2 7 1 1 15
Measured Returns 0 2 1 0 0 0 0 0 2 7 1 1 14 Unmeasured Returns 0 0 0 0 0 0 0 0 0 0 0 0 0 Consumptive Use 0 0 0 0 0 0 0 1 0 0 0 0 1
Bullhead City Pumped from wells Diversion 598 576 720 810 930 975 1,151 1,022 950 915 799 748 10,194 Mohave County Parks, Lake Mohave diversion Diversion 1 1 1 1 2 2 2 2 1 2 1 1 17
Measured Returns 0 0 0 0 0 0 0 0 0 14 11 15 40 Unmeasured Returns 198 190 238 268 308 322 380 338 314 303 264 247 3,370 Consumptive Use 401 387 483 543 624 655 773 686 637 600 525 487 6,801
Mohave Water Conservation District Pumped from wells Diversion 72 60 79 82 95 98 108 95 102 92 80 71 1,034
Measured Returns 0 0 0 0 0 0 0 0 0 0 0 0 0 Unmeasured Returns 24 20 26 27 31 33 36 31 34 30 26 23 341 Consumptive Use 48 40 53 55 64 65 72 64 68 62 54 48 693
EPCOR Water Arizona, Inc. Pumped from wells Diversion 43 41 50 49 53 54 70 68 59 59 56 67 669
Measured Returns 0 0 0 0 0 0 0 0 0 0 0 0 0 Unmeasured Returns 15 14 17 17 19 19 24 24 21 21 20 23 234 Consumptive Use 28 27 33 32 34 35 46 44 38 38 36 44 435
Mohave Valley I.D.D. Pumped from wells and Topock Marsh Inlet for agriculture use Diversion 684 903 2,340 2,791 2,906 3,235 3,894 3,557 2,163 2,716 1,481 1,023 27,693 Pumped from wells for domestic use Diversion 340 330 393 473 526 557 548 669 607 566 504 410 5,923
Measured Returns 0 0 0 0 0 0 0 0 0 0 0 0 0 Unmeasured Returns 496 619 1,394 1,565 1,620 1,872 2,118 2,037 1,287 1,599 984 674 16,265 Consumptive Use 528 614 1,339 1,699 1,812 1,920 2,324 2,189 1,483 1,683 1,001 759 17,351
Fort Mojave Indian Reservation Pumped from river for agriculture use Diversion 1,046 4,572 5,379 6,711 7,906 8,802 8,521 8,760 4,294 4,758 2,335 1,763 64,847 Pumped from river and wells for domestic use Diversion 64 86 135 155 151 293 205 271 144 208 146 119 1,977
Measured Returns 0 0 0 0 0 0 0 0 0 0 0 0 0 Unmeasured Returns 511 2,143 2,536 3,158 3,706 4,184 4,014 4,154 2,042 2,284 1,141 866 30,739 Consumptive Use 599 2,515 2,978 3,708 4,351 4,911 4,712 4,877 2,396 2,682 1,340 1,016 36,085
12

Table 4. State of Arizona - Records of Diversion, Returns, and Consumptive Use, Calendar Year 2017. (Values are in acre-feet.) WATER USER JAN FEB MAR APR MAY JUN JUL AUG SEP OCT NOV DEC TOTAL
Golden Shores Water Conservation District Pumped from wells Diversion 23 22 28 29 34 64 41 43 38 41 36 25 424
Measured Returns 0 0 0 0 0 0 0 0 0 0 0 0 0 Unmeasured Returns 8 7 9 10 11 21 14 14 12 14 12 8 140 Consumptive Use 15 15 19 19 23 43 27 29 26 27 24 17 284
Havasu National Wildlife Refuge Firebreak Inlet Canal Diversion 24 150 3,065 5,023 3,318 3,312 2,984 1,787 1,316 1,224 427 215 22,845
Farm Ditch Diversion 1 -7 10 623 1,097 708 731 614 311 225 194 30 19 4,555
Pumped from well Diversion 10 11 15 17 20 25 27 26 20 17 12 12 212
Measured Returns 2 0 0 0 0 0 0 0 0 0 0 0 0 0
Unmeasured Returns 24 150 3,259 5,401 3,560 3,580 3,190 1,869 1,374 1,263 413 216 24,299 Consumptive Use 3 21 444 736 486 488 435 255 187 172 56 30 3,313
Crystal Beach Water Conservation District Pumped from wells Diversion 7 7 8 9 10 11 11 11 10 10 9 8 111
Measured Returns 0 0 0 0 0 0 0 0 0 0 0 0 0 Unmeasured Returns 2 2 3 3 4 4 4 4 4 4 3 3 40 Consumptive Use 5 5 5 6 6 7 7 7 6 6 6 5 71
Lake Havasu City Pumped from wells Diversion 734 706 895 942 1,039 1,170 1,329 1,251 1,189 1,158 1,132 892 12,437
Measured Returns 0 0 0 0 0 0 0 0 0 0 0 0 0 Unmeasured Returns 279 268 340 358 395 445 505 475 452 440 430 339 4,726 Consumptive Use 455 438 555 584 644 725 824 776 737 718 702 553 7,711
Arizona State Parks (Windsor Beach) Pumped from wells Diversion 0 0 0 0 1 0 1 0 0 2 2 0 6
Measured Returns 0 0 0 0 0 0 0 0 0 0 0 0 0 Unmeasured Returns 0 0 0 0 0 0 0 0 0 1 1 0 2 Consumptive Use 0 0 0 0 1 0 1 0 0 1 1 0 4
Central Arizona Project Pumped from Lake Havasu Diversion 126,924 62,359 136,275 159,848 174,612 79,014 71,258 70,184 134,073 130,498 126,715 143,853 1,415,613
Measured Returns 0 0 0 0 0 0 0 0 0 0 0 0 0 Unmeasured Returns 0 0 0 0 0 0 0 0 0 0 0 0 0 Consumptive Use 126,924 62,359 136,275 159,848 174,612 79,014 71,258 70,184 134,073 130,498 126,715 143,853 1,415,613
Hillcrest Water Company Pumped from wells Diversion 1 1 2 3 2 2 2 2 3 3 3 4 28
Measured Returns 0 0 0 0 0 0 0 0 0 0 0 0 0 Unmeasured Returns 0 0 1 1 1 1 1 1 1 1 1 1 10 Consumptive Use 1 1 1 2 1 1 1 1 2 2 2 3 18
Springs Del Sol Domestic Water Improvement District Pumped from wells Diversion 0 0 0 0 0 0 1 1 0 1 0 1 4
Measured Returns 0 0 0 0 0 0 0 0 0 0 0 0 0 Unmeasured Returns 0 0 0 0 0 0 1 0 0 0 0 0 1 Consumptive Use 0 0 0 0 0 0 0 1 0 1 0 1 3
Brooke Water, LLC Pumped from river and wells Diversion 33 33 41 38 43 44 51 49 50 44 41 39 506
Measured Returns 0 0 0 0 0 0 0 0 0 0 0 0 0 Unmeasured Returns 11 11 13 13 14 14 17 16 16 15 14 13 167 Consumptive Use 22 22 28 25 29 30 34 33 34 29 27 26 339
Town of Parker Pumped from wells Diversion 50 49 57 69 85 90 97 93 75 73 63 59 860
Measured Returns 17 16 17 16 17 15 16 16 16 17 16 17 196 Unmeasured Returns 14 14 16 20 24 26 28 26 21 21 18 17 245 Consumptive Use 19 19 24 33 44 49 53 51 38 35 29 25 419
13

Table 4. State of Arizona - Records of Diversion, Returns, and Consumptive Use, Calendar Year 2017. (Values are in acre-feet.) WATER USER JAN FEB MAR APR MAY JUN JUL AUG SEP OCT NOV DEC TOTAL
Colorado River Indian Reservation Diversion at Headgate Rock Dam Diversion 9,943 26,660 50,990 70,780 68,290 73,450 74,520 65,550 52,020 44,450 26,420 29,809 592,882 Pumped from river and wells Diversion 334 383 500 556 682 801 871 835 663 579 436 421 7,061
Measured Returns 15,596 17,880 20,151 21,992 22,319 24,803 26,498 24,969 25,853 22,693 22,026 22,213 266,993 Unmeasured Returns 565 1,487 2,832 3,923 3,793 4,084 4,147 3,651 2,898 2,477 1,477 1,663 32,997 Consumptive Use -5,884 7,676 28,507 45,421 42,860 45,364 44,746 37,765 23,932 19,859 3,353 6,354 299,953
Rayner Ranches Pumped from river (AEP-9) and well (AEW-35) Diversion 0 259 342 358 616 617 715 715 441 259 0 0 4,322
Measured Returns 0 0 0 0 0 0 0 0 0 0 0 0 0 Unmeasured Returns 0 91 120 125 216 216 250 250 154 91 0 0 1,513 Consumptive Use 0 168 222 233 400 401 465 465 287 168 0 0 2,809
Ehrenburg Improvement Association Pumped from river Diversion 17 17 21 24 28 32 38 37 32 29 26 20 321
Measured Returns 4 2 6 3 5 3 4 3 3 3 2 2 40 Unmeasured Returns 5 5 6 7 8 9 11 11 9 8 7 6 92 Consumptive Use 8 10 9 14 15 20 23 23 20 18 17 12 189
North Baja Pipeline Pumped from wells Diversion 7 18 26 32 29 42 45 27 23 15 8 11 283
Measured Returns 0 0 0 0 0 0 0 0 0 0 0 0 0 Unmeasured Returns 2 6 9 11 10 15 16 9 8 5 3 4 98 Consumptive Use 5 12 17 21 19 27 29 18 15 10 5 7 185
Cibola Valley I.D.D. Pumped from river for agriculture use Diversion 166 529 790 1,309 864 1,007 1,062 981 265 379 266 1,297 8,915 Pumped from river for domestic use Diversion 25 25 25 25 25 15 15 15 15 15 15 15 230
Measured Returns 0 0 0 0 0 0 0 0 0 0 0 0 0 Unmeasured Returns 54 158 232 381 253 291 307 284 80 112 80 374 2,606 Consumptive Use 137 396 583 953 636 731 770 712 200 282 201 938 6,539
Mohave County Water Authority Pumped from river Diversion 0 0 83 75 81 94 105 136 0 0 0 0 574
Measured Returns 0 0 0 0 0 0 0 0 0 0 0 0 0 Unmeasured Returns 0 0 24 21 23 27 30 39 0 0 0 0 164 Consumptive Use 0 0 59 54 58 67 75 97 0 0 0 0 410
Hopi Tribe Pumped from river Diversion 0 633 235 259 613 700 982 592 560 231 0 0 4,805
Measured Returns 0 0 0 0 0 0 0 0 0 0 0 0 0 Unmeasured Returns 0 180 67 74 175 199 280 169 159 66 0 0 1,369 Consumptive Use 0 453 168 185 438 501 702 423 401 165 0 0 3,436
GSC Farm, LLC Pumped from river Diversion 0 159 257 85 325 480 412 299 387 37 0 33 2,474
Measured Returns 0 0 0 0 0 0 0 0 0 0 0 0 0 Unmeasured Returns 0 45 73 24 93 137 117 85 110 11 0 10 705 Consumptive Use 0 114 184 61 232 343 295 214 277 26 0 23 1,769
Arizona Game and Fish Commission Pumped from river Diversion 0 0 353 397 295 420 425 427 0 0 0 0 2,317
Measured Returns 0 0 0 0 0 0 0 0 0 0 0 0 0 Unmeasured Returns 0 0 101 113 83 120 121 122 0 0 0 0 660 Consumptive Use 0 0 252 284 212 300 304 305 0 0 0 0 1,657
Cibola Island Pumped from river Diversion 18 56 84 139 92 107 113 104 28 40 28 138 947
Measured Returns 0 0 0 0 0 0 0 0 0 0 0 0 0 Unmeasured Returns 5 16 24 40 26 31 32 30 8 11 8 39 270 Consumptive Use 13 40 60 99 66 76 81 74 20 29 20 99 677
Cibola National Wildlife Refuge Pumped from river Diversion 479 402 631 1,396 1,488 2,000 1,541 2,064 1,291 1,397 1,572 1,010 15,271
Measured Returns 0 0 0 0 0 0 0 0 0 0 0 0 0 Unmeasured Returns 182 153 240 530 565 760 586 784 491 531 597 384 5,803 Consumptive Use 297 249 391 866 923 1,240 955 1,280 800 866 975 626 9,468
14

Table 4. State of Arizona - Records of Diversion, Returns, and Consumptive Use, Calendar Year 2017. (Values are in acre-feet.) WATER USER JAN FEB MAR APR MAY JUN JUL AUG SEP OCT NOV DEC TOTAL
Imperial National Wildlife Refuge Pumped from river Diversion 63 242 244 336 288 337 297 381 267 313 288 112 3,168
Measured Returns 0 0 0 0 0 0 0 0 0 0 0 0 0 Unmeasured Returns 24 92 93 128 109 128 113 145 101 119 109 43 1,204 Consumptive Use 39 150 151 208 179 209 184 236 166 194 179 69 1,964
Bureau of Land Management Pumped from river and wells (Permitees, LHFO and YFO) Diversion 32 44 68 10 100 84 104 161 105 153 108 95 1,064
Pumped from river (ADW-01) (leased by L. Pratt) Diversion 3 7 9 12 13 16 19 21 20 16 13 9 9 164
Pumped from river (ADP-1) and well (AEW-14) (leased by M. Lee) Diversion 3 8 10 14 15 18 22 24 23 18 16 11 11 190
Measured Returns 0 0 0 0 0 0 0 0 0 0 0 0 0 Unmeasured Returns 16 21 33 14 47 44 51 71 49 64 45 40 495 Consumptive Use 31 42 61 24 87 81 98 133 90 118 83 75 923
Fisher's Landing Water and Sewer, LLC Pumped from well Diversion 1 1 1 1 0 1 1 2 2 1 1 2 14
Measured Returns 0 0 0 0 0 0 0 0 0 0 0 0 0 Unmeasured Returns 0 0 0 0 0 0 0 1 1 0 0 1 3 Consumptive Use 1 1 1 1 0 1 1 1 1 1 1 1 11
Shepard Water Company Pumped from well Diversion 2 2 3 2 3 4 4 4 3 4 3 3 37
Measured Returns 0 0 0 0 0 0 0 0 0 0 0 0 0 Unmeasured Returns 1 1 1 1 1 1 1 2 1 1 1 1 13 Consumptive Use 1 1 2 1 2 3 3 2 2 3 2 2 24
U.S. Army Yuma Proving Grounds Diversion at Imperial Dam Diversion 0 1 2 1 1 2 0 4 0 1 0 2 14 Pumped from wells Diversion 16 18 20 35 50 75 75 61 45 50 24 9 478
Measured Returns 0 0 0 0 0 0 0 0 0 0 0 0 0 Unmeasured Returns 0 0 0 0 0 0 0 0 0 0 0 0 0 Consumptive Use 16 19 22 36 51 77 75 65 45 51 24 11 492
JRJ Partners, LLC Pumped from river (AEP-1) and well (AEW-3) Diversion 48 30 96 122 111 72 115 100 22 110 116 100 1,042
Measured Returns 0 0 0 0 0 0 0 0 0 0 0 0 0 Unmeasured Returns 17 10 34 43 39 25 40 35 8 38 41 35 365 Consumptive Use 31 20 62 79 72 47 75 65 14 72 75 65 677
Cha Cha, LLC Pumped from river (AEP-2/3) and wells (AEW-4/5, ADW-3) Diversion 40 56 88 82 150 113 157 93 99 172 81 21 1,152
Measured Returns 0 0 0 0 0 0 0 0 0 0 0 0 0 Unmeasured Returns 14 20 31 29 53 40 55 32 34 60 28 7 403 Consumptive Use 26 36 57 53 97 73 102 61 65 112 53 14 749
Beattie Farms Southwest (Russell Youmans) Pumped from well (ADW-2) Diversion 117 41 39 158 4 0 0 0 36 102 93 104 694
Measured Returns 0 0 0 0 0 0 0 0 0 0 0 0 0 Unmeasured Returns 41 14 14 55 1 0 0 0 13 36 33 36 243 Consumptive Use 76 27 25 103 3 0 0 0 23 66 60 68 451
Gila Monster Farms Diversion at Imperial Dam Diversion 441 416 1,221 1,224 923 418 209 385 256 824 623 416 7,356
Measured Returns 40 26 67 56 33 14 10 17 11 43 28 19 364 Unmeasured Returns 168 158 464 465 351 159 79 146 97 313 237 158 2,795 Consumptive Use 233 232 690 703 539 245 120 222 148 468 358 239 4,197
Wellton-Mohawk I.D.D. Diversion at Imperial Dam Diversion 13,945 21,725 39,713 44,921 36,885 35,317 34,148 30,990 35,696 37,037 21,295 21,025 372,697
GGMC Return 1,401 1,515 2,448 2,314 1,456 1,360 1,764 1,512 1,789 2,151 1,082 1,083 19,875 Dome Return 492 540 545 707 545 366 172 305 335 379 456 584 5,426
MOD Return 4 8,333 8,684 9,431 8,220 8,836 8,592 8,495 8,428 8,777 8,674 8,174 6,420 101,064
Total Returns 10,226 10,739 12,424 11,241 10,837 10,318 10,431 10,245 10,901 11,204 9,712 8,087 126,365 Unmeasured Returns 0 0 0 0 0 0 0 0 0 0 0 0 0 Consumptive Use 3,719 10,986 27,289 33,680 26,048 24,999 23,717 20,745 24,795 25,833 11,583 12,938 246,332
15
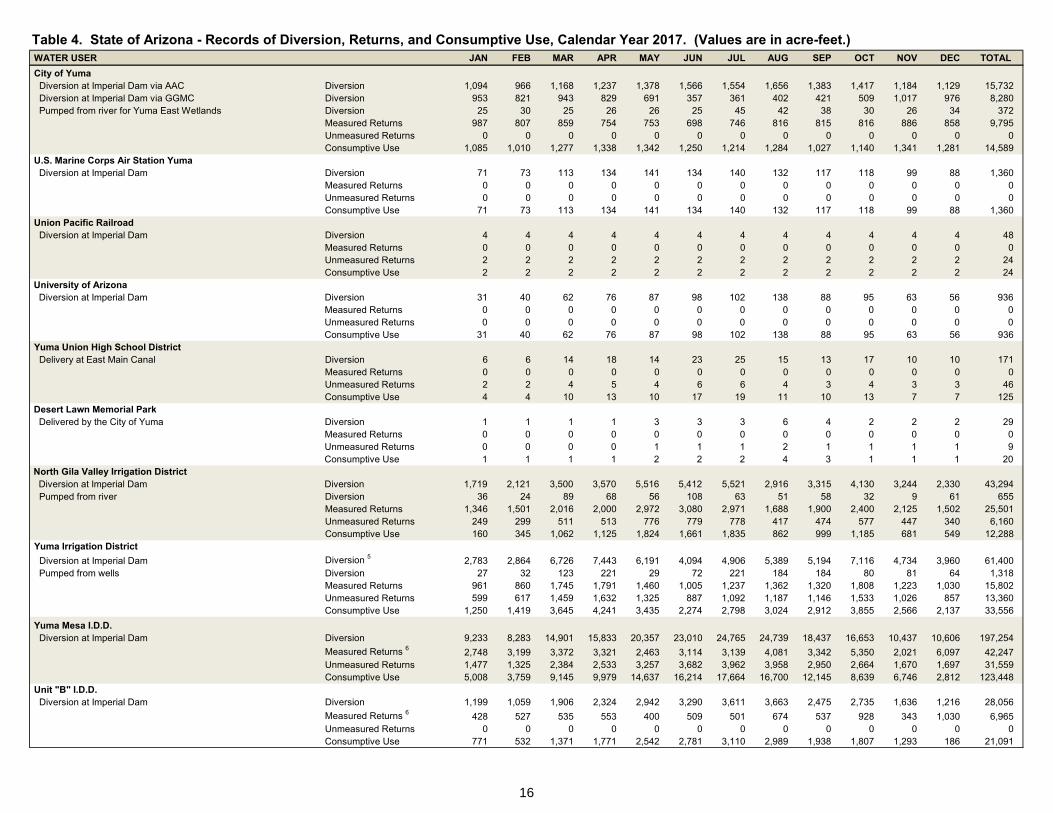
Table 4. State of Arizona - Records of Diversion, Returns, and Consumptive Use, Calendar Year 2017. (Values are in acre-feet.) WATER USER JAN FEB MAR APR MAY JUN JUL AUG SEP OCT NOV DEC TOTAL
City of Yuma Diversion at Imperial Dam via AAC Diversion 1,094 966 1,168 1,237 1,378 1,566 1,554 1,656 1,383 1,417 1,184 1,129 15,732 Diversion at Imperial Dam via GGMC Diversion 953 821 943 829 691 357 361 402 421 509 1,017 976 8,280 Pumped from river for Yuma East Wetlands Diversion 25 30 25 26 26 25 45 42 38 30 26 34 372
Measured Returns 987 807 859 754 753 698 746 816 815 816 886 858 9,795 Unmeasured Returns 0 0 0 0 0 0 0 0 0 0 0 0 0 Consumptive Use 1,085 1,010 1,277 1,338 1,342 1,250 1,214 1,284 1,027 1,140 1,341 1,281 14,589
U.S. Marine Corps Air Station Yuma Diversion at Imperial Dam Diversion 71 73 113 134 141 134 140 132 117 118 99 88 1,360
Measured Returns 0 0 0 0 0 0 0 0 0 0 0 0 0 Unmeasured Returns 0 0 0 0 0 0 0 0 0 0 0 0 0 Consumptive Use 71 73 113 134 141 134 140 132 117 118 99 88 1,360
Union Pacific Railroad Diversion at Imperial Dam Diversion 4 4 4 4 4 4 4 4 4 4 4 4 48
Measured Returns 0 0 0 0 0 0 0 0 0 0 0 0 0 Unmeasured Returns 2 2 2 2 2 2 2 2 2 2 2 2 24 Consumptive Use 2 2 2 2 2 2 2 2 2 2 2 2 24
University of Arizona Diversion at Imperial Dam Diversion 31 40 62 76 87 98 102 138 88 95 63 56 936
Measured Returns 0 0 0 0 0 0 0 0 0 0 0 0 0 Unmeasured Returns 0 0 0 0 0 0 0 0 0 0 0 0 0 Consumptive Use 31 40 62 76 87 98 102 138 88 95 63 56 936
Yuma Union High School District Delivery at East Main Canal Diversion 6 6 14 18 14 23 25 15 13 17 10 10 171
Measured Returns 0 0 0 0 0 0 0 0 0 0 0 0 0 Unmeasured Returns 2 2 4 5 4 6 6 4 3 4 3 3 46 Consumptive Use 4 4 10 13 10 17 19 11 10 13 7 7 125
Desert Lawn Memorial Park Delivered by the City of Yuma Diversion 1 1 1 1 3 3 3 6 4 2 2 2 29
Measured Returns 0 0 0 0 0 0 0 0 0 0 0 0 0 Unmeasured Returns 0 0 0 0 1 1 1 2 1 1 1 1 9 Consumptive Use 1 1 1 1 2 2 2 4 3 1 1 1 20
North Gila Valley Irrigation District Diversion at Imperial Dam Diversion 1,719 2,121 3,500 3,570 5,516 5,412 5,521 2,916 3,315 4,130 3,244 2,330 43,294 Pumped from river Diversion 36 24 89 68 56 108 63 51 58 32 9 61 655
Measured Returns 1,346 1,501 2,016 2,000 2,972 3,080 2,971 1,688 1,900 2,400 2,125 1,502 25,501 Unmeasured Returns 249 299 511 513 776 779 778 417 474 577 447 340 6,160 Consumptive Use 160 345 1,062 1,125 1,824 1,661 1,835 862 999 1,185 681 549 12,288
Yuma Irrigation District
Diversion at Imperial Dam Diversion 5 2,783 2,864 6,726 7,443 6,191 4,094 4,906 5,389 5,194 7,116 4,734 3,960 61,400
Pumped from wells Diversion 27 32 123 221 29 72 221 184 184 80 81 64 1,318 Measured Returns 961 860 1,745 1,791 1,460 1,005 1,237 1,362 1,320 1,808 1,223 1,030 15,802 Unmeasured Returns 599 617 1,459 1,632 1,325 887 1,092 1,187 1,146 1,533 1,026 857 13,360 Consumptive Use 1,250 1,419 3,645 4,241 3,435 2,274 2,798 3,024 2,912 3,855 2,566 2,137 33,556
Yuma Mesa I.D.D. Diversion at Imperial Dam Diversion 9,233 8,283 14,901 15,833 20,357 23,010 24,765 24,739 18,437 16,653 10,437 10,606 197,254
Measured Returns 6 2,748 3,199 3,372 3,321 2,463 3,114 3,139 4,081 3,342 5,350 2,021 6,097 42,247
Unmeasured Returns 1,477 1,325 2,384 2,533 3,257 3,682 3,962 3,958 2,950 2,664 1,670 1,697 31,559 Consumptive Use 5,008 3,759 9,145 9,979 14,637 16,214 17,664 16,700 12,145 8,639 6,746 2,812 123,448
Unit "B" I.D.D. Diversion at Imperial Dam Diversion 1,199 1,059 1,906 2,324 2,942 3,290 3,611 3,663 2,475 2,735 1,636 1,216 28,056
Measured Returns 6 428 527 535 553 400 509 501 674 537 928 343 1,030 6,965
Unmeasured Returns 0 0 0 0 0 0 0 0 0 0 0 0 0 Consumptive Use 771 532 1,371 1,771 2,542 2,781 3,110 2,989 1,938 1,807 1,293 186 21,091
16
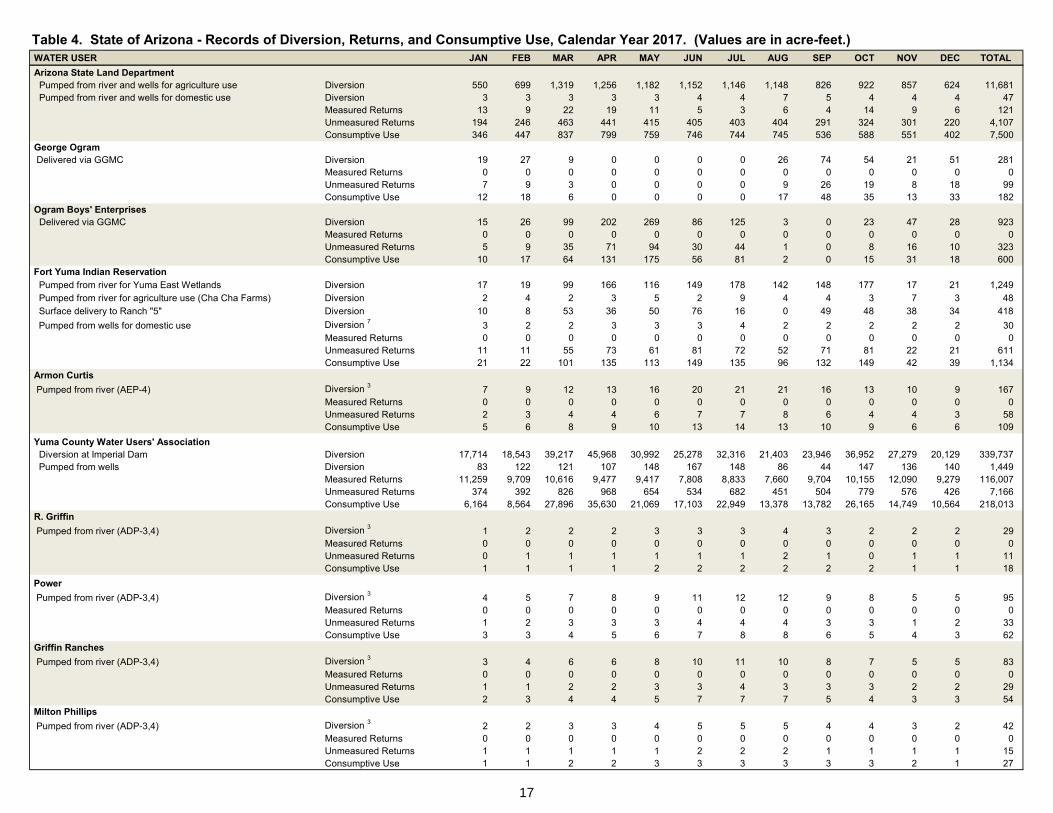
Table 4. State of Arizona - Records of Diversion, Returns, and Consumptive Use, Calendar Year 2017. (Values are in acre-feet.) WATER USER JAN FEB MAR APR MAY JUN JUL AUG SEP OCT NOV DEC TOTAL
Arizona State Land Department Pumped from river and wells for agriculture use Diversion 550 699 1,319 1,256 1,182 1,152 1,146 1,148 826 922 857 624 11,681 Pumped from river and wells for domestic use Diversion 3 3 3 3 3 4 4 7 5 4 4 4 47
Measured Returns 13 9 22 19 11 5 3 6 4 14 9 6 121 Unmeasured Returns 194 246 463 441 415 405 403 404 291 324 301 220 4,107 Consumptive Use 346 447 837 799 759 746 744 745 536 588 551 402 7,500
George Ogram Delivered via GGMC Diversion 19 27 9 0 0 0 0 26 74 54 21 51 281
Measured Returns 0 0 0 0 0 0 0 0 0 0 0 0 0 Unmeasured Returns 7 9 3 0 0 0 0 9 26 19 8 18 99 Consumptive Use 12 18 6 0 0 0 0 17 48 35 13 33 182
Ogram Boys' Enterprises Delivered via GGMC Diversion 15 26 99 202 269 86 125 3 0 23 47 28 923
Measured Returns 0 0 0 0 0 0 0 0 0 0 0 0 0 Unmeasured Returns 5 9 35 71 94 30 44 1 0 8 16 10 323 Consumptive Use 10 17 64 131 175 56 81 2 0 15 31 18 600
Fort Yuma Indian Reservation Pumped from river for Yuma East Wetlands Diversion 17 19 99 166 116 149 178 142 148 177 17 21 1,249 Pumped from river for agriculture use (Cha Cha Farms) Diversion 2 4 2 3 5 2 9 4 4 3 7 3 48 Surface delivery to Ranch "5" Diversion 10 8 53 36 50 76 16 0 49 48 38 34 418
Pumped from wells for domestic use Diversion 7 3 2 2 3 3 3 4 2 2 2 2 2 30
Measured Returns 0 0 0 0 0 0 0 0 0 0 0 0 0 Unmeasured Returns 11 11 55 73 61 81 72 52 71 81 22 21 611 Consumptive Use 21 22 101 135 113 149 135 96 132 149 42 39 1,134
Armon Curtis
Pumped from river (AEP-4) Diversion 3 7 9 12 13 16 20 21 21 16 13 10 9 167
Measured Returns 0 0 0 0 0 0 0 0 0 0 0 0 0 Unmeasured Returns 2 3 4 4 6 7 7 8 6 4 4 3 58 Consumptive Use 5 6 8 9 10 13 14 13 10 9 6 6 109
Yuma County Water Users' Association Diversion at Imperial Dam Diversion 17,714 18,543 39,217 45,968 30,992 25,278 32,316 21,403 23,946 36,952 27,279 20,129 339,737 Pumped from wells Diversion 83 122 121 107 148 167 148 86 44 147 136 140 1,449
Measured Returns 11,259 9,709 10,616 9,477 9,417 7,808 8,833 7,660 9,704 10,155 12,090 9,279 116,007 Unmeasured Returns 374 392 826 968 654 534 682 451 504 779 576 426 7,166 Consumptive Use 6,164 8,564 27,896 35,630 21,069 17,103 22,949 13,378 13,782 26,165 14,749 10,564 218,013
R. Griffin
Pumped from river (ADP-3,4) Diversion 3 1 2 2 2 3 3 3 4 3 2 2 2 29
Measured Returns 0 0 0 0 0 0 0 0 0 0 0 0 0 Unmeasured Returns 0 1 1 1 1 1 1 2 1 0 1 1 11 Consumptive Use 1 1 1 1 2 2 2 2 2 2 1 1 18
Power
Pumped from river (ADP-3,4) Diversion 3 4 5 7 8 9 11 12 12 9 8 5 5 95
Measured Returns 0 0 0 0 0 0 0 0 0 0 0 0 0 Unmeasured Returns 1 2 3 3 3 4 4 4 3 3 1 2 33 Consumptive Use 3 3 4 5 6 7 8 8 6 5 4 3 62
Griffin Ranches
Pumped from river (ADP-3,4) Diversion 3 3 4 6 6 8 10 11 10 8 7 5 5 83
Measured Returns 0 0 0 0 0 0 0 0 0 0 0 0 0 Unmeasured Returns 1 1 2 2 3 3 4 3 3 3 2 2 29 Consumptive Use 2 3 4 4 5 7 7 7 5 4 3 3 54
Milton Phillips
Pumped from river (ADP-3,4) Diversion 3 2 2 3 3 4 5 5 5 4 4 3 2 42
Measured Returns 0 0 0 0 0 0 0 0 0 0 0 0 0 Unmeasured Returns 1 1 1 1 1 2 2 2 1 1 1 1 15 Consumptive Use 1 1 2 2 3 3 3 3 3 3 2 1 27
17

Table 4. State of Arizona - Records of Diversion, Returns, and Consumptive Use, Calendar Year 2017. (Values are in acre-feet.) WATER USER JAN FEB MAR APR MAY JUN JUL AUG SEP OCT NOV DEC TOTAL
Victor Power
Pumped from river (ADP-3,4) Diversion 3 1 1 1 1 2 2 2 2 2 1 1 1 17
Measured Returns 0 0 0 0 0 0 0 0 0 0 0 0 0 Unmeasured Returns 1 0 0 0 1 1 1 1 1 0 0 0 6 Consumptive Use 0 1 1 1 1 1 1 1 1 1 1 1 11
Cocopah Indian Reservation Diversion at Imperial Dam Diversion 52 41 94 471 0 0 0 0 0 18 19 50 745
Pumped from river and wells Diversion 3,8 69 86 116 127 154 187 203 196 155 129 92 90 1,604
Measured Returns 5 2 2 4 0 0 0 0 0 0 1 1 15 Unmeasured Returns 41 43 71 203 52 64 69 67 53 50 38 48 799 Consumptive Use 75 82 137 391 102 123 134 129 102 97 72 91 1,535
Bureau of Reclamation's Yuma Area Office Pumped from wells Diversion 0 36 0 72 77 12 0 0 0 0 0 0 197
Measured Returns 0 0 0 0 0 0 0 0 0 0 0 0 0 Unmeasured Returns 0 0 0 0 0 0 0 0 0 0 0 0 0 Consumptive Use 0 36 0 72 77 12 0 0 0 0 0 0 197
Arizona Public Service Company Pumped from well Diversion 0 0 0 0 0 0 0 24 1 0 0 0 25
Measured Returns 0 0 0 0 0 0 0 0 0 0 0 0 0 Unmeasured Returns 0 0 0 0 0 0 0 11 0 0 0 0 11 Consumptive Use 0 0 0 0 0 0 0 13 1 0 0 0 14
Gary Pasquinelli Pumped from river (ADP-5) Diversion 13 5 32 79 63 40 0 0 48 69 32 16 397
Measured Returns 0 0 0 0 0 0 0 0 0 0 0 0 0 Unmeasured Returns 5 2 11 27 22 14 0 0 17 24 11 6 139 Consumptive Use 8 3 21 52 41 26 0 0 31 45 21 10 258
Pumped from the South Gila Wells (DPOCs) Measured Returns 9 3,794 4,360 5,089 2,484 19 2,707 4,645 5,076 2,589 5,291 96 5,496 41,646
Unmeasured Returns -3,794 -4,360 -5,089 -2,484 -19 -2,707 -4,645 -5,076 -2,589 -5,291 -96 -5,496 -41,646 Consumptive Use 0 0 0 0 0 0 0 0 0 0 0 0 0
Arizona Totals
Diversion 192,119 157,637 316,756 380,840 374,993 280,149 282,477 254,676 294,713 300,359 236,437 245,763 3,316,919 Measured Returns 47,424 49,639 56,922 53,711 50,706 54,079 59,034 56,613 56,997 60,743 50,590 55,653 652,111 Unmeasured Returns 1,854 4,500 12,997 20,821 22,199 20,604 19,054 16,365 12,764 10,725 10,028 3,394 155,305 Consumptive Use 142,841 103,498 246,837 306,308 302,088 205,466 204,389 181,698 224,952 228,891 175,819 186,716 2,509,503
Footnotes: 1 Diversion values are normally positive. Should negative diversion values occur, water is flowing from the canal to the river.
Yuma Mesa Conduit Outlet Flows (AF) = 7,240
Protective and Regulatory Pumping Unit (AF) = 26,015
8 Diversion amounts include pumpage from wells ADP-3, 4, AEW-15, 16, and the Cocopah Bend R.V. Park. The reported diversion includes deliveries to the Cocopah Tribe's Trust lands and 239 AF to the Tribe's Fee lands located within PPR No. 7. 9 Until comprehensive modeling of the Yuma area to determine how unmeasured returns are affected by pumping of the DPOC wellfield is complete, this pumpage is added to Arizona's measured returns and subtracted from Arizona's unmeasured returns.
2 The South Dike is the point of measured return flow for the Refuge and meter readings will normally indicate a positive flow of water from the Refuge into the river. If the flow reverses and water flows into the Refuge instead, a negative value will be recorded; when this occurs, this is considered a diversion. 3 Calculated by the USGS using field crop verification and ET methodologies. A description of this methodology is included in the Significant Documents. 4 MOD return flow credit is the measured flow at Station 0+00. When comparing this return value to the "Water Bypassed Pursuant to IBWC Minute No. 242", differences can result due to a combination of transmission loss, DPOC and Yuma Mesa Conduit discharge into the MODE, MODE water that has been desalinated, and MODE water discharged to the river. During periods of sustained flow in the Gila River this measurement may include both Colorado River and Gila River water. At such times Reclamation will determine how best to differentiate return flows from the two sources. 5 Diversion does not include water delivered to users (George Ogram, Ogram Boys' Enterprises, and some ASLD lands) located outside of District boundaries. 6 YMIDD receives 85 percent of the return flows from the Yuma Mesa Conduit Outlet and the Protective and Regulatory Pumping Unit; Unit B receives the remaining 15 percent.
7 Diversion is an estimate of the amount of domestic water required by FYIR, AZ.
18

Table 5. State of California - Records of Diversion, Returns, and Consumptive Use, Calendar Year 2017. (Values are in acre-feet.) WATER USER JAN FEB MAR APR MAY JUN JUL AUG SEP OCT NOV DEC TOTAL
Fort Mojave Indian Reservation Pumped from river and well for agriculture use Diversion 111 380 1,214 1,454 1,845 1,932 1,193 2,149 1,731 1,179 483 110 13,781 Pumped from wells for domestic use Diversion 5 2 3 3 5 6 5 5 5 5 3 2 49
Measured Returns 0 0 0 0 0 0 0 0 0 0 0 0 0 Unmeasured Returns 54 176 562 673 855 895 553 995 802 547 225 52 6,389 Consumptive Use 62 206 655 784 995 1,043 645 1,159 934 637 261 60 7,441
City of Needles Pumped from wells Diversion 90 90 136 153 182 191 202 199 154 198 157 135 1,887
Measured Returns 31 28 31 31 31 30 32 33 31 32 30 29 369 Unmeasured Returns 8 10 62 43 9 17 31 51 8 97 49 43 428
Consumptive Use 1 51 52 43 79 142 144 139 115 115 69 78 63 1,090
Southern California Gas Company Pumped from wells Diversion 0 0 0 1 1 2 2 3 3 1 2 1 16
Measured Returns 0 0 0 0 0 0 0 0 0 0 0 0 0 Unmeasured Returns 0 0 0 0 0 0 0 0 0 0 0 0 0
Consumptive Use 2 0 0 0 1 1 2 2 3 3 1 2 1 16
Pacific Gas and Electric Company Pumped from wells Diversion 11 14 19 20 25 30 33 32 25 21 15 14 259
Measured Returns 9 11 15 16 20 24 27 26 20 17 12 12 209 Unmeasured Returns 0 0 0 0 0 0 0 0 0 0 0 0 0
Consumptive Use 2 2 3 4 4 5 6 6 6 5 4 3 2 50
Havasu Water Company Pumped from wells Diversion 1 2 3 3 3 4 4 4 3 3 2 2 34
Measured Returns 0 0 0 0 0 0 0 0 0 0 0 0 0 Unmeasured Returns 1 1 1 1 1 2 2 1 1 1 1 1 14
Consumptive Use 2 0 1 2 2 2 2 2 3 2 2 1 1 20
Vista Del Lago Pumped from wells Diversion 1 1 2 2 2 3 3 3 2 2 2 2 25
Measured Returns 0 0 0 0 0 0 0 0 0 0 0 0 0 Unmeasured Returns 0 0 1 1 1 1 1 1 1 1 1 1 10
Consumptive Use 2 1 1 1 1 1 2 2 2 1 1 1 1 15
Non-Federal Subcontractors to the LCWSP Pumped from wells Diversion 13 16 22 23 28 35 37 36 28 24 17 17 296
Measured Returns 0 0 0 0 0 0 0 0 0 0 0 0 0 Unmeasured Returns 5 6 9 9 11 14 15 14 11 10 7 7 118
Consumptive Use 2 8 10 13 14 17 21 22 22 17 14 10 10 178
Wetmore, Kenneth C. Pumped from well Diversion 0 0 0 0 1 1 1 1 1 0 0 0 5
Measured Returns 0 0 0 0 0 0 0 0 0 0 0 0 0 Unmeasured Returns 0 0 0 0 0 0 1 0 1 0 0 0 2 Consumptive Use 0 0 0 0 1 1 0 1 0 0 0 0 3
Williams, Jerry O. and Deloris P.
Pumped from well Diversion 0 0 0 0 0 0 0 1 0 0 0 0 1 Measured Returns 0 0 0 0 0 0 0 0 0 0 0 0 0 Unmeasured Returns 0 0 0 0 0 0 0 1 0 0 0 0 1 Consumptive Use 0 0 0 0 0 0 0 0 0 0 0 0 0
19
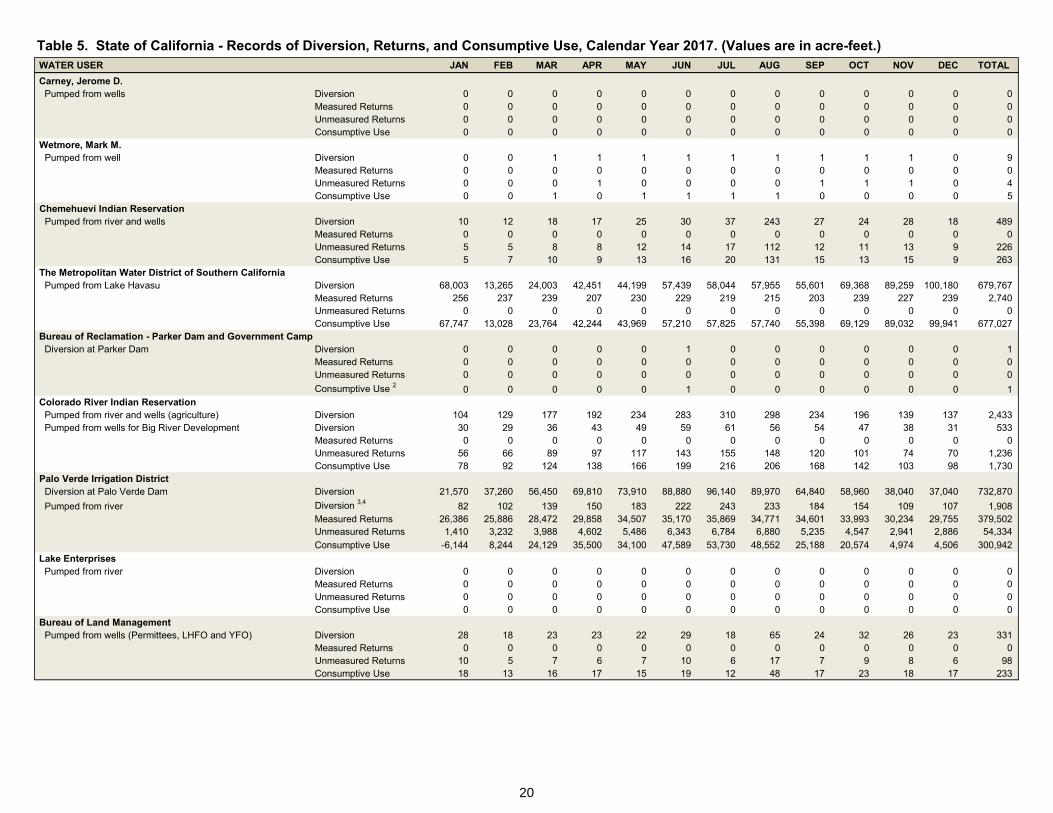
Table 5. State of California - Records of Diversion, Returns, and Consumptive Use, Calendar Year 2017. (Values are in acre-feet.) WATER USER JAN FEB MAR APR MAY JUN JUL AUG SEP OCT NOV DEC TOTAL
Carney, Jerome D. Pumped from wells Diversion 0 0 0 0 0 0 0 0 0 0 0 0 0
Measured Returns 0 0 0 0 0 0 0 0 0 0 0 0 0 Unmeasured Returns 0 0 0 0 0 0 0 0 0 0 0 0 0 Consumptive Use 0 0 0 0 0 0 0 0 0 0 0 0 0
Wetmore, Mark M. Pumped from well Diversion 0 0 1 1 1 1 1 1 1 1 1 0 9
Measured Returns 0 0 0 0 0 0 0 0 0 0 0 0 0 Unmeasured Returns 0 0 0 1 0 0 0 0 1 1 1 0 4 Consumptive Use 0 0 1 0 1 1 1 1 0 0 0 0 5
Chemehuevi Indian Reservation Pumped from river and wells Diversion 10 12 18 17 25 30 37 243 27 24 28 18 489
Measured Returns 0 0 0 0 0 0 0 0 0 0 0 0 0 Unmeasured Returns 5 5 8 8 12 14 17 112 12 11 13 9 226 Consumptive Use 5 7 10 9 13 16 20 131 15 13 15 9 263
The Metropolitan Water District of Southern California Pumped from Lake Havasu Diversion 68,003 13,265 24,003 42,451 44,199 57,439 58,044 57,955 55,601 69,368 89,259 100,180 679,767
Measured Returns 256 237 239 207 230 229 219 215 203 239 227 239 2,740 Unmeasured Returns 0 0 0 0 0 0 0 0 0 0 0 0 0 Consumptive Use 67,747 13,028 23,764 42,244 43,969 57,210 57,825 57,740 55,398 69,129 89,032 99,941 677,027
Bureau of Reclamation - Parker Dam and Government Camp Diversion at Parker Dam Diversion 0 0 0 0 0 1 0 0 0 0 0 0 1
Measured Returns 0 0 0 0 0 0 0 0 0 0 0 0 0 Unmeasured Returns 0 0 0 0 0 0 0 0 0 0 0 0 0
Consumptive Use 2 0 0 0 0 0 1 0 0 0 0 0 0 1
Colorado River Indian Reservation Pumped from river and wells (agriculture) Diversion 104 129 177 192 234 283 310 298 234 196 139 137 2,433 Pumped from wells for Big River Development Diversion 30 29 36 43 49 59 61 56 54 47 38 31 533
Measured Returns 0 0 0 0 0 0 0 0 0 0 0 0 0 Unmeasured Returns 56 66 89 97 117 143 155 148 120 101 74 70 1,236 Consumptive Use 78 92 124 138 166 199 216 206 168 142 103 98 1,730
Palo Verde Irrigation District Diversion at Palo Verde Dam Diversion 21,570 37,260 56,450 69,810 73,910 88,880 96,140 89,970 64,840 58,960 38,040 37,040 732,870
Pumped from river Diversion 3,4 82 102 139 150 183 222 243 233 184 154 109 107 1,908
Measured Returns 26,386 25,886 28,472 29,858 34,507 35,170 35,869 34,771 34,601 33,993 30,234 29,755 379,502 Unmeasured Returns 1,410 3,232 3,988 4,602 5,486 6,343 6,784 6,880 5,235 4,547 2,941 2,886 54,334
Consumptive Use -6,144 8,244 24,129 35,500 34,100 47,589 53,730 48,552 25,188 20,574 4,974 4,506 300,942
Lake Enterprises Pumped from river Diversion 0 0 0 0 0 0 0 0 0 0 0 0 0
Measured Returns 0 0 0 0 0 0 0 0 0 0 0 0 0 Unmeasured Returns 0 0 0 0 0 0 0 0 0 0 0 0 0 Consumptive Use 0 0 0 0 0 0 0 0 0 0 0 0 0
Bureau of Land Management Pumped from wells (Permittees, LHFO and YFO) Diversion 28 18 23 23 22 29 18 65 24 32 26 23 331
Measured Returns 0 0 0 0 0 0 0 0 0 0 0 0 0 Unmeasured Returns 10 5 7 6 7 10 6 17 7 9 8 6 98 Consumptive Use 18 13 16 17 15 19 12 48 17 23 18 17 233
20

Table 5. State of California - Records of Diversion, Returns, and Consumptive Use, Calendar Year 2017. (Values are in acre-feet.) WATER USER JAN FEB MAR APR MAY JUN JUL AUG SEP OCT NOV DEC TOTAL
Yuma Project Reservation Division Indian Unit Diversion at Imperial Dam Diversion 1,880 2,044 5,328 7,394 5,506 3,144 1,846 3,436 2,803 4,619 3,368 3,072 44,440
Pumped from wells for domestic use Diversion 5 34 42 58 63 76 93 101 97 77 64 45 45 795
Measured Returns 142 82 117 55 17 9 6 15 49 50 115 74 731 Unmeasured Returns 320 348 899 1,245 932 541 325 590 481 782 570 521 7,554
Bard Unit Diversion at Imperial Dam Diversion 1,807 1,960 3,858 5,041 3,162 3,157 2,708 2,404 3,459 3,880 3,755 2,795 37,986
Measured Returns 79 45 45 21 6 5 5 5 35 24 73 38 381 Unmeasured Returns 302 327 644 842 528 527 452 401 578 648 627 467 6,343
Unassigned Yuma Project Reservation Division Measured Returns 6 2,397 1,896 1,842 2,375 2,172 2,228 1,345 1,345 1,451 1,873 2,263 2,109 23,296
Total Yuma Project Reservation Division Consumptive Use 7 481 1,348 5,697 7,960 5,089 3,084 2,522 3,581 3,745 5,186 3,520 2,703 44,916
Fort Yuma Indian Reservation Ranch 1
Pumped from well and river (CEW-2; CDP-3) Diversion 4 13 16 21 23 28 34 37 36 28 24 17 17 294
Ranch 2 Parcel 3
Pumped from well and river (CEW-2; CDP-4) Diversion 4 7 9 12 13 16 20 21 21 16 14 10 9 168
Ranch 3
Pumped from well and river (CEW-2; CDP-5) Diversion 4 0 0 0 0 0 0 0 0 0 0 0 0 0
Ranch 4
Pumped from well and river (CEW-1,15; CDP-1,2) Diversion 4 41 52 70 76 93 113 123 119 93 78 55 55 968
Ranch 5 Diverted from the AAC Diversion 23 19 118 78 111 170 35 0 109 108 85 76 932 Ranch 7
Pumped from well and river (CEW-1,15; CDP-1,2) Diversion 4 8 10 14 15 18 22 24 23 18 15 11 10 188
Ranch 15
Pumped from well (CEW-14) Diversion 4 18 24 32 35 42 52 56 54 43 36 25 25 442
Ranch 17
Pumped from river (CDP-6,7) Diversion 4 0 0 0 0 0 0 0 0 0 0 0 0 0
Sum of Diversions for the FYIR Ranches in California Diversion 110 130 267 240 308 411 296 253 307 275 203 192 2,992 Measured Returns 0 0 0 0 0 0 0 0 0 0 0 0 0 Unmeasured Returns 50 57 119 108 139 184 133 113 138 123 89 85 1,338 Consumptive Use 60 73 148 132 169 227 163 140 169 152 114 107 1,654
Yuma Island California
Arizona State Land Department Trust Lands Diversion 4 171 214 292 314 389 468 512 488 386 327 231 222 4,014
Measured Returns 0 0 0 0 0 0 0 0 0 0 0 0 0 Unmeasured Returns 78 96 129 140 176 207 229 220 172 146 104 98 1,795 Consumptive Use 93 118 163 174 213 261 283 268 214 181 127 124 2,219
City of Winterhaven Pumped from well Diversion 8 8 8 7 7 14 7 8 7 8 8 7 97
Measured Returns 0 0 0 0 0 0 0 0 0 0 0 0 0 Unmeasured Returns 3 2 3 2 2 5 2 3 2 3 3 2 32 Consumptive Use 5 6 5 5 5 9 5 5 5 5 5 5 65
21

Table 5. State of California - Records of Diversion, Returns, and Consumptive Use, Calendar Year 2017. (Values are in acre-feet.) WATER USER JAN FEB MAR APR MAY JUN JUL AUG SEP OCT NOV DEC TOTAL
Imperial Irrigation District Diversion at Imperial Dam
Delivery from Warren H. Brock Reservoir Total IID Consumptive Use
Water Transferred to SDCWA for Mitigation
Coachella Valley Water District Diversion at Imperial Dam
Diversion Measured Returns Unmeasured Returns
Consumptive Use 8
Total Consumptive Use
Diversion 9
Measured Returns Consumptive Use
Diversion Measured Returns Unmeasured Returns Consumptive Use
58,392 6,985
0
11,514 62,921
19,512 2,334
17,178
13,207 1,580
0 11,627
127,709 8,182
0
12,385 131,912
11,142 714
10,428
19,622 1,257
0 18,365
245,589 8,320
0
14,275 251,544
5,246 178
5,068
26,805 908
0 25,897
268,744 3,236
0
12,542 278,050
3,318 40
3,278
31,836 383
0 31,453
283,328 1,429
0
12,290 294,189
2,443 12
2,431
35,883 181
0 35,702
279,141 1,371
0
9,489 287,259
4,670 23
4,647
36,715 180
0 36,535
261,534 1,373
0
9,140 269,301
6,876 36
6,840
37,300 196
0 37,104
228,921 1,534
0
9,392 236,779
7,379 49
7,330
36,673 246
0 36,427
215,151 6,462
0
0 208,689
3,554 107
3,447
28,945 869
0 28,076
229,926 3,999
0
0 225,927
11,645 203
11,442
29,222 508
0 28,714
156,229 8,487
0
10,550 158,292
13,966 759
13,207
28,214 1,533
0 26,681
133,951 5,275
0
14,632 143,308
20,673 814
19,859
19,508 768
0 18,740
2,488,615 56,653
0
116,2092,548,171
110,424 5,269
105,155
343,930 8,609
0 335,321
California Totals Diversion Measured Returns Unmeasured Returns Consumptive Use
185,180 40,199 2,302
154,193
214,191 38,338 4,331
183,907
369,697 40,167 6,521
337,284
431,303 36,222 7,778
399,845
451,817 38,605 8,276
417,226
476,961 39,269 8,903
438,278
467,514 39,108 8,706
428,840
430,913 38,239 9,547
392,519
377,606 43,828 7,570
326,208
410,181 40,938 7,027
362,216
334,340 43,733 4,713
296,444
318,284 39,113 4,248
289,555
4,467,987 477,759 79,922
4,026,515
Footnotes: 1 In 2017, the City of Needles (Needles) conserved 146 AF under the Pilot System Conservation Program. In accordance with System Conservation Implementation Agreement No. 15-XX-30-W0596, Needles' Colorado River consumptive use in excess of 1,077 AF (its 1,223 AF PPR entitlement adjusted for the 146 AF of conservation) is offset by pumping from the LCWSP. For additional details, see Table 16. 2 Tabulated consumptive use is offset by pumping from the LCWSP. For additional details, see Table 16. 3 Water pumped from the river for delivery to non-canal lands served by PVID upstream of Palo Verde Diversion Dam. The water reported in this line item represents a portion of the diversion previously reported within the item "Colorado River Indian Reservation: Pumped from river and wells (agriculture)". 4 Calculated by the USGS using field crop verification and ET methodologies. A description of this methodology is included in the Significant Documents. Points of diversion for the Yuma Island in CA are AEP-02, AEP-03, AEW-04, AEW-05, ADW-03, CEP-01, CEP-02, CDW-02, CDW-05, CDW-07, CDW-08, CEW-07, CEW-09, CEW-12, CEW-13. See the USGS maps in the Significant Documents section. 5 Diversion is an estimate of the amount of domestic water required by the YPRD Indian Unit. 6 Unassigned measured returns include drainage from the Indian Unit and the Bard Unit in the Reservation Division, but excludes seepage from the AAC. 7 Calculated as the sum of diversions (83,221 AF) minus the sum of: measured returns (1,112 AF), unmeasured returns (13,897 AF) and unassigned measured returns (23,296 AF). 8 Colorado River water captured in the Warren H. Brock Reservoir and delivered to IID as consumptive use. Flow measurement is made at the Brock Reservoir outlet channel, Station 21+36. 9 As referenced in Column 7, Exhibit B, of the CRWDA and the IID/SDCWA Water Transfer Agreement, as amended, IID conserves water for transfer to SDCWA for delivery, by exchange from non-Colorado River sources, to the Salton Sea for mitigation purposes. For additional details, see Table 18.
22
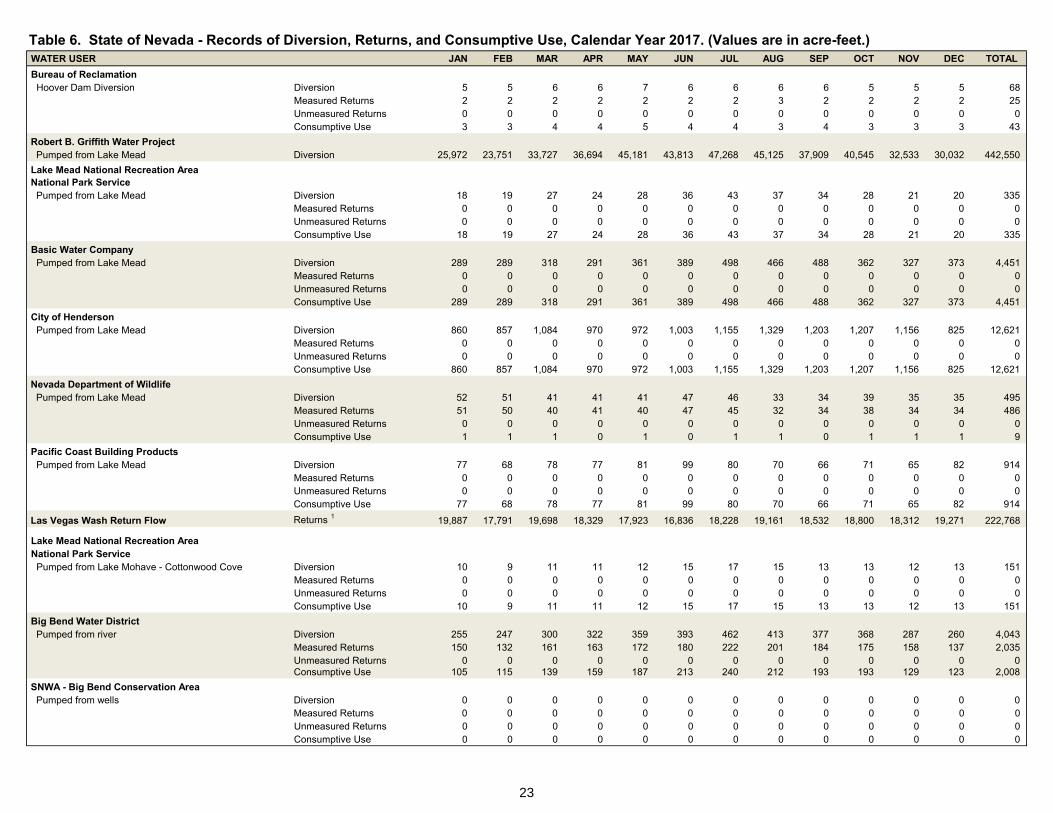
Table 6. State of Nevada - Records of Diversion, Returns, and Consumptive Use, Calendar Year 2017. (Values are in acre-feet.) WATER USER JAN FEB MAR APR MAY JUN JUL AUG SEP OCT NOV DEC TOTAL
Bureau of Reclamation Hoover Dam Diversion Diversion 5 5 6 6 7 6 6 6 6 5 5 5 68
Measured Returns 2 2 2 2 2 2 2 3 2 2 2 2 25 Unmeasured Returns 0 0 0 0 0 0 0 0 0 0 0 0 0 Consumptive Use 3 3 4 4 5 4 4 3 4 3 3 3 43
Robert B. Griffith Water Project Pumped from Lake Mead Diversion 25,972 23,751 33,727 36,694 45,181 43,813 47,268 45,125 37,909 40,545 32,533 30,032 442,550
Lake Mead National Recreation Area National Park Service
Pumped from Lake Mead Diversion 18 19 27 24 28 36 43 37 34 28 21 20 335 Measured Returns 0 0 0 0 0 0 0 0 0 0 0 0 0 Unmeasured Returns 0 0 0 0 0 0 0 0 0 0 0 0 0 Consumptive Use 18 19 27 24 28 36 43 37 34 28 21 20 335
Basic Water Company Pumped from Lake Mead Diversion 289 289 318 291 361 389 498 466 488 362 327 373 4,451
Measured Returns 0 0 0 0 0 0 0 0 0 0 0 0 0 Unmeasured Returns 0 0 0 0 0 0 0 0 0 0 0 0 0 Consumptive Use 289 289 318 291 361 389 498 466 488 362 327 373 4,451
City of Henderson Pumped from Lake Mead Diversion 860 857 1,084 970 972 1,003 1,155 1,329 1,203 1,207 1,156 825 12,621
Measured Returns 0 0 0 0 0 0 0 0 0 0 0 0 0 Unmeasured Returns 0 0 0 0 0 0 0 0 0 0 0 0 0 Consumptive Use 860 857 1,084 970 972 1,003 1,155 1,329 1,203 1,207 1,156 825 12,621
Nevada Department of Wildlife Pumped from Lake Mead Diversion 52 51 41 41 41 47 46 33 34 39 35 35 495
Measured Returns 51 50 40 41 40 47 45 32 34 38 34 34 486 Unmeasured Returns 0 0 0 0 0 0 0 0 0 0 0 0 0 Consumptive Use 1 1 1 0 1 0 1 1 0 1 1 1 9
Pacific Coast Building Products Pumped from Lake Mead Diversion 77 68 78 77 81 99 80 70 66 71 65 82 914
Measured Returns 0 0 0 0 0 0 0 0 0 0 0 0 0 Unmeasured Returns 0 0 0 0 0 0 0 0 0 0 0 0 0 Consumptive Use 77 68 78 77 81 99 80 70 66 71 65 82 914
Las Vegas Wash Return Flow Returns 1 19,887 17,791 19,698 18,329 17,923 16,836 18,228 19,161 18,532 18,800 18,312 19,271 222,768
Lake Mead National Recreation Area National Park Service Pumped from Lake Mohave - Cottonwood Cove Diversion 10 9 11 11 12 15 17 15 13 13 12 13 151
Measured Returns 0 0 0 0 0 0 0 0 0 0 0 0 0 Unmeasured Returns 0 0 0 0 0 0 0 0 0 0 0 0 0 Consumptive Use 10 9 11 11 12 15 17 15 13 13 12 13 151
Big Bend Water District Pumped from river Diversion 255 247 300 322 359 393 462 413 377 368 287 260 4,043
Measured Returns 150 132 161 163 172 180 222 201 184 175 158 137 2,035 Unmeasured Returns 0 0 0 0 0 0 0 0 0 0 0 0 0 Consumptive Use 105 115 139 159 187 213 240 212 193 193 129 123 2,008
SNWA - Big Bend Conservation Area Pumped from wells Diversion 0 0 0 0 0 0 0 0 0 0 0 0 0
Measured Returns 0 0 0 0 0 0 0 0 0 0 0 0 0 Unmeasured Returns 0 0 0 0 0 0 0 0 0 0 0 0 0 Consumptive Use 0 0 0 0 0 0 0 0 0 0 0 0 0
23
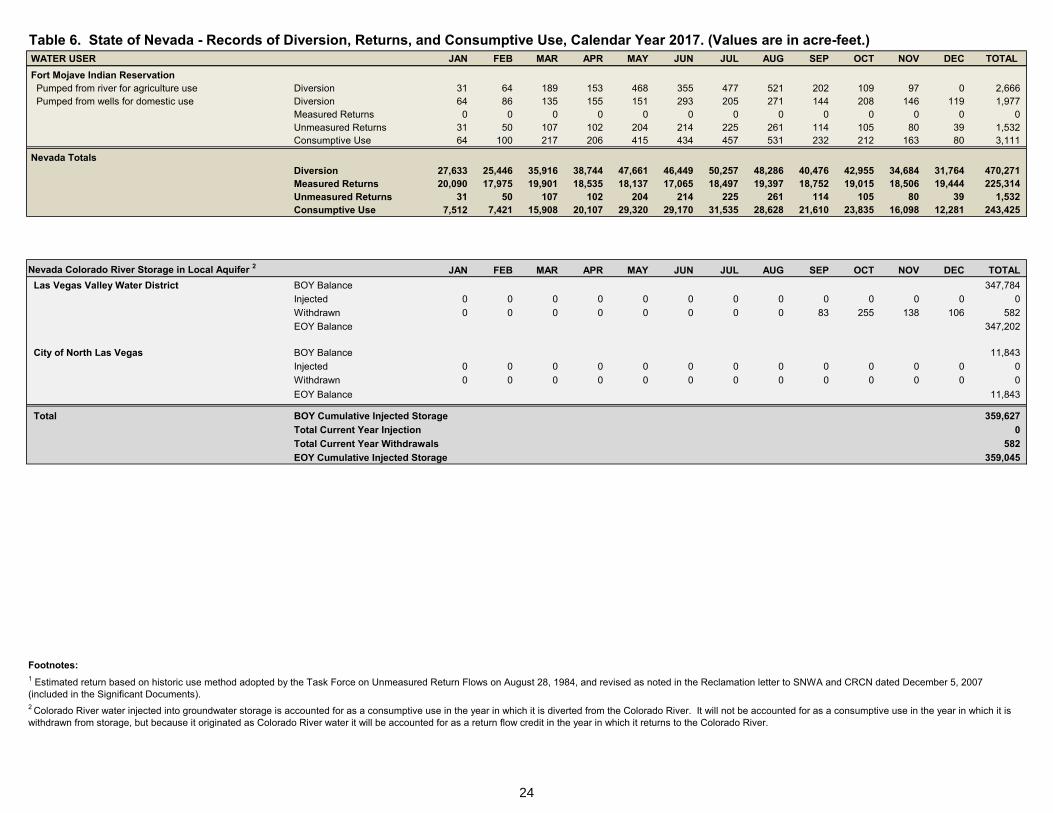
Table 6. State of Nevada - Records of Diversion, Returns, and Consumptive Use, Calendar Year 2017. (Values are in acre-feet.) WATER USER JAN FEB MAR APR MAY JUN JUL AUG SEP OCT NOV DEC TOTAL
Fort Mojave Indian Reservation Pumped from river for agriculture use Diversion 31 64 189 153 468 355 477 521 202 109 97 0 2,666 Pumped from wells for domestic use Diversion 64 86 135 155 151 293 205 271 144 208 146 119 1,977
Measured Returns 0 0 0 0 0 0 0 0 0 0 0 0 0 Unmeasured Returns 31 50 107 102 204 214 225 261 114 105 80 39 1,532 Consumptive Use 64 100 217 206 415 434 457 531 232 212 163 80 3,111
Nevada Totals Diversion Measured Returns Unmeasured Returns Consumptive Use
27,633 20,090
31 7,512
25,446 17,975
50 7,421
35,916 19,901
107 15,908
38,744 18,535
102 20,107
47,661 18,137
204 29,320
46,449 17,065
214 29,170
50,257 18,497
225 31,535
48,286 19,397
261 28,628
40,476 18,752
114 21,610
42,955 19,015
105 23,835
34,684 18,506
80 16,098
31,764 19,444
39 12,281
470,271 225,314
1,532 243,425
Nevada Colorado River Storage in Local Aquifer 2 JAN FEB MAR APR MAY JUN JUL AUG SEP OCT NOV DEC TOTAL
Las Vegas Valley Water District BOY Balance
Injected 0
Withdrawn 0
EOY Balance
0
0
0
0
0
0
0
0
0
0
0
0
0
0
0
83
0
255
0
138
0
106
347,784
0
582
347,202
City of North Las Vegas BOY Balance
Injected 0
Withdrawn 0
EOY Balance
0
0
0
0
0
0
0
0
0
0
0
0
0
0
0
0
0
0
0
0
0
0
11,843
0
0
11,843
Total BOY Cumulative Injected Storage
Total Current Year Injection
Total Current Year Withdrawals
EOY Cumulative Injected Storage
359,627
0
582
359,045
Footnotes: 1 Estimated return based on historic use method adopted by the Task Force on Unmeasured Return Flows on August 28, 1984, and revised as noted in the Reclamation letter to SNWA and CRCN dated December 5, 2007 (included in the Significant Documents). 2 Colorado River water injected into groundwater storage is accounted for as a consumptive use in the year in which it is diverted from the Colorado River. It will not be accounted for as a consumptive use in the year in which it is withdrawn from storage, but because it originated as Colorado River water it will be accounted for as a return flow credit in the year in which it returns to the Colorado River.
24
ARTICLE V(C): RECORDS FOR THE DISPOSITION OF WATER ORDERED BUT NOT DIVERTED
In accordance with Article V(C) of the Consolidated Decree, Tables 7 and 8 document records of releases of mainstream water pursuant to orders therefor but not diverted by the party ordering the same, and the quantity of such water delivered to Mexico in satisfaction of the 1944 Mexican Water Treaty (Treaty) or diverted by others in satisfaction of decreed rights.
In addition to the requirements of the Decree, the tabulations provided herewith also document quantities of such water passing to Mexico in excess of Treaty requirements and quantities captured in storage.
Water ordered but not diverted is the difference between the approved daily order and the mean daily delivery on the day the diversion was made. Daily orders are provided to Reclamation in advance of the delivery date by the amount of time required for water to travel between the storage location and the user’s point of diversion from the mainstream.
To the extent possible, water ordered but not diverted was delivered to other diverters in satisfaction of their water rights. Any remaining water ordered but not diverted was distributed between delivery to storage, delivery to Mexico in satisfaction of Treaty requirements, and to Mexico in excess of Treaty requirements.
The water users listed in this tabulation are major water users from whom Reclamation receives a daily water order and, with the exception of CAP and MWD, are those that divert their water downstream of Parker Dam. Currently, no daily orders are received from water users in Nevada, therefore Reclamation has not created a tabulation for Nevada water users. In addition, the storage capacity of Lake Mead is large enough relative to Nevada’s daily diversions from the reservoir that any water ordered but not diverted would be retained for future use and would not pass to Mexico in excess of Treaty requirements.
The “Passing to Mexico in Excess of Treaty” values displayed in this section of the report reflect the sum of the daily amounts of water passing to Mexico in excess of the daily Treaty amount, according to IBWC’s schedule, resulting from water that had been ordered but not diverted. The “To Mexico in Excess of Treaty” values displayed in the Article V(D) section reflect all water under/over delivered to Mexico according to IBWC’s schedule. The information provided in Article V(C) is unrelated to information provided in Article V(D) and comparisons between the tabulations should not be made.
25

Table 7. State of Arizona - Disposition of Water Ordered but not Diverted, Calendar Year 2017. (Values are in acre-feet.)
WATER USER JAN FEB MAR APR MAY JUN JUL AUG SEP OCT NOV DEC TOTAL
Central Arizona Project - Diversion at Lake Havasu
Ordered but not Diverted 1
Delivered to Mexico in Satisfaction of Treaty Diverted by Others Delivered to Storage 2
Passing to Mexico in Excess of Treaty
Colorado River Indian Reservation - Diversion at Headgate Rock Dam
Ordered but not Diverted 1
Delivered to Mexico in Satisfaction of Treaty Diverted by Others Delivered to Storage 3
Passing to Mexico in Excess of Treaty
North Gila Valley Irrigation District - Diversion at Imperial Dam
Ordered but not Diverted 1
Delivered to Mexico in Satisfaction of Treaty Diverted by Others Delivered to Storage 3
Passing to Mexico in Excess of Treaty
Gila Monster Farms - Diversion at Imperial Dam
Ordered but not Diverted 1
Delivered to Mexico in Satisfaction of Treaty Diverted by Others Delivered to Storage 3
Passing to Mexico in Excess of Treaty
Wellton-Mohawk I.D.D. - Diversion at Imperial Dam
Ordered but not Diverted 1
Delivered to Mexico in Satisfaction of Treaty Diverted by Others Delivered to Storage 3
Passing to Mexico in Excess of Treaty
Yuma Irrigation District - Diversion at Imperial Dam
Ordered but not Diverted 1
Delivered to Mexico in Satisfaction of Treaty Diverted by Others Delivered to Storage 3
Passing to Mexico in Excess of Treaty
Yuma Mesa I.D.D. - Diversion at Imperial Dam
Ordered but not Diverted 1
Delivered to Mexico in Satisfaction of Treaty Diverted by Others Delivered to Storage 3
Passing to Mexico in Excess of Treaty
10,472
10,472
5,720 3,007 1,899
811 3
310 98
158 17 37
301 115 154
8 24
3,249 832
2,093 16
307
330 140 135 28 27
1,401 259 991
6 146
467
467
1,287 455 472 357
3
202 93 51 55
3
474 167 214 86
7
2,243 1,449
272 455
66
333 110 158 63
1
1,414 562 611 224
17
638
638
2,575 588
1,730 219
37
270 57
132 77
4
258 26
148 80
5
1,314 366 649 214
85
228 14
154 43 18
2,143 842
1,016 268
18
7,348
7,348
3,606 1,087 2,063
403 53
308 91
157 59
2
184 81 98 3 2
808 391 358 25 34
161 91 55 12
3
1,151 540 449 145
16
5,893
5,893
4,503 1,674 1,889
765 174
382 178 158 27 19
136 34 63 30
8
1,951 781 779 350
40
179 105
45 27
2
1,497 882 359 174
83
767
767
4,318 1,137 2,259
831 91
183 39 66 70
8
181 29
106 46
0
1,171 316 431 406
19
346 31
155 148
12
1,710 440 743 508
19
669
669
3,146 971
1,673 474
27
396 123 143 122
8
254 85
117 51
1
1,469 296 681 488
5
158 113
33 12
0
1,293 533 435 320
5
1,657
1,657
6,244 2,377 2,923
840 104
387 177 182 22
7
294 102 136 48
7
1,150 335 353 444
19
90 40 41 8 1
1,396 536 636 206
18
3,530
3,530
4,677 1,485 1,482
251 1,459
614 63
468 77
6
592 119 362 34 77
1,980 305 732 109 834
146 22 67 19 37
1,855 797 763 151 143
1,187
1,187
3,001 1,040 1,474
441 46
233 53
144 22 14
169 47 93 27
3
458 92
261 68 37
157 56 80 17
4
1,996 709 804 433
50
216
216
1,488 823 452 192
21
410 226 142
36 8
210 137
41 26
5
2,580 1,202 1,206
112 60
255 91
137 21
7
2,111 1,034 1,017
52 9
4,602
4,602
3,477 1,206 1,580
665 26
272 149
78 42
3
337 180 104
48 5
489 62
375 48
4
82 12 66 4 0
1,418 925 366 104
23
37,446
37,446
44,04215,85019,8966,2492,044
3,9671,3471,879
625119
3,3901,1221,636
490144
18,8626,4278,1902,7351,510
2,465825
1,126402112
19,3858,0598,1902,591
547
26
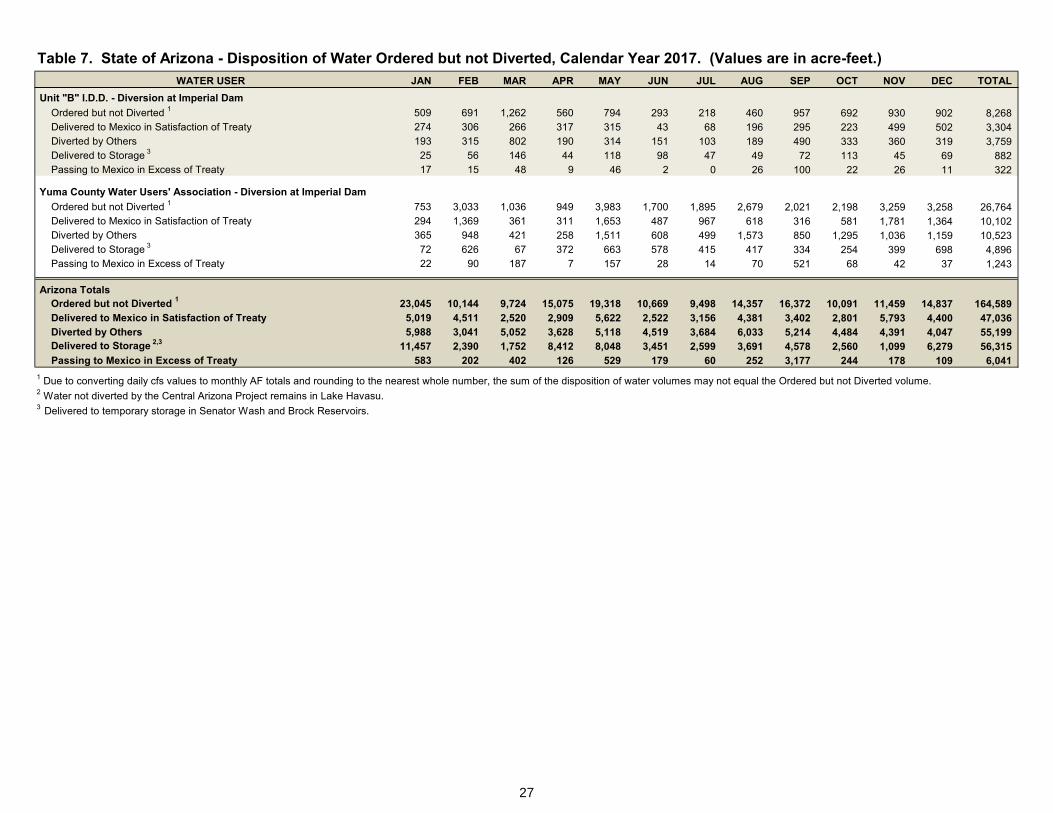
Table 7. State of Arizona - Disposition of Water Ordered but not Diverted, Calendar Year 2017. (Values are in acre-feet.)
WATER USER JAN FEB MAR APR MAY JUN JUL AUG SEP OCT NOV DEC TOTAL
Unit "B" I.D.D. - Diversion at Imperial Dam
Ordered but not Diverted 1
Delivered to Mexico in Satisfaction of Treaty Diverted by Others Delivered to Storage 3
Passing to Mexico in Excess of Treaty
Yuma County Water Users' Association - Diversion at Imperial Dam
Ordered but not Diverted 1
Delivered to Mexico in Satisfaction of Treaty Diverted by Others Delivered to Storage 3
Passing to Mexico in Excess of Treaty
509 274 193 25 17
753 294 365 72 22
691 306 315 56 15
3,033 1,369
948 626
90
1,262 266 802 146
48
1,036 361 421 67
187
560 317 190 44
9
949 311 258 372
7
794 315 314 118
46
3,983 1,653 1,511
663 157
293 43
151 98
2
1,700 487 608 578
28
218 68
103 47
0
1,895 967 499 415
14
460 196 189 49 26
2,679 618
1,573 417
70
957 295 490 72
100
2,021 316 850 334 521
692 223 333 113
22
2,198 581
1,295 254
68
930 499 360 45 26
3,259 1,781 1,036
399 42
902 502 319 69 11
3,258 1,364 1,159
698 37
8,2683,3043,759
882322
26,76410,10210,5234,8961,243
Arizona Totals Ordered but not Diverted 1
Delivered to Mexico in Satisfaction of Treaty Diverted by Others Delivered to Storage 2,3
Passing to Mexico in Excess of Treaty
23,045 5,019 5,988
11,457 583
10,144 4,511 3,041 2,390
202
9,724 2,520 5,052 1,752
402
15,075 2,909 3,628 8,412
126
19,318 5,622 5,118 8,048
529
10,669 2,522 4,519 3,451
179
9,498 3,156 3,684 2,599
60
14,357 4,381 6,033 3,691
252
16,372 3,402 5,214 4,578 3,177
10,091 2,801 4,484 2,560
244
11,459 5,793 4,391 1,099
178
14,837 4,400 4,047 6,279
109
164,58947,03655,19956,315
6,041
1 Due to converting daily cfs values to monthly AF totals and rounding to the nearest whole number, the sum of the disposition of water volumes may not equal the Ordered but not Diverted volume. 2 Water not diverted by the Central Arizona Project remains in Lake Havasu. 3 Delivered to temporary storage in Senator Wash and Brock Reservoirs.
27
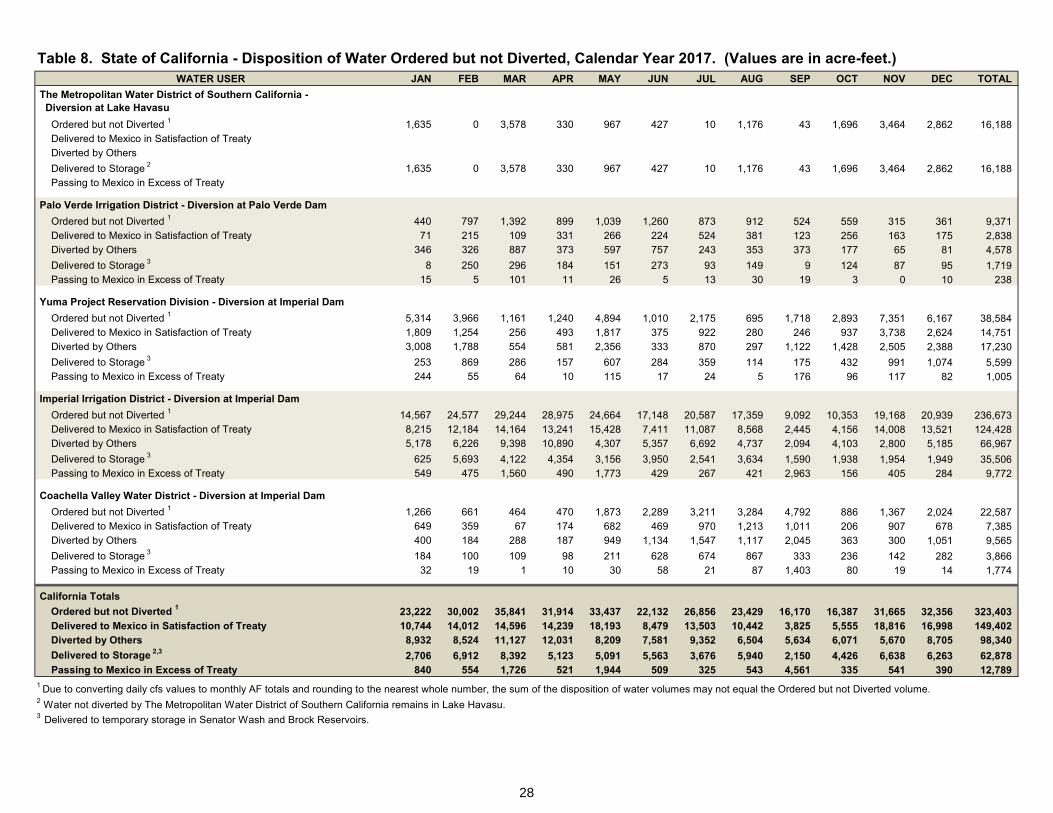
Table 8. State of California - Disposition of Water Ordered but not Diverted, Calendar Year 2017. (Values are in acre-feet.) WATER USER JAN FEB MAR APR MAY JUN JUL AUG SEP OCT NOV DEC TOTAL
The Metropolitan Water District of Southern California - Diversion at Lake Havasu
Ordered but not Diverted 1
Delivered to Mexico in Satisfaction of Treaty Diverted by Others
Delivered to Storage 2
Passing to Mexico in Excess of Treaty
Palo Verde Irrigation District - Diversion at Palo Verde Dam
Ordered but not Diverted 1
Delivered to Mexico in Satisfaction of Treaty Diverted by Others
Delivered to Storage 3
Passing to Mexico in Excess of Treaty
Yuma Project Reservation Division - Diversion at Imperial Dam
Ordered but not Diverted 1
Delivered to Mexico in Satisfaction of Treaty Diverted by Others
Delivered to Storage 3
Passing to Mexico in Excess of Treaty
Imperial Irrigation District - Diversion at Imperial Dam
Ordered but not Diverted 1
Delivered to Mexico in Satisfaction of Treaty Diverted by Others
Delivered to Storage 3
Passing to Mexico in Excess of Treaty
Coachella Valley Water District - Diversion at Imperial Dam
Ordered but not Diverted 1
Delivered to Mexico in Satisfaction of Treaty Diverted by Others
Delivered to Storage 3
Passing to Mexico in Excess of Treaty
1,635
1,635
440 71
346
8 15
5,314 1,809 3,008
253 244
14,567 8,215 5,178
625 549
1,266 649 400
184 32
0
0
797 215 326
250 5
3,966 1,254 1,788
869 55
24,577 12,184
6,226
5,693 475
661 359 184
100 19
3,578
3,578
1,392 109 887
296 101
1,161 256 554
286 64
29,244 14,164
9,398
4,122 1,560
464 67
288
109 1
330
330
899 331 373
184 11
1,240 493 581
157 10
28,975 13,241 10,890
4,354 490
470 174 187
98 10
967
967
1,039 266 597
151 26
4,894 1,817 2,356
607 115
24,664 15,428
4,307
3,156 1,773
1,873 682 949
211 30
427
427
1,260 224 757
273 5
1,010 375 333
284 17
17,148 7,411 5,357
3,950 429
2,289 469
1,134
628 58
10
10
873 524 243
93 13
2,175 922 870
359 24
20,587 11,087
6,692
2,541 267
3,211 970
1,547
674 21
1,176
1,176
912 381 353
149 30
695 280 297
114 5
17,359 8,568 4,737
3,634 421
3,284 1,213 1,117
867 87
43
43
524 123 373
9 19
1,718 246
1,122
175 176
9,092 2,445 2,094
1,590 2,963
4,792 1,011 2,045
333 1,403
1,696
1,696
559 256 177
124 3
2,893 937
1,428
432 96
10,353 4,156 4,103
1,938 156
886 206 363
236 80
3,464
3,464
315 163
65
87 0
7,351 3,738 2,505
991 117
19,168 14,008
2,800
1,954 405
1,367 907 300
142 19
2,862
2,862
361 175
81
95 10
6,167 2,624 2,388
1,074 82
20,939 13,521
5,185
1,949 284
2,024 678
1,051
282 14
16,188
16,188
9,3712,8384,578
1,719238
38,58414,75117,230
5,5991,005
236,673124,428
66,967
35,5069,772
22,5877,3859,565
3,8661,774
California Totals
Ordered but not Diverted 1
Delivered to Mexico in Satisfaction of Treaty Diverted by Others
Delivered to Storage 2,3
Passing to Mexico in Excess of Treaty
23,222 10,744 8,932
2,706 840
30,002 14,012
8,524
6,912 554
35,841 14,596 11,127
8,392 1,726
31,914 14,239 12,031
5,123 521
33,437 18,193
8,209
5,091 1,944
22,132 8,479 7,581
5,563 509
26,856 13,503
9,352
3,676 325
23,429 10,442
6,504
5,940 543
16,170 3,825 5,634
2,150 4,561
16,387 5,555 6,071
4,426 335
31,665 18,816
5,670
6,638 541
32,356 16,998
8,705
6,263 390
323,403149,402
98,340
62,87812,789
1 Due to converting daily cfs values to monthly AF totals and rounding to the nearest whole number, the sum of the disposition of water volumes may not equal the Ordered but not Diverted volume. 2 Water not diverted by The Metropolitan Water District of Southern California remains in Lake Havasu. 3 Delivered to temporary storage in Senator Wash and Brock Reservoirs.
28

ARTICLE V(D): RECORDS OF DELIVERIES TO MEXICO IN SATISFACTION OF PART III OF THE 1944 TREATY REQUIREMENTS AND WATER PASSING TO MEXICO
IN EXCESS OF TREATY REQUIREMENTS
In accordance with Article V(D) of the Consolidated Decree, Table 9 documents the records of deliveries to Mexico of water in satisfaction of the obligations of Part III of the “Utilization of Waters of the Colorado and Tijuana Rivers and of the Rio Grande” (1944 Mexican Water Treaty (Treaty)), signed February 3, 1944 and water passing to Mexico in excess of Treaty requirements. The tabulations, based upon records furnished by the U.S. Section of the IBWC, show the quantities of water delivered to Mexico at the Northerly International Boundary, the Southerly International Boundary, the Limitrophe, and emergency deliveries to Tijuana (as applicable), pursuant to Articles 10 and 15 of the 1944 Mexican Water Treaty and related Minutes of the IBWC; and the quantities of water passing to Mexico in excess of Treaty requirements.
Minutes incorporated into the tabulations include:
1) Minute No. 242 – Permanent and Definitive Solution to the International Problem of the Salinity of the Colorado River, signed August 30, 1973.
2) Minute No. 318 – Adjustment of Delivery Schedules for Water Allotted to Mexico for the Years 2010 through 2013 as a Result of Infrastructure Damage in Irrigation District 014, Rio Colorado, Caused by the April 2010 Earthquake in the Mexicali Valley, Baja California, signed December 17, 2010.
3) Minute No. 319 – Interim International Cooperative Measures in the Colorado River Basin Through 2017 and Extension of Minute 318 Cooperative Measures to Address the Continued Effects of the April 2010 Earthquake in the Mexicali Valley, Baja California, signed November 20, 2012.
4) Minute No. 322 – Extension of the Temporary Emergency Delivery of Colorado River Water for Use in Tijuana, Baja California, signed January 19, 2017.
5) Minute No. 323 – Extension of Cooperative Measures and Adoption of a Binational Water Scarcity Contingency Plan in the Colorado River Basin, signed September 21, 2017.
29

0 0 0 0
Table 9. Deliveries to Mexico in Satisfaction of Part III of the 1944 Mexican Water Treaty, and Water Passing to Mexico in Excess of Treaty Requirements, Calendar Year 2017. (Values are in acre-feet.)
JAN FEB MAR APR MAY JUN JUL AUG SEP OCT NOV DEC TOTAL
Colorado River at the Northerly International Boundary 1
Deliveries to Mexico in Satisfaction of Treaty Requirements Delivery at the Limitrophe 2
Delivery at Southerly International Boundary Diversion Channel Discharge 3
Delivery to Mexico at the Northerly International Boundary 4
115,253 148,650 190,803 169,244 99,745 115,925 120,191 91,780 93,454
348 295 399 165 198 111 240 88 767
10,647 11,082 11,766 11,463 10,584 9,793 10,134 10,343 9,552
0 3 63 139 67 1 13 10 109,833 148,466 190,564 169,026 98,735 115,690 119,909 91,612 85,283
53,823
604
11,035
53,503
86,758 96,431
226 339
12,026 12,131
86,512 96,235
1,382,057
3,781
130,554
2961,365,369
Total Deliveries to Mexico in Satisfaction of Treaty Requirements Creation of Water for Mexico's Water Reserve 5
120,828 159,843 202,732 180,717 109,656 125,661 130,284 102,056 95,612
0 0 0 0 0 0 0 0 0
65,142
0
98,764 108,705
0 0
1,500,000
0
Total to Mexico in Satisfaction of Treaty Requirements
Delivery of Mexico's Water Reserve
To Mexico in Excess of Treaty 6
Accountable Deliveries to Mexico 7
Water Bypassed Pursuant to IBWC Minute No. 242
Water Provided to the U.S. Pursuant to Section III.6.e.iii of IBWC Minute No. 319
120,828 159,843 202,732 180,717 109,656 125,661 130,284 102,056 95,612
0 0 0 0 0 0 0 0 0
5,420 183 240 217 1,010 235 281 168 8,172
126,248 160,026 202,972 180,934 110,666 125,896 130,565 102,224 103,784
5,693 9,030 10,698 11,671 15,308 11,847 9,773 10,567 10,598
0 0 0 0 0 0 0 0 0
65,142
0
319
65,461
9,580
0
98,764 108,705
0 0
246 195
99,010 108,900
15,132 6,805
0 124,000
1,500,000
0
16,688
1,516,688
126,701
124,000
Mexico's Water Reserve 5
BOY Balance
Creation
Delivery
Water Provided to the United States Pursuant to Section III.6.e.iii of Minute No. 319 Evaporation 8
EOY Cumulative Balance Available for Future Delivery 9
223,612
0
0
(124,000)(2,988)
96,624
Note: Annual totals may differ from the sum of the displayed monthly values due to rounding and conversion from TCM to AF.
Footnotes: 1 Flow in the river at the NIB as reported by IBWC as delivery to Mexico. 2 Wasteway deliveries to the river limitrophe via the Cooper, 11 Mile, and 21 Mile lateral wasteways in satisfaction of the 1944 Treaty requirements. 3 The Diversion Channel delivers water from the SIB confluence structure to the river or to the Bypass Drain. Consistent with a 2001 Memorandum of Understanding between Reclamation and the U.S. Section of the IBWC, during the months of January and October through December water was discharged to the Bypass Drain. During the months of February through September water was discharged to the Colorado River and was charged to the Treaty. 4 That portion of the flows at NIB necessary to meet the 1.5 MAF Treaty obligation. 5 Includes water deferred by Mexico pursuant to IBWC Minute Nos. 319 and 323. Pursuant to IBWC Minute No. 323, Mexico's Water Reserve includes Emergency Storage, Revolving Account, and Intentionally Created Mexican Allocation. 6 Water passing to Mexico in excess of Mexico's daily schedule. Calculated as the sum of daily differences between actual flows to Mexico and Mexico's total schedule. 7 Mexico's total water delivery. This value includes deliveries made in satisfaction of Treaty requirements in accordance with Mexico's scheduled diversions (including any water delivered pursuant to IBWC Minute Nos. 319 and 323) and water passing to Mexico in excess of Mexico's daily schedule. It does not include water bypassed pursuant to IBWC Minute No. 242. 8 In accordance with IBWC Minute Nos. 319 and 323, a 3 percent reduction for evaporation is applied annually on December 31 to Mexico's Water Reserve, beginning in the year of creation. 9 The cumulative volume of water deferred by Mexico (Mexico's Water Reserve) pursuant to Minute Nos. 319 and 323; includes water created during the reporting year and the prior year EOY balance, less deliveries made during the reporting year and the annual evaporation assessment.
30
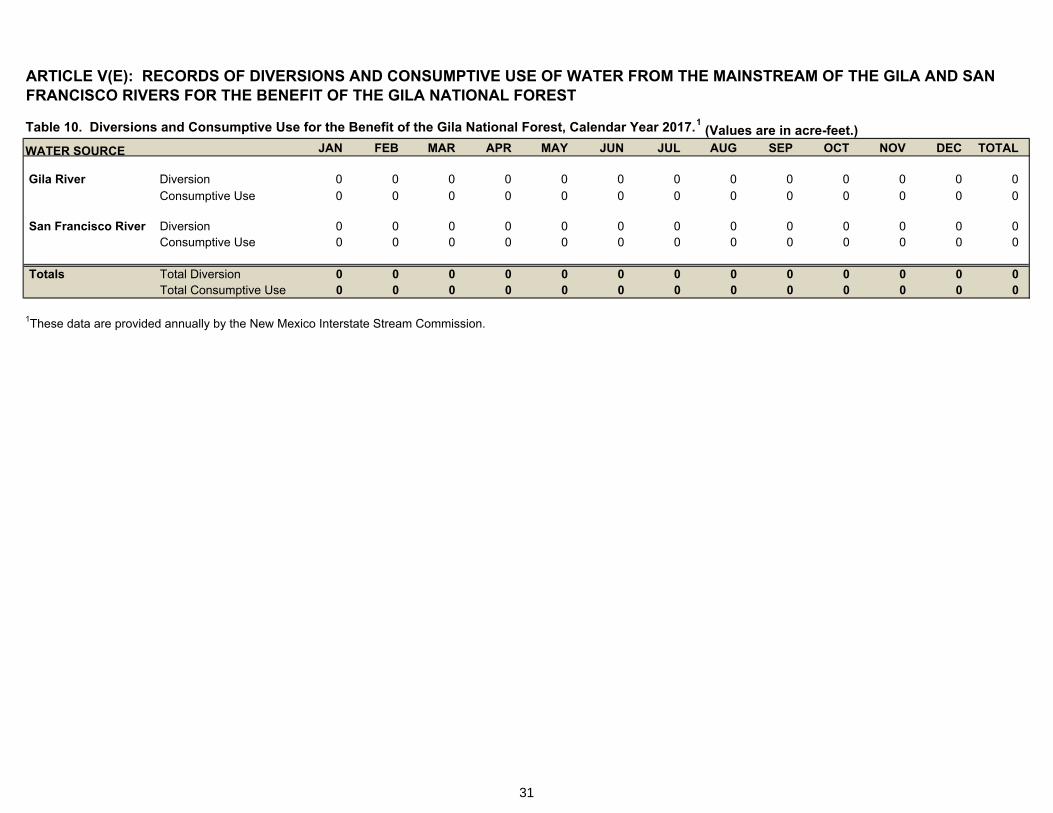
ARTICLE V(E): RECORDS OF DIVERSIONS AND CONSUMPTIVE USE OF WATER FROM THE MAINSTREAM OF THE GILA AND SAN FRANCISCO RIVERS FOR THE BENEFIT OF THE GILA NATIONAL FOREST
Table 10. Diversions and Consumptive Use for the Benefit of the Gila National Forest, Calendar Year 2017.1 (Values are in acre-feet.)
WATER SOURCE JAN FEB MAR APR MAY JUN JUL AUG SEP OCT NOV DEC TOTAL
Gila River Diversion 0 0 0 0 0 0 0 0 0 0 0 0 0 Consumptive Use 0 0 0 0 0 0 0 0 0 0 0 0 0
San Francisco River Diversion 0 0 0 0 0 0 0 0 0 0 0 0 0 Consumptive Use 0 0 0 0 0 0 0 0 0 0 0 0 0
Totals Total Diversion 0 0 0 0 0 0 0 0 0 0 0 0 0 Total Consumptive Use 0 0 0 0 0 0 0 0 0 0 0 0 0
1These data are provided annually by the New Mexico Interstate Stream Commission.
31
INFORMATION PROVIDED IN ADDITION TO THE REPORTING REQUIREMENTS OF THE CONSOLIDATED DECREE
The information contained in the following sections of this report is supplemental to the records required by Article V of the Consolidated Decree of the United States Supreme Court in Arizona v. California, 547 U.S. 150 (2006). This information provides a more extensive record of activities relating to federal management of the Colorado River. In concise tabulations specific to various agreements, policies, rules, or Records of Decision, this information is intended to help the reader correlate the records found in the Article V portion of this report with the various conservation, transfer, and exchange agreements. The penultimate section contains a list of documents significant to the actions taken by Reclamation, the Lower Division States, and the water user agencies for the calendar year documented in this report. The final section of this report contains a series of maps showing the general location of the water users tabulated in this report.
32

SUMMARY OF WATER AVAILABILITY AND USE BY STATE The Secretary of the Interior (Secretary) makes Colorado River water available to the Lower Division States in accordance with Article II of the Consolidated Decree.
Under Article II, the Secretary apportions water to the states under shortage, normal, or surplus conditions, and, in accordance with Article II(B)6, may release to a state water which was apportioned to but unused by another state.
The amount of Colorado River water available for use in a state is impacted by various agreements and policies. Examples of these agreements and policies include storage and interstate release agreements, the Colorado River Water Delivery Agreement (CRWDA), the Inadvertent Overrun and Payback Policy (IOPP), and the Colorado River Interim Guidelines for Lower Basin Shortages and the Coordinated Operations for Lake Powell and Lake Mead (2007 Interim Guidelines), specifically, Intentionally Created Surplus (ICS).
Table 11 documents the amount of Colorado River water made available to each Lower Division State under Article II of the Consolidated Decree, water released pursuant to Article II(B)(6) of the Consolidated Decree, paybacks made by users within the state in accordance with IOPP, creation or delivery of ICS, and the total consumptive use within a state. In those years when a given program shows activity a line will be included within the table denoting the activity and the volume of water involved. Otherwise, the line is omitted.
The table demonstrates whether the consumptive use results in an underrun or overrun of the amount of Colorado River water available to each Lower Division State for the calendar year covered by this report.
33
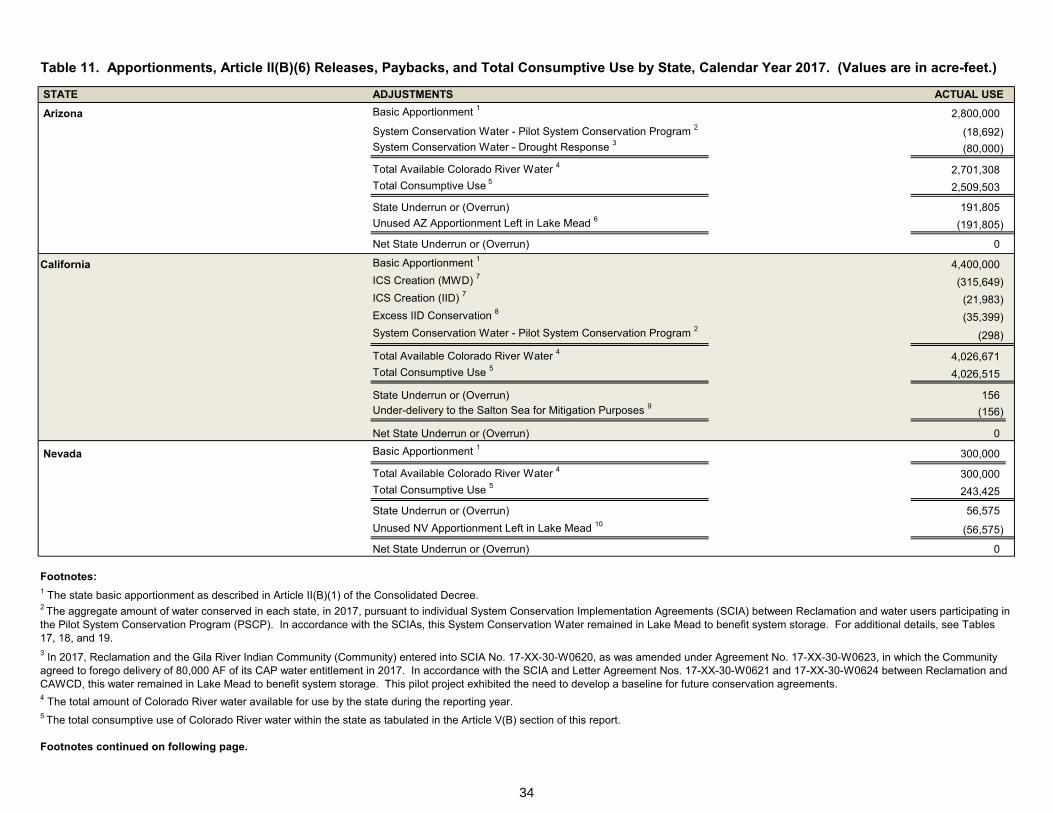
Table 11. Apportionments, Article II(B)(6) Releases, Paybacks, and Total Consumptive Use by State, Calendar Year 2017. (Values are in acre-feet.)
STATE
Arizona
ADJUSTMENTS
Basic Apportionment 1
System Conservation Water - Pilot System Conservation Program 2
System Conservation Water - Drought Response 3
ACTUAL USE
2,800,000
(18,692)
(80,000)
Total Available Colorado River Water 4
Total Consumptive Use 5
2,701,308
2,509,503
State Underrun or (Overrun)
Unused AZ Apportionment Left in Lake Mead 6
191,805
(191,805)
Net State Underrun or (Overrun) 0
California Basic Apportionment 1
ICS Creation (MWD) 7
ICS Creation (IID) 7
Excess IID Conservation 8
System Conservation Water - Pilot System Conservation Program 2
4,400,000
(315,649)
(21,983)
(35,399)
(298)
Total Available Colorado River Water 4
Total Consumptive Use 5
4,026,671
4,026,515
State Underrun or (Overrun) Under-delivery to the Salton Sea for Mitigation Purposes 9
156
(156)
Nevada
Net State Underrun or (Overrun)
Basic Apportionment 1
0
300,000
Total Available Colorado River Water 4
Total Consumptive Use 5
300,000
243,425
State Underrun or (Overrun)
Unused NV Apportionment Left in Lake Mead 10
56,575
(56,575)
Net State Underrun or (Overrun) 0
Footnotes: 1 The state basic apportionment as described in Article II(B)(1) of the Consolidated Decree. 2 The aggregate amount of water conserved in each state, in 2017, pursuant to individual System Conservation Implementation Agreements (SCIA) between Reclamation and water users participating in the Pilot System Conservation Program (PSCP). In accordance with the SCIAs, this System Conservation Water remained in Lake Mead to benefit system storage. For additional details, see Tables 17, 18, and 19. 3 In 2017, Reclamation and the Gila River Indian Community (Community) entered into SCIA No. 17-XX-30-W0620, as was amended under Agreement No. 17-XX-30-W0623, in which the Community agreed to forego delivery of 80,000 AF of its CAP water entitlement in 2017. In accordance with the SCIA and Letter Agreement Nos. 17-XX-30-W0621 and 17-XX-30-W0624 between Reclamation and CAWCD, this water remained in Lake Mead to benefit system storage. This pilot project exhibited the need to develop a baseline for future conservation agreements. 4 The total amount of Colorado River water available for use by the state during the reporting year. 5 The total consumptive use of Colorado River water within the state as tabulated in the Article V(B) section of this report.
Footnotes continued on following page.
34

Table 11 Footnotes: Continued from previous page.
6 By letter dated June 28, 2017, CAWCD notified Reclamation of its intent to adjust its diversions of unused Arizona basic apportionment in 2017 to effect a voluntarily contribution to Lake Mead. The volume of 191,805 AF remained in Lake Mead to benefit system storage. 7 The amount of ICS created by the water user during the reporting year. Unless otherwise noted, ICS values displayed are provisional until verified by Reclamation. 8 In 2017, IID conserved 80,937 AF of water in excess of its CRWDA water transfer obligations. Provisional data indicate that 21,983 AF were stored in Lake Mead by IID as Extraordinary Conservation ICS, 23,555 AF were delivered to MWD pursuant to the California Agreement for the Creation and Delivery of Extraordinary Conservation Intentionally Created Surplus , as amended, resulting in 35,399 AF of excess conservation. IID and MWD propose to credit this excess conservation to MWD’s ICS account through the application of Section XI.G.3.B.8 of the 2007 Interim Guidelines, subject to Section XI.G.7.B.5. This proposal is currently under review. All ICS values are provisional until verified by Reclamation. 9 In 2017, IID conserved 105,311 AF for Salton Sea mitigation purposes, but, due to measurement imprecision and operational/infrastructure limitations, only delivered 105,155 AF to the Salton Sea, resulting in a 156 AF under-delivery. To fulfill its 2017 mitigation requirement, IID plans to deliver 156 AF of conserved water to the Salton Sea in 2018. 10 Colorado River water apportioned to, but not consumptively used by, Nevada in 2017. By letter dated October 23, 2017, SNWA notified Reclamation that it anticipated having unused Nevada basic apportionment available for offstream storage, and that, instead of moving the water offstream, SNWA would leave the water in Lake Mead to pilot a new ICS proposal. In accordance with the 2007 Interim Guidelines, creation of ICS is predicated upon the execution of an exhibit to the 2007 Lower Colorado River Intentionally Created Surplus Forbearance Agreement and a Delivery Agreement, and approval of an ICS Plan of Creation. As of the date of this report, these requirements have not been completed. Any ICS credited to SNWA from water stored in Lake Mead under this pilot project will be reflected in a future Colorado River Accounting and Water Use Report .
35

INTERSTATE WATER BANKING WITHIN THE STATES OF
ARIZONA, CALIFORNIA, AND NEVADA On November 1, 1999, the Secretary of the Interior adopted Federal regulations, codified at 43 CFR Part 414, establishing a procedural framework for carrying out an interstate water banking program.The rule provided for authorized parties to enter into agreements whereby Colorado River water may be stored off-stream in one state for future benefit of consuming entities in another state.
The primary mechanism through which these transactions mayoccur is a Storage and Interstate Release Agreement (SIRA), which permits authorized entities in the Lower Division States to store Colorado River water off-stream, develop intentionally created unused apportionment (ICUA) in a future year, and make the ICUAavailable to the Secretary for release for use in another Lower Division State. These SIRAs provide structure and guidance, in accordance with Article II(B)(6) of the Consolidated Decree, for the actions the Secretary will take in releasing Colorado River water to a specific entity in order to implement the interstate contractual distribution of water under the interstate water banking program.
Two SIRAs have been implemented under 43 CFR Part 414. The first SIRA was entered into on December 18, 2002, among Reclamation, on behalf of the Secretary, the Arizona Water Banking Authority (AWBA), the Southern Nevada Water Authority (SNWA), and the Colorado River Commission of Nevada (CRCN). This SIRA provides for the storage, by AWBA, of either the State of Arizona’s basic or surplus apportionment or the State of Nevada’s unused basic or surplus apportionment for the benefit of SNWA.
In 2001, AWBA, SNWA, and CRCN executed an Agreement for Interstate Water Banking, amended January 1, 2005, April 1, 2009, and May 20, 2013, specifying the interstate banking relationship among those parties. This agreement establishes the terms and conditions for the off-stream storage of Colorado River water in Arizona and the establishment of Long-Term Storage Credits (LTSC) for the benefit of SNWA.
Under the AWBA/SNWA/CRCN interstate banking agreement, Colorado River water diverted and banked in Arizona is accounted as consumptively used by Arizona in the year it is diverted and, as a result, LTSCs are created for SNWA. When LTSCs are recovered, SNWA will divert Colorado River water in exchange for the Central Arizona Water Conservation District’s (CAWCD) use of the LTSCs pursuant to the SIRA. The Secretary will release ICUAcreated by AWBA, via CAWCDs forbearance to SNWA, in that same year pursuant to Article II(B)(6) of the Consolidated Decree. ICUA used by SNWA is in addition to Nevada’s basic apportionment and is accounted as consumptive use of Colorado River water in Nevada for that year.
The second SIRA was entered into on October 27, 2004, among Reclamation, on behalf of the Secretary, the Metropolitan WaterDistrict of Southern California (MWD), SNWA, and CRCN. This SIRA provides for the storage, by MWD, of the State of Nevada’s unused basic or surplus apportionment for the benefit of SNWA.
In 2004, MWD, SNWA, and CRCN, executed an Operational Agreement, amended August 2009, October 2012, and October 2015, specifying the interstate banking relationship among those parties, and providing the terms and conditions under which MWD will store Nevada unused basic apportionment for the benefit of SNWA. When SNWA requests delivery of this water, MWD will develop ICUA by reducing its diversion of Colorado River water. The ICUA developed by MWD through its reduced diversion of Colorado River water will be released by the Secretary for use by SNWA.
Table 12 documents the Accumulated Long Term Storage Credits (ALTSC) verified by AWBA and MWD, provisional LTSC accrued during the past year, LTSCs recovered during the past year, and ALTSC held for an entity with a SIRA.
36
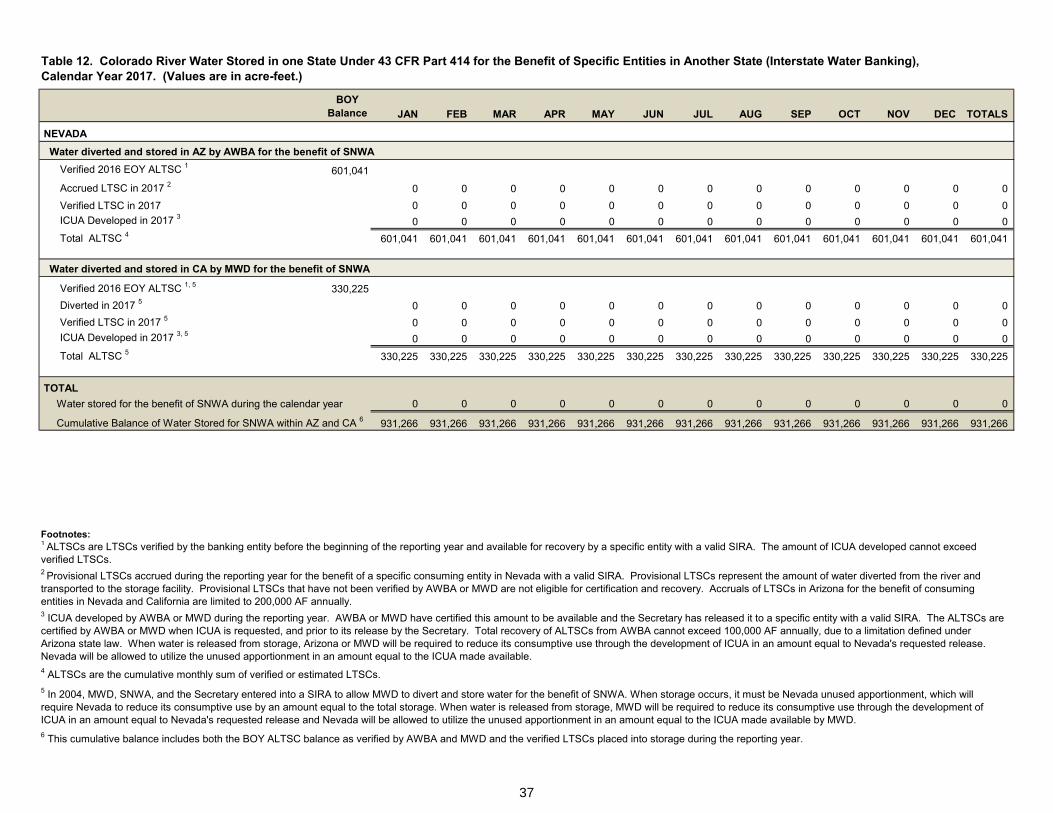
Table 12. Colorado River Water Stored in one State Under 43 CFR Part 414 for the Benefit of Specific Entities in Another State (Interstate Water Banking), Calendar Year 2017. (Values are in acre-feet.)
BOY Balance JAN FEB MAR APR MAY JUN JUL AUG SEP OCT NOV DEC TOTALS
NEVADA
Water diverted and stored in AZ by AWBA for the benefit of SNWA
Verified 2016 EOY ALTSC 1 601,041
Accrued LTSC in 2017 2 0 0 0 0 0 0 0 0 0 0 0 0 0
Verified LTSC in 2017 0 0 0 0 0 0 0 0 0 0 0 0 0
ICUA Developed in 2017 3 0 0 0 0 0 0 0 0 0 0 0 0 0
Total ALTSC 4 601,041 601,041 601,041 601,041 601,041 601,041 601,041 601,041 601,041 601,041 601,041 601,041 601,041
Water diverted and stored in CA by MWD for the benefit of SNWA
Verified 2016 EOY ALTSC 1, 5 330,225
Diverted in 2017 5 0 0 0 0 0 0 0 0 0 0 0 0 0
Verified LTSC in 2017 5 0 0 0 0 0 0 0 0 0 0 0 0 0
ICUA Developed in 2017 3, 5 0 0 0 0 0 0 0 0 0 0 0 0 0
Total ALTSC 5 330,225 330,225 330,225 330,225 330,225 330,225 330,225 330,225 330,225 330,225 330,225 330,225 330,225
TOTAL
Water stored for the benefit of SNWA during the calendar year 0 0 0 0 0 0 0 0 0 0 0 0 0
Cumulative Balance of Water Stored for SNWA within AZ and CA 6 931,266 931,266 931,266 931,266 931,266 931,266 931,266 931,266 931,266 931,266 931,266 931,266 931,266
Footnotes: 1 ALTSCs are LTSCs verified by the banking entity before the beginning of the reporting year and available for recovery by a specific entity with a valid SIRA. The amount of ICUA developed cannot exceed verified LTSCs. 2 Provisional LTSCs accrued during the reporting year for the benefit of a specific consuming entity in Nevada with a valid SIRA. Provisional LTSCs represent the amount of water diverted from the river and transported to the storage facility. Provisional LTSCs that have not been verified by AWBA or MWD are not eligible for certification and recovery. Accruals of LTSCs in Arizona for the benefit of consuming entities in Nevada and California are limited to 200,000 AF annually. 3 ICUA developed by AWBA or MWD during the reporting year. AWBA or MWD have certified this amount to be available and the Secretary has released it to a specific entity with a valid SIRA. The ALTSCs are certified by AWBA or MWD when ICUA is requested, and prior to its release by the Secretary. Total recovery of ALTSCs from AWBA cannot exceed 100,000 AF annually, due to a limitation defined under Arizona state law. When water is released from storage, Arizona or MWD will be required to reduce its consumptive use through the development of ICUA in an amount equal to Nevada's requested release. Nevada will be allowed to utilize the unused apportionment in an amount equal to the ICUA made available. 4 ALTSCs are the cumulative monthly sum of verified or estimated LTSCs.
5 In 2004, MWD, SNWA, and the Secretary entered into a SIRA to allow MWD to divert and store water for the benefit of SNWA. When storage occurs, it must be Nevada unused apportionment, which will require Nevada to reduce its consumptive use by an amount equal to the total storage. When water is released from storage, MWD will be required to reduce its consumptive use through the development of ICUA in an amount equal to Nevada's requested release and Nevada will be allowed to utilize the unused apportionment in an amount equal to the ICUA made available by MWD. 6 This cumulative balance includes both the BOY ALTSC balance as verified by AWBA and MWD and the verified LTSCs placed into storage during the reporting year.
37
INADVERTENT OVERRUNS AND PAYBACKS WITHIN THE STATES OF
ARIZONA, CALIFORNIA, AND NEVADA
On October 10, 2003, the Secretary of the Interior executed the Colorado River Water Delivery Agreement authorizing the Inadvertent Overrun and Payback Policy (IOPP). The policy is set forth in the Record of Decision, Colorado River Water Delivery Agreement, Implementation Agreement, Inadvertent Overrun and Payback Policy, and Related Federal Actions, Final Environmental Impact Statement, published in the Federal Register at 69 Fed. Reg. 12202 (March 15, 2004). Effective January 1, 2004, the IOPP, which applies only to Colorado River water users in the Lower Division States, defines inadvertent overruns, establishes procedures to account for inadvertent overruns, and sets forth the requirements for payback of inadvertent overruns to the Colorado River system.
For various reasons, a user may inadvertently divert, pump or receive Colorado River water in an amount that exceeds that to which the user is entitled for that year pursuant to the user’s water delivery contract, decreed water right, or Secretarial reservation (inadvertent overrun).
In accordance with the IOPP, paybacks are required to commence in the calendar year that immediately follows the release date of the final Water Accounting Report that reports the overrun. Section 2.6 of the IOPP sets forth the number of years within which an overrun must be paid back and the minimum payback required for each year. Overruns are not allowed in a year for which the Secretary has declared a Shortage condition.
The tabulations in Tables 13 through 15 document information associated with inadvertent overruns and paybacks, as applicable, for each individual water user, including:
1) The beginning-of-year overrun account balance.
2) The amount of overrun incurred in the reporting year.
3) The amount of validated paybacks made to the Colorado River system in the reporting year.
4) The end-of-year overrun balance.
38
Table 13. State of Arizona - Overruns, Paybacks, and Overrun Account Balances, Calendar Year 2017. (Values are in acre-feet.) ANNUAL TOTALS
WATER USER DETAILS DIVERSION CONSUMPTIVE USE APPROVAL ENTITLEMENT
No overruns or paybacks occurred within the State of Arizona in the reporting year.
39

Table 14. State of California - Overruns, Paybacks, and Overrun Account Balances, Calendar Year 2017. (Values are in acre-feet.) ANNUAL TOTALS
WATER USER DETAILS DIVERSION CONSUMPTIVE USE APPROVAL ENTITLEMENT
No overruns or paybacks occurred within the State of California in the reporting year.
40

Table 15. State of Nevada - Overruns, Paybacks, and Overrun Account Balances, Calendar Year 2017. (Values are in acre-feet.) ANNUAL TOTALS
WATER USER DETAILS DIVERSION CONSUMPTIVE USE APPROVAL ENTITLEMENT
No overruns or paybacks occurred within the State of Nevada in the reporting year.
41
LOWER COLORADO WATER SUPPLY PROJECT
The Lower Colorado Water Supply Act (Act), Public Law 99-655, Nov. 14, 1986, authorized the Secretary of the Interior (Secretary) to construct, operate, and maintain the Lower Colorado Water Supply Project (LCWSP). Pursuant to the Act, the Secretary is authorized to enter into exchange contracts and contracts for the care, operation, and maintenance of all or any part of the project works, subject to such rules and regulations as the Secretary may prescribe. Reclamation assumed the care, operation, and maintenance of the LCWSP in 2013.
Any contracts executed by the Secretary to recover the costs of the LCWSP must be with persons, or Federal or non-Federal governmental entities whose lands or interests in lands are located adjacent to the Colorado River in the State of California who do not hold rights to Colorado River water or whose rights are insufficient to meet their present or anticipated future domestic, municipal, industrial, and recreational needs, as determined by the Secretary. Water for agricultural use is not authorized under the Act.
The Act authorized construction of wells with a total annual capacity of 10,000 acre-feet. Stage I of the LCWSP has been completed and consists of two wells located south of the All-American Canal (AAC) in Imperial County having a total design capacity of 5,000 acre-feet. The wells, which became operational as of August 1, 2003, pump groundwater and discharge it into the AAC for use by the Imperial Irrigation District (IID). IID then forbears the use of an equal amount of Colorado River water.
In September 1992, Reclamation entered into a contract to supply LCWSP water to the City of Needles (Needles) in annual amounts up to 3,500 acre-feet of the initial capacity. Pursuant to that contract, Needles enters into sub-contracts for delivery of LCWSP water to non-Federal water users in San Bernardino, Riverside, and Imperial Counties. The Colorado River Board of California (CRBC) receives and reviews applications for LCWSP sub-contracts, and makes recommendations to Reclamation.
Reclamation reviews CRBC’s recommendations and refers approved applicants to Needles for execution of subcontracts.
In September 1998, the Bureau of Land Management (BLM) was allocated 1,150 acre feet of Stage I capacity for consumptive use on BLM administered lands in California located adjacent to the Colorado River. In December 2004, a Reclamation determination reserved an additional 350 acre-feet of Stage I capacity of the LCWSP for use by Reclamation facilities in California on land adjacent to the Colorado River. With that determination, the estimated 5,000 acre-feet per year of Stage I capacity was completely allocated.
The Act, as amended in 2005 by Public Law 109-103, authorized the Secretary to enter into agreements for the design and construction of the remaining stages of the LCWSP. Additionally, it authorized contracts with persons or entities holding water delivery contracts under Section 5 of the Boulder Canyon Project Act of 1928 for municipal and industrial uses within the State of California. On March 26, 2007, Reclamation entered into a contract with Needles and The Metropolitan Water District of Southern California (MWD), allowing MWD to receive as much unused water as available. MWD is depositing certain monies in a Water Quality Maintenance Trust Fund (Trust Fund) to provide for the long-term viability of the LCWSP or its replacement.
In 2010, development began for Stage II of the LCWSP to provide the remaining authorized capacity of up to 5,000 acre-feet per year. In 2013, following the initial planning and environmental compliance phase, Needles and Reclamation entered into a design, acquisition, and construction agreement, funded by the Trust Fund. Two new wells were constructed in 2017. LCWSP-3 and LCWSP-4 began well-development pumping in December 2017 and November 2017, respectively. The well development period for the new wells was completed in early 2018, with completion of all LCWSP construction activities by the end of 2018. The LCWSP will produce the entire 10,000 acre-feet beginning in 2018.
42

Table 16. Summary of Uses Offset by Pumpage from the LCWSP, Calendar Year 2017. (Values are in acre-feet.)
TOTALS
LCWSP Wellfield Pumpage 1 7,377
Federal LCWSP Contractors 2
BLM
Bureau of Reclamation - Parker Dam and Government Camp
Consumptive Use
Consumptive Use
Total Federal Contractors' Consumptive Use
233
1
234
Non-Federal LCWSP Contractors 3
City of Needles
Needles' Subcontractors
Southern California Gas Company
Pacific Gas & Electric Company
Havasu Water Company
Vista del Lago
Needles' Other Subcontractors
Consumptive Use
Consumptive Use
Consumptive Use
Consumptive Use
Consumptive Use
Consumptive Use
Needles' and Subcontractors' Consumptive Use
13
16
50
20
15
178
292
LCWSP Water Available to MWD 4 6,851
Total Non-Federal Contractors' Consumptive Use 7,143
Footnotes:
1 Non-Colorado River water pumped from the LCWSP wellfield and delivered to IID for its use via the AAC. IID forbears the consumptive use of this amount from the Colorado River to make water available for exchange to the LCWSP beneficiaries. 2 Total LCWSP Federal contractors' consumptive use. Colorado River water used was exchanged for LCWSP water.
3 Total LCWSP Non-Federal consumptive use by the City of Needles and its subcontractors. Colorado River water used was exchanged for LCWSP water.
4 Total amount of water pumped from the wellfield less consumptive use of LCWSP water by Federal and Non-Federal LCWSP contractors.
43

CONSERVATION, TRANSFERS, AND EXCHANGES
Colorado River water apportioned to the Lower Division States has been further apportioned among the states of Arizona, California, and Nevada and is generally committed to specific persons or entities on a permanent basis. Increasing water demands within the Lower Division States must be met through a combination of conservation, transfers, exchanges, or new water sources which augment the limited supply of Colorado River water.
On October 10, 2003, the Secretary of the Interior entered into the Colorado River Water Delivery Agreement (CRWDA) with Imperial Irrigation District, Coachella Valley Water District, the Metropolitan Water District of Southern California, and the San Diego County Water Authority to resolve longstanding disputes regarding the priority, use, and transfer of Colorado River water within California. The CRWDA recognizes a variety of water transfers, exchanges, and conservation programs which alter the delivery of certain Colorado River water for up to 75 years.
Concurrent with the CRWDA, the California agencies entered into the Quantification Settlement Agreement, including a series of supplemental agreements, which collectively implement many provisions of the CRWDA through water transfers, water exchanges, and water conservation measures. Data as a result of the implementation of these agreements are documented in this section.
Tables 17 through 19 entitled “State of (State) Transfers, Exchanges and Water Made Available by Extraordinary Conservation, Calendar Year 2017” tabulate these transactions reported within Arizona, California, and Nevada.
For California, the tabulation documents, by agreement, conservation outside of the CRWDA or in amounts that differ from those displayed in Exhibit B of the CRWDA.
For Arizona, California, Nevada the tabulation includes System Conservation Water created in 2017 under the Pilot System Conservation Program (PSCP). Under the PSCP, System Conservation Water, conserved through the voluntary implementation of extraordinary conservation pilot projects, remained in Lake Mead to benefit system storage.
Table 20 entitled “Bureau of Reclamation – Water Made Available by Conservation, Calendar Year 2017” documents water made available by Reclamation through conservation efforts. These include:
1) Groundwater introduced to the system by pumping certain wells in the Yuma area that discharge to the Colorado River via the Yuma Mesa Conduit.
2) Water stored in Warren H. Brock Reservoir.
3) Water discharged to the Colorado River as a result of the operation of the Yuma Desalting Plant.
4) Water conserved by the Gila River Indian Community pursuant to SCIA No. 17-XX-30-W0621 and Agreement No. 17-XX-30-W0623.
5) Water provided to the United States pursuant to Agreement No. 12-XX-30-W0565 (2012 Contributed Funds Agreement1).
Table 21 entitled “Exhibit B to the Colorado River Water Delivery Agreement” is reproduced from the CRWDA for convenient reference.
1 Referring to the Agreement Among the United States of America, Through the Department of the Interior, Bureau of Reclamation, The Metropolitan Water District of Southern California, the Colorado River Commission of Nevada, the Southern Nevada Water Authority, and the Central Arizona Water Conservation District, for a Pilot Program for the Conversion of Intentionally Created Mexican Allocation to Intentionally Created Surplus.
44

Table 17. State of Arizona - Transfers, Exchanges, and Water Made Available by Extraordinary Conservation, Calendar Year 2017. (Values are in acre-feet.)
PROGRAM OR PARTICIPATING AGENCIES TOTAL
Pilot System Conservation Program (PSCP) 1
City of Bullhead City 2
Colorado River Indian Tribes 3
Tohono O'odham Nation 4
40
8,572
10,080
Footnotes:
1 Water conserved from projects implemented pursuant to System Conservation Implementation Agreements (SCIA), executed in accordance with the July 30, 2014, Agreement Among The United States of America, Through The Department of the Interior, Bureau of Reclamation, The Central Arizona Water Conservation District, The Metropolitan Water District of Southern California, Denver Water, and The Southern Nevada Water Authority, For A Pilot Program for Funding the Creation of Colorado River System Water through Voluntary Water Conservation and Reductions in Use , as amended August 12, 2015 and March 8, 2016. Water conserved from projects implemented under the PSCP is for the sole purpose of increasing storage levels in Lake Mead and Lake Powell and will not accrue to the benefit or use of any individual water user. 2 In 2015, Reclamation and the City of Bullhead City (City) entered into SCIA No. 15-XX-30-W0587, as amended, under the PSCP in which the City agreed to construct wastewater injection wells to recover and inject into the Colorado River aquifer effluent that would otherwise be lost by evaporation and dedicate a portion of this water as System Conservation Water. In accordance with the SCIA and Letter Agreement No. 15-XX-30-W0588 between Reclamation and CAWCD, this System Conservation Water remained in Lake Mead to benefit system storage.
3 In 2016, Reclamation and the Colorado River Indian Tribes (Tribes) entered into SCIA No. 16-XX-30-W0606 under the PSCP in which the Tribes agreed to fallow 1,591 acres of farmland from October 1, 2016 through September 30, 2018 to create System Conservation Water. In accordance with the SCIA and Letter Agreement No. 16-XX-30-W0608 between Reclamation and CAWCD, the portion of water conserved in 2017 (reflected above) remained in Lake Mead to benefit system storage.
4 In 2016, Reclamation and the Tohono O'odham Nation (Nation) entered into SCIA No. 16-XX-30-W0609 under the PSCP in which the Nation agreed to reduce delivery of its CAP water entitlement by 10,080 AF in 2017 to create System Conservation Water. In accordance with the SCIA and Letter Agreement No. 16-XX-30-W0611 between Reclamation and CAWCD, this System Conservation Water remained in Lake Mead to benefit system storage.
45

Table 18. State of California - Transfers, Exchanges, and Water Made Available by Extraordinary Conservation, Calendar Year 2017. (Values are in acre-feet.) PROGRAM OR PARTICIPATING AGENCIES TOTAL
IID Conservation
1988 IID/MWD Conservation Agreement 1 105,000
MWD Reduction for CVWD use 2 0
Transfer to SDCWA 3 100,000
SDCWA Mitigation Transfer 4 105,311
IID Intra-Priority 3 Transfer to CVWD 5 45,000
Extraordinary Conservation Delivered to MWD 6,7 23,555
PVID/MWD Forbearance and Fallowing Program 8 119,379
MWD/Bard Water District Pilot Seasonal Fallowing Program 9 2,310
All-American Canal Lining Project 10
SDCWA Exchange with MWD 56,200 Supplemental Water 11,500
Total Conservation 67,700
Coachella Canal Lining Project 11
SDCWA Exchange With MWD 23,126
Supplemental Water 4,500
Mitigation 3,224
Total Conservation 30,850
Total MWD Exchange with SDCWA 12 179,326
Pilot System Conservation Program (PSCP) 13
City of Needles 14 146
CVWD 15 152
Note: Additional transfers and water exchange obligations may be found in Table 21, Exhibit B to the CRWDA.
Footnotes: 1 1988 IID/MWD Water Conservation Program conserved water, determined in accordance with the amended 1988 Program Agreement and the amended 1989 Approval Agreement, made available by IID for diversion in the reporting year by MWD, reported as an annual total. 2 In accordance with the amended 1989 Approval Agreement, CVWD may request up to 20,000 AF of the water conserved by IID for MWD under the 1988 IID/MWD Water Conservation Agreement. MWD reduces its use by up to 20,000 AF of water conserved for use by CVWD, which is reflected in the displayed value above. 3 As referenced in Column 5, Exhibit B, of the CRWDA, IID conserves water for transfer to SDCWA.
Footnotes continued on following page.
46

Table 18 Footnotes: Continued from previous page. 4 As referenced in Column 7, Exhibit B, of the CRWDA and the IID/SDCWA Water Transfer Agreement, as amended, IID conserves water for transfer to SDCWA for delivery, by exchange from non-Colorado River sources, to the Salton Sea for mitigation purposes. As shown in Exhibit B, IID’s 2017 Salton Sea mitigation requirement was 150,000 AF; however, in 2016 IID pre-delivered 44,689 AF of conserved water, created through fallowing, to the Sea for the stated purpose of reducing its 2017 mitigation balance to 105,311 AF (150,000 – 44,689 = 105,311). As reported above, in 2017, IID conserved 105,311 AF for mitigation purposes, but due to measurement imprecision and operational/infrastructure limitations–only delivered 105,155 AF to the Salton Sea, resulting in a 156 AF under-delivery. To fulfill its 2017 mitigation requirement, IID plans to deliver 156 AF of conserved water to the Salton Sea in 2018. Also, as first reported in the 2010 Water Accounting Report (and subsequent reports), in 2010 IID delivered 46,546 AF of Colorado River water to the Salton Sea with a stated intention to store the water for use for Salton Sea mitigation requirements in 2011 and half of 2012. IID did not conserve an equivalent amount of water in 2011 and 2012 for delivery to the Salton Sea resulting in a Colorado River system storage depletion of 46,546 AF. This matter is the subject of a series of letters between Reclamation and IID, including Reclamation's letter dated May 3, 2013; IID's letter dated June 28, 2013; and Reclamation's letter dated July 2, 2013, and currently remains under discussion between Reclamation and IID. Pursuant to the Minute No. 319 Binational ICS Delivery Agreement between the United States and IID, IID agrees to not request and Reclamation will not deliver to IID any Binational ICS available to IID under Minute No. 319 until this outstanding dispute has been resolved. 5 IID conserves water under an acquisition agreement with CVWD to meet the IID/CVWD Intra-priority 3 Transfer obligation as referenced in Column 8, Exhibit B of the CRWDA. 6 For informational purposes: Water conserved by IID through extraordinary conservation and delivered to MWD pursuant to the California Agreement for the Creation and Delivery of Extraordinary Conservation Intentionally Created Surplus , as amended. 7 In the 2015 Colorado River Accounting and Water Use Report , the amount of “Extraordinary Conservation Delivered to MWD” was reported as 38,313 AF. As described in IID and MWD’s joint letter dated April 18, 2018, this amount has been corrected to 45,477 AF (an increase of 7,164 AF). 8 The provisional amount of PVID's annual reduction in agricultural consumptive use of Colorado River water through land fallowing as a result of fallowing 25,947 acres from January through July and 23,356 acres from August through December in the reporting year. This provisional amount is currently under review and the final amount will be reflected in a future Colorado River Accounting and Water Use Report based on values verified in the final report titled Calendar Year 2017 Fallowed Land Verification Report, PVID/MWD Forbearance and Fallowing Program . 9 Bard Water District's seasonal reduction in consumptive use of Colorado River water through land fallowing. This value represents the preliminary estimate of the reduction in Bard Water District's consumptive use as a result of fallowing 752 acres from March 15 through July 15 and 889 acres from April 15 through August 15 in the reporting year. 10 The Secretarial Determination of water conserved by lining certain reaches of the AAC was issued in December 2009 (see Significant Documents). As a result, conserved water was distributed in accordance with the Allocation Agreement among the United States, MWD, CVWD, IID, SDCWA, and the SLRSP, dated October 10, 2003 and Public Law 100-675, as amended. 11 The Secretarial Determination of water conserved by the CCLP was issued in January 2008 (see Significant Documents). As a result, conserved water was distributed in accordance with the Allocation Agreement among the United States, MWD, CVWD, IID, SDCWA, and the SLRSP, dated October 10, 2003, Public Law 100-675, as amended, and Exhibit B to the Settlement Agreement between CVWD and SDCWA, dated October 30, 2007. 12 The amount shown represents water exchanged between MWD and SDCWA in the reporting year. This is the sum of: IID Conservation - Transfer to SDCWA (100,000 AF), All-American Canal Lining Project - SDCWA Exchange with MWD (56,200 AF), and the Coachella Canal Lining Project - SDCWA Exchange with MWD (23,126 AF).
13 Water conserved from projects implemented pursuant to System Conservation Implementation Agreements (SCIA), executed in accordance with the July 30, 2014, Agreement Among The United States of America, Through The Department of the Interior, Bureau of Reclamation, The Central Arizona Water Conservation District, The Metropolitan Water District of Southern California, Denver Water, and The Southern Nevada Water Authority, For A Pilot Program for Funding the Creation of Colorado River System Water through Voluntary Water Conservation and Reductions in Use , as amended August 12, 2015 and March 8, 2016. Water conserved from projects implemented under the PSCP is for the sole purpose of increasing storage levels in Lake Mead and Lake Powell and will not accrue to the benefit or use of any individual water user.
14 In 2016, Reclamation and the City of Needles (Needles) entered into SCIA No. 15-XX-30-W0596 under the PSCP in which Needles agreed to implement water conservation measures on the Rivers Edge Golf Course to create System Conservation Water. In accordance with the SCIA, this System Conservation Water remained in Lake Mead to benefit system storage. 15 In 2016, Reclamation and CVWD entered into SCIA No. 15-XX-30-W0593 under the PSCP in which CVWD agreed to establish a Furrow/Flood to Drip Conversion Rebate Program to create System Conservation Water. In accordance with the SCIA, this System Conservation Water remained in Lake Mead to benefit system storage.
47

Table 19. State of Nevada - Transfers, Exchanges, and Water Made Available by Extraordinary Conservation, Calendar Year 2017. (Values are in acre-feet.)
PROGRAM OR PARTICIPATING AGENCIES TOTAL
Pilot System Conservation Program (PSCP) 1
SNWA 2 744
Footnotes:
1 Water conserved from projects implemented pursuant to System Conservation Implementation Agreements (SCIA), executed in accordance with the July 30, 2014, Agreement Among The United States of America, Through The Department of the Interior, Bureau of Reclamation, The Central Arizona Water Conservation District, The Metropolitan Water District of Southern California, Denver Water, and The Southern Nevada Water Authority, For A Pilot Program for Funding the Creation of Colorado River System Water through Voluntary Water Conservation and Reductions in Use , as amended August 12, 2015 and March 8, 2016. Water conserved from projects implemented under the PSCP is for the sole purpose of increasing storage levels in Lake Mead and Lake Powell and will not accrue to the benefit or use of any individual water user. 2 In 2016, Reclamation and SNWA entered into SCIA No. 16-XX-30-W0612 under Phase II of the PSCP in which SNWA agreed to conserve up to 860 AF per year, from October 1, 2016 through September 30, 2019, of post-1929 Virgin River surface water rights to create System Conservation Water. In accordance with the SCIA, the portion of water conserved in 2017 remained in Lake Mead to benefit system storage. (Volume noted is provisional until verified by Reclamation.)
48
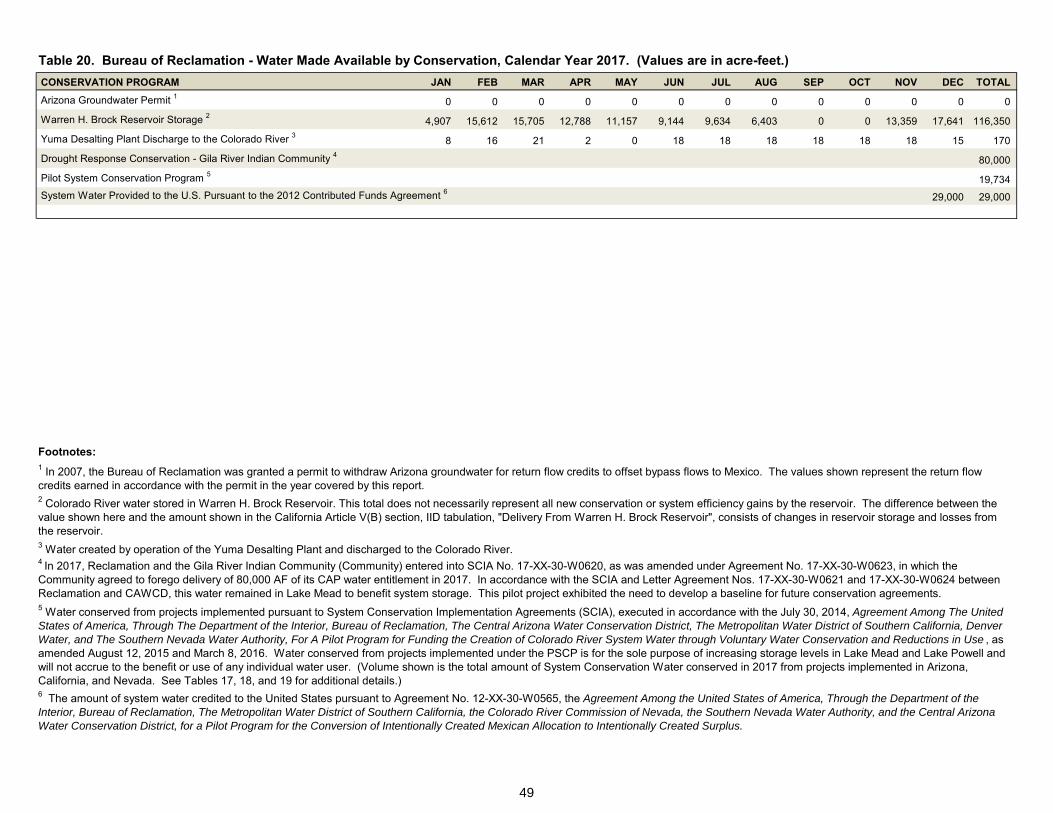
Table 20. Bureau of Reclamation - Water Made Available by Conservation, Calendar Year 2017. (Values are in acre-feet.)
CONSERVATION PROGRAM JAN FEB MAR APR MAY JUN JUL AUG SEP OCT NOV DEC TOTAL
Arizona Groundwater Permit 1 0 0 0 0 0 0 0 0 0 0 0 0 0
Warren H. Brock Reservoir Storage 2 4,907 15,612 15,705 12,788 11,157 9,144 9,634 6,403 0 0 13,359 17,641 116,350
Yuma Desalting Plant Discharge to the Colorado River 3 8 16 21 2 0 18 18 18 18 18 18 15 170
Drought Response Conservation - Gila River Indian Community 4 80,000
Pilot System Conservation Program 5 19,734
System Water Provided to the U.S. Pursuant to the 2012 Contributed Funds Agreement 6 29,000 29,000
Footnotes: 1 In 2007, the Bureau of Reclamation was granted a permit to withdraw Arizona groundwater for return flow credits to offset bypass flows to Mexico. The values shown represent the return flow credits earned in accordance with the permit in the year covered by this report. 2 Colorado River water stored in Warren H. Brock Reservoir. This total does not necessarily represent all new conservation or system efficiency gains by the reservoir. The difference between the value shown here and the amount shown in the California Article V(B) section, IID tabulation, "Delivery From Warren H. Brock Reservoir", consists of changes in reservoir storage and losses from the reservoir. 3 Water created by operation of the Yuma Desalting Plant and discharged to the Colorado River. 4 In 2017, Reclamation and the Gila River Indian Community (Community) entered into SCIA No. 17-XX-30-W0620, as was amended under Agreement No. 17-XX-30-W0623, in which the Community agreed to forego delivery of 80,000 AF of its CAP water entitlement in 2017. In accordance with the SCIA and Letter Agreement Nos. 17-XX-30-W0621 and 17-XX-30-W0624 between Reclamation and CAWCD, this water remained in Lake Mead to benefit system storage. This pilot project exhibited the need to develop a baseline for future conservation agreements. 5 Water conserved from projects implemented pursuant to System Conservation Implementation Agreements (SCIA), executed in accordance with the July 30, 2014, Agreement Among The United States of America, Through The Department of the Interior, Bureau of Reclamation, The Central Arizona Water Conservation District, The Metropolitan Water District of Southern California, Denver Water, and The Southern Nevada Water Authority, For A Pilot Program for Funding the Creation of Colorado River System Water through Voluntary Water Conservation and Reductions in Use , as amended August 12, 2015 and March 8, 2016. Water conserved from projects implemented under the PSCP is for the sole purpose of increasing storage levels in Lake Mead and Lake Powell and will not accrue to the benefit or use of any individual water user. (Volume shown is the total amount of System Conservation Water conserved in 2017 from projects implemented in Arizona, California, and Nevada. See Tables 17, 18, and 19 for additional details.)
The amount of system water credited to the United States pursuant to Agreement No. 12-XX-30-W0565, the Agreement Among the United States of America, Through the Department of the Interior, Bureau of Reclamation, The Metropolitan Water District of Southern California, the Colorado River Commission of Nevada, the Southern Nevada Water Authority, and the Central Arizona Water Conservation District, for a Pilot Program for the Conversion of Intentionally Created Mexican Allocation to Intentionally Created Surplus.
6
49

Table 21. Exhibit B to the Colorado River Water Delivery Agreement.
EXHIBIT B
QUANTIFICATION AND TRANSFERS1
In Thousands of Acre-feet Column: 1 2 3 4 5 6 7 8 9 10 11 12 13 14 15 16 17 18 19 20 21 22 23
1 2 3 4 5 6 7 8 9
10 11 12 13 14 15 16 17 18 19 20 21 22 23 24 25 26
Calendar Year
2Priority 1, 2 and 3b
2003 420 2004 420 2005 420 2006 420 2007 420 2008 420 2009 420 2010 420 2011 420 2012 420 2013 420 2014 420 2015 420 2016 420 2017 420 2018 420 2019 420 2020 420 2021 420 2022 420 2023 420 2024 420 2025 420 2026 420 2027 420 2028 420
2029-2037 420
2038-204713 420
2048-207714 420
IID Priority 3a
IID Priority 3a
Quantified Amount
Reductions 10IID Net
Consumptive Use Amount (difference between column 3
and column 12)
3IID Reduction
: MWD 1988
Agreemen t Transfer
IID Reduction : SDCWA Transfer
4IID Reduction
: AAC Lining IID, SDCWA &
SLR
5,6IID Reduction : SDCWA Mitigation Transfer
7Intra-
Priority 3 Transfer
IID/CVWD
6IID Reduction:
MWD Transfer
with Salton Sea
Restoration
8IID Reduction
: Condition
al ISG Backfill
9IID Reduction
: Misc. PPRs
IID Reductions:
Total Amount (sum of
columns 4 through 11)
3,100 110 10 0 5 0 0 0 11.5 136.5 2,963.5 3,100 110 20 0 10 0 0 0 11.5 151.5 2,948.5 3,100 110 30 0 15 0 0 0 11.5 166.5 2,933.5 3,100 110 40 0 20 0 0 9 11.5 190.5 2,909.5 3,100 110 50 0 25 0 0 0 11.5 196.5 2,903.5 3,100 110 50 67.7 25 4 20 0 11.5 288.2 2,811.8 3,100 110 60 67.7 30 8 40 0 11.5 327.2 2,772.8 3,100 110 70 67.7 35 12 60 0 11.5 366.2 2,733.8 3,100 110 80 67.7 40 16 80 0 11.5 405.2 2,694.8 3,100 110 90 67.7 45 21 100 0 11.5 445.2 2,654.8 3,100 110 100 67.7 70 26 100 0 11.5 485.2 2,614.8 3,100 110 100 67.7 90 31 100 0 11.5 510.2 2,589.8 3,100 110 100 67.7 110 36 100 0 11.5 535.2 2,564.8 3,100 3,100 3,100
110 110 110
100 100 130
67.7 67.7 67.7
130 150 0
41 45 63
100 91 0
0 0 0
11.5 11.5 11.5
560.2 575.2 382.2
2,539.8 2,524.8 2,717.8
3,100 110 160 67.7 0 68 0 0 11.5 417.2 2,682.8 3,100 110 193 67.7 0 73 0 0 11.5 454.7 2,645.3 3,100 110 205 67.7 0 78 0 0 11.5 472.2 2,627.8 3,100 110 203 67.7 0 83 0 0 11.5 474.7 2,625.3 3,100 110 200 67.7 0 88 0 0 11.5 477.2 2,622.8 3,100 110 200 67.7 0 93 0 0 11.5 482.2 2,617.8 3,100 110 200 67.7 0 98 0 0 11.5 487.2 2,612.8 3,100 110 200 67.7 0 103 0 0 11.5 492.2 2,607.8 3,100 110 200 67.7 0 103 0 0 11.5 492.2 2,607.8 3,100 110 200 67.7 0 103 0 0 11.5 492.2 2,607.8 3,100 110 200 67.7 0 103 0 0 11.5 492.2 2,607.8
3,100 110 200 67.7 0 103 0 0 11.5 492.2 2,607.8
3,100 110 200 67.7 0 100 0 0 11.5 489.2 2,610.8
CVWD Priority 3a
CVWD Priority 3a Quantified
Amount
Reductions Additions
CVWD Net Consumptive
Use Amount (columns 14 -
17 plus columns 18 +
19)
4CVWD Reduction
: CC Lining,
SDCWA & SLR
9CVWD Reduction
: Misc. PPRs
11CVWD Reduction
s: Total Amount (sum of columns 15 + 16)
7Intra-Priority 3 Transfer
IID/CVWD
3Intra-
Priority 3 Transfer
MWD/CVW D
330 0 3 3 0 20 347 330 0 3 3 0 20 347 330 0 3 3 0 20 347 330 26 3 29 0 20 321 330 26 3 29 0 20 321 330 26 3 29 4 20 325 330 26 3 29 8 20 329 330 26 3 29 12 20 333 330 26 3 29 16 20 337 330 26 3 29 21 20 342 330 26 3 29 26 20 347 330 26 3 29 31 20 352 330 26 3 29 36 20 357 330 330 330
26 26 26
3 3 3
29 29 29
41 45 63
20 20 20
362 366 384
330 26 3 29 68 20 389 330 26 3 29 73 20 394 330 26 3 29 78 20 399 330 26 3 29 83 20 404 330 26 3 29 88 20 409 330 26 3 29 93 20 414 330 26 3 29 98 20 419 330 26 3 29 103 20 424 330 26 3 29 103 20 424 330 26 3 29 103 20 424 330 26 3 29 103 20 424
330 26 3 29 103 20 424
330 26 3 29 100 20 421
Total Priority 1-3 Use
Plus PPR Consumptiv
e Use (sum of columns 2+13+20
plus 11+16)
12ISG Benchmarks
12Annual Targets
3,745.0 3,740 3,740 3,730.0 3,707 3,715.0 3,674 3,665.0 3,640 3,640 3,659.0 3,603 3,571.3 3,566 3,536.3 3,530 3,530 3,501.3 3,510 3,466.3 3,490 3,431.3 3,470 3,470 3,396.3 3,462 3,376.3 3,455 3,356.3 3,448 3,336.3 3,325.3 3,536.3
3,440
3,506.3 3,473.8 3,461.3 3,463.8 3,466.3 3,466.3 3,466.3 3,466.3 3,466.3 3,466.3 3,466.3
3,466.3
3,466.3
1 Exhibit B is independent of increases and reductions as allowed under the Inadvertent Overrun and Payback Policy. 2 Any higher use covered by MWD, any lesser use will produce water for MWD and help satisfy ISG Benchmarks and Annual Targets. 3 IID/MWD 1988 Conservation Program conserves up to 110,000 AFY and the amount is based upon periodic verification. Of amount conserved, up to 20,000 AFY to CVWD (column 19), which does not count toward ISG Benchmarks and Annual Targets, and
remainder to MWD. 4 Ramp-up amounts may vary based upon construction progress, and final amounts will be determined by the Secretary pursuant to the Allocation Agreement. 5 Any amount identified in Exhibit B for mitigation purposes will only be from non-Colorado River sources and these amounts may be provided by exchange for Colorado River water. 6 Water would be transferred to MWD subject to satisfaction of certain conditions and to appropriate federal approvals. For informational purposes only, these transfers may also be subject to state approvals. Schedules are subject to adjustments with mutual consent.
After 2006, these quantities will count toward the ISG Benchmarks (column 22) and Annual Targets (column 23) only if and to the extent that water is transferred into the Colorado River Aqueduct for use by MWD and/or SDCWA. 7 MWD can acquire if CVWD declines the water. Any water obtained by MWD will be counted as additional agricultural reduction to help satisfy the ISG Benchmarks and Annual Targets. MWD will provide CVWD 50,000 AFY of the 100,000 AFY starting in year 46. 8 IID has agreed to provide transfer amounts to meet the minimum ISG benchmarks, not to exceed a cumulative total of 145,000 AF. Maximum transfer amounts are 25,000 AF in 2006, 50,000 AF plus the unused amount from 2006 in 2009, and 70,000 AF plus the
unused amounts from 2006 and 2009 in 2012. In addition to the maximum transfer amounts IID has also committed that no more than 72,500 AF of reduced inflow to the Salton Sea would result from these additional transfers. 9 Up to the amount shown, as agreed upon reduction to IID or CVWD to cover collectively the sum of individual Miscellaneous PPRs, federal reserved rights and decreed rights. This is a reduction that counts towards ISG Benchmarks and Annual Targets.
10 For purposes of Subparagraph 8(b)(2)(i) and (ii) and 8(c)(1) and (4) the Secretary will take into account: (i) the satisfaction of necessary conditions to certain transfers (columns 7 and 9) not within IID's control: (ii) the amounts of conserved water as determined, where such amounts may vary (columns 4, 6, 9 and 10); and (iii) with respect to column 7, reductions by IID will be considered in determining IID's compliance regardless of whether the conserved water is diverted into the Colorado River Aqueduct.
11 For purposes of Subparagraph 8(c)(1) and (4) the Secretary will take into account: (i) the satisfaction of necessary conditions to certain transfers (columns 15 and 16) not within CVWD's control; and (ii) the amounts of conserved water as determined, where such amounts may vary (column 15).
12 All consumptive use of priorities 1 through 3 plus 14,500 AF of PPRs must be within 25,000 AF of the amount stated. 13 Assumes SDCWA does not elect termination in year 35. 14 Assumes SDCWA and IID mutually consent to renewal term of 30 years.
Notes:
Substitute transfers can be made provided the total volume of water to be transferred remains equal or greater than amounts shown consistent with applicable federal approvals.
The shaded columns represent amounts of water that may vary.
50

INTENTIONALLY CREATED SURPLUS
In 2006, Reclamation entered into letter agreements with the Imperial Irrigation District and the Metropolitan Water District of Southern California to implement a demonstration program for the development of Intentionally Created Surplus (ICS). In this program, ICS refers to a quantity of surplus water the Secretary may make available for release under Article II(B)(2) of the Consolidated Decree. The demonstration program covered calendars years 2006 – 2007 and required that ICS be created through extraordinary conservation measures.
On December 13, 2007, the Secretary of the Interior signed the Record of Decision, Colorado River Interim Guidelines for Lower Basin Shortages and the Coordinated Operations for Lake Powell and Lake Mead (2007 Interim Guidelines). Beginning in 2008, the creation of ICS is governed by the 2007 Interim Guidelines. Section 3, pages 38-43 of the 2007 Interim Guidelines contains the policies and guidelines concerning the categories of creation, delivery, and accounting for Intentionally Created Surplus.
Under the 2007 Interim Guidelines, ICS may be created by an approved water user using a variety of approved measures within the four established ICS categories: Extraordinary Conservation ICS, Tributary Conservation ICS, System Efficiency ICS, and Imported ICS. Also stipulated in the 2007 Interim Guidelines are the limitations as to the maximum quantities of ICS that may be created during each year, delivered in a year, and accumulated in a water user’s ICS account.
The following conditions apply to ICS:
1) During the year of creation, and with the exception of System Efficiency ICS, there is a one-time deduction of 5 percent from the amount of ICS created which is dedicated to system storage to provide a collective storage benefit for Colorado River water users.
2) Beginning in the year after its creation, and with the exception of System Efficiency ICS, an annual evaporation loss of 3 percent is applied to the quantity of ICS remaining in an ICS account at the end of each year. This assessment is not applied during a shortage year.
3) If the Secretary releases Flood Control Surplus water, Extraordinary Conservation ICS accumulated in ICS accounts is reduced by the amount of the Flood Control Surplus on an acre-foot for acre-foot basis until no Extraordinary Conservation ICS remains.
4) If a water user has an overrun payback obligation, the water user must repay the obligation in full before it can request or receive delivery of ICS.
The Secretary is responsible for approving plans for the creation of ICS, modifications to those plans, and developing procedures to account for and verify ICS creation and delivery.
Table 22 documents information associated with ICS, as applicable, for each individual water user, including.
1) The beginning of year ICS account balance.
2) The amount of ICS created in the reporting year.
3) The amount of ICS delivered in the reporting year.
4) The end of year ICS account balance, after applying reductions for system assessment, IOPP payback, and evaporation, as appropriate.
51
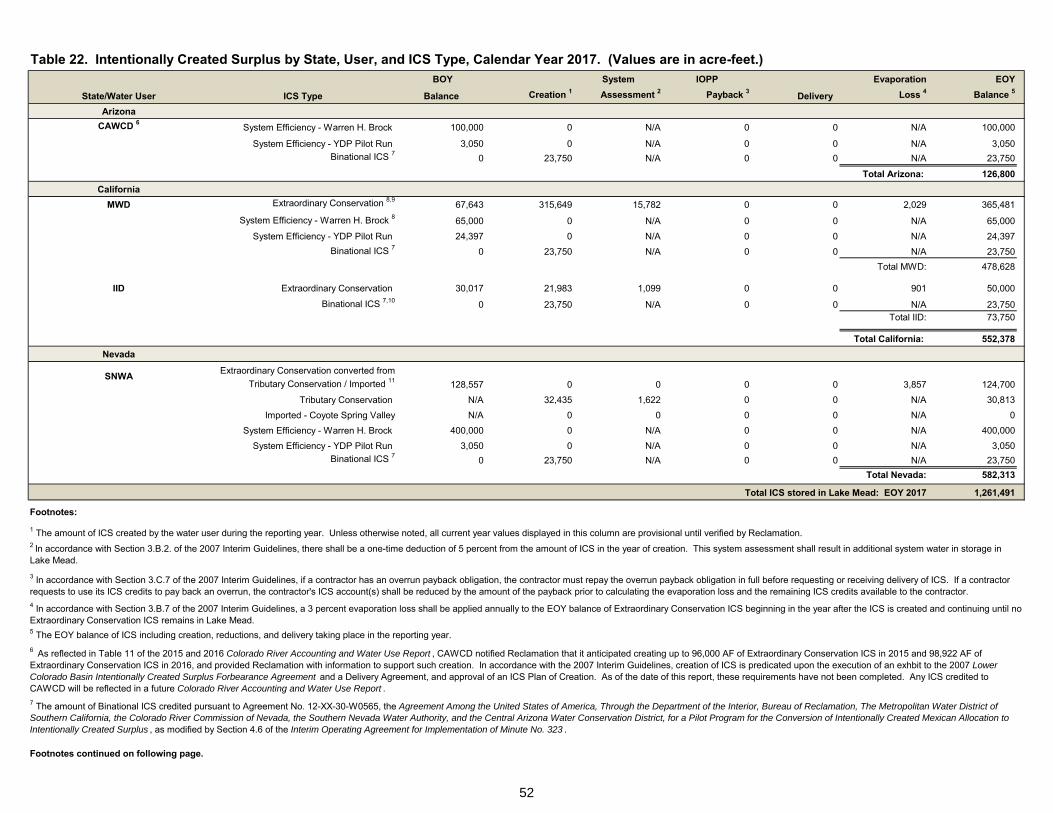
Table 22. Intentionally Created Surplus by State, User, and ICS Type, Calendar Year 2017. (Values are in acre-feet.)
State/Water User ICS Type
BOY
Balance Creation 1
System
Assessment 2
IOPP Evaporation
Payback 3 Delivery Loss 4
EOY
Balance 5
Arizona
CAWCD 6 System Efficiency - Warren H. Brock
System Efficiency - YDP Pilot Run
Binational ICS 7
100,000
3,050
0
0
0
23,750
N/A
N/A
N/A
0 0 N/A
0 0 N/A
0 0 N/A
Total Arizona:
100,000
3,050
23,750
126,800
California
MWD
IID
Extraordinary Conservation 8,9
System Efficiency - Warren H. Brock 8
System Efficiency - YDP Pilot Run
Binational ICS 7
Extraordinary Conservation
Binational ICS 7,10
67,643
65,000
24,397
0
30,017
0
315,649
0
0
23,750
21,983
23,750
15,782
N/A
N/A
N/A
1,099
N/A
0 0 2,029
0 0 N/A
0 0 N/A
0 0 N/A
Total MWD:
0 0 901
0 0 N/A Total IID:
Total California:
365,481
65,000
24,397
23,750
478,628
50,000
23,750 73,750
552,378
Nevada
SNWA Extraordinary Conservation converted from
Tributary Conservation / Imported 11
Tributary Conservation
Imported - Coyote Spring Valley
System Efficiency - Warren H. Brock
System Efficiency - YDP Pilot Run
Binational ICS 7
128,557
N/A
N/A
400,000
3,050
0
0
32,435
0
0
0
23,750
0
1,622
0
N/A
N/A
N/A
0 0 3,857
0 0 N/A
0 0 N/A
0 0 N/A
0 0 N/A
0 0 N/A
Total Nevada:
124,700
30,813
0
400,000
3,050
23,750
582,313
Total ICS stored in Lake Mead: EOY 2017 1,261,491
Footnotes:
1 The amount of ICS created by the water user during the reporting year. Unless otherwise noted, all current year values displayed in this column are provisional until verified by Reclamation. 2 In accordance with Section 3.B.2. of the 2007 Interim Guidelines, there shall be a one-time deduction of 5 percent from the amount of ICS in the year of creation. This system assessment shall result in additional system water in storage in Lake Mead.
3 In accordance with Section 3.C.7 of the 2007 Interim Guidelines, if a contractor has an overrun payback obligation, the contractor must repay the overrun payback obligation in full before requesting or receiving delivery of ICS. If a contractor requests to use its ICS credits to pay back an overrun, the contractor's ICS account(s) shall be reduced by the amount of the payback prior to calculating the evaporation loss and the remaining ICS credits available to the contractor. 4 In accordance with Section 3.B.7 of the 2007 Interim Guidelines, a 3 percent evaporation loss shall be applied annually to the EOY balance of Extraordinary Conservation ICS beginning in the year after the ICS is created and continuing until no Extraordinary Conservation ICS remains in Lake Mead. 5 The EOY balance of ICS including creation, reductions, and delivery taking place in the reporting year.
6 As reflected in Table 11 of the 2015 and 2016 Colorado River Accounting and Water Use Report , CAWCD notified Reclamation that it anticipated creating up to 96,000 AF of Extraordinary Conservation ICS in 2015 and 98,922 AF of Extraordinary Conservation ICS in 2016, and provided Reclamation with information to support such creation. In accordance with the 2007 Interim Guidelines, creation of ICS is predicated upon the execution of an exhbit to the 2007 Lower Colorado Basin Intentionally Created Surplus Forbearance Agreement and a Delivery Agreement, and approval of an ICS Plan of Creation. As of the date of this report, these requirements have not been completed. Any ICS credited to CAWCD will be reflected in a future Colorado River Accounting and Water Use Report . 7 The amount of Binational ICS credited pursuant to Agreement No. 12-XX-30-W0565, the Agreement Among the United States of America, Through the Department of the Interior, Bureau of Reclamation, The Metropolitan Water District of Southern California, the Colorado River Commission of Nevada, the Southern Nevada Water Authority, and the Central Arizona Water Conservation District, for a Pilot Program for the Conversion of Intentionally Created Mexican Allocation to Intentionally Created Surplus , as modified by Section 4.6 of the Interim Operating Agreement for Implementation of Minute No. 323 .
Footnotes continued on following page.
52
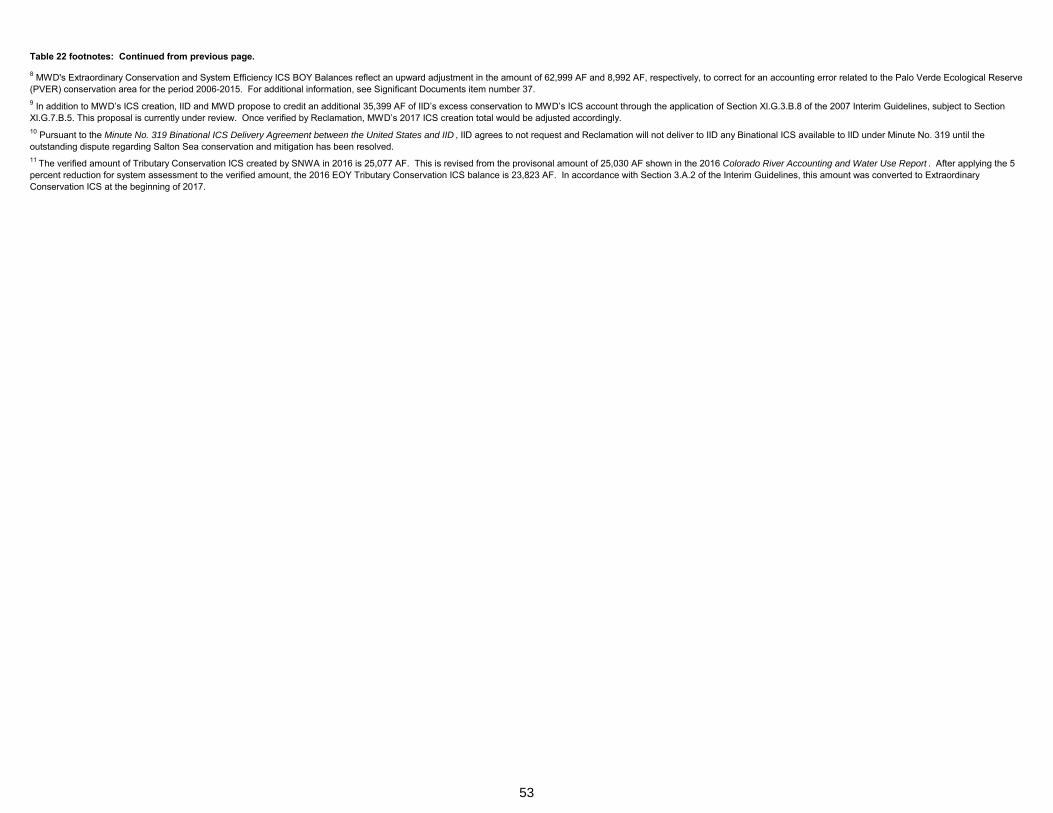
Table 22 footnotes: Continued from previous page.
8 MWD's Extraordinary Conservation and System Efficiency ICS BOY Balances reflect an upward adjustment in the amount of 62,999 AF and 8,992 AF, respectively, to correct for an accounting error related to the Palo Verde Ecological Reserve (PVER) conservation area for the period 2006-2015. For additional information, see Significant Documents item number 37. 9 In addition to MWD’s ICS creation, IID and MWD propose to credit an additional 35,399 AF of IID’s excess conservation to MWD’s ICS account through the application of Section XI.G.3.B.8 of the 2007 Interim Guidelines, subject to Section XI.G.7.B.5. This proposal is currently under review. Once verified by Reclamation, MWD’s 2017 ICS creation total would be adjusted accordingly. 10 Pursuant to the Minute No. 319 Binational ICS Delivery Agreement between the United States and IID , IID agrees to not request and Reclamation will not deliver to IID any Binational ICS available to IID under Minute No. 319 until the outstanding dispute regarding Salton Sea conservation and mitigation has been resolved. 11 The verified amount of Tributary Conservation ICS created by SNWA in 2016 is 25,077 AF. This is revised from the provisonal amount of 25,030 AF shown in the 2016 Colorado River Accounting and Water Use Report . After applying the 5 percent reduction for system assessment to the verified amount, the 2016 EOY Tributary Conservation ICS balance is 23,823 AF. In accordance with Section 3.A.2 of the Interim Guidelines, this amount was converted to Extraordinary Conservation ICS at the beginning of 2017.
53
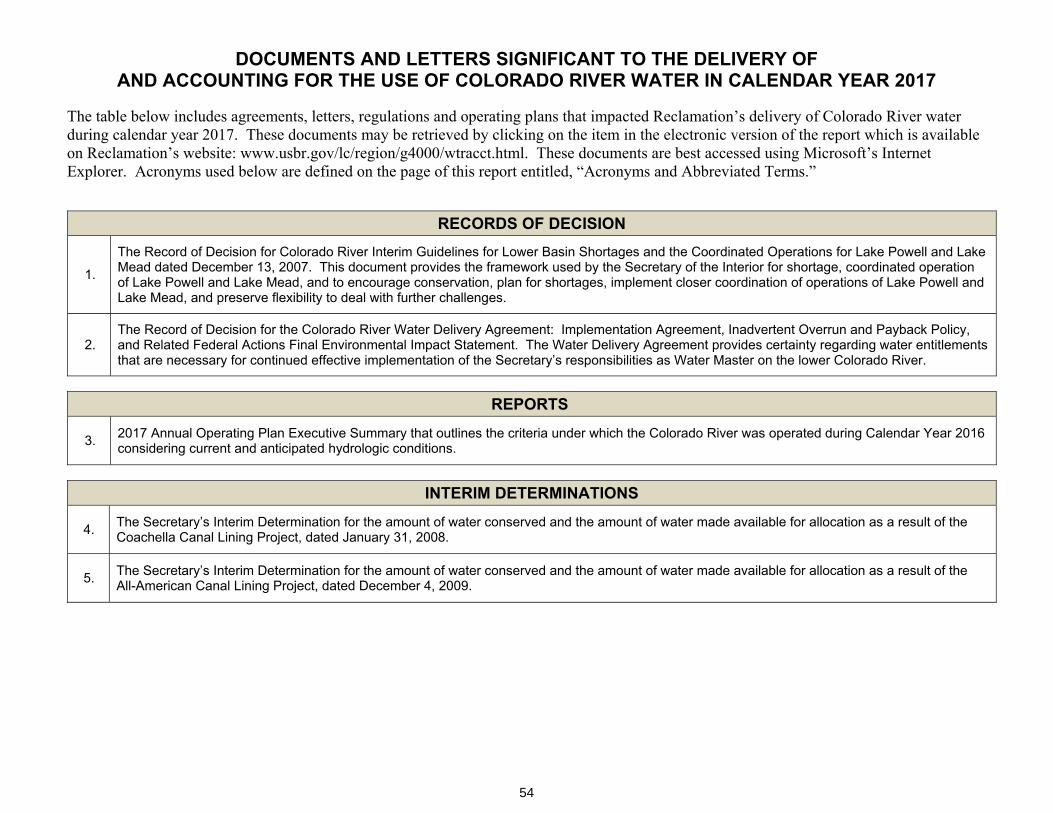
DOCUMENTS AND LETTERS SIGNIFICANT TO THE DELIVERY OF AND ACCOUNTING FOR THE USE OF COLORADO RIVER WATER IN CALENDAR YEAR 2017
The table below includes agreements, letters, regulations and operating plans that impacted Reclamation’s delivery of Colorado River water during calendar year 2017. These documents may be retrieved by clicking on the item in the electronic version of the report which is available on Reclamation’s website: www.usbr.gov/lc/region/g4000/wtracct.html. These documents are best accessed using Microsoft’s Internet Explorer. Acronyms used below are defined on the page of this report entitled, “Acronyms and Abbreviated Terms.”
RECORDS OF DECISION
1.
The Record of Decision for Colorado River Interim Guidelines for Lower Basin Shortages and the Coordinated Operations for Lake Powell and Lake Mead dated December 13, 2007. This document provides the framework used by the Secretary of the Interior for shortage, coordinated operation of Lake Powell and Lake Mead, and to encourage conservation, plan for shortages, implement closer coordination of operations of Lake Powell and Lake Mead, and preserve flexibility to deal with further challenges.
2. The Record of Decision for the Colorado River Water Delivery Agreement: Implementation Agreement, Inadvertent Overrun and Payback Policy, and Related Federal Actions Final Environmental Impact Statement. The Water Delivery Agreement provides certainty regarding water entitlements that are necessary for continued effective implementation of the Secretary’s responsibilities as Water Master on the lower Colorado River.
REPORTS
3. 2017 Annual Operating Plan Executive Summary that outlines the criteria under which the Colorado River was operated during Calendar Year 2016 considering current and anticipated hydrologic conditions.
INTERIM DETERMINATIONS
4. The Secretary’s Interim Determination for the amount of water conserved and the amount of water made available for allocation as a result of the Coachella Canal Lining Project, dated January 31, 2008.
5. The Secretary’s Interim Determination for the amount of water conserved and the amount of water made available for allocation as a result of the All-American Canal Lining Project, dated December 4, 2009.
54

DOCUMENTS AND LETTERS SIGNIFICANT TO THE DELIVERY OF AND ACCOUNTING FOR THE USE OF COLORADO RIVER WATER IN CALENDAR YEAR 2017
PILOT SYSTEM CONSERVATION PROGRAM
6.
Agreement (No. 14-XX-30-W0574) Among The United States of America, Through The Department of the Interior, Bureau of Reclamation, The Central Arizona Water Conservation District, The Metropolitan Water District of Southern California, Denver Water, and The Southern Nevada Water Authority, For A Pilot Program for Funding the Creation of Colorado River System Water through Voluntary Water Conservation and Reductions in Use, dated July 30, 2014, including Amendment Nos. 1 and 2.
7. System Conservation Implementation Agreement No. 15-XX-30-W0587 Between Reclamation and City of Bullhead City, Arizona to Implement a Pilot System Conservation Program, dated September 15, 2015.
8. System Conservation Implementation Agreement No. 16-XX-30-W0606 Between Reclamation and the Colorado River Indian Tribes to Implement a Pilot System Conservation Program, dated September 14, 2016.
9. System Conservation Implementation Agreement No. 16-XX-30-W0609 Between Reclamation and the Tohono O’odham Nation to Implement a Pilot System Conservation Program, dated September 14, 2016.
10. System Conservation Implementation Agreement No. 15-XX-30-W0596 Between Reclamation and the City of Needles to Implement a Pilot System Conservation Program, dated April 15, 2016.
11. System Conservation Implementation Agreement No. 15-XX-30-W0593 Between Reclamation and the Coachella Valley Water District to Implement a Pilot System Conservation Program, dated January 11, 2016.
12. System Conservation Implementation Agreement No. 16-XX-30-W0612 Between Reclamation and the Southern Nevada Water Authority to Implement a Pilot System Conservation Program, dated October 17, 2016.
DROUGHT RESPONSE
13. System Conservation Implementation Agreement No. 17-XX-30-W0620 Between Reclamation and the Gila River Indian Community, dated January 18, 2017.
14. Agreement No. 17-XX-30-W0623 Among Reclamation, the Arizona Department of Water Resources, the Gila River Indian Community, the City of Phoenix, and the Walton Family Foundation, Inc., to Fund the Creation of Colorado River System Water Through Voluntary Water Conservation and Reductions in Use During 2017, dated July 14, 2017.
INTENTIONALLY CREATED SURPLUS
15. Documents related to the creation, delivery, and accounting of IID’s ICS, calendar year 2017.
16. Documents related to the creation, delivery, and accounting of MWD’s ICS, calendar year 2017.
55
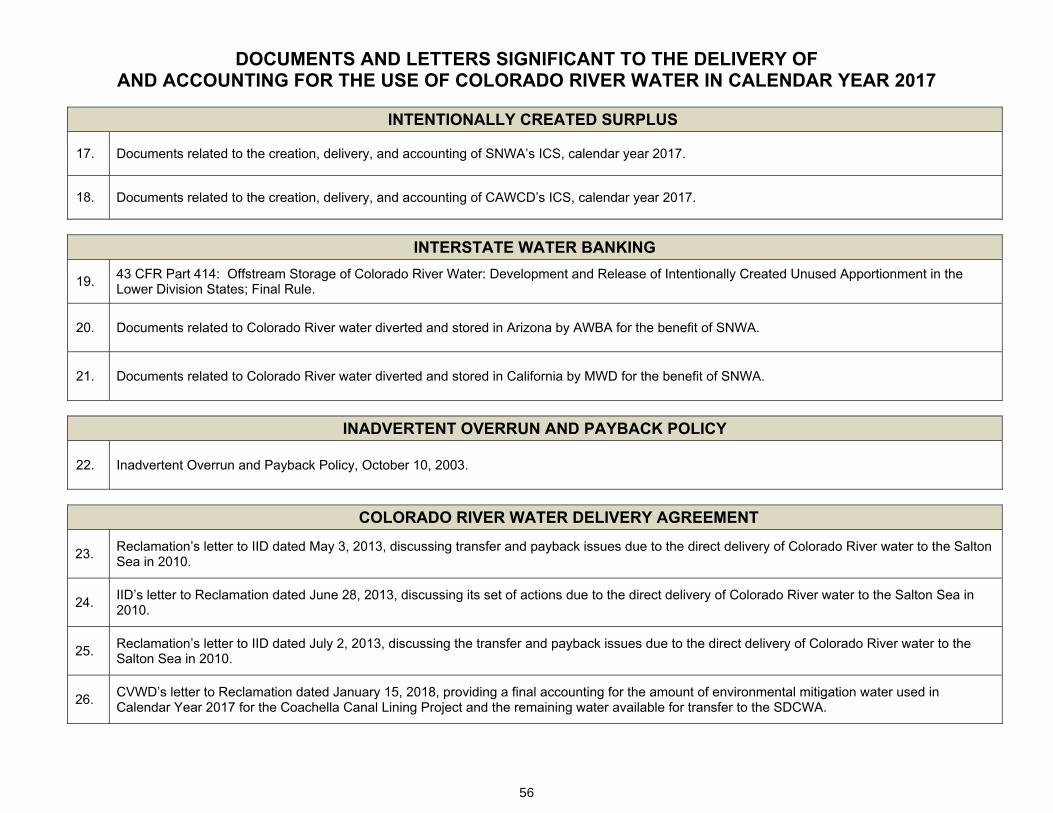
DOCUMENTS AND LETTERS SIGNIFICANT TO THE DELIVERY OF AND ACCOUNTING FOR THE USE OF COLORADO RIVER WATER IN CALENDAR YEAR 2017
INTENTIONALLY CREATED SURPLUS
17. Documents related to the creation, delivery, and accounting of SNWA’s ICS, calendar year 2017.
18. Documents related to the creation, delivery, and accounting of CAWCD’s ICS, calendar year 2017.
INTERSTATE WATER BANKING
19. 43 CFR Part 414: Offstream Storage of Colorado River Water: Development and Release of Intentionally Created Unused Apportionment in the Lower Division States; Final Rule.
20. Documents related to Colorado River water diverted and stored in Arizona by AWBA for the benefit of SNWA.
21. Documents related to Colorado River water diverted and stored in California by MWD for the benefit of SNWA.
INADVERTENT OVERRUN AND PAYBACK POLICY
22. Inadvertent Overrun and Payback Policy, October 10, 2003.
COLORADO RIVER WATER DELIVERY AGREEMENT
23. Reclamation’s letter to IID dated May 3, 2013, discussing transfer and payback issues due to the direct delivery of Colorado River water to the Salton Sea in 2010.
24. IID’s letter to Reclamation dated June 28, 2013, discussing its set of actions due to the direct delivery of Colorado River water to the Salton Sea in 2010.
25. Reclamation’s letter to IID dated July 2, 2013, discussing the transfer and payback issues due to the direct delivery of Colorado River water to the Salton Sea in 2010.
26. CVWD’s letter to Reclamation dated January 15, 2018, providing a final accounting for the amount of environmental mitigation water used in Calendar Year 2017 for the Coachella Canal Lining Project and the remaining water available for transfer to the SDCWA.
56

DOCUMENTS AND LETTERS SIGNIFICANT TO THE DELIVERY OF AND ACCOUNTING FOR THE USE OF COLORADO RIVER WATER IN CALENDAR YEAR 2017
WATER ACCOUNTING
27. A description on how irrigation water is calculated by the USGS for areas where estimates of diversion are required.
28. Maps showing the locations of the wells and river pumps reported by the USGS.
29. CAWCD’s letter to Reclamation dated June 28, 2017, regarding its revised estimates of Colorado River water diversion for calendar year 2017, in which CAWCD notified Reclamation that it anticipated leaving unused Arizona basic apportionment in Lake Mead to effect a voluntary contribution to benefit system storage.
30. 2007 California Agreement for the Creation and Delivery of Extraordinary Conservation Intentionally Created Surplus (California ICS Agreement).
31. 2015 Amendment No. 1 to the 2007 California ICS Agreement.
32. IID’s letter to MWD dated October 27, 2017, requesting to store up to 69,000 AF of IID’s 2017 excess extraordinary conservation water in MWD’s system.
33. MWD’s letter to IID dated November 28, 2017, in which MWD agreed to store up to 69,000 AF of IID’s excess extraordinary conservation water in calendar year 2016.
34. IID and MWD joint letter dated April 18, 2018, re: a 2015 IID Total Diversion to Field Loss Percentage Calculation Correction and Related Adjustment to IID’s Excess and Additional Excess Extraordinary Conservation Intentionally Created Surplus Delivered to Metropolitan’s System
35. Procedure for Determining Return Flow Credits to Nevada from Las Vegas Wash, adopted by the Task Force on Unmeasured Return Flows on August 28, 1984.
36. Reclamation letter to SNWA and CRCN dated December 5, 2007 regarding Las Vegas Valley Return Flow Credit Methodology.
37. Technical Report: Calculation of Consumptive Use and Unmeasured Return Flow from the Palo Verde Ecological Reserve – Calendar Years 2006-2016.
57

DOCUMENTS AND LETTERS SIGNIFICANT TO THE DELIVERY OF AND ACCOUNTING FOR THE USE OF COLORADO RIVER WATER IN CALENDAR YEAR 2017
UNITED STATES-MEXICO 1944 WATER TREATY
38. Minute No. 242 – Permanent and Definitive Solution to the International Problem of the Salinity of the Colorado River.
39. Minute No. 318 – Adjustment of Delivery Schedules for Water Allotted to Mexico for the Years 2010 Through 2013 as a Result of Infrastructure Damage in Irrigation District 014, Rio Colorado, Caused by the April 2010 Earthquake in the Mexicali Valley, Baja California.
40. Minute No. 319 – Interim International Cooperative Measures in the Colorado River Basin Through 2017 and Extension of Minute 318 Cooperative Measures to Address the Continued Effects of the April 2010 Earthquake in the Mexicali Valley, Baja California.
41. Minute No. 322 – Extension of the Temporary Emergency Delivery of Colorado River Water for use in Tijuana, Baja California
42. Minute No. 323 – Extension of Cooperative Measures and Adoption of a Binational Water Scarcity Contingency Plan in the Colorado River Basin
43. 2001 Memorandum of Understanding between Reclamation and the U.S. Section of the IBWC regarding deliveries at SIB.
44. USIBWC’s Letter to Reclamation dated December 14, 2017, advising Reclamation of the implementation of Section III.6.e.iii of Minute No. 319.
45. Reclamation’s letter to USIBWC dated December 19, 2017, regarding the conversion of water pursuant to Section III.6.e.iii of Minute No. 319.
46. USIBWC’s letter to Reclamation dated April 26, 2018, advising Reclamation on the accounting of the volumes of Colorado River water deferred by Mexico in accordance with Minute Nos. 318, 319, and 323.
47. Reclamation’s letter to USIBWC dated May 11, 2018, stating its concurrence with the accounting of the volumes of Colorado River water deferred by Mexico.
58

Maps Identifying the General Location of Lower Colorado River Water Users
59

60

61
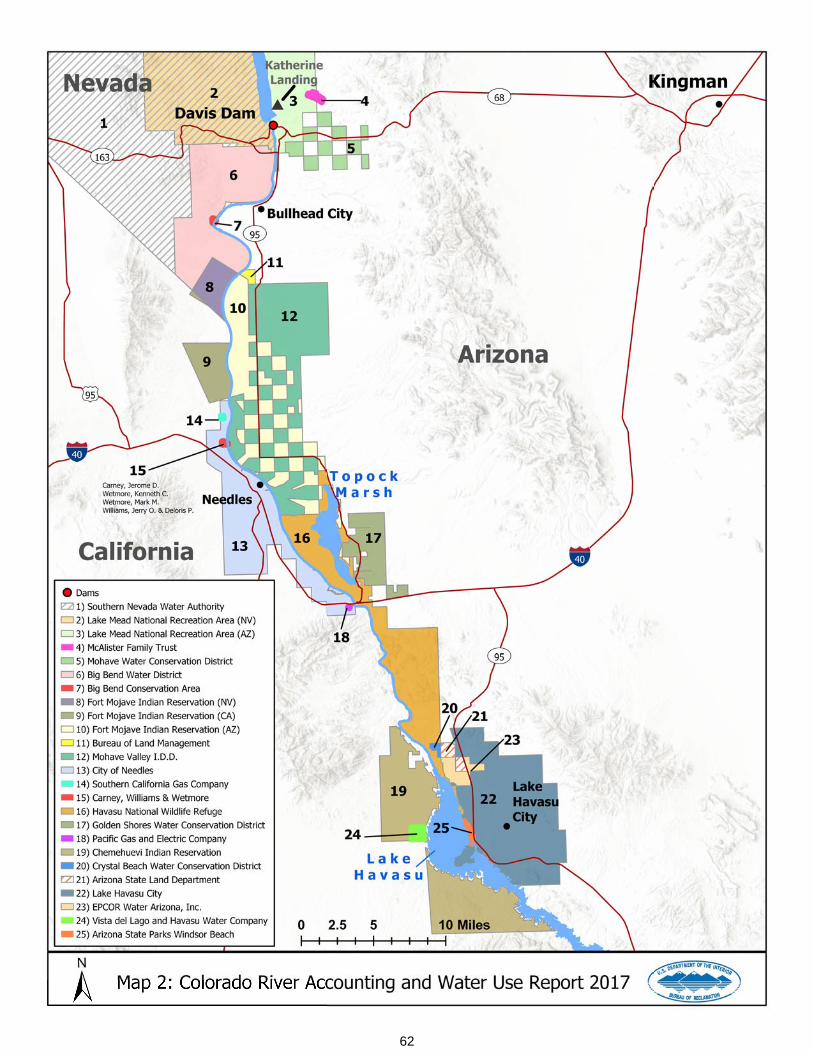
62
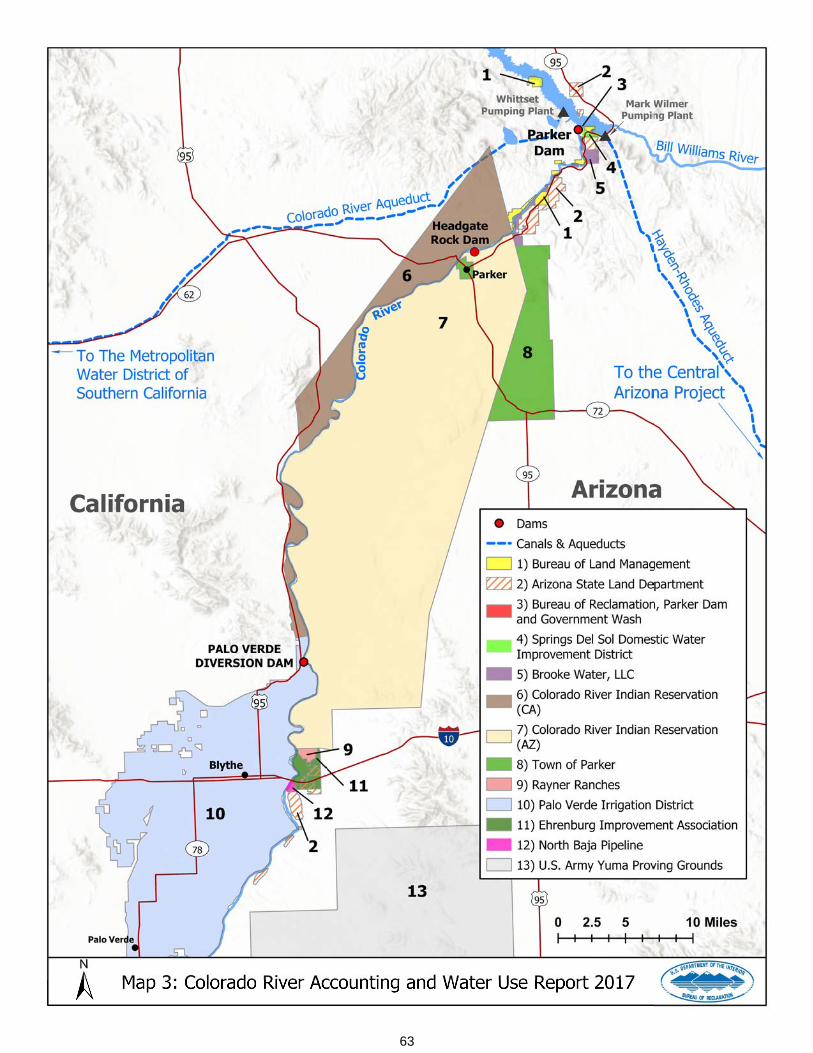
63
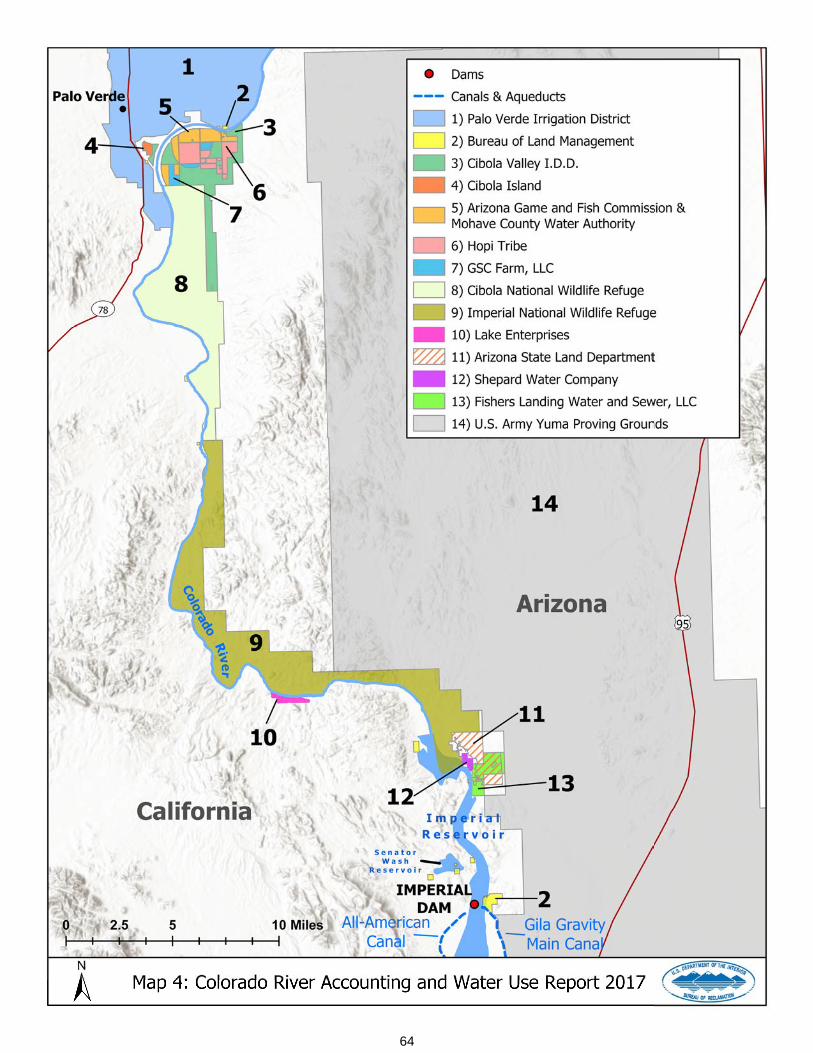
64
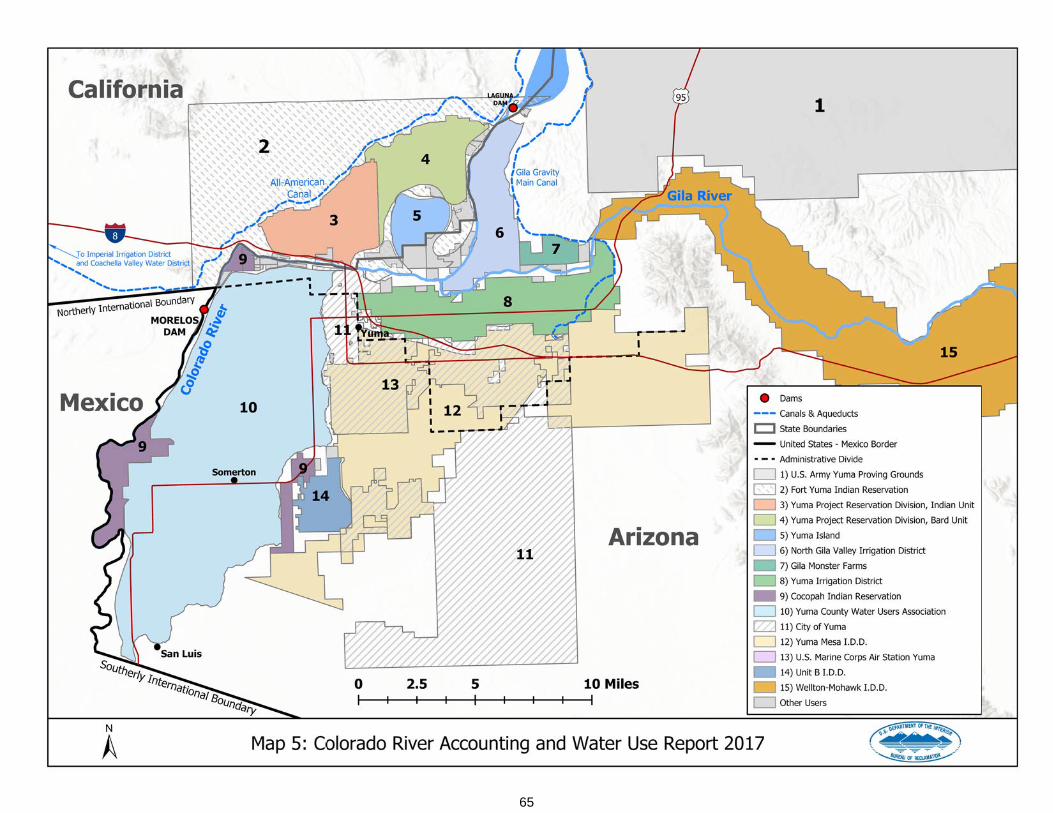
65

66

67