recognition of pyralidae insects using intelligent
TRANSCRIPT

Recognition of Pyralidae Insects Using Intelligent
Monitoring Autonomous Robot Vehicle in Natural
Farm Scene
Boyi Liu 1, 2, Zhuhua Hu 1,*, Yaochi Zhao 1, Yong Bai 1 and Yu Wang 1
1 State Key Laboratory of Marine Resource Utilization in South China Sea, College of Information Science & Technology,
Hainan University, Haikou 570228, China; [email protected] (B.L.); [email protected] (Y.Z.); [email protected]
(Y.B.); [email protected] (Y.W.)
2 University of Chinese Academy of Science, Beijing 100049, China
* Correspondence: [email protected]; Tel.: +86-155-0090-9301
Abstract. The Pyralidae pests, such as corn borer and rice leaf roller, are main pests in economic crops.
The timely detection and identification of Pyralidae pests is a critical task for agriculturists and farmers.
However, the traditional identification of pests by humans is labor intensive and inefficient. To tackle
the challenges, a pest monitoring autonomous robot vehicle and a method to recognize Pyralidae pests
are presented in this paper. Firstly, the robot on autonomous vehicle collects images by performing
camera sensing in natural farm scene. Secondly,the total probability image can be obtained by using
inverse histogram mapping, and then the object contour of Pyralidae pests can be extracted quickly and
accurately with the constrained Otsu method. Finally, by employing Hu moment and the perimeter and
area characteristics, the correct contours of objects can be drawn, and the recognition results can be
obtained by comparing them with the reference templates of Pyralidae pests. Additionally, the moving
speed of the mechanical arms on the vehicle can be adjusted adaptively by interacting with the
recognition algorithm. The experimental results demonstrate that the robot vehicle can automatically
capture pest images, and can achieve 94.3% recognition accuracy in natural farm planting scene.
Keywords. Pest recognition, Pyralidae pests, Agricultural robot, Image processing.
Introduction
In agricultural production, the timely detection and identification of pests/diseases is a critical task
for agriculturists and farmers to maintain the stability of grain output and reduce the environmental
pollution caused by the usage of pesticides. Pyralidae insect is one of the most common pests in maize,
sorghum and so on, and it does great harm to the quality and productivity of crops [1]. However, the
traditional monitoring by humans requires a large amount of labor, and the detection is not timely due
to human omissions. With the rapid development of artificial intelligence, computer vision-based pest
detection has attracted attention from agriculturalists and computer scientists [2].
Related Work
Some computer vision-based methods have been proposed to identify plant pests/diseases.
Generally, they can be categorized as unsupervised and supervised methods.
In the category of unsupervised methods, the researchers need to analyze the specific features of
pests/diseases, and design a feature extractor to separate the pests/diseases from background, then the
additional features related to the segmented area are extracted to use for the classification of
pests/diseases. For example, in [3], the authors applied multifractal analysis to segment action of

whitefly images based on the local singularity and global image characteristics. In [4], convolutional
Riemannian texture structure was explored to differentiate the environmental background textures and
potential pest textures in pest camouflages in grains, then a differential entropic active contour model
was developed to detect pests. In [5], to identify common greenhouse pests, such as whiteflies, aphid
and thrips, the watershed algorithm was used to segment pests from the background images, and then
color features of pests were subsequently extracted by Mahalanobis distance for identification of pest
species. Besides single cue of feature channels, multi-feature fusion based method was also employed
to identify pests/diseases. For example, in [6], the authors use color, shape and texture features and
combined them with sparse representation to recognize pests.
In the past decade, as the increasing development of machine learning technology, more and more
supervised models are designed to identify pests/ diseases. In traditional supervised learning, the
features of pests/diseases are defined by human handcraft. In practical applications, the feature
information is firstly computed, and then it is fed to suitable classifiers to recognize pests/diseases. For
examples, Ali et al. applied DE color difference algorithm to separate the disease affected area, and the
color histogram and textural features were also used to classify diseases [7]. Lu et al. used spectroscopy
technology to detect anthracnose crown rot in strawberry [8], in which the spectral vegetation indices
are used to train SDA (Stepwise Discriminant Analysis), FDA (Fisher discriminant analysis) and
KNN(K-Nearest Neighbor) classifiers. Xie et al. employed KNN classifier to identify whether there is
gray mold disease in tomato leaves from hyper-spectral images [9]. In [10], HOG(Histogram of
gradient), Gabor and LBP (Local binary Pattern) features are calculated, and then Adaboost (Adaptive
Boost) and SVM(Support Vector Machine) are used to recognize white-backed plant hoppers in paddy
fields and identify their developmental stages. Similarly, in [11,12], the authors used histograms of
oriented gradient features or region index as well as color index to design SVM structure, then SVM
method is used for the classification of pests. In [13], features are extracted by using DCT (Discrete
Cosine Transform) and then pests are classified with ANN (Artificial Neural Network). In [14, 15] the
authors used the color feature to train a GMM (Gaussian Mixture Model), and with the trained model
pest/diseases can be segmented accurately from background for subsequent recognition.
In the last five years, there are great innovations in the field of machine learning and DCNN (Deep
Convolutional Neural Networks) [16, 17, 18]. They have dramatically advanced the object recognition
to improve the recognition accuracy of pests/diseases in agricultures. For example, Sharada et al.
applied deep learning technology to train a DCNN from 54,306 image of disease and healthy plant
leaves collected under controlled conditions, and tested in their validation dataset with 99.35%
recognition accuracy [19]. There are also pioneering work in training datasets [20, 21].
Regardless what supervised or unsupervised approach is, a large number of images with
pests/disease are needed to construct and test a recognition model. However, the collection of
pests/disease images is difficult and labor intensive. Researchers have been trying to reduce difficulty
and labor force by pre-processing technology, such as focusing on or using stick trap [22, 3]. However,
such designed algorithms are not suitable for the recognition of pests/disease in natural farm scene.
Hence the acquisition technology of images with pest/disease is important for pest/disease recognition.
We noted that there is little research to address this issue in present. In [23], the authors designed a pre-
programmed autonomous pest control robot to sample bemisia tabaci adults, but the background of
image is still not in a natural farm scene.
Motivation and Main Contributions
At present, most of the images of pests and diseases are taken manually, and some of them are

selected for research. However, the effectiveness of the algorithms for continuous dynamic natural
scenes has not been verified by many studies. In addition, most of the existing researches focus on
simulation analysis for the detection of diseases and insect pests. The intelligent detection robots with
autonomous control are rarely reported for the natural farm scene. Finally, the algorithms based on
neural networks require a large number of training samples, which are not suitable for mobile embedded
real-time monitoring devices. To overcome these shortcomings, we made the following contributions.
(1) We design a monitoring robot vehicle that can take images in natural farm scene. The recognition
probability of diseases and insect pests is interacted in real time with the control the moving speed
of the mechanical arms on the robot vehicle.
(2) We propose the detection and identification algorithm for Pyralidae pests. Considering that the
color characteristics of adult Pyralidae pests are different from the background, we use color
histogram mapping and constrained Otsu to accurately segment pests from complex scenes. Then,
based on the segmentation results, we apply geometry invariant moments to recognize the
Pyralidae pests in images. Our designed algorithm does not need large amount of data samples.
(3) We implement the algorithm on the embedded board of the smart vehicle, and verify the
effectiveness of our proposed algorithm in the actual application scenarios.
The rest of this paper is organized as follows. Section 2 shows data acquisition equipment and its
structure, and also describes of our proposed detection and recognition algorithm. In Section 3, we
present the experimental results using the monitoring robot and the proposed recognition scheme.
Finally, Section 4 concludes the paper.
Materials and Methods
Acquisition Equipment of Pyralidae Insects Images
1.Deep grooved wheel, 2.Shell, 3.Guardrail, 4.Screen display, 5.Camera, 6. Mechanical arm, 7.Vertical thread
screw, 8.Screw guardrail, 9.Solar panels, 10. Sensor integrator, 11. Horizontal screw motor, 12. Trap lamp, 13.The
hardcore, 14. Cross bar, 15.Insects collecting board, 16.Vertical thread screw driven motor, 17. Chassis, 18. Vehicle
control buttons, 19. Horizontal thread screw, 20. Trap top cover.
Figure1. The intelligent autonomous robot vehicle
The images used in our study are collected by an Automatic Detection and Identification System

for Pests and Diseases. The system was developed by our team and has been installed at the zone of
technology application and demonstration of Hainan University in Hainan province, China. The system
prototype and structure diagram is shown in Figure 1. The system can be divided into five major parts:
the camera sensor (automatic focusing, resolution 1600×1200 and camera model KS2A01AF) and
display unit; trap unit; the power transmission unit; the intelligent detection and recognition unit; and
the hardware bearer unit. Table 1 shows the technical parameters of the robot vehicle.
Table 1. The technical parameters of the robot vehicle.
Parameters Value
Boundary dimension - (mmmmmm) 11808601800
Running speed – ( m/s) 0.56
Description of Proposed Recognition Scheme
In this paper, the recognition scheme for Pyralidae insects, based on the method of inverse
histogram mapping, is composed of five parts, including input module, reference image processing
module, image segmentation module, contour extraction module, and object recognition module.
The input module firstly converts the experimental image into a matrix and initializes the
parameters such as the binarization threshold of the probability image and contour recognition threshold.
In the module of reference image processing, the reference image is transformed from RGB to HSV
space and the histogram of the color layer (H layer) is computed. The image segmentation module is
designed to compute the color histogram of the experimental image, normalize its histogram, obtain the
probability image by mapping between histogram of test image and reference image, and then binarize
the probability image.
Subsequently, in the contour extraction module, the contour of the binary image is extracted. The
contours of the internal holes are removed by morphological methods according to the circumference
and area features.
Finally, in the target recognition module, the algorithm recognizes the object contour by calculating
the similarity between the contour obtained in the previous steps and the template contour. The object
contour is confirmed when the similarity of the contour is larger than a threshold, and thus we can obtain
the recognition results.
The pseudo-code for the proposed scheme is shown in Table 2. In Table 2, S denotes the template
image, and Mx represents the image to be detected.
Table 2. The pseudo-code description of proposed scheme.
Output: Three vertices of triangular markings on the Pyralidae insects 1 1 2 2 3 3
( , ), ( , ), ( , ) .
1: Initialize: (R, G, B)←S, Mx
2: Setting: The threshold of Hu moments; Reference contour image Yimage
3: V=max(R, G, B);
S=(V-min(R,G,B))×255/V if V!=0, 0 otherwise
H=
( ) 60 /
180 ( ) 60 /
240 ( ) 60 /
G B S if V=R
B R S if V=G
+ R G S if V=B
−
+ −
−
4: for i =0:1:255
The color histogram of each image is obtained by statistics: H←Xi=Hpi/(Hm×Hn);

Normalize(H);
end for
5: for i =0:1:m
for j=0:1:n
Gij = Similarity(H of {Image blocks with the same size as Mx}, H of Mx) /* Calculate the histogram similarity
*/
end for
end for
6: R=OSTU(G); /* the image is binarized*/
7: C=findContours(R) /*findContours() extracts the contours from binary images*/
8: real_match ← Based on Hu moment, calculating the similarity between C and the template contour
9: if real_match > match:
Triangle ← Approximate processing for triangle contour;
Output vertex coordinates
else:delete R
Probability Image Based on Color Histogram Inverse Projection and Multi-Template Matching
The adults of the Pyralidae insects are yellowish brown. The back of the Pyralidae insects is
yellowish brown, and the end of the abdomen is relatively thin and pointed. Usually, they have a pair
of filamentous antennae, which are grayish brown. Meanwhile, its forewing is tan, with two brown
wavy stripes, and there are two yellowish brown short patterns between the two lines. In addition, the
hind wings of the Pyralidae insects are grayish brown; especially, female moths are similar in shape to
male moths with lighter shades, yellowish veins, lightly brown texture and obese abdomen. From these
characteristics, the color characteristics of adult Pyralidae insects are obvious, and it is very effective
to recognize the Pyralidae insects by color characteristics. Color histograms are often used to describe
color features, and are particularly useful for describing images that are difficult to segment
automatically.
The inverse projection of the histogram is proposed by Michael J.Swain and Dana H. Ballard [24],
which is a form of record that shows how the pixel or pixel block adapts to the histogram model
allocation. It can be used to segment image or find interesting content in the image. The output of the
algorithm is an image of the same size as the input image, where the value of the pixel represents the
probability that it belongs to the object image. Therefore, it is possible to obtain a probability image by
mapping the histogram in the object image by using the template image of the Pyralidae insects.
Considering the Pyralidae insects’ highlight color feature and the functional characteristics of histogram
reflective algorithm, our proposed scheme applies image grayscale processing based on the reflection
of the color histogram in the color feature extraction step. After the object image and the template image
are converted into the HSV space and the color layer (i.e. the H component) is extracted, the image is
grayed out by the method of histogram mapping. The gray image obtained in this way is a probability
image that reflects the degree of similarity to the object color. Thus, it realizes the color distribution
feature screening of the object image. The process of the algorithm is shown as follows:
(1) Convert the reference image into HSV space, extract the H spatial matrix, calculate statistical
histogram and normalize it.
(2) Start from the first pixel (x, y) of the experimental image, cut a temporary image that is the

same size as the reference image, where (x, y) is the center pixel of the temporary image. Extract the H
space matrix, calculate its histogram and normalize it.
(3) Let Sim ilarity(H , H )1 2 denotes the similarity between the color histogram of the detected image
H1 and the color histogram of the reference image H2. The degree of similarity indicates how the color
characteristics of the pixels are in line with the probability of Pyralidae insects.
Calculate Sim ilarity(H , H )1 2 as described in Eq. (1) and Eq. (2).
' 1( ) ( )
N
k k k
j
H H i H jN
= − (1)
' '
1 2
' 2 ' 2
1 2
( ) ( )
( ) ( )
N
i
N
i
H i H i
Similarity(H , H )=
H i H i
1 2 (2)
In the Eq. (1) and Eq. (2), 1, 2k , 1, 2, 3, ,i j N= , N is the number of intervals in the
histogram, ( )k
H i is the value of the i-th interval in the k-th histogram.
In addition, the color and texture between different Pyralidae insects in natural scenes are distinct,
and hence it is necessary to use a plurality of template images for histogram inverse projection
processing. Otherwise, the use of a template cannot be adapted to a variety of different scenes. As shown
in Table 3, three template images are given. The total probability image obtained is shown in Eq. (3),
where M represents the number of template images.
( )1
1
,
M
m
m
Similarity(H ) Similarity H H=
1= (3)
After the images are converted to HSV space, histogram inverse mapping is conducted by
employing three template images, and thus we can obtain the probability image respectively. Then, the
three probability images are combined into one image, and logic and erosion operations are performed.
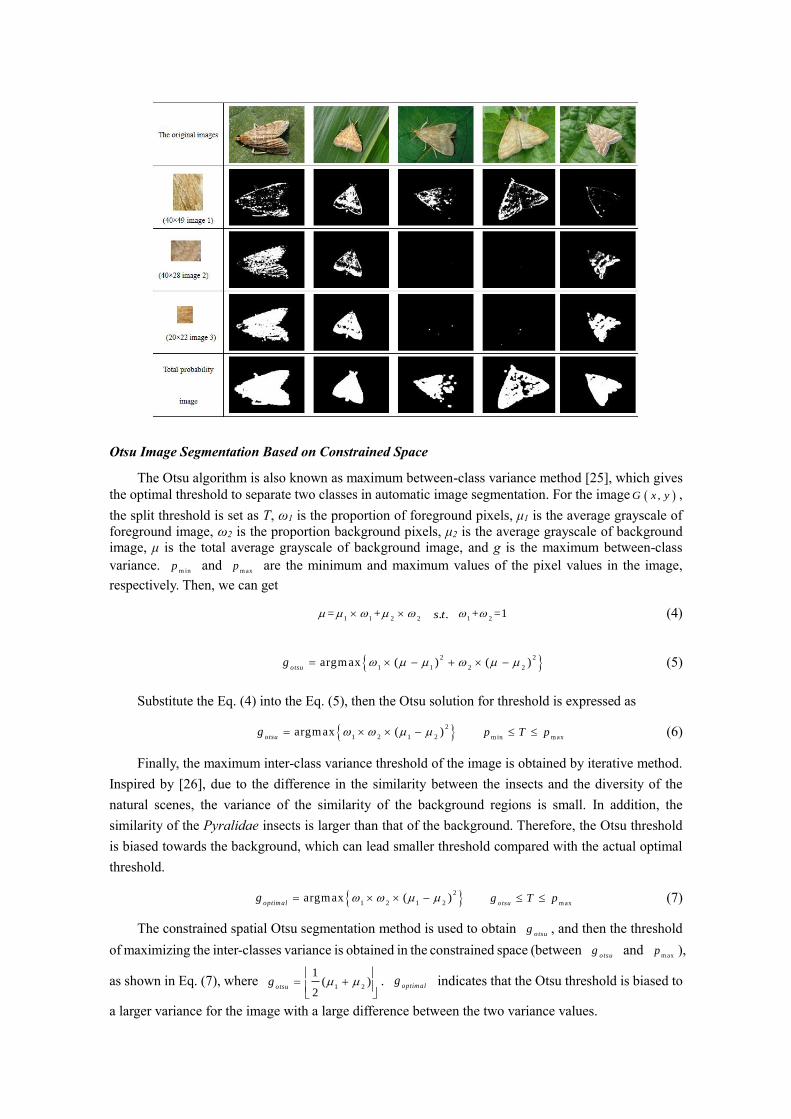
Table 3 shows the probability images obtained by histogram inverse mapping. The images in the
first column are the template images. Except the template images, the rest images in Table 3 are
experiment images or probability images. The first row is the original images containing Pyralidae
insects, and the second to the 4th rows are the probability images obtained by mapping the test images’
inverse histogram with the template image respectively. The last row is the total probability image
Table 3. The original images and the obtained binary probability images
after inverse histogrammapping.
Otsu Image Segmentation Based on Constrained Space
The Otsu algorithm is also known as maximum between-class variance method [25], which gives
the optimal threshold to separate two classes in automatic image segmentation. For the image ( ),G x y ,
the split threshold is set as T, ω1 is the proportion of foreground pixels, μ1 is the average grayscale of
foreground image, ω2 is the proportion background pixels, μ2 is the average grayscale of background
image, μ is the total average grayscale of background image, and g is the maximum between-class
variance. m in
p and m ax
p are the minimum and maximum values of the pixel values in the image,
respectively. Then, we can get
1 1 2 2= + . .s t
1 21+ = (4)
2 2
1 1 2 2argmax ( ) ( )
otsug = − + − (5)
Substitute the Eq. (4) into the Eq. (5), then the Otsu solution for threshold is expressed as
2
1 2 1 2argmax ( )
otsug = −
m in m axp T p (6)
Finally, the maximum inter-class variance threshold of the image is obtained by iterative method.
Inspired by [26], due to the difference in the similarity between the insects and the diversity of the
natural scenes, the variance of the similarity of the background regions is small. In addition, the
similarity of the Pyralidae insects is larger than that of the background. Therefore, the Otsu threshold
is biased towards the background, which can lead smaller threshold compared with the actual optimal
threshold.
2
1 2 1 2argmax ( )
optimalg = −
m axotsug T p (7)
The constrained spatial Otsu segmentation method is used to obtain otsu
g , and then the threshold
of maximizing the inter-classes variance is obtained in the constrained space (between otsu
g and m ax
p ),
as shown in Eq. (7), where 1 2
1( )
2otsu
g
= +
. optimalg indicates that the Otsu threshold is biased to
a larger variance for the image with a large difference between the two variance values.

Object Contour Recognition Based on Hu Moments
The moment feature mainly characterizes the geometric characteristics of the image area, and it is
known as the geometric moment. Because it has the invariant characteristics of the rotation, translation,
scale and so on, it is also called the invariant moment. In image processing, geometric invariant
moments can be used as an important feature to represent objects, which can be used to classify images.
Among numerous geometric invariant moments, Hu moment is the most popular invariant moments
[27].
Specifically, we assume that the gray distribution in the target D region is f (x, y). To describe
the target, the gray distribution outside the region D is considered to be 0, and then the geometric
moment p q
m and the regional moment p q
of the p q+ order are respectively expressed as follows:
( , )p q
pq
D
m x y f x y dxdy= (8)
( ) ( ) ( , )p p
p q
D
x x y y f x y dxdy = − − (9)
According to the two above equations, a contour can be represented by p q
m with p q
. Based on
the similarity between the experimental contour and the reference contour, the contour will be removed
if the similarity is less than the threshold. The left contour is the contours of the Pyralidae insects.
Finally, by using the function called approxPolyDP() in the OpenCV and other contour approximation
processing function, the contour is approximated to a triangle and marked. Obviously, the marked
contour is the desired result. Remark: The approxPolyDP function can perform polygon fitting on
contour points.
Recognition Algorithm interacted with Robot Control
As can be seen from Figure 2, the mechanical arms on both sides carry cameras to obtain the video
stream of diseases and insect pests in real time. Then, the video stream is transmitted to the analysis
module in the robot vehicle, and the probability of the existence of Pyralidae insects in each frame is
obtained, and the probability value is transmitted to the controller. If the probability exceeds a preset
threshold, a warning message will be sent to the responsible experts. Meanwhile, the controller converts
the received probability information into the speed of the motor in a linear relationship. There are four
motors in the robot vehicle, namely two motors that control the up and down motion of the slide bar,
and two motors that control the left and right motion of the mechanical arms.
Interaction of the robot operations with the pest recognition is one of the innovations of our
proposal. According to the probability of similarity, the robot arms can adjust their speed. When the
recognition similarity is greater than 0.9, the robot arms stop moving for the camera sensors to collect
more images. Only when the similarity of five consecutive insect images is greater than 0.9, the robot
issue an alarm and we can make the final decision on the presence of Pyralidae insects. When the
similarity is between 0.7 and 0.9, the movement of mechanical arms slow down to account for the fact
that maybe there is interference of other insects. By adaptively adjusting the moving speed of
mechanical arms, the miss detection and false alarm can be significantly reduced.
In Figure 2, the robot vehicle can adjust the movement of the mechanical arms according to
similarity probability. At the end of the arm, an embedded board with a camera sensor can change the
angle of the shot. The mechanical arms also can move up and down or back and forth with the driving
of the motor.

(a) (b) (c)
(d) (e) (f)
Figure 2. Movement of the mechanical arm based on recognition similar probability.
(a) - (d) Motion state of the mechanical arms; (e)-(f) The slide rails for the horizontal and vertical
movement of the mechanical arms.
Results and Discussions
The hardware platform of this scheme includes PC (Inter(R) Core(TM) i3-2500 CPU @3.30GHZ
and 4.00GB RAM), embedded development board (NVIDIA Jetson TX1), embedded auxiliary control
development board (2 Raspberry Pi B+ and 6 Arduino uno r3 expansion board), camera module
(KS2A01AF), etc. The software used includes Window 7 operating system, Python 2.7, OpenCV 2.4.13
and embedded Linux operating system. The images used in the experiment are collected from cameras
on the robot arms. We gather more than 200 images of the Pyralidae insects for experiments in the same
conditions, and a few images of detection are shown in Table 4. The robot can perform a well-designed
motion, capture clear images, and correctly identify the Pyralidae insects in the images.
Experiments and Analysis
After the probability images are obtained, the contour extraction, matching, screening and
recognition are performed. The triangles mark is used for recognition to characterize the Pyralidae
insects shape. The recognition results are shown in Table 4.
Table 4. The recognition results and the robot arm action.

As can be seen from Table 4, our proposed scheme can identify the object when the images contain
Pyralidae insects. The number illustrated on the pictures indicates the similarity value (e.g., 0.86). When
we use the triangle for identification, better results are achieved. According to different recognition
results, the speed of the robot arms can be adjusted adaptively. The processing time is about one second
on each image.
In order to verify the advantages of the proposed scheme in the identification of Pyralidae insects,
we compare with the three existing methods, namely, Support Vector Machine (SVM) method [12], the
multi-structural element-based crop pest identification method proposed in [28] and the general
histogram reverse mapping method. The experimental results based on SVM are shown in Table 5.
Table 5. Recognition results and time costs are based on the SVM method.
The results of correct
identification are based
on the SVM method.
Time cost (/s) 3.10, 2.10, 1.85, 3.20, 3.12, 3.20, 2.80, 3.10, 2.80, 3.10, 2.87, 3.21

The results of incorrect
identification are based
on the SVM method.
Time cost (/s) 3.22, 2.95, 2.99, 3.01, 3.24, 1.96, 2.75
From the experimental results, the recognition accuracy of the model trained by SVM method is about
65%, which is lower than the accuracy of the method proposed in this paper. Moreover, the accuracy of
hyperplane obtained by training is about 0.5, which leads to the unstable recognition. The average time
cost of the SVM method spent on an image is about 2.87s.
The experimental results are shown in Table 6. The recognition scheme of Pyralidae insects
proposed in this paper has higher recognition accuracy and lower false alarm rate. Besides, it is not
necessary to carry out a large amount of data analysis, which ensures that the average time-consuming
is not significantly increased. In Table 6, the recognition accuracy and the false positive value are
calculated as follows:
1( 0 1)
n
ij
i
ij ij
r
= r or rn
=
= =
(10)
,
1, 1( 0 1)
n m
ij
i j
ij ij
x r
r or rx
= =
−
= = =
(11)
In (10) and (11), represents the recognition rate and represents the false positive rate.i j
r is
the j-th contour of the i-th Pyralidae insects( If exist, then 1, else 0). n represents the number of real
Pyralidae insectss in the image, x represents the total number of contours marked by the algorithm, and
m represents the total number of contours marked by the algorithm for the i-th Pyralidae insects in the
image. Thus, the recognition accuracy reflects the ability of the algorithm to identify Pyralidae insects.
The false alarm rate reflects the proportion of the error contours in all marked contours. Especially, the
sum of these two probabilities is not necessarily equal to 1.
Our scheme and other three existing algorithms are used to test more than 200 images containing
the Pyralidae insects, respectively. Then, we conducted a statistical analysis for the average time
consumption, the recognition accuracy, the false alarm rate. The results of the statistics are shown in
Table 6.
Table 6. Comparison results of different schemes.
Methods Recognition
accuracy rate (%)
False alarm
rate (%)
Average time-
consuming (/s)
The proposed method 94.3 6.5 1.12
Color histogram backprojection [29] 65.2 60.8 1.01
Multi-structural element method [28] 78.8 16.9 1.10
SVM method [12] 65 49.3 2.87

Discussions
Currently, recognition method based on deep learning has a rapid development. Unfortunately, the
capture and establishment of pest images of borers are very difficult. The available images are far less
than the requirement for training a deep learning network model. In addition, the robot can adaptively
adjust the sampling frequency to detect with our proposed scheme.
Future Work
Firstly, the average processing time of each frame is slightly longer than 1 second, which will lead
to a lag in the response of the robot to the observation results. In the future work, we will optimize the
algorithm and improve the processing capacity of hardware to reduce the time overhead of video frame
processing. Secondly, in the natural farm scene, due to the non-uniformity of the illumination, the local
color of the images can be too bright or too dark, and it is difficult to determine a relatively stable
threshold range, which affects the identification accuracy of pests and diseases. Therefore, the detection
of pests and diseases under non-uniform illumination needs further study.
Conclusions
Pyralidae pests have great harmful impacts on the quality and productivity of crops. In order to
achieve the accurate detection and identification of Pyralidae pests, we designed an intelligent robot
on an autonomous vehicle to acquire images in practical farm scene, and we also presented a Pyralidae
pests’ recognition algorithm to be used in the robot. Specifically, by employing the color and shape
characteristics of Pyralidae pests, we proposed a segmentation algorithm by inverse histogram mapping
and constrained Otsu to segment pests. Then, we designed a recognition approach based on Hu invariant
moment. Finally, compared with existing methods, the accuracy of our recognition scheme can reach
to nearly 94.3% with acceptable time complexity. Another advantage of our proposed scheme is that it
does not require large number of images of Pyralidae pests to be collected.
Acknowledgements
This research was supported by Key R & D Project of Hainan Province, China (Grant No.
ZDYF2018015), Hainan Province Natural Science Foundation, China (Grant No. 617033) and Oriented
Project of State Key Laboratory of Marine Resource Utilization in South China Sea, China (Grant No.
DX2017012).
References
Wei, T.; Zhu, W.; Pang, M.; Liu, Y.; Wang, Z.; Dong, J. (2013). Influence of the damage of cotton bollworm and corn
borer to ear rot in corn. Journal of Maize Sciences. vol. 21, no. 4, pp. 116-118.
Wen, C.; Guyer, D. (2012). Image-based orchard insect automated identification and classification method. Computers
and Electronics in Agriculture. vol. 89, pp. 110-115.
Xia, C.; Lee, J. M.; Li, Y.; Chung, B. K.; Chon, T. S. (2012). In situ detection of small-size insect pests sampled on traps
using multifractal analysis. Optical Engineering. vol. 51, no. 2, pp. 027001-1-027001-12.
Dai, S.; Man, H. (2017). A convolutional Riemannian texture model with differential entropic active contours for
unsupervised pest detection. in Proceedings of the 2017 IEEE International Conference on Acoustics, Speech and
Signal Processing (ICASSP). pp. 1028-1032, New Orleans, LA, USA, March.
Xia, C.; Chon, T. S.; Ren, Z.; Lee, J. M. (2015). Automatic identification and counting of small size pests in greenhouse
conditions with low computational cost. Ecological Informatics. vol. 29, no. 9, pp. 139-146.

Hu, Y.; Song, L.; Zhang, J.; Xie, C.; Li, R. (2014). Pest image recognition of multi-feature fusion based on sparse
representation. Pattern Recognition and Artificial Intelligence. vol. 27, no. 11, pp. 985-992.
Ali, H.; Lali, M. I.; Nawaz, M. Z.; Sharif, M.; Saleem, B. A. (2017). Symptom based automated detection of citrus
diseases using color histogram and textural descriptors. Computers and Electronics in Agriculture. vol. 138, pp. 92-
104.
Lu, J.; Ehsani, R.; Shi, Y.; Abdulridha, J.; Castro, A. I.; Xu, Y. (2017). Field detection of anthracnose crown rot in
strawberry using spectroscopy technology. Computers and Electronics in Agriculture. vol. 13, pp. 289-299.
Xie, C.; Yang, C.; He, Y. (2017). Hyperspectral imaging for classification of healthy and gray mold diseased tomato
leaves with different infection severities. Computers and Electronics in Agriculture. vol. 135, pp. 154-162.
Qing, Y.; Chen, G.; Zheng, W.; Zhang, C.; Yang, B.; Jian, T. (2017). Automated detection and identification of white-
backed planthoppers in paddy fields using image processing. Journal of Integrative Agriculture. vol. 16, no. 7, pp.
1547-1557.
Liu, T.; Chen, W.; Wu, W.; Sun, C.; Guo, W.; Zhu, X. (2016). Detection of aphids in wheat fields using a computer vision
technique. Biosystems Engineering. vol. 141, pp. 82-93.
Ebrahimi, M. A.; Khoshtaghaza, M. H.; Minaei, S.; Jamshidi, B. (2017). Vision-based pest detection based on SVM
classification method. Computers and Electronics in Agriculture. vol. 137, pp. 52-58.
Javed, M. H.; Noor, M. H.; Khan, B. Y.; Noor, N.; Arshad, T. (2017). K-means based automatic pests detection and
classification for pesticides spraying. International Journal of Advanced Computer Science and Applications. vol. 8,
no.11, pp. 236-240.
Zhao, Y.; Hu, Z.; Bai, Y.; Cao, F. (2015). An accurate segmentation approach for disease and pest based on DRLSE
guided by texture difference. Transactions of the Chinese Society for Agriculture Machinery. vol. 46, no. 2, pp. 14-
19.
Zhao Y.; Hu, Z. (2015). Segmentation of fruit with diseases in natural scenes based on logarithmic similarity constraint
Otsu. Transactions of the Chinese Society for Agriculture Machinery. vol. 46, no. 11, pp. 9-15.
Krizhevsky, A.; Sutskever, I.; Hinton, G. (2012). ImageNet classification with deep convolutional neural networks. in
Proceedings of the 25th International Conference on Neural Information Processing Systems (NIPS). pp. 1097-1105,
Lake Tahoe, Nevada, December.
Simonyan, K.; Zisserman, A. (2015). Very deep convolutional networks for large-scale image recognition. in Proceedings
of the International Conference on Learning Representations (ICLR). San Diego, CA, USA, May.
He, K.; Zhang, X.; Ren, S.; Sun, J. (2016). Deep residual learning for image recognition. in Proceedings of the 2016
IEEE conference on computer vision and pattern recognition (CVPR). pp. 770-778, Las Vegas, NV, USA, June.
Mohanty, S. P.; Hughes, D. P.; Salathé, M. (2016). Using deep learning for image-based plant disease detection. Frontiers
in Plant Science. vol. 7, pp. 1419.
Yang, S.; Yang, X.; Mo, J. (2017). The application of unmanned aircraft systems to plant protection in China. Precision
Agriculture, vol. 19, no. 21, pp. 1-15.
Kamilaris, A.; Prenafeta-Boldú, F. X. (2018). Deep learning in agriculture: a survey. Computers and Electronics in
Agriculture. vol. 147, no. 1, pp. 70-90.
Barbedo, J. G. A. (2014). Using digital image processing for counting whiteflies on soybean leaves. Journal of Asia-
Pacific Entomology. vol. 17, no. 4, pp. 685-694.
Chung, B. K.; Xia, C.; Song, Y. H.; Lee, J. M.; Li, Y.; Kim, H.; Chon, T. S. (2014). Sampling of bemisia tabaci adults
using a pre-programmed autonomous pest control robot. Journal of Asia-Pacific Entomology. vol. 17, no. 4, pp. 737-
743.
Swain, M. J.; Ballard, D. H. Color indexing. (1991). International Journal of Computer Vision. vol. 7, no. 1, pp. 11-32.

Otsu, N. (1979). A threshold selection method from gray-level histogram. IEEE Transactions on Systems Man &
Cybernetics. vol. 9, no. 1, pp. 62-66.
Xu, X.; Song, E.; Jin, L. (2009). Characteristic analysis of threshold based on Otsu criterion. Acta Electronica Sinica.
vol. 37, no. 12, pp. 2716-2719.
Doyle, W. (1962). Operations useful for similarity-invariant pattern recognition. Journal of the ACM. vol. 9, no. 2, pp.
259-267.
Liu, J.; Geng, G.; Ren, Z. (2009). Plant pest recognition system based on multi-structure element morphology. Computer
Engineering and Design. vol. 30, no. 6, pp. 1488-1490.
Xu, S.; Lin, W.; Wu, W.; Zhao, H. (2015). Nutrient deficiency image diagnose of rapeseed based on color feature. Chinese
Journal of Oil Crop Sciences. vol. 37, no. 4, pp. 576 – 582.
Liu, B.; Wang, L.; Liu, M.; Xu, C. (2019). Lifelong federated reinforcement learning: a learning architecture for
navigation in cloud robotic systems. arXiv:1901.06455.
Liu, B.; Cheng, J.; Cai, K.; Shi, P; Tang, X. (2017). Singular Point Probability Improve LSTM Network Performance for
Long-term Traffic Flow Prediction. National Conference of Theoretical Computer Science, pp.328-340.