recommendations of the expert panel to define removal rates … · william keeling, neely law and...
TRANSCRIPT

Recommendations of the Expert Panel to Define Removal Rates
for Urban Nutrient Management
CBP APPROVED FINAL REPORT
Marc Aveni, Karl Berger, Jonathan Champion, Gary Felton, Mike Goatley, William Keeling, Neely Law and Stuart Schwartz
Approved by Urban Stormwater Work Group: 2/9/2013 Approved by Watershed Technical Work Group: 3/4/2013
Approved by Water Quality Goal Implementation Team: 3/11/2013
Prepared by:
Tom Schueler and Cecilia Lane Chesapeake Stormwater Network

Urban Nutrient Management Expert Panel: Approved Final Report
2
Table of Contents Page Executive Summary 4 Section 1 Charge and Membership of the Panel 6 Section 2 Definitions and Qualifying Conditions 8 Section 3 Turf and Fertilization Behavior in Chesapeake Bay 12
Estimating urban pervious land and turf cover in the Bay watershed 12 Status of state phosphorus fertilizer legislation 14 Trends in non-farm fertilizer sales in the Bay watershed 15 Derivation of the original CBP-approved rate for UNM 18 How CBWM simulates nutrient loads from pervious areas 18
Section 4 Review of the Available Science 21 Review of phosphorus dynamics on urban lawns 21 Review of nitrogen dynamics on urban lawns 22 High risk factors for nutrient export 25 Scientific justification for core UNM practices 28 Regional studies on effect of P fertilizer restrictions 33 Summary of homeowner fertilizer behaviors 34 Effect of outreach in changing fertilizer behavior 35
Section 5 The Recommended Credits and Rates 39
State-wide P reduction credit for urban pervious land 39 State-wide N reduction credit for urban pervious land 41 N and P reduction credits for UNM practices 42 N Credit for state-wide N Fertilizer regulations 44 No credit for passive outreach 44
Section 6 Accountability Mechanisms 45
Verification for state-wide reduction credits 45 Verification for UNM practices 46 Verification for N fertilizer regulations 48 Reducing the potential for double counting 48
Section 7 Future Research and Management Needs 49
Justification of the recommendations 49 UNM capacity, communication and delivery issues 50 Proposed CBWM refinements 51 Priority research recommendations to fill management gaps 51

Urban Nutrient Management Expert Panel: Approved Final Report
3
References Cited 53 Appendix A Mass Balance Check on UNM Rates Appendix B Nutrient Management on Public Lands: A Review Appendix C Sample Urban Nutrient Management Plan Appendix D Consolidated Meeting Minutes of the Panel Appendix E Conformity with BMP Review Protocol 61
List of common acronyms used throughout the text: BMP Best Management Practice CAST Chesapeake Assessment Scenario Tool CBP Chesapeake Bay Program CBWM Chesapeake Bay Watershed Model DIY Do it Yourself GIS Geographic Information Systems HOA Homeowner Association MS4 Municipal Separate Storm Sewer System Rv Runoff Coefficient RT VM Reporting, Tracking, Verification and Monitoring Sf Square feet SRP Soluble Reactive Phosphorus TMDL Total Maximum Daily Load TN or N Total Nitrogen TP or P Total Phosphorus TSS Total Suspended Solids UNM Urban Nutrient Management WIN Water Insoluble Nitrogen WIP Watershed Implementation Plan WQGIT Water Quality Goal Implementation Team WTM Watershed Treatment Model

Urban Nutrient Management Expert Panel: Approved Final Report
4
Summary of Panel Recommendations More than 3.5 million acres of urban pervious lands exist in the Bay watershed, comprising nearly 10% of its total area. This diverse category of land cover includes both fertilized and un-fertilized turf and is managed in many different ways. Bay states have collectively targeted more than 45% of the pervious land for the application of urban nutrient management (UNM) practices to help achieve load nutrient reductions to meet the Bay TMDL by 2025. The Panel discarded the existing CBP-approved definition of UNM as being too ambiguous and also concluded that the corresponding removal rates for UNM were not technically justified. The Panel then reviewed more than 200 research studies and reports to understand turf grass N and P dynamics, homeowner fertilization behaviors, the effects of P fertilizer restrictions in watersheds outside of the Bay and the effect of various outreach campaigns to change those behaviors. The Panel also examined historic and recent trends in fertilizer sales across the watershed and confirmed the general adequacy of the technical assumptions for fertilizer inputs to pervious lands in the CBWM. The literature review supported the contention that most turf grass is highly retentive of applied N, but may still export some particulate organic N regardless of whether a lawn is fertilized or not. The Panel identified 11 site-based factors associated with a high risk of N and P export, such as soils, slope, terrain, age and lawn care practice. These site-based factors led the Panel to define ten core lawn care practices that minimize the risk of N and P export, which collectively define the UNM practice. Based on the science and best professional judgment, the Panel recommends three types of nutrient reduction credits. The first is an automatic state-wide P reduction credit starting in 2013 that reflects declines in P fertilizer application rates due to recent state phosphorus fertilizer legislation and the gradual industry phase out of P in fertilizer products. The exact reduction varies by state, but is about 25% for states that have adopted legislation and 20% for those that have not. The automatic credit expires in three years, and will be replaced by a more verifiable and variable credit based on declines in unit area P application rates derived from improved non-farm fertilizer sales statistics. States may also be eligible for a state-wide N reduction credit in 2014 if they can document declines in unit N fertilizer applications relative to the current application rate benchmark employed in the CBWM. States that implement N fertilizer regulations that satisfy certain verification requirements may also qualify for an automatic N credit. The second credit is a removal rate for the acreage of pervious land covered by qualifying UNM practices, based on the site risk for N and P export. For low risk lawns, the UNM load reductions for TN and TP are 3 and 6% respectively. The load reductions increase when UNM practices are applied to high risk lawns (20% TN, 10% TP).

Urban Nutrient Management Expert Panel: Approved Final Report
5
Summary of Urban Fertilizer Management Credits for Phosphorus and Nitrogen
Nutrient Statewide with P fertilizer legislation
Statewide without P fertilizer legislation
Urban Nutrient Management UNM 2
Phosphorus
25%
20%
Low risk: 3% High risk: 10% Blended: 4.5%
Notes & Conditions of Credit
Effective 2013 for 3 years. In 2016 , need to show reduction in P using two years of fertilizer sales data
Need to survey high-risk every 5 years; Renew UNM every 3 years
Nitrogen
For States with N fertilizer legislation: 9% reduction for qualifying acres by commercial applicators, 4.5% reduction for do-it-yourselfer acres For all other States: 3% load reduction for every 10% decrease in N urban fertilizer input from CBWM benchmark
Low risk: 6% High risk: 20%
Blended: 9%
Notes & Conditions of Credit
Effective 2014, need to show N reduction using two consecutive years sales data
Need to survey high-risk every 5 years; Renew UNM every 3 years
The Panel developed methods for reporting, tracking and verifying the credits to ensure the UNM practices achieve their intended pollutant reduction. The Panel acknowledged that there are still many unknowns when it comes to the UNM practice, and adopted an adaptive management approach as it developed its recommendations. The Panel also recommended improvements to the CBWM model and priority research projects that could improve confidence in its representation of UNM. Lastly, the Panel recommended several ways to improve Bay-wide communication of the UNM message, and improve the capacity to deliver UNM practices to meet the future demand for this practice.

Urban Nutrient Management Expert Panel: Approved Final Report
6
Section 1 Charge and Membership of the Panel
Urban Nutrient Management Expert Panel
Panelist Affiliation Jonathan Champion District Department of the Environment
Karl Berger Metropolitan Washington Council of Governments Dr. Stu Schwartz University of Maryland, Baltimore County
William Keeling Virginia Department of Conservation and Recreation
Dr. Gary Felton University of Maryland, College Park Dr. Neely Law Center for Watershed Protection Marc Aveni Prince William County Department of Public Works
Dr. Mike Goatley Virginia Tech Tom Schueler Chesapeake Stormwater Network (panel facilitator) Technical support by Jeremy Hanson (CRC), Molly Harrington (CRC), Gary Shenk (EPA CBPO, Guido Yacto (EPA CBPO) Jeff Sweeney (EPA CBPO), Matt Johnston (CBPO) and Mark Sievers (TetraTech) is gratefully appreciated
The initial charge of the Panel was to review all of the available science on the nutrient removal rates associated with four kinds of nutrient management practices applied to urban pervious areas. 1. Automatic credit for State-wide phosphorus fertilizer legislation 2. Possible credit for jurisdictions without phosphorus fertilizer legislation that reflect
industry phase out of P in fertilizer products 3. Proper fertilizer application on privately and publicly owned turf (i.e., Urban
Nutrient Management) 4. Local outreach campaigns to reduce fertilization frequency on privately-owned turf
The Panel was specifically requested to assess:
Current CBWM 5.3.2 land use data for urban pervious areas and recommend the most probable splits for turf management status (i.e., fertilized, un-fertilized, and over-fertilized), based on homeowner surveys, sales data, land cover and other metrics.
Available literature on the nutrient and sediment loading rates associated with fertilized, un-fertilized and over-fertilized turf, accounting for regional and terrain differences.
Current CBWM modeling assumptions to simulate the impact of reduced P applications to pervious areas as a result of adoption of state-wide phosphorus fertilizer legislation.
Specific definitions for each class of nutrient management practices and the qualifying conditions and rationale under which a jurisdiction can receive a nutrient reduction credit.

Urban Nutrient Management Expert Panel: Approved Final Report
7
Whether the existing CBP approved nutrient load reduction rates for urban nutrient management practices developed in 2003 are still reliable, recommend minimum local outreach and education program requirements needed to qualify for them, and how jurisdictions will be able to certify the acreage where the practices are implemented.
Extent of fertilizer applications on public lands, and recommend the minimum changes in local landscaping, purchasing and contracting policies in order to reduce the frequency of un-needed fertilizer applications. The Panel may also recommend procedures to evaluate better nutrient management practices on local, state and federal lands.
What, if any, nutrient credits can be provided by outreach campaigns to change homeowner behavior from lawn fertilization to non-fertilization (as well as any increase or decrease in sediment delivery). If such a credit is proposed, the Panel will need to define the metrics that communities will need to measure to certify that the change in fertilizer behavior actually takes place.
The proper units to report urban nutrient management (UNM) implementation to receive credit in the Chesapeake Bay Watershed Model
The Panel confined its efforts to managed urban turf (including golf courses) and did not address turf farms, highway medians or temporary/permanent vegetative stabilization at construction sites.
Beyond this specific charge, the Panel was asked to:
Determine whether to recommend that an interim BMP rate be established for one or more classes of urban nutrient management practices prior to the conclusion of the panel for WIP planning purposes
Recommend procedures to report, track and verify that urban nutrient management practices are actually being implemented on the ground
Critically analyze any unintended consequences associated with the nutrient management credit and any potential for double or over-counting of the credit
While conducting its review, the Panel followed the procedures and process outlined in the WQGIT BMP review protocol (WQGIT, 2010). The process begins with BMP expert panels that evaluate existing research and make initial recommendations on removal rates. These, in turn, are reviewed by the Urban Stormwater Workgroup and the Watershed Technical Workgroup to ensure they are accurate and consistent with the Chesapeake Bay Watershed Model (CBWM) framework. Appendix D documents the process by which the Panel reached consensus, in the form of a series meeting minutes that summarize their deliberations. Appendix E documents how the Panel satisfied the review criteria established in the BMP review protocol.
Urban Nutrient Management Expert Panel: Approved Final Report
8
Section 2 Definitions and Qualifying Conditions
The Panel agreed that the UNM practice has been ambiguously defined in the past in the context of the CBWM, and therefore expended a great deal of effort to come up with stronger definitions and qualifying conditions so that any reduction credits could be accurately reported, tracked and verified. With this in mind, the Panel came to consensus on the following definitions: Pervious Land: This term is used to describe urban and suburban land that is not impervious in the Chesapeake Bay Watershed Model (CBWM). This land use category predominately includes residential lawns, but may also include landscaping, gardens, parks, rights of way, vacant lots and open areas. Pervious land may also include a limited amount of forest canopy. Pervious lands are subject to different management regimes including just periodic mowing all the way up to the intensive maintenance of a golf course. In the context of the CBWM, fertilizer inputs to pervious areas are currently represented by a single weighted average for both fertilized and un-fertilized pervious areas (i.e., all pervious areas receive fertilizer input). Turf (aka lawns, turf grass, turf cover): In the context of this report, the term turf refers primarily to pervious areas that are managed to attain dense grass cover, which may involve one or more of the following: fertilization, irrigation, weed control, and other turf management practices. High Risk Export Factors: These are defined as pervious areas that are subject to one or more of the following risk factors:
1. Currently over-fertilized beyond state or extension recommendations 2. P-saturated soils as determined by a soil P test 3. Newly established turf (i.e., less than three years old) 4. Steep slopes 5. Exposed soil 6. High water table 7. Over-irrigated lawns 8. Soils that are sandy, shallow, compacted or have low water holding capacity 9. High use areas (e.g., athletic fields, golf courses) 10. Adjacent to stream, river or Bay 11. Karst terrain
More specific operational definitions of each risk factor are described in Section 4.3. Statewide Phosphorus Reduction Credit for Pervious Land: This load reduction credit is determined for each state to reflect the impact of phosphorus fertilizer legislation and/or the gradual P phase out in the market. The automatic credit is initially based on the assumed annual P fertilizer inputs for pervious land in the most recent version of the CBWM. In 2016, however, the state credit will be adjusted upward or downward, based on state-reported trends in the P content of non-farm fertilizer sales data.

Urban Nutrient Management Expert Panel: Approved Final Report
9
Statewide Nitrogen Reduction Credit for Pervious Land: This load reduction credit is determined for each state to reflect the expected decline in N fertilizer sales over time. The credit will be initially based on each state's 2014 N fertilizer inputs, relative to the current CBWM assumption of 43 lbs/ac/year for pervious land, and will only be granted if states can document a downward trend in the N content of non-farm fertilizer sales data. The magnitude of the credit will be determined by changing N fertilization inputs in the CBWM. This credit will also be subject to biennial verification. Urban Nutrient Management: is defined as identifying how the major plant nutrients (nitrogen, phosphorus, and potassium) are to be annually managed for expected turf and landscape plants and for the protection of water quality. A nutrient management plan is a written site specific plan which addresses these issues. The goal of an urban or turf and landscape nutrient management planning is to minimize adverse environmental effects, primarily upon water quality, and avoid unnecessary nutrient applications. It should be recognized that some level of nutrient loss to surface and groundwater will occur even by following the recommendations in a nutrient management plan, however, these losses should be lower than would occur without nutrient management (VCE, 2011). Table 1 outlines some of the required elements of an urban nutrient management plan in Virginia. In addition, a sample copy of UNM plan is provided in Appendix C. Core UNM Practices. The Panel concluded that the ten lawn care practices outlined in Section 4.4 and summarized in Table 2 constitute effective UNM practice in the Chesapeake Bay. These ten practices should be reinforced in the core outreach message communicated to the public, and as many practices as might apply to a site should be incorporated into a UNM plan or homeowner pledge. It is recognized that some states may modify the individual lawn care practices to meet their own unique terrain and conditions, as long as they document the nutrient reduction benefit. Phosphorus Fertilizer Legislation: Refers to the passage and implementation of state legislation to restrict the P content in lawn maintenance fertilizer and require or recommend other nutrient management practices on urban turf. As described in Section 3.2, each of the three Bay states has taken different approaches in their legislation. Some fertilizer P application may still be allowed in several Bay states, so the Panel has avoided the term P-ban in this report, except when reviewing the impact of local ordinances enacted in non-Bay states. Nitrogen Fertilization Legislation (Maryland Only). This refers to state legislation or regulations that:
(a) limits the N content and establishes minimum slow release content for DIY fertilizer products sold in retail outlets (b) sets an upper limit on the maximum amount of N fertilizer that commercial applicators can apply in any one application (0.9 lbs/acre/year) (c) prohibits application on paved surfaces, water features, or during the dormant season, and,

Urban Nutrient Management Expert Panel: Approved Final Report
10
(d) has verifiable procedures for commercial applicator training, certification, and application record-keeping, including fines for non-compliance.
Table 1 Common Components of an Urban Nutrient Management Plan in VA
1. Use tables in VA DCR (2005) and soil test information to develop plant nutrient
recommendations 2. Calculate phosphorus application rates based on soil test. 3. Know when phosphorus applications are not allowed based on soil test phosphorus saturation
level. 4. Understand specific nitrogen management criteria when dealing with environmentally sensitive
sites as related to various nitrogen sources and plants 5. Develop a schedule for the timing and placement of fertilizers 6. Develop an integrated nutrient balance sheet for all nutrient sources, application rates and
timings 7. Understand issues to address in a plan narrative 8. Determine hydrologic unit code from Virginia National Watershed Boundary Dataset maps 9. Generate appropriate maps to: a. show site and boundaries where nutrients will be applied, b.
delineate management areas and indicate size in acres or square feet, environmentally sensitive areas, c. setback areas for application of organic materials.
10. Identify character of disturbed, imported or manufactured soils and determine appropriate nutrient management related management considerations
11. Determine how to define management areas as a function of use or vegetation type and how that impacts nutrient application
12. Determine available nutrient application rates from a wastewater nutrient analysis and the amount of water applied (in the case of wastewater reuse)
13. Determine acceptable periods of nitrogen application for various turf grass types based on location in Virginia and characteristics of the fertilizer to be applied
14. Selection and management of de-icing materials to reduce water quality impact 15. Employ stormwater management principles to reduce runoff pollution
Source: Adapted from VA DCR (2005)
Table 2 Core Urban Nutrient Management Practices for the Chesapeake Bay 1 Consult with the local extension service, master gardener or certified applicator to get
technical assistance to develop an effective urban nutrient management plan for the property.
2 Maintain a dense vegetative cover of turf grass to reduce runoff, prevent erosion, and retain nutrients
3 Choose not to fertilize, OR adopt a reduce rate/monitor approach OR the small fertilizer dose approach.
4 Retain clippings and mulched leaves on the yard and keep them out of streets and storm drains
5 Do not apply fertilizers before spring green up or after grass becomes dormant
6 Maximize use of slow release N fertilizer during the active growing season
7 Set mower height at 3 inches or taller
8 Immediately sweep off any fertilizer that lands on a paved surface
9 Do not apply fertilizer within 15 to 20 feet of a water feature (depending on applicable state regulations) and manage this zone as a perennial planting, meadow, grass buffer or a forested buffer
10 Employ lawn practices to increase soil porosity and infiltration capability, especially along portions of the lawn that convey or treat stormwater runoff.
Urban Nutrient Management Expert Panel: Approved Final Report
11
Maryland's lawn fertilizer legislation is currently the only Bay state that meets criteria (a) - (d), as outlined in MDA (2013). As a result, the acreage of pervious land serviced by commercial applicators that meet the core UNM practices is eligible for a nitrogen credit, as long they can be verified as conforming with the new regulations. Maryland may also receive a smaller nitrogen credit for the acreage of home lawns managed by do-it-yourselfers, that are directly influenced by its new retail sales and labeling requirements under the new regulations. The method used to define the N credit is explained in Section 5.4. The state-wide N fertilizer regulation credit is subject to the training, certification, record keeping and verification procedures outlined in Section 6.3. UNM Planning Agency: This refers to the specific agency in a community that has authority and/or qualifications to assess a property and prepare a verifiable UNM plan. In most states, the UNM planning agency may be the State Cooperative Extension Service, Soil and Water Conservation District, State Agency, or a Local Agency. In some cases, support may be provided by Master Gardeners, a watershed stewards academy, local watershed groups or landscape contractors associations. Each Bay state may specifically define which agency(s) are responsible for UNM plans in their state (e.g., Virginia). Qualifying Urban Nutrient Management Plan. The basic reporting unit for the practice is the acreage of written UNM plans or applicator certifications that contain the applicable lawn care practices specified in Table 2, and are subject to verification. Homeowner UNM Pledge: This is a shorter version of a UNM plan in which an individual homeowner submits a written pledge to implement the applicable UNM practices on their lawn, after an on-site visit from a trained professional to assess risk factors and test soils. The nutrient reduction credit for homeowner pledges is less than for lawns that have a qualified UNM plan, and is limited to no more than the low risk UNM credit for both TN and TP. Each Bay state will choose whether homeowner pledges are an allowable UNM delivery option within their jurisdiction. Trained UNM Expert: An individual with the requisite training and experience to prepare UNM plans in their jurisdiction. Several Bay states have established voluntary or mandatory training programs to certify UNM experts. Active Outreach Program. This retail outreach effort is designed to directly interact with individual fertilizer applicators to adopt the core UNM practices, along with other Bay friendly landscaping practices. The outreach effort may be targeted to properties with known high risk factors or be applied across the community such that higher credits are granted for outreach that focuses on high risk turf grass. The product of this strategy is a verifiable UNM plan or pledge whereby an individual homeowner, lawn care company, HOA, business, institutional or public landowner commits to the applicable lawn care practices that apply to their turf.
Urban Nutrient Management Expert Panel: Approved Final Report
12
Section 3 Background on Turf and Fertilization in the Chesapeake Bay
3.1 Estimating Urban Pervious Area and Turf Cover in the Bay Watershed
Until recently, the extent of turf cover associated with urban, suburban and exurban land development in the watershed has been poorly understood. The acreage of turf cover has steadily increased in the Bay watershed over the last four decades as farms and forests have been converted into new development (Schueler, 2010). With new development, small parcels of turf cover are interspersed within a broader mosaic of land use that make it a challenge to characterize (Claggett et al, 2011). Turf cover may also be hidden by tree canopy or confused with pasture in exurban areas. As a result, turf cover within highway rights of way, parks, golf courses, airports, residential lots, cemeteries, schools, churches, hobby farms and institutions may not always be well represented in urban land cover classifications. Consequently, turf cover has been hard to detect directly from satellite imagery, aerial photography or GIS analysis. Recent work by Claggett et al (2011) and Schueler (2010), however, have developed updated estimates of the extent of pervious lands in the Chesapeake Bay using multiple methods. The studies independently calculated that pervious land covers about 3.8 million acres in the Bay watershed, or just less than 10% of the total watershed area. To put this in perspective, turf cover is now equivalent to the area devoted to row crops (corn, soybeans, wheat) in the Bay watershed. The estimated acreage of turf cover in each Bay state is provided in Table 3, and the general distribution of turf cover is portrayed in Figure 1. Based on these new methods, the acreage of pervious land simulated in the CBWM has increased by more than a million acres from Version 4 to Version 5.3.2. The extent of turf cover predicted by the methods of Claggett et al (2011) for the CBWM showed reasonable agreement with higher resolution estimates of turf cover for Baltimore County, MD, and further testing is now occurring in other Bay counties (Claggett, 2012).

Urban Nutrient Management Expert Panel: Approved Final Report
13
Figure 1: Distribution of Turf Cover in the Chesapeake Watershed (Schueler, 2010).
Table 3 Estimated Distribution of Urban Pervious Land in the CBWM 5.3.2, By Bay State
State
Urban Pervious Area 1 Acres
Delaware 36,481 District of Columbia 17,206 Maryland 990,291 New York 170,716 Pennsylvania 1,052,558 Virginia 1,195,567 West Virginia 88,218 TOTAL 3,551,037 1 Acres of Urban Pervious Area in Version 5.3.2 of Chesapeake Bay Watershed Model
About 60 to 80% of pervious land area is associated with residential lawns, depending on the state and reporting era. A summary of these studies can be found in Table 4. More detail on what is known about current homeowner practices on turf can be found in Section 4.6.

Urban Nutrient Management Expert Panel: Approved Final Report
14
Approximately 10 to 15% of pervious land is managed by commercial or institutional land uses. In most cases, they utilize landscape contractors or their own maintenance crews to manage them. The Panel could find very little information on the current UNM practices for this category of pervious land. About 15% to 20% of pervious land is managed by public agencies, in the form of road right of ways, municipal open space, schools and parks. A more detailed discussion of current UNM practices and policies for public turf can be found in Appendix B.
Table 4 Distribution of Turf Grass by Sector in Maryland, Virginia and New York 1
Turf Sector MD 2005 VA 2004 NY 2004 Home lawns 82.6% 61.6% 82.1% Apartments 0.6 Nd 0.8 Roadside right of way 4.3 17.5 Nd Municipal Open Space 3.5 6.0 Nd Parks 1.9 2.5 1.9 Commercial Nd 5.0 0.3 Schools 3.4 2.9 1.6 Golf Course 1.4 2.2 3.0 Churches/ Cemeteries 1.2 1.4 1.1 Airports/Sod farms) 1.1 0.9 0.6 1 As reported in MDASS (2006), VADACS (2006) and NYASS (2004) nd = no data as the indicated turf sector was not sampled or estimated
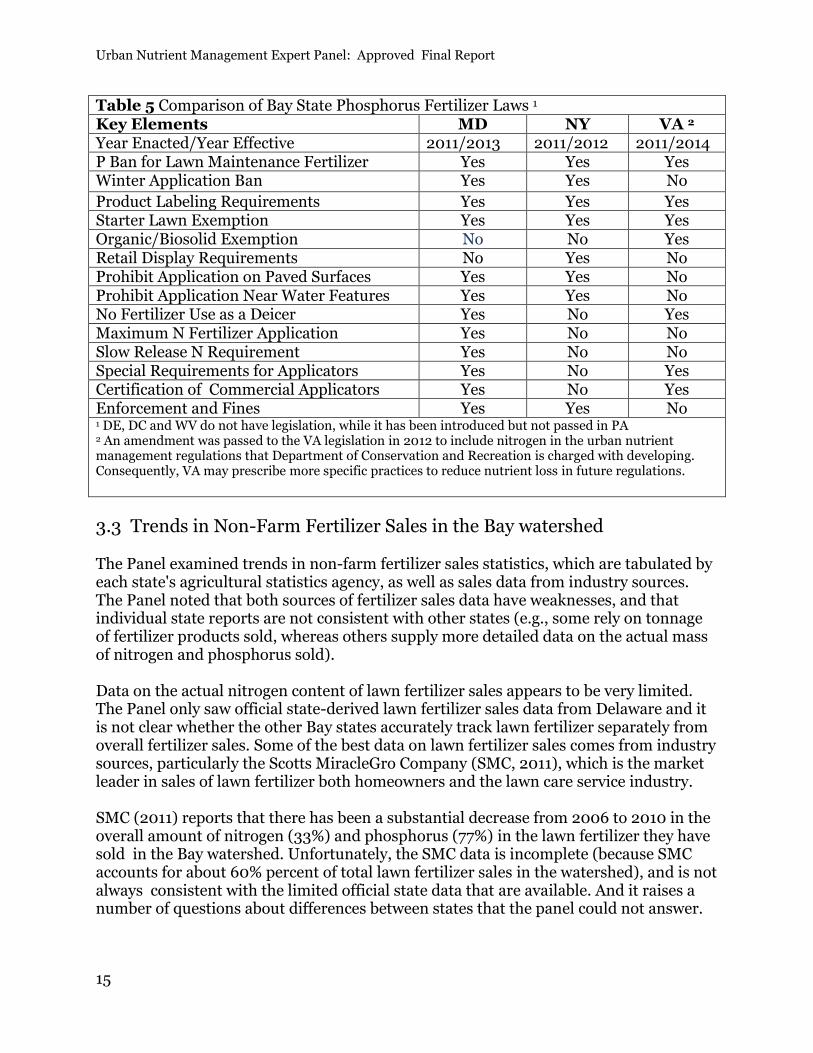
3.2 Status of State Phosphorus Fertilizer Legislation Three states in the watershed have enacted phosphorus fertilizer legislation as of 2011 (MD, NY, and VA). Pennsylvania is currently considering legislation, but it has not yet been passed. A common feature in all three states is elimination of phosphorus in lawn maintenance fertilizer products. There are many other elements to each state law, and these are compared in Table 5. Some include a ban on winter fertilization applications, expanded product labeling requirements, and prohibitions on applying fertilizer to impervious surfaces or near water features. Some states also establish a certification process for commercial applicators. Maryland has specific requirements on the maximum individual application of N fertilizer, and a minimum requirement for slow release N formulations. The Panel noted that one of the limitations of the new laws is that they did not allocate funds for expanded education and outreach to make their residents aware of the various nutrient management provisions of their respective laws.
Urban Nutrient Management Expert Panel: Approved Final Report
15
Table 5 Comparison of Bay State Phosphorus Fertilizer Laws 1 Key Elements MD NY VA 2 Year Enacted/Year Effective 2011/2013 2011/2012 2011/2014 P Ban for Lawn Maintenance Fertilizer Yes Yes Yes Winter Application Ban Yes Yes No
Product Labeling Requirements Yes Yes Yes Starter Lawn Exemption Yes Yes Yes Organic/Biosolid Exemption No No Yes Retail Display Requirements No Yes No Prohibit Application on Paved Surfaces Yes Yes No Prohibit Application Near Water Features Yes Yes No No Fertilizer Use as a Deicer Yes No Yes Maximum N Fertilizer Application Yes No No Slow Release N Requirement Yes No No Special Requirements for Applicators Yes No Yes Certification of Commercial Applicators Yes No Yes Enforcement and Fines Yes Yes No 1 DE, DC and WV do not have legislation, while it has been introduced but not passed in PA 2 An amendment was passed to the VA legislation in 2012 to include nitrogen in the urban nutrient management regulations that Department of Conservation and Recreation is charged with developing. Consequently, VA may prescribe more specific practices to reduce nutrient loss in future regulations.
3.3 Trends in Non-Farm Fertilizer Sales in the Bay watershed The Panel examined trends in non-farm fertilizer sales statistics, which are tabulated by each state's agricultural statistics agency, as well as sales data from industry sources. The Panel noted that both sources of fertilizer sales data have weaknesses, and that individual state reports are not consistent with other states (e.g., some rely on tonnage of fertilizer products sold, whereas others supply more detailed data on the actual mass of nitrogen and phosphorus sold). Data on the actual nitrogen content of lawn fertilizer sales appears to be very limited. The Panel only saw official state-derived lawn fertilizer sales data from Delaware and it is not clear whether the other Bay states accurately track lawn fertilizer separately from overall fertilizer sales. Some of the best data on lawn fertilizer sales comes from industry sources, particularly the Scotts MiracleGro Company (SMC, 2011), which is the market leader in sales of lawn fertilizer both homeowners and the lawn care service industry. SMC (2011) reports that there has been a substantial decrease from 2006 to 2010 in the overall amount of nitrogen (33%) and phosphorus (77%) in the lawn fertilizer they have sold in the Bay watershed. Unfortunately, the SMC data is incomplete (because SMC accounts for about 60% percent of total lawn fertilizer sales in the watershed), and is not always consistent with the limited official state data that are available. And it raises a number of questions about differences between states that the panel could not answer.

Urban Nutrient Management Expert Panel: Approved Final Report
16
With these caveats in mind, the Panel looked at the long term trends in non-farm fertilizer data, with a focus on Maryland. Non-farm fertilizer use increased from about 60,000 tons per year in 1990 to about 200,000 tons in 2004 (MDA, 2005). Since then, non-farm fertilizer sales appear to have stabilized, with some recent industry evidence that they have been dropping in the last few years (SMC. 2010). Felton (2007) developed estimates of the non-farm tonnage of nitrogen sold in Maryland from 1994 to 2004 (see Figure 2). The analysis shows a steady rise through 2000, followed by a drop to mid 1990's levels in the last two reporting years. Insufficient data were available to track long term trends in phosphorus non-farm fertilizer sales.
Figure 2 Trends in Farm and Non-Farm N Fertilizer Sales in MD from 1994-2004 (source: Felton 2007). The industry data also suggests that there has been substantial reduction in the P content of the lawn fertilizer being sold in the Bay watershed states due to SMC's initiative to phase out P in fertilizer products and in anticipation of the implementation of recent state phosphorus fertilizer legislation (Table 6). This trend is supported by the official state data from Delaware (Table 7), which indicates that in the state as a whole the amount of phosphorus contained in non-farm fertilizer being sold decreased 86 percent from 2006 – 2010.

Urban Nutrient Management Expert Panel: Approved Final Report
17
Table 6 Industry Reported Change in P Fertilizer Sales in the Bay States,
2006 to 2010 1
State 2 2006 2010
Percent reduction Millions of
Pounds Millions of
Pounds
Pennsylvania 1.41 0.26 82 % Maryland 0.68 0.10 85 % Virginia 0.60 0.22 63 %
Delaware 0.09 0.04 55 % West Virginia 0.07 0.02 71 %
Total 2.85 0.655 77% 1 annual sales data reported by SMC (2011) for non-farm fertilizer sales by state. Scott's currently has a 60% market share, and has committed to a full phase out of P in its fertilizer products by January 1, 2013. Analysis performed by Gary Felton, 2012. 2 Note that the statistics on P sales are provided for each state as a whole, and NOT the fraction of the state located within the Bay watershed
The Scotts data also appears to indicate a decline in the sale of nitrogen in lawn fertilizer from 2006 – 2010, but this trend did not appear to be as pronounced as the trend in phosphorus.
Taken together, the industry and limited official state sales data provided sufficient justification – in the judgment of a majority of panel members – to support a preliminary credit for a reduction in P application rates in the CBWM, based either on statewide legislation or the fact that P lawn fertilizer sales are declining anyway as a result of industry practice. The Panel concluded that any state-wide nutrient reduction credit must ultimately be defined and verified using more detailed and accurate state non-farm fertilizer statistics in the future. The details of these verification protocols are described in Section 6.
Table 7. Change in Non-Farm Sales of Phosphate Fertilizer in Delaware 2006 to 2010
Million lbs of P2O5
2006 2007 2008 2009 2010 Change 0.934 1.114 0.584 0.308 0.132 - 86%
Source: Delaware Department of Agriculture, as Reported in DE Final Phase 2 Watershed Implementation Plan (May, 2012)

Urban Nutrient Management Expert Panel: Approved Final Report
18
3.4 Derivation of the original CBP-approved rate for urban nutrient management The CBP has had an approved nutrient removal rate for urban nutrient management in effect for nearly 15 years (CBP, 1998, Appendix H). The entire documentation for the rate is provided below: ... urban nutrient management leads to a reduction in urban fertilizer applied. Urban nutrient management involves public education (targeting urban/suburban residents and business) to encourage reduction of excessive fertilizer use. The CBP Nutrient Subcommittee Tributary Strategy Workgroup has estimated that urban nutrient management reduces nitrogen loads by 17% and phosphorus loads by 22% No scientific or modeling analysis could be found to support or document the nutrient reduction rates cited above. In addition, the Panel noted that the definition of the UNM was extremely ambiguous and could not be accurately measured, tracked or verified. Therefore, the Panel concluded the existing definition and associated removal rates for the existing CBP-approved UNM practice could not be technically justified. The Panel devised a more specific definition for UNM based on ten core lawn management practices that collectively reduce the risk for nutrient export, and devised a more defensible protocol to estimate the nitrogen and phosphorus reduction credits associated with its implementation.
3.5 How nutrient loads from pervious areas are simulated in the context of
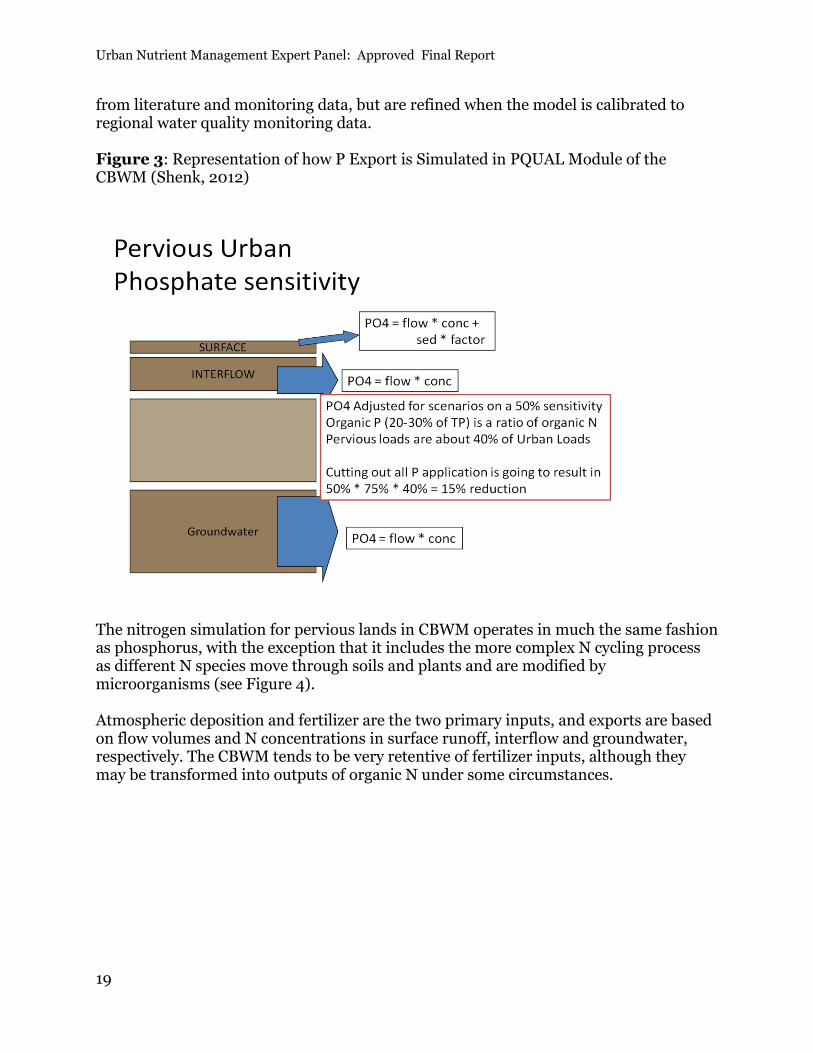
the CBWM The Chesapeake Bay Watershed Model (CBWM) simulates nutrient dynamics for a broad range of land uses and land covers throughout the watershed, including urban pervious land. Given the central role of the model in deriving TP and TN reductions associated with various levels of UNM practices, it is helpful to understand how the model currently simulates nutrient pathways, processes and export, with a specific focus on key model assumptions on the response of pervious lands to urban fertilizer inputs, and how the fertilizer inputs are derived. The CBWM uses PQUAL to simulate P dynamics within pervious lands, and AGCHEM to simulate N dynamics. The basic documentation for how the model simulates nutrient loadings and BMP reductions can be found in CBP (1998). The phosphorus simulation is fairly straight forward, and is represented in Figure 3. For each unit of pervious land, the model calculates the flow volume to surface runoff, interflow and groundwater. Atmospheric and fertilizer inputs are then applied, and the P export is defined based on the assumed concentration of phosphate and organic phosphorus for each of the three types of flows. As shown in Figure 3, the CBWM has a 50% sensitivity to P inputs, which basically means that only half of the fertilizer input is available for export (the rest is retained in the soil or by plant uptake). The P concentration factors are initially derived
Urban Nutrient Management Expert Panel: Approved Final Report
19
from literature and monitoring data, but are refined when the model is calibrated to regional water quality monitoring data. Figure 3: Representation of how P Export is Simulated in PQUAL Module of the CBWM (Shenk, 2012)
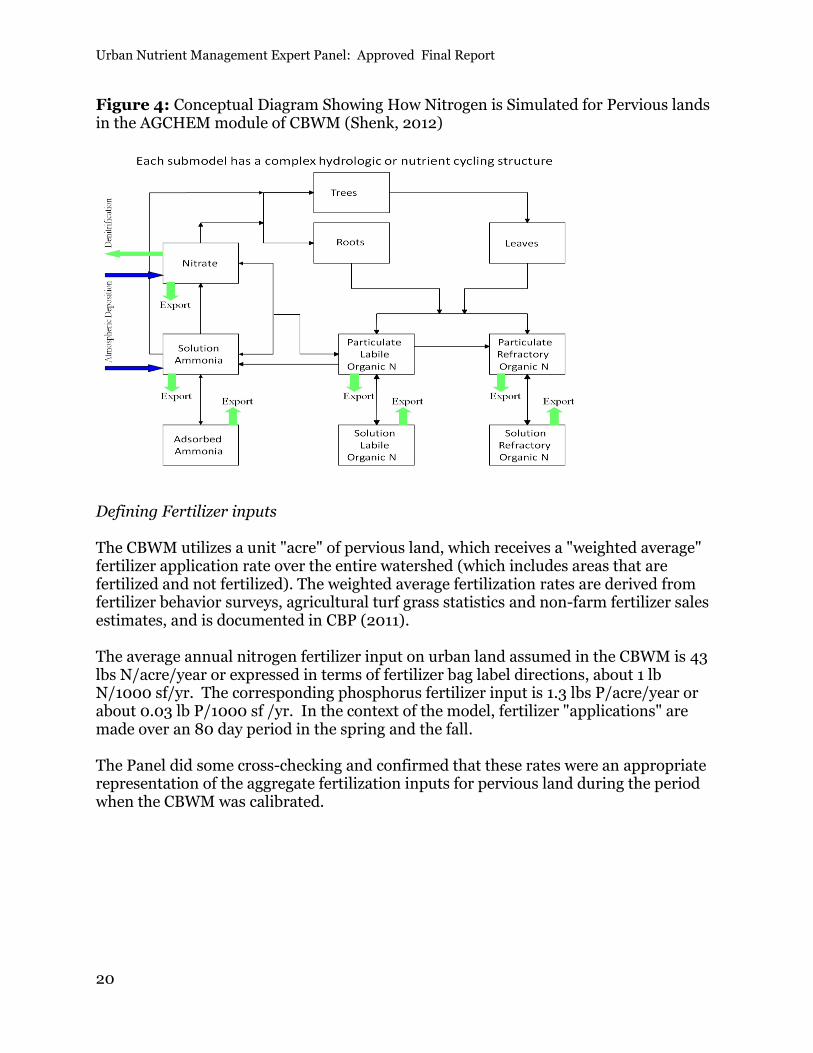
The nitrogen simulation for pervious lands in CBWM operates in much the same fashion as phosphorus, with the exception that it includes the more complex N cycling process as different N species move through soils and plants and are modified by microorganisms (see Figure 4). Atmospheric deposition and fertilizer are the two primary inputs, and exports are based on flow volumes and N concentrations in surface runoff, interflow and groundwater, respectively. The CBWM tends to be very retentive of fertilizer inputs, although they may be transformed into outputs of organic N under some circumstances.
Urban Nutrient Management Expert Panel: Approved Final Report
20
Figure 4: Conceptual Diagram Showing How Nitrogen is Simulated for Pervious lands in the AGCHEM module of CBWM (Shenk, 2012)
Defining Fertilizer inputs The CBWM utilizes a unit "acre" of pervious land, which receives a "weighted average" fertilizer application rate over the entire watershed (which includes areas that are fertilized and not fertilized). The weighted average fertilization rates are derived from fertilizer behavior surveys, agricultural turf grass statistics and non-farm fertilizer sales estimates, and is documented in CBP (2011). The average annual nitrogen fertilizer input on urban land assumed in the CBWM is 43 lbs N/acre/year or expressed in terms of fertilizer bag label directions, about 1 lb N/1000 sf/yr. The corresponding phosphorus fertilizer input is 1.3 lbs P/acre/year or about 0.03 lb P/1000 sf /yr. In the context of the model, fertilizer "applications" are made over an 80 day period in the spring and the fall. The Panel did some cross-checking and confirmed that these rates were an appropriate representation of the aggregate fertilization inputs for pervious land during the period when the CBWM was calibrated.

Urban Nutrient Management Expert Panel: Approved Final Report
21
Section 4 Review of the Available Science
In the last decade, there has been a great deal of research to better understand the nutrient dynamics of turf grass "ecosystems" and their relationship to nutrient loads and downstream water quality. The panel reviewed more than 150 papers and reports on these topics. Several important review papers included Soldat and Petrovic (2008), Felton (2007), Daniels et al (2010) and Guillard (2008). This section describes the key findings from the literature review.
4.1 Review of Phosphorus Dynamics on Urban Lawns There are four potential pathways where P can be exported from urban lawns:
1. Leaching into groundwater (usually minor) 2. Soluble P in surface runoff 3. Sediment bound P in surface runoff 4. Organic matter (i.e., leaves and grass clippings) that reach adjacent impervious
cover and are washed into the storm drain system Phosphorus leaching is generally only a concern on shallow, sandy or artificially drained soils, as most P seldom leaches more than three feet through the soil (Daniels et al, 2010). Some urban soils may be saturated with respect to P, either because they have been fertilized for many years and/or because they reflect the legacy of past farming activity. In these conditions, soluble P can leave the soil in surface runoff without sediment (e.g., Maguire and Sims, 2002 and Soldat and Petrovic, 2009). P loss can also occur when phosphorus attached to sediment and organic matter are exported by surface runoff. The potential loss is greatest when turf is dormant and particularly when soils are frozen (Bierman et al, 2010a). Turf grass clippings typically contains 2.0 to 5.0% P in dry matter tissue (Soldat and Petrovic, 2008, Guillard and Dest, 2003). Ray (1997) measured the P content of dead leaves at 1.5% of their dry weight. Soldat et al (2009) notes that P can be released by dead vegetation. Dorney (1986) reported that 9 % of total P in leaves was potentially leachable in 2 hours Various studies have evaluated P losses from fertilized lawns. Shuman (2004) noted that losses sharply increased as the P fertilizer application rate increased, but also noted that a certain amount of P loss was independent of fertilizer application. Soldat and Petrovic (2008) reviewed 12 studies and noted that P losses ranged from less than 1% to as much as 18%, depending on turf grass conditions and fertilizer timing. They found that P loss was greatest when storms occurred shortly after P fertilizer applications. P losses were also strongly related to the runoff volume generated by the lawn. Factors that increase runoff volume (e.g., steep slopes, compacted soils, frozen ground, low turf density) are all associated with a higher risk of P loss.

Urban Nutrient Management Expert Panel: Approved Final Report
22
4.2 Review of Nitrogen Dynamics on Urban Lawns There are four primary sources of nitrogen to urban lawns: mineralization of N in the soil, atmospheric deposition, degradation of organic matter (such as lawn clippings) and fertilizer inputs. While the rates of soil mineralization are very site-dependent, there are good data on atmospheric deposition rates. Measured atmospheric deposition in Baltimore was 0.23 lbs N 1000 sf/year (Groffman et al, 2011) which is generally consistent with the Bay-wide average N deposition of 0.42 lbs N 1000 sf/year which is the current average input to pervious lands in CBWM. Decomposition of lawn clippings is another important source of N to the lawn, as they rapidly become available in the soil (Raciti et al, 2011a). Frank et al (2005), Felton (2007) and Kopp and Guillard (2004) independently estimated that returning grass clippings to the lawn could provide approximately one lb of N/1000 sf/year. Estimates for average fertilizer applications are provided in Sections 3.3 and 3.5. There are four potential pathways where N can be exported from urban lawns:
1. Leaching of nitrate into groundwater 2. Loss of nitrate and ammonium in overland flow 3. Organic nitrogen (e.g., lawn clippings or N attached to eroded sediments that
runs off or is blown over to adjacent impervious cover and is washed into the storm drain system, and
4. Volatilization of ammonia into the atmosphere shortly after fertilization Nitrate Leaching Nitrate leaching can be a significant source of N export under certain lawn conditions, and is dependent on soil type, irrigation, grass species, rooting depth and fertilization rate and timing (Bowman et al 2002, and Pare et al 2006). Nitrate leaching is greatest during the seasons of the year when the grass is dormant. Cool season turf grass typically goes dormant sometime in December and resumes growth at some point in February or March, depending on the severity of the winter. Cool season turf grass may also go dormant in the summer due to extensive drought or heat. The measured N loss via leaching is related to the amount of water soluble fertilizer applied. Table 8 presents the results from 16 different research treatments that measured TN or nitrate loss as a function of fertilization rate/frequency. The analysis indicates relatively low N losses for lawns that applied less than 130 lbs N/yr (or >3 lbs N per 1000 sf lawn; shaded in green. By contrast, N losses were significant higher for lawns with N fertilizer treatments that exceeded the 3 lb threshold (shaded in red in Table 8). N losses were also influenced by the type of fertilizer and the number of soluble N applications.

Urban Nutrient Management Expert Panel: Approved Final Report
23
Table 8: N Losses from Turf Grass as a Function of Fertilizer Application Rate N Load
Exported (lb/ac)
N Fertilizer Input
(lb/ac)
% of Fertilizer Exported1
Reference
Notes
0.17 85 0.20% Mancino & Troll, 1990 In 10 weekly apps
0.28 87.5 0.32% Namcino & Troll, 1990 In 5 biweekly apps
0.06 93.7 0.06% Spence et al. 2012 High Maintenance Fescue lawn
0.13 76.75 0.17% Spence et al 2012 Low Maintenance Fescue Lawn
0.87 87.45 1% Frank et al. 2006 Lo input leaching losses
1.78 131 1.36% Guillard & Kopp 2004 Organic fertilizer
1.8 43.6 4.13% Mancino & Troll, 1990 Single application
3.3 131 2.52% Guillard & Kopp, 2004 PCSCU slow release
2.68 268 1% Quiroga-Garza et al. 2001
Semi-arid, Warm season Bermuda grass
3.66 268 1.37% Erickson 2001 Leaching loss
6.25 79 7.91% King et al. 2001 Hi Risk: Watered to maintain 85% FC with tile drains
10.7 1071 1% Quiroga-Garza et al 2001.
Hi Risk: Hi Input semi-arid Bermuda grass
23.02 131 17.55% Guillard & Kopp 2004 Hi Risk: Highly soluble ammonium nitrate
24.05 219 11% Frank et al. 2006 Hi Risk: Hi Input
68.02 412.3 16.5% Roy et al 2000 Hi Risk: 3x sod grower practice overwhelms turf, fall leaching losses.
87-222 312 28%-71% Pare et al 2006 Hi Risk: 80:20 sand peat media, applied 25kg/ha biweekly over 7 month growing season. Multiple cultivars.
1 Export is calculated as % fertilizer inputs. This overestimates turf system exports for field studies with atmospheric inputs in precipitation. Not all studies measured all species of nitrogen, and some may have measured only surface or subsurface N losses
Historically, concerns with nitrogen leaching from lawns have been driven by human health concerns regarding nitrate contamination of drinking water – particularly groundwater supplies. For this reason the concentration of leachate remains a significant concern. When it comes to urban nitrogen load reduction, however, nitrate leaching are not synonymous with total N loads delivered to the Bay. Nitrate leaching introduces soluble nitrogen into subsurface flow paths that may encounter reducing conditions supporting denitrification. Indeed, the potential for denitrification along subsurface flow paths is a principal nitrogen removal mechanism expected from riparian and vegetated buffers. Although leaching losses are not equivalent to surface losses, nitrate leaching in landscapes with
Urban Nutrient Management Expert Panel: Approved Final Report
24
highly permeable soils and high water tables pose the greatest risk for transforming leachate into surface loads through shallow subsurface return flows. Recent research indicates that lawns are highly retentive of fertilizer N under typical application rates and lawn conditions. Groffman et al (2004) found approx 75% of fertilizer N was retained in urban lawns monitored in Baltimore. Kaushal et al (2011) used N isotopic ratio signatures to show watershed export of nitrogen is not directly proportional to fertilizer inputs in Baltimore watersheds. Though lawn fertilizer is a significant input to the watersheds, the isotopic signatures of stream nitrogen suggest sewage is a much more significant N loading source than lawn fertilizer. Raciti et al (2008) and Raciti et al (2011b) demonstrated residential lawns have a high capacity for both carbon and nitrogen storage in plant biomass, thatch and soils. Denitrification in fertilized urban soils is significant at certain times of the year, with a loss up to 0.30 lbs/1000 sf/year, nearly all of which occurred during less than 5% of the growing season when soils are saturated and air temperatures are warm (Raciti et al, 2011a). A lawn's capacity for N storage and transient seasonal conditions supporting high de-nitrification rates may explain why other research studies found relatively low N export, despite significant N fertilizer inputs. Nitrate loss in Overland Flow A recent study measured nitrate-N losses in overland flow over 87 rainfall events from low and high maintenance lawns in the North Carolina piedmont (Spence et al, 2012). The authors found that the highly maintained lawns (fertilizer, irrigation and re-seeding) generated slightly less runoff (runoff coefficient, Rv= 0.04) and nitrogen export (about 1% of N fertilization applied) than lawns with a less intense maintenance regime (which still included fertilization). The less maintained lawns had a Rv of 0.06 and produced runoff during more rainfall events and generated slightly higher yields of nitrate, compared to the high maintenance lawns. The authors did note that their test lawns were located on undisturbed and highly permeable soils, which may not be representative of all residential situations. The Panel concluded that several risk factors sharply increased the risk of overland flow and potential fertilizer export. The amount of runoff volume is largely determined by lawn slope, soil compaction, and turf density. For example, Garn (2002) found that runoff was as much as 50% greater in steeply sloping urban lawns. Runoff losses appear greatest during the seasons of the year when the grass is dormant or the ground is either saturated or frozen (Guillard et al, 2008). Easton and Petrovic (2008) noted that N losses were greatest in newly established turf. N loss was most closely associated with shallow and compacted soils that had low water storage capacity. Loss of Organic N in Surface Runoff. Another N export pathway involves the loss of organic nitrogen in surface runoff. The organic nitrogen may be derived from lawn clippings, leaves and eroded sediments that are blown or washed off lawns and into the storm drain system. Several authors have
Urban Nutrient Management Expert Panel: Approved Final Report
25
indicated that this may be an important N export mechanism (Daniels et al, 2010 and Felton, 2007) given the rapid rate of decomposition and release of lawn organic matter. Spence et al (2012) note that the N content of lawn clippings ranged from 2.7 to 4.5% of their dry weight. Source area sampling of lawn runoff by Steuer et al (1997) measured a median TN concentration of 9.7 mg/l, 90% of which was measured as TKN. Lawn N concentrations were more than four times higher than N concentration in streets, parking lots and rooftops sampled in the same study. Other researchers have also show that organic forms of nitrogen predominate over nitrate in lawn runoff (Garn, 2002, Spence et al, 2012). While significant concentrations of particulate organic N have been measured in lawn runoff, the significance of this loss pathway is less clear when it comes the total N export. For example, the high particulate organic N loads reported by Garn (2002) were attributed to leaf litter, rather than grass clippings. While the particulate N concentrations for suburban lawns sampled by Spence et al (2012) were high, the total particulate N load exported was less than 0.15 lbs/ac/yr, regardless of lawn maintenance regime. Volatilization Some organic forms of fertilizer, especially urea, may be subject to volatilization losses shortly after they are applied. The organic fertilizer may be converted to ammonia which can be lost to the atmosphere. Volatilization occurs on warm and moist soils, and can be reduced if fertilizer is watered in immediately after application (Felton, 20o7). In summary, while lawns have been shown to be retentive of fertilizer nitrogen under most conditions, they can produce significant N losses via leaching, runoff, and clippings in high risk conditions (see next section for a detailed list).
4.3 High Risk Nutrient Export Factors. The Panel noted that lawn nutrient export was a classic example of the "disproportionality" concept cited by Baker et al (2008). The basic concept is that most lawns in the urban landscape are reasonably retentive of nutrients under most conditions, with a small proportion of high risk lawn conditions or behaviors responsible for most of the total nutrient export. Baker et al (2008) argue that an UNM program that is specifically targeted to high risk lawns would be the most effective, economical and fair as it would focus on lawns that provide the greatest source loading.

Urban Nutrient Management Expert Panel: Approved Final Report
26
Figure 5 Conceptual Model for Defining N Export Risk in the Urban Landscape (developed by Stuart Schwartz) A range of landscape and behavioral factors affect the relative risk of nutrient loss and therefore the effectiveness of urban nutrient management (UNM) from turf grass land uses. The nutrient loading risk from turf grass in any distinct urban land use (residential, commercial, institutional, etc.) may vary due to the slopes and soils, the fertilizer application rate adopted, and the quality of the lawn care practices being employed (see Figure 5). Slope/Soil Risk: For any land use, steeper slopes will tend to increase the risk of runoff and therefore surface transport of sediment and nutrients. The slope risk interacts with the soil texture and structure. Thick loamy soils on gentle slopes have a very low runoff loading risk. Poorly drained soils on steep slopes produce high runoff, and hence, a higher risk for nutrient and sediment loading. In other cases, sandy, well-drained soils in areas with shallow water tables may also present a high risk of transporting dissolved nutrients mobilized through leaching, that may return to surface water through shallow subsurface flow paths. Fertilizer Application Rate: Nutrient loading risk is further compounded by the nutrient application rate employed. Across each land use/slope-soil risk category shown in Figure 5, land managers may elect to apply widely different fertilization rates, ranging from zero to application rates in excess of 6 lbs/1,000 sf that would be considered
Slope/Soil RiskLow High
App
licat
ion
Rat
eN
one
Reco
mm
ende
dEx
cess
ive
Flat to gentle slopesHealthy well- structured soil
Steep poorly drained slopes orSandy well drained soils with
shallow water tableApplication rates > 6 lbs/k
High wear turf Application rates 3-6 lbs/k
Extension Recommendation Application rates 2-3 lbs/k
Low inputApplication rates > 1-2 lbs/k
Zero Input
PracticesG
oodPoor
• Soil test (including pH)• Mulch Clippings
• Multiple small well-timed applications net clippings
• No fertilizer or clippings on pavement
• Weather sensitive application
• Broadcast WS fertilizer on schedule, early spring, late fall
and then some – just to be sure• Remove clippings
• 1-2 applications as convenient
• Some attention to convenient
recommendations
• Residential
• Commercial
• Institutional
• Public parks/rec
• Public ROW
Slope/Soil RiskLow High
App
licat
ion
Rat
eN
one
Reco
mm
ende
dEx
cess
ive
Flat to gentle slopesHealthy well- structured soil
Steep poorly drained slopes orSandy well drained soils with
shallow water tableApplication rates > 6 lbs/k
High wear turf Application rates 3-6 lbs/k
Extension Recommendation Application rates 2-3 lbs/k
Low inputApplication rates > 1-2 lbs/k
Zero Input
• Soil test (including pH)• Mulch Clippings
• Multiple small well-timed applications net clippings
• No fertilizer or clippings on pavement
• Weather sensitive application
• 1-2 applications as convenient
• Some attention to convenient
recommendations

Urban Nutrient Management Expert Panel: Approved Final Report
27
excessive for normal or high wear turf. Between these extremes land mangers and homeowners may elect low input lawns applying 1-2 lbs/1,000 sf; maximum extension recommended rate of 3 lbs/1000 sf; or high intensity fertilization of 3-5 lbs/1,ooo sf that are sometimes suggested for heavily stressed turf such as athletic fields. Lawn Care Practices: Finally, the nutrient loading risk suggested by the convolution of land use, slope-soil risk, and fertilization application is further refined by the type of the overall lawn care practices employed. For example, the ten core UNM practices recommended by the Panel should tend to minimize the risk of N export, and to a lesser degree, P export. By contrast, high risk lawn care practices may involve broadcasting water soluble fertilizer on a routine schedule irrespective of weather or turf conditions, and then adding a little more, because “more must be better”. Grass clippings are removed rather than recycled on the lawn, and an extra application of fertilizer is applied in late fall or even early winter, to jump start spring "greening". Between these extremes of low and high risk practices exist a continuum of moderate risk practices. These lawns may implement some, but not all of the recommended UNM practices (e.g., not closely coordinating application timing and irrigation). Some of the recommended lawn care practices may be incorporated informally (e.g. multiple fertilizer applications) as convenient by the homeowner without having a written UNM plan. The spectrum of possible lawn care practices may further moderate or amplify the risk of nutrient export. Together, these three major dimensions of risk associated with turf grass fertilizer use -- landscape factors, fertilizer application rate and lawn care practice -- interact to affect nutrient export from urban pervious land to the Bay. The current CBWM, however, is limited to a single, generic urban pervious land use and does not consider the heterogeneity of turf grass based on those risks. The Panel considered these model limitations and attempted to account for a risk-based approach to define UNM credits. The Panel concurred with the targeting approach, and reviewed the literature to define a more operational definition of what constitutes high risk conditions or behaviors. They include lawns with:
1. Owners are currently over-fertilizing beyond state or extension recommendations
2. P-saturated soils as determined by a soil analysis 3. Newly established turf (Easton and Petrovic, 2004, Line and White, 2007) 4. Steep slopes (more than 15%) 5. Exposed soil (more than 5 % for managed turf and 15% for unmanaged turf) 6. High water table (within three feet of surface ) 7. Over-irrigated lawns (Barton and Colmer, 2005, Guillard, 2008) 8. Soils that are shallow, compacted or low water holding capacity (Easton and
Petrovic 2008a and b) 9. High use areas (e.g., athletic fields, golf courses)
Urban Nutrient Management Expert Panel: Approved Final Report
28
10. Sandy soils (infiltration rate more than 2 inches per hour) 11. Adjacent to stream, river or Bay (within 300 feet) 12. Karst terrain
UNM planning agencies may elect to identify additional factors to define high risk lawns; a list of environmentally sensitive factors such as those defined in Virginia's Nutrient Management Standards are provided in Table 9. Some of the high risk factors could be mapped or measured at the local level using available GIS data, neighborhood and/or site surveys or soil sample analysis. The Panel recommends that planners screen for high risk factors when developing individual UNM plans and designing community outreach programs. The Panel also recommends higher UNM nutrient reduction credits be granted when effective targeting based on high risk factors and behavior change can be confirmed and verified. Table 9. Additional Virginia UNM High Risk Factors Stipulated by Regulation "Environmentally sensitive site" means any pervious land which is particularly susceptible to nutrient loss to groundwater or surface water since it contains, or drains to areas which contain, sinkholes, or where at least 33% of the area in a specific field contains one or any combination of the following features: 1. Soils with high potential for leaching based on soil texture or excessive drainage 2. Shallow soils less than 41 inches deep likely to be located over fractured or limestone bedrock 3. Subsurface tile drains 4. Soils with high potential for subsurface lateral flow based on soil texture and poor drainage 5. Floodplains as identified by soils prone to frequent flooding in county soil surveys 6. Lands with slopes greater than 15%. Source: VA DCR (2005)
4.4 Scientific Justification for Core UNM Practices The Panel focused considerable efforts to define ten specific lawn care practices that are most strongly associated with reduced nutrient export from turf grass areas. The Panel primarily focused on practices that could reduce nitrogen export, given the effect of state phosphorus fertilizer legislation and the recent industry phase out of phosphorus in fertilizer products. However, several of the lawn care practices employed to reduce nitrogen loss also have the potential to reduce phosphorus loss. The scientific justification for these core practices are described in this section. The Panel acknowledged that each Bay state should adapt and modify these recommendations to reflect their unique conditions, as well as the recommendations of state lawn care extension agencies. Specific elements of the core UNM practices may
Urban Nutrient Management Expert Panel: Approved Final Report
29
differ across in the watershed, especially with respect to warm or cool season grass species and different climatic or plant hardiness zones. Lawn Care Practice 1. Consult with the local extension service office, certified plan writer or applicator to get technical assistance to develop an effective urban nutrient management plan for the property, based on a soil test analysis. The precise lawn care prescription should be based on state-specific UNM recommendations or regulations, as well as an understanding of soil properties, the type of grass species, the age of the lawn, and other factors. Professional expertise is essential to develop an effective plan. Lawn Care Practice 2. Maintain a dense vegetative cover of turf grass to reduce runoff, prevent erosion, and retain nutrients The research demonstrates that dense vegetative cover helps to reduce surface runoff which can be responsible for significant nutrient export from the lawn, regardless of whether it is fertilized or not. Dense cover has been shown to reduce surface runoff volumes in a wide range of geographic settings and soil conditions (Easton and Petrovic, 2004, 2008a,b, Garn, 2002, Bierman et al 2010, Ohno et al, 2007, Raciti et al, 2008, Shuman, 2004, Vlach et al, 2008, Legg et al, 1996 and Spence et al, 2012). If a lawn does not have a dense cover, it has an elevated risk for nutrient export, especially if soils are compacted or slopes are steep. In these situations, the primary nutrient management practice is to identify the factors responsible for the poor turf cover, and implement practices to improve it (e.g., tilling, soil amendments, fertilization or conservation landscaping). Lawn Care Practice 3. Per the UNM plan, Choose not to fertilize, OR Adopt a Reduce Rate/Monitor Strategy, OR Apply less than a pound of N per 1000 square feet per each individual application.
The Panel noted that three distinct and acceptable N fertilization strategies exist to effectively reduce the risk of export in runoff or via leaching, depending on site conditions and the needs and preferences of the homeowner.
The first strategy is to elect to not fertilize at all, which may be appropriate for relatively flat, mature lawns with a dense vegetative cover (e.g., older than ten years). This strategy relies on soil mineralization, lawn clippings and atmospheric deposition to supply the N inputs needed for growth, and is effective as long as turf cover remains dense (see Practice 2). (Caution: this strategy should not be employed on lawns that have poor turf cover or exposed soils since their runoff has a higher risk of phosphorus and sediment export, according to research.
The second strategy utilizes a "reduced rate and monitor" approach to fertilization advocated by Guillard et al (2008). In this strategy, the homeowner reduces application rates on the fertilizer bag label by one-third to a half and

Urban Nutrient Management Expert Panel: Approved Final Report
30
monitors the lawn response over time. The homeowner only re-applies fertilizer (at the smaller dose) if they perceive that lawn quality starts to fall below acceptable levels. Consumer research shows that most residents follow fertilizer label information to decide how much to apply (Schueler, 2000, Kerr and Downs Research, 2011), so that this iterative approach to lawn management could be effective. The third strategy is to fertilize at the state or cooperative extension recommended N fertilization rate but split it into 3 or 4 small doses during the growing season. In MD and NJ, this recommended rate is defined as a maximum single application of no more than 0.9 pound of N per 1000 square feet; other states and/or extension recommendation in the watershed may be slightly different. This strategy greatly reduces the N export risk for homeowners that desire a green lawn or use a lawn care company.
Several studies provide strong evidence for the second and third strategies, i.e., that it is better from a water quality perspective to apply smaller doses several times a year rather than the single maximum dose. Frank et al (2006) demonstrated the smaller dose strategy reduced N export for mature Kentucky bluegrass turf. Easton and Petrovic (2004) reported reduced P loss in leachate and runoff from a sandy loam soil when the same annual fertilizer application rate was spread over four smaller applications rather than two larger ones. Daniels et al (2010) also recommends the small dose fertilizer strategy for the Commonwealth of Virginia.
The "choose not to fertilize" option should not be used if the lawn has poor turf cover...These un-managed lawns can deliver runoff, sediment and nutrients to the stream network

Urban Nutrient Management Expert Panel: Approved Final Report
31
Lawn Care Practice 4. Retain clippings and mulched leaves on the lawn and keep them out of streets and storm drains
Lawn clippings are an important nutrient source for the urban lawn, as well as an important source of organic matter which enhances infiltration rate, soil health and water retention. Nitrogen isotope studies have shown that lawn clippings quickly decompose and return nutrients to the soil pool within a matter of weeks (Raciti et al, 2011 and Kopp and Guillard, 2005). Kopp and Guillard (2002) concluded that N fertilization could be reduced by 50% or more without decreasing turf grass quality when clippings were returned in an extensive field experiment with cool season grasses. Frank et al (2005) conducted research on cool season grasses and concluded that returning grass clippings to the lawn could provide approximately one lb of N/1000 sf/year, which is about 30 to 50% of the maximum recommended application rate for lawns in the Bay watershed (Felton, 2007). Kopp and Guillard (2005) notes that returning clippings "without a concomitant reduction in fertilizer application rates may lead to increased nitrate leaching losses". From the standpoint of phosphorus, Bierman et al (2010) conducted a three year study that looked at phosphorus runoff for lawns where clippings were either recycled or removed, and concluded that recycling clippings did not significantly increase P runoff from turf. Kussow (2008) also confirmed that grass recycling did not increase P export from a Midwestern lawn. Guillard (2008) notes that lawn clippings are high in nutrients and should be treated as if they were a fertilizer (see Section 4.1). Given the potential risk of nutrient export from lawn clippings and/or leaves, homeowners should strive to keep them on their lawn, and out of the gutter, street or storm drain system, regardless of whether they fertilize or not. In addition, the amount of nutrients supplied by lawn clippings and mulched leaves should be accounted for when assessing fertilizer needs.
Lawn Care Practice 5 Do not apply fertilizers before spring green up or after the grass becomes dormant Research has shown a clear link between lawn nutrient export and the timing of fertilization. The risk of nutrient export by leaching or surface runoff is greatest during the seasons of the year when the grass is dormant. The start of the dormancy period is dependent on the climatic zone in the Bay watershed. In the northern part of the watershed, it may begin around Halloween, whereas dormancy begins around Thanksgiving in the southern part of the watershed. Fertilizer applied to cool season grasses during the winter or late fall is highly susceptible to export (Bauer et al 2012, Mangiafico and Guillard, 2006, Roy et al 2001, Soldat and Petrovic, 2008, Bierman et al 2010).

Urban Nutrient Management Expert Panel: Approved Final Report
32
Lawn Care Practice 6. Maximize use of slow release N fertilizer
The risk of nutrient export is reduced when slow release fertilizer products are used during the growing season, compared to water soluble formulations. (Guillard and Kopp, 2004, Cohen et al, 1999 and Quiroga-Garza et al 2001, Lee et al, 2003, Felton, 2007, Bowman et al, 2002). Slow release fertilizer is typically shown on fertilizer products as water insoluble nitrogen or WIN, and can range from 20 to 50% of the total N product. Consumers can shop for the fertilizer product with the greatest percentage of WIN. Slow release fertilizer formulations should be avoided in the late fall, as they are likely to be releasing N when the grass is dormant or frozen (Felton, 2007).
Lawn Care Practice 7 Set Mower height at 3 inches or taller Maintaining taller grass produces a deeper and more extensive root system, which in turn, increases nutrient uptake and reduces lawn runoff volume. The deeper roots also reduce the need for supplemental irrigation during times of drought, suppresses weeds and increases turf density. Together, maintaining taller grass on urban lawns has been associated with reduced N and P loss (Guillard et al 2008, Cole et al 1997 and Soldat and Petrovic, 2008). The risk of nitrate leaching was reduced with greater root length density in warm season grasses (Bowman et al, 2002).
Lawn Care Practice 8 Immediately sweep off any fertilizer that lands on a paved surface
Rotary spreaders are the most common method to apply fertilizers and can broadcast fertilizer granules near the edge of the lawn, street or driveway, where they can be subsequently washed off in surface runoff. There has not been much research on off-target fertilization, but Felton (2007) has estimated that as much as 2 to 4 % of applied fertilizer may be subject to this loss pathway. Immediate sweeping of off target fertilizer is essential, given the high probability that the granules that land on paved surfaces will be directly washed into the storm drain system. Additionally, deflector technology is now available on most broadcast fertilizer spreaders at a very reasonable price. Deflectors can reduce off-target fertilization by as much as 99% (Felton, pers. comm, 2012). Product labeling to educate homeowners on this important practice will soon be required in both Maryland and Virginia.
Lawn Care Practice 9 Do not apply fertilizer within 15 to 20 feet of a water feature (depending on any applicable state regulations) and consider managing this zone as a perennial planting, meadow, grass buffer or forest buffer.
The risk of nutrient export is greatest from lawn areas adjacent to water features such as streams, shorelines, sinkholes and drainage ditches, simply due to the short distance for nutrients to travel via leaching and/or surface runoff. Several research projects have reported reduced nutrient export when these areas are managed as a buffer (Cole et al, 1997, Moss et al 2006, Garn 2002). Both Virginia and Maryland require a fertilizer buffer zone near water features, although more outreach is needed to make homeowners and commercial applicators aware of the buffer zone restriction.

Urban Nutrient Management Expert Panel: Approved Final Report
33
Lawn Care Practice 10 Employ lawn practices to increase soil porosity and infiltration capability, especially along portions of the lawn that are used to convey or treat stormwater runoff.
The optimal approach is to design the lawn to act a stormwater BMP to reduce runoff volumes and nutrient loads. A number of practices have been shown to increase lawn porosity including rain gardens (Selbig and Balser, 2010) and rooftop disconnections (Mueller and Thompson, 2009). A growing number of Bay communities are encouraging homeowners to install these practices using a wide range of incentives. A future Expert Panel is being assembled to explicitly define the nutrient removal credits and qualifying conditions for these on-lot practices.
4.5 Regional Studies on Effect of P Fertilizer Restrictions The Panel investigated several reports that evaluated the impact of P fertilizer restrictions on water quality that were implemented in several communities in the upper Midwest (Lehman et al 2009, Vlach et al 2008, Lawson and Walker 2011). All three studies initially reported a statistically significant decline in ambient P concentrations following the implementation of a P-ban ordinance. However, data from Lawson and Walker (2011) showed a slight increase in ambient P levels in the most recent analysis, although the levels were still below their pre-P-ban levels. Lehman et al (2009) analyzed river TP and soluble reactive phosphorus (SRP) concentrations upstream and downstream of a community before and after a fertilizer P-ban was enacted in Ann Arbor, MI. They found an average TP reduction of 28% between the two time periods. The authors also detected minor reductions in SRP, but these were not statistically significant. Subsequent monitoring by Lawson and Walker (2011) found that median TP concentrations had fallen below the TMDL target concentration of 0.05 mg/l in 2008 and 2009. TP concentrations climbed slightly in 2010 and 2012, but still showed a 13% overall decline when compared to pre-P fertilizer ban conditions. Both studies concluded that the P ban was a major factor in the decline, but that other watershed stewardship practices may have played a role but could not be documented.
Vlach et al (2008) analyzed storm runoff from six small residential subwatersheds in two communities in the Minneapolis/St Paul metro areas. Three of the subwatersheds were located in a community that had enacted a P fertilizer ban. The other three subwatersheds had not enacted a P ban, and were used as a control. Vlach et al (2008) reported a 12 to 16% reduction in TP and a 24 to 34% reduction in SRP for storms greater than a half inch in depth in the P ban subwatersheds, compared to the control subwatersheds. By contrast, no statistically significant difference in either TP or SRP was observed for smaller storms (i.e., less than a half inch of rainfall).

Urban Nutrient Management Expert Panel: Approved Final Report
34
Vlach also noted that homeowners did not fully comply with the local P fertilizer ban, as about 28% of residents continued to use P fertilizers after they were banned. He concluded the effect of the P fertilizer ban might have been amplified had full compliance been achieved. The study suggests that imposing a P fertilizer ban can achieve moderate reductions that are consistent with the zero-P CBWM fertilizer runs (see Section 5.1). Moreover, Vlach documented that these reductions were achieved even with a significant amount of non-compliance or cheating was taken into account. The Panel, however, concluded that a single study was insufficient to characterize this phenomena.
4.6 Summary of Homeowner Fertilization Behaviors The implementation of this practice is fundamentally driven by the behaviors of homeowners and commercial applicators, so it is important to review what we know about their actual behaviors. More than 15 surveys have sampled lawn fertilization practices, of which four are located within the Bay watershed. These studies are summarized in Table 10. The surveys consistently indicate that the majority of residential lawns are fertilized (i.e., 50 to 83%, depending on the survey). Many of the surveys focused on suburban areas and therefore may not fully represent fertilization behaviors in ultra urban, rural or exurban areas. The random phone survey conducted by Swann (1999) is probably the most representative sample of the extent to which homeowner fertilize in the Bay watershed, and appears to also be consistent with national industry estimates (SMC, 2011).
Table 10. Summary of Research on Homeowner Fertilization Behavior Study 1 Location % Fertilize % DIY 2 % Lawn Care 3 Aveni, 1996 Northern VA 79 -- -- Swann, 1999 Ches Bay 50 91 9 Law et al, 2004
Glyndon MD 68 71 29 Baisman Run 56 44 56
Osmond and Hardy 2004 North Carolina
Cary 83 48 52 Goldsboro 66 76 24 Kingston 54 70 30 New Bern 72 75 25 Greenville 73 65 35
Varlamof et al 2001 Georgia 76 -- -- Schueler, 2000 Non-Bay
States 54-82 -- --
SMC (2001) National 56 90 10 1 Each of the studies utilized different survey methods and sample sizes so the studies are not strictly comparable
2 Do-it-yourselfers 3 Employ a lawn care company that applies fertilizer on their behalf.

Urban Nutrient Management Expert Panel: Approved Final Report
35
The surveys show that most of the fertilizer is applied by individual homeowners rather than lawn care companies, although the proportion rises noticeably in more affluent neighborhoods or communities (e.g., Cary, Baisman, see Table 11). The surveys also show some consistency in homeowner application frequency, with fertilizer applied 1.7 to 2.0 times per year. This is in contrast to the more frequent applications by lawn care companies, which apply an average of 3 lbs N per 1000 sf/yr but do so in 4 to 5 smaller applications throughout the growing season (Felton, 2012 and Law et al, 2004). Swann's (1999) Chesapeake Bay survey provided insights into the seasonality of fertilization applications, with 73% of respondents reporting that they fertilized in the spring, 56% in the fall, 12% in the summer and 7% in the winter. The average number of applications per year was 1.7, with 6% of respondents applying 4 or more applications in any given year. Several surveys have looked at which sources of information homeowners rely on to make their fertilization decisions (Swann, 1999, Schueler, 2000a, Eisenhauer et al, 2010a, Kerr and Downs Research, 2011, Osmond and Hardy, 2004). The primary sources are the product label, retail sales attendant, neighbor, lawn care company or simply based on what they perceive the lawn to look like. All of the studies indicated that no more than 20% of residents consulted an expert lawn professional or took a soil test to determine the optimal fertilization strategy. More information on the effect of outreach campaigns in changing homeowner fertilization behaviors can be found in the next section.
4.7 Summary of Effect of Outreach on Changing Behavior
Education and outreach are the critical link to change the fertilization behaviors of individual homeowners and commercial applicators. There are many different approaches to education and outreach, but for purposes of this report, the Panel relied on the retail and wholesale definitions first proposed by Schueler (2000b).
Retail methods rely on direct engagement with individual property owners to develop an UNM plan based on field visits, training and direct technical assistance (e.g., Master Gardeners, Cooperative Extension, Soil Conservation District or watershed group, sensu Aveni, 1998). Another retail form of outreach is to encourage or require certification of commercial fertilizer applicators on appropriate UNM practices. Wholesale methods rely on media and/or social marketing campaigns that utilize a combination of TV, radio, internet, newspaper, billboard and other media methods to influence homeowner norms and awareness relative to desired fertilization behaviors.
The effectiveness of any form of outreach targeted to change behavior will depend on how deeply rooted the norm or behavior that is targeted for change has become. Recent research suggests that lawn fertilization is an extremely challenging behavior to change,

Urban Nutrient Management Expert Panel: Approved Final Report
36
even when residents understand that it can have an impact on downstream water quality (Blaine et al, 2012). For example, Nielson and Smith (2005) conducted resident surveys, interviews and neighborhood analysis to define lawn care behaviors in suburban neighborhoods in Oregon. Their statistical analysis showed that "...their number one priority as being the look of their yard. Residents commonly used words such as neat, clean , green and nice to describe priorities. A concern for the look of one's yard was coupled with statements about responsibility to neighbors, personal enjoyment of lawn aesthetics, or statements that expressed a fear of neighbor disapproval if yards were not kept up". Carrico et al (2012) also conducted detailed surveys and interviews of 194 residents in Nashville to explore the psychological and social predictors of lawn fertilization behavior, and also found that personal and neighborhood factors were the major predictors, even for residents with high environmental awareness. Carrico concluded that "...Maintaining a lawn is an avenue for engaging with one's neighborhood, for fulfilling expectations of what it means to be a positive member of a community, and to communicate a willingness to cooperate in creating and maintaining a shared space....Motivations for maintaining a green lawn, whether personal, social, or a combination, can overwhelm health or environmental concerns." Blaine et al (2012) notes that these strong neighborhood pressures and norms about lawn care could be harnessed to make alternate UNM practices "the" new norm, particularly if they show neighbors how they can achieve their desired lawn outcomes while reducing nutrient export. In this way, targeted UNM outreach campaigns could influence and possibly change what is considered acceptable fertilization behavior at the neighborhood scale. Summary of Research on Retail Methods
The Panel could only find a handful of reports that measured the impact of retail outreach methods in changing actual residential fertilizer behaviors. Most studies simply measured the number of individuals trained or nutrient management plans written, and did not evaluate actual behavior changes. One exception is a study by Dietz et al (2004) who evaluated the impact of lawn care practices before and after an intensive homeowner education effort in two subdivisions in Connecticut on stormwater quality. While they were able to detect some improvements in other watershed behaviors, Dietz could not detect any statistically significant change in the number of residents that fertilized as a result of the education effort, nor any change in their annual fertilization rate or change in stormwater quality. Diorka et al (2008) evaluated the impact of an outreach effort in Michigan and concluded it had changed resident's awareness of stormwater runoff and fertilizer practices, but did not attempt to measure actual changes in fertilizer practices. Taylor et al (2007) evaluated the effect of direct training on getting commercial properties to implement pollution prevention practices, and reported modest increases in practice
Urban Nutrient Management Expert Panel: Approved Final Report
37
implementation. Other studies have shown changes in awareness but not necessarily actual changes in behavior. Eisenhauer et al (2010a) conducted an analysis of the effect of a norm-based fertilizer retail education campaign in six neighborhoods in Bangor, Maine using pre and post surveys of 139 residents and found a statistically significant increase in resident intentions to reduce fertilizer use. Follow up research in four New England communities indicated that 55% of residents reported applying less fertilizer after exposure to extension service training, although only 23% of sampled residents availed themselves of the opportunity for lawn care training and technical assistance (Eisenhauer, 2010b). Another retail education opportunity involves direct training and certification of commercial fertilizer applicators, who collectively fertilize 15 to 25% of urban turf in the Bay watershed (see Table 10). Recent legislation has instituted training and certification programs in Maryland and Virginia. The Panel noted that targeting commercial applicators may be the most efficient means to get the most UNM plans implemented and verified in the short term. Only one study was available to assess the potential impact of this approach. Eisenhauer (2010c) conducted before and after surveys to test whether a series of workshops and webcasts targeted toward professional landscapers and turf managers could have a significant effect on reducing the magnitude and manner of how they apply fertilizers. Eisenhauer reported that 70% of the training population agreed or strongly agreed with a reduced-rate/monitor-lawn fertilization strategy after training (although he did not actually measure the actual adoption rate). Summary of Research on Wholesale Education Campaigns Several communities have sought to change residential fertilizer behavior through multi-media outreach campaigns using some combination of TV, radio, newspaper internet, direct mail and social media. These marketing campaigns have several challenges:
Getting target audience to actually hear the message
Provide a compelling message that changes social norms and increases environmental awareness
Motivating residents to actually change their fertilization behaviors The impact of these social marketing campaigns are mixed. Foushee (2010) reported the impact of a media campaign utilizing TV, radio and website and other outreach in four different communities in North Carolina. The study surveyed 715 individuals that were exposed to the three month campaign on a wide range of watershed behaviors including fertilization, and compared it to a baseline survey that utilized the same questions. The surveys revealed that the campaign was effective in reaching North Carolina residents (expressed in terms of message recall), and changed awareness in regards to the water quality impact of stormwater runoff.

Urban Nutrient Management Expert Panel: Approved Final Report
38
In terms of fertilizer behavior, however, the NC campaign had no statistically significant impact on the number of individuals that fertilized or used soil tests or the frequency that they fertilized. On the other hand, the NC survey did show a modest improvement in the number of residents that recycled or composted lawn clippings. The Southwest Florida Water Management District commissioned two different market surveys to evaluate the impact of media campaigns in two different geographical areas (Kerr and Downs Research, 2011 and Salter Mitchell, 2011). Unlike the Foushee (2010) study, both media campaigns were narrowly focused on the objective of changing fertilizer behaviors within a defined geographical area. Both media campaigns utilized TV and radio ads, direct mail, billboard and internet/social media, and the impact was assessed using pre and post campaign phone surveys of 1152 and 607 residents, respectively, making fertilizer decisions (Kerr and Downs Research, 2011 and Salter Mitchell, 2011). The unaided recall rate for the campaigns averaged about 20%. Salter Mitchell (2011) concluded that their campaign had specific impact on increasing fertilizer/water quality awareness and in changing select fertilization behaviors (e.g., sweeping up fertilizer on impervious surfaces and not applying before a heavy rain). They were not, however, able to detect any change in the number of residents who fertilized or the frequency of their applications. By contrast, Kerr and Downs Research (2011) found that their campaign had a modest but detectable effect in changing some (but not all) of the ten lawn care practices/behaviors they sought to change. Both studies noted that the effectiveness of their campaign was limited by competition from private sector ads promoting fertilizer products, and the proper fertilization message they were advertising was perhaps too complex to be readily digested by residents. Both studies also indicated that the campaigns needed to be refined and repeated to create lasting behavioral change. Panel Recommendations Based on the limited evidence available, the Panel concluded that retail outreach and commercial applicator training showed the most promise to achieve real changes in fertilization behavior, when they are carefully targeted with a specific message, and measured in the form of surveys or number of UNM plans/pledges completed. The Panel also concluded that retail outreach efforts would be most effective when they are targeted to high risk conditions as defined in Section 4.3. The Panel also concluded that there was no evidence to provide any nutrient reduction credit for passive outreach efforts, as defined in Section 1, although they agreed that MS4s should incorporate the core UNM practices into their existing outreach materials.
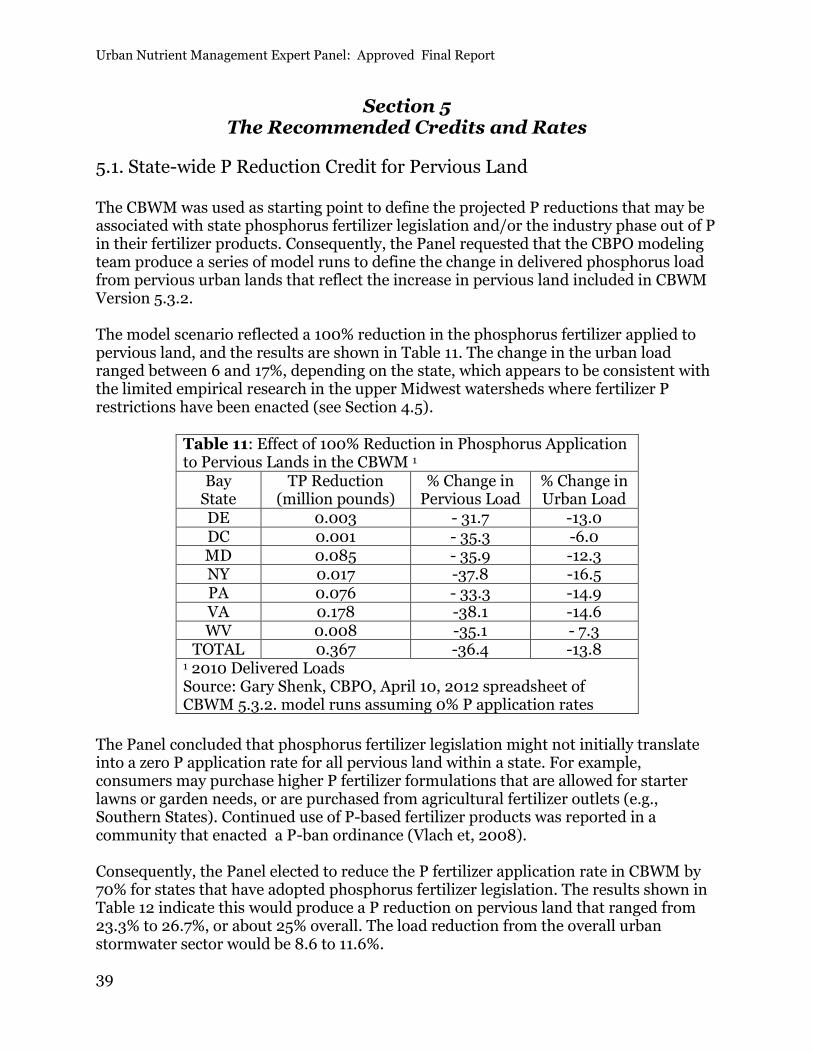
Urban Nutrient Management Expert Panel: Approved Final Report
39
Section 5 The Recommended Credits and Rates
5.1. State-wide P Reduction Credit for Pervious Land The CBWM was used as starting point to define the projected P reductions that may be associated with state phosphorus fertilizer legislation and/or the industry phase out of P in their fertilizer products. Consequently, the Panel requested that the CBPO modeling team produce a series of model runs to define the change in delivered phosphorus load from pervious urban lands that reflect the increase in pervious land included in CBWM Version 5.3.2. The model scenario reflected a 100% reduction in the phosphorus fertilizer applied to pervious land, and the results are shown in Table 11. The change in the urban load ranged between 6 and 17%, depending on the state, which appears to be consistent with the limited empirical research in the upper Midwest watersheds where fertilizer P restrictions have been enacted (see Section 4.5).
Table 11: Effect of 100% Reduction in Phosphorus Application to Pervious Lands in the CBWM 1
Bay State
TP Reduction (million pounds)
% Change in Pervious Load
% Change in Urban Load
DE 0.003 - 31.7 -13.0 DC 0.001 - 35.3 -6.0 MD 0.085 - 35.9 -12.3 NY 0.017 -37.8 -16.5 PA 0.076 - 33.3 -14.9 VA 0.178 -38.1 -14.6 WV 0.008 -35.1 - 7.3
TOTAL 0.367 -36.4 -13.8 1 2010 Delivered Loads Source: Gary Shenk, CBPO, April 10, 2012 spreadsheet of CBWM 5.3.2. model runs assuming 0% P application rates
The Panel concluded that phosphorus fertilizer legislation might not initially translate into a zero P application rate for all pervious land within a state. For example, consumers may purchase higher P fertilizer formulations that are allowed for starter lawns or garden needs, or are purchased from agricultural fertilizer outlets (e.g., Southern States). Continued use of P-based fertilizer products was reported in a community that enacted a P-ban ordinance (Vlach et, 2008). Consequently, the Panel elected to reduce the P fertilizer application rate in CBWM by 70% for states that have adopted phosphorus fertilizer legislation. The results shown in Table 12 indicate this would produce a P reduction on pervious land that ranged from 23.3% to 26.7%, or about 25% overall. The load reduction from the overall urban stormwater sector would be 8.6 to 11.6%.

Urban Nutrient Management Expert Panel: Approved Final Report
40
The same conservative approach was used to define the P fertilizer application rates for states that have not yet adopted phosphorus fertilizer legislation. The downward industry trend in P fertilizer sales has the potential to stall, given that not all companies in the lawn care service and/or fertilizer sales sector have made the commitment to fully phase out P in their lawn fertilizer formulations.
Table 12: Recommended TP Load Reduction Credit from Pervious Lands in States that have adopted Phosphorus
Fertilizer Legislation 1 Bay
State TP Reduction
(million pounds) % Change in
Pervious Load % Change in Urban Load
MD 0.060 - 25.1 - 8.6 NY 0.012 - 26.5 - 11.6
PA 2 0.053 - 23.3 - 10.4 VA 0.125 - 26.7 - 10.2
1 The load reduction shown in Table 12 (Zero P fertilizer run) was multiplied by 0.7 to compute the estimated benefit of phosphorus fertilizer legislation. 2 PA phosphorus fertilizer legislation is still under consideration, no credit is allowed until it has passed Source: Gary Shenk, CBPO, April 10, 2012 spreadsheet of CBWM 5.3.2. model runs assuming 0% P application rates
Table 13: Recommended TP Load Reductions from Pervious Lands in States that are influenced by fertilizer industry P phase-out 1
Bay State
TP Reduction (million pounds)
% Change in Pervious Load
% Change in Urban Load
DE 0.0018 - 19.0 - 7.8 DC 0.0006 - 21.2 - 3.6
PA 2 0.046 -20.0 -8.9 WV 0.0048 -21.1 - 4.4
1 The load reduction shown in Table 12 (Zero P fertilizer run) was multiplied by 0.6 to compute the estimated benefit of industry phase-out of phosphorus in fertilizer products 2 In the event phosphorus fertilizer legislation is not passed Source: Gary Shenk, CBPO, April 10, 2012 spreadsheet of CBWM 5.3.2. model runs assuming 0% P application rates
The results shown in Table 13 indicate a 60% reduction in P fertilizer application would produce a P reduction on pervious land ranging from 19.0% to 21.2%, or about 20% overall. The P load reduction from the overall urban stormwater sector would be range from 4.4 to 8.9%. Depending on market conditions and consumer preferences, it is conceivable that the decline in P levels might even be reversed. For these reasons, the Panel elected to reduce the P fertilizer application rate in CBWM by 60% for states that have not yet adopted phosphorus fertilizer legislation.

Urban Nutrient Management Expert Panel: Approved Final Report
41
The Panel acknowledges that the most appropriate method to verify P fertilizer reductions over time is to analyze the actual nutrient content in future non-farm fertilizer sales data. Therefore, in 2016, the automatic state credit should lapse and be replaced with improved state-reported estimates of P fertilizer applications to pervious land using the enhanced reporting methods and verification procedures outlined in Section 6.1.
5.2. State-wide N Reduction Credit for Pervious Land The Panel also recommends that states may apply for an TN credit after 2014, if they can document a reduction in N fertilizer applications to pervious land using the methods and verification procedures outlined in Section 6.1. The magnitude of the load reduction credit will be calculated by the CBWM, and will be based on the relationship of future state 2014 fertilizer N applications to the current CBWM N fertilizer input application rate for pervious land (43 lbs/acre/year). Figure 6. N Loss Response to Reduced N Fertilizer Application Rate in CBWM
The Panel requested a series of model runs from the CBWM modeling team to project the change in N export as a function of reductions in N fertilizer inputs to pervious land. As shown in Figure 6, sensitivity runs indicate that there is a 3% decline in N export for each 10% reduction in N fertilizer inputs, from the current assumed CBWM application rate of 43 lb/acre/year for urban pervious land (Yactayo, 2012). Similarly, a 20% reduction in average fertilizer input is projected to produce a 6% decrease in delivered loads.
0%
2%
4%
6%
8%
10%
12%
14%
16%
10% 20% 30% 40% 50%
Pe
rvio
us
Urb
an D
eliv
ere
d lo
ad %
d
rop
2009N051811 scenario % drop in N urban fertilizer input

Urban Nutrient Management Expert Panel: Approved Final Report
42
The Panel concluded that qualifying states that can document a decline from the current CBWM N fertilizer input application rate are eligible for TN load reduction credit. The credit amounts to a 3% reduction in delivered load from pervious land for each 10% increment reduction the current CBWM application rate of 43 lbs/pervious acre/yr. The reduction must be documented and verified by analyzing state non-farm N fertilizer sales data using the method outlined in Section 6.1.
Alternatively, the Panel recommends that the CBP re-examine the basis for its current nitrogen fertilizer application rate for pervious land as it develops Phase 6 of the CBWM. If future changes in N application rates have established a new baseline, it may be desirable to express it as a lower fertilizer input for pervious land, rather than providing a varying state-wide percent reduction credit.
5.3 N and P Removal Efficiency for UNM Practices While the research profiled in Section 4.4 indicated that the UNM practices may individually reduce the risk of nutrient export, no studies were available to measure their cumulative impact in reducing N or P export on either high or low risk pervious lands. Consequently, the Panel used a "best professional judgment" approach, along with research and model simulations, to define nutrient load reduction credits. The Panel took a conservative approach to define the UNM credit for several reasons. First, the Panel noted that most urban lawns with healthy turf grass are generally retentive of both N and P and are currently exporting low nutrient loads during most rainfall events. Second, some N and P loss occurs on urban pervious land independent of fertilization regime and lawn care practices. Runoff from urban watersheds (mix of pervious and impervious cover) tends to be dominated by organic forms of N and P (Pitt et al, 2003). Losses can be significant after high intensity rain events, especially during the non-growing season and when the ground is frozen. Consequently, UNM practices may not be fully effective under these seasonal conditions. In addition, the Panel was concerned about how effectively homeowners and commercial applicators might implement the UNM practices in the real world. Quite simply, what is written in a UNM plan may not be implemented on the lawn. In particular, homeowners may have difficulty in measuring or visualizing what a thousand square feet is, may not calibrate spreaders effectively, or simply want to use up the entire bag of fertilizer product. Similarly, homeowners may elect to follow some UNM practices, but not others, based on personal preferences and other reasons. The Panel concluded that UNM rates should reflect incomplete implementation of UNM plans. The Panel made the following assumptions when it defined UNM rates:
80% of the pervious land in the Bay watershed were considered to be in the low risk category, whereas 20% could be classified as being high risk.

Urban Nutrient Management Expert Panel: Approved Final Report
43
5% of applied fertilizer N is available for export in the high risk category and only 1% of applied fertilizer N is lost from the low risk category.
To avoid double counting, no applied fertilizer P was assumed to occur on either high or low risk lawns (i.e., since nutrient reduction is already provided under the automatic state-wide P reduction credit).
The current pervious fertilizer application rates and export sensitivity from the CBWM are used as the baseline for the load reductions.
A major portion of the total load from pervious land is not subject to any reduction by UNM practices. The non-removable load was defined as twice the average load from forest land in CBWM.
A small fraction of the residual load was available for potential reduction by UNM practices. The residual load was defined as the total load less the fertilizer input load and less the non-removable load.
Only 10% (N) and 20% (P) of the residual load could be reduced by UNM practices that are not directly related to the fertilization rate.
A lower maximum removal rate is assigned to P for two reasons. First, only half of the UNM practices work to reduce P export (#1, #2, #4, #6, and #10). Second, reductions in P fertilizer application are already accounted for by the state-wide P reduction credit for pervious land.
Appendix A provides more detail on the process the Panel used to define UNM rates, along with two different mass balance checks to assure that the proposed reductions were internally consistent with the current loading rates for pervious land generated by the CBWM. The Panel notes that each of the technical assumptions shown above are testable propositions, which can and should be further elucidated by future research.
Table 14 Nitrogen Reduction Credits for Qualifying UNM Per Acre of Residential, Commercial, Institutional or Public Land
Turf Management Category Annual Nitrogen Reduction Rate
Low Risk Lawns 1 6 % reduction of pervious load
Hi Risk Lawns 1 20% reduction of pervious load
Blended Rate 2 9% reduction of pervious load
1 regardless of fertilization regime (including non-fertilized lawns) 2 state-wide credit, assuming 80% of lawn acreage falls into the low category and 20% is high risk
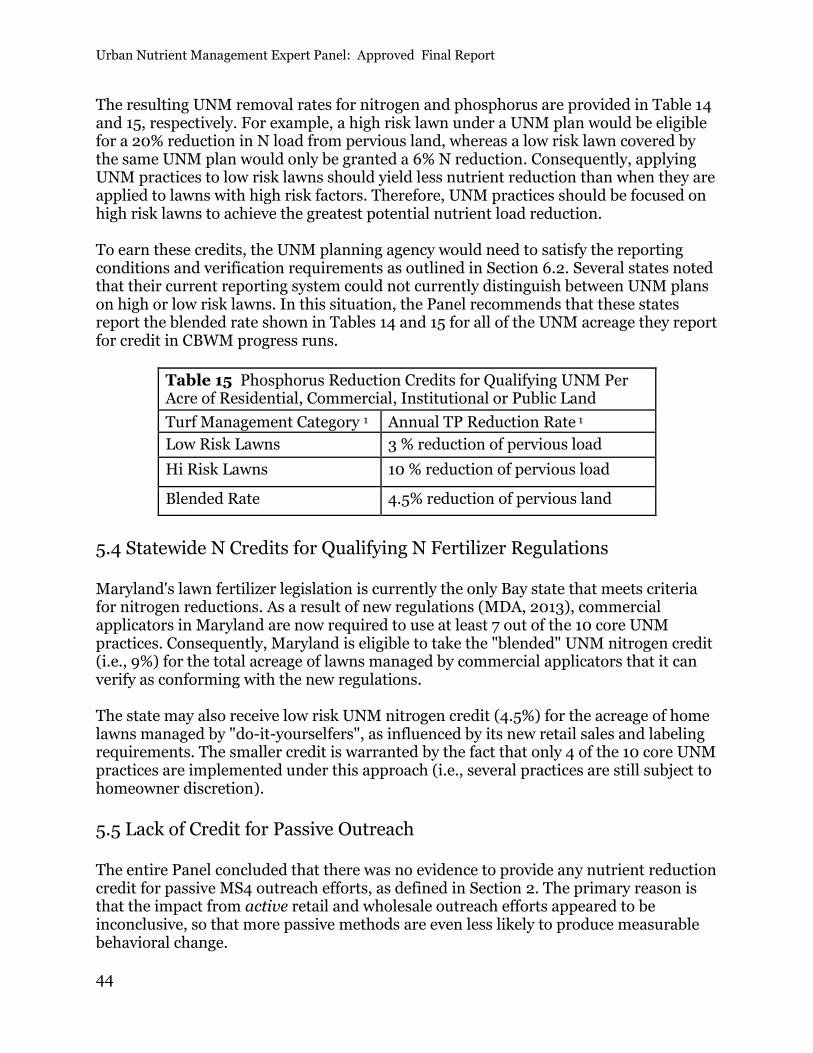
Urban Nutrient Management Expert Panel: Approved Final Report
44
The resulting UNM removal rates for nitrogen and phosphorus are provided in Table 14 and 15, respectively. For example, a high risk lawn under a UNM plan would be eligible for a 20% reduction in N load from pervious land, whereas a low risk lawn covered by the same UNM plan would only be granted a 6% N reduction. Consequently, applying UNM practices to low risk lawns should yield less nutrient reduction than when they are applied to lawns with high risk factors. Therefore, UNM practices should be focused on high risk lawns to achieve the greatest potential nutrient load reduction. To earn these credits, the UNM planning agency would need to satisfy the reporting conditions and verification requirements as outlined in Section 6.2. Several states noted that their current reporting system could not currently distinguish between UNM plans on high or low risk lawns. In this situation, the Panel recommends that these states report the blended rate shown in Tables 14 and 15 for all of the UNM acreage they report for credit in CBWM progress runs.
Table 15 Phosphorus Reduction Credits for Qualifying UNM Per Acre of Residential, Commercial, Institutional or Public Land
Turf Management Category 1 Annual TP Reduction Rate 1
Low Risk Lawns 3 % reduction of pervious load
Hi Risk Lawns 10 % reduction of pervious load
Blended Rate 4.5% reduction of pervious land
5.4 Statewide N Credits for Qualifying N Fertilizer Regulations Maryland's lawn fertilizer legislation is currently the only Bay state that meets criteria for nitrogen reductions. As a result of new regulations (MDA, 2013), commercial applicators in Maryland are now required to use at least 7 out of the 10 core UNM practices. Consequently, Maryland is eligible to take the "blended" UNM nitrogen credit (i.e., 9%) for the total acreage of lawns managed by commercial applicators that it can verify as conforming with the new regulations. The state may also receive low risk UNM nitrogen credit (4.5%) for the acreage of home lawns managed by "do-it-yourselfers", as influenced by its new retail sales and labeling requirements. The smaller credit is warranted by the fact that only 4 of the 10 core UNM practices are implemented under this approach (i.e., several practices are still subject to homeowner discretion).
5.5 Lack of Credit for Passive Outreach The entire Panel concluded that there was no evidence to provide any nutrient reduction credit for passive MS4 outreach efforts, as defined in Section 2. The primary reason is that the impact from active retail and wholesale outreach efforts appeared to be inconclusive, so that more passive methods are even less likely to produce measurable behavioral change.

Urban Nutrient Management Expert Panel: Approved Final Report
45
Section 6 Accountability Mechanisms
The Panel concurs with the conclusion of the National Research Council (NRC, 2011) that verification of BMP installation and subsequent performance is a critical element to ensure that pollutant reductions are actually achieved and sustained across the watershed. The Panel also concurred with the principles and protocols for urban BMP reporting, tracking and verification developed by the CBP Urban Stormwater Workgroup (USWG, 2012). The Panel felt that accountability was especially important for UNM plans since they are not a tangible or structural practice like many other urban BMPs. UNM plans represent a voluntary intention to implement specific lawn care practices in the future, and not necessarily an assurance that they have actually been implemented on the lawn. A property owner or commercial applicator may fail to follow the plan, only implement a few practices, change their minds, or sell the property to a new owner. As currently formulated, UNM plans are not associated with any economic subsidy that can be revoked for non-compliance. The UNM planning agency may also lack the staff resources and legal authority to enforce compliance with the plans. To meet these challenges, the Panel developed the following specific reporting and verification protocols for UNM planning agencies.
6.1 Verification of Statewide Nutrient Reduction Credits Individual states will retain primary responsibility for reporting, tracking and verification for this credit. States will need to document trends in non-farm P and N fertilizer sales every two years, relative to state-wide CBWM benchmark for P and N fertilizer inputs to pervious land. EPA would retain responsibility for hard-wiring each state's pervious land load changes into the CBWM input deck. State-wide P Reduction Credit for Pervious Lands: States are eligible to receive an automatic three year P load reduction credit in 2013, with the magnitude of the credit depending on whether they have adopted phosphorus fertilization legislation or not (i.e., Tables 12 or 13). In 2016, however, the automatic state-wide credit will lapse and must be replaced with state-reported estimates of P fertilizer applications to pervious land based on an analysis of the P content of their non-farm fertilizer sales statistics. The following method shall be used to verify the new credit:
Step 1: Multiply the state acreage in pervious land shown in Table 3 by the 1.3 lbs P/acre/year average application rate assumed in the current version of CBWM to establish the state P application benchmark. Step 2: Determine the P content of reported non-farm fertilizer sales for two consecutive years, accounting for the differential P content in the various lawn

Urban Nutrient Management Expert Panel: Approved Final Report
46
and garden fertilizer products that are represented in the sales statistics. Convert to total pounds of P, and adjust downward to account for non-Bay watershed area in the state on a pro-rata basis. The mass of estimated P sold is then divided by the state acres of pervious land (Table 3) to determine the new state average P application rate in lbs/ac/year. Step 3: Divide the new state P application rate by the state application benchmark and then multiply by 100 to get the percentage reduction in P application from the CBWM benchmark. Step 4: The state-specific unit area P application rate is then entered into the CBWM directly to compute the revised P load generated from pervious lands for the state.
Each state must repeat the above analysis every two years over the life of the TMDL to verify that the downward trend in P fertilizer applications is maintained over time. Statewide N Reduction Credits for Pervious Land: States may qualify for a statewide N reduction credit beginning in 2014. They will need to verify the credit by following the same four steps described for the P credit, with the difference being that CBWM benchmark loading rate will be 43 lbs/pervious acre/yr. The Panel recommends that the statewide nutrient reduction credit be configured into existing assessment tools in the future (i.e., CAST and Scenario Builder), and be shown as a unit acre load reduction. This unit reduction rate would then be applied to total pervious acres within an individual jurisdiction in CAST to enable a locality to understand how the state-wide load reductions apply to them.
The Panel acknowledges that its recommendations for enhanced reporting of non-farm fertilizer sales by nutrient content will require many state agricultural agencies to change their procedures for compiling fertilizer statistics, which will inevitably increase their fiscal burden, workload and may require legislative authorization. The Panel concluded that these stringent verification procedures were essential, given the enormity of the nutrient load reduction that could potentially be claimed under these state-wide credits.
6.2 Accountability Procedures for UNM Practices What is an Acceptable Urban Nutrient Management Plan?
Each UNM plan must be prepared by a trained expert (e.g., certified plan writer), which may require soil testing and may also contain other practices to improve lawn health and aesthetics.
The UNM plan must be consistent with the applicable UNM lawn care practices recommended in this report or existing state UNM requirements (e.g., Virginia)

Urban Nutrient Management Expert Panel: Approved Final Report
47
Each UNM plan must clearly document the: o Start and end dates for the plan o Name, contact information and locator data for the owner, applicator and
UNM planner o Acreage of turf and landscaping covered by the plan o Annual N and P fertilization rate, if any o Whether the turf is classified as high or low risk of nutrient export or is an
unfertilized lawn (optional)
The plan must be contain a signed commitment by the owner that they intend to implement the plan.
Commercial applicators can send a UNM template for the lawns they service as long as they follow the core UNM practices.
Simpler homeowner pledges to implement the core UNM practices may also be considered acceptable in some states as long as they meet the commitment and reporting requirements. In general, the Panel recommends that the acreage of homeowner pledges should only qualify for the low risk UNM credit, given that they are harder to verify. The duration of pledges is limited to 3 years, but can be renewed.
The maximum duration of an individual UNM plan is up to three years, at which point it can be renewed based on affirmation from the owner or applicator that they are either (a) maintaining the plan or (b) or have modified the plan based on further professional feedback and (c) modified based on new soil sample information.
If a UNM plan cannot be reconfirmed after three years, it will be considered lapsed, and the treated acreage should be deducted from the UNM planning agency database. Turf areas greater than one acre in size may require an on-site visit to assess turf condition and nutrient export risk.
What Record Keeping is Required? In most cases, the UNM planning agency will have primary responsibility for tracking the aggregate acreage of UNM implemented in their jurisdiction. The Panel recommends they keep the following records over time:
Electronic or hard copy of the individual UNM plan
Owner contact information and street and watershed address
A UNM contact database so that they can communicate by mail or e-mail, and send at least one reinforcement message to each UNM owner/applicator each year.
A UNM tracking database or spreadsheet to track required data elements for NEIN reporting and the status of UNM plans over time

Urban Nutrient Management Expert Panel: Approved Final Report
48
What Needs to be Report to the State? Localities need to contact their state agency responsible for CBP reporting to find out about specific UNM reporting requirements. Compliance Verification Through Sub-sampling. Verification involves an affirmation by the plan writer, property owner or operator that the UNM plan is still valid, and is still being implemented. The UNM planning agency (or delegated third party organization) will also need to randomly sub-sample either plan writers or property owners with high nutrient export risk under a defined schedule to verify compliance with the UNM plan. The aggregate compliance rates derived from these surveys will be used to extrapolate UNM compliance rates for the community as a whole and make any adjustments or downgrades to the nutrient reduction performance for this practice. The Panel could not agree on what elements of UNM could actually be inspected during an on-site visit, nor a numeric threshold for the intensity of sub-sampling to provide acceptable verification data. The Panel noted that the statistical rigor of any UNM sub-sampling effort should be consistent with the verification protocols being developed for agricultural nutrient management practices, as outlined by the AWG (2012), while at the same time recognizing that limited capacity currently exists in the urban sector to assess what could amount to hundreds of thousands of properties. The Panel felt that creating better UNM sub-sampling procedures should be a major priority research and implementation priority in the next few years.
6.3 Verification of the Credit for Qualifying N Fertilizer Regulations To prevent double counting, Maryland cannot take any credit for the state-wide nitrogen reduction credit described in Section 5.2, although for verification purposes, it will need to cross check its UNM reductions with measured declines in the N content of non-farm fertilizer sales (see Section 6.1). In addition, because the state of Maryland is already taking the UNM credit for fertilized lawns, localities can only take credit for UNM practices if they are applied to non-fertilized lawns. The state will also need to maintain records on training, certification and enforcement of commercial applicators subject to their new regulations, and will need to document how they measure the acreage of pervious land subject to commercial applicators and do-it-yourselfers.
6.4 Reducing the Potential for Double Counting. The Panel noted that it was quite possible that the acreage treated under both the UNM credit and the state-wide nutrient reduction credit would geographically coincide with the treated area of structural urban BMPs, such as stormwater retrofits or new LID practices. In this situation, the Panel investigated the risk of double counting (i.e., UNM, as a non-structural practice, delivers reduced loads to a structural BMP which reduces them even further).

Urban Nutrient Management Expert Panel: Approved Final Report
49
From a practical standpoint, it is not possible to geographically isolate or define the combined areas treated by both the non-structural UNM practice and downstream structural BMPs. UNM would have the effect of reducing nutrient concentrations to downstream urban BMPs. Research has shown that nutrient removal in structural BMPs declines in response to lower inflow nutrient event mean concentrations during storm events (ISQD, 2010). On the other hand, the combined application of non-structural and structural BMPs within the same drainage area would add to system resiliency and reliability. The Panel noted the potential for double counting was minimal, given that it took a very conservative approach in defining the UNM removal rates. Therefore, the Panel recommends that the mass UNM reductions be calculated independently of any additional reductions by "downstream" urban BMPs at this time.
Section 7
Future Research and Management Needs 7.1 Justification of the Recommendations One of the key requirements of the CBPO protocol is for the expert panel to justify the selected effectiveness in the removal rates that they ultimately recommend (WQGIT, 2010). While the Panel considers its current recommendations to improve upon the existing UNM removal rates used in the CBWM, it also clearly acknowledges that major scientific gaps still exist to our understanding of the following:
Extent and current fertilization management status of pervious lands in the watershed and the fraction that are of highest risk for nutrient export.
Current and future trends in non-farm N and P fertilizers sales in the Bay watershed that are applied to pervious land.
Best methods to simulate urban pervious lands in the context of the CBWM.
Cumulative impact of the ten lawn care practices that define UNM on reducing nutrient loads.
Effect of various outreach options in changing actual fertilizer behaviors.
Level of cooperation from the lawn care, fertilizer and retail industries in promoting the recommended UNM practices.
Given these significant gaps, the Panel agreed that the recommended rates should be reevaluated by a new panel to be reconvened by 2017 when more research data, better non-farm fertilizer statistics, further UNM verification data and an improved CBWM model all become available.

Urban Nutrient Management Expert Panel: Approved Final Report
50
7.2 UNM Communication, Capacity and Delivery Issues The Panel noted that localities and states will be challenged by the sheer number of future UNM plans in the Bay watershed, which may well exceed several million, based on the anticipated widespread implementation of UNM practices projected in current State Watershed Implementation Plans (see Table 16). An analysis of Phase 2 WIP plans indicates that 45% of urban pervious land in the watershed will be covered by UNM practices by the year 2025.
Table 16 Comparison of Acres of Urban Pervious Areas and Anticipated Acres Under
Urban Nutrient Management by 2025, For Each Bay State
State Urban Pervious Area 1 Urban Nutrient
Management 2 Acres
Delaware 36,481 34,584 District of Columbia 17,206 42,240 3 Maryland 990,291 505,548 New York 170,716 170,654 Pennsylvania 1,052,558 311,154 Virginia 1,195,567 517,058 West Virginia 88,218 347 TOTAL 3,551,037 1,581,585 1 Acres of Urban Pervious Area in Version 5.3.2 of Chesapeake Bay Watershed Model 2 Acres under urban nutrient management in each state by 2025 as reported in the Phase 2 Watershed Implementation Plan submissions to EPA in 2012, as summarized in spreadsheet by Jeff Sweeney, EPA CBPO 3 Clearly, the area under UNM cannot exceed the total pervious area;
The Panel noted that Bay managers will need to solve several UNM capacity, delivery, communication and tracking challenges, given that they are relying so heavily on the practice to achieve nutrient reductions from the urban sector. In particular, the Panel notes that the effectiveness of UNM practices to actually reduce nutrient export will depend heavily on the capacity of the many UNM planning agencies in the watershed to deliver a clear, consistent and repeated message to the target population. The core UNM message needs to be consistently communicated across the CBP partnership and various government agencies to reach the individual fertilizer applicators. Without such coordination, there is a risk that mixed, confusing or even conflicting messages will be sent to the target population of property owners in the Bay. With this in mind, the Panel recommends that EPA and the states convene a Bay-wide meeting of urban extension agents, soil scientists, turf specialists, green industry professionals and MS4 stormwater managers to go over the newly recommended UNM practice, and create a communication plan to deliver a consistent, uniform and concise Bay UNM message across at all levels of government and within the private sector. The Panel also expressed concern over current gaps in the capacity to provide professional UNM advice and the future demand for it. Specifically, the Panel is not sure whether the existing pool of qualified UNM experts in Bay watershed can effectively
Urban Nutrient Management Expert Panel: Approved Final Report
51
service the several million property owners that potentially need UNM plans and advice. The expansion in UNM plan implementation contemplated in the state WIPs could outstrip the collective current capacity of local, state, extension and soil conservationist resources. The Panel recommends that existing UNM professionals convene together to discuss how to increase the pool of qualified UNM experts, and look for opportunities to expand training to include commercial applicators, watershed groups, landscaping professionals, and local government staff. A major focus would be to work with the appropriate stakeholders to develop workable sub-sampling protocols to improve confidence in UNM verification. In addition, the Panel recommends that these groups work together to produce standardized reporting templates to streamline and integrate the process of reporting site-specific UNM practices up through the state-specific reporting of aggregate UNM credits. This may also improve consistency with the CAST/VAST/MAST and Scenario Builder Tools.
7.3 Proposed CBWM Model Refinements The Panel recommends that CBPO consider the following CBWM improvements or refinements as part of its midpoint correction in 2017 to better simulate urban nutrient management on pervious lands:
Update the unit area fertilization rate for each pervious land management category to reflect current and future trends in non-farm fertilizer sales
Refine measurements of the current area of pervious land used as input to the CBWM.
Expand the pervious land use to include at least two fertilizer management categories (e.g., fertilized and non-fertilized) and possibly other categories that can be linked to higher nutrient export risk (and be accurately characterized at the river-basin segment scale).
Improve the simulation of each management category by modifying model parameters to account for nutrient loss through the pathways described in Sections 4.1 and 4.2.
7.4 Priority Research to Fill Management Gaps The Panel identified the following priorities to improve our understanding of how the implementation of UNM practices can reduce nutrient export in the Bay watershed:

Urban Nutrient Management Expert Panel: Approved Final Report
52
Map the distribution and ground truth the relative proportion of different land uses/covers within the current pervious land classification used in the CBWM, with a focus on high and low nutrient export risk factors.
Conduct additional studies of homeowner fertilizer behavior in urban, suburban and exurban portions of the Bay watershed. These studies should focus on measuring their compliance with the intent of new statewide P fertilizer legislation.
Undertake before and after surveys to document changes in homeowner attitudes
and behaviors after exposure to UNM planning, and similar surveys to evaluate the impact of UNM training on UNM practice implementation among commercial applicators
Conduct source area monitoring research to confirm the load, concentrations and
sources of organic N and P in lawn runoff, and define the specific contribution of lawn and leaf debris to nutrient loads associated with both pervious and impervious cover.
Develop improved methods to quantify the actual lawn fertilizer N and P inputs for pervious lands through enhanced reporting and analysis of non-farm fertilizer sales data.
Perform field research to measure surface and subsurface nutrient export associated with high and low risk lawns over a broader range of soil, physiographic, terrain and soil conditions.
Support sociological research to determine the motivations and impediments for individuals to adopt UNM practices.

Urban Nutrient Management Expert Panel: Approved Final Report
53
References Cited Agricultural Work Group (AWG). 2012. Agricultural data verification protocol for the Chesapeake Bay Program Partnership. Chesapeake Bay Program Office, Annapolis, MD. Aveni, M. 1998. Homeowner surveys reveal lawn management practices in Virginia. Watershed Protection Techniques. 1(2):85-86. Baker, L. B. Wilson, D. Fulton and B. Horgan. 2008. Disproportionality as a framework to target pollutant reduction from urban landscapes. Cities and the Environment. 1(2): Barten, J. and J. Johnson. 2007. Minnesota phosphorus fertilizer law. Lakeline 12(3): 23-28. Barton, A. and T. Colmer. 2005. Irrigation and fertiliser strategies for minimizing nitrogen leaching from turfgrass. Agricultural Water Management. 80: 160-175 Bauer, S., D. Lloyd, B. Horgan and D. Soldat. 2012. Agronomic and physiological responses of cool-season turf grass to fall-applied nitrogen. Crop Science. 52-1-1o. Bierman, P., B. Horgan, C. Rosen, and A. Hollman. 2010a. Effects of phosphorus fertilization and turfgrass clipping management on phosphorus runoff. University of Minnesota. Final Report to Minnesota Pollution Control Agency. Bierman, P., B. Horgan, C. Rosen, A. Hollman and P. Pagliari. 2010b. Phosphorus runoff and turf grass as affected by phosphorus fertilization and clipping management. Journal of Environmental Quality. 39:282-292. Blaine, T., S. Clayton, P. Robbins and P. Grewal. 2012. Homeowner attitudes and practices towards residential landscape management in Ohio, USA. Environmental Management. 50:257-271. Bowman, C., C. Cherney, and T. Rufty. 2002. Fate and transport of nitrogen applied to warm season turfgrasses. Crop Science. 42: 833-841. Burns, D. A., Boyer, E. W., Elliott, E. M., and C. Kendall. 2009. Sources and transformations of nitrate from streams draining varying land uses: evidence from dual isotope analysis. Journal of Environmental Quality. 38(3): 1149-1159.
Carrico, A.,J. Fraser and J. Bazuin. 2012. Green with envy: psychological and social predictors of lawn fertilizer application. Environment and Behavior. May 2012 Chesapeake Bay Program (CBP). 1998. Appendix H: Tracking best management practice nutrient reductions in the Chesapeake Bay Program. Chesapeake Bay Watershed Model Application and Calculation of Nutrient and Sediment Loadings. Report of Chesapeake Bay Program Modeling Committee. Annapolis, MD.

Urban Nutrient Management Expert Panel: Approved Final Report
54
CBP. 2011. Excerpts on lawn fertilization practices in Estimates of County-Level Nitrogen for Use in Modeling Pollutant Reduction in CBWM. Documentation for Scenario Builder Version 2.4. US EPA Chesapeake Bay Program. Claggett, P., F. Irani, and R. Thompson. 2011. Methods for estimating past, present, and future developed land uses in the Chesapeake Bay watershed. Phase 5.3. Chesapeake Bay TMDL Methods Brief. US Geological Survey. Annapolis, MD. Claggett, P. 2012. Personal communication with the Expert Panel at Research Review Meeting. Research geographer. Chesapeake Bay Program. April, 2012. Cohen, S., A. Svrjcek, T. Durburow, and N. Barnes. 1999. Water quality impacts by golf courses. Journal of Environmental Quality. 28(3): 798-809. Cole, J. et al, 1997. Influence of buffers on pesticide and nutrient runoff from bermudagrass turf. Journal of Environmental Quality. 26:1589-1598. Daniels, W., M. Goatley, R. Maguire and D. Sample. 2010. Effects of fertilizer management practices on urban runoff water quality. Crop and Environmental Sciences. Occoquan Watershed Monitoring Lab. Virginia Tech. Dietz, M., J. Clausen, and K. Filchak. 2002. Education and changes in residential nonpoint source pollution. Journal of Environmental Management. 34(5): 684-690. Diorka, S. 2008. Public awareness of Delhi Charter township stormwater public education activities. Western Michigan University. Kalamazoo, MI. Dorney, J.R. 1986. Leachable and total phosphorus in urban street tree leaves. Water, Air and Soil Pollution. 28:439-443. Easton, Z and A. Petrovic. 2004. Fertilizer source effect on ground and surface water quality in drainage from turfgrass. Journal of Environmental Quality. 33:645-655. Easton, Z and A. Petrovic. 2008a. Determining phosphorus loading rates based on land use in an urban watershed. p. 43-62 in Nett et al (eds) The fate of turfgrass nutrient and plant protection chemicals in the urban environment. American Chemical Society. Washington, DC. Easton, Z and A. Petrovic. 2008b. Determining nitrogen loading rates based on land use in an urban watershed. p. 63-82 in Nett et al (eds) The fate of turfgrass nutrient and plant protection chemicals in the urban environment. American Chemical Society. Washington, DC. Eisenhauer, B. et al. 2010a. Changing Bangor area lawn care behavior: results from an evaluation survey. Final Report. Plymouth State University.

Urban Nutrient Management Expert Panel: Approved Final Report
55
Eisenhauer, B., J. Peterson, C. Weber. 2010b. Changing homeowner lawn care behavior to reduce nutrient losses in New England's urbanizing watersheds: Final Social Science Project Evaluation Report. Plymouth State University. Eisenhauer, B. 2010c. Nitrogen fertilizer reduction on coastal lawns through training and education. Final report CT 319 Grant. Plymouth State University. Erickson, J., J. Cisar, J. Volin and G. Snyder. 2001. Comparing nitrogen runoff and leaching between newly established St Augustinegrass turf and an alternative residential landscape. Crop Science. 41:1889-1895. Felton, G. 2007. Review of research related to nitrogen losses from turfgrass with focus on the mid Atlantic. University of Maryland, College Park, MD. Felton, G. 2012. Personal Communication on lawn care company fertilization rates in Maryland. University of Maryland Cooperative Extension. College Park, MD. Foushee, S. 2010. Pre and post TV campaign surveys of stormwater awareness and behavior: comparison and findings. North Carolina Clean Water Education Partnership. Raleigh, NC. Frank, K., M. O'Reilly, J. Crum, and R. Calhoun. 2005. The fate of nitrogen applied to a mature Kentucky bluegrass turf. Crop Science. 46: 209-215. Garn, H. 2002. Effects of lawn fertilizer on nutrient concentrations in runoff from lakeshore lawns, Lauderdale Lakes, Wisconsin. USGS Water Resources Investigation Report 4130. United States Geological Survey. Goetz, S., Wright, R., Smith, A., Zinecker, E. and E. Schaub. 2003. IKONOS imagery for resource management: tree cover, impervious surfaces, and riparian buffer analyses in the mid-Atlantic region. Remote Sensing of Environment. 88:195-208. Gregory, J., Dukes, M., Jones, P., and G. Miller. 2006. Effect of urban soil compaction on infiltration rate. Journal of Soil and Water Conservation. 61(3):117-123. Groffman, P, N. Law, K. Belt, L. Band and T. Fisher. 2004. Nitrogen fluxes and retention in urban watershed ecosystems. Ecosystems. 7(4):393-403.
Guillard, K. and W. Dest. 2003. Extractable soil phosphorus concentrations and creeping bentgrass response on sand greens. Crop Science. 43:272-281.
Guillard, K. and K. Kopp. 2004. Nitrogen fertilizer from and associated nitrate leaching for cool season turf. Journal of Environmental Quality. 33:1822-1827. Guillard, K. and many others. 2008. New England regional nitrogen and phosphorus fertilizer and associated management practice recommendations for lawns based on
Urban Nutrient Management Expert Panel: Approved Final Report
56
water quality considerations. Turfgrass Nutrient Management Bulletin. B-100. University of Connecticut, Department of Plant Science. Johnson, G., J. Davis, Y, Qian and K. Doesken. 2006. Topdressing turf with composted manure improves soil quality and protects water quality. Soil Science Society of America. 70:2114-2121. Kaushal, S., P. Groffman, L. Band, E. Elliott, C. Shields, and C. Kendall. 2011. Tracking Nonpoint Source Nitrogen Pollution in Human-Impacted Watersheds. Environmental Science & Technology. 45(19): 8225-8232.
Kerr and Downs Research. 2011. Final 2011 fertilizer pre- and post-advertising campaign survey study. Southwest Florida Water Management District.
King, K., R. Harmel, H. Torbert and J. Balogh. 2001. Impact of a turfgrass system on nutrient loading to surface waters. JAWRA. 37(8): 629-638. Kopp, K. and K. Guillard. 2002. Clipping management and nitrogen fertilization of turf grass growth. nitrogen utilization, and quality. Crop Science: 42:1225-1331. Kussow, W. 2008. Nitrogen and soluble phosphorus losses from an upper Midwest lawn in The fate of turfgrass nutrients and plant protection chemicals in the urban environment. Pages 1-19. American Chemical Society. Law, N., Band, L., and J. Grove. 2004. Nitrogen input from residential lawn care practices in suburban watersheds in Baltimore County, MD. Journal of Environmental Planning and Management. 47(5):737-755. Lawson, R and D. Walker. 2011. Middle Huron Watershed Water Quality Monitoring Program: Summary Results 2003-2011. Lee. D. C. Bowman and D. Cassel. 2003. Soil inorganic nitrogen under fertilized bermudagrass turf. Crop Science. 43(1): 247-257. Legg, A., Bannerman, R., and J. Panushka. 1996. Variation in the Relation of Rainfall to Runoff from Residential Lawns in Madison, Wisconsin, July and August 1995. U.S. Geological Survey, Denver, CO. Lehman, J., D. Bell and K. MacDonald. 2009. Reduced river phosphorus following implementation of fertilizer ordinance. Lake and Reservoir Management. 23: 307-312. Line, D. and N. White. 2007. Effects of development on runoff and pollutant export. Water Environment Research. 79(2): 185-190. Maguire, R. and J. Sims. 2002. Measuring agronomic and environmental soil phosphorus saturation and predicting phosphorus leaching with Mehlich 3. Soil Science Society of America Journal. 66:2033-2039.

Urban Nutrient Management Expert Panel: Approved Final Report
57
Mancino, C. and J. Troll. 1990. Nitrate and ammonium leaching losses from N fertilizers applied to penncross creeping bentgrass. HortScience. 25(2):194-198. Mangiafico, S. and K. Guillard. 2006. Fall fertilization timing effects on nitrate leaching and turf grass color and growth. Journal of Environmental Quality. 35:163-171. Mastrocicco, M., Colombani, N., Salemi, E., and G. Castaldelli. 2011. Reactive Modeling of Denitrification in Soils with Natural and Depleted Organic Matter. Water Air and Soil Pollution. 222(1-4): 205-215.
Maryland Department of Agriculture (MDA). 2005. Annual fertilizer tonnage reports: 1990-2004. Maryland Agricultural Statistics Service. MDA. 2013. Proposed fertilization application requirements for land not used for agricultural purposes. Section 15.20.10 Subtitle 20, Soil and Water Conservation. Title 15. Maryland Department of Agriculture. MDASS. 2006. Maryland 2005 Turfgrass Survey. United States Department of Agriculture. National Agricultural Statistics Survey. Maryland Turfgrass Council. Maryland Field Office. College Park Milesi, C., S. Running, C. Elvidge, J. Deitz, B. Tuttle and R. Nemani. 2005. Mapping and modeling the biogeochemical cycling of turf grasses in the United States. Environmental Management. 36(3): 426-438. Moss, J., G. Bell, M. Kizer, M. Payton, H. Zhang and D. Martin. 2006. Reducing nutrient runoff from golf course fairways using grass buffers of multiple heights. Crop Science. 46:72-80. Mueller, G. and A. Thompson. 2009. The ability of urban residential lawns to disconnect impervious area for municipal sewer systems. JAWRA 45(5):1116-1126. Nielson, L. and C. Smith. 2005. Influences on residential yard care and water quality: Tualatin watershed, Oregon. JAWRA. 41(1): 93-106. New York Agricultural Statistics Service (NYASS). 2004. New York Turfgrass Survey. National Agricultural Statistics Service. Albany, NY Ohno, T., B. Hoskins and M. Erich, 2007. Soil organic matter effects on plant available and water soluble phosphorus. Biology Fertility Soil. 43:683-690. Osmond, D. and D. Hardy. 2004. Characterization of turf practices in five North Carolina communities. Journal of Environmental Quality. 33:565-575. Pare, K., H. Chantigny, K. Carey, W. Johnston and J. Dionne. 2006. Nitrogen uptake and leaching under annual bluegrass ecotypes and bentgrass species: a lysimeter experiment. Crop Science. 46: 847-853.

Urban Nutrient Management Expert Panel: Approved Final Report
58
Pennsylvania Agricultural Statistics Service (PAASS). 1990. 1989 Pennsylvania Turfgrass Survey. Pennsylvania Department of Agriculture. Harrisburg, PA. Pouyat, R., I. Yesilonis, J. Russell-Anelli, and N. Neerchal. 2007. Soil chemical and physical properties that differentiate urban land-use and cover types. Soil Science Society of America Journal. 71(3):1010-1019. Qian, Y., W. Bandaaranayake, W. Parton, B. Mecham, M. Harivandi and A. Mosier. 2003. Long term effects of clipping and nitrogen management in turfgrass on soil organic carbon and nitrogen dynamics. The CENTURY Model Simulation. Journal of Environmental Quality. 32: 1694-1700. Quiroga-Garza, H., G, Picchioni and M. Remmenga. 2001. Bermudagrass fertilized with slow-release nitrogen sources: I. Nitrogen uptake and potential leaching losses. Journal of Environmental Quality. 30:440-448. Raciti, S., A. Burgin, P., Man, D. Lewis, and T. Fahey. 2011a. Denitrification in suburban lawn soils. Journal of Environmental Quality, 40(6): 1932-1940.
Raciti, S., P. Groffman, J. Jenkins, R. Pouyat, T. Fahey, S. Pickett and M. Cadenasso. 2011b. Accumulation of carbon and nitrogen in residential soils with different land-use histories. Ecosystems. 14(2): 287-297.
Raciti, S., P. Groffman, and T. Fahey. 2008. Nitrogen retention in urban lawns and forests. Ecological Applications. 18(7):1615-1626. Raciti, S., P. Groffman, J. Jenkins, R, Pouyat, T. Fahey, S. Pickett and M. Cadenasso. 2011b. Accumulation of carbon and nitrogen in residential soils with different land-use histories. Ecosystems. 14(2): 287-297. Ray, H. 1997. Street dirt as a phosphorus source for urban stormwater. MS thesis. Department of Civil Engineering, University of Alabama-Birmingham, Birmingham, Alabama. Robbins, P., and T. Birkenholtz. 2003. Turfgrass revolution: measuring the expansion of the American lawn. Land Use Policy. 20:181-194. Roy, J. G. Parkin and C. Wagner-Riddle. 2000. Timing of nitrate leaching from turfgrass after multiple fertilizer applications. Water Quality Research Journal Canada. 35(4): 735-752. Salter Mitchell. 2011. Lawn care behavior: Crystal River/Kings Bay and Rainbow River survey. Final Report. Southwest Florida Water Management District. Scotts MiracleGro Company (SMC). 2011. National Turfgrass Fertilization Statistics. Data shared with Expert Panel
Urban Nutrient Management Expert Panel: Approved Final Report
59
Schueler, T. 2000a. Understanding Watershed Behavior. Watershed Protection Techniques. 3(3): 671-679. Schueler, T. 2000b. On Watershed Education. Watershed Protection Techniques. 3(3): 680-688. Schueler, T. 2010. The clipping point: turf cover estimates for the Chesapeake Bay watershed and management implications. Technical Bulletin No. 8. Chesapeake Stormwater Network. Baltimore, MD. Selbig, W. and N. Balster. 2010. Evaluation of turfgrass and prairie vegetated rain gardens in a clay and sand soil, Madison, WI, Water Years 2004-2008. USGS Scientific Investigation Report 2010-5077. Shenk, G. 2012. Presentation to Expert Panel on how CBWM Phase 5.3.2. simulates nutrient dynamics on pervious land. US EPA Chesapeake Bay Program. February, 2012. Shuman, L. 2004. Phosphorus and nitrate nitrogen in runoff following fertilizer application to turfgrass. Journal of Environmental Quality. 31: 1710-1715 Soldat, D. and A. Petrovic. 2009. The fate and transport of phosphorus in turfgrass ecosystems. Crop Science. 48:2051-2065. Spence, P., D. Osmond, W. Childres, J. Heitman and W. Robarge. 2012. Effects of lawn maintenance on nutrient losses via overland flow during natural rainfall events. JAWRA. 48(6): 1-16. Swann, C. 1999. A survey of residential nutrient behaviors in the Chesapeake Bay. Chesapeake Research Consortium. Center for Watershed Protection. Ellicott City, MD. Steuer, J., W. Selbig, N. Hornewer and J. Prey. 1997. Sources of contamination in an urban basin in Marquette, MI, and an analysis of concentrations, loads and data quality. USGS Water Resources Investigations Report. 97-4242. Struss, R. pers. comm (May 11, 2012). Minnesota Department of Agriculture. Taylor, A. R., Curnow, T. Fletcher and J. Lewis. 2007. Education campaigns to reduce stormwater pollution in commercial areas: do they work? Journal of Environmental Management. 84: 323-335 U.S. EPA. 2011. Final Chesapeake Bay Watershed Implementation Plan in response to Bay-wide TMDL. United States Environmental Protection Agency, Region 3. Philadelphia, PA. Urban Stormwater Workgroup (USWG). 2012. Principles and Protocols for Urban BMP Verification. Approved 11/27/2102. Chesapeake Bay Program.

Urban Nutrient Management Expert Panel: Approved Final Report
60
Varlamoff, S., W. Florkowski, J. Jordan, J. Latimer and K. Brannon. 2001. Georgia homeowner survey of landscape management practices. HortTechnology. 11:326-331. Vlach, B., J. Barten, J. Johnson and M. Zachay. 2008. Case Study #9: Assessment of source reduction due to phosphorus-free fertilizers. University of Minnesota. Stormwater Center. St Paul, MN. Virginia Agricultural Statistics Survey (VAASS). 1998. Virginia Turfgrass Industry Profile. National Agricultural Statistics Service. Virginia Field Office. Richmond, VA Virginia Department of Agricultural and Consumer Services. (VADACS). 2006. Virginia’s Turfgrass Industry. National Agricultural Statistics Service. Virginia Field Office. Richmond, VA. Virginia Department of Conservation and Recreation (VADCR). 2005. Virginia nutrient management standards and criteria. Commonwealth of Virginia. Richmond, VA. Virginia Cooperative Extension (VCE). 2011. Urban nutrient management handbook. Virginia Department of Conservation and Recreation. Blacksburg, VA. Water Quality Goal Implementation Team (WQGIT). 2010. Protocol for the development, review and approval of loading and effectiveness estimates for nutrient and sediment controls in the Chesapeake Bay Watershed Model. US EPA Chesapeake Bay Program. Annapolis, MD.

Urban Nutrient Management Expert Panel: Approved Final Report
61
Appendix E Conformity of Report with BMP Review Protocol
The BMP review protocol established by the Water Quality Goal Implementation Team (WQGIT, 2010) outlines the expectations for the content of expert panel reports. This appendix references the specific sections within the report where panel addressed the requested protocol criteria. 1. Identity and expertise of panel members: Table in Section 1, p. 6 2. Practice name or title: Urban Nutrient Management, which consists of three different credits (state-wide N and P and site-based UNM plans) 3. Detailed definition of the practice: Section 2, pages 8-11 4. Recommended N, P and TSS loading or effectiveness estimates: Summary Table of Credits (p. 5). Detailed discussion of credits in Section 5, pages 39 to 44. 5. Justification of selected effectiveness estimates: For UNM rates, see mass balance in Appendix A. See also Sections 4 and 5 6. List of references used: see Page 53 7. Detailed discussion on how each reference was considered: See Section 4 8. Land uses to which BMP is applied: Pervious Land 9. Load sources that the BMP will address and potential interactions with other practices: See Section 3.1 (p. 12), Sections 4.1 (p.21) and 4.2 (p. 22) for the load sources and Section 6.4 for potential for reducing double counting with other downstream BMPs (p. 49) 10. Description of pre-BMP and post-BMP circumstances and individual practice baseline: See section 3.3 for trends in fertilizer applications (p. 15), Section 6.1 for how to compute baseline for non-farm fertilizer statistics (p. 45), and sections 5.1 to 5.4 (pp. 38-44) 11. Conditions under which the BMP works/not works. See Section 2 for qualifying conditions (p. 8) and Section 4.3 on high risk factors for N export (p. 25), and Section 7.1 for discussion on panels confidence in its recommendations (p. 49) 12. Temporal performance of BMP including lag times between establishment and full functioning. No lag time is assumed. 13. Unit of measure: State reduction credit: mass load reduction applied to pervious land UNM rates: acres of qualifying pervious land

Urban Nutrient Management Expert Panel: Approved Final Report
62
Alternative outreach: mass load reduction applied to pervious land 14. Locations in CB watershed where the practice applies: All qualifying pervious acres in the Bay watershed that meet the operational definition of high and low risk factors. 15. Useful life of the BMP: Generally 3 years, can be renewed subject to verification 16. Cumulative or annual practice: annual practice 17. Description of how BMP will be tracked and reported: See Section 6. 18. Ancillary benefits, unintended consequences, double counting: See Section 6.4 (p. 48) 19. Timeline for a re-evaluation of the panel recommendations: 2017, see Section 7.1 20. Outstanding Issues: See Research, Management and Modeling Recommendations in Section 7. 21. Pollutant relocation: No issues as the credits were based on both surface and groundwater export from urban pervious land