reconciling high efficiency with low latency …davidlo/resources/2015.thesis.pdf · reconciling...
TRANSCRIPT

RECONCILING HIGH EFFICIENCY WITH LOW LATENCY IN THE DATACENTER
A DISSERTATION
SUBMITTED TO THE DEPARTMENT OF ELECTRICAL ENGINEERING
AND THE COMMITTEE ON GRADUATE STUDIES
OF STANFORD UNIVERSITY
IN PARTIAL FULFILLMENT OF THE REQUIREMENTS
FOR THE DEGREE OF
DOCTOR OF PHILOSOPHY
David Lo
June 2015

This dissertation is online at: http://purl.stanford.edu/yb021pv0010
© 2015 by David Lo. All Rights Reserved.
Re-distributed by Stanford University under license with the author.
ii

I certify that I have read this dissertation and that, in my opinion, it is fully adequatein scope and quality as a dissertation for the degree of Doctor of Philosophy.
Christos Kozyrakis, Primary Adviser
I certify that I have read this dissertation and that, in my opinion, it is fully adequatein scope and quality as a dissertation for the degree of Doctor of Philosophy.
Oyekunle Olukotun
I certify that I have read this dissertation and that, in my opinion, it is fully adequatein scope and quality as a dissertation for the degree of Doctor of Philosophy.
Mendel Rosenblum
Approved for the Stanford University Committee on Graduate Studies.
Patricia J. Gumport, Vice Provost for Graduate Education
This signature page was generated electronically upon submission of this dissertation in electronic format. An original signed hard copy of the signature page is on file inUniversity Archives.
iii

Abstract
Web services are an integral part of today’s society, with billions of people using the Internet regularly. The
Internet’s popularity is in no small part due to the near-instantaneous access to large amounts of personalized
information. Online services such as web search (Bing, Google), social networking (Facebook, Twitter,
LinkedIn), online maps (Bing Maps, Google Maps, NavQuest), machine translation (Bing Translate, Google
Translate), and webmail (GMail, Outlook.com) are all portals to vast amounts of information, filtered to only
show relevant results with sub-second response times. The new services and capabilities enabled by these
services are also responsible for huge economic growth.
Online services are typically hosted in warehouse-scale computers located in large datacenters. These
datacenters are run at a massive scale in order to take advantage of economies of scale. A single datacenter
can comprise of 50,000 servers, draw tens of megawatts of power, and cost hundreds of millions to billions
of dollars to construct. When considering the large numbers of datacenters worldwide, the total impact of
datacenters is quite significant. For instance, the electricity consumed by all datacenters is equivalent to
the output of 30 large nuclear power plants. At the same time, demand for additional compute capacity of
datacenters is on the rise because of the rapid growth in Internet users and the increase in computational
complexity of online services.
This dissertation focuses on improving datacenter efficiency in the face of latency-critical online services.
There are two major components of this effort. The first is to improve the energy efficiency of datacenters,
which will improve the operational expenses of the datacenter and help mitigate the growing environmental
footprint of operating datacenters. The first two systems we introduce, autoturbo and PEGASUS, fall under
this category. The second efficiency opportunity we pursue is to increase the resource efficiency of datacenters
by enabling higher utilization. Higher resource efficiency leads to significantly increased capabilities without
increasing the capital expenses of owning a datacenter and is critical to future scaling of datacenter capacity.
The third system we describe, Heracles, targets the resource efficiency opportunity for current and future
datacenters.
There are two avenues of improving energy efficiency that we investigate. We examine methods of
improving energy efficiency of servers when they are running at peak load and when they are not. Both
cases are important because of diurnal load variations on latency-critical online services that can cause the
utilization of servers to vary from idle to full load in a 24 hour period. Latency-critical workloads present a
iv

unique set of challenges that have made improving their energy efficiency difficult. Previous approaches in
power management have run afoul of the performance sensitivity of latency-critical workloads. Furthermore,
latency-critical workloads do not contain sufficient periods of idleness, complicating efforts reduce their
power footprint via deep-sleep states.
In addition to improving energy efficiency, this dissertation also studies the improvement of resource
efficiency. This opportunity takes advantage of the fact that datacenters are chronically run at low utilizations,
with an industry average of 10%-50% utilization. Ironically, the low utilization of datacenters is not caused
by a lack of work, but rather because of fears of performance interference between different workloads.
Large-scale latency-critical workloads exacerbate this problem, as they are typically run on dedicated servers
or with greatly exaggerated resource reservations. Thus, high resource efficiency through high utilization is
obtained by enabling workloads to co-exist with each other on the same server without causing performance
degradation.
In this dissertation, we describe three practical systems to improve the efficiency of datacenters. Auto-
turbo uses machine learning to improve the efficiency of servers running at peak load for a variety of energy
efficiency metrics. By intelligently selecting the proper power mode on modern CPUs, autoturbo can improve
Energy Delay Product by up to 47%. PEGASUS improves energy efficiency for large-scale latency-critical
workloads by using a feedback loop to safely reduce the power consumed by servers at low utilizations. An
evaluation of PEGASUS on production Google websearch yields power savings of up to 20% on a full-sized
production cluster. Finally, Heracles improves datacenter utilization by performing coordinated resource iso-
lation on servers to ensure that latency-critical workloads will still meet their latency guarantees, enabling
other jobs to be co-located on the same server. We tested Heracles on several production Google workloads
and demonstrated an average server utilization of 90%, opening up the potential for integer multiple increases
in resource and cost efficiency.
v

Acknowledgements
First and foremost, I would like to thank my thesis advisor, Christos Kozyrakis. Christos has been a wonderful
source of advice, mentorship, guidance, and support ever since I started working with him the summer after
my sophomore year as an undergraduate. This thesis would not have been possible if not for Christos’s
insights into future challenges facing computer architects and his percipient advice throughout my academic
career. It has been a great pleasure doing research with him.
I would also like to thank other Stanford faculty for their advice and guidance. Thanks to the Pervasive
Parallelism Lab (PPL) faculty and the Stanford Experimental Datacenter Lab (SEDCL) faculty for fostering
a productive research environment: Mendel Rosenblum, Kunle Olukotun, Mark Horowitz, Bill Dally, John
Ousterhout, Alex Aiken, Balaji Prabhakar, and Pat Hanrahan.
A significant portion of my dissertation is based on research that I performed while at Google. This
was made possible only with the support of Liqun Cheng, Rama Govindaraju, Partha Ranganathan, Luiz
Barroso, Chris Johnson, Alex Kritikos, Mahesh Palekar, Nadav Eiron, and Peter Dahl. It was only through
their assistance that I was able to run real-world experiments with production Google workloads on Google
hardware, a feat that cannot be replicated anywhere else.
I would like to thank my fellow graduate students in Christos’s research group, both past and present:
Daniel Sanchez, Jacob Leverich, Christina Delimitrou, Adam Belay, Richard Yoo, Mike Dalton, Hari Kan-
nan, Woongki Baek, Raghu Prabhakar, Grant Ayers, Mingyu Gao, Sam Grossman, Ana Klimovic, Camilo
Moreno, Rakesh Ramesh, Greg Kehoe, and Felipe Munera. Daniel introduced me to research when he was
supervising my REU project that fateful summer after sophomore year, and his dedication as a mentor was
responsible for setting me on the path to a PhD. It’s been a pleasure collaborating and co-authoring papers
with Daniel and Richard, as well as with Krishna Malladi and Jeremy Sugerman. Jacob was an excellent
sysadmin, and I am envious of the sparsity of cluster downtime under his watch.
I also want to thank Mendel Rosenblum and Kunle Olukotun for taking the time to be my dissertation
readers, Mark Horowitz for being the fifth examiner on my defense committee, and Eric Darve for chairing
said committee. I would like to extend appreciation to our wonderful admins, Sue George and Teresa Lynn.
I am grateful to Google, which has supported research that became a critical component of my dissertation
through two internships and a Google PhD Fellowship.
Many others contributed to my personal growth and well-being throughout my studies at Stanford. I
vi

would like to thank Mom, Dad, and Michael for their love, encouragement, and support even when I was half
a world away. I would also like to thank my friends for their unquestionable role in maintaining my sanity.
Finally, I want to thank Caroline Suen for her love, understanding, and support.
It’s been a good ride.
vii

Contents
Abstract iv
Acknowledgements vi
1 Introduction 11.1 Importance of datacenters . . . . . . . . . . . . . . . . . . . . . . . . . . . . . . . . . . . . 1
1.2 Scaling challenges for datacenters . . . . . . . . . . . . . . . . . . . . . . . . . . . . . . . 2
1.3 Datacenter efficiency . . . . . . . . . . . . . . . . . . . . . . . . . . . . . . . . . . . . . . 3
1.4 Challenges for latency-critical applications . . . . . . . . . . . . . . . . . . . . . . . . . . . 4
1.5 Summary of contributions . . . . . . . . . . . . . . . . . . . . . . . . . . . . . . . . . . . 5
2 Motivation and background 72.1 Datacenters . . . . . . . . . . . . . . . . . . . . . . . . . . . . . . . . . . . . . . . . . . . 7
2.1.1 Total Cost of Ownership . . . . . . . . . . . . . . . . . . . . . . . . . . . . . . . . 8
2.2 Scaling for datacenters . . . . . . . . . . . . . . . . . . . . . . . . . . . . . . . . . . . . . 8
2.2.1 Future scaling opportunities . . . . . . . . . . . . . . . . . . . . . . . . . . . . . . 12
2.3 Large-scale latency critical workloads . . . . . . . . . . . . . . . . . . . . . . . . . . . . . 15
2.3.1 Energy proportionality challenges . . . . . . . . . . . . . . . . . . . . . . . . . . . 17
2.3.2 Resource efficiency challenges . . . . . . . . . . . . . . . . . . . . . . . . . . . . . 19
2.4 Questions this dissertation explores . . . . . . . . . . . . . . . . . . . . . . . . . . . . . . . 21
3 Dynamic Management of TurboMode in Modern Multi-core Chips 223.1 Introduction . . . . . . . . . . . . . . . . . . . . . . . . . . . . . . . . . . . . . . . . . . . 23
3.2 TurboMode Background . . . . . . . . . . . . . . . . . . . . . . . . . . . . . . . . . . . . 24
3.3 TurboMode Analysis . . . . . . . . . . . . . . . . . . . . . . . . . . . . . . . . . . . . . . 26
3.3.1 Methodology . . . . . . . . . . . . . . . . . . . . . . . . . . . . . . . . . . . . . . 26
3.3.2 TurboMode for Different Metrics . . . . . . . . . . . . . . . . . . . . . . . . . . . 28
3.3.3 TurboMode for Different Workloads . . . . . . . . . . . . . . . . . . . . . . . . . . 31
3.4 Dynamic TurboMode Management . . . . . . . . . . . . . . . . . . . . . . . . . . . . . . . 35
viii

3.4.1 Overview . . . . . . . . . . . . . . . . . . . . . . . . . . . . . . . . . . . . . . . . 35
3.4.2 Offline Classifier Training . . . . . . . . . . . . . . . . . . . . . . . . . . . . . . . 36
3.4.3 Online autoturbo Operation . . . . . . . . . . . . . . . . . . . . . . . . . . . . . . 39
3.5 Evaluation . . . . . . . . . . . . . . . . . . . . . . . . . . . . . . . . . . . . . . . . . . . . 41
3.6 Related Work . . . . . . . . . . . . . . . . . . . . . . . . . . . . . . . . . . . . . . . . . . 46
3.7 Conclusions . . . . . . . . . . . . . . . . . . . . . . . . . . . . . . . . . . . . . . . . . . . 47
4 Towards Energy Proportionality for OLDI Workloads 484.1 Introduction . . . . . . . . . . . . . . . . . . . . . . . . . . . . . . . . . . . . . . . . . . . 48
4.2 On-line, Data Intensive Workloads . . . . . . . . . . . . . . . . . . . . . . . . . . . . . . . 50
4.2.1 Background . . . . . . . . . . . . . . . . . . . . . . . . . . . . . . . . . . . . . . . 50
4.2.2 OLDI Workloads for This Study . . . . . . . . . . . . . . . . . . . . . . . . . . . . 51
4.2.3 Power Management Challenges . . . . . . . . . . . . . . . . . . . . . . . . . . . . 52
4.3 Energy Proportionality Analysis for OLDI . . . . . . . . . . . . . . . . . . . . . . . . . . . 54
4.3.1 Methodology . . . . . . . . . . . . . . . . . . . . . . . . . . . . . . . . . . . . . . 54
4.3.2 Analysis of Energy Inefficiencies . . . . . . . . . . . . . . . . . . . . . . . . . . . 54
4.3.3 Shortcomings of Current DVFS Schemes . . . . . . . . . . . . . . . . . . . . . . . 57
4.4 Iso-latency Power Management . . . . . . . . . . . . . . . . . . . . . . . . . . . . . . . . . 59
4.4.1 Iso-latency Potential . . . . . . . . . . . . . . . . . . . . . . . . . . . . . . . . . . 59
4.4.2 Using Other Power Management Schemes . . . . . . . . . . . . . . . . . . . . . . . 62
4.5 A Dynamic Controller for Iso-latency . . . . . . . . . . . . . . . . . . . . . . . . . . . . . 63
4.5.1 PEGASUS Description . . . . . . . . . . . . . . . . . . . . . . . . . . . . . . . . . 64
4.5.2 PEGASUS Evaluation . . . . . . . . . . . . . . . . . . . . . . . . . . . . . . . . . 65
4.6 Related Work . . . . . . . . . . . . . . . . . . . . . . . . . . . . . . . . . . . . . . . . . . 71
4.7 Conclusions . . . . . . . . . . . . . . . . . . . . . . . . . . . . . . . . . . . . . . . . . . . 72
5 Heracles: Improving Resource Efficiency at Scale 735.1 Introduction . . . . . . . . . . . . . . . . . . . . . . . . . . . . . . . . . . . . . . . . . . . 73
5.2 Shared Resource Interference . . . . . . . . . . . . . . . . . . . . . . . . . . . . . . . . . . 75
5.3 Interference Characterization & Analysis . . . . . . . . . . . . . . . . . . . . . . . . . . . 77
5.3.1 Latency-critical Workloads . . . . . . . . . . . . . . . . . . . . . . . . . . . . . . . 77
5.3.2 Characterization Methodology . . . . . . . . . . . . . . . . . . . . . . . . . . . . . 78
5.3.3 Interference Analysis . . . . . . . . . . . . . . . . . . . . . . . . . . . . . . . . . . 79
5.4 Heracles Design . . . . . . . . . . . . . . . . . . . . . . . . . . . . . . . . . . . . . . . . . 82
5.4.1 Isolation Mechanisms . . . . . . . . . . . . . . . . . . . . . . . . . . . . . . . . . 82
5.4.2 Design Approach . . . . . . . . . . . . . . . . . . . . . . . . . . . . . . . . . . . . 83
5.4.3 Heracles Controller . . . . . . . . . . . . . . . . . . . . . . . . . . . . . . . . . . . 84
5.5 Heracles Evaluation . . . . . . . . . . . . . . . . . . . . . . . . . . . . . . . . . . . . . . . 87
ix

5.5.1 Methodology . . . . . . . . . . . . . . . . . . . . . . . . . . . . . . . . . . . . . . 87
5.5.2 Individual Server Results . . . . . . . . . . . . . . . . . . . . . . . . . . . . . . . . 89
5.5.3 Websearch Cluster Results . . . . . . . . . . . . . . . . . . . . . . . . . . . . . . . 91
5.6 Related Work . . . . . . . . . . . . . . . . . . . . . . . . . . . . . . . . . . . . . . . . . . 94
5.7 Conclusions . . . . . . . . . . . . . . . . . . . . . . . . . . . . . . . . . . . . . . . . . . . 97
6 Concluding remarks 98
Appendices 100
A OLDIsim: benchmarking scale-out workloads 101A.1 Introduction . . . . . . . . . . . . . . . . . . . . . . . . . . . . . . . . . . . . . . . . . . . 101
A.2 Motivation . . . . . . . . . . . . . . . . . . . . . . . . . . . . . . . . . . . . . . . . . . . . 102
A.3 OLDIsim APIs . . . . . . . . . . . . . . . . . . . . . . . . . . . . . . . . . . . . . . . . . 103
A.3.1 DriverNode . . . . . . . . . . . . . . . . . . . . . . . . . . . . . . . . . . . . . . . 104
A.3.2 QueryContext . . . . . . . . . . . . . . . . . . . . . . . . . . . . . . . . . . . . . . 108
A.3.3 LeafNodeServer . . . . . . . . . . . . . . . . . . . . . . . . . . . . . . . . . . . . 109
A.3.4 ParentNodeServer . . . . . . . . . . . . . . . . . . . . . . . . . . . . . . . . . . . 112
A.4 Implementation details for OLDIsim . . . . . . . . . . . . . . . . . . . . . . . . . . . . . . 119
A.4.1 Event handling . . . . . . . . . . . . . . . . . . . . . . . . . . . . . . . . . . . . . 119
A.4.2 LeafNodeServer load-balancing . . . . . . . . . . . . . . . . . . . . . . . . . . . . 119
A.5 Sample websearch workload . . . . . . . . . . . . . . . . . . . . . . . . . . . . . . . . . . 120
A.6 Conclusions . . . . . . . . . . . . . . . . . . . . . . . . . . . . . . . . . . . . . . . . . . . 122
A.7 Acknowledgements . . . . . . . . . . . . . . . . . . . . . . . . . . . . . . . . . . . . . . . 122
Bibliography 123
x

List of Tables
2.1 James Hamilton’s datacenter TCO model [46]. Basic assumptions are provided by Hamil-
ton based on his experience working for Amazon Web Services and Microsoft Foundation
Services. Monthly expenses are simple monthly payments given an amortization period and
annual interest rate. . . . . . . . . . . . . . . . . . . . . . . . . . . . . . . . . . . . . . . . 9
3.1 Machine configuration summary. . . . . . . . . . . . . . . . . . . . . . . . . . . . . . . . . 27
3.2 Optimal TM settings for each metric/workload class/hardware configuration. . . . . . . . . . 29
3.3 Classifier building results for metrics of interest on various hardware configurations. . . . . . 36
3.4 Classifier building and validation results for Sensitive and Interfering on various hardware
configurations. . . . . . . . . . . . . . . . . . . . . . . . . . . . . . . . . . . . . . . . . . 37
3.5 SPECCPU application properties on SBServer and SBMobile. ILServer is the same as SB-
Server except that leslie3d is also in Sensitive. . . . . . . . . . . . . . . . . . . . . . . . . . 37
4.1 PEGASUS policy for search. . . . . . . . . . . . . . . . . . . . . . . . . . . . . . . . . . . 67
xi

List of Figures
2.1 Breakdown of TCO by category based on assumptions in Table 2.1. . . . . . . . . . . . . . 10
2.2 Average CPU utilizations for large-scale clusters . . . . . . . . . . . . . . . . . . . . . . . 13
2.3 Power as a function of utilization . . . . . . . . . . . . . . . . . . . . . . . . . . . . . . . . 13
2.4 Example topology of Google websearch . . . . . . . . . . . . . . . . . . . . . . . . . . . . 16
2.5 Diurnal user load variation for Google websearch . . . . . . . . . . . . . . . . . . . . . . . 17
2.6 Fraction of CPUs across a Google cluster that is utilized and reserved. . . . . . . . . . . . . 18
2.7 Latency of websearch with cpufreq, showing latency SLO violations. The solid horizontal
line shows the target SLO latency. . . . . . . . . . . . . . . . . . . . . . . . . . . . . . . . 19
2.8 Latency of websearch with a low-priority batch workload, showing latency SLO violations.
The solid horizontal line shows the target SLO latency. . . . . . . . . . . . . . . . . . . . . 20
3.1 Impact of TM on QPS/W and QPS/$ for SPECpower ssj2008 on ILServer and ILServer†. 30
3.2 TM impact on ED, ED2, QPS/W , and QPS/$ metrics for a subset of workloads. . . . . . 32
3.3 TM impact on various efficiency metrics and 95%-ile latency for websearch on SBMobile . . 33
3.4 TM impact on various efficiency metrics and 95%-ile latency for websearch on SBMobile. . 34
3.5 Block diagram of online component autoturbo. . . . . . . . . . . . . . . . . . . . . . . . . 35
3.6 autoturbo’s effect on various workloads for SBMobile. . . . . . . . . . . . . . . . . . . . . 42
3.7 autoturbo’s effect on various workloads for ILServer/SBServer/HServer. . . . . . . . . . . . 43
3.8 autoturbo detecting a phase change and adjusting TM for a SPECCPU mix made of gromacs,
bwaves, gromacs, and GemsFDTD. autoturbo is optimizing for ED2 on SBMobile. . . . . . 44
4.1 Configurations for search and memkeyval. . . . . . . . . . . . . . . . . . . . . . . . . . . . 51
4.2 Example diurnal load and power draw for a search cluster over 24 hours. . . . . . . . . . . . 53
4.3 Total cluster power for search and memkeyval at various loads, normalized to peak power at
100% load. . . . . . . . . . . . . . . . . . . . . . . . . . . . . . . . . . . . . . . . . . . . 55
4.4 CPU power for search and memkeyval at various loads, normalized to peak CPU power at
100% load. . . . . . . . . . . . . . . . . . . . . . . . . . . . . . . . . . . . . . . . . . . . 55
4.5 Characterization of CPU sleep states for search and memkeyval at various utilizations. . . . . 56
xii

4.6 Characterization of latencies of search and memkeyval at various utilizations. The latency for
each service is normalized to the average latency of the service at max load. . . . . . . . . . 57
4.7 Latency of search with cpufreq, showing SLA violations. . . . . . . . . . . . . . . . . . . . 58
4.8 Characterization of search’s latency dependency on both p-state and CPU utilization. . . . . 59
4.9 Characterization of power consumption for search and memkeyval for iso-latency with vari-
ous latency SLO metrics. The SLO target is the latency at peak load (relaxed) . . . . . . . . 60
4.10 Characterization of power consumption for search and memkeyval for iso-latency with vari-
ous latency SLO metrics. The SLO target used is more aggressive compared to Figure 4.9. . 61
4.11 Comparison of iso-latency with core consolidation to RAPL. Measured total cluster power
consumed by search at various utilizations, normalized to peak power at 100% load. . . . . . 63
4.12 Block diagram showing high level operation and communication paths for PEGASUS. . . . 65
4.13 Results of running PEGASUS for search on the small cluster. . . . . . . . . . . . . . . . . . 66
4.14 Results of running PEGASUS for search on the full production cluster. . . . . . . . . . . . . 69
4.15 Estimation of power when using distributed PEGASUS. . . . . . . . . . . . . . . . . . . . . 70
5.1 Impact of interference on shared resources on websearch, ml cluster, and memkeyval. . . . . 80
5.2 The system diagram of Heracles. . . . . . . . . . . . . . . . . . . . . . . . . . . . . . . . . 84
5.3 Characterization of websearch showing that its performance is a convex function of cores and
LLC. . . . . . . . . . . . . . . . . . . . . . . . . . . . . . . . . . . . . . . . . . . . . . . . 88
5.4 Latency of LC applications co-located with BE jobs under Heracles. For clarity we omit
websearch and ml cluster with iperf as those workloads are extremely resistant to network
interference. . . . . . . . . . . . . . . . . . . . . . . . . . . . . . . . . . . . . . . . . . . . 90
5.5 EMU achieved by Heracles. . . . . . . . . . . . . . . . . . . . . . . . . . . . . . . . . . . 91
5.6 DRAM bandwidth of system when LC applications co-located with BE jobs under Heracles. 92
5.7 CPU utilization of system when LC applications co-located with BE jobs under Heracles. . . 93
5.8 CPU power of system when LC applications co-located with BE jobs under Heracles. . . . . 94
5.9 Network bandwidth of memkeyval under Heracles. . . . . . . . . . . . . . . . . . . . . . . 95
5.10 Latency SLO and effective machine utilization for a websearch cluster managed by Heracles. 95
A.1 Scaling behavior of OLDIsim on a CMP system. . . . . . . . . . . . . . . . . . . . . . . . . 104
A.2 Different types of nodes in OLDIsim . . . . . . . . . . . . . . . . . . . . . . . . . . . . . . 105
A.3 Callbacks.h relevant to DriverNode . . . . . . . . . . . . . . . . . . . . . . . . . . . . 105
A.4 Relevant methods in DriverNode class . . . . . . . . . . . . . . . . . . . . . . . . . . . . . 106
A.5 Relevant methods in TestDriver class . . . . . . . . . . . . . . . . . . . . . . . . . . . . . . 107
A.6 Sample DriverNode code . . . . . . . . . . . . . . . . . . . . . . . . . . . . . . . . . . . . 108
A.7 Relevant members of QueryContext class . . . . . . . . . . . . . . . . . . . . . . . . . . . 108
A.8 Callbacks.h relevant to LeafNodeServer . . . . . . . . . . . . . . . . . . . . . . . . . . 109
A.9 Relevant methods in LeafNodeServer class . . . . . . . . . . . . . . . . . . . . . . . . . . 110
xiii

A.10 Sample LeafNodeServer code . . . . . . . . . . . . . . . . . . . . . . . . . . . . . . . . . 112
A.11 Callbacks.h relevant to ParentNodeServer . . . . . . . . . . . . . . . . . . . . . . . . . 113
A.12 Relevant methods in ParentNodeServer class . . . . . . . . . . . . . . . . . . . . . . . . . . 114
A.13 Relevant code in FanoutManager.h . . . . . . . . . . . . . . . . . . . . . . . . . . . . 115
A.14 Sample ParentNodeServer code . . . . . . . . . . . . . . . . . . . . . . . . . . . . . . . . . 118
A.15 Different types of nodes in OLDIsim . . . . . . . . . . . . . . . . . . . . . . . . . . . . . . 120
A.16 Workload topology for websearch . . . . . . . . . . . . . . . . . . . . . . . . . . . . . . . 120
A.17 PDF and CDF of Γ(α = 0.7, β = 20000) . . . . . . . . . . . . . . . . . . . . . . . . . . . 121
A.18 Comparison of latency between Google websearch and websearch on OLDIsim. . . . . . . . 121
xiv

List of Algorithms
3.1 autoturbo control loop. . . . . . . . . . . . . . . . . . . . . . . . . . . . . . . . . . . . . . . 40
5.1 High-level controller. . . . . . . . . . . . . . . . . . . . . . . . . . . . . . . . . . . . . . . . 85
5.2 Core & memory sub-controller. . . . . . . . . . . . . . . . . . . . . . . . . . . . . . . . . . 87
5.3 CPU power sub-controller. . . . . . . . . . . . . . . . . . . . . . . . . . . . . . . . . . . . . 89
5.4 Network sub-controller. . . . . . . . . . . . . . . . . . . . . . . . . . . . . . . . . . . . . . 89
xv

Chapter 1
Introduction
1.1 Importance of datacenters
Web services are an integral part of today’s society, with billions of people using the Internet regularly. The
Internet’s popularity is in no small part due to the near-instantaneous access to large amounts of personalized
information. Online services such as web search (Bing, Google), social networking (Facebook, Twitter,
LinkedIn), online maps (Bing Maps, Google Maps, NavQuest), machine translation (Bing Translate, Google
Translate), and webmail (GMail, Outlook.com) are all portals to vast amounts of information, filtered to
only show relevant results with sub-second response times. The new services and capabilities enabled by
these services are also responsible for huge economic growth, with studies estimating that the Internet is
responsible for contributing $1.7 trillion towards the global GDP and a 21% growth in the GDP of developed
nations [103].
Large-scale datacenters hosting Warehouse-Scale Computers (WSCs) are responsible for hosting the vast
majority of these online services. Microsoft in 2013 announced that it has 1 million servers, while studies have
estimated that Google owned approximately 1 million servers in 2011. These servers are spread out across
the world for locality and redundancy reasons into many datacenters, with a single datacenter containing
around 50,000 servers. These millions of servers in datacenters worldwide cost significant amounts of money
to build and operate, and also consume considerable amounts of electricity for power and cooling. In 2015,
Apple was reported to invest $2 billion into the construction of a single datacenter alone [157]. World-wide,
datacenters were estimated to consume the equivalent power output of 30 large nuclear power plants [38]. Put
another way, datacenters consume approximately 1% of the total amount of electricity generated world-wide.
Though both the scale of datacenters and the scale of their resource requirements are daunting, datacenters
are very efficient in terms of compute capability per dollar. Through economies of scale, the cost per unit
computation is far cheaper for a datacenter than a commodity PC. In addition, very large application such as
search and social networking require large clusters of hundreds to thousands of servers: there is too much
data and computation for such an application to fit on a single server or even a small rack of servers [6].
1

CHAPTER 1. INTRODUCTION 2
While datacenters are already large, complex, and power-hungry, they are projected to grow in the future
due to increasing demand for Internet services. Global Internet penetration in 2014 is currently estimated at
around 40%, leaving significant room for growth. In addition, online services are becoming more compu-
tationally intensive over time to provide more personalized access to information. Large-scale data-mining
and machine learning are being used more widely in various web applications, such as using deep learning to
improve the accuracy of online maps [39]. The growth of users combined with the increasing computational
complexity of workloads translates to growing demand for datacenters. A study performed by Cisco in 2013
estimates that the number of workloads running in datacenters will nearly double from 2013 to 2018 [20].
1.2 Scaling challenges for datacenters
Large-scale datacenters have been enabled by the economics of co-locating massive amounts of compute,
networking, and storage in a single facility. By taking advantage of economies of scale while purchasing
equipment for datacenters, large datacenter operators are able to negotiate for bulk-volume discounts on
hardware. In addition, the large scale of datacenters and the associated electricity consumption enables
datacenter operators to obtain better pricing on electricity by purchasing it at wholesale rates. The growth in
datacenter computing has been fueled by the favorable economics of building and operating large datacenters,
as the marginal costs of performing computation is far outstripped by the profits of operating popular web
services.
Unfortunately, there are several challenges for the continued scaling of the capabilities of datacenters.
The growth of datacenters have been driven by two factors. The first is the cost reduction of operating
a datacenter, and the second is the increasing capability of datacenters. However, previous approaches to
scale datacenters are either one-time tricks or are encountering scaling issues. On the cost reduction side,
a technique was to build the servers in-house and to strip out unnecessary components to reduce cost, but
this was a one-time trick. Another cost reduction technique was to improve the efficiency of power delivery
and cooling of datacenters, but this approach is facing diminishing returns as better datacenter designs have
pushed the amount of wasted electricity to a very small fraction of total datacenter power.
On the other hand, methods to continue scaling of the compute capabilities of datacenters are also running
out of steam. There are two ways to grow the amount of computational capacity: either increase the number of
datacenters or increase the computational power of a single datacenter. Increasing the number of datacenters
is a very expensive proposition, given that a large datacenter can cost billions of dollars to build. Scaling the
capability of a datacenter by adding additional servers is economically infeasible, due to the costs of scaling
power delivery infrastructure above approximately 50MW for a single datacenter facility [88]. The last tool
in scaling the capability of datacenters has been that of Moore’s Law combined with Dennard scaling, where
shrinking the node size leads to a 2.8× increase in the compute capability without a substantial increase in
cost or power consumption [88]. However, Dennard scaling has greatly slowed past the 90nm node [30], thus
greatly reducing the inter-generational intrinsic growth rate of CPU compute capability for future datacenters.

CHAPTER 1. INTRODUCTION 3
With the increasing difficulty of reducing the costs of datacenters and improving the capabilities of data-
centers, new approaches for scaling are needed. One promising avenue is to examine today’s datacenters and
to improve the efficiency of the servers and the applications running on datacenters. Previous approaches of
improving the economics of datacenters have mostly ignored the internals of servers and workloads, instead
focusing on externals such as power delivery or on the economy of purchasing additional servers. Since
previous approaches are no longer providing the same scaling benefits that they once did, a fresh look at
improving the efficiency of servers and workloads is warranted. There are two opportunities we focus on in
this dissertation: improving efficiency of components that contribute to the operational expenses (OpEX) and
the efficient use of costs that comprise the capital expenses (CapEX) of datacenters.
1.3 Datacenter efficiency
A promising avenue of increasing the capabilities of future datacenters is to improve the efficiency of data-
centers. By making better use of resources such as servers and electricity, improved efficiency can lead to
increased capability without raising costs. Thus, higher datacenter efficiency is key to enabling the growth
of datacenters for the expanding number of Internet users as well as the increasing computational demand
placed on datacenters. There are three sources of efficiency that we examine in this thesis: peak energy ef-ficiency, energy proportionality, and resource efficiency. The first two, peak energy efficiency and energy
proportionality, are a direct way of improving the OpEX of a datacenter. The last one, resource efficiency,
will improve the CapEX of datacenters.
Peak energy efficiency is about reducing the amount of electrical power used when servers are running
at peak load. By lowering the peak electricity consumption of servers, datacenters can be provisioned for less
peak power, lowering the power infrastructure costs as well as the maximum electricity bill. Alternatively,
more servers can be packed into the same power footprint, leading to increased computational density. An
example of this technique is the exploration of low-power architectures, such as ARM cores, in the datacenter.
Datacenter operators are primarily interested in the amount of power consumed to meet a certain performance
target, which is captured by composite energy efficiency metrics that combine power/energy with latency or
performance. Ironically, the use of low-power cores alone can actually hurt energy efficiency, as shown in a
study that examined the use of Intel Atom cores for Bing search [71].
While peak energy efficiency focuses on reducing the amount of power used at peak load, energy pro-portionality focuses on improving the power used at lower loads. Ideal energy proportionality behavior is
that a server consumes X% power when running at X% load. In other words, a server consumes no power
when idle, peak power when running at maximum load, and the power vs. load curve would be a straight
line between those two points. Unfortunately, servers in datacenters are both un-energy proportional and
underutilized, leading to massive amounts of wasted electricity [98]. By improving energy proportionality,
the electricity costs of operating a datacenter will be reduced by a significant amount. Previous approaches
on improving energy proportionality in datacenters have focused on putting idle machines into a deep sleep

CHAPTER 1. INTRODUCTION 4
state to reduce idle power while running active machines at high load [109].
Finally, resource efficiency looks at improving the utilization of resources within a datacenter. Today’s
datacenters are operated at a low average utilization, ranging from 10% in Amazon’s EC2 [95] to 20% for
Twitter [29] and 30% for Google [7]. This underutilization represents a significant fraction of wasted compute
capability and the associated costs in purchasing said capability. Thus, increasing resource efficiency leads to
an increase in both capability and cost efficiency for datacenters. Furthermore, improving resource efficiency
is the only way to improve cost efficiency, as the only way to recoup infrastructure costs is to make use of the
infrastructure. Prior work on improving resource efficiency has been through improved cluster management
and scheduling techniques, such as Borg [155] and Mesos [51] that perform bin-packing of workloads.
1.4 Challenges for latency-critical applications
Many online services, such as websearch, social networking, webmail, etc. fall under a category of workloads
called large-scale latency-critical workloads. These workloads all share two common characteristics. The
first is that the data is sharded across many servers, thus requiring an architecture where all individual servers
must respond before a final result can be generated. The second common characteristic is that the workload
is ultimately user-facing and thus has a strict end-to-end latency constraint on the order of hundreds of mil-
liseconds. Thus, large-scale latency critical workloads place very tight latency constraints on the tail-latency
of each individual server, as the slowest server in the entire ensemble determines the overall query time.
Due to the strict latency constraints, large-scale latency-critical workloads pose a unique set of challenges
towards increasing efficiency of the datacenter. This is because of the fundamental trade-off between effi-
ciency and low latency. On the energy efficiency side, it is well understood that there is a Pareto frontier
representing the trade-offs between latency and energy, where speeding up a computation to achieve lower
latency requires larger and larger amounts of energy. Furthermore, investigating composite energy efficiency
metrics shifts the optimum point on the Pareto frontier even further, complicating efforts to identify the most
efficient operating point.
On the energy proportional side, recent research [98] has shown that servers running latency-critical work-
loads are terribly energy inefficient when running at low loads, with efficiencies lower than what previous
models that account for idle power suggest [6]. By improving energy proportionality to match the linear
power models, significant energy savings can be achieved at lower utilizations. However, there are significant
challenges in reducing the energy consumed by the server without negatively impacting the latency guaran-
tees of the latency-critical workload. Previous work has attempted to use active low-power modes for CPUs to
reduce power at low loads, but this approach causes unacceptable latency violations. This is because previous
approaches are designed for batch or real-time workloads, which have a vastly different set of performance
assumptions compared to latency-critical workloads.
Finally, latency-critical workloads also pose many challenges for increasing resource efficiency. Latency-
critical workloads, because of their user-facing nature, are subject to diurnal load variations and thus are not

CHAPTER 1. INTRODUCTION 5
fully utilized throughout the entire day. Moreover, latency-critical workloads are typically run on dedicated
servers or with greatly exaggerated resource reservations in order to avoid inter-workload interference [28].
This is because existing techniques to mitigate interference, such as OS process scheduling and process
isolation via containers or virtual machines, do not protect against performance degradation. Remaining
sources of interference in the system, such as in shared caches and network links, can cause latency-critical
workloads to miss their latency targets even when they are under low load. Thus, the typical approach used
by cluster managers to handle interference is to make the problem go away by throwing resources at latency-
critical workloads until interference is no longer an issue.
1.5 Summary of contributions
In this dissertation, we show that there exists a huge opportunity to expand the capabilities of datacenters by
increasing the efficiency of existing datacenters. We demonstrate that large improvements in efficiency can
be obtained by combining information about workloads with the intelligent use of hardware. We focus on
the three efficiency metrics described earlier: peak energy efficiency, energy proportionality, and resource
efficiency.
First, we present autoturbo, a dynamic controller that uses machine learning to improve energy efficiency
for both batch and latency-critical workloads at peak loads. Autoturbo chooses the best setting of TurboMode,
an opportunistic overclocking mechanism found on modern multi-core processors, to optimize for a given
energy efficiency metric. Through controlling TurboMode, autoturbo essentially manages the frequency and
voltage of CPUs, two critical parameters for determining the performance and power consumption for CPUs.
By using an efficiency model trained on a small set of benchmarks, autoturbo can optimize for both energy
efficiency and composite efficiency metrics such as throughput per Watt and Energy Delay Squared Product
(ED2) without a priori knowledge of new workloads. We show that autoturbo can select the proper setting
of TurboMode the vast majority of the time, realizing gains of up to 68% on ED2 compared to statically
leaving TurboMode off while avoiding losses of 25% that are caused by statically enabling TurboMode. We
further demonstrate the generalizability of autoturbo to different generations of CPUs from several processor
vendors.
Second, we investigate the unexpectedly poor energy efficiency of latency-critical workloads at low uti-
lizations. We show that a significant amount of energy is wasted to process queries faster than the Service
Level Objective (SLO) for latency-critical workloads at low loads. We then demonstrate that the failure of
previous approaches, such as schemes managing active low power modes for CPUs, is due to the lack of
end-to-end latency information from the workload and the lack of a fine-grained power control mechanism.
We finally show that using latency information from the workload to manage a fine-grained power control
mechanism will lead to significant improvements in energy proportionality. This is achieved thorough an
iso-latency power management policy that slows down the CPU while keeping the latency-critical workload
running just fast enough to meet its SLO. We then implement PEGASUS, a dynamic real-time controller that

CHAPTER 1. INTRODUCTION 6
realizes the iso-latency policy. An evaluation of PEGASUS on production hardware at Google with various
latency-critical workloads show a potential power savings of up to 40% during periods of low load while
maintaining without violating the latency SLO.
Finally, we extend the concept of iso-latency to improving resource efficiency. In large datacenters, there
is an abundance of work that can be done, yet the average utilization of the datacenter is low because of
latency-critical workloads. We characterize all potential interference sources for several production latency-
critical workloads at Google, and demonstrate the need for a dynamic controller that isolates all shared
resources on each server. We then describe an implementation of such a controller, Heracles, which uses la-
tency feedback from the latency-critical workload in order to simultaneously manage several shared resources
in real-time using both hardware and software mechanisms. Heracles is then able to raise utilization by filling
in idle resources with best-effort batch jobs while ensuring that the latency-critical workload meets its SLO.
We evaluate Heracles on production Google hardware with several mixes of high-priority latency-critical and
low-priority batch jobs and demonstrate an average utilization of 90% without violating the latency guaran-
tees of the latency-critical application.

Chapter 2
Motivation and background
2.1 Datacenters
Web services are an integral part of today’s society, with the International Telecommunications Union esti-
mating that there 3 billion regular users of the Internet in 2014 [66]. The Internet’s popularity is in no small
part due to the near-instantaneous access to large amounts of personalized information. Online services such
as web search (Bing, Google), social networking (Facebook, Twitter, LinkedIn), online maps (Bing Maps,
Google Maps, NavQuest), machine translation (Bing Translate, Google Translate), and webmail (GMail,
Outlook.com) are all portals to vast amounts of information, filtered to only show relevant results with sub-
second response times. As an example of the daunting scale of online services, there are estimates that show
that the size of Google’s search index in 2015 encompasses over 45 billion webpages [24]. The new services
and capabilities enabled by these services are also responsible for huge economic growth, with studies esti-
mating that the Internet is responsible for contributing $1.7 trillion towards the global gross domestic product
(GDP) and a 21% growth in the GDP of developed nations in 2009. Furthermore, Internet services account
for 3.4% of GDP across large economies that make up 70% of the world’s GDP. If the Internet was a single
sector, its contribution would outweigh that of agriculture and utilities [103].
Large-scale datacenters housing Warehouse-Scale Computers (WSCs) are responsible for hosting the vast
majority of these online services. These datacenters are favored by the economies of scale that come with
building and operating tens of thousands of servers in a single facility. The large capacities of datacenters are
driven by the dual necessities of operating over an extremely large dataset with near instantaneous response
times. For example, Google web search stores its document index in DRAM for low latency responses, but
an index of tens of billions of webpages cannot possibly fit on a single machine. Thus, a single Google
websearch instance spans across thousands of machines [98]. When scaled to handle multiple online services
to handle load for a global audience, the scale of resources invested in datacenters worldwide is breathtaking.
Microsoft in 2013 announced that it has 1 million servers, while studies have estimated that Google owned
approximately 1 million servers in 2011. These servers are spread out across the world for locality and
7

CHAPTER 2. MOTIVATION AND BACKGROUND 8
redundancy reasons into many datacenters, with a single datacenter containing around 50,000 servers. These
millions of servers in datacenters worldwide cost significant amounts of money to build and operate, and also
consume considerable amounts of electricity for power and cooling. In 2015, Apple was reported to invest
$2 billion into the construction of a single datacenter alone [157]. World-wide, datacenters were estimated
to consume the equivalent power output of 30 large nuclear power plants [38]. Put another way, datacenters
consume approximately 1% of the total amount of electricity generated world-wide.
2.1.1 Total Cost of Ownership
The move towards consolidating computation into dense datacenters is driven by the financial bottom line for
operators of online services. By concentrating servers into datacenters, economies of scale are achieved for
purchasing and operating servers, networking equipment, power distribution infrastructure, cooling equip-
ment, and other facilities. In addition, datacenters also consolidate the consumption of electricity from the
electrical grid, enabling operators to purchase electricity at wholesale rates.
One common metric for measuring the cost of datacenters it the Total Cost of Ownership, or TCO. Dat-
acenter TCO is broken down into two components, CapEX and OpEX. CapEX, or capital expenditures,
are the sum total of the costs of purchasing capital equipment for the datacenter. CapEX includes the costs
of servers, networking gear (such as routers and switches), cooling infrastructure (such as chillers and air
handlers), power delivery infrastructure (such as power distribution units at the racks, backup batteries, and
emergency generators), and the actual facility itself (such as real-estate costs). The costs of operating the
equipment (such as electricity for the servers, networking gear, cooling infrastructure, and power lost in inef-
ficiencies of the power delivery infrastructure), interest on loans used to pay for capital equipment, and salary
for employees working in datacenters are included in OpEX.
To illustrate the TCO breakdown of a datacenter between its various CapEX and OpEX parts, we use the
TCO model from James Hamilton [46]. We show the assumptions used in Hamilton’s model in Table 2.1 and
the TCO breakdown resulting from that model in Figure 2.1. Hamilton’s model suggests that the vast majority
of costs in a datacenter is related to the costs of buying servers, with energy accounting for only 31% of the
TCO of the datacenter and networking a mere 8%. Of the energy costs, 18% goes to CapEX for cooling and
power delivery and the remaining 13% going to OpEX costs for the electricity bill. Improving peak energy
efficiency improves the entire 31% portion of TCO, while energy proportionality would only improve the
OpEX portion for energy costs. In addition, improving the energy efficiency of datacenters skews the cost
distribution more heavily towards CapEX for servers and networking, which comprise the other 70% of TCO
for a datacenter.
2.2 Scaling for datacenters
Projections for future demand on the computational capabilities indicate a continued growth for the already
staggering capabilities of datacenters. This is due to several factors. The first is that there is still ample room

CHAPTER 2. MOTIVATION AND BACKGROUND 9
(a) Basic Datacenter Assumptions
Size of facility (critical load) 8,000,000 WCost of power ($/kW-hr) $0.07
Cost per critical watt in $/W $9Watts per server 165Cost per server $1,450
Average critical load usage 80%Power usage effectiveness (PUE) 1.45
Power and cooling costs as a percentage of facility costs 82%(b) Financial Assumptions
Annual interest rate 5%Facility amortization 10 yearsServer amortization 3 years
Network amortization 4 yearsNetworking gear discount 60%
(c) Networking Gear
Layer Equipment Count Price PowerBorder Cisco 7609 2 $362,000 5,000 W
Core Cisco 6509E 2 $500,000 5,000 WAggregation Juniper Ex8216 22 $750,000 10,000 W
Access Cisco 3560-48TD 1,150 $11,995 151 WTotal $12,807,300 413,650 W
(d) Monthly Expenses
Servers $1,998,097Networking $294,943
Power/Cooling $626,211Energy $474,208
Other $137,461
Table 2.1: James Hamilton’s datacenter TCO model [46]. Basic assumptions are provided by Hamilton basedon his experience working for Amazon Web Services and Microsoft Foundation Services. Monthly expensesare simple monthly payments given an amortization period and annual interest rate.
for the number of Internet users to grow. Global Internet penetration in 2014 is around 40%, meaning that
that number of potential Internet users can more than double. In addition, online services are becoming more
computationally intensive in order to provide more relevant and personalized access to information for users.
Recently, large-scale data-mining and machine learning techniques are being integrated into various web
applications. For instance, large-scale facial recognition is being used by Facebook for automatic tagging of
friends in uploaded photos. Google has started using deep learning to improve the accuracy of online maps
by reading street numbers from Street View imagery [39]. Future algorithms, such as automatic captioning
of images [77, 156], would require even more computational power.

CHAPTER 2. MOTIVATION AND BACKGROUND 10
57%
8%
18%
13%4%
Servers
NetworkingEquipment
Power Distribution& Cooling
Power
OtherInfrastructure
TCO breakdown
Figure 2.1: Breakdown of TCO by category based on assumptions in Table 2.1.
Up until the present, economically scaling the capabilities of datacenters has primary relied on computa-
tion becoming cheaper over time. Historically, the growth of datacenters have been driven by reductions in
the CapEX or OpEX of the datacenter or by relying on chip vendors to produce CPUs with better performance
for the same cost and power budget.
Since servers are the single largest contributor to TCO (57% in Hamilton’s model), operators of large
datacenters have found ways of reducing the costs of servers. The singularly most effective cost reduction
technique for servers was to switch from purchasing servers from vendors such as Dell or HP to buying com-
modity servers from original design manufacturers. This approach was first widely used at Google and has
seen wide adoption in the industry as well, with Facebook and Microsoft releasing their server designs to
the Open Compute project. By designing their own servers, datacenter operators are able to strip out unnec-
essary components such as optical drives and front panel bezels to minimize component costs. In addition,
purchasing servers directly from original design manufacturers remove the server vendors as middlemen,
further streamlining costs. The switch to commodity servers has proven quite effective at reducing TCO. In a
hypothetical case study, Barroso et al. calculate that using commodity servers can achieve a 42% savings on
amortized 3-year TCO compared to high end servers from Dell [6]. The switch to commodity servers, while
extremely effective at reducing CapEX, is nevertheless a trick that can only be used once.
Reductions in the OpEX of datacenters have revolved around improving the energy efficiency of datacen-
ters, as the costs for operational staff in a datacenter are negligible. Historically, much power in a datacenter

CHAPTER 2. MOTIVATION AND BACKGROUND 11
is “wasted” on equipment that do not directly contribute to computation, namely on power distribution infras-
tructure and facility cooling. For example, a traditional datacenter architecture for backup power involving
a centralized Uninterruptible Power Supply (UPS) adds an extra 17% power overhead [49]. The amount of
power wasted on non-compute power is typically captured in terms of Power Utilization Efficiency, or PUE.
PUE is defined as the total power consumed by the datacenter facility divided by the total critical power.
For example, a hypothetical datacenter sized for 5MW of critical power may consume a total of 8MW when
power delivery losses and cooling is included, leading to a PUE ratio of 8MW5MW = 1.6. While the industry
average PUE is 1.8-1.9, modern large datacenters are able to achieve a PUE of almost 1.1 [6, 42]. This is
due to techniques such as distributing backup batteries to each server, isolating hot/cold aisles for cooling,
and situating datacenters in naturally cool climates so cooling the datacenter is as simple as “opening the
windows” [6]. Given that PUEs are already so low for large datacenters, there is diminishing returns for
improving PUE further: a PUE of 1.1 means that there can be at most a 10% gain in improving facility
efficiency.
Scaling the capabilities of datacenters can be done by onlining additional datacenters or by increasing the
capacity of existing datacenters. Both of these propositions have their own set of challenges. Large datacen-
ter tend to be sited in locations with cool climates for energy efficiency, proximity to base-load generating
power stations for cheaper electricity rates, as well as closeness to major fiber nodes. Locations with these
desirable properties are rare, and so scaling up the number of datacenters might lead to suboptimal place-
ments of future datacenters. In addition, there is significant financial and regulatory risk in the placement
of new datacenters [27]. The challenges with scaling up the capacity of datacenters lie in the difficulty of
provisioning additional space and power within an existing datacenter. Unless the existing datacenter was
already provisioned for additional capacity, adding new servers will incur costs of purchasing new racks,
PDUs, and networking equipment; furthermore, the new servers will also need power delivery and cooling
equipment. Finally, there are practical limits to the size of datacenters due to physical, regulatory, and power
utility considerations [27].
One elegant technique used to scale the capability of datacenters is to rely on processor vendors to produce
CPUs with higher performance but with the same cost and power budget. Historically, this trend has been
enabled by a combination of Moore’s Law and Dennard scaling. Every two years, Moore’s Law yields
a doubling of transistor count, which we can optimistically assume yields a doubling of performance due
to more cores. In the same period of time, Dennard scaling also yields a frequency multiplier of 1.4×,
a gate capacitance multiplier of 0.7×, and a threshold voltage multiplier of 0.7× due to smaller feature
size [30]. These multipliers combine to produce a performance increase of 2.8×, but the smaller capacitance
and threshold voltages cancel out the power cost of achieving higher performance. This allows datacenter
operators to have a longer-term amortization schedule for datacenter facilities compared to servers, as a newer
generation of servers will feature 2.8× the performance with the same power budget. Unfortunately, Dennard
scaling has challenges past the 90nm node due to sub-threshold leakage becoming a dominant power term at
lower supply voltages [30]. This means that for the foreseeable future, new generations of CPUs can at best

CHAPTER 2. MOTIVATION AND BACKGROUND 12
achieve a 40% increase in compute capability for the same power budget [88].
2.2.1 Future scaling opportunities
With the slowdown in capacity scaling from previous techniques, we need to find new ways of increasing
datacenter capacity to handle the projected growth in datacenter load. One such opportunity is to increase the
efficiency of the servers themselves. PUEs of large datacenters are approaching 1.0, indicating that the vast
majority of energy used by a datacenter is going to the servers themselves. In addition, the hardware cost
of servers is the single largest component of datacenter TCO, implying that servers ought to be used at high
utilization to be cost efficient. There are many ways for the efficiency of servers to be improved from the
perspective of energy efficiency and resource efficiency.
There are several energy efficiency metrics to capture the efficiency of servers. We first look at a group
of metrics that capture peak load efficiency. Intuitively, these metrics measure the energy efficiency of the
server when the server is running at 100% load, which leads to maximum power consumption of the server.
Peak load energy efficiency metrics include simple metrics such as throughput per Watt, which is equivalent
to computations per Joule and measures the amount of energy that is spent on processing a single task. In
addition to these simple metrics, there are also composite metrics such as Energy Delay Product (ED) and
Energy Delay Squared Product (ED2). ED and ED2 are used when the latency of the computation needs
to be factored into the total energy cost. These metrics are appropriate when users interact with the system,
as users would like to have their batch jobs finish somewhat quickly and to have results to their websearch
queries in less than a second. Improving peak energy efficiency would improve both the CapEX and OpEX
portions of energy’s contribution to datacenter TCO.
Peak load efficiency is important for large scale batch systems, which can be run at very high utilizations
with distributed computation frameworks such as Hadoop [151] or Spark [149]. Applications running on
these frameworks can be scaled to run on all cores across many servers, resulting in high utilization. Un-
fortunately, large datacenters are not actually utilized at high loads. Studies that look at individual server
utilization in an entire fleet over time at large datacenter operators show that the vast majority of servers are
lightly utilized. Average utilizations of 20%-30% (Figure 2.2) are the norm, where it is the exception rather
than the rule for servers to run at utilizations above 90%.
Thus, in addition to peak energy efficiency, we must also examine the energy efficiency of servers at
other operating points. The widely accepted standard for measuring this efficiency is to compare the power
consumed by servers to an idealized energy proportional model. The power used by a server can be broken
into two components: static power and dynamic power. Static power is composed of power that is needed to
keep an idle server powered on and ready to execute work at a moment’s notice, such as fan power, DRAM
refresh, and static leakage of CMOS circuits in the CPU, cache, and memory. Dynamic power is the amount
of power actually spent in performing work, such as power consumed in the CPU to execute instructions,
power to read and write data from DRAM and disk, and power spent by the network interface to receive and
transmit packets.

CHAPTER 2. MOTIVATION AND BACKGROUND 13
Google avg. util.
30% avg. utilization
(a) Average CPU utilization at Google [6]
Twitter avg. util.
20% avg. utilization
(b) Average CPU utilization at Twitter [29]
Figure 2.2: Average CPU utilizations for large-scale clusters
0% 20% 40% 60% 80% 100%
Pow
er
Utilization
Power vs. utilization
Pidle
Pactive
(a) Ideal energy proportionality
0% 20% 40% 60% 80% 100%
Pow
er
Utilization
Power vs. utilization
Pactive
PidleStatic power
Dynamic power
(b) Model for an example server
Figure 2.3: Power as a function of utilization
An ideal energy proportional server would have no static power component (Pidle = 0), and thus its
power consumption vs. load would be a straight line (Power ∝ Load) as in Figure 2.3a. However, real
servers have a fairly substantial idle power component, as shown in Figure 2.3b. This is because of the large
amount of power needed to keep a server on standby. Servers with large fractions of idle static power (e.g.
Pidle = 0.5Pactive) are not uncommon [6, 88]. Because of the low utilization of servers, static power can
come to dominate the overall energy consumption of a datacenter. Thus, improving the energy proportional
behavior of servers can lead to large savings in total energy. A study that simulated the energy consumption
of a cluster demonstrated that a reduction of Pidle from 0.5Pactive to 0.1Pactive can save up to 35-40% on
datacenter energy [34]. Thus, improving the energy proportionality of servers can yield a substantial savings
in OpEX through a reduction in electricity consumption.

CHAPTER 2. MOTIVATION AND BACKGROUND 14
Finally, there exists a significant opportunity to improve the resource efficiency of datacenters. Resource
efficiency is a measure of how well the compute capacity of the datacenter is actually utilized in a day-to-
day setting, and is directly measured as the utilization of the servers. Therefore, low utilization of servers
in the datacenter has a direct negative impact on the realized capacity of a datacenter. Even if a datacenter
can theoretically handle a large amount of work, the theoretical peak utilization is a moot point if it cannot
be practically achieved. Thus, improving the utilization of servers in a datacenter corresponds to a one-to-
one increase of the realized capability of a datacenter. Recall from Figure 2.2 that the average utilization
of servers is 20-30%. Thus, assuming conservatively that utilization can be raised to 90%, the computing
power of the datacenter has effectively tripled or quadrupled. From an economic standpoint, improving
the utilization of existing servers in a datacenter is equally desirable. In the analysis of datacenter TCO,
increasing the utilization of servers is the only way to recover the money invested into the CapEX of the
datacenter. From Hamilton’s model, CapEX accounts for 87% of the TCO of a datacenter. An average
utilization of 20%-30% translates to an approximate wastage of 70%-80% of CapEX, for a total waste of
60%-70% of datacenter TCO. When a single large datacenter can cost $2 billion to build [157], wasting over
$1 billion is very difficult to ignore. Furthermore, improving the utilization of servers also positively impacts
overall datacenter energy efficiency. This is because of the poor energy proportionality of modern servers,
meaning that servers are more energy efficient when running at higher loads. Thus, improving the resource
efficiency of servers by raising utilization is very advantageous, as it improves both the capability and the
energy efficiency of the datacenter.
Related work for improving efficiency
Improving the efficiency of servers, and of computers in general, is not a new field. On the energy effi-
ciency side, a significant amount of work has gone into designing more energy efficient architectures, such
as low-power mobile cores [71]. In addition, there is significant work on improving overall energy efficiency
by managing an “ensemble” of servers together [131]. To improve energy proportionality, several systems
have been proposed to coalesce long periods of idleness where the servers can be put into deep sleep modes,
effectively removing the idle power term [109]. Another approach to improve energy proportionality is to use
Dynamic Voltage Frequency Scaling (DVFS), where components of the server are operated at lower perfor-
mance to save power during periods of low load. DVFS has been shown to work well on throughput-oriented
batch jobs [37, 62, 81, 84, 129, 142, 160] as well as real-time workloads [4, 93, 122, 135, 141]. Finally, for
resource efficiency, there are several cluster managers used in production systems that attempt to maximize
the utilization of servers by bin-packing work into them, such as Google’s Borg and the open-source Mesos
project [51,155]. There is also substantial work on improving these cluster managers with interference-aware
scheduling techniques, as found in Paragon, Quasar, BubbleUp, and BubbleFlux [28, 29, 104, 163]. Unfor-
tunately, these many techniques to improve efficiency do not interact well with a large-class of datacenter
workloads: that of large-scale latency-critical workloads, which we will describe in Section 2.3.
At first blush, it may seem this dissertation is yet another thesis on improving efficiency of computer

CHAPTER 2. MOTIVATION AND BACKGROUND 15
systems. However, we note that previous efforts to improve efficiency do not directly deal with large-scale
latency-critical workloads running on warehouse scaling computers. Large-scale latency-critical workloads
have a unique set of requirements that render previous techniques ineffective, which we will describe in
Section 2.3. This dissertation expands upon previous work to to unlock huge efficiency gains for latency-
critical workloads, a class of emerging workloads that was once written off as hopelessly inefficient.
2.3 Large-scale latency critical workloads
Many online services, such as websearch, social networking, webmail, etc. fall under a category of workloads
called large-scale latency-critical workloads. These workloads all share two common characteristics. The
first is that data is sharded across many servers, thus requiring an architecture where all individual servers
must respond before a final result can be generated. For instance, Google websearch is structured as a hi-
erarchical fan-out tree (Figure 2.4) where a single incoming search query is distributed to all the leaf nodes
in the tree, and the final search result is obtained after aggregating and sorting the results from each leaf
node [25]. The second common characteristic is that the workload is ultimately user-facing and thus has a
strict latency service level objective (SLO) on the order of hundreds of milliseconds. If the SLO is defined
on an individual server level, the target could be that the 99.9%-ile tail latency needs to be less than tens of
milliseconds; while a SLO for the entire end-to-end latency could be closer to ∼ 100 milliseconds. The strict
SLO is due to studies that show that users treat “slow” response times as unacceptable degradation in user
experience. One recent study at Google demonstrated that a page render time greater than 400 milliseconds
has a measurable impact on ad-revenue [137]. Thus, large-scale latency critical workloads place very tight
latency constraints on the tail-latency of each individual server, as the slowest server in the entire ensemble
determines the overall query time. The strict latency SLO of large-scale latency-critical workloads differen-
tiates it from large batch jobs that may also access a large amount of data stored on many separate servers.
Batch jobs, due to their non-interactive nature, are much more tolerating of small disturbances compared to
large-scale latency-critical workloads. Users who submit batch jobs will hardly notice a 1 second increase
in processing times, while the same increase in end-to-end latency for a user of an online service is consid-
ered unacceptable. Ultimately, both the latency-critical and large-scale aspects of large-scale latency-critical
workloads combine to make this class of workloads very challenging to achieve high efficiency on.
Not only are large-scale latency-critical workloads difficult to achieve high efficiency on, they are also the
primary reason behind the underutilization of datacenters. These workloads are user-facing, and thus the load
on them is dictated by the number of users currently using the online service. This behavior is apparent as
diurnal load variation. We measure an example diurnal load for Google websearch over a 24 hour period and
plot it in Figure 2.5. Due to coarse-grained load balancing at the front-end, websearch is utilized at nearly
peak load for approximately half of the day. However, during the other half of the day, namely when users are
asleep in the middle of the night, the load on websearch drops to approximately 25%. Because to geo-locality
considerations (web services steer traffic to the closest datacenter to the user) and a non-uniform distribution

CHAPTER 2. MOTIVATION AND BACKGROUND 16
Web Server
Root
Parent Parent Parent
Leaf Leaf Leaf
… …
Front end
Back end
search set up
Figure 2.4: Example topology of Google websearch, from [25].
of the world’s population across timezones (there are more people in Asia than in the middle of the Pacific),
there will always be instances of online services that operate below capacity because of diurnal user patterns.
Paradoxically, large datacenters have a near endless supply of jobs that can be executed. These jobs
typically take the form of best-effort batch jobs, such as analytics, log processing, machine learning, etc.
For instance, training a neural network to better recognize images would fall under this category of batch
jobs. In theory, one would expect that the servers in the datacenter would always be highly utilized, as there
should always be a job ready to fill in any idleness. In practice, the actual utilization of a datacenter is fairly
low, even with advanced cluster management software. Figure 2.6 shows the CPU utilization of a cluster
of servers at Google, as well as the number of CPUs requested by jobs [132]. The CPU utilization rarely
rises above 50%, but the amount of CPUs reserved is always at 100%. Furthermore, most of the exaggerated

CHAPTER 2. MOTIVATION AND BACKGROUND 17
0 5 10 15 20Time (hr)
0
20
40
60
80
100
% o
f pea
k lo
ad
Example diurnal patterns for websearch
Figure 2.5: Diurnal user load variation for Google websearch. Time is an offset from the start of the trace,not absolute time.
resource reservations are due to high priority (i.e. latency-critical) jobs, where on average high priority jobs
reserve more than twice the amount of CPUs than they actually consume. Naturally, this exaggeration of
resource requirements leads to poor utilization of the datacenter in a way that the cluster manager cannot
fix. While over-exaggerated resource reservations seem wasteful, there are good reasons for specifying such
reservations, which we will describe shortly in Section 2.3.2.
We now discuss the difficulties of achieving high efficiency for large-scale latency-critical workloads.
The common underlying theme is that various techniques that worked for other workloads do not work for
latency-critical workloads because of the strict latency SLO that latency-critical workloads must meet.
2.3.1 Energy proportionality challenges
A previous approach to achieving energy proportionality in the datacenter proposes using deep sleep states
to reduce idle power, such as in PowerNap [109]. However, large-scale latency-critical workloads do not
expose enough idleness to take advantage of these deep sleep states. A study of latency-critical workloads
at Google showed that even at very low loads (10%), the distribution of the periods of idleness in various
system components prohibit the use of the lowest power sleep states [110]. In addition, the same study
concluded that attempting to create long enough periods of idleness by batching requests causes latency SLO

CHAPTER 2. MOTIVATION AND BACKGROUND 18
0.5
1.0
Po
rtio
n o
f C
PU
Time (days)0 5 10 15 20 25
High priority Med priority Low priority
0 5 10 15 20 25
allocatedused
Time (days)
Study of utilization on 12,000 node Google cluster
>2x allocation inflation
Figure 2.6: Fraction of CPUs across a Google cluster that is utilized and reserved.
violations, making batching a non-starter. Another approach advocates consolidating load onto fewer servers
and turning off the idle servers during periods of low load [85]. However, the large distributed state that
needs to be available for OLDI workloads prevents load consolidation and makes this approach impractical.
For instance, websearch shards its search index in DRAM across thousands of nodes and there is not enough
free DRAM available in any single node to hold more index data (otherwise the index would have been made
larger to begin with).
To improve energy proportionality for a single node, there have been attempts to use DVFS to reduce
server power at low load. Unfortunately, previous DVFS controllers were designed for throughput-oriented
or real-time workloads and not latency-critical workloads. Namely, these DVFS control schemes use CPU
utilization as the primary control input and completely ignore additional latency requirements of the work-
load. This mismatch in assumptions leads to latency SLO violations for the latency-critical workload, render-
ing such DVFS schemes unusable. Previous experiments have yielded conclusive evidence that such DVFS
schemes are not suitable for latency-critical workloads. For instance, using the cpufreq power governor, a
DVFS scheme found in Linux that is used to extend the battery life of laptop computers, causes large latency
violations for websearch as seen in Figure 2.7.
Given the difficulties of adapting previous approaches for achieving energy proportionality to latency-
critical workloads, the standard solution has been to simply give up. Operators of latency-critical online
services would rather deal with the wasted energy than to cause latency violations that could result in a poor
end-user experience and a subsequent loss of revenue. However, since datacenters are becoming limited by
the amount of power they consume, improving energy proportionality is of paramount importance for future
datacenter scaling.

CHAPTER 2. MOTIVATION AND BACKGROUND 19
0 5 10 15 20Time (hr)
0.0
0.2
0.4
0.6
0.8
1.0
1.2
1.4Fr
acti
on o
f SLO
late
ncy
Latency for websearch with cpufreq
Figure 2.7: Latency of websearch with cpufreq, showing latency SLO violations. The solid horizontal lineshows the target SLO latency.
2.3.2 Resource efficiency challenges
The only way to improve resource efficiency is to make better use of compute resources. Recall from earlier
that in many large datacenters, there is an abundance of jobs that can be run. Thus, the challenge for resource
efficiency is not on the supply side; in fact, the cluster manager in Figure 2.6 believes that the cluster is being
highly utilized. We previously alluded to the fact that the paradox of high allocations and low usage is caused
by the exaggeration of resources in the requirements of the job. This resource exaggeration is a product of the
extreme sensitivity of latency-critical workloads to inter-workload interference. Inter-workload interference
occurs when two jobs are running on the same server and contend for shared resources.
Any shared resource on the server can be a source of interference. For example, two jobs co-scheduled
on the same logical CPU will necessarily be multiplexed, and thus the performance of each job will suffer
compared to the case where each job has its own CPU. To make matters worse, latency-critical workloads
are by nature exquisitely sensitive to any performance degradations because of the strict latency SLOs. This
sensitivity effectively means that interference from any single source could be enough to cause a latency SLO
violation. Thus, in order to mitigate interference from a co-located workload, every single source of shared
resource contention must have interference mitigation mechanisms. The large numbers of shared resources
in a server (cores, caches, DRAM, network, power, etc.) makes this a daunting requirement.

CHAPTER 2. MOTIVATION AND BACKGROUND 20
0 20 40 60 80 100% of peak websearch load
0
50
100
150
200
250
300
99%
late
ncy
(% o
f SLO
)
interference impact on websearch
Baseline With batch
Figure 2.8: Latency of websearch with a low-priority batch workload, showing latency SLO violations. Thesolid horizontal line shows the target SLO latency.
Up until recently, the lack of hardware support for shared resource isolation has made achieving high
resource efficiency quite challenging. Using only software mechanisms to achieve high resource efficiency for
latency-critical workloads while guaranteeing their tight latency SLOs has been very difficult. For example,
using the priority scheduling parameter alone in Linux’s Completely Fair Scheduler is woefully inadequate in
preventing latency violations. To demonstrate this point, we conducted an experiment where a batch job was
co-schedule with Google websearch on the same server. The scheduling parameters were set so that the batch
job was marked as low priority, and websearch as high priority. The latency was then measured and shown
in Figure 2.8. It is immediately clear that OS scheduling priorities could not guarantee that websearch will
meet its latency requirements. Even more concerning is that websearch failed to meet its latency SLO at any
offered load, even at very low loads. Unfortunately, even interference-aware schedulers such as Paragon [28],
BubbleUp [104], or CPI2 [164] are unable to improve resource efficiency in this case, as such schedulers will
conclude that such a co-location is impossible and will schedule websearch onto dedicated servers.
The widely adopted workaround to the sensitivity of latency-critical workloads to interference has been
to either run those workloads on dedicated servers or to greatly exaggerate their resource requirements. In
the dedicated server case, having no other workloads on the same server guarantees that there cannot be any
interference. Greatly exaggerating the resource requirements of latency-critical workloads is a slightly more
nuanced approach, the idea being that the exaggerated resource reservation will only allow small jobs unlikely
CHAPTER 2. MOTIVATION AND BACKGROUND 21
to cause interference to be co-scheduled with the latency-critical one. In either case, resource efficiency
suffers greatly, as a significant fraction of the server will be left idle when the latency-critical workload is not
being used at high load.
2.4 Questions this dissertation explores
This dissertation will explore opportunities to improve both energy efficiency and resource efficiency for
datacenters. There are several questions that we use to guide this exploration. The first is to examine whether
there exists opportunities to achieve huge efficiency gains in existing systems. We choose to focus on existing
systems to achieve wider immediate applicability for today’s datacenters. We specifically focus our inquiry on
finding acceptable trade-offs that can lead to efficiency improvements, as the vast majority of “free” efficiency
gains, such as PUE improvement and commodity servers, have already been exploited.
First, we examine peak CPU power consumption. At peak load, CPU power consumes 70% of total sys-
tem power, making it an attractive target for efficiency optimization. We therefore analyze whether or not
running the CPU at full power actually translates to significantly improved performance for different work-
loads and different efficiency metrics. We also apply this analysis to large-scale latency-critical workloads,
and ask if there exists power and performance trade-offs at lower utilizations. Specifically, we ask the ques-
tion of whether or not there exists unused performance at lower utilizations that can be turned into energy
savings. Finally, we investigate what kinds of mechanisms and the granularity of said mechanisms needed to
realize potential energy savings as well as the magnitude of energy savings.
We then turn our focus to determining how we can use increase the resource efficiency of servers in
the face of latency-critical workloads. We begin by asking the same question of whether there is unused
performance at lower utilizations for latency-critical workloads, and how we can turn performance slack
into increased server utilization. We then investigate the necessary mechanisms needed to perform resource
partitioning to guarantee performance isolation between workloads running on the same server. Finally, we
apply what we learned from the previous questions to answer the question of how high the utilization of
servers can be raised to without violating the SLOs of latency-critical workloads.

Chapter 3
Dynamic Management of TurboMode inModern Multi-core Chips
We begin the technical portion of this dissertation by examining opportunities to improve peak energy effi-
ciency for CPUs. We examine the dynamic overclocking of CPUs, or TurboMode, a feature recently intro-
duced on all x86 multi-core chips. It leverages thermal and power headroom from idle execution resources
to overclock active cores to increase performance. TurboMode can accelerate CPU-bound applications at
the cost of additional power consumption. Nevertheless, naive use of TurboMode can significantly increase
power consumption without increasing performance. Thus far, there is no strategy for managing TurboMode
to optimize its use across all workloads and efficiency metrics.
In this chapter, we analyze the impact of TurboMode on a wide range of efficiency metrics (perfor-
mance, power, cost, and combined metrics such as QPS/W and ED2) for representative server workloads
on various hardware configurations. We determine that TurboMode is generally beneficial for performance
(up to +24%), cost efficiency (QPS/$ up to +8%), energy-delay product (ED, up to +47%), and energy-
delay-squared product (ED2, up to +68%). However, TurboMode is inefficient for workloads that exhibit
interference for shared resources. We use this information to build and validate a model that predicts the
optimal TurboMode setting for each efficiency metric. We then implement autoturbo, a background daemon
that dynamically manages TurboMode in real time without any hardware changes. We demonstrate that au-
toturbo improves QPS/$, ED, and ED2 by 8%, 47%, and 68% respectively over not using TurboMode. At
the same time, autoturbo virtually eliminates all the large drops in those same metrics (-12%, -25%, -25%
for QPS/$, ED, and ED2) that occur when TurboMode is used naively (always on).1
1This chapter is based on work that was originally published in [100].
22

CHAPTER 3. DYNAMIC MANAGEMENT OF TURBOMODE IN MODERN MULTI-CORE CHIPS 23
3.1 Introduction
There is a constant need for higher performance in computer systems. This is particularly the case for large-
scale datacenters (DCs) that host demanding popular services such as social networking, webmail, streaming
video, websearch, and cloud computing. These applications demand both high throughput to support large
number of users and low latency to meet Quality of Service constraints for each user. Nevertheless, perfor-
mance is not the only efficiency metric. A large concern for datacenter operators is the total cost of ownership
(TCO) for a certain level of service, including both capital and operational expenses. The two largest TCO
components are the cost of servers and the cost to power them, which can be 53% and 19% respectively [47].
Therefore, any optimization should also target metrics that capture energy and cost efficiency such QPS/W
or QPS/$ for throughput workloads and energy-delay products (ED or ED2) for latency sensitive applica-
tions.
This chapter focuses on dynamic CPU overclocking (TurboMode) as a method to increase the efficiency
of server computers. While this chapter focuses on server workloads, the techniques we present can be used
in any kind of computer system that uses TurboMode. TurboMode has been recently introduced on x86
multi-core chips from Intel and AMD. It overclocks a cores by utilizing available thermal headroom from
idle execution resources [1, 58]. Current chips can dynamically overclock a core by up to 40% or more,
which can lead to an increase in performance by up to 40%. As the number of cores per chip increases over
time, the overclocking range and the performance implications of TurboMode will also increase. TurboMode
is controlled by firmware using an embedded hardware controller that sets the exact clock frequency based
on the thermal headroom available and the expected performance benefits. Software has little control over
TurboMode, except for the ability to enable/disable it.
Unfortunately, TurboMode is not always beneficial and deciding when to enable it is quite complex. As
seen in Section 3.3, the optimal TurboMode setting varies across different applications, hardware platforms,
and efficiency metrics. There is no clear static setting or simple heuristic for TurboMode management.
Naively turning on TurboMode (i.e., relying solely on the firmware controller) can actually lead to energy
waste of up to 28% and decrease cost efficiency in some cases. At the same time, disabling TurboMode all
the time misses opportunities for huge gains in energy and cost efficiency. We need an automatic system that
manages TurboMode intelligently, maximizing its benefits when applicable and masking its impact otherwise.
Towards this goal, we make the following contributions:
1. We characterize the impact of TurboMode on performance, power, cost and energy efficiency metrics
for various server workloads on several hardware platforms (Intel and AMD). We demonstrate that
turning on TurboMode can greatly improve such metrics (ED2 up to 68%) but can also significantly
degrade the same metrics in the presence of workload interference (ED2 up to 25%). The wide vari-
ability in TurboMode’s efficiency necessitates a dynamic control scheme.
2. We develop a predictive model that utilizes machine learning to predict the proper TurboMode setting.
We demonstrate that our modeling technique is effective for a wide range of efficiency metrics and

CHAPTER 3. DYNAMIC MANAGEMENT OF TURBOMODE IN MODERN MULTI-CORE CHIPS 24
different hardware configurations. It can accurately predict the optimal TurboMode setting for various
application configurations.
3. We implement autoturbo, a daemon that uses the model to dynamically control TurboMode. The dae-
mon requires neither hardware modifications nor a priori knowledge of the workload. We demonstrate
that it improves both energy efficiency (ED by 47% and ED2 by 68%) and cost efficiency (QPS/$
by 8%). More importantly, it eliminates nearly all the cases where TurboMode causes efficiency drops.
We expect the utility of autoturbo to be even greater with future multi-core chips. With more cores per chip,
the frequency range and potential of TurboMode will be larger. At the same time, there will be increased
interference for shared resources such as caches, memory channels, and on-chip or off-chip interconnects.
The rest of this chapter will be organized as follows. Section 3.2 describes TurboMode and current im-
plementations of it from x86 server CPU vendors. Section 3.3 analyzes the impact of TurboMode for various
workloads, metrics, and machine configurations. Section 3.4 describes our implementation of autoturbo and
Section 3.5 evaluates its efficacy. Section 3.6 presents related work and Section 3.7 concludes this chapter.
3.2 TurboMode Background
TurboMode (TM) is a form of dynamic voltage frequency scaling (DVFS). Unlike prior applications of DVFS
which decrease CPU clock frequency and voltage to save power, TM operates in the opposite direction.
Namely, TM increases CPU clock frequency in the active cores when a multi-core processor has idle re-
sources. Thus, previous DVFS control schemes ( [62, 113]) are inadequate in managing TM, as they do not
account for the dependency between CPU clock frequency and the presence of idle resources. The processor
is able to overclock active cores because the CPU’s thermal design power (TDP) is the worst case power at
maximum load. When a workload idles some resources of a core, there will be thermal and power head-
room available. Since in practice applications do not fully utilize all execution units of a core, TM functions
even if all cores are active. TM exploits this available headroom by increasing the operating frequency of
the processor [1, 58]. Increasing the CPU’s frequency will then speed up the applications running on the
CPU, potentially leading to better performance. The frequency boost enabled by TM is already significant on
current processors. In one of our evaluation machines, TM can boost the CPU from a nominal frequency of
2.50GHz to 3.60GHz, a 44% gain that could lead to a 44% performance increase.
All current implementations of TM are controlled via a feedback controller implemented in firmware.
The firmware controller monitors the CPU to determine the frequency boost that should be applied. The final
operating frequency of the processor is determined by several factors that include CPU power consumption,
the number of idle cores, and CPU temperature.
The only way for software to manage TM for all modern x86 server CPUs is to enable/disable its use.
One way to do so is to statically enable/disable TM from the BIOS. However, this approach is extremely
coarse-grained, as turning on TM from a disabled state would require a machine reboot. Instead, we use
CHAPTER 3. DYNAMIC MANAGEMENT OF TURBOMODE IN MODERN MULTI-CORE CHIPS 25
an online approach by utilizing the operating system to dynamically enable or disable TM through existing
ACPI power management functions. In our work, we use the Linux kernel’s built-in CPU frequency scaling
support to set the maximum frequency allowed for the CPU. By setting the maximum CPU frequency at the
nominal frequency, or one step lower, the CPU will be prevented from entering the TM regime. However, the
CPU frequency scaling facility cannot set the maximum allowable TM frequency. For instance, if a CPU can
scale from a nominal 2.50GHz to 3.60GHz, setting the maximum CPU frequency to 3.20GHz will not prevent
the firmware TM controller from setting the CPU frequency to 3.60GHz. However, for the same processor,
setting the maximum frequency at 2.50GHz will prevent TM from activating. We will show later in this
chapter that adjusting this one simple switch can have profound performance, power, and cost implications.
Both major x86 server CPU vendors, AMD and Intel, have implemented TM in their latest generation
processors. AMD’s version is named Turbo CORE, while Intel’s version is called TurboBoost. In this chapter,
we use “TM” as an umbrella term for both versions. At a high level, both implementations are quite similar.
Both overclock the processor beyond its base frequency when there is thermal and power headroom, and both
have a maximum TM boost frequency that is prescribed by the number of active cores. At the hardware level,
there are significant differences between AMD’s and Intel’s TM controller. AMD’s implementation reacts to
current and temperature sensors on the CPU die to adjust the frequency boost. Intel’s version predicts the
power utilization based on the instruction mix and uses that information to determine the frequency boost.
Intel’s TM is also subject to thermal throttling, but unlike AMD’s version, it is not the primary method
to control frequency gain. Theoretically, Intel’s implementation has a more repeatable TM boost, while
AMD’s implementation is more sensitive to external factors such as ambient temperature. However, in our
experiments, we have observed that the frequency boost from AMD’s TM does not experience wide variance
between experiment runs. This is due to our test machines being situated in a climate controlled environment
that would be found in a datacenter. Finally, we also observe that TM appears to be frequency limited and
not power limited.
Another difference between Intel’s and AMD’s TM controllers is that Intel’s version attempts to ad-
dress energy efficiency. It does this by applying differing amounts of frequency boost depending on the
“memory scalability” of the workload and a user configurable parameter for the aggressiveness of TM
(MSR IA32 ENERGY PERF BIAS) [134]. In practice, we find that this setting is hard to use effectively.
We have observed that setting the parameter to “energy efficient” can still lead to degradation in energy ef-
ficiency metrics. Therefore, in our study, we leave this parameter at the setting for “highest performance”
to avoid interference between the firmware controller and our software controller for TM. Intel also exposes
a MSR that allows software to control the maximum achievable TM boost (MSR TURBO RATIO LIMIT);
however, we do not evaluate it because there is no equivalent MSR for the AMD platform.
A software TM controller is motivated further by the fact that improving the firmware TM controller does
not guarantee improvements in energy efficiency. This is because it is infeasible to pre-program firmware
to be aware of the impact of TM on all workloads and workload combinations. In addition, the firmware
does not have information on the other aspects of the system that affect cost and power (e.g. cooling system,

CHAPTER 3. DYNAMIC MANAGEMENT OF TURBOMODE IN MODERN MULTI-CORE CHIPS 26
component costs, etc.), nor does it know which metric to optimize for. Thus, an entire system needs to be
assembled and operated before it can be determined whether TM will improve efficiency metrics.
3.3 TurboMode Analysis
We now examine the highly variable impact of TM on performance, energy, and cost efficiency for a variety
of workloads on a wide-range of hardware platforms.
3.3.1 Methodology
Hardware We selected several very different hardware platforms that represent a wide selection of server
parameters that are seen in practice [19,71] in order to reach conclusions that are not specific to one hardware
configuration. We use real hardware for our evaluation in order to accurately capture the complex behavior
of TM.
1. Sandy Bridge Server (SBServer) has a Sandy Bridge EP (Core i7 3930k) processor with 6 cores that
share a 12MB L3 cache. The granularity of TM control is chip-wide. This configuration is representa-
tive of a low-end Sandy Bridge server.
2. Interlagos Server (ILServer). This system contains an AMD Opteron 6272 processor, mimicking a
low-end Interlagos based server. The processor can logically be viewed as a dual socket part, since
it is composed of two dies that share a package. Each die has 4 modules, where each module has 2
integer cores that share a front-end. All modules on the same die share 8MB of L3 cache. We lower the
base frequency from 2.1GHz to 1.9GHz in order to be able to dynamically control TM. Unlike Sandy
Bridge and Ivy Bridge CPUs, the Interlagos architecture allows for control of TM at the module level.
3. Sandy Bridge Laptop (SBMobile). The laptop contains an Intel Core i7 2860QM processor with 4 cores
that share a 8MB L3 cache. We use a mobile part in order to understand the implications of TM on
a more energy-proportional system. In addition, the larger frequency boost of this CPU gives insight
into future CPUs with a larger TM frequency swing.
4. Ivy Bridge Server (IBServer) and Haswell Server (HServer). We also performed a partial evaluation on
Ivy Bridge (Xeon E3-1230v2) and Haswell (Xeon E3-1220v3) CPUs. Due to space constraints we do
not present a full evaluation of TM on these platforms; however, we will demonstrate that our dynamic
controller works well on these platforms.
All machines use Ubuntu 12.04 LTS as the operating system with Linux 3.2.0-26. We summarize the machine
configurations used in this study in Table 3.1. For our experiments, we disable HyperThreading on both Intel
CPUs and the second core in each Interlagos module to avoid performance counter interference.
We monitor the frequency of the CPU throughout our experiments using turbostat to verify that TM
is functioning as expected. We measure the total system power by interposing a power meter between the
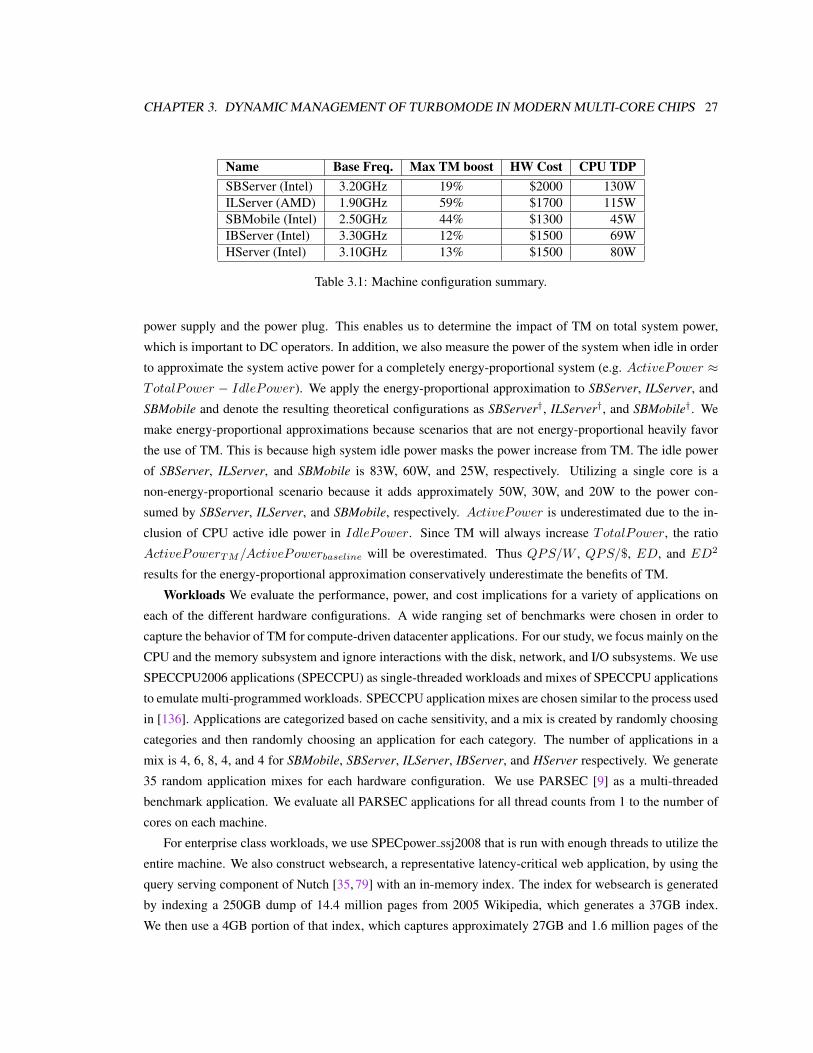
CHAPTER 3. DYNAMIC MANAGEMENT OF TURBOMODE IN MODERN MULTI-CORE CHIPS 27
Name Base Freq. Max TM boost HW Cost CPU TDPSBServer (Intel) 3.20GHz 19% $2000 130WILServer (AMD) 1.90GHz 59% $1700 115WSBMobile (Intel) 2.50GHz 44% $1300 45WIBServer (Intel) 3.30GHz 12% $1500 69WHServer (Intel) 3.10GHz 13% $1500 80W
Table 3.1: Machine configuration summary.
power supply and the power plug. This enables us to determine the impact of TM on total system power,
which is important to DC operators. In addition, we also measure the power of the system when idle in order
to approximate the system active power for a completely energy-proportional system (e.g. ActivePower ≈TotalPower − IdlePower). We apply the energy-proportional approximation to SBServer, ILServer, and
SBMobile and denote the resulting theoretical configurations as SBServer†, ILServer†, and SBMobile†. We
make energy-proportional approximations because scenarios that are not energy-proportional heavily favor
the use of TM. This is because high system idle power masks the power increase from TM. The idle power
of SBServer, ILServer, and SBMobile is 83W, 60W, and 25W, respectively. Utilizing a single core is a
non-energy-proportional scenario because it adds approximately 50W, 30W, and 20W to the power con-
sumed by SBServer, ILServer, and SBMobile, respectively. ActivePower is underestimated due to the in-
clusion of CPU active idle power in IdlePower. Since TM will always increase TotalPower, the ratio
ActivePowerTM/ActivePowerbaseline will be overestimated. Thus QPS/W , QPS/$, ED, and ED2
results for the energy-proportional approximation conservatively underestimate the benefits of TM.
Workloads We evaluate the performance, power, and cost implications for a variety of applications on
each of the different hardware configurations. A wide ranging set of benchmarks were chosen in order to
capture the behavior of TM for compute-driven datacenter applications. For our study, we focus mainly on the
CPU and the memory subsystem and ignore interactions with the disk, network, and I/O subsystems. We use
SPECCPU2006 applications (SPECCPU) as single-threaded workloads and mixes of SPECCPU applications
to emulate multi-programmed workloads. SPECCPU application mixes are chosen similar to the process used
in [136]. Applications are categorized based on cache sensitivity, and a mix is created by randomly choosing
categories and then randomly choosing an application for each category. The number of applications in a
mix is 4, 6, 8, 4, and 4 for SBMobile, SBServer, ILServer, IBServer, and HServer respectively. We generate
35 random application mixes for each hardware configuration. We use PARSEC [9] as a multi-threaded
benchmark application. We evaluate all PARSEC applications for all thread counts from 1 to the number of
cores on each machine.
For enterprise class workloads, we use SPECpower ssj2008 that is run with enough threads to utilize the
entire machine. We also construct websearch, a representative latency-critical web application, by using the
query serving component of Nutch [35, 79] with an in-memory index. The index for websearch is generated
by indexing a 250GB dump of 14.4 million pages from 2005 Wikipedia, which generates a 37GB index.
We then use a 4GB portion of that index, which captures approximately 27GB and 1.6 million pages of the

CHAPTER 3. DYNAMIC MANAGEMENT OF TURBOMODE IN MODERN MULTI-CORE CHIPS 28
original data. Websearch is driven by simulated search queries that are generated by a model that uses an
exponential distribution for query arrival times and a query term model that is representative of web search
queries seen at search engines [162]. Websearch must also satisfy a Quality of Service (QoS) constraint
that 95% of the queries must be processed in less than 500ms [91]. Nutch is configured such that at 100%
utilization it will use all available CPU cores.
Single SPECCPU workloads and application mixes from SPECCPU can be considered to be either
throughput-oriented or latency-oriented. These benchmarks represent throughput-oriented applications if
the number of benchmarks executed per second is the primary metric. Similarly, if the metric of interest is
how long each benchmark takes to execute, then SPECCPU is an analogue for latency-oriented applications.
SPECpower ssj2008 is a throughput-oriented benchmark that scores the system by how many queries per
second it can handle. Thus, we do not compute latency metrics for SPECpower ssj2008. Finally, while web-
search is both sensitive to throughput and latency, it can be optimized for either one. To optimize websearch
for throughput, one would measure the maximum sustained QPS that can be achieved without violating QoS.
To optimize for latency, one would reduce the 95%-ile latencies for a fixed QPS rate. In addition, since
SPECpower ssj2008 and websearch are request-driven workloads, we sweep the input QPS rate from 10%
to 100% of the maximum QPS rate on each server configuration. This is done because datacenters are not
always utilized at 100%.
3.3.2 TurboMode for Different Metrics
There are many metrics that are useful when dealing with performance, power, and cost. All of the metrics
that we examine are legitimate metrics when applied to different workload scenarios. For instance, under
periods of high load, the metric of interest will be performance, but under normal load conditions, QPS/$ is
more important. Even the same workload can have different metrics of interest. Take websearch for example.
If one has a fixed 95%-ile latency target, the metric of interest is QPS/W or QPS/$. On the other hand, if
one wants to optimize for a lower 95%-ile target, then ED and ED2 are more relevant. We list the metrics
that we analyze below:
1. Performance measures the raw performance of a workload and is useful when application throughput
and latency is critical. This metric will obviously be improved by the use of TM, and we include other
metrics to see the true cost of using TM.
2. Power measures the total system power consumed while executing the workloads. This metric is for
situations where minimal power is needed, even at the expense of performance.
3. Energy Delay Product and Energy Delay Squared Product: Energy Delay Product is calculated as the
product of the energy it takes to complete an operation with the time it takes to complete the operation,
and Energy Delay Squared Product is found in a similar way. These metrics are commonly used as a
way of finding the optimal trade-off between performance and energy. This trade-off is important for
latency sensitive applications in an energy constrained environment. [14]

CHAPTER 3. DYNAMIC MANAGEMENT OF TURBOMODE IN MODERN MULTI-CORE CHIPS 29
Workload QPSW
QPS$ ED ED2
SBSe
rver SPECCPU On On On On
SPECCPU mixes Off ? Off ?PARSEC Off ? Off ?SPECpower ssj2008 Off On N/A N/Awebsearch Off On On On
SBSe
rver† SPECCPU Off On On On
SPECCPU mixes Off Off Off ?PARSEC Off Off Off ?SPECpower ssj2008 Off On N/A N/Awebsearch Off On On On
ILSe
rver SPECCPU On On On On
SPECCPU mixes On On On OnPARSEC On On On OnSPECpower ssj2008 Off On N/A N/Awebsearch On On On On
ILSe
rver† SPECCPU Off On On On
SPECCPU mixes Off Off ? OnPARSEC Off On ? OnSPECpower ssj2008 Off On N/A N/Awebsearch On On On On
SBM
obile SPECCPU Off On On On
SPECCPU mixes Off ? ? ?PARSEC Off On ? ?SPECpower ssj2008 Off On N/A N/Awebsearch Off On On On
SBM
obile† SPECCPU Off On Off ?
Table 3.2: Optimal TM settings for each metric/workload class/hardware configuration. On/Off indicates astatic optimal TM setting of On/Off. ? indicates that there is no optimal static TM setting. The results forSPECpower ssj2008 are reported at 100% QPS rate achieved with TM on. The QPS/W and QPS/$ forwebsearch are reported at 100% QPS rate with TM on, and ED and ED2 metrics are reported at 100% QPSrate with TM off. SBMobile† only has SPECCPU listed because all other workloads are energy-proportionalon SBMobile.
4. Queries Per Second Over Power (QPS/W ): The efficiency of throughput-oriented batch workloads
running on power constrained systems are best measured by this metric. QPS/W is inversely pro-
portional to the amount of energy needed to execute one job; thus, this metric is the same as energy
efficiency which is important in a large-scale DC [7].
5. QPS/$ is a direct measure of cost efficiency. The fiscally conscious system operator will find this
metric to be most relevant for throughput-oriented workloads. We use a standard 3 year depreciation

CHAPTER 3. DYNAMIC MANAGEMENT OF TURBOMODE IN MODERN MULTI-CORE CHIPS 30
ILServer/† SPECpower_ssj2008
0
20
40
60
80
0 50 100 150 200
QP
S/$
QPS (thousands)
QPS/$ vs. QPS
0
1000
2000
3000
0 100 200
QP
S/W
QPS (thousands)
QPS/W vs. QPS
0
1000
2000
3000
0% 50% 100%
QP
S/W
QPS %
QPS/W vs. QPS %
0
20
40
60
80
0% 50% 100%
QP
S/$
QPS %
QPS/$ vs. QPS %
TM off TM onILServer †
TM off TM onILServer
Figure 3.1: Impact of TM on QPS/W and QPS/$ for SPECpower ssj2008 on ILServer and ILServer†.The graphs in the upper half are for absolute QPS numbers, while the graphs in the lower half are for QPSnumbers relative to the maximum QPS rate that can be supported for each setting of TM. Higher numbers arebetter for QPS/W and QPS/$.
cycle, and we assume an electricity cost of $0.15/kWHr. We use the cost model found in [119, 120] in
our calculations. This metric is commonly used to measure the cost-efficiency of large-scale DCs [7].
We measured the changes in performance and power caused by the use of TM and calculated the above
metrics the workloads on various hardware platforms. In Figure 3.2, we show the impact of TM on the various
metrics for a subset of applications. For completeness, we show TM’s impact on all metrics in Table 3.2.
Using TM will always have a positive impact on performance, as speeding up the clock frequency of
the processor should not degrade application performance. Similarly, TM will certainly increase power con-
sumption. As a case study of the optimal TM setting for QPS/W and QPS/$ for a throughput driven work-
load, we examine SPECpower ssj2008’s behavior on ILServer and ILServer† as illustrated in Figure 3.1.
SPECpower ssj2008 is amenable to the use of TM, as enabling TM increases the maximum QPS rate by
25%. To optimize for both relative and absolute QPS/W , TM should be kept off. This is because QPS
will typically scale only as much as frequency, but the power consumed scales faster than frequency. This is

CHAPTER 3. DYNAMIC MANAGEMENT OF TURBOMODE IN MODERN MULTI-CORE CHIPS 31
due to the fact that P ∝ V 2f and that higher frequencies require increased supply voltage [17]. Figure 3.1
shows this effect when idle power is removed (ILServer†), as QPS/W when TM is on always falls below
the QPS/W for when TM is off.
On the other hand, if TM can produce a performance gain, then it should almost always be enabled to
optimize for QPS/$. This effect can be explained in a straightforward manner by reviewing the hardware
and energy costs associated with the TCO. For ILServer, the cost of the hardware is about the same as the
cost of electricity and infrastructure for power delivery and cooling. Since the use of TM does not increase
power consumption by an inordinately large factor, it is always more advantageous to enable TM if it enables
more performance out of the same piece of hardware. In Figure 3.1, the QPS/$ for absolute QPS numbers
seems to show that TM degrades this metric. However, in reality, if each machine can handle more work,
then fewer machines need to be provisioned. Thus, TM improves QPS/$ not for an individual machine, but
rather for the entire datacenter, as reflected in the graph for QPS/$ vs. relative QPS.
Table 3.2 shows that our observations for QPS/W and QPS/$ based on SPECpower ssj2008 running
on ILServer also generalizes to many other workloads and platforms. There are some exceptions to the
rule. Using TM can actually improve QPS/W in situations that are not energy-proportional, such as when
running only a single instance of a SPECCPU application. When the idle power is removed (e.g., SBServer†
and ILServer†), then the optimal TM setting for QPS/W for the single SPECCPU application workload is
to turn TM off. In addition, there are times when TM should be disabled to optimize for QPS/$, such as
when TM does not appreciably increase the QPS rate.
TM has a variable effect on applications for ED and ED2 in energy-proportional scenarios. In the single
application workload scenario, ED and ED2 always benefit from the use of TM; but trade-offs emerge when
the energy-proportional approximation is applied. When multiple cores are being utilized, there is no optimal
setting forED andED2 across all workloads. As we will discuss in Section 3.3.3, the optimal TM setting for
ED and ED2 depends on whether the workload exhibits interference for shared resources. In Section 3.4,
we will combine our observations from this section to build an effective system to select the optimal TM
setting for ED, ED2, and QPS/$.
3.3.3 TurboMode for Different Workloads
As seen in Table 3.2, the optimal TM setting depends on the workload. We now focus on ED and ED2 as a
case study for how TM can affect those metrics depending on workload. In Figure 3.2, we show a subset of
workloads that exhibit large swings for ED and ED2 on the different machine configurations.
We study theED andED2 metrics for websearch on SBMobile; the conclusions we arrive at also apply to
SBServer†. ILServer† can mostly be explained in the same way as well, except for TM’s large positive effect
on QPS/W and QPS/$. We sweep the QPS rate for websearch from 10% to 100% of the maximum QPS
that it can support with both TM on and TM off and plot the effect of TM on various metrics in Figure 3.3, 3.4.
95%-ile latency is improved by 30%-35% across the same QPS range that websearch can support if TM is
not enabled. The reason why the 95%-ile latency is reduced by a factor larger than the QPS gain can be

CHAPTER 3. DYNAMIC MANAGEMENT OF TURBOMODE IN MODERN MULTI-CORE CHIPS 32
-50%
0%
50%
100%
Mix 1 Mix 2 Websearch
% im
pro
ve
me
nt
Workload
SBMobile
-50%
0%
50%
100%
Mix 1 Mix 2 Websearch
% im
pro
ve
me
nt
Workload
ILServer†
ED ED² QPS/W QPS/$
-50%
0%
50%
100%
Mix 1 Mix 2 Websearch
% im
pro
ve
me
nt
Workload
SBServer†127%
Figure 3.2: TM impact on ED, ED2, QPS/W , and QPS/$ metrics for a subset of workloads.
explained by queuing theory. A significant component of 95%-ile latency is due to a query being held up
by earlier queries; thus, reducing the processing time for an individual query will have an amplified effect
on reducing 95%-ile latency. Due to this effect, the ED and ED2 metrics, which are based on 95%-ile
latency, are always improved significantly through the use of TM. However, on the relative QPS graph, it
may appear that enabling TM degrades ED and ED2 when the utilization of the machine goes over 80%.
This is misleading, because running websearch at that same absolute QPS rate with TM disabled will violate
the QoS constraint. Thus, a direct comparison is invalid beyond that point. TM also provides a 24% boost
to the maximum QPS, and its behavior for QPS/W and QPS/$ mirrors that of SPECpower ssj2008 and
are explained in the same way. On ILServer, TM actually increases the maximum QPS by 180%, due to
ILServer struggling to meet the QoS constraint when running with TM off. Because of the queuing delay
effect, increasing the clock frequency leads to a large increase in maximum QPS, QPS/W , and QPS/$. If
the QoS constraint was relaxed to 1 second, then the large increase in maximum QPS vanishes and TM no
longer benefits QPS/W or QPS/$ as much.
We now turn our attention to the SPECCPU application mixes. Mix 1 is composed of lbm, xalancbmk,
lbm, and milc. Mix 2 is composed of namd, hmmer, gobmk, and bzip2. These mixes were created by a
random process as previously described. On SBMobile, using TM on Mix 1 increases the CPU frequency by
20%, but only produces an average performance increase of 0.2% with a 29% increase in power. On the other
hand, enabling TM for Mix 2 boosts the core frequency by 13% for a 13% increase in performance and a

CHAPTER 3. DYNAMIC MANAGEMENT OF TURBOMODE IN MODERN MULTI-CORE CHIPS 33
0
0.01
0.02
0.03
0 20 40 60
QP
S/$
QPS
QPS/$ vs. QPS
TM off TM on
SBMobilewebsearch (QPS)
0
0.5
1
0 20 40 60
QP
S/W
QPS
QPS/W vs. QPS
0
10
20
30
0 20 40 60
ED
QPS
ED vs. QPS
0
5
10
15
0 20 40 60
ED
²
QPS
ED² vs. QPS
0
200
400
600
0 20 40 6095
% la
ten
cy (
ms)
QPS
95% latency vs. QPS
Figure 3.3: TM impact on various efficiency metrics and 95%-ile latency for websearch on SBMobile. The95%-ile latency,ED, andED2 numbers are absolute, meaning that lower is better. QPS numbers are absolutein this figure.

CHAPTER 3. DYNAMIC MANAGEMENT OF TURBOMODE IN MODERN MULTI-CORE CHIPS 34
0
0.5
1
0% 50% 100%
QP
S/W
QPS %
QPS/W vs. QPS %
TM off TM on
SBMobilewebsearch (QPS %)
0
0.01
0.02
0.03
0% 50% 100%
QP
S/$
QPS %
QPS/$ vs. QPS %
0
10
20
30
0% 50% 100%
ED
QPS %
ED vs. QPS %
0
5
10
15
0% 50% 100%
ED
²
QPS %
ED² vs QPS %
0
200
400
600
0% 50% 100%95
% la
ten
cy (
ms)
QPS
95% latency vs. QPS %
Figure 3.4: TM impact on various efficiency metrics and 95%-ile latency for websearch on SBMobile. The95%-ile latency, ED, and ED2 numbers are absolute, meaning that lower is better. QPS is normalized topeak QPS in this figure.

CHAPTER 3. DYNAMIC MANAGEMENT OF TURBOMODE IN MODERN MULTI-CORE CHIPS 35
Core 1
Core NCore N-1
Core 2 Sample perfcounters per core
Classifier
TurboModeheuristic
App properties per core
Enable/disable TurboMode Metric
Training data
Figure 3.5: Block diagram of online component autoturbo.
22% increase in power. The reason for the disparate behavior is due to the composition of the mixes. Mix 1 is
composed of applications that either fit in the last level cache, or exhibit cache thrashing behavior, while Mix
2 is composed of applications that are classified as cache insensitive or cache friendly [136]. Mix 1 incurs
interference in the LLC and is a completely memory-bound workload that cannot benefit from TM. Enabling
TM increases the CPU’s power consumption, even if that increase does not translate into a performance
gain. For workloads not dominated by memory accesses (e.g., Mix 2), TM will speed up the workload with
modest power increases, resulting in a win for QPS/$, ED, and ED2. However, interference can occur in
other shared resources external to the CPU, such as disk, network, and I/O. We expect that workloads that
interfere in those resources will also experience large efficiency degradations when TM is enabled, and we
leave the handling of those cases to future work. TM has many benefits but also runs the risk of increasing
energy consumption without realizing gains in performance. This strongly motivates the construction of
an intelligent controller that determines when TM should be enabled. In Section 3.4, the observation that
significant memory interference causes TM to burn extra energy will be leveraged to build an intelligent TM
controller.
3.4 Dynamic TurboMode Management
3.4.1 Overview
We have demonstrated earlier that the use of TM can significantly increase efficiency for some workloads
while also causing major degradations for others. We want the best of both worlds, where the system in-
telligently uses TM only in situations that produce an efficiency improvement. To achieve this goal, we
implement a software controller for TM named autoturbo.
The block diagram for autoturbo is shown in Figure 3.5. It runs as a periodic background daemon in
order to minimize resource usage. autoturbo starts by collecting system wide per-core performance counters

CHAPTER 3. DYNAMIC MANAGEMENT OF TURBOMODE IN MODERN MULTI-CORE CHIPS 36
Machine Accuracy Metric Classifier FeaturesSBServer† 100.0% Naive % cycles
ED2 Bayes w/ mem.SBMobile† 96.8% requests
Table 3.3: Classifier building results for metrics of interest on various hardware configurations.
for a configurable fixed time period, set to 5 seconds in our experiments. After it has collected counters, it
uses a machine learning classifier to predict application characteristics for the workload on each active core.
These results are then used by heuristics to determine whether TM should be enabled or disabled to optimize
for a certain metric. The heuristic can be as simple as enabling TM if the classifier predicts that the workload
benefits from the use of TM for a certain metric, to a more complicated heuristic that is used when several
workloads are running at the same time. The TM setting from the heuristic is applied, and the process repeats
from the beginning.
Since TM impacts each metric differently, we build a classifier and heuristic for each metric of interest.
Every metric requires a separate classifier since TM will affect each metric differently. The process to build
the classifier and heuristic can be automated and is described in Section 3.4.2. As autoturbo is an open-loop
controller, having accurate models is very important.
3.4.2 Offline Classifier Training
The online component of autoturbo uses models that are generated offline for the various metrics. The
modeling parameters only need to be generated once per server type. The offline training can be done by the
system integrator, who then provides this information to all their customers for a plug-n-play solution that
works right out of the box. The offline training can also be done by the DC operator for a more customized
solution, as they can use their own metrics and workloads for the training phase. Another advantage of
the DC operator performing offline training is that they can provide a more accurate TCO model for their
infrastructure and cooling costs.
Classifying Individual Workloads Creating a model that predicts the impact of TM on individual work-
loads for a specific machine is fairly straightforward. We first use SPECCPU and two other memory intensive
benchmarks, stream and lmbench-lat mem, as the training applications. stream and lmbench-lat mem are se-
lected because they exhibit streaming and cache thrashing behaviors. These applications are then run on the
machine that we wish to model, and performance, power, and various performance counters are measured
when TM is on and when it is off. We then calculate the effect TM has on the power, performance, and cost
metrics of interest.
As seen earlier, an application tends to benefit from TM if it is not memory bound. Therefore, to predict
if an individual workload benefits from TM, we need only predict if it is memory bound. We build such
a predictor by applying machine learning techniques on a wide array of performance counters that capture
memory boundness, such as IPC, L3 loads/misses, TLB misses, memory requests, etc. We first use feature

CHAPTER 3. DYNAMIC MANAGEMENT OF TURBOMODE IN MODERN MULTI-CORE CHIPS 37
Machine Classifier Counters used AccuracySe
nsiti
veSBServer Logistic Regression % cycles with outstanding memory requests 83.9%
% cycles front end is idleILServer Naive Bayes L2-load-misses / instruction 93.5%SBMobile Naive Bayes % cycles with outstanding memory requests 87.1%
% cycles front end is idle
Inte
rfer
ing SBServer Logistic Regression % cycles with outstanding memory requests 87.1%
ILServer Naive Bayes L3-misses 93.5%# requests to memory / instruction
SBMobile Logistic Regression % cycles with outstanding memory requests 87.1%
Table 3.4: Classifier building and validation results for Sensitive and Interfering on various hardware config-urations.
Property SPECCPU apps with propertySensitive mcf, milc, cactusADM, soplex, GemsFDTD, libquantum, lbm, omnetpp, astar, sphinx3,
xalancbmkInterfering bwaves, milc, leslie3d, soplex, GemsFDTD, libquantum, lbm
Table 3.5: SPECCPU application properties on SBServer and SBMobile. ILServer is the same as SBServerexcept that leslie3d is also in Sensitive.
selection to find the performance counters that best capture memory boundness, and to reject performance
counters that have poor signal to noise ratio or that simply don’t function correctly. Then, we train a model
based on those features to pick the proper parameters for the model. We fit a model to each metric and
machine, due to cost/hardware variation between different configurations. We use the Orange data mining
package [23] for this because manually tuning the model is both time consuming and error prone. The model
is then used in an online classifier that predicts whether TM will benefit a metric. The results of the feature
selection and the accuracy of the classifiers are shown in Table 3.3. We show the results for the ED2 metric
on SBServer† and SBMobile† only since these are the only configurations where the optimal setting for TM
varies depending on application. All other metrics on other hardware configurations have a static optimal
setting, e.g., TM should always be off to optimize for QPS/W on SBServer†. For the remaining hardware
configurations and metric, we show that using a single performance counter that tracks the fraction of time
there is a memory request outstanding provides excellent prediction power.
Classifying Application Mixes Predicting the optimal TM setting for a given metric on a mix of ap-
plications is more complicated. The naive approach would be to model the interactions between workloads
running on every core in the system. However, this approach is unscalable for large core counts, as the
number of parameters for the classifier would scale with the square of the number of cores. Training such a
classifier would also require a prohibitively large training set of application mixes.
Instead, we use a heuristic approach to determine the optimal TM setting for application mixes. In Sec-
tion 3.3.3 we observe that memory interference (L3 for ILServer, main memory for SBServer and SBMobile)

CHAPTER 3. DYNAMIC MANAGEMENT OF TURBOMODE IN MODERN MULTI-CORE CHIPS 38
causes TM to consume extra power without a corresponding performance gain. Thus, we developed a heuris-
tic that dynamically detects excessive memory interference and disables TM. While we examine only memory
interference for this work, extending the heuristic to detect other types of interference is straightforward. To
aid in the detection of memory interference, we build classifiers using the same process previously discussed
to predict if a workload is sensitive to memory interference (Sensitive) and if it causes memory interference
(Interfering). This classification scheme was inspired by [70]. These two properties are independent from
each other. For example, a workload that is memory latency bound but causes the prefetcher to trash the L3
cache is Interfering, but not Sensitive. To build each machine-specific classifier for Interfering and Sensi-
tive, we run each SPECCPU application in tandem with the stream benchmark and measure the performance
degradation for the SPECCPU application and for stream. Applications that degrade significantly when run
in parallel with stream are marked as Sensitive, and applications that significantly slow down stream are
marked as Interfering. The results of the application classification are shown in Table 3.5. We then build
predictors using this data and show the results in Table 3.4. Misclassifications occur when applications with
different properties have similar inputs to the classifier, which is caused by the use of indirect features (e.g.,
performance counters) to measure memory behavior. However, these cases are rare, as seen by the high
classification accuracy.
The performance counters automatically selected by feature selection are intimately related to the ar-
chitectures of the different CPUs. For SBServer and SBMobile, applications that are frequently stalled on
memory (a high portion of cycles with a memory request pending and a high portion of cycles where the
front end is stalled) are sensitive to memory interference. Similarly, applications that have intensive memory
activity, as measured by a large fraction of cycles with pending memory requests, cause significant amounts
of memory interference. For ILServer, since the L3 cache is exclusive of the L2, applications with high L2
MPKI are sensitive to memory interference. Similarly, applications with high L3 MPKI and memory access
intensity cause memory interference. Since the best performance counters vary by processor architecture, it
would have been difficult to manually pinpoint the precise performance counters to use even if the general
theme of “performance counters related to memory” is known.
For SBServer, the Sensitive model misclassifies 5 SPECCPU applications: 434.zeusmp, 436.cactusADM,
437.leslie3d, 482.sphinx3, 483.xalancbmk. 434.zeusmp and 437.leslie3d are false positives. 434.zeusmp is
misclassified due to the high percentage of cycles where the front end is idle, whereas 437.leslie3d is misclas-
sified due to the high percentage of cycles where there is an outstanding memory request. 436.cactusADM,
482.sphinx3, 483.xalancbmk are false negatives. 436.cactusADM is misclassified because it has a relatively
low percentage of cycles where there is an outstanding memory request, 482.sphinx3 because it has a rela-
tively low percentage of cycles where the CPU front end idle, and 483.xalancbmk because it has low counts
for both outstanding memory request time and front end idle time. 410.bwaves, 429.mcf, 470.lbm, 471.om-
netpp for Interfering. 410.bwaves, 470.lbm are false negatives. 429.mcf, 471.omnetpp are false positives.
The Sensitive and Interfering models for SBMobile behave similarly to SBServer, with the only exception be-
ing that 483.xalancbmk is classified correctly by the MemSensitve classifier. The similarity of the classifiers
CHAPTER 3. DYNAMIC MANAGEMENT OF TURBOMODE IN MODERN MULTI-CORE CHIPS 39
between SBMobile and SBSever is expected, as both are based on the Sandy Bridge microarchitecture.
The Sensitive classifier for ILServer misclassifies 410.bwaves and 482.sphinx3. 410.bwaves is a false
positive and 482.sphinx3 is a false negative. Both are misclassified because both have similar IPC and L2
load MPKI, but one application is sensitive while the other is not. Thus, during LOOCV, the 410.bwaves
data causes the misprediction of 482.sphinx3, and vice versa. The Interfering classifier mispredicts both
429.mcf and 471.omnetpp as false positives. 429.mcf is not an interfering application despite having a high
L3 MPKI and number of main memory request per instruction, while 471.omnetpp has a high L3 MPKI.
Adding more performance counters to the classifiers causes the prediction accuracy to drop, indicating that
all other performance counters have poor signal to noise ratios. In addition, measuring too many performance
events would require sampling over a limited number of physical hardware event counter registers, degrading
their accuracy.
The next step is to determine the maximum amount of interference before TM no longer provides a
win. This process is controlled via static policy, which is determined by the maximum number of interfering
workloads that can be co-located before the use of TM degrades a metric. To find the proper policy for each
metric, we measure the power and performance increase caused by TM for different numbers of active cores.
For example, TM increases power by 23% for a 4 core workload on SBMobile with a 12% frequency boost.
Thus TM must significantly increase the performance of applications running on at least 2 cores in order to
not degrade the ED2 metric for SBMobile. This heuristic applies TM conservatively, as it pessimistically
assumes that Sensitive workloads will not benefit at all from TM in the presence of memory interference. To
determine the number of applications that will be degraded, the heuristic looks at the application properties
of the workload on each core in a NUMA node. If there is more than one Interfering application, then the
number of degraded applications will be the number of Sensitive applications. If there is one Interfering
application, the number of degraded applications is the number of Sensitive applications on cores other than
the one hosting the Interfering workload, as a workload cannot interfere with itself.
3.4.3 Online autoturbo Operation
We implement the online component of autoturbo as a Python program to have convenient access to the
Orange machine learning library. However, this portion could also be implemented in the CPU firmware to
offload the computational load of the classifier. This would require the CPU firmware to expose an interface
to input training data and to declare the metric that autoturbo should be optimizing for. The pseudocode for
autoturbo is given in Algorithm 3.1.
First, the system operator sets the system type and the metric that autoturbo should be optimizing for.
This loads the appropriate models that were generated by the training phase as described in Section 3.4.2.
Next, autoturbo samples the appropriate performance counters available on the system for 5 seconds. From
this data, it can determine the number of cores that were active in the sampling period. If there were no active
cores, then there is nothing to optimize for. If there is one active core, then the single application classifier
is used to predict the optimal TM setting for that application. If there is more than one active core, then the

CHAPTER 3. DYNAMIC MANAGEMENT OF TURBOMODE IN MODERN MULTI-CORE CHIPS 40
1 loadModels(systemType, metric)2 while True:3 perfCounters = sampleCounters()4 if numCoresActive() == 1:5 setTM(singleAppModel(perfCounters))6 elif numCoresActive() > 1:7 setTM(multipleAppModel(perfCounters))
Algorithm 3.1: autoturbo control loop.
multiple application classifier is used to predict if there is significant workload interference that would negate
the benefits of TM. The predicted optimal TM setting is then set via cpufreq-set, and the process repeats.
The choice of a 5 second sampling period was done after considering the trade-off between increased
reactiveness of autoturbo at shorter sampling periods and lower power consumption of autoturbo at longer
sampling periods. Running the predictive classifiers, like any other application, consumes CPU resources
and power. When there is a workload present, each sampling period will invoke at least one classifier, and
so increased sampling increases the overhead of autoturbo. However, if the sampling period is too long,
then changes in the workload composition or changes in the workload phase will not be quickly detected.
We chose 5 seconds as a time period that is long enough to not increase CPU utilization or power by an
appreciable amount, while being short enough such that the typical workload will not change drastically
within most sampling windows.
As autoturbo runs as a background daemon, it can be easily deployed across the entire datacenter by
standard application deployment procedures. autoturbo can be easily extended with remote management
features, such as providing real-time reporting on when TM is enabled and the frequency boost of TM.
The architecture of autoturbo also allows for real time switching of metrics to be optimized for, which is
useful for large virtualized datacenters where workloads with different optimization targets can shift between
physical machines. In addition, autoturbo can also be extended to manually disable TM on a node, which is
invaluable in case of a thermal or power emergency in the datacenter. While remote management is currently
not available in autoturbo, it is planned as future work.
Sandy Bridge implementation details All relevant performance counters can be conveniently obtained
from perf stat. TM can only be controlled at a chip level granularity; thus, the optimal heuristic for workloads
that utilize multiple cores is the same as the one previously described.
Interlagos implementation details In addition to per-core performance counters obtained from perf
stat, the classifiers for the Interlagos platform also require counters from the North Bridge performance
monitoring unit (NBPMU) that provides performance counters for each NUMA node that includes 8 cores.
Since perf stat for our Linux distribution did not support using the NBPMU, we wrote our own applica-
tion that gets and sets that appropriate MSRs for the NBPMU by using the msr kernel module. Using the
NBPMU poses a challenge because the performance counters obtained from the NBPMU are not per-core
counters. Thus, we approximate the contribution from core c to a NBPMU counter by the following formula:

CHAPTER 3. DYNAMIC MANAGEMENT OF TURBOMODE IN MODERN MULTI-CORE CHIPS 41
NBPMU counterc = (NBPMU counter)(L2 load missesc)All L2 load misses on same NUMA node . This method works under the assumption that
the probability of a L3 miss is independent of the requesting core. While this assumption is not guaranteed to
be true for a set-associative cache, we find it to hold for our benchmark applications. Nevertheless, the ideal
solution would be to implement an analogue of the L3 misses and # of main memory request performance
counters in the per-core PMU.
While TM can be controlled at a module granularity, in practice we find that controlling TM at such a
fine granularity on the Interlagos platform is not worthwhile. This is due to the Interlagos chip not being
energy-proportional. For example, if two cores (on two separate dies) are active with TM on, the power draw
is 53W above idle power. If TM is disabled on one core, then the power draw only drops by 3W. However,
disabling TM on both cores drops the power by an additional 20W. Thus, autoturbo controls TM on ILServer
at a chip-level granularity.
3.5 Evaluation
We evaluate autoturbo for all workloads on all hardware platforms across all metrics by running autoturbo
on top of the workload. We measure the power consumption of the machine and the performance of the
workload to determine how effectively autoturbo can use TM to optimize for a given metric. We show the
results of using autoturbo on a subset of workloads/metrics/hardware platforms in Figures 3.6, 3.7. Each
line shows the metric of interest for the workload, normalized to the baseline case of when TM is always
off. We compare autoturbo against two other management strategies for TM. The Naive manager naively
uses TM all the time. The Static Oracle has prior knowledge of which setting of TM should be applied
for the entire duration of the workload to optimize for a given metric. The Static Oracle required several
profiling runs and as such is not practical for scheduling unknown workloads. For each line, the workloads
(X axis) are sorted by the improvement achieved in ascending order. The behavior of autoturbo on the single
SPECCPU workload running on SBMobile† is similar to SBServer†. In addition, autoturbo also has the same
behavior for websearch and SPECpower ssj2008 for all metrics measured on all machines. We compare the
performance of autoturbo on websearch and SPECpower ssj2008 against naively enabling TM, as that is the
optimal setting for those workloads. Even though autoturbo was trained on SPECCPU applications, we can
still use them as test applications because autoturbo was trained on performance counters for the entire run,
while the classifier uses counters obtained from 5 second windows as its inputs.
SBMobile autoturbo is able to use TM to intelligently improve QPS/$ and ED2 for the workload
consisting of SPECCPU application mixes. We show results for when all cores are used and when half the
cores are used in Figure 3.6. When all cores are used, the naive approach can improve the QPS/$ ratio
and ED2 metrics for approximately 40% of the mixes compared to the baseline. However, the other 60% of
the time it will cause degradations for those metrics. This degradation can be severe, up to 8% for QPS/$
and 25% for ED2. These degradations are due to applications within the mix interfering with each other,
causing the naive use of TM to consume extra power to provide a frequency boost that does not translate into

CHAPTER 3. DYNAMIC MANAGEMENT OF TURBOMODE IN MODERN MULTI-CORE CHIPS 42
-10%
-5%
0%
5%
10%Q
PS
/$ im
pro
ve
me
nt
App Mix
SBMobileMix QPS/$
0
50
100
0 50 100 150 200
QP
S/$
QPS (k)
SBMobile SPECpower_ssj2008 QPS/$
-40%
-20%
0%
20%
ED
² im
pro
ve
me
nt
App Mix
SBMobileMix ED²
0
0.01
0.02
0.03
0 20 40 60
QP
S/$
QPS
SBMobilewebsearch QPS/$
0
200
400
600
0 20 40 6095
% la
ten
cy (
ms)
QPS
SBMobile websearch 95% latency
0
5
10
15
0 20 40 60E
D²
QPS
SBMobilewebsearch ED²
-30%
-20%
-10%
0%
10%
ED
imp
rov
em
en
t
App Mix
SBMobileMix ED
-20%
0%
20%
40%
60%
ED
²im
pro
ve
me
nt
App Mix
SBMobileMix (2-cores) ED²
Naïve Auto Static Oracle
Figure 3.6: autoturbo’s effect on various workloads for SBMobile.
improved performance. autoturbo’s heuristic to avoid the use of TM in such interference scenarios is clearly
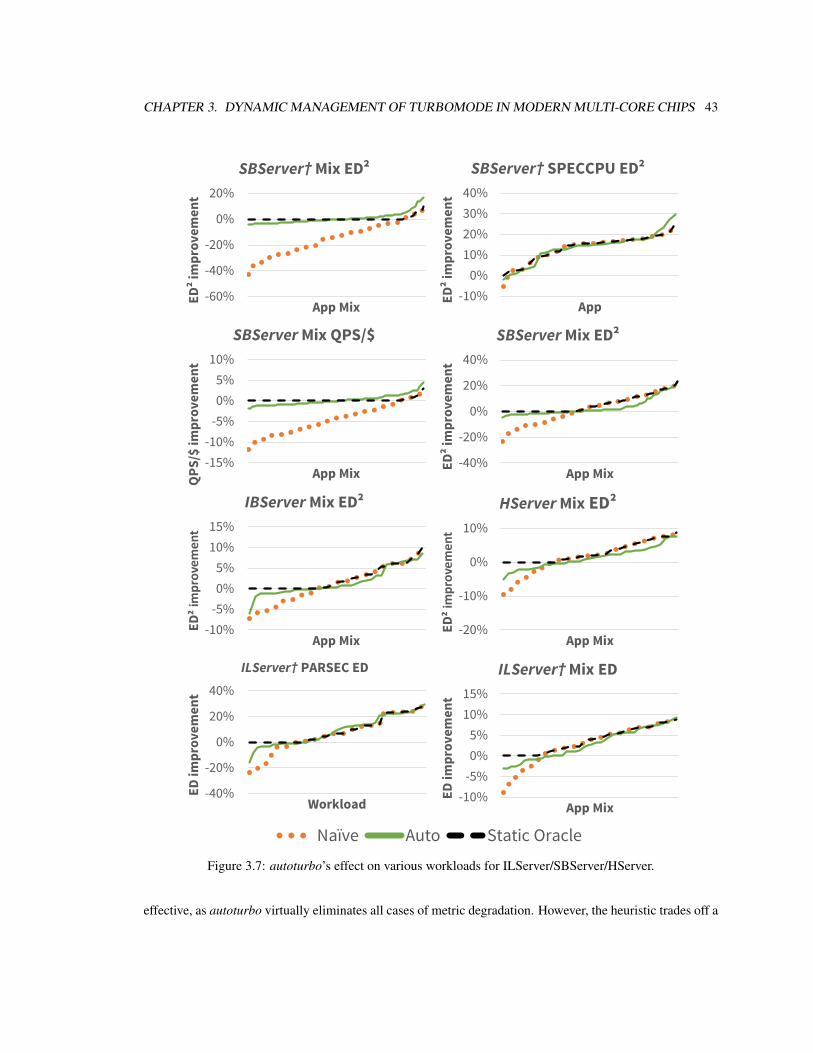
CHAPTER 3. DYNAMIC MANAGEMENT OF TURBOMODE IN MODERN MULTI-CORE CHIPS 43
-15%
-10%
-5%
0%
5%
10%
QP
S/$
imp
rov
em
en
t
App Mix
SBServerMix QPS/$
-60%
-40%
-20%
0%
20%E
D²
imp
rov
em
en
t
App Mix
SBServer† Mix ED²
-40%
-20%
0%
20%
40%
ED
² im
pro
ve
me
nt
App Mix
SBServerMix ED²
-10%
0%
10%
20%
30%
40%
ED
² im
pro
ve
me
nt
App
SBServer† SPECCPU ED²
-10%
-5%
0%
5%
10%
15%
ED
imp
rov
em
en
t
App Mix
ILServer† Mix ED
-40%
-20%
0%
20%
40%
ED
imp
rov
em
en
t
Workload
ILServer† PARSEC ED
-20%
-10%
0%
10%
ED
² im
pro
vem
ent
App Mix
HServerMix ED²
-10%
-5%
0%
5%
10%
15%
ED
² im
pro
vem
ent
App Mix
IBServerMix ED²
Naïve Auto Static Oracle
Figure 3.7: autoturbo’s effect on various workloads for ILServer/SBServer/HServer.
effective, as autoturbo virtually eliminates all cases of metric degradation. However, the heuristic trades off a

CHAPTER 3. DYNAMIC MANAGEMENT OF TURBOMODE IN MODERN MULTI-CORE CHIPS 44
2.40
2.50
2.60
2.70
2.80
2.90
3.00
215 235 255 275 295
Fre
qu
en
cy (
GH
z)
Time (s)
autoturbo dynamic adjustment
Memory interference occurs mid-workload
Figure 3.8: autoturbo detecting a phase change and adjusting TM for a SPECCPU mix made of gromacs,bwaves, gromacs, and GemsFDTD. autoturbo is optimizing for ED2 on SBMobile.
low rate of false positives for a low rate of false negatives. autoturbo’s heuristic is conservative in managing
interference, as it preemptively disables TM in the face of predicted interference even if that interference
turns out to be mild. This effect is shown by autoturbo failing to match the same level of metric improvement
as the Static Oracle. One avenue of future work is to build a regression model that predicts the amount of
interference and to only disable TM if that interference is above a threshold. Interestingly, there are also cases
where autoturbo outperforms the Static Oracle. This occurs in situations where the SPECCPU application
has phases in its execution that vary between CPU-intensive and memory-intensive. The Static Oracle cannot
take advantage of this dynamism, since it chooses a TM setting for the entire workload duration. On the other
hand, autoturbo can detect and account for these phase changes, as seen in Figure 3.8. When half the cores
are used, we see larger gains in ED2 because TM provides a larger frequency boost. autoturbo functions
properly in this case, and is able to enable TM whenED2 is improved while disabling it for mixes with heavy
memory interference.
For SPECpower ssj2008, not only is autoturbo able to properly apply TM, but its CPU footprint is small
enough such that it does not interfere with it. Even as QPS is swept from low to high, autoturbo does
not have a detrimental effect on the efficiency of SPECpower specssj2008, as the QPS/$ for autoturbo
closely tracks the behavior of naive TM. For websearch, the use of autoturbo generally does not degrade
performance or efficiency metrics compared to the naive use of TM. The only exception is when websearch
is run at 100% QPS and autoturbo slightly degrades the 95%-ile latency and the associated ED2 metric.
When autoturbo wakes up to classify the applications, it will cause the OS to switch out a websearch thread,
degrading the response latency. If the classifier component of autoturbo is integrated into firmware, then this
performance penalty will disappear. autoturbo is also able to properly optimize for the ED2 metric for the

CHAPTER 3. DYNAMIC MANAGEMENT OF TURBOMODE IN MODERN MULTI-CORE CHIPS 45
single application SPECCPU workload for SBMobile†, disabling TM for the one workload (milc) that does
not benefit from TM.
While not shown, we observed that autoturbo is able to improve QPS/$ and ED2 for PARSEC as well.
SBServer autoturbo is also able to optimize the SPECCPU application mixes for QPS/$ and ED2
for SBServer and ED2 for SBServer†, as shown in Figure 3.7. While the degradation of TM for QPS/$
can be -12%, autoturbo is able to select the proper TM setting to ensure that it only degrades QPS/$ by a
maximum of -3%. Likewise, autoturbo is also able to disable TM in cases where workload interference would
degrade ED2 significantly. autoturbo is quite successful at preventing significant degradation of metrics, as
it has strictly better worse case performance compared to the Naive TM manager. However, like SBMobile,
the interference heuristic in TM is overly conservative, causing autoturbo to miss some opportunities for
improving ED2. For ED2 on SBServer†, where there is no idle power to buffer the ED2 of workloads
with interference, the conservative heuristic in autoturbo pays off by being strictly better than the Naive
use of TM to improve ED2. autoturbo does have a few minor false positives that degrade ED2 by at
most -7%. These false positives arise when autoturbo misclassifies applications as not being Sensitive or
Interfering when they actually are. autoturbo also is able to successfully optimize the single application
SPECCPU workload running SBServer† forED2. It successfully tracks the performance of the Static Oracle,
demonstrating that the theoretical accuracy of the single workload ED2 classifier is realized in a practical
setting. While not shown, autoturbo successfully optimizes PARSEC for ED2 on SBServer† as well. Like
SBMobile, autoturbo also correctly turns on TM for SPECpower ssj2008 and websearch to take advantage
of TM improving QPS/$, ED, and ED2 while exhibiting negligible interference with those workloads.
ILServer We show the results of running autoturbo on ILServer in Figure 3.7. For the SPECCPU appli-
cation mix workload, we use autoturbo to optimize the ED metric on ILServer†, since all other metrics on
ILServer† and all metrics on ILServer have a statically optimal TM setting. This is because an 8 application
SPECCPU mix fails to saturate memory bandwidth, a result of the low clock frequency and the low IPC on
the ILServer. Thus, running many interfering applications together still leads to a small but non-negligible
speedup for SPECCPU mixes for a relatively small increase in power. Like SBServer†, autoturbo success-
fully eliminates major degradations in ED but also misses some opportunities to improve ED. For PARSEC
on ILServer†, autoturbo is able to eliminate most of the degradations to ED while keeping the benefits of
TM. The only case where it failed to do so was when autoturbo activated TM for streamcluster at low thread
counts, because it could not predict that the performance gain was too small to be worthwhile. autoturbo
is also able to successfully optimize SPECpower ssj2008 for QPS/$ and websearch for QPS/$, ED, and
ED2 by turning on TM consistently and by not interfering with those workloads.
IBServer and HServer We observe the generality of autoturbo by demonstrating that it functions across
several generations of architectures from the same CPU vendor, as seen in Figure 3.7. A surprising result
for HServer is that while Haswell has independent frequency domains for each core, once TM is activated,
all cores will run at the same frequency, thus autoturbo is still useful. Due to space constraints, we omit the
results from the entire metric and workload evaluation and only show results for autoturbo optimizing the

CHAPTER 3. DYNAMIC MANAGEMENT OF TURBOMODE IN MODERN MULTI-CORE CHIPS 46
ED2 metric for SPECCPU application mixes. Just like with the other hardware configurations, autoturbo
intelligently enables TM to optimize for ED2. However, autoturbo will occasionally disable the use of TM
even when it is optimal to use TM. Again, this is because of the conservative heuristic used to determine if
there is too much interference.
3.6 Related Work
While the management of TM is a developing field, there is much prior work on dynamic power management
for CMPs. [62] proposes the use of a global manager that selects the proper power mode with the help of
DVFS to minimize power with respect to a given performance target. However, they assume that the under-
lying hardware supports software managed per-core DVFS, which is not available from current implementa-
tions of TM. [80] studies the use of on-chip regulators for DVFS and conclude that CMPs can benefit greatly
from its use. Per-core DVFS would allow autoturbo to selectively enable TM for cores hosting workloads
that benefit from the extra frequency boost. [33] proposes a hardware mechanism that can be used to accu-
rately model the profitability of DVFS at various operating points. If this hardware mechanism was available
on our evaluation hardware, then we could accurately use it to predict the optimal setting of TM as opposed
to using our ML model to approximate the benefits of TM. [63] also proposes using performance counters to
decide when to use low-power and high-power DVFS states. We use a machine learning to extend this idea
to create a more robust predictor that can handle workload interference from executing several workloads on
the same CMP. A key enabler for TM is per-core power gating [87], which creates large amounts of thermal
and electrical headroom that is used to boost the frequency of the remaining active cores. Another enabling
technology is for the CPU to estimate its power consumption when deciding if there is sufficient headroom
to activate TM [64]. Computational sprinting [127] utilizes thermal capacitance to temporarily overclock the
CPU to achieve increased performance for a short period of time. This is different from TM in that TM can
achieve sustained overclocking if there are idle resources on the CPU.
The field of evaluating and managing TM is nascent, as the technology was only recently introduced. [17]
evaluate TM on an Intel Nehalem processor and determine that TM improves execution time at the cost of
power. We extend their work by demonstrating that although QPS/W is not improved, the use of TM can
still improve other metrics of interest. In addition, we also implement a software TM controller that is able
to prevent the activation of TM in suboptimal scenarios.
There has been much prior work on detecting and managing workload interference caused by memory
contention. [69] quantifies destructive interference between separate processes on CMPs and concludes that
most of the performance penalty comes from contention for the shared memory bus, supporting our strategy
for detecting workload interference. [105] propose Cross-core interference Profiling Environment (CiPE) as
a way of directly detecting cross-core interference in an accurate fashion, as opposed to indirect detection
of autoturbo. CiPE uses offline profiling, which is infeasible for DCs that can accept any workload, such as

CHAPTER 3. DYNAMIC MANAGEMENT OF TURBOMODE IN MODERN MULTI-CORE CHIPS 47
Amazon EC2. However, CiPE is a viable method for characterizing applications as Sensitive and/or Inter-
fering during the offline training phase for autoturbo. [113] also deals with resource contention with an eye
towards optimizing for the ED metric. Their focus is more on scheduling, although they also use DVFS as a
fallback attempt to deal with energy inefficiency in the case of memory contention that scheduling cannot re-
solve. autoturbo complements this work, as it can optimize for energy efficiency in the newly introduced TM
regime that cannot be controlled in the same way as DVFS. [136] proposes Vantage, an effective cache par-
titioning scheme. autoturbo can use Vantage to partition the last level cache to shield Sensitive applications
from Interfering applications to maximize the benefit of TM. [50] manages interference between contending
workloads on a CMP by using clock modulation, which is another knob autoturbo can use to selectively
enable TM for workloads that benefit from a faster clock.
3.7 Conclusions
Modern servers must carefully balance performance gains against energy consumption and cost increases. We
showed that TurboMode, the dynamic overclocking of multi-core chips when thermal and power headroom
exists, can greatly improve performance. However, its impact on efficiency metrics that include energy and
cost is not always positive and depends significantly on the characteristics of the application and underlying
hardware. We developed autoturbo, a software daemon that utilizes predictive models to understand the
impact of TurboMode on the current workload and to decide if TM should be turned on or off. autoturbo
allows workloads to get the maximum benefit from TurboMode when possible (up to 68% efficiency increase
for ED2), while eliminating virtually all the cases where TurboMode leads to efficiency drop (up to -25%
for ED2). We also demonstrate that autoturbo is a general solution that works for many different hardware
configurations.

Chapter 4
Towards Energy Proportionality forOLDI Workloads
After finding opportunities to improve peak energy efficiency, we turn our attention to improving energy
efficiency during periods of low utilization. This is critical for large-scale latency-critical workloads running
in warehouse-scale computers (WSCs). Reducing the energy footprint of WSCs systems is key to their
affordability, yet difficult to achieve in practice. The lack of energy proportionality of typical WSC hardware
and the fact that important workloads (such as search) require all servers to remain up regardless of traffic
intensity renders existing power management techniques ineffective at reducing WSC energy use.
We present PEGASUS, a feedback-based controller that significantly improves the energy proportionality
of WSC systems, as demonstrated by a real implementation in a Google search cluster. PEGASUS uses re-
quest latency statistics to dynamically adjust server power management limits in a fine-grain manner, running
each server just fast enough to meet global service-level latency objectives. In large cluster experiments, PE-
GASUS reduces power consumption by up to 20%. We also estimate that a distributed version of PEGASUS
can nearly double these savings.1
4.1 Introduction
Warehouse-scale computer (WSC) systems support popular online services such as search, social networking,
webmail, online maps, automatic translation, and software as a service (SaaS). We have come to expect that
these services provide us with instantaneous, personalized, and contextual access to petabytes of data. To
fulfill the high expectations for these services, a rapid rate of improvement in the capability of WSC systems
is needed. As a result, current WSC systems include tens of thousands of multi-core servers and consume
tens of megawatts of power [6].
1This chapter is based on work that was originally published in [98].
48

CHAPTER 4. TOWARDS ENERGY PROPORTIONALITY FOR OLDI WORKLOADS 49
The massive scale of WSC systems exacerbates the challenges of energy efficiency. Modern servers are
not energy proportional: they operate at peak energy efficiency when they are fully utilized, but have much
lower efficiencies at lower utilizations [5]. While the average utilization of WSC systems for continuous
batch workloads can be around 75%, the average utilization of shared WSC systems that mix several types
of workloads, including online services, may be between 10% and 50% [6]. At medium and low utilizations,
the energy waste compared to an ideal, energy proportional system is significant. To improve the cost effec-
tiveness of WSC systems, it is important to improve their energy efficiency at low and moderate utilizations.
For throughput-oriented, batch workloads such as analytics, there are several ways to improve energy
efficiency at low utilization. We can consolidate the load onto a fraction of the servers, turning the rest of
them off [86,152]. Alternatively, we can temporarily delay tasks to create sufficiently long periods of idleness
so that deep sleep modes are effective [109, 110]. Unfortunately, neither approach works for on-line, data-
intensive (OLDI) workloads such as search, social networking, or SaaS. Such user-facing services are often
scaled across thousands of servers and access distributed state stored across all servers. They also operate
with strict service level objectives (SLOs) that are in the range of a few milliseconds or even hundreds of
microseconds. OLDI workloads operate frequently at low or medium utilization due to diurnal patterns in
user traffic [110]. Nevertheless, server consolidation is not possible, as the state does not fit in a small fraction
of the servers and moving the state is expensive. Similarly, delaying tasks for hundreds of milliseconds for
deep sleep modes to be practical would lead to unacceptable SLO violations. Even at very low utilization,
OLDI servers receive thousands of requests per second. Finally, co-scheduling other workloads on the same
servers to utilize spare processing capacity is often impractical as most of the memory is already reserved
and interference can lead to unacceptable degradation on latency SLO [28, 73, 105, 163].
A promising method to improve energy efficiency for OLDI workloads at low or medium utilization is to
scale the servers’ processing capacity to match the available work. We can reduce power consumption by
scaling voltage and clock frequency (DVFS) or the number of active cores in the server. Traditionally, DVFS
is controlled by monitoring CPU utilization, raising the frequency when utilization is high and decreasing it
when it is low. We demonstrate that DVFS schemes that use CPU utilization as the only control input are
ineffective for OLDI workloads as they can cause SLO violations. We observe that OLDI workloads exhibit
different latencies for the same CPU utilization at different CPU frequencies. This makes it particularly
difficult to correlate CPU utilization to request latency at different DVFS settings and complicates the design
of robust control schemes.
We advocate making OLDI workloads more energy efficient across the utilization spectrum through fine-
grain management of the servers’ processing capacity based on the observed, end-to-end, request latency. The
proposed iso-latency power management technique adjusts server performance so that the OLDI workload
“barely meets” its SLO goal. By directly using the overall request latency and SLO targets, instead of the
inaccurate and indirect metric of CPU utilization, we can achieve robust performance (no degradation of
the SLO), while saving significant amounts of power during low and medium utilization periods. We show
that iso-latency power management achieves the highest savings when using a fine-grain CPU power control

CHAPTER 4. TOWARDS ENERGY PROPORTIONALITY FOR OLDI WORKLOADS 50
mechanism, Running Average Power Limit (RAPL) [60], which allows the enforcement of CPU power limits
in increments of 0.125W.
The specific contributions of this chapter are the following. We characterize Google workloads, including
search, with real-world anonymized traffic traces to show the high cost of the lack of energy proportionality
in WSC systems. We also quantify why power management techniques for batch workloads or utilization-
based DVFS management are ineffective for OLDI workloads. We show that latency slack is a better metric
compared to CPU utilization when performing power saving decisions. Next, we characterize the potential
of iso-latency power management using RAPL and show that it improves energy proportionality and can
lead to overall power savings of 20% to 40% for low and medium utilization periods of OLDI workloads.
Since the cluster is operated at low and medium utilizations for nearly half the time, iso-latency translates to
significant power savings. The characterization of iso-latency demonstrates some non-intuitive results such
as: a) aggressive power management works for tail latency and can be applied with minimal extra power at
scale; b) ultra-low latency services benefit even more from aggressive power management techniques. Finally,
we describe PEGASUS, a feedback-based controller that implements iso-latency power management. For
search, PEGASUS leads to overall power savings of up to 20% in clusters with thousands of servers without
impacting the latency SLO. In addition, PEGASUS makes clusters nearly energy proportional for OLDI
workloads in the 20% to 50% utilization range. If we discount the idle power at zero utilization (due to power
for fans, power supplies, DRAM refresh etc.), PEGASUS meets and often beats energy proportionality in
this range. We also estimate that a distributed version of PEGASUS that identifies less utilized servers in
the cluster to further reduce power on can achieve the full potential of iso-latency power management, or
nearly 40% power savings. To the best of our knowledge, this is the first study to achieve such power savings
on an actual warehouse-scale deployment and the first to evaluate fine-grained versus coarse-grained power
management tied to application latency SLO metrics.
4.2 On-line, Data Intensive Workloads
4.2.1 Background
On-line, data intensive (OLDI) workloads such as search, social networking, and SaaS represent the vast
majority of activity on the Internet. They are driven by user requests that require mining through massive
datasets and then returning combined results from many servers in near real-time. Hence, they partition the
data across a large number of servers and use multi-tier, high fan-out organizations to process each request.
For instance, in web search, processing a user query involves fanning out the query through a large tree of
nodes [25]. In addition, DRAM and Flash memory are often used for fast access to data.
OLDI workloads are quite different from large-scale batch workloads like MapReduce. In addition to
high throughput requirements, OLDI workloads have strict requirements on end-user latency. In our search
example, since the rendered content can only be sent back to the user after all steps have completed, a
slowdown in any one server in the tree will lead to either a slowdown for the user or degraded results,

CHAPTER 4. TOWARDS ENERGY PROPORTIONALITY FOR OLDI WORKLOADS 51
Web Server
Root
Parent Parent Parent
Leaf Leaf Leaf
… …
Front end
Back end
search set up
Application Logic
memkeyval DB tier
Back end
sample memkeyval set up
Web Server
Figure 4.1: Configurations for search and memkeyval.
either of which result in poor end-user experience. Social networking and SaaS exhibit similar behavior in
terms of high fanout and a dependence on the slowest component. It is well understood that an additional
server-side delay of just 400msec for page-rendering has a measurable impact on user experience and ad-
revenue [137]. Moreover, the large number of users and requests makes it important to optimize tail latency,
not just average latency. Achieving low tail latency at the scale and complexity of OLDI workloads is quite
difficult [26], making power management challenging. For instance, rendering a social networking news
feed involves queries for the user’s connections and his/her recent status updates; ranking, filtering, and
formatting these updates; retrieving related media files; selecting and formatting relevant advertisements and
recommendations; etc. Since the rendered content can only be sent back to the user after all the steps have
completed, a slowdown in any one component will lead to either a slowdown for the user or degraded results,
either of which result in a poor end-user experience.
4.2.2 OLDI Workloads for This Study
We use two production Google services in this study.
search: We evaluate the query serving portion of a production web search service. search requires thousands
of leaf nodes all running in parallel in order to meet the stringent SLO, which is on the order of tens of
milliseconds. Figure 4.1 shows an example search topology: a user query is first processed by a front-end
server, which then eventually fans out the query to a large number of leaf nodes [25]. The search index is
sharded across all of the leaf nodes and each query is processed by every leaf. Relevant results from each

CHAPTER 4. TOWARDS ENERGY PROPORTIONALITY FOR OLDI WORKLOADS 52
leaf are then aggregated, scored, ordered, and sent to the front-end to be presented to the user. Most of the
processing is in the leaf nodes that mine through their respective shards. Consequently, leaf nodes account
for the vast majority of nodes in a search cluster and are responsible for an overwhelming fraction of power
consumed. To drive search, we use an example serving index from Google. We use an anonymized trace
of real user queries for load generation. We can also generate a controlled amount of load by replaying the
query log at different QPS (queries per second) levels.
memkeyval: We also evaluate an in-memory key-value store used in production services at Google. Func-
tionally, it is similar to memcached, an open source in-memory key-value store [111]. While memkeyval is
not directly user-facing, it is used in the backends of several Google web services. Other large-scale OLDI
services, such as Facebook and Twitter, use memcached extensively in user-facing services as well, making
this an important workload. Figure 4.1 shows an example of how memkeyval is used by user-facing services.
memkeyval is architected such that each memkeyval server is independent from all other memkeyval servers.
Compared to search, there is significantly less processing per request and no direct fan out of requests. In-
stead, the fan-out occurs at a higher tier, where the web tier or application logic can issue tens or hundreds of
requests to satisfy a single user request. Because of this, memkeyval has even tighter SLO latency constraints
than search, typically on the order of tens or hundreds of microseconds. Hence, memkeyval adds to our anal-
ysis an example of an ultra-low latency workload. To generate load for memkeyval, we captured a trace of
requests from production services, which we can replay at varying QPS speeds.
4.2.3 Power Management Challenges
Figure 4.2 shows the diurnal load variation for search on an example cluster. Load is normalized to the
peak capacity of the cluster and power is normalized to the power consumed at peak capacity. There are
several interesting observations. First, the cluster is not overprovisioned as it is highly utilized for roughly
half the day, demonstrating that both the number and type of servers are well tuned for the peak of this
workload. However, load is not constant. There is a very pronounced trough that represents a long period
of low utilization. Second, the cluster exhibits poor energy proportionality during off-peak periods. Ideally,
power consumption should closely track load. However, the actual power consumed is much higher: at 30%
utilization the cluster draws 70% of its peak power. Since a major reason for lack of proportionality is the
non-zero idle power (due to various components such as fans, power supplies, memory refresh, etc.), we also
define a relaxed energy proportionality that only looks at the energy proportionality of dynamic power by
discounting the idle power draw at 0% utilization. The Dynamic EP in Figure 4.2 is defined such that the
power at 100% utilization is 100% of peak power, the power at 0% utilization is the idle power of the cluster,
and all powers in between fall on a line connecting the two points. Dynamic EP represents the expected power
draw of a cluster assuming that idle power cannot be removed and is often used to model server power [6].
Even after discounting idle power, the cluster draws far more power than expected at low utilizations. This
is the opportunity gap we target: reducing the operating cost of large WSC systems by making them more
energy proportional during periods of low or medium utilization.

CHAPTER 4. TOWARDS ENERGY PROPORTIONALITY FOR OLDI WORKLOADS 53
0 5 10 15 20Time (hr)
0
20
40
60
80
100
% o
f pea
k
Opportunity Gap
Example diurnal patterns for search
QPS Dynamic EP (Power) Power
Figure 4.2: Example diurnal load and power draw for a search cluster over 24 hours. For a perfectly energyproportional cluster, power draw would perfectly track load (QPS). Dynamic EP (Power) indicates the hypo-thetical amount of power consumed if the idle power is assumed to be constant and the active power is energyproportional.
Existing power management techniques for WSC systems cannot address this opportunity gap for OLDI
workloads. Several techniques advocate consolidating workloads onto a fraction of the available servers dur-
ing periods of low utilization so that the remaining servers can be turned off [73]. Hence, while each server
is not energy proportional, the WSC system as a whole becomes nearly energy proportional. Nevertheless,
workload consolidation is difficult for OLDI workloads as the number of servers is set by both peak pro-
cessing requirements and data storage requirements. For instance, a search cluster is sized to hold the entire
search index in memory, and individual nodes cannot be powered off without losing part of the search index,
which will impact search quality. Even if spare memory storage is available, moving tens of gigabytes of state
in and out of servers is expensive and time consuming, making it difficult to react to fast or small changes in
load. Other techniques focus on individual servers and attempt to maximize idle periods so that deep sleep
power modes can be used. For instance, PowerNap would need to batch tasks on each server in order to
create sufficiently long idle periods [109, 110]. Full system idle power modes, such as ACPI S3, have tran-
sition times on the order of seconds [110]. Since OLDI workloads have latency requirements in the order of
milliseconds or microseconds, use of idle power modes produces frequent SLO violations [110]. Moreover,

CHAPTER 4. TOWARDS ENERGY PROPORTIONALITY FOR OLDI WORKLOADS 54
OLDI workloads usually have a large fan-out (see Figure 4.1) when processing user queries. A single user
query to the front-end will lead to forwarding of the query to all leaf nodes. As a result, even a small request
rate can create a non-trivial amount of work on each server. For instance, consider a cluster sized to handle a
peak load of 10,000 queries per second (QPS) using 1000 servers. Even at 10% load, each of the 1000 nodes
are seeing on average one query per millisecond. There is simply not enough idleness to invoke some of the
more effective low power modes.
4.3 Energy Proportionality Analysis for OLDI
4.3.1 Methodology
To understand the challenges of improving energy efficiency for OLDI workloads during low utilization
periods, we collected power and latency measurements from a cluster with Sandy Bridge CPUs running
production workloads. The power measured is full system power of the cluster and is equivalent to the
power draw at the wall socket. For search, latency was measured at the root of the fan-out tree as opposed
to the latency at each individual leaf node. By measuring as close to the end-user as possible, we have a
more accurate assessment of the latency of the entire cluster. For search, we use the 30 second moving
average latency (µ/30s) as one of the latency SLO metrics. Since we measure latency at the root where
the effects of slow leafs are already seen, using mean latency at the root is an acceptable metric. We also
collected 95%-ile and 99.9%-ile tail latencies at the root for search as a sensitivity analysis for further insights.
For memkeyval, we measure mean latency, as well as 95%-ile and 99%-ile tail latencies. This is because
memkeyval is typically used in such a way that the higher-level service waits for several parallel memkeyval
requests to several servers to complete before being able to return a result. Thus, the overall latency of the
entire memkeyval service is dependent on the slowest server, which is estimated by the tail latency of an
individual server.
4.3.2 Analysis of Energy Inefficiencies
Figures 4.3 and Figure 4.4 show the total cluster power and the CPU-only power respectively at varying
loads for search and memkeyval. As expected, the total cluster power consumed is far higher than the power
consumed by an ideal, energy proportional cluster. We also plot the power draw of a cluster that exhibits
energy proportional behavior on its active power (Dynamic EP). Eliminating idle draw due to fans, power
supplies, and leakage power is quite difficult in the absence of sufficiently long idle periods. However, we
expect that the cluster should be fairly close to energy proportional once idle power is removed. Figure 4.3
shows this is not the case in practice. The total cluster power consumed is still much higher than the Dynamic
EP power across all utilization points for both workloads. While idle power is a major contributor to the
energy proportionality problem, it alone does not account for the large gap between the power behavior of
current clusters and the behavior of energy proportional clusters. To improve energy proportionality, we focus

CHAPTER 4. TOWARDS ENERGY PROPORTIONALITY FOR OLDI WORKLOADS 55
0 20 40 60 80 100% of peak load
0
20
40
60
80
100
% o
f pea
k po
wer
search full system power
0 20 40 60 80 100% of peak load
0
20
40
60
80
100
% o
f pea
k po
wer
memkeyval full system power
0.0 0.2 0.4 0.6 0.8 1.00.00.20.40.60.81.0
Measured EP Dynamic EP
Figure 4.3: Total cluster power for search and memkeyval at various loads, normalized to peak power at 100%load.
0 20 40 60 80 100% of peak load
0
20
40
60
80
100
% o
f pea
k CP
U p
ower
search CPU power
0 20 40 60 80 100% of peak load
0
20
40
60
80
100
% o
f pea
k CP
U p
ower
memkeyval CPU power
0.0 0.2 0.4 0.6 0.8 1.00.00.20.40.60.81.0
Measured EP Dynamic EP
Figure 4.4: CPU power for search and memkeyval at various loads, normalized to peak CPU power at 100%load.
on addressing active power draw when the cluster is underutilized. We leave the improvement of idle power
to future work.
Since the CPUs are the largest contributors to server power in modern servers (40% of total power at idle
and 66% at peak [6]), we focus on CPU power as measured directly using on-board sensors in the servers
(Figure 4.4). The power consumed by the CPU is not energy proportional and has the same shape as the

CHAPTER 4. TOWARDS ENERGY PROPORTIONALITY FOR OLDI WORKLOADS 56
0 25 50 75 100% of peak load
0
20
40
60
80
100%
of t
ime
Active
c1
c7search CPU idle
0 25 50 75 100% of peak load
0
20
40
60
80
100
% o
f tim
e
Active
c1
memkeyval CPU idle
Figure 4.5: Characterization of CPU sleep states for search and memkeyval at various utilizations.
power curves of the entire cluster (Figure 4.3). This establishes that the CPU is a major contributor to the
non-energy proportionality for these OLDI workloads, even if idle power is ignored. Therefore, we focus on
understanding the cause of non-energy proportionality on the CPU and how to reduce the power consumed
by the CPU in the context of making the entire WSC system more energy proportional.
The default CPU power management approach for the servers we study is to execute at the highest avail-
able CPU active power state (p-state), followed by idling in some sleep state. Namely, the power saving
driver in use is intel idle [56]. We characterized the fraction of time each core spends active and the fraction
of time it spends in various sleep states (c1, c3, c7) in Figure 4.5. In c1, the core is clock gated. In c3,
the L1 and L2 caches are flushed and clock gated. In c7, the core is power gated [134]. c1, c3, and c7 are
ordered in increasing order of power savings [59]. c1, c3, and c7 have wake up latencies of almost zero,
10µs, and 100µs [59, 110]. We observe that both search and memkeyval do not spend very much time in
the low power c7 sleep state. The vast majority of idle time is spent in the c1 sleep state, which does not
save very much power but has almost zero exit latency. This is because in OLDI workloads, idle periods are
particularly short even at low utilization, providing little opportunity to exploit deeper sleep states with higher
exit latencies [110]. The idle behavior of OLDI workloads contrasts sharply with application behavior for
mobile and client devices, where racing to idle is effective because of long idle times between short bursts of
activity [127]. These observations motivate us to improve proportionality by improving active mode power
consumption and by reducing the (ineffective) CPU idle time for OLDI workloads.
Figure 4.6 provides a clue towards achieving this goal. It shows how the various latencies of search and
memkeyval are increasing with the amount of load on the cluster. It is important to remember that SLO targets
for user or internal requests are set at a fixed value. These targets are independent of the immediate load on
the cluster. Furthermore, SLO targets are typically set right at the knee of the latency/throughput curve.
At loads below these inflection points, we observe that: a) there is still significant headroom between the
measured latency and the SLO target; b) workload developers and system operators only care about avoiding
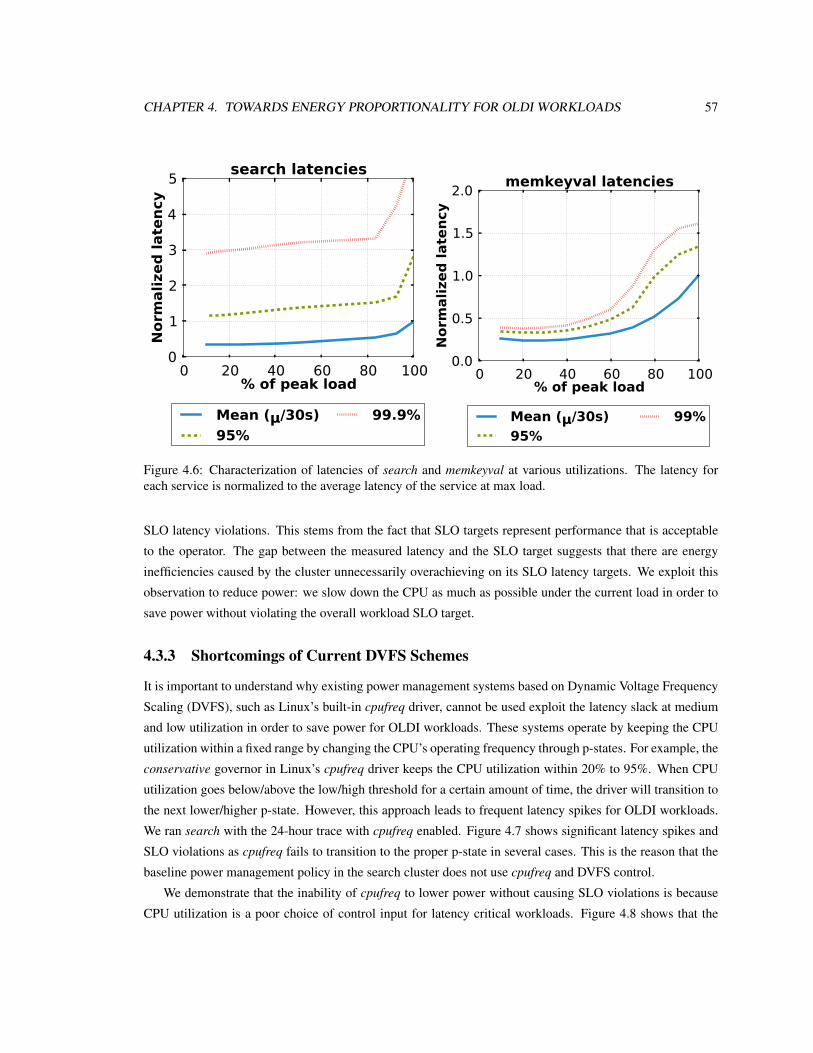
CHAPTER 4. TOWARDS ENERGY PROPORTIONALITY FOR OLDI WORKLOADS 57
0 20 40 60 80 100% of peak load
0
1
2
3
4
5N
orm
aliz
ed la
tenc
ysearch latencies
Mean ( /30s)95%
99.9%
0 20 40 60 80 100% of peak load
0.0
0.5
1.0
1.5
2.0
Nor
mal
ized
late
ncy
memkeyval latencies
Mean ( /30s)95%
99%
Figure 4.6: Characterization of latencies of search and memkeyval at various utilizations. The latency foreach service is normalized to the average latency of the service at max load.
SLO latency violations. This stems from the fact that SLO targets represent performance that is acceptable
to the operator. The gap between the measured latency and the SLO target suggests that there are energy
inefficiencies caused by the cluster unnecessarily overachieving on its SLO latency targets. We exploit this
observation to reduce power: we slow down the CPU as much as possible under the current load in order to
save power without violating the overall workload SLO target.
4.3.3 Shortcomings of Current DVFS Schemes
It is important to understand why existing power management systems based on Dynamic Voltage Frequency
Scaling (DVFS), such as Linux’s built-in cpufreq driver, cannot be used exploit the latency slack at medium
and low utilization in order to save power for OLDI workloads. These systems operate by keeping the CPU
utilization within a fixed range by changing the CPU’s operating frequency through p-states. For example, the
conservative governor in Linux’s cpufreq driver keeps the CPU utilization within 20% to 95%. When CPU
utilization goes below/above the low/high threshold for a certain amount of time, the driver will transition to
the next lower/higher p-state. However, this approach leads to frequent latency spikes for OLDI workloads.
We ran search with the 24-hour trace with cpufreq enabled. Figure 4.7 shows significant latency spikes and
SLO violations as cpufreq fails to transition to the proper p-state in several cases. This is the reason that the
baseline power management policy in the search cluster does not use cpufreq and DVFS control.
We demonstrate that the inability of cpufreq to lower power without causing SLO violations is because
CPU utilization is a poor choice of control input for latency critical workloads. Figure 4.8 shows that the

CHAPTER 4. TOWARDS ENERGY PROPORTIONALITY FOR OLDI WORKLOADS 58
0 5 10 15 20Time (hr)
0.0
0.2
0.4
0.6
0.8
1.0
1.2
1.4Fr
acti
on o
f SLO
late
ncy
(/3
0s)
Latency for search with cpufreq
Figure 4.7: Latency of search with cpufreq, showing SLA violations. The solid horizontal line shows thetarget SLO latency.
latency of search is different at the same CPU utilization across different p-states. Therefore, CPU utilization
alone is fundamentally insufficient to estimate latency. No amount of tuning CPU utilization thresholds
would allow a DVFS controller to achieve optimal power savings without SLO violations. Depending on the
workload complexity and its SLO targets, the thresholds will be different and would vary for each p-state.
Thus, we argue that to save power without SLO violations, we need to directly use application-level latency
as the input to power control. Note that the use of CPU utilization as the only control input is a shortcoming
not only limited to cpufreq: several research proposals [36, 53, 124, 129], Intel’s demand-based switching
mechanism [54], and most OS implementations also use CPU utilization as the sole control input.
Another shortcoming of existing DVFS systems is that they use p-states to manage the trade-off between
power and performance. However, p-state based power management is extremely coarse grained. For in-
stance, dropping from p0 to p1 would disable TurboBoost, which can result in a significant frequency drop,
up to 700MHz for an example Xeon E5-2667v2 CPU [55]. This means that using p-states alone misses on
opportunities for power savings. For instance, in Figure 4.8, at utilization ranges between 65%-85%, the
highest power p-state (p0) must be used, as the use of p1 would cause SLO violations. This motivates the
need for fine-grain CPU power management in hardware.

CHAPTER 4. TOWARDS ENERGY PROPORTIONALITY FOR OLDI WORKLOADS 59
0 20 40 60 80 100CPU utilization (%)
0.0
0.5
1.0
1.5
2.0
2.5
3.0
3.5
Frac
tion
of S
LO la
tenc
y (
/30s
)
search latency vs. p-states
p0 p1 lowest p-state
Figure 4.8: Characterization of search’s latency dependency on both p-state and CPU utilization. The solidhorizontal line shows the target SLO latency.
4.4 Iso-latency Power Management
We propose a power management policy called iso-latency that addresses the shortcomings of existing DVFS
systems. At a high level, it monitors the end-to-end request latencies of an OLDI service and adjusts the
power settings of all servers so that SLO targets are barely met under any load. Iso-latency is inherently a
dynamic policy as there is no one CPU p-state that will give optimal power savings while preventing SLO
violations for all loads and all workloads. Intuitively, iso-latency is making a trade-off between latency and
power. Figure 4.6 shows that, at low and medium utilization, there is latency headroom that can be exchanged
for power savings without impacting SLO targets.
4.4.1 Iso-latency Potential
Before we discuss our implementation of iso-latency, we analyze the potential benefits for our OLDI work-
loads and servers.
To adjust the power settings of servers, we use a fine-grain power management feature introduced in recent
Intel chips named Running Average Power Limit (RAPL) [60]. The RAPL interface allows the user to set an
average power limit that the CPU should never exceed. On the servers we evaluate, we used the default time

CHAPTER 4. TOWARDS ENERGY PROPORTIONALITY FOR OLDI WORKLOADS 60
0 20 40 60 80 100% of peak load
0
20
40
60
80
100
% o
f pea
k ba
selin
e po
wer
search iso-latency power
0 20 40 60 80 100% of peak load
0
20
40
60
80
100
Savi
ngs
from
bas
elin
e (%
)
search iso-latency power
0.0 0.2 0.4 0.6 0.8 1.00.00.20.40.60.81.0
iso[ /30s] iso[99.9%] EP Dynamic EP
0 20 40 60 80 100% of peak load
0
20
40
60
80
100
% o
f pea
k ba
selin
e po
wer
memkeyval iso-latency power
0 20 40 60 80 100% of peak load
0
20
40
60
80
100
Savi
ngs
from
bas
elin
e (%
)
memkeyval iso-latency power
0.0 0.2 0.4 0.6 0.8 1.00.00.20.40.60.81.0
iso[ /30s] iso[99%] EP Dynamic EP
Figure 4.9: Characterization of power consumption for search and memkeyval for iso-latency with variouslatency SLO metrics. The SLO target is the latency at peak load (relaxed)
period to average over (45ms). RAPL can be programmed dynamically by writing a model specific register
(MSR), and changes to the power limit take effect within less than 1 millisecond. The interface exports a
fine grained power control knob, as the power limit can be set in increments of 0.125W. RAPL enforces this
power limit mainly by scaling the voltage and frequency but can also modulate the CPU frequency to achieve
average frequencies in between p-state frequencies. Compared to p-states, RAPL allows us to exploit a far
wider spectrum of power-performance trade-offs, which is critical to determining the optimal operating point
for iso-latency.
To understand the potential of iso-latency for search and memkeyval, we sweep the RAPL power limit at
a given load to find the point of minimum cluster power that satisfies the SLO target. For sensitivity analysis,
we use several SLO targets. The first SLO target is the latency of the workload at maximum utilization.
This is a more relaxed constraint, as latency is high at peak throughput (past the knee of the latency-load
curve). The second SLO target is more aggressive, as it is the latency measured at the knee of the curve. For
search, the knee is at 80% of peak utilization, while for memkeyval, the knee is at 60% of peak utilization.

CHAPTER 4. TOWARDS ENERGY PROPORTIONALITY FOR OLDI WORKLOADS 61
0 20 40 60 80 100% of peak load
0
20
40
60
80
100
% o
f pea
k ba
selin
e po
wer
search iso-latency power
0 20 40 60 80 100% of peak load
0
20
40
60
80
100
Savi
ngs
from
bas
elin
e (%
)
search iso-latency power
0.0 0.2 0.4 0.6 0.8 1.00.00.20.40.60.81.0
iso[ /30s] iso[99.9%] EP Dynamic EP
0 20 40 60 80 100% of peak load
0
20
40
60
80
100
% o
f pea
k ba
selin
e po
wer
memkeyval iso-latency power
0 20 40 60 80 100% of peak load
0
20
40
60
80
100
Savi
ngs
from
bas
elin
e (%
)
memkeyval iso-latency power
0.0 0.2 0.4 0.6 0.8 1.00.00.20.40.60.81.0
iso[ /30s] iso[99%] EP Dynamic EP
Figure 4.10: Characterization of power consumption for search and memkeyval for iso-latency with variouslatency SLO metrics. The SLO target used is more aggressive compared to Figure 4.9.
Figures 4.9 and 4.10 compare the baseline power consumption to that of a cluster managed by an ideal iso-
latency controller that always finds the minimum power setting that avoids SLO violations. The right column
of the figures shows the power savings using iso-latency over the baseline. For clarity, we omit the 95%-ile
tail latency result for both search and memkeyval, as it is almost indistinguishable from the 99.9%-ile latency
and 99%-ile latency curves for search and memkeyval, respectively.
The most salient observation is that iso-latency is able to save a significant amount of power compared to
the baseline. In the utilization range of 20% to 80%, iso-latency can save 20% to 40% power and serve the
same load without SLO violations. This result holds for both OLDI workloads, even for the aggressive SLO
target (Figure 4.10), demonstrating that even a relatively small amount of latency headroom can be turned into
large power savings. A physical analogy can be made to explain this result. The baseline can be compared
to driving a car with sudden stops and starts. iso-latency would then be driving the car at a slower speed to
avoid accelerating hard and braking hard. The second way of operating a car is much more fuel efficient than
the first, which is akin to the results we have observed.
Another interesting observation from Figures 4.9 and 4.10 is that iso-latency can save significant amounts

CHAPTER 4. TOWARDS ENERGY PROPORTIONALITY FOR OLDI WORKLOADS 62
of power even when the SLO target is enforced on tail latency instead of on mean latency. For both search
and memkeyval, iso-latency does not need to spend too much additional power to meet tail latency constraints,
such as low 99.9%-ile latency. This is because most of the latency is due to queueing delay, which is respon-
sible for the sharp knee in the latency curves [26]. Iso-latency needs to run the cluster just fast enough to
avoid excessive queueing delays. While it does take a little more power to avoid queueing delay effects in tail
latency, it is not significantly more power than to avoid excessive increases in mean latency.
It is important to note that iso-latency compares well to idealized, energy proportional clusters. For the
relaxed SLO target (Figure 4.9), iso-latency leads to lower power consumption than an energy proportional
(EP) cluster at utilizations higher than 50%. The explanation is fairly simple: by using DFVS to reduce the
CPU speed, iso-latency achieves better than linear reductions in power (P = CV 2F ) by reducing F almost
linearly and V by significant amounts as well. At utilizations lower than 50%, the ideal EP cluster does
better than iso-latency because the total power consumed is dominated by idle power. When idle power is
removed (Dynamic EP), iso-latency performs as well as, if not better, than Dynamic EP at all utilizations.
When we consider aggressive SLO targets (Figure 4.10), iso-latency matches the ideal EP curve above 60%
utilization and outperforms the Dynamic EP curve above 30% utilization. A tighter SLO latency causes the
power curves to be shifted up; nevertheless, iso-latency still saves a significant amount of power over the
baseline.
Iso-latency leads to higher power savings for memkeyval compared to search, even though the former has
tighter absolute latency constraints (µsec compared to msec). Recall the characterization of idle times from
Figure 4.5. We see that memkeyval cannot take advantage of deeper sleep states and can only use c1 because
of the high request arrival rate, even at 10% load. On the other hand, because search has a lower request
arrival rate, the baseline can take advantage of more power efficient sleep states. Thus, we expect iso-latency
to benefit ultra-low-latency, high throughput workloads more, because it can convert the “race to (inefficient)
idle” scenario to a more energy efficient “operate at a moderate but constant rate”.
4.4.2 Using Other Power Management Schemes
As mentioned earlier, we can use the iso-latency policy with other power management mechanisms such
as p-states. While we believe that RAPL is a better management mechanism because it allows for fine-
grain control, it is not currently available on all CPU chips. Another power management mechanism is to
consolidate the workload onto a sufficient subset of the cores in each CPU during times of low utilization. The
remaining cores can be powered off (i.e., put into c7 sleep state) so that power is saved without experiencing
SLO violations. We characterize iso-latency with CPU consolidation in Figure 4.11. Instead of sweeping
RAPL settings to find the most appropriate for each utilization level, we now sweep the number of active
cores per server. We leave the CPU operating at its highest p-state in order to maximize the number of cores
that can be turned off. The results in Figure 4.11 are for search using the relaxed SLO target on the mean
latency. These are the easiest constraints one can put on iso-latency to obtain maximum power savings.
Figure 4.11 shows that core consolidation is not as effective as RAPL when used as a power management

CHAPTER 4. TOWARDS ENERGY PROPORTIONALITY FOR OLDI WORKLOADS 63
0 20 40 60 80 100% of peak load
0
20
40
60
80
100
% o
f pea
k ba
selin
e po
wer
search power
Core Consolidation RAPL
Figure 4.11: Comparison of iso-latency with core consolidation to RAPL. Measured total cluster powerconsumed by search at various utilizations, normalized to peak power at 100% load.
scheme for iso-latency. The static power savings achieved by shutting down cores are eclipsed by the far
larger dynamic power required to operate the remaining cores at a high frequency. This is the basic phe-
nomenon driving the multi-core evolution: assuming sufficient parallelism, many slow cores is more energy
efficient than fewer faster cores. Nevertheless, it is still interesting to explore how core consolidation can
be combined with RAPL (DVFS control) to create a better power management mechanism. Depending on
the exact trade-offs between static and dynamic power at low frequencies, it may be better to have a few
moderately fast cores as opposed to many slow cores. This is an interesting trade-off to examine in future
work.
4.5 A Dynamic Controller for Iso-latency
Having established the potential of iso-latency as a power management policy, we now discuss the imple-
mentation of a cluster-wide, iso-latency controller for OLDI workloads.

CHAPTER 4. TOWARDS ENERGY PROPORTIONALITY FOR OLDI WORKLOADS 64
4.5.1 PEGASUS Description
PEGASUS (Power and Energy Gains Automatically Saved from Underutilized Systems) is a dynamic,
feedback-based controller that enforces the iso-latency policy. At a high level, PEGASUS is a feedback-
based controller that uses both the measured latency from the OLDI workload and the SLO target to adjust
the RAPL settings in a fine-grain manner across all servers. During periods with significant latency head-
room, PEGASUS will automatically lower the power limit until the latency headroom has been reduced.
Conversely, when measured latency is getting close to the SLO target, PEGASUS will raise the power limit
until there is sufficient latency headroom. PEGASUS always keeps a small latency headroom in order to
ensure stability and robust handling of load increases. This latency headroom is configurable and determined
based on the gradient of load spikes. Our current implementation of PEGASUS assumes a uniform cluster
and thus applies the same RAPL setting across all servers. We discuss the implications of this assumption in
Section 4.5.2.
Figure 4.12 shows a diagram of PEGASUS. The Application Performance Monitor monitors workload
latency and reports the amount of headroom to the PEGASUS controller. This component can piggyback
on performance monitoring infrastructure already in OLDI workloads. The PEGASUS controller in turn
is responsible for determining the proper power adjustment based on the latency headroom, which it then
periodically communicates to each of the local agents running on each server. The power adjustment is
informed by the power savings policy, which is tailored to the OLDI workload. The frequency at which the
PEGASUS controller sends updated power limits to the local agent is determined by how long it takes before
the effects of the new power limit are seen in the application latency. This delay is application dependent,
due to many workload specific factors such as the inertia of queries already in flight in the cluster, the delay
in the latency measurement system, etc. The PEGASUS controller will send updates at a fixed frequency
to the local agents, even if the power limit is staying constant. Finally, the local agents set the power limit
from the PEGASUS controller using the RAPL interface. In case of a communication breakdown between
the PEGASUS controller and the local agents, the local agents will automatically default to maximum power.
Hence, PEGASUS failures cannot jeopardize the SLO for the workload.
The PEGASUS controller is very simple, around 200 lines of code, and has modest resource require-
ments. In its current form, it is based on a multi-step bang-bang controller that outputs a ∆(PowerLimit%)
depending on the latency headroom. The thresholds and the control outputs are workload dependent and are
determined empirically. We describe control parameters for search in Table 4.1 For our experiments, we ran
the PEGASUS controller on a single core of a single server. In our experiments, running on one core is more
than enough to control the thousands of servers in the cluster. We profiled the performance of the PEGASUS
controller, and determined that most of the time (> 90%) is spent on transmitting the network packets to
the local agents. When scaled to thousands of servers, the PEGASUS controller takes approximately 500
milliseconds to send out the command packet to all of the local agents. This delay can be shortened by
parallelizing the networking portion of the PEGASUS controller to use multiple cores. However, for our
experiments, the 500 millisecond delay does not appear to negatively impact the control scheme nor the

CHAPTER 4. TOWARDS ENERGY PROPORTIONALITY FOR OLDI WORKLOADS 65
Server
OLDI workload
Local Agent
HW Power
Server
OLDI workload
Local Agent
HW Power
Server
OLDI workload
Local Agent
HW Power…
PEGASUS controller
Application Performance
Monitor
Figure 4.12: Block diagram showing high level operation and communication paths for PEGASUS.
performance of the OLDI workload.
We designed PEGASUS to be a general controller that works with any OLDI workload. PEGASUS is
separated into two distinct components: policy (control parameters) and enforcement (actuation). The policy
component is responsible for determining how much to adjust the CPU power limit. The policy portion is
workload specific, and is dependent on the characteristics of the workload, such as the latency SLO metric
(mean or tail latency) as well as the sensitivity of the workload to CPU power. For instance, search with
its SLO target measured as the mean latency over 30 seconds will need to make smaller power adjustments
compared to the same workload with its SLO target measured as the mean latency over 60 seconds. This is
because PEGASUS needs to be more conservative when managing workloads with tighter SLO constraints,
as there is less room for error. The enforcement portion is workload agnostic. It applies the CPU power
limit determined by the policy of PEGASUS uniformly across all nodes in the cluster. Once the local agent
receives a request from the central controller, it only takes milliseconds before the new power limit is enforced
by RAPL.
4.5.2 PEGASUS Evaluation
We evaluate PEGASUS on the more challenging of the two OLDI workloads, search. We chose search
because it is a complete, large-scale, OLDI workload with high fan-out across multiple tiers. In addition,
because search is a complete service, measuring the overall latency of a user query is straightforward, as it is
the latency at the root of the distribution tree. Moreover, the power savings potential for search is lower than
that for memkeyval (see Figure 4.10). Thus, evaluating PEGASUS on search paints a more conservative and
realistic picture of its capabilities.
The evaluation setup closely approximates production clusters and their load for search. We use the
same kind of servers and the same number of servers used for production websearch. We then populate

CHAPTER 4. TOWARDS ENERGY PROPORTIONALITY FOR OLDI WORKLOADS 66
0 5 10 15 20Time (hr)
0
20
40
60
80
100
% o
f pea
k po
wer
Power
EPDynamic EP
Baseline PEGASUS
0 5 10 15 20Time (hr)
0
10
20
30
40
50
Savi
ngs
over
bas
elin
e (%
)
PEGASUS power savings
0 5 10 15 20Time (hr)
0.0
0.2
0.4
0.6
0.8
1.0
Frac
tion
of S
LO la
tenc
y (
/30s
) Latency comparisonBaseline PEGASUS
Figure 4.13: Results of running PEGASUS for search on the small cluster.
these servers with portions of the Google search index. We generate search queries using an anonymized
search query log containing searches from actual users. To evaluate a realistic mix of high and low utilization
periods, we use a 24-hour load trace shown in Figure 4.2. Since we measure latency as close as possible
to the user (root of the tree), we use the mean latency over a rolling 30-second window as the latency SLO
metric. The SLO target is defined as the latency of search when operating at 90% of the maximum possible
load supported by the cluster. To provide the necessary headroom for stability and load changes, we set the
target latency for PEGASUS at 95% of the actual SLO target. For search, we only manage the leaf nodes, as
they are by far the largest contributor to power consumption.
We describe the PEGASUS policy we used for search. It is a very conservative policy that aims to slowly

CHAPTER 4. TOWARDS ENERGY PROPORTIONALITY FOR OLDI WORKLOADS 67
Let X = Measured SLO Latency, Y = Measured Instantaneous Latency, T = SLO targetInput ActionX > T Set max power, wait 5 minutesY > 1.35T Set max powerY > T Increase power by 7%0.85T ≤ Y ≤ T Keep current powerY < 0.85T Lower power by 1%Y < 0.60T Lower power by 3%
Table 4.1: PEGASUS policy for search.
reduce the power limit without causing any SLO violations along the way. The policy uses both the SLO
latency (30 second moving average) and the instantaneous latency as inputs. The actions the policy takes
based on the latency headroom is summarized in Table 4.1. The table lists rules in decreasing priority, i.e.
only the first matching rule is applied. The rationale for using both SLO latency and instantaneous latency is
that the instantaneous latency is a good early warning signal that lets PEGASUS know if an SLO violation
might occur. This gives PEGASUS the opportunity to gracefully increase the power limit to stave off SLO
violations before they happen. In addition, using the instantaneous latency allows PEGASUS to update the
power limit more frequently, as opposed to waiting for the 30 second moving average to change. In our
experiments, using the instantaneous latency allowed PEGASUS to update the power limit approximately
once every 5 seconds. However, the measured SLO latency is still used as an emergency stop. If PEGASUS
causes the SLO to be violated, then it should back off and not interfere with the OLDI workload. The
reasoning behind this is that SLO violations are typically caused by excessive load and, in these situations,
PEGASUS should not attempt to save power. When adjusting to save power, our policy for search takes
very tiny steps to avoid riding the steep slope of the latency curve near the knee. Large perturbations near
the knee can cause an order of magnitude increase in latency. Therefore, PEGASUS adopts a very cautious
wait-and-see control scheme when the latency headroom is small. The policy also includes a built-in margin
for the latency headroom where it will keep the current power setting. This margin is to account for noise in
the latency measurement caused by variations in load as well as the differences between each search query.
As before, the baseline point for comparison uses the default power manager that races to idle, cpuidle.
We measure full system power for the entire cluster as well as query latency throughout the entire duration
of the run.
Small Cluster Results:
We first evaluate PEGASUS on an experimentation cluster that contains tens of servers. We scale the portion
of the search index used to the memory capacity of the cluster. Because we are using a smaller dataset (index)
and a smaller fan-out, the SLO target used in this experiment is a fraction of the SLO target of the production
cluster.

CHAPTER 4. TOWARDS ENERGY PROPORTIONALITY FOR OLDI WORKLOADS 68
Figure 4.13 shows the results of running the 24-hour trace described previously with and without PEGA-
SUS. First, we note from the latency comparison graph that PEGASUS is able to meet the SLO target just as
well as the baseline. In addition, the query latency with PEGASUS is flat, showing that PEGASUS is oper-
ating the cluster no faster than it deems necessary. Note that both the baseline and PEGASUS occasionally
has small SLO violations (latency above 1.0). However, PEGASUS introduces no new SLO violations: it
fails to meet the SLO in exactly the same cases as the baseline. These SLO violations are unavoidable as
they are caused by load spikes exceeding the provisioned capacity of the cluster. Indeed, PEGASUS was not
even attempting to save power at those points. Looking at the power graph for the first half of the experiment
where SLO violations occur, the baseline and PEGASUS curves are identical. PEGASUS recognized that
there was not sufficient latency headroom to attempt power reduction measures.
The power savings graph in Figure 4.13 shows that PEGASUS achieves most of the theoretical potential
of iso-latency. During the low utilization portion of the diurnal load pattern, PEGASUS saves 30% power
compared to the baseline. This result establishes that the potential of iso-latency can be achieved with a
relatively simple controller. Moreover, the power consumption graph shows that PEGASUS turns the cluster
into an energy proportional one for search, if idle power is excluded. PEGASUS successfully trades off
latency headroom for power savings. Over the entire 24 hour run, PEGASUS was able to save 11% total
energy compared to the baseline. The overall energy savings are capped by the portion of time search operates
close to peak capacity in the trace (roughly half of the time). Nevertheless, the power and energy savings
from PEGASUS are essentially free, as these savings do not result in additional SLO violations.
Production Cluster Results:
We also evaluated PEGASUS on a full scale, production cluster for search at Google, which includes thou-
sands of servers. The salient differences between the full production cluster and the small cluster are that
many more servers are available and that the entire search index is used. We also use the production level
SLO latency target. For the production cluster experiments, we re-used the 24-hour trace discussed above
in order to obtain an apples-to-apples comparison between the baseline and PEGASUS (two runs). We only
use the 12 hours of the trace that contain the load trough and run it both with PEGASUS and the baseline
approach because we are confident from the small cluster results that PEGASUS can successfully detect pe-
riods of peak utilization and operate the cluster at peak performance when needed. The 12 hours containing
the trough characterize how effectively PEGASUS can turn the theoretical power savings of iso-latency into
practical ones.
Figure 4.14 presents the results on the production cluster. The latency graph shows that PEGASUS did
not cause any additional SLO violations compared to the baseline. This demonstrates that the enforcement
portion of PEGASUS can scale out to thousands of nodes without issues. This result should not be surprising,
because search must manage thousands of nodes as well. Distributing PEGASUS messages to thousands of
servers is not that different from distributing queries to thousands of leafs. It can be done quickly in a
coordinated manner. Compared with the traffic that search generates itself, PEGASUS messages to servers

CHAPTER 4. TOWARDS ENERGY PROPORTIONALITY FOR OLDI WORKLOADS 69
0 2 4 6 8 10 12Time (hr)
0
20
40
60
80
100
% o
f pea
k po
wer
Power
EPDynamic EP
Baseline PEGASUS
0 2 4 6 8 10 12Time (hr)
0
10
20
30
40
50
Savi
ngs
over
bas
elin
e (%
)
PEGASUS power savings
0 2 4 6 8 10 12Time (hr)
0.0
0.2
0.4
0.6
0.8
1.0
Frac
tion
of S
LO la
tenc
y (
/30s
) Latency comparisonBaseline PEGASUS
Figure 4.14: Results of running PEGASUS for search on the full production cluster.
are rare and are a tiny fraction of overall traffic.
Nevertheless, we do observe several issues that only emerge at scale. The delay between iterations for
PEGASUS needed to be increased (from 3 to 4 seconds) due to the increased inertia of queries within the
cluster. Namely, when the power limit changed, the observed query latency evolved more slowly compared
to that on the small cluster. Another issue is that PEGASUS is not able to save as much power on the full
cluster as compared to the small cluster. In Figure 4.14, we observe power savings between 10% and 20%
during the period of low utilization, compared to 30% in the small cluster. The reason is that PEGASUS
applies uniform RAPL settings across all the servers with the assumption that all servers have the same CPU
utilization. However, when scaling to thousands of nodes, this is no longer the case. We examined the
distribution of CPU utilizations across the leaf servers and observed a wide variance across the nodes. For

CHAPTER 4. TOWARDS ENERGY PROPORTIONALITY FOR OLDI WORKLOADS 70
0 2 4 6 8 10 12Time (hr)
0
20
40
60
80
100
% o
f pea
k po
wer
Power
EP Dynamic EP Baseline Hierarchical
0 2 4 6 8 10 12Time (hr)
0
10
20
30
40
50
Savi
ngs
over
bas
elin
e (%
)
PEGASUS power savings
Figure 4.15: Estimation of power when using distributed PEGASUS.
instance, when running at peak utilization, we observed that 50% of the nodes were operating at below 85%
peak CPU utilization. At the same time, a tiny fraction (0.2%) of nodes were operating at 100% peak CPU
utilization.
The existence of these hot nodes is due to the amount of work per query varying depending on the hotness
of the index shard for the leaf node. Because search must wait for all leaf nodes to finish processing a single
query before it can return results to the user, the entire cluster is bottlenecked by these hot nodes. The use of a
single power limit forces all servers to run as fast as the small fraction of hot leaf nodes, significantly reducing
the realized power savings. This is a challenge at large-scale that is not obvious from the small cluster results
and demonstrates the difficulties in adapting a control scheme that works well for smaller clusters to a cluster
with thousands of nodes.
The solution to the hot leaf problem is fairly straightforward: implement a distributed controller on each
server that keeps the leaf latency at a certain latency goal. The latency goal would be communicated by
the centralized controller that can monitor latency and SLO challenges at the root of the search tree. Using
such a distributed approach, only the hot leafs would be run faster to allow the overall SLO target to be met,
while the vast majority of leafs would be run at a much lower power. Compared to the simple, centralized
version of PEGASUS, the distributed version would be more complicated to implement. However, distributed
PEGASUS would be far more efficient at extracting power savings. It would also respond to latency transients
faster. For instance, the centralized PEGASUS can only detect an impending latency problem when all of
the queues in the search tree start to fill up, while distributed PEGASUS would be able to detect and act on
individual queues filling up. Moreover, the distributed controller would be able to deal with heterogeneous
server configurations in the cluster.
Unfortunately, due to scheduling constraints for the production cluster, we were unable to evaluate dis-
tributed PEGASUS. However, we estimated the power savings that can be achieved with this distributed
controller. We measured the distribution of CPU utilization on the search cluster and combined it with the
diurnal load curve to estimate how much power the distributed controller would be able to save. We show the
results of our estimation in Figure 4.15. The distributed controller is estimated to perform much better than

CHAPTER 4. TOWARDS ENERGY PROPORTIONALITY FOR OLDI WORKLOADS 71
the uniform PEGASUS controller, saving up to 35% power over the baseline. This is comparable with the
results from the small cluster, which shows that an idealized version of distributed PEGASUS can recover all
of the power savings that were lost to using a uniform power limit. We also see that distributed PEGASUS
has the opportunity to save power during periods of peak utilization, as it can save power on non-hot leaf
nodes.
4.6 Related Work
There has been substantial work related to saving power for datacenter workloads. Ranganathan et al. propose
a power budgeting approach that budgets for an “ensemble” of servers to take advantage of the rarity of
concurrent load spikes in order to increase energy efficiency [131]. Raghavendra et al. propose a coordinated
power management architecture for datacenters that integrates several otherwise disparate controllers together
without the different controllers interfering internally with each other [128]. PowerNap tackles the energy
proportionality problem by having an enhanced “nap” state that is very low power and has low wakeup
latencies [109]. Similarly, Blink advocates the use of server low power states that essentially turn off servers
[140]. However, OLDI workloads are not amenable to having individual nodes turned off. Meisner et al.
showed that coordinated full-system low power modes are needed to achieve energy proportionality for OLDI
workloads [110], which is the approach we take. Managing MapReduce clusters for energy efficiency has
also been widely explored [18, 82, 85], but these consolidation-based techniques are not applicable for OLDI
workloads with tight latency constraints and large dataset footprints.
There are many studies on optimizing energy efficiency of CPUs through the use of DVFS. However,
many of those approaches are not applicable to OLDI workloads. Many proposals are geared towards batch
workloads without latency requirements. Namely, these DVFS systems improve the energy efficiency of
throughput oriented jobs, but they do not make any guarantees on the absolute latency of the job nor do they
use the observed latency to inform the DVFS decision [37, 62, 81, 84, 129, 142, 160]. This is not acceptable
for OLDI workloads, where the SLO latency is critical. There are also DVFS schemes that aim to maximize
energy efficiency of real-time systems where jobs have deadlines [4, 93, 122, 135, 141]. However, these
systems have several limitations that make them impractical for OLDI workloads. The first is that both the
number and length of jobs must be known ahead of time, which conflicts with the dynamic nature of OLDI
workloads. The second is that these control schemes are designed for single node systems; this is not a good
fit for OLDI workloads, which run on potentially thousands of servers.
Another way to improve energy efficiency is to use otherwise idle resources on OLDI servers to perform
useful work. For example, if search operates at 50% utilization, we can fill up the remainder of the cluster
with batch workloads that would otherwise be running on other servers. This approach improves energy
efficiency by operating servers in their most power efficient mode and can save on capital expenses for
batch servers. However, workload co-location has several challenges, including resource provisioning (e.g.,
removing memory from the search index so that batch workloads can use it) and interference management so

CHAPTER 4. TOWARDS ENERGY PROPORTIONALITY FOR OLDI WORKLOADS 72
that SLO violations are avoided [21,28,68,105,126,136,163]. Investigation of the interactions of co-location
with iso-latency will be thoroughly investigated in Chapter 5.
4.7 Conclusions
We presented PEGASUS, a feedback-based controller that implements iso-latency power management policy
for large-scale, latency-critical workloads: it adjusts the power-performance settings of servers in a fine-grain
manner so that the overall workload barely meets its latency constraints for user queries at any load. We
demonstrated PEGASUS on a Google search cluster. We showed that it preserves SLO latency guarantees
and can achieve significant power savings during periods of low or medium utilization (20% to 40% sav-
ings). We also established that overall workload latency is a better control signal for power management
compared to CPU utilization. Overall, iso-latency provides a significant step forward towards the goal of
energy proportionality for one of the challenging classes of large-scale, low-latency workloads.

Chapter 5
Heracles: Improving ResourceEfficiency at Scale
Improving energy efficiency for periods of low utilization lowers the OpEX of operating a datacenter. How-
ever, the dominant portion of the TCO of datacenters lies in CapEX. The most straightforward way to improv-
ing CapEX efficiency is to have high utilization of servers. Unfortunately, user-facing, latency-sensitive ser-
vices, such as websearch, underutilize their computing resources during daily periods of low traffic. Reusing
those resources for other tasks is rarely done in production services since the contention for shared resources
can cause latency spikes that violate the service-level objectives of latency-sensitive tasks. The resulting
under-utilization hurts both the affordability and energy-efficiency of large-scale datacenters. With technol-
ogy scaling slowing down, it becomes important to address this opportunity.
We present Heracles, a feedback-based controller that enables the safe colocation of best-effort tasks
alongside a latency-critical service. Heracles dynamically manages multiple hardware and software isolation
mechanisms, such as CPU, memory, and network isolation, to ensure that the latency-sensitive job meets
latency targets while maximizing the resources given to best-effort tasks. We evaluate Heracles using pro-
duction latency-critical and batch workloads from Google and demonstrate average server utilizations of 90%
without latency violations across all the load and colocation scenarios that we evaluated.1
5.1 Introduction
Public and private cloud frameworks allow us to host an increasing number of workloads in large-scale
datacenters with tens of thousands of servers. The business models for cloud services emphasize reduced
infrastructure costs. Of the total cost of ownership (TCO) for modern energy-efficient datacenters, servers
are the largest fraction (50-70%) [6]. Maximizing server utilization is therefore important for continued
1This chapter is based on work that will be published in [99].
73

CHAPTER 5. HERACLES: IMPROVING RESOURCE EFFICIENCY AT SCALE 74
scaling.
Until recently, scaling from Moore’s law provided higher compute per dollar with every server genera-
tion, allowing datacenters to scale without raising the cost. However, with several imminent challenges in
technology scaling [32, 48], alternate approaches are needed. Some efforts seek to reduce the server cost
through balanced designs or cost-effective components [71, 92, 101]. An orthogonal approach is to improve
the return on investment and utility of datacenters by raising server utilization. Low utilization negatively
impacts both operational and capital components of cost efficiency. Energy proportionality can reduce oper-
ational expenses at low utilizations [5], which PEGASUS was able to achieve (Chapter 4). But, to amortize
the much larger capital expenses, an increased emphasis on the effective use of server resources is warranted.
Several studies have established that the average server utilization in most datacenters is low, ranging
between 10% and 50% [6, 16, 29, 108, 132, 153]. A primary reason for the low utilization is the popularity
of latency-critical (LC) services such as social media, search engines, software-as-a-service, online maps,
webmail, machine translation, online shopping and advertising. These user-facing services are typically
scaled across thousands of servers and access distributed state stored in memory or Flash across these servers.
While their load varies significantly due to diurnal patterns and unpredictable spikes in user accesses, it is
difficult to consolidate load on a subset of highly utilized servers because the application state does not fit in
a small number of servers and moving state is expensive. The cost of such underutilization can be significant.
For instance, Google websearch servers often have an average idleness of 30% over a 24 hour period [98].
For a hypothetical cluster of 10,000 servers, this idleness translates to a wasted capacity of 3,000 servers.
A promising way to improve efficiency is to launch best-effort batch (BE) tasks on the same servers and
exploit any resources underutilized by LC workloads [28,105,106]. Batch analytics frameworks can generate
numerous BE tasks and derive significant value even if these tasks are occasionally deferred or restarted [12,
16, 22, 29]. The main challenge of this approach is interference between colocated workloads on shared
resources such as caches, memory, I/O channels, and network links. LC tasks operate with strict service
level objectives (SLOs) on tail latency, and even small amounts of interference can cause significant SLO
violations [86, 105, 110]. Hence, some of the past work on workload colocation focused only on throughput
workloads [21, 116]. More recent systems predict or detect when a LC task suffers significant interference
from the colocated tasks, and avoid or terminate the colocation [29, 104, 105, 118, 154, 165]. These systems
protect LC workloads, but reduce the opportunities for higher utilization through colocation.
Recently introduced hardware features for cache isolation and fine-grained power control allow us to
improve colocation. This work aims to enable aggressive colocation of LC workloads and BE jobs by auto-
matically coordinating multiple hardware and software isolation mechanisms in modern servers. We focus
on two hardware mechanisms, shared cache partitioning and fine-grained power/frequency settings, and two
software mechanisms, core/thread scheduling and network traffic control. Our goal is to eliminate SLO vio-
lations at all levels of load for the LC job while maximizing the throughput for BE tasks.
There are several challenges towards this goal. First, we must carefully share each individual resource;
conservative allocation will minimize the throughput for BE tasks, while optimistic allocation will lead to
CHAPTER 5. HERACLES: IMPROVING RESOURCE EFFICIENCY AT SCALE 75
SLO violations for the LC tasks. Second, the performance of both types of tasks depends on multiple re-
sources, which leads to a large allocation space that must be explored in real-time as load changes. Finally,
there are non-obvious interactions between isolated and non-isolated resources in modern servers. For in-
stance, increasing the cache allocation for a LC task to avoid evictions of hot data may create memory
bandwidth interference due to the increased misses for BE tasks.
We present Heracles2, a real-time, dynamic controller that manages four hardware and software isola-
tion mechanisms in a coordinated fashion to maintain the SLO for a LC job. Compared to existing sys-
tems [29, 105, 164] that prevent colocation of interfering workloads, Heracles enables a LC task to be colo-
cated with any BE job. It guarantees that the LC workload receives just enough of each shared resource to
meet its SLO, thereby maximizing the utility from the BE task. Using online monitoring and some offline
profiling information for LC jobs, Heracles identifies when shared resources become saturated and are likely
to cause SLO violations and configures the appropriate isolation mechanism to proactively prevent that from
happening.
The specific contributions of this chapter are the following. First, we characterize the impact of interfer-
ence on shared resources for a set of production, latency-critical workloads at Google, including websearch,
an online machine learning clustering algorithm, and an in-memory key-value store. We show that the impact
of interference is non-uniform and workload dependent, thus precluding the possibility of static resource par-
titioning within a server. Next, we design Heracles and show that: a) coordinated management of multiple
isolation mechanisms is key to achieving high utilization without SLO violations; b) carefully separating
interference into independent subproblems is effective at reducing the complexity of the dynamic control
problem; and c) a local, real-time controller that monitors latency in each server is sufficient. We evaluate
Heracles on production Google servers by using it to colocate production LC and BE tasks . We show that
Heracles achieves an effective machine utilization of 90% averaged across all colocation combinations and
loads for the LC tasks while meeting the latency SLOs. Heracles also improves throughput/TCO by 15%
to 300%, depending on the initial average utilization of the datacenter. Finally, we establish the need for
hardware mechanisms to monitor and isolate DRAM bandwidth, which can improve Heracles’ accuracy and
eliminate the need for offline information.
To the best of our knowledge, this is the first study to make coordinated use of new and existing isolation
mechanisms in a real-time controller to demonstrate significant improvements in efficiency for production
systems running LC services.
5.2 Shared Resource Interference
When two or more workloads execute concurrently on a server, they compete for shared resources. This
section reviews the major sources of interference, the available isolation mechanisms, and the motivation for
dynamic management.
2The mythical hero that killed the multi-headed monster, Lernaean Hydra.

CHAPTER 5. HERACLES: IMPROVING RESOURCE EFFICIENCY AT SCALE 76
The primary shared resource in the server are the cores in the one or more CPU sockets. We cannot simply
statically partition cores between the LC and BE tasks using mechanisms such as cgroups cpuset [112].
When user-facing services such as search face a load spike, they need all available cores to meet throughput
demands without latency SLO violations. Similarly, we cannot simply assign high priority to LC tasks
and rely on OS-level scheduling of cores between tasks. Common scheduling algorithms such as Linux’s
completely fair scheduler (CFS) have vulnerabilities that lead to frequent SLO violations when LC tasks are
colocated with BE tasks [86]. Real-time scheduling algorithms (e.g., SCHED FIFO) are not work-preserving
and lead to lower utilization. The availability of HyperThreads in Intel cores leads to further complications,
as a HyperThread executing a BE task can interfere with a LC HyperThread on instruction bandwidth, shared
L1/L2 caches, and TLBs.
Numerous studies have shown that uncontrolled interference on the shared last-level cache (LLC) can be
detrimental for colocated tasks [29,43,86,104,136]. To address this issue, Intel has recently introduced LLC
cache partitioning in server chips. This functionality is called Cache Allocation Technology (CAT), and it
enables way-partitioning of a highly-associative LLC into several subsets of smaller associativity [60]. Cores
assigned to one subset can only allocate cache lines in their subset on refills, but are allowed to hit in any part
of the LLC. It is already well understood that, even when the colocation is between throughput tasks, it is best
to dynamically manage cache partitioning using either hardware [21,68,126] or software [94,116] techniques.
In the presence of user-facing workloads, dynamic management is more critical as interference translates to
large latency spikes [86]. It is also more challenging as the cache footprint of user-facing workloads changes
with load [78].
Most important LC services operate on large datasets that do not fit in on-chip caches. Hence, they put
pressure on DRAM bandwidth at high loads and are sensitive to DRAM bandwidth interference. Despite
significant research on memory bandwidth isolation [68,72,114,117], there are no hardware isolation mech-
anisms in commercially available chips. In multi-socket servers, one can isolate workloads across NUMA
channels [10, 147], but this approach constrains DRAM capacity allocation and address interleaving. The
lack of hardware support for memory bandwidth isolation complicates and constrains the efficiency of any
system that dynamically manages workload colocation.
Datacenter workloads are scale-out applications that generate network traffic. Many datacenters use
rich topologies with sufficient bisection bandwidth to avoid routing congestion in the fabric [2, 65]. There
are also several networking protocols that prioritize short messages for LC tasks over large messages for BE
tasks [3, 158]. Within a server, interference can occur both in the incoming and outgoing direction of the
network link. If a BE task causes incast interference, we can throttle its core allocation until networking
flow-control mechanisms trigger [123]. In the outgoing direction, we can use traffic control mechanisms in
operating systems like Linux to provide bandwidth guarantees to LC tasks and to prioritize their messages
ahead of those from BE tasks [15]. Traffic control must be managed dynamically as bandwidth requirements
vary with load. Static priorities can cause underutilization and starvation [121]. Similar traffic control can be
applied to solid-state storage devices [138].

CHAPTER 5. HERACLES: IMPROVING RESOURCE EFFICIENCY AT SCALE 77
Power is an additional source of interference between colocated tasks. All modern multi-core chips
have some form of dynamic overclocking, such as Turbo Boost in Intel chips and Turbo Core in AMD
chips. These techniques opportunistically raise the operating frequency of the processor chip higher than the
nominal frequency in the presence of power headroom. Thus, the clock frequency for the cores used by a LC
task depends not just on its own load, but also on the intensity of any BE task running on the same socket.
In other words, the performance of LC tasks can suffer from unexpected drops in frequency due to colocated
tasks. This interference can be mitigated with per-core dynamic voltage frequency scaling, as cores running
BE tasks can have their frequency decreased to ensure that the LC jobs maintain a guaranteed frequency. A
static policy would run all BE jobs at minimum frequency, thus ensuring that the LC tasks are not power-
limited. However, this approach severely penalizes the vast majority of BE tasks. Most BE jobs do not have
the profile of a power virus3 and LC tasks only need the additional frequency boost during periods of high
load. Thus, a dynamic solution that adjusts the allocation of power between cores is needed to ensure that LC
cores run at a guaranteed minimum frequency while maximizing the frequency of cores for BE tasks.
A major challenge with colocation is cross-resource interactions. A BE task can cause interference in all
the shared resources discussed. Similarly, many LC tasks are sensitive to interference on multiple resources.
Therefore, it is not sufficient to manage one source of interference: all potential sources need to be monitored
and carefully isolated if need be. In addition, interference sources interact with each other. For example, LLC
contention causes both types of tasks to require more DRAM bandwidth, also creating a DRAM bandwidth
bottleneck. Similarly, a task that notices network congestion may attempt to use compression, causing core
and power contention. In theory, the number of possible interactions scales with the square of the number of
interference sources, making this a very difficult problem.
5.3 Interference Characterization & Analysis
This section characterizes the impact of interference on shared resources for latency-critical services.
5.3.1 Latency-critical Workloads
We use three Google production latency-critical workloads.
websearch is the query serving portion of a production web search service. It is a scale-out workload that
provides high throughput with a strict latency SLO by using a large fan-out to thousands of leaf nodes that
process each query on their shard of the search index. The SLO for leaf nodes is in the tens of milliseconds
for the 99%-ile latency. Load for websearch is generated using an anonymized trace of real user queries.
websearch has high memory footprint as it serves shards of the search index stored in DRAM. It also
has moderate DRAM bandwidth requirements (40% of available bandwidth at 100% load), as most index
accesses miss in the LLC. However, there is a small but significant working set of instructions and data in the
hot path. Also, websearch is fairly compute intensive, as it needs to score and sort search hits. However, it
3A computation that maximizes activity and power consumption of a core.
CHAPTER 5. HERACLES: IMPROVING RESOURCE EFFICIENCY AT SCALE 78
does not consume a significant amount of network bandwidth. For this study, we reserve a small fraction of
DRAM on search servers to enable colocation of BE workloads with websearch.
ml cluster is a standalone service that performs real-time text clustering using machine-learning techniques.
Several Google services use ml cluster to assign a cluster to a snippet of text. ml cluster performs this task
by locating the closest clusters for the text in a model that was previously learned offline. This model is
kept in main memory for performance reasons. The SLO for ml cluster is a 95%-ile latency guarantee of
tens of milliseconds. ml cluster is exercised using an anonymized trace of requests captured from production
services.
Compared to websearch, ml cluster is more memory bandwidth intensive (with 60% DRAM bandwidth
usage at peak) but slightly less compute intensive (lower CPU power usage overall). It has low network
bandwidth requirements. An interesting property of ml cluster is that each request has a very small cache
footprint, but, in the presence of many outstanding requests, this translates into a large amount of cache
pressure that spills over to DRAM. This is reflected in our analysis as a super-linear growth in DRAM
bandwidth use for ml cluster versus load.
memkeyval is an in-memory key-value store, similar to memcached [111]. memkeyval is used as a caching
service in the backends of several Google web services. Other large-scale web services, such as Facebook
and Twitter, use memcached extensively. memkeyval has significantly less processing per request compared
to websearch, leading to extremely high throughput in the order of hundreds of thousands of requests per
second at peak. Since each request is processed quickly, the SLO latency is very low, in the few hundreds of
microseconds for the 99%-ile latency. Load generation for memkeyval uses an anonymized trace of requests
captured from production services.
At peak load, memkeyval is network bandwidth limited. Despite the small amount of network protocol
processing done per request, the high request rate makes memkeyval compute-bound. In contrast, DRAM
bandwidth requirements are low (20% DRAM bandwidth utilization at max load), as requests simply retrieve
values from DRAM and put the response on the wire. memkeyval has both a static working set in the LLC
for instructions, as well as a per-request data working set.
5.3.2 Characterization Methodology
To understand their sensitivity to interference on shared resources, we ran each of the three LC workloads with
a synthetic benchmark that stresses each resource in isolation. While these are single node experiments, there
can still be significant network traffic as the load is generated remotely. We repeated the characterization
at various load points for the LC jobs and recorded the impact of the colocation on tail latency. We used
production Google servers with dual-socket Intel Xeons based on the Haswell architecture. Each CPU has a
high core-count, with a nominal frequency of 2.3GHz and 2.5MB of LLC per core. The chips have hardware
support for way-partitioning of the LLC.
We performed the following characterization experiments:
Cores: As we discussed in §5.2, we cannot share a logical core (a single HyperThread) between a LC and a
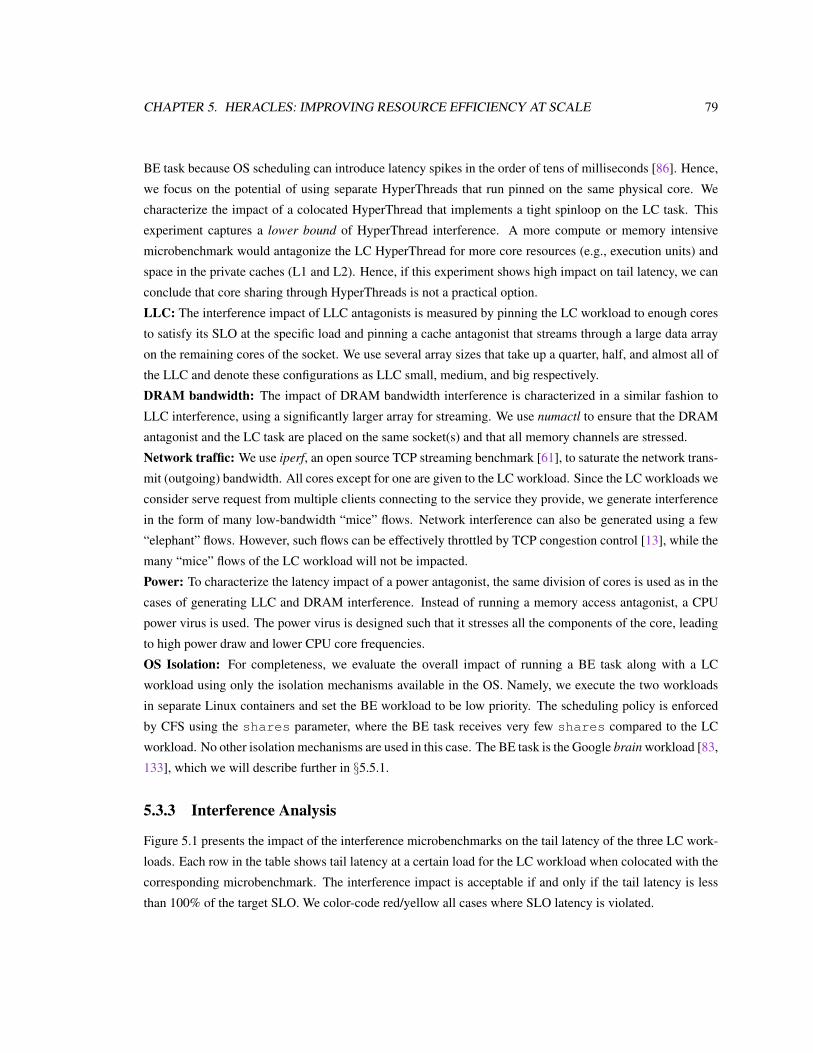
CHAPTER 5. HERACLES: IMPROVING RESOURCE EFFICIENCY AT SCALE 79
BE task because OS scheduling can introduce latency spikes in the order of tens of milliseconds [86]. Hence,
we focus on the potential of using separate HyperThreads that run pinned on the same physical core. We
characterize the impact of a colocated HyperThread that implements a tight spinloop on the LC task. This
experiment captures a lower bound of HyperThread interference. A more compute or memory intensive
microbenchmark would antagonize the LC HyperThread for more core resources (e.g., execution units) and
space in the private caches (L1 and L2). Hence, if this experiment shows high impact on tail latency, we can
conclude that core sharing through HyperThreads is not a practical option.
LLC: The interference impact of LLC antagonists is measured by pinning the LC workload to enough cores
to satisfy its SLO at the specific load and pinning a cache antagonist that streams through a large data array
on the remaining cores of the socket. We use several array sizes that take up a quarter, half, and almost all of
the LLC and denote these configurations as LLC small, medium, and big respectively.
DRAM bandwidth: The impact of DRAM bandwidth interference is characterized in a similar fashion to
LLC interference, using a significantly larger array for streaming. We use numactl to ensure that the DRAM
antagonist and the LC task are placed on the same socket(s) and that all memory channels are stressed.
Network traffic: We use iperf, an open source TCP streaming benchmark [61], to saturate the network trans-
mit (outgoing) bandwidth. All cores except for one are given to the LC workload. Since the LC workloads we
consider serve request from multiple clients connecting to the service they provide, we generate interference
in the form of many low-bandwidth “mice” flows. Network interference can also be generated using a few
“elephant” flows. However, such flows can be effectively throttled by TCP congestion control [13], while the
many “mice” flows of the LC workload will not be impacted.
Power: To characterize the latency impact of a power antagonist, the same division of cores is used as in the
cases of generating LLC and DRAM interference. Instead of running a memory access antagonist, a CPU
power virus is used. The power virus is designed such that it stresses all the components of the core, leading
to high power draw and lower CPU core frequencies.
OS Isolation: For completeness, we evaluate the overall impact of running a BE task along with a LC
workload using only the isolation mechanisms available in the OS. Namely, we execute the two workloads
in separate Linux containers and set the BE workload to be low priority. The scheduling policy is enforced
by CFS using the shares parameter, where the BE task receives very few shares compared to the LC
workload. No other isolation mechanisms are used in this case. The BE task is the Google brain workload [83,
133], which we will describe further in §5.5.1.
5.3.3 Interference Analysis
Figure 5.1 presents the impact of the interference microbenchmarks on the tail latency of the three LC work-
loads. Each row in the table shows tail latency at a certain load for the LC workload when colocated with the
corresponding microbenchmark. The interference impact is acceptable if and only if the tail latency is less
than 100% of the target SLO. We color-code red/yellow all cases where SLO latency is violated.

CHAPTER 5. HERACLES: IMPROVING RESOURCE EFFICIENCY AT SCALE 80
websearch10% 20% 30% 40% 50% 60% 70% 80% 90%
LLC (small) 103% 96% 102% 96% 104% 100% 100% 103% 103%LLC (med) 106% 99% 111% 103% 116% 108% 110% 125% 111%LLC (big) >300% >300% >300% >300% >300% >300% >300% 264% 123%
DRAM >300% >300% >300% >300% >300% >300% >300% 270% 122%HyperThread 109% 106% 113% 114% 105% 117% 119% 136% >300%CPU power 124% 107% 115% 108% 114% 105% 101% 100% 99%
Network 35% 36% 36% 37% 38% 41% 48% 55% 64%brain 165% 173% 168% 230% >300% >300% >300% >300% >300%
ml cluster10% 20% 30% 40% 50% 60% 70% 80% 90%
LLC (small) 88% 84% 110% 93% 216% 106% 105% 206% 202%LLC (med) 88% 91% 115% 104% >300% 212% 220% 212% 205%LLC (big) >300% >300% >300% >300% >300% >300% >300% 250% 214%
DRAM >300% >300% >300% >300% >300% >300% >300% 287% 223%HyperThread 109% 111% 100% 107% 112% 114% 119% 130% 262%CPU power 101% 89% 86% 90% 92% 90% 89% 92% 97%
Network 56% 60% 58% 58% 59% 59% 63% 67% 89%brain 149% 189% 202% 217% 239% >300% >300% >300% >300%
memkeyval10% 20% 30% 40% 50% 60% 70% 80% 90%
LLC (small) 88% 91% 101% 91% 101% 138% 140% 150% 78%LLC (med) 148% 107% 119% 108% 138% 230% 181% 162% 100%LLC (big) >300% >300% >300% >300% >300% >300% 280% 222% 79%
DRAM >300% >300% >300% >300% >300% >300% >300% 234% 103%HyperThread 31% 32% 32% 35% 43% 51% 62% 119% 153%CPU power 277% 294% >300% >300% 224% 252% 193% 167% 82%
Network 28% 29% 27% >300% >300% >300% >300% >300% >300%brain 232% >300% >300% >300% >300% >300% >300% >300% >300%
Each entry is color-coded as follows: 140% is ≥120%, 110% is between 100% and 120%, and 65% is≤100%.
Figure 5.1: Impact of interference on shared resources on websearch, ml cluster, and memkeyval. Each rowis an antagonist and each column is a load point for the workload. The values are latencies, normalized to theSLO latency.
By observing the rows for brain, we immediately notice that current OS isolation mechanisms are inad-
equate for colocating LC tasks with BE tasks. Even at low loads, the BE task creates sufficient pressure on
shared resources to lead to SLO violations for all three workloads. A large contributor to this is that the OS
allows both workloads to run on the same core and even the same HyperThread, further compounding the
interference. Tail latency eventually goes above 300% of SLO latency. Proposed interference-aware cluster
managers, such as Paragon [28] and Bubble-Up [105], would disallow these colations. To enable aggressive
task colocation, not only do we need to disallow different workloads on the same core or HyperThread, we

CHAPTER 5. HERACLES: IMPROVING RESOURCE EFFICIENCY AT SCALE 81
also need to use stronger isolation mechanisms.
The sensitivity of LC tasks to interference on individual shared resources varies. For instance, memkeyval
is quite sensitive to network interference, while websearch and ml cluster are not affected at all. websearch
is uniformly insensitive to small and medium amounts of LLC interference, while the same cannot be said for
memkeyval or ml cluster. Furthermore, the impact of interference changes depending on the load: ml cluster
can tolerate medium amounts of LLC interference at loads ¡50% but is heavily impacted at higher loads.
These observations motivate the need for dynamic management of isolation mechanisms in order to adapt to
differences across varying loads and different workloads. Any static policy would be either too conservative
(missing opportunities for colocation) or overly optimistic (leading to SLO violations).
We now discuss each LC workload separately, in order to understand their particular resource require-
ments.
websearch: This workload has a small footprint and LLC (small) and LLC (med) interference do not impact
its tail latency. Nevertheless, the impact is significant with LLC (big) interference. The degradation is caused
by two factors. First, the inclusive nature of the LLC in this particular chip means that high LLC interference
leads to misses in the working set of instructions. Second, contention for the LLC causes significant DRAM
pressure as well. websearch is particularly sensitive to interference caused by DRAM bandwidth saturation.
As the load of websearch increases, the impact of LLC and DRAM interference decreases. At higher loads,
websearch uses more cores while the interference generator is given fewer cores. Thus, websearch can defend
its share of resources better.
websearch is moderately impacted by HyperThread interference until high loads. This indicates that
the core has sufficient instruction issue bandwidth for both the spinloop and the websearch until around
80% load. Since the spinloop only accesses registers, it doesn’t cause interference in the L1 or L2 caches.
However, since the HyperThread antagonist has the smallest possible effect, more intensive antagonists will
cause far larger performance problems. Thus, HyperThread interference in practice should be avoided. Power
interference has a significant impact on websearch at lower utilization, as more cores are executing the power
virus. As expected, the network antagonist does not impact websearch, due to websearch’s low bandwidth
needs.
ml cluster ml cluster is sensitive to LLC interference of smaller size, due to the small but significant per-
request working set. This manifests itself as a large jump in latency at 80% load for LLC (small) and 50%
load for LLC (medium). With larger LLC interference, ml cluster experiences major latency degradation.
ml cluster is also sensitive to DRAM bandwidth interference, primarily at lower loads (see explanation for
websearch). ml cluster is moderately resistant to HyperThread interference until high loads, suggesting that
it only reaches high instruction issue rates at high loads. Power interference has a lesser impact on ml cluster
since it is less compute intensive than websearch. Finally, ml cluster is not impacted at all by network
interference.
memkeyval: Due to its significantly stricter latency SLO, memkeyval is sensitive to all types of interference.
At high load, memkeyval becomes sensitive even to small LLC interference as the small per-request working

CHAPTER 5. HERACLES: IMPROVING RESOURCE EFFICIENCY AT SCALE 82
sets add up. When faced with medium LLC interference, there are two latency peaks. The first peak at low
load is caused by the antagonist removing instructions from the cache. When memkeyval obtains enough cores
at high load, it avoids these evictions. The second peak is at higher loads, when the antagonist interferes with
the per-request working set. At high levels of LLC interference, memkeyval is unable to meet its SLO. Even
though memkeyval has low DRAM bandwidth requirements, it is strongly affected by a DRAM streaming
antagonist. Ironically, the few memory requests from memkeyval are overwhelmed by the DRAM antagonist.
memkeyval is not sensitive to the HyperThread antagonist except at high loads. In contrast, it is very
sensitive to the power antagonist, as it is compute-bound. memkeyval does consume a large amount of network
bandwidth, and thus is highly susceptible to competing network flows. Even at small loads, it is completely
overrun by the many small “mice” flows of the antagonist and is unable to meet its SLO.
5.4 Heracles Design
We have established the need for isolation mechanisms beyond OS-level scheduling and for a dynamic con-
troller that manages resource sharing between LC and BE tasks. Heracles is a dynamic, feedback-based
controller that manages in real-time four hardware and software mechanisms in order to isolate colocated
workloads. Heracles implements a different kind of iso-latency policy compared to the power saving policy
from Chapter 4. Instead of lowering power, the iso-latency policy in Heracles attempts to increase resource
efficiency as long as the SLO is being met. This policy allows for increasing server utilization through tol-
erating some interference caused by colocation, as long as the the difference between the SLO latency target
for the LC workload and the actual latency observed (latency slack) is positive. In its current version, Hera-
cles manages one LC workload with many BE tasks. Since BE tasks are abundant, this is sufficient to raise
utilization in many datacenters. We leave colocation of multiple LC workloads to future work.
5.4.1 Isolation Mechanisms
Heracles manages 4 mechanisms to mitigate interference.
For core isolation, Heracles uses Linux’s cpuset cgroups to pin the LC workload to one set of
cores and BE tasks to another set (software mechanism) [112]. This mechanism is necessary, since in §5.3
we showed that core sharing is detrimental to latency SLO. Moreover, the number of cores per server is
increasing, making core segregation finer-grained. The allocation of cores to tasks is done dynamically. The
speed of core (re)allocation is limited by how fast Linux can migrate tasks to other cores, typically in the tens
of milliseconds.
For LLC isolation, Heracles uses the Cache Allocation Technology (CAT) available in recent Intel chips
(hardware mechanism) [60]. CAT implements way-partitioning of the shared LLC. In a highly-associative
LLC, this allows us to define non-overlapping partitions at the granularity of a few percent of the total LLC
capacity. We use one partition for the LC workload and a second partition for all BE tasks. Partition sizes

CHAPTER 5. HERACLES: IMPROVING RESOURCE EFFICIENCY AT SCALE 83
can be adjusted dynamically by programming model specific registers (MSRs), with changes taking effect in
a few milliseconds.
There are no commercially available DRAM bandwidth isolation mechanisms. We enforce DRAM band-
width limits in the following manner: we implement a software monitor that periodically tracks the total
bandwidth usage through performance counters and estimates the bandwidth used by the LC and BE jobs. If
the LC workload does not receive sufficient bandwidth, Heracles scales down the number of cores that BE
jobs use. We discuss the limitations of this coarse-grained approach in §5.4.2.
For power isolation, Heracles uses CPU frequency monitoring, Running Average Power Limit (RAPL),
and per-core DVFS (hardware features) [60,80]. RAPL is used to monitor CPU power at the per-socket level,
while per-core DVFS is used to redistribute power amongst cores. Per-core DVFS setting changes go into
effect within a few milliseconds. The frequency steps are in 100MHz and span the entire operating frequency
range of the processor, including Turbo Boost frequencies.
For network traffic isolation, Heracles uses Linux traffic control (software mechanism). Specifically we
use the qdisc [15] scheduler with hierarchical token bucket queueing discipline (HTB) to enforce bandwidth
limits for outgoing traffic from the BE tasks. The bandwidth limits are set by limiting the maximum traffic
burst rate for the BE jobs (ceil parameter in HTB parlance). The LC job does not have any limits set on
it. HTB can be updated very frequently, with the new bandwidth limits taking effect in less than hundreds of
milliseconds. Managing ingress network interference has been examined in numerous previous work [74].
5.4.2 Design Approach
Each hardware or software isolation mechanism allows reasonably precise control of an individual resource.
Given that, the controller must dynamically solve the high dimensional problem of finding the right settings
for all these mechanisms at any load for the LC workload and any set of BE tasks. Heracles solves this as an
optimization problem, where the objective is to maximize utilization with the constraint that the SLO must
be met.
Heracles reduces the optimization complexity by decoupling interference sources. The key insight that
enables this reduction is that interference is problematic only when a shared resource becomes saturated,
i.e. its utilization is so high that latency problems occur. This insight is derived by the analysis in §5.3: the
antagonists do not cause significant SLO violations until an inflection point, at which point the tail latency
degrades extremely rapidly. Hence, if Heracles can prevent any shared resource from saturating, then it can
decompose the high-dimensional optimization problem into many smaller and independent problems of one
or two dimensions each. Then each sub-problem can be solved using sound optimization methods, such as
gradient descent.
Since Heracles must ensure that the target SLO is met for the LC workload, it continuously monitors
latency and latency slack and uses both as key inputs in its decisions. When the latency slack is large,
Heracles treats this as a signal that it is safe to be more aggressive with colocation; conversely, when the
slack is small, it should back off to avoid an SLO violation. Heracles also monitors the load (queries per

CHAPTER 5. HERACLES: IMPROVING RESOURCE EFFICIENCY AT SCALE 84
LC workload
Controller
CPU powerCores & Memory
Network
DRAM BW
LLC (CAT)
CPU DVFSCPU
PowerHTB
NetBW
Latency readings
Can BE grow?
Internal feedback loops
Figure 5.2: The system diagram of Heracles.
second), and during periods of high load, it disables colocation due to a high risk of SLO violations. In
Chapter 4, we demonstrated that indirect performance metrics, such as CPU utilization, are insufficient to
guarantee that the SLO is met.
Ideally, Heracles should require no offline information other than SLO targets. Unfortunately, one short-
coming of current hardware makes this difficult. The Intel chips we used do not provide accurate mechanisms
for measuring (or limiting) DRAM bandwidth usage at a per-core granularity. To understand how Heracles’
decisions affect the DRAM bandwidth usage of latency-sensitive and BE tasks and to manage bandwidth
saturation, we require some offline information. Specifically, Heracles uses an offline model that describes
the DRAM bandwidth used by the latency-sensitive workloads at various loads, core, and LLC allocations.
We verified that this model needs to be regenerated only when there are significant changes in the workload
structure and that small deviations are fine. There is no need for any offline profiling of the BE tasks, which
can vary widely compared to the better managed and understood LC workloads. There is also no need for of-
fline analysis of interactions between latency-sensitive and best effort tasks. Once we have hardware support
for per-core DRAM bandwidth accounting [68], we can eliminate this offline model.
5.4.3 Heracles Controller
Heracles runs as a separate instance on each server, managing the local interactions between the LC and
BE jobs. As shown in Figure 5.2, it is organized as three subcontrollers (cores & memory, power, network
traffic) coordinated by a top-level controller. The subcontrollers operate fairly independently of each other
and ensure that their respective shared resources are not saturated.
Top-level controller: The pseudo-code for the controller is shown in Algorithm 5.1. The controller polls
the tail latency and load of the LC workload every 15 seconds. This allows for sufficient queries to calculate
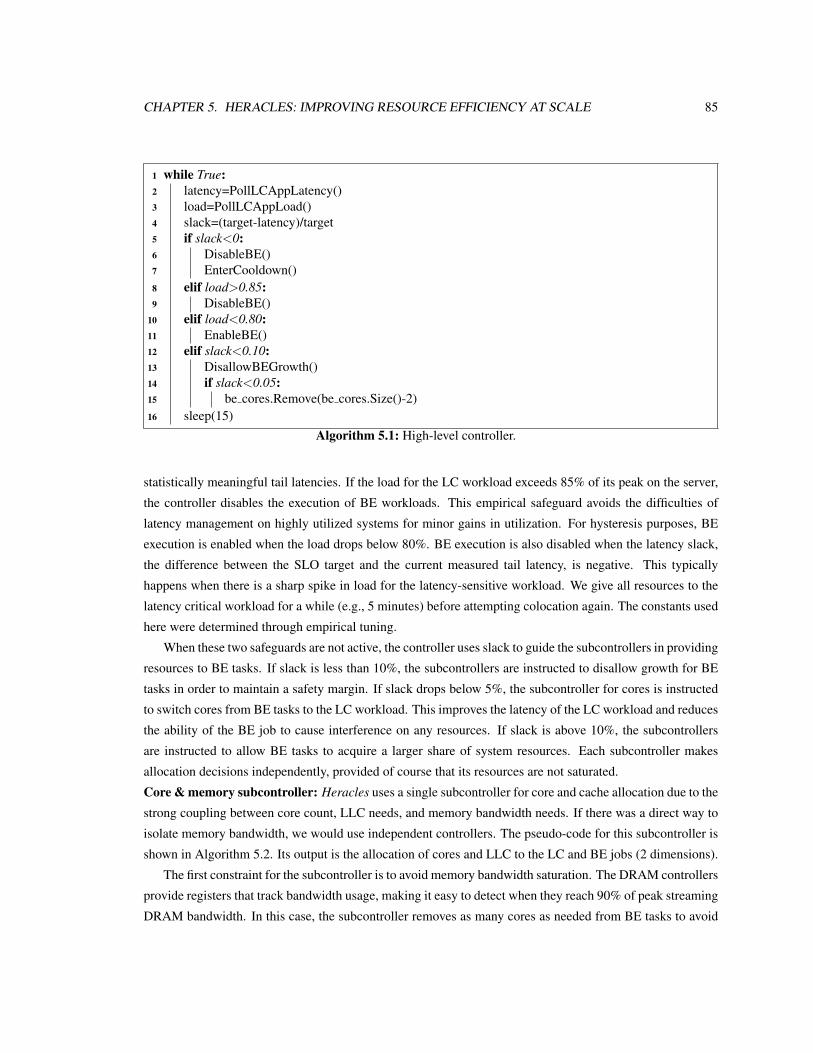
CHAPTER 5. HERACLES: IMPROVING RESOURCE EFFICIENCY AT SCALE 85
1 while True:2 latency=PollLCAppLatency()3 load=PollLCAppLoad()4 slack=(target-latency)/target5 if slack<0:6 DisableBE()7 EnterCooldown()8 elif load>0.85:9 DisableBE()
10 elif load<0.80:11 EnableBE()12 elif slack<0.10:13 DisallowBEGrowth()14 if slack<0.05:15 be cores.Remove(be cores.Size()-2)16 sleep(15)
Algorithm 5.1: High-level controller.
statistically meaningful tail latencies. If the load for the LC workload exceeds 85% of its peak on the server,
the controller disables the execution of BE workloads. This empirical safeguard avoids the difficulties of
latency management on highly utilized systems for minor gains in utilization. For hysteresis purposes, BE
execution is enabled when the load drops below 80%. BE execution is also disabled when the latency slack,
the difference between the SLO target and the current measured tail latency, is negative. This typically
happens when there is a sharp spike in load for the latency-sensitive workload. We give all resources to the
latency critical workload for a while (e.g., 5 minutes) before attempting colocation again. The constants used
here were determined through empirical tuning.
When these two safeguards are not active, the controller uses slack to guide the subcontrollers in providing
resources to BE tasks. If slack is less than 10%, the subcontrollers are instructed to disallow growth for BE
tasks in order to maintain a safety margin. If slack drops below 5%, the subcontroller for cores is instructed
to switch cores from BE tasks to the LC workload. This improves the latency of the LC workload and reduces
the ability of the BE job to cause interference on any resources. If slack is above 10%, the subcontrollers
are instructed to allow BE tasks to acquire a larger share of system resources. Each subcontroller makes
allocation decisions independently, provided of course that its resources are not saturated.
Core & memory subcontroller: Heracles uses a single subcontroller for core and cache allocation due to the
strong coupling between core count, LLC needs, and memory bandwidth needs. If there was a direct way to
isolate memory bandwidth, we would use independent controllers. The pseudo-code for this subcontroller is
shown in Algorithm 5.2. Its output is the allocation of cores and LLC to the LC and BE jobs (2 dimensions).
The first constraint for the subcontroller is to avoid memory bandwidth saturation. The DRAM controllers
provide registers that track bandwidth usage, making it easy to detect when they reach 90% of peak streaming
DRAM bandwidth. In this case, the subcontroller removes as many cores as needed from BE tasks to avoid

CHAPTER 5. HERACLES: IMPROVING RESOURCE EFFICIENCY AT SCALE 86
saturation. Heracles estimates the bandwidth usage of each BE task using a model of bandwidth needs for
the LC workload and a set of hardware counters that are proportional to the per-core memory traffic to the
NUMA-local memory controllers. For the latter counters to be useful, we limit each BE task to a single
socket for both cores and memory allocations using Linux numactl. Different BE jobs can run on either
socket and LC workloads can span across sockets for cores and memory.
When the top-level controller signals BE growth and there is no DRAM bandwidth saturation, the sub-
controller uses gradient descent to find the maximum number of cores and cache partitions that can be given
to BE tasks. Offline analysis of LC applications (Figure 5.3) shows that their performance is a convex func-
tion of core and cache resources, thus guaranteeing that gradient descent will find a global optimum. We
perform the gradient descent in one dimension at a time, switching between increasing the cores and increas-
ing the cache given to BE tasks. Initially, a BE job is given one core and 10% of the LLC and starts in the
GROW LLC phase. Its LLC allocation is increased as long as the LC workload meets its SLO, bandwidth
saturation is avoided, and the BE task benefits. The next phase (GROW CORES) grows the number of cores
for the BE job. Heracles will reassign cores from the LC to the BE job one at a time, each time checking for
DRAM bandwidth saturation and SLO violations for the LC workload. If bandwidth saturation occurs first,
the subcontroller will return to the GROW LLC phase. The process repeats until an optimal configuration has
been converged upon. The search also terminates on a signal from the top-level controller indicating the end
to growth or the disabling of BE jobs. The typical convergence time is about 30 seconds.
During gradient descent, the subcontroller must avoid trying suboptimal allocations that will either trigger
DRAM bandwidth saturation or a signal from the top-level controller to disable BE tasks. To estimate the
DRAM bandwidth usage of an allocation prior to trying it, the subcontroller uses the derivative of the DRAM
bandwidth from the last reallocation of cache or cores. Heracles estimates whether it is close to an SLO
violation for the LC task based on the amount of latency slack.
Power subcontroller: The simple subcontroller described in Algorithm 5.3 ensures that there is sufficient
power slack to run the LC workload at a minimum guaranteed frequency. This frequency is determined
by measuring the frequency used when the LC workload runs alone at full load. Heracles uses RAPL to
determine the operating power of the CPU and its maximum design power, or thermal dissipation power
(TDP). It also uses CPU frequency monitoring facilities on each core. When the operating power is close to
the TDP and the frequency of the cores running the LC workload is too low, it uses per-core DVFS to lower
the frequency of cores running BE tasks in order to shift the power budget to cores running LC tasks. Both
conditions must be met in order to avoid confusion when the LC cores enter active-idle modes, which also
tends to lower frequency readings. If there is sufficient operating power headroom, Heracles will increase the
frequency limit for the BE cores in order to maximize their performance. The control loop runs independently
for each of the two sockets and has a cycle time of two seconds.
Network subcontroller: This subcontroller prevents saturation of network transmit bandwidth as shown in
Algorithm 5.4. It monitors the total egress bandwidth of flows associated with the LC workload
(LCBandwidth) and sets the total bandwidth limit of all other flows as

CHAPTER 5. HERACLES: IMPROVING RESOURCE EFFICIENCY AT SCALE 87
1 def PredictedTotalBW():2 return LcBwModel()+BeBw()+bw derivative3 while True:4 MeasureDRAMBw()5 if total bw>DRAM LIMIT:6 overage=total bw-DRAM LIMIT7 be cores.Remove(overage/BeBwPerCore())8 continue9 if not CanGrowBE():
10 continue11 if state==GROW LLC:12 if PredictedTotalBW()>DRAM LIMIT:13 state=GROW CORES14 else:15 GrowCacheForBE()16 MeasureDRAMBw()17 if bw derivative≥0:18 Rollback()19 state=GROW CORES20 if not BeBenefit():21 state=GROW CORES22 elif state==GROW CORES:23 needed=LcBwModel()+BeBw()+BeBwPerCore()24 if needed>DRAM LIMIT:25 state=GROW LLC26 elif slack>0.10:27 be cores.Add(1)28 sleep(2)
Algorithm 5.2: Core & memory sub-controller.
LinkRate − LCBandwidth −max(0.05LinkRate, 0.10LCBandwidth). A small headroom of 10% of
the current LCBandwidth or 5% of the LinkRate is added into the reservation for the LC workload in order
to handle spikes. The bandwidth limit is enforced via HTB qdiscs in the Linux kernel. This control loop is
run once every second, which provides sufficient time for the bandwidth enforcer to settle.
5.5 Heracles Evaluation
5.5.1 Methodology
We evaluated Heracles with the three production, latency-critical workloads from Google analyzed in §5.3.
We first performed experiments with Heracles on a single leaf server, introducing BE tasks as we run the
LC workload at different levels of load. Next, we used Heracles on a websearch cluster with tens of servers,
measuring end-to-end workload latency across the fan-out tree while BE tasks are also running. In the cluster

CHAPTER 5. HERACLES: IMPROVING RESOURCE EFFICIENCY AT SCALE 88
LLC size (%)
0%25%
50%75%
100%
Core
s (%)
0%
25%
50%
75%
100%
Max
load
und
er S
LO
0%
25%
50%
75%
100%
Max load under SLO (websearch)
0102030405060708090100
Figure 5.3: Characterization of websearch showing that its performance is a convex function of cores andLLC.
experiments, we used a load trace that represents the traffic throughout a day, capturing diurnal load variation.
In all cases, we used production Google servers.
For the LC workloads we focus on SLO latency. Since the SLO is defined over 60-second windows,
we report the worst-case latency that was seen during experiments. For the production batch workloads, we
compute the throughput rate of the batch workload with Heracles and normalize it to the throughput of the
batch workload running alone on a single server. We then define the Effective Machine Utilization (EMU)= LC Throughput + BE Throughput. Note that Effective Machine Utilization can be above 100% due to
better binpacking of shared resources. We also report the utilization of shared resources when necessary to
highlight detailed aspects of the system.
The BE workloads we use are chosen from a set containing both production batch workloads and the
synthetic tasks that stress a single shared resource. The specific workloads are:
stream-LLC streams through data sized to fit in about half of the LLC and is the same as LLC (med)
from §5.3.2. stream-DRAM streams through an extremely large array that cannot fit in the LLC (DRAM
from the same section). We use these workloads to verify that Heracles is able to maximize the use of LLC
partitions and avoid DRAM bandwidth saturation.
cpu pwr is the CPU power virus from §5.3.2. It is used to verify that Heracles will redistribute power to
ensure that the LC workload maintains its guaranteed frequency.

CHAPTER 5. HERACLES: IMPROVING RESOURCE EFFICIENCY AT SCALE 89
1 while True:2 power=PollRAPL()3 ls freq=PollFrequency(ls cores)4 if power>0.90*TDP and ls freq<guaranteed:5 LowerFrequency(be cores)6 elif power≤0.90*TDP and ls freq≥guaranteed:7 IncreaseFrequency(be cores)8 sleep(2)
Algorithm 5.3: CPU power sub-controller.
1 while True:2 ls bw=GetLCTxBandwidth()3 be bw=LINK RATE-ls bw-max(0.05*LINK RATE, 0.10*ls bw)4 SetBETxBandwidth(be bw)5 sleep(1)
Algorithm 5.4: Network sub-controller.
iperf is an open source network streaming benchmark used to verify that Heracles partitions network
transmit bandwidth correctly to protect the LC workload.
brain is a Google production batch workload that performs deep learning on images for automatic la-
belling [83,133]. This workload is very computationally intensive, is sensitive to LLC size, and also has high
DRAM bandwidth requirements.
streetview is a production batch job that stitches together multiple images to form the panoramas for
Google Street View. This workload is highly demanding on the DRAM subsystem.
5.5.2 Individual Server Results
Latency SLO: Figure 5.4 presents the impact of colocating each of the three LC workloads with BE work-
loads across all possible loads under the control of Heracles. Note that Heracles attempts to run as many
copies of the BE task as possible and maximize the resources they receive. At all loads and in all colocation
cases, there are no SLO violations with Heracles. This is true even for brain, a workload that even with the
state-of-the-art OS isolation mechanisms would render any LC workload unusable. This validates that the
controller keeps shared resources from saturating and allocates a sufficient fraction to the LC workload at
any load. Heracles maintains a small latency slack as a guard band to avoid spikes and control instability. It
also validates that local information on tail latency is sufficient for stable control for applications with mil-
liseconds and microseconds range of SLOs. Interestingly, the websearch binary and shard changed between
generating the offline profiling model for DRAM bandwidth and performing this experiment. Nevertheless,
Heracles is resilient to these changes and performs well despite the somewhat outdated model.
Heracles reduces the latency slack during periods of low utilization for all workloads. For websearch and
ml cluster, the slack is cut in half, from 40% to 20%. For memkeyval, the reduction is much more dramatic,

CHAPTER 5. HERACLES: IMPROVING RESOURCE EFFICIENCY AT SCALE 90
0 20 40 60 80 100% of peak load
0
20
40
60
80
100
99%
late
ncy
(% o
f SLO
)websearch latency with Heracles
0 20 40 60 80 100% of peak load
0
20
40
60
80
100
95%
late
ncy
(% o
f SLO
)
ml_cluster latency with Heracles
0 20 40 60 80 100% of peak load
0
20
40
60
80
100
99%
late
ncy
(% o
f SLO
)
memkeyval latency with Heracles
baselinestream-LLC
stream-DRAMcpu_pwr
brainstreetview
iperfSLO latency
Figure 5.4: Latency of LC applications co-located with BE jobs under Heracles. For clarity we omit web-search and ml cluster with iperf as those workloads are extremely resistant to network interference.
from a slack of 80% to 40% or less. This is because the unloaded latency of memkeyval is extremely small
compared to the SLO latency. The high variance of the tail latency for memkeyval is due to the fact that
its SLO is in the hundreds of microseconds, making it more sensitive to interference than the other two
workloads.
Server Utilization: Figure 5.5 shows the EMU achieved when colocating production LC and BE tasks
with Heracles. In all cases, we achieve significant EMU increases. When the two most CPU-intensive and
power-hungry workloads are combined, websearch and brain, Heracles still achieves an EMU of at least
75%. When websearch is combined with the DRAM bandwidth intensive streetview, Heracles can extract
sufficient resources for a total EMU above 100% at websearch loads between 25% and 70%. This is because
websearch and streetivew have complementary resource requirements, where websearch is more compute
bound and streetview is more DRAM bandwidth bound. The EMU results are similarly positive for ml cluster
and memkeyval. By dynamically managing multiple isolation mechanisms, Heracles exposes opportunities
to raise EMU that would otherwise be missed with scheduling techniques that avoid interference.
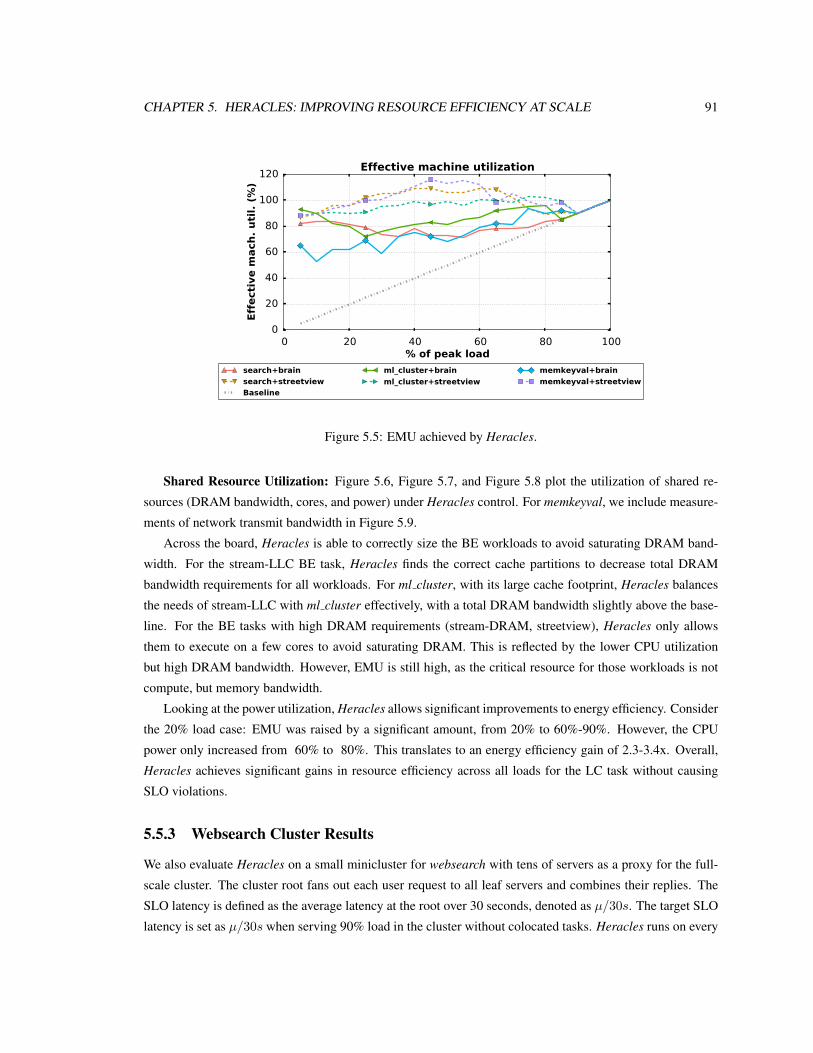
CHAPTER 5. HERACLES: IMPROVING RESOURCE EFFICIENCY AT SCALE 91
0 20 40 60 80 100% of peak load
0
20
40
60
80
100
120
Effe
ctiv
e m
ach.
uti
l. (%
)
Effective machine utilization
search+brainsearch+streetviewBaseline
ml_cluster+brainml_cluster+streetview
memkeyval+brainmemkeyval+streetview
Figure 5.5: EMU achieved by Heracles.
Shared Resource Utilization: Figure 5.6, Figure 5.7, and Figure 5.8 plot the utilization of shared re-
sources (DRAM bandwidth, cores, and power) under Heracles control. For memkeyval, we include measure-
ments of network transmit bandwidth in Figure 5.9.
Across the board, Heracles is able to correctly size the BE workloads to avoid saturating DRAM band-
width. For the stream-LLC BE task, Heracles finds the correct cache partitions to decrease total DRAM
bandwidth requirements for all workloads. For ml cluster, with its large cache footprint, Heracles balances
the needs of stream-LLC with ml cluster effectively, with a total DRAM bandwidth slightly above the base-
line. For the BE tasks with high DRAM requirements (stream-DRAM, streetview), Heracles only allows
them to execute on a few cores to avoid saturating DRAM. This is reflected by the lower CPU utilization
but high DRAM bandwidth. However, EMU is still high, as the critical resource for those workloads is not
compute, but memory bandwidth.
Looking at the power utilization, Heracles allows significant improvements to energy efficiency. Consider
the 20% load case: EMU was raised by a significant amount, from 20% to 60%-90%. However, the CPU
power only increased from 60% to 80%. This translates to an energy efficiency gain of 2.3-3.4x. Overall,
Heracles achieves significant gains in resource efficiency across all loads for the LC task without causing
SLO violations.
5.5.3 Websearch Cluster Results
We also evaluate Heracles on a small minicluster for websearch with tens of servers as a proxy for the full-
scale cluster. The cluster root fans out each user request to all leaf servers and combines their replies. The
SLO latency is defined as the average latency at the root over 30 seconds, denoted as µ/30s. The target SLO
latency is set as µ/30s when serving 90% load in the cluster without colocated tasks. Heracles runs on every

CHAPTER 5. HERACLES: IMPROVING RESOURCE EFFICIENCY AT SCALE 92
0 20 40 60 80 100% of peak load
0
20
40
60
80
100D
RAM
BW
(%
of a
vaila
ble)
websearch DRAM BW
0 20 40 60 80 100% of peak load
0
20
40
60
80
100
DRA
M B
W (
% o
f ava
ilabl
e)
ml_cluster DRAM BW
0 20 40 60 80 100% of peak load
0
20
40
60
80
100
DRA
M B
W (
% o
f ava
ilabl
e)
memkeyval DRAM BW
baselinestream-LLC
stream-DRAMcpu_pwr
brainstreetview
iperf
Figure 5.6: DRAM bandwidth of system when LC applications co-located with BE jobs under Heracles.
leaf node with a uniform 99%-ile latency target set such that the latency at the root satisfies the SLO. We
use Heracles to execute brain on half of the leafs and streetview on the other half. Heracles shares the same
offline model for the DRAM bandwidth needs of websearch across all leaves, even though each leaf has a
different shard. We generate load from an anonymized, 12-hour request trace that captures the part of the
daily diurnal pattern when websearch is not fully loaded and colocation has high potential.
Latency SLO: Figure 5.10 shows the latency SLO with and without Heracles for the 12-hour trace.
Heracles produces no SLO violations while reducing slack by 20-30%. Meeting the 99%-ile tail latency
at each leaf is sufficient to guarantee the global SLO. We believe we can further reduce the slack in larger
websearch clusters by introducing a centralized controller that dynamically sets the per-leaf tail latency targets
based on slack at the root. This will allow a future version of Heracles to take advantage of slack in higher
layers of the fan-out tree.
Server Utilization: Figure 5.10 also shows that Heracles successfully converts the latency slack in the
baseline case into significantly increased EMU. Throughout the trace, Heracles colocates sufficient BE tasks

CHAPTER 5. HERACLES: IMPROVING RESOURCE EFFICIENCY AT SCALE 93
0 20 40 60 80 100% of peak load
0
20
40
60
80
100CP
U u
tiliz
atio
n (%
)websearch CPU utilization
0 20 40 60 80 100% of peak load
0
20
40
60
80
100
CPU
uti
lizat
ion
(%)
ml_cluster CPU utilization
0 20 40 60 80 100% of peak load
0
20
40
60
80
100
CPU
uti
lizat
ion
(%)
memkeyval CPU utilization
baselinestream-LLC
stream-DRAMcpu_pwr
brainstreetview
iperf
Figure 5.7: CPU utilization of system when LC applications co-located with BE jobs under Heracles.
to maintain an average EMU of 90% and a minimum of 80% without causing SLO violations. The websearch
load varies between 20% and 90% in this trace.
TCO: To estimate the impact on total cost of ownership, we use the TCO calculator by Barroso et al.
with the parameters from the case-study of a datacenter with low per-server cost [6]. This model assumes
$2000 servers with a PUE of 2.0 and a peak power draw of 500W as well as electricity costs of $0.10/kW-hr.
For our calculations, we assume a cluster size of 10,000 servers. Assuming pessimistically that a websearch
cluster is highly utilized throughout the day, with an average load of 75%, Heracles’ ability to raise utilization
to 90% translates to a 15% throughput/TCO improvement over the baseline. This improvement includes the
cost of the additional power consumption at higher utilization. Under the same assumptions, a controller
that focuses only on improving energy-proportionality for websearch, such as PEGASUS, would achieve
throughput/TCO gains of roughly 3%.

CHAPTER 5. HERACLES: IMPROVING RESOURCE EFFICIENCY AT SCALE 94
0 20 40 60 80 100% of peak load
0
20
40
60
80
100CP
U p
ower
(%
TD
P)websearch CPU power
0 20 40 60 80 100% of peak load
0
20
40
60
80
100
CPU
pow
er (
% T
DP)
ml_cluster CPU power
0 20 40 60 80 100% of peak load
0
20
40
60
80
100
CPU
pow
er (
% T
DP)
memkeyval CPU power
baselinestream-LLC
stream-DRAMcpu_pwr
brainstreetview
iperf
Figure 5.8: CPU power of system when LC applications co-located with BE jobs under Heracles.
If we assume a cluster for LC workloads utilized at an average of 20%, as many industry studies sug-
gest [95, 153], Heracles can achieve a 306% increase in throughput/TCO. A controller focusing on energy-
proportionality would achieve improvements of less than 7%. Heracles’ advantage is due to the fact that it
can raise utilization from 20% to 90% with a small increase to power consumption, which only represents
9% of the initial TCO. As long as there are useful BE tasks available, one should always choose to improve
throughput/TCO by colocating them with LC jobs instead of lowering the power consumption of servers in
modern datacenters. Also note that the improvements in throughput/TCO are large enough to offset the cost
of reserving a small portion of each server’s memory or storage for BE tasks.
5.6 Related Work
Isolation mechanisms: There is significant work on shared cache isolation, including soft partitioning based
on replacement policies [159,161], way-partitioning [126,130], and fine-grained partitioning [102,136,143].

CHAPTER 5. HERACLES: IMPROVING RESOURCE EFFICIENCY AT SCALE 95
0 20 40 60 80 100% of peak load
0
20
40
60
80
100
Net
wor
k BW
(%
of a
vaila
ble)
memkeyval network BW
baseline iperf
Figure 5.9: Network bandwidth of memkeyval under Heracles.
0 2 4 6 8 10 12Time (hr)
0
20
40
60
80
100
120
% o
f SLO
late
ncy
(/3
0s)
Latency comparisonBaseline Heracles SLO latency
0 2 4 6 8 10 12Time (hr)
0
20
40
60
80
100
120
Effe
ctiv
e m
ach.
uti
l. (%
)
Effective machine utilizationBaseline Heracles
Figure 5.10: Latency SLO and effective machine utilization for a websearch cluster managed by Heracles.
Tessellation exposes an interface for throughput-based applications to request partitioned resources [96].
Most cache partitioning schemes have been evaluated with a utility-based policy that optimizes for aggregate
throughput [126]. Heracles manages the coarse-grained, way-partitioning scheme recently added in Intel
CPUs, using a search for a right-sized allocation to eliminate latency SLO violations. We expect Heracles
will work even better with fine-grained partitioning schemes when they are commercially available.
Iyer et al. explores a wide range quality-of-service (QoS) policies for shared cache and memory systems
with simulated isolation features [44, 45, 52, 67, 68]. They focus on throughput metrics, such as IPC and
MPI, and did not consider latency-critical workloads or other resources such as network traffic. Cook et al.
evaluate hardware cache partitioning for throughput based applications and did not consider latency-critical
tasks [21]. Wu et al. compare different capacity management schemes for shared caches [159]. The proposed
Ubik controller for shared caches with fine-grained partitioning support boosts the allocation for latency-
critical workloads during load transition times and requires application level changes to inform the runtime

CHAPTER 5. HERACLES: IMPROVING RESOURCE EFFICIENCY AT SCALE 96
of load changes [78]. Heracles does not require any changes to the LC task, instead relying on a steady-state
approach for managing cache partitions that changes partition sizes slowly.
There are several proposals for isolation and QoS features for memory controllers [31, 68, 72, 89, 114,
115, 117, 139]. While our work showcases the need for memory isolation for latency-critical workloads,
such features are not commercially available at this point. Several network interface controllers implement
bandwidth limiters and priority mechanisms in hardware. Unfortunately, these features are not exposed by
device drivers. Hence, Heracles and related projects in network performance isolation currently use Linux
qdisc [74]. Support for network isolation in hardware should strengthen Heracle’s robustness.
The LC workloads we evaluated do not use disks or SSDs in order to meet their aggressive latency
targets. Nevertheless, disk and SSD isolation is quite similar to network isolation. Thus, the same principles
and controls used to mitigate network interference still apply. For disks, we list several available isolation
techniques: 1) the cgroups blkio controller [112], 2) native command queuing (NCQ) priorities [57], 3)
prioritization in file-system queues, 4) partitioning LC and BE to different disks, 5) replicating LC data
across multiple disks that allows selecting the disk/reply that responds first or has lower load [26]. For SSDs:
1) many SSDs support channel partitions, separate queueing, and prioritization at the queue level, 2) SSDs
also support suspending operations to allow LC requests to overtake BE requests.
Interference-aware cluster management: Several cluster-management systems detect interference between
colocated workloads and generate schedules that avoid problematic colocations. Nathuji et al. develop a
feedback-based scheme that tunes resource assignment to mitigate interference for colocated VMs [116].
Bubble-flux is an online scheme that detects memory pressure and finds colocations that avoid interference
on latency-sensitive workloads [105, 163]. Bubble-flux has a backup mechanism to enable problematic co-
locations via execution modulation, but such a mechanism would have challenges with applications such
as memkeyval, as the modulation would need to be done in the granularity of microseconds. DeepDive
detects and manages interference between co-scheduled applications in a VM system [118]. CPI2 throttles
low-priority workloads that interfere with important services [164]. Finally, Paragon and Quasar use online
classification to estimate interference and to colocate workloads that are unlikely to cause interference [28,
29].
The primary difference of Heracles is the focus on latency-critical workloads and the use of multiple
isolation schemes in order to allow aggressive colocation without SLO violations at scale. Many previous
approaches use IPC instead of latency as the performance metric [105, 118, 163, 164]. Nevertheless, one can
couple Heracles with an interference-aware cluster manager in order to optimize the placement of BE tasks.
Latency-critical workloads: There is also significant work in optimizing various aspects of latency-critical
workloads, including energy proportionality [75, 97, 98, 109, 110], networking performance [8, 76], and
hardware-acceleration [90, 125, 146]. Heracles is largely orthogonal to these projects.

CHAPTER 5. HERACLES: IMPROVING RESOURCE EFFICIENCY AT SCALE 97
5.7 Conclusions
We present Heracles, a heuristic feedback-based system that manages four isolation mechanisms to enable a
latency-critical workload to be colocated with batch jobs without SLO violations. We used an empirical char-
acterization of several sources of interference to guide an important heuristic used in Heracles: interference
effects are large only when a shared resource is saturated. We evaluated Heracles and several latency-critical
and batch workloads used in production at Google on real hardware and demonstrated an average utilization
of 90% across all evaluated scenarios without any SLO violations for the latency-critical job. Through co-
ordinated management of several isolation mechanisms, Heracles enables colocation of tasks that previously
would cause SLO violations. Compared to power-saving mechanisms alone, Heracles increases overall cost
efficiency substantially through increased utilization.

Chapter 6
Concluding remarks
This dissertation has presented several practical systems to achieve higher efficiency for datacenters. In
particular, we have made the following contributions:
• Improving peak energy efficiency: We described autoturbo (Chapter 3), a system that uses machine
learning to find the optimal setting of TurboMode for varying efficiency metrics. We demonstrated that
a static setting of TurboMode will not be able to capture the optimum energy efficiency for different
workloads and metrics. We use a machine learning algorithm to learn the correlation between the
optimal setting of TurboMode and performance counters on the CPU and show that such a classifier
can substantially improve the energy efficiency of servers.
• Improving energy proportionality: In order to achieve energy proportionality for latency-critical
workloads, we show that two requirements must be satisfied. The first is that latency feedback in-
formation from the application must be used to choose an appropriate trade-off between performance
and power. The second is a fine-grained power management mechanism to expose many performance-
power operating points. We develop an iso-latency policy to keep the latency-critical workload op-
erating with minimal latency slack to achieve substantial power savings. PEGASUS is a controller
that realizes this iso-latency power policy, and we demonstrate its effectiveness on production Google
workloads running on real hardware.
• Improving resource efficiency: We apply the same principles for iso-latency power management to
achieving high utilization in the datacenter. The principal difference is that instead of saving power,
we use latency information to manage resource isolation mechanisms to guarantee safe workload co-
locations. Heracles is a real-time dynamic controller that manages many isolation mechanisms to
achieve high utilization in the datacenter. We demonstrate that Heracles is able to achieve average
utilizations of 90% without causing latency SLO violations for latency-critical workloads, even in the
face of diurnal load variation. Thus, Heracles is able to significantly raise the resource efficiency of
98

CHAPTER 6. CONCLUDING REMARKS 99
datacenters by increasing the realizable capacity of datacenters by integer multiples with a marginal
increase in the overall cost of operating the datacenter.
We believe that the contributions above open many interesting paths for future research. First, there is
significant synergy between all three approaches, as achieving good peak energy efficiency, energy propor-
tionality, and resource efficiency are not mutually exclusive goals. For example, autoturbo can be combined
with Heracles to choose the optimal operating frequencies for different workloads running on the same server
to achieve better energy efficiency and resource efficiency. Similarly, the principles of iso-latency power man-
agement can also be applied to Heracles to further lower the power footprint of a latency-critical workload.
In addition, we have demonstrated that an intimate understanding of the workloads, the hardware they run
on, and their policies can unlock substantial gains. While past studies to improve efficiency have successfully
focused on architectural features such as CPI or cache miss rates, the shift to higher level metrics such as la-
tency SLOs have enabled an entire new class of optimizations. Looking forward, we hope that both software
and hardware designers use the same approach to find new opportunities for significant efficiency increases.
There is still substantial opportunities left to increase efficiency at a smaller granularity, such as at the level
of individual requests. All of our approaches used can be extended to optimally schedule and re-allocate
resources at the request level to further increase the efficiency of workloads. We leave these endeavors to
future work.

Appendices
100
Appendix A
OLDIsim: benchmarking scale-outworkloads
A.1 Introduction
There are two major classes of workloads running in large-scale datacenters: throughput oriented batch pro-
cessing workloads (such as analytics, log processing, neural network training) and latency-critical scale-out
applications (such as websearch, social networking, ads). The former class of workloads are already well
represented with existing benchmarks, ranging from single-node workloads such as SPECCPU [144] and
PARSEC [9] to large cluster-scale benchmarks driven by frameworks such as Hadoop [151] and Spark [149].
Unfortunately, there is a dearth of latency-critical scale-out workloads that are capable of emulating the mul-
tiple tiers often found in such workloads. While there are several latency-critical that represent one tier, such
as memcached [111], Cassandra [150], or SPECWEB [145], there are virtually no publicly available bench-
marks for the entire end-to-end stack. For example, there is only one commonly used scale-out workload
used by the community, namely, Nutch [79]. Thus, there is a clear and pressing need for additional scale-
out benchmarks in order to provide a standard set of workloads to characterize the behavior of large-scale
datacenters.
OLDIsim, or OnLine Data Intensive simulator, is designed as an easy-to use open-source framework for
developers to construct and benchmark scale-out applications. OLDIsim provides a set of Application Pro-
gramming Interfaces, or APIs, in C++ that abstract away the details of handling node-to-node communication
patterns commonly found in scale-out workloads. For instance, OLDIsim provides easy to use abstractions for
one-to-one, one-to-several, and one-to-all fan-in/fan-out patterns. OLDIsim is also optimized for performance
and is capable of supporting several million transactions per second on benchmarked hardware. In addition,
OLDIsim also provides built-in latency and throughput monitoring at all tiers of the scale-out application,
thus enabling a transparent view into the behavior of the application. This is important for benchmarking the
101

APPENDIX A. OLDISIM: BENCHMARKING SCALE-OUT WORKLOADS 102
behavior of the system, as performance bottlenecks can be easily isolated.
The first public release of OLDIsim by Google also includes a sample scale-out workload, websearch
that simulates the performance of Google websearch. The workload emulates the processing time distribu-
tion recorded from production Google websearch to achieve a comparable end-to-end latency distribution.
websearch is used in Google’s open-source cloud performance benchmarker, PerfKitBenchmarker [148], to
measure the scaling-efficiency of adding more nodes to horizontally scale a workload. This scaling-efficiency
metric captures the inherent server-to-server variations that cause performance degradation in a scale-out set-
ting, as the fan-in/fan-out communication pattern means that the slowest server determines overall query
execution time.
This chapter describes the motivation for creating an open-source scale-out benchmarking framework,
the APIs that OLDIsim exposes, low-level implementation details for OLDIsim, and the sample websearch
workload.
A.2 Motivation
Latency-critical workloads are a growing class of applications in the datacenter. These applications are fueled
by the growth of user-facing services such as Google websearch, Facebook, Twitter, various software-as-a-
service providers, etc. Despite the large footprint of these workloads in datacenters, there are virtually no
public benchmarks that attempt to capture and characterize the behavior of these kinds of workloads. For
instance, in the CloudSuite benchmark, only one of the eight benchmarks can be classified as a scale-out
workload, namely that of Web Search [35]. The remaining workloads in CloudSuite are either throughput
oriented batch workloads (Data Analytics, Graph Analytics, Software Testing) or a single-tier latency-critical
workload (Data Caching, Data Serving, Media Streaming, Web Serving). The lack of public benchmarks
for multi-tier scale-out applications is quite apparent in the literature, as several recent papers use Nutch
(the workload behind CloudSuite’s Web Search benchmark) as the sole representative scale-out workload
[35, 91, 163].
Unfortunately, representative scale-out workloads used in production datacenters are impossible to come
by, as operators of such datacenters have a vested interest in keeping their workloads confidential. Thus, the
only clear path forward to obtaining additional scale-out workloads is to enable developers to easily create
their own benchmarks. Conceptually, a scale-out workload is not difficult to visualize, as the workload is
divided into several tiers, where each tier is responsible for a specific processing task. However, as always,
the devil is in the details. Creating a scalable, performant workload is very challenging, as there are many
low-level system details that need to be optimized, such as multithreading, load-balancing, networking, etc.
Proper design choices and handling of these details are crucial to achieving a high-performance and scalable
workload, which are prerequisites to creating a representative scale-out benchmark.
Understandably, most developers have a difficult time managing these details. Facebook and Twitter,
two popular examples of scale-out workloads, were originally designed with ease-of-coding as the primary

APPENDIX A. OLDISIM: BENCHMARKING SCALE-OUT WORKLOADS 103
consideration as opposed to performance. As such, their original incarnations used relatively slow languages
such as PHP and Ruby that are single-threaded. Prioritizing ease of development at the expense of perfor-
mance was ultimately unscalable, as Facebook switched to using HHVM over the default PHP interpreter
and Twitter has migrated many core services to Java.
OLDIsim was created to greatly simplify the creation of performant scale-out applications. This is made
possible by the observation that scale-out applications have a lot of code and structural reuse. For instance,
scale-out workloads all have to manage communications between different tiers, have a reply/response RPC-
style communication between different tiers, and use a one-to-one or one-to-many fan-in/fan-out communi-
cation pattern. While different scale-out workloads have different processing requirements and actions, there
is a big opportunity to abstract out the low-level communication and RPC execution details into a common
framework that can be re-used by multiple scale-out applications.
First, OLDIsim abstracts away the low-level network communication and protocol parsing into a simple
message-based interface. Requests from the user are seen as messages, and different tiers can send their
own messages to other tiers for further processing. Messages are sent immediately after being handed off
to OLDIsim to ensure minimal latency throughout the system. Messages are also labelled with a specific
message type that is used to route messages to different message handlers. When a tier is done processing the
message, OLDIsim provides a simple to use facility to reply to the originator of the message. The tracking of
messages and replies is handled internally by OLDIsim.
Second, OLDIsim is designed with performance as a first-class priority. OLDIsim is written in C++11
and was extensively optimized for performance. OLDIsim is multi-threaded and uses lock-free concurrent
structures as well as intelligent work placement and distribution to achieve high scalability on multi-core
systems. We show the scalability of OLDIsim in Figure A.1, as measured on a dual-socket Sandy Bridge
server with 12 cores (2x Intel Xeon E5-2630) and 10GbE Ethernet sending the smallest possible messages.
In addition, OLDIsim load-balances work between threads in order to ensure high utilization in the face of
irregular workload patterns. More details of the performance optimizations can be found in Section A.4.
A.3 OLDIsim APIs
Since OLDIsim is a framework, it is packaged as a C++ library to be linked into OLDIsim-enabled applica-
tions. Relevant API header files can be found in the oldisim/include/oldisim/ directory under the
source tree.
We now describe commonly used features of the high-level programming model exposed by OLDIsim.
There are three possible node types: a driver node responsible for sending test data into the system, a parentnode that is used to fan-in/fan-out work to other parts of the system, and a leaf node that performs the bulk
of the computation to produce a result. The three node types in OLDIsim and possible directions of message
sending available to each node are shown in Figure A.2. A ChildConnection represents the ability to send
messages to lower levels in the fan-out tree, while a ParentConnection represents the ability to send data

APPENDIX A. OLDISIM: BENCHMARKING SCALE-OUT WORKLOADS 104
0
2
4
6
8
10
12
14
0 2 4 6 8 10 12
QPS
Millions
Cores
QPS
Figure A.1: Scaling behavior of OLDIsim on a CMP system. Experiment was run on a dual socket Intel XeonE5-2630 system with Linux 3.13.0. The benchmark was run with 20 connections per thread and a limit of 25outstanding requests per thread.
back up to the node that originated the message. In other words, ChildConnection and ParentConnectionrepresent two parts of the same message flow, where the ChildConnection is accessible to the higher level
node and the ParentConnection to the lower level node. Both ChildConnections and ParentConnections
are managed internally by OLDIsim and are not exposed in the high-level programming interface.
OLDIsim does not perform any parsing or processing of the payload of messages, as it treats it as a raw
stream of bytes. It is up to the developer to use a data serialization format, such as using raw bytes from
memory, an ASCII format, protocol buffers [41], etc.
OLDIsim uses many callbacks and continuations throughout its API. One useful trick is to use std::bind
from the functional header in C++11 with placeholder arguments from std::placeholders in or-
der to pass state to callbacks and continuations.
A.3.1 DriverNode
The DriverNode produces queries to feed into the system and optionally allows the developer to shape the
traffic arrival rates. It also measures the latency response characteristics for the requests it generates, and when
the DriverNode is terminated with a SIGINT signal (CTRL+C), it will produce statistics on the QPS, receive
and transmit bandwidth for the messages (excluding TCP/IP and Ethernet protocol overheads), as well as the
minimum, average, 50%, 90%, 95%, 99%, and 99.9%-ile latencies for each message type. The DriverNode

APPENDIX A. OLDISIM: BENCHMARKING SCALE-OUT WORKLOADS 105
Driver Node
ChildConnection
(a) Driver Node
Parent Node
ChildConnection
ParentConnection
(b) ParentNodeServer
Leaf Node
ParentConnection
(c) LeafNodeServer
Figure A.2: Different types of nodes in OLDIsim
is multi-threaded to take advantage of multi-core parallelism to generate requests quickly and efficiently. We
now describe the operations available to the DriverNode. The relevant definitions and methods can be found
in Callbacks.h, DriverNode.h and TestDriver.h.
typedef std::function<void(NodeThread&, TestDriver&)>
DriverNodeThreadStartupCallback;
typedef std::function<void(NodeThread&, ResponseContext&)>
DriverNodeResponseCallback;
typedef std::function<void(NodeThread&, TestDriver&)>
DriverNodeMakeRequestCallback;
Figure A.3: Callbacks.h relevant to DriverNode

APPENDIX A. OLDISIM: BENCHMARKING SCALE-OUT WORKLOADS 106
DriverNode(const std::string& hostname, uint16_t port);
void Run(uint32_t num_threads, bool thread_pinning,
uint32_t num_connections_per_thread, uint32_t max_connection_depth);
/**
* Set the callback to run after a thread has started up.
* It will run in the context of the newly started thread.
*/
void SetThreadStartupCallback(
const DriverNodeThreadStartupCallback& callback);
/**
* Set the callback to run when the driver needs a request to send to the
* service under test. It will run in the context of the driver thread.
*/
void SetMakeRequestCallback(const DriverNodeMakeRequestCallback& callback);
/**
* Set the callback to run after a reply is received from the workload.
* It will run in the context of the event thread that is responsible
* for the connection. The callback will be used for incoming replies
* of the given type.
*/
void RegisterReplyCallback(uint32_t type,
const DriverNodeResponseCallback& callback);
/**
* Inform the driver node that it can send requests of the specified
* type
*/
void RegisterRequestType(uint32_t type);
/**
* Enable remote statistics monitoring at a given port.
* It exposes a HTTP server with several URLs that provide diagnostic
* and monitoring information
*/
void EnableMonitoring(uint16_t port);
Figure A.4: Relevant methods in DriverNode class

APPENDIX A. OLDISIM: BENCHMARKING SCALE-OUT WORKLOADS 107
void SendRequest(uint32_t type, const void* payload, uint32_t payload_length,
uint64_t next_request_delay_us);
Figure A.5: Relevant methods in TestDriver class
The constructor is used to specify the hostname:port combination of the OLDIsim node to send traffic to. The
target node can either be a ParentNodeServer or a LeafNodeServer.
SetThreadStartupCallback is used to allow the developer to perform custom thread initialization steps.
SetMakeRequestCallback specifies a callback that is called when a DriverNode thread needs a message
to send to the service under test. This happens under several circumstances: 1) the thread has just started
up and needs a message to send 2) the delay has expired from the last message sent on this thread or
3) the maximum number of in-flight messages was previously reached and now a free message slot has
opened up. The developer provided callback is provided with the thread-local TestDriver instance, which it
should call SendRequest on to produce a message to send to the service under test. SendRequest takes a
next request delay us parameter to modulate the load that a driver thread sends, if no modulation is desired,
this parameter should be set to 0. SendRequest does not take ownership of the payload data, as it simply
copies it into a network buffer.
RegisterReplyCallback is used to register an optional custom callback to run when a reply to a generated
message is received. This could be used to generate and collect statistics on reply quality, for instance.
RegisterRequestType is used to inform the DriverNode that it is capable of sending messages of the specified
type. Sending a message type that was not registered is an error.
EnableMonitoring enables a HTTP server running at the given port that exposes the following endpoints:
/topology and /child stats. Both of these endpoints produce JSON strings that provide monitoring
data.
Run is used to actually start the test driver. Run should be called only after all the parameters are set and
callback handlers are registered, and is a blocking call that only returns when the DriverNode is shut down. It
takes several parameters to control the test driver execution. num threads sets the number of worker threads
available to process queries. thread pinning enables pinning each thread to a logical CPU (and is only sensible
if num threads is less than the total number of logical CPUs). num connections per thread specifies the
number of connections to the service under test per thread. If this value is too high, the target node may believe
it is under DDoS attack. max connection depth specifies the maximum number of outstanding messages that
can be in-flight per connection. If this value is too high then the latency measurements can be skewed
upwards.

APPENDIX A. OLDISIM: BENCHMARKING SCALE-OUT WORKLOADS 108
void MakeRequest(oldisim::NodeThread& thread,
oldisim::TestDriver& test_driver) {
// Send an empty message of type 0 as fast as it can
test_driver.SendRequest(0, nullptr, 0, 0);
}
int main(int argc, char** argv) {
// Test the node at testserver:1234
oldisim::DriverNode driver_node("testserver", 1234);
driver_node.SetMakeRequestCallback(MakeRequest);
driver_node.RegisterRequestType(0);
// Enable remote monitoring at port 8080
driver_node.EnableMonitoring(8080);
// Run driver with 4 threads, thread pinning, 10 connections/thread,
// and request parallelism of 5
driver_node.Run(4, true, 10, 5);
return 0;
}
Figure A.6: Sample DriverNode code
A.3.2 QueryContext
We now describe the class QueryContext, which is used to store the data for a message as well as the meta-
data for that message. QueryContext is used in both LeafNodeServer and ParentNodeServer. The relevant
definition for the class can be found in QueryContext.h.
const uint32_t type;
const uint32_t payload_length;
void* const payload;
void SendResponse(const void* data, uint32_t data_length);
Figure A.7: Relevant members of QueryContext class
A QueryContext object represents a message received from a higher tier. It is composed of a message type
and a message payload. The payload length field records the size of the payload, in bytes. The payload data

APPENDIX A. OLDISIM: BENCHMARKING SCALE-OUT WORKLOADS 109
is owned by the QueryContext object and will be automatically freed. When the receiving tier is ready to re-
spond to the message, it can send a reply to the message by calling the SendResponse method. SendResponse
does not take ownership of the reply data, as it simply copies it into a network buffer.
A.3.3 LeafNodeServer
The LeafNodeServer is a multi-threaded server that listens on a port for messages from a higher tier. When
it receives a message, it looks up the proper handler for that message type, calls it, and sends back the
response that the message handler produces. The LeafNodeServer is optimized for persistent connections
opened from higher tiers, and it statically assigns connection parsing duty in a round-robin fashion between
its worker threads. We now describe the operations available to the LeafNodeServer. The relevant definitions
and methods can be found in Callbacks.h and LeafNodeServer.h.
typedef std::function<void(NodeThread&)> LeafNodeThreadStartupCallback;
typedef std::function<void(NodeThread&, QueryContext&)> LeafNodeQueryCallback;
Figure A.8: Callbacks.h relevant to LeafNodeServer

APPENDIX A. OLDISIM: BENCHMARKING SCALE-OUT WORKLOADS 110
explicit LeafNodeServer(uint16_t port);
/* Set various configuration parameters for the leaf node server */
void SetNumThreads(uint32_t num_threads);
void SetThreadPinning(bool use_thread_pinning);
void SetThreadLoadBalancing(bool use_thread_lb);
void SetThreadLoadBalancingParams(int lb_process_connections_batch_size,
int lb_process_request_batch_size);
void Run();
/**
* Set the callback to run after a thread has started up.
* It will run in the context of the newly started thread.
*/
void SetThreadStartupCallback(const LeafNodeThreadStartupCallback& callback);
/**
* Set the callback to run after an incoming connection is accepted and a
* ParentConnection object representing that connection has been made.
* It will run in the context of the thread that the connection is assigned
* to.
*/
void SetAcceptCallback(const AcceptCallback& callback);
/**
* Set the callback to run after an incoming query is received.
* It will run in the context of the event thread that is responsible
* for the connection. The callback will be used for incoming queries
* of a given type
*/
void RegisterQueryCallback(uint32_t type,
const LeafNodeQueryCallback& callback);
/**
* Enable remote statistics monitoring at a given port.
* It exposes a HTTP server with several URLs that provide diagnostic
* and monitoring information
*/
void EnableMonitoring(uint16_t port);
Figure A.9: Relevant methods in LeafNodeServer class

APPENDIX A. OLDISIM: BENCHMARKING SCALE-OUT WORKLOADS 111
The constructor takes an argument specifying the port number the LeafNodeServer should listen on.
SetNumThreads sets the number of worker threads available to process queries.
SetThreadPinning enables pinning each thread to a logical CPU (and is only sensible if num threads is less
than the total number of logical CPUs).
SetThreadLoadBalancing and SetThreadLoadBalancingParams are used to enable and to tune the inter-
thread load-balancing parameters. lb process connections batch size is the maximum number of messages
that a single thread handles on a connection before waking up other threads to help handle requests, and
lb process request batch size represents the maximum number of messages a thread will process when work
stealing before checking to see if it has work on its own connections.
SetThreadStartupCallback and SetAcceptCallback are used to allow the developer to perform custom
thread initialization and connection initialization steps.
RegisterQueryCallback registers a message handler for a given message type that is called when a message
of that type is received. The message handler is blocking, so it should avoid calls to long I/O operations.
Since a LeafNodeServer does not have any lower tiers it can pass messages to, it must produce a response to
the message by the end of the query handler.
EnableMonitoring enables a HTTP server running at the given port that exposes the following endpoints:
/topology and /child stats. Both of these endpoints produce JSON strings that provide monitoring
data.
Run is used to actually start the server. Run should be called only after all the parameters are set and callback
handlers are registered, and is a blocking call that only returns when the LeafNodeServer is shut down.

APPENDIX A. OLDISIM: BENCHMARKING SCALE-OUT WORKLOADS 112
void Type0Handler(oldisim::NodeThread& thread, oldisim::QueryContext& context) {
// Send back a reply with 1 byte
static const char test_response[] = "0";
context.SendResponse(test_response, sizeof(test_response));
}
int main(int argc, char** argv) {
// Listen on port 1234
oldisim::LeafNodeServer server(1234);
// Register handler for messages with type 0
server.RegisterQueryCallback(0, Type0Handler);
// Run with 4 threads and with thread pinning
server.SetNumThreads(4);
server.SetThreadPinning(true);
server.Run();
return 0;
}
Figure A.10: Sample LeafNodeServer code
A.3.4 ParentNodeServer
The ParentNodeServer represents intermediate nodes in the fan-out tree that can communicate with other
ParentNodeServers or LeafNodeServers. ParentNodeServers are the most flexible kind of nodes, and can
be used as front-end load balancers, result aggregators, etc. Ideally ParentNodeServers will not perform
complex calculations, as those tasks should be delegated to LeafNodeServers. ParentNodeServers are also
multi-threaded and also balance connection handling between several worker threads in the same manner
as LeafNodeServers. The key different between a ParentNodeServer and a LeafNodeServer is that when a
message is received, a ParentNodeServer can issue non-blocking request(s) to one or several nodes in a lower
tier of the system, and when the response(s) are received, the ParentNodeServer will resume processing the
original message. This is done in a style that closely resembles continuations. We now describe the operations
available to the ParentNodeServer. The relevant definitions and methods can be found in Callbacks.h,
ParentNodeServer.h, and FanoutManager.h.

APPENDIX A. OLDISIM: BENCHMARKING SCALE-OUT WORKLOADS 113
typedef std::function<void(NodeThread&, FanoutManager&)>
ParentNodeThreadStartupCallback;
typedef std::function<void(NodeThread&, FanoutManager&, QueryContext&)>
ParentNodeQueryCallback;
Figure A.11: Callbacks.h relevant to ParentNodeServer

APPENDIX A. OLDISIM: BENCHMARKING SCALE-OUT WORKLOADS 114
explicit ParentNodeServer(uint16_t port);
void Run(uint32_t num_threads, bool thread_pinning);
/**
* Set the callback to run after a thread has started up.
* It will run in the context of the newly started thread.
*/
void SetThreadStartupCallback(
const ParentNodeThreadStartupCallback& callback);
/**
* Set the callback to run after an incoming connection from a higher
* level parent is accepted and a
* ParentConnection object representing that connection has been made.
* It will run in the context of main event loop thread.
*/
void SetAcceptCallback(const AcceptCallback& callback);
/**
* Set the callback to run after an incoming query is received from a parent.
* It will run in the context of the event thread that is responsible
* for the connection. The callback will be used for incoming queries
* of the given type.
*/
void RegisterQueryCallback(uint32_t type,
const ParentNodeQueryCallback& callback);
/**
* Inform the parent node server that it can send requests of the specified
* type
*/
void RegisterRequestType(uint32_t type);
/**
* Add a hostname:port as a child node that requests can be sent to.
* Note that it is up to the thread to create the actual connections.
*/
void AddChildNode(std::string hostname, uint16_t port);
/**
* Enable remote statistics monitoring at a given port.
* It exposes a HTTP server with several URLs that provide diagnostic
* and monitoring information
*/
void EnableMonitoring(uint16_t port);
Figure A.12: Relevant methods in ParentNodeServer class

APPENDIX A. OLDISIM: BENCHMARKING SCALE-OUT WORKLOADS 115
struct FanoutRequest {
uint32_t child_node_id;
uint32_t request_type;
const void* request_data;
uint32_t request_data_length;
};
struct FanoutReply {
bool timed_out;
uint32_t child_node_id;
uint32_t request_type;
std::unique_ptr<uint8_t[]> reply_data;
uint32_t reply_data_length;
float latency_ms;
};
struct FanoutReplyTracker {
uint64_t starting_request_id;
int num_requests;
int num_replies_received;
std::vector<FanoutReply> replies;
bool closed; // Marked as such when timed out or when all replies received
uint64_t start_time;
};
class FanoutManager {
public:
// Methods to create child connections, used by user programs
void MakeChildConnection(uint32_t child_node_id);
void MakeChildConnections(uint32_t child_node_id, int num);
// Methods to perform fanout queries
typedef std::function<void(QueryContext&, const FanoutReplyTracker&)>
FanoutDoneCallback;
void Fanout(QueryContext&& originating_query, const FanoutRequest* requests,
int num_requests, const FanoutDoneCallback& callback,
double timeout_ms = 0.0);
void FanoutAll(QueryContext&& originating_query, const FanoutRequest& request,
const FanoutDoneCallback& callback, double timeout_ms = 0.0);
};
Figure A.13: Relevant code in FanoutManager.h
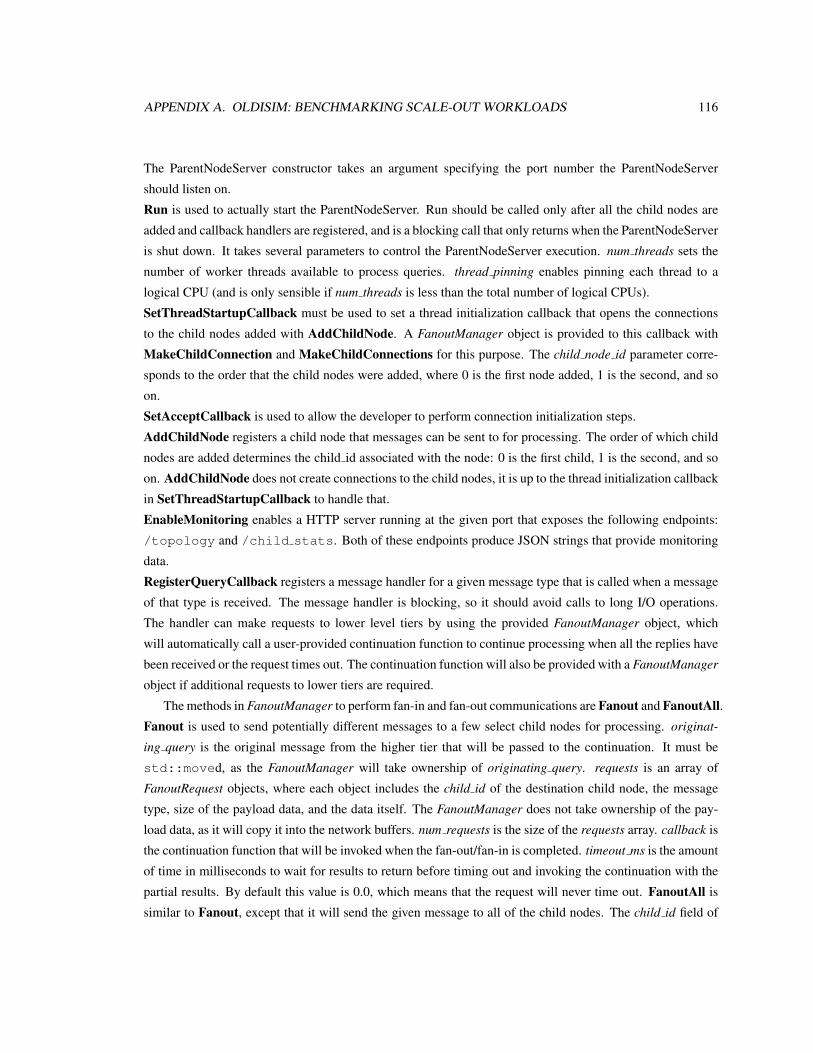
APPENDIX A. OLDISIM: BENCHMARKING SCALE-OUT WORKLOADS 116
The ParentNodeServer constructor takes an argument specifying the port number the ParentNodeServer
should listen on.
Run is used to actually start the ParentNodeServer. Run should be called only after all the child nodes are
added and callback handlers are registered, and is a blocking call that only returns when the ParentNodeServer
is shut down. It takes several parameters to control the ParentNodeServer execution. num threads sets the
number of worker threads available to process queries. thread pinning enables pinning each thread to a
logical CPU (and is only sensible if num threads is less than the total number of logical CPUs).
SetThreadStartupCallback must be used to set a thread initialization callback that opens the connections
to the child nodes added with AddChildNode. A FanoutManager object is provided to this callback with
MakeChildConnection and MakeChildConnections for this purpose. The child node id parameter corre-
sponds to the order that the child nodes were added, where 0 is the first node added, 1 is the second, and so
on.
SetAcceptCallback is used to allow the developer to perform connection initialization steps.
AddChildNode registers a child node that messages can be sent to for processing. The order of which child
nodes are added determines the child id associated with the node: 0 is the first child, 1 is the second, and so
on. AddChildNode does not create connections to the child nodes, it is up to the thread initialization callback
in SetThreadStartupCallback to handle that.
EnableMonitoring enables a HTTP server running at the given port that exposes the following endpoints:
/topology and /child stats. Both of these endpoints produce JSON strings that provide monitoring
data.
RegisterQueryCallback registers a message handler for a given message type that is called when a message
of that type is received. The message handler is blocking, so it should avoid calls to long I/O operations.
The handler can make requests to lower level tiers by using the provided FanoutManager object, which
will automatically call a user-provided continuation function to continue processing when all the replies have
been received or the request times out. The continuation function will also be provided with a FanoutManager
object if additional requests to lower tiers are required.
The methods in FanoutManager to perform fan-in and fan-out communications are Fanout and FanoutAll.Fanout is used to send potentially different messages to a few select child nodes for processing. originat-
ing query is the original message from the higher tier that will be passed to the continuation. It must be
std::moved, as the FanoutManager will take ownership of originating query. requests is an array of
FanoutRequest objects, where each object includes the child id of the destination child node, the message
type, size of the payload data, and the data itself. The FanoutManager does not take ownership of the pay-
load data, as it will copy it into the network buffers. num requests is the size of the requests array. callback is
the continuation function that will be invoked when the fan-out/fan-in is completed. timeout ms is the amount
of time in milliseconds to wait for results to return before timing out and invoking the continuation with the
partial results. By default this value is 0.0, which means that the request will never time out. FanoutAll is
similar to Fanout, except that it will send the given message to all of the child nodes. The child id field of

APPENDIX A. OLDISIM: BENCHMARKING SCALE-OUT WORKLOADS 117
the request object is ignored in this case.
The continuation function called after the fan-in/fan-out is given the results of the fan-in/fan-out in a
FanoutReplyTracker object. The FanoutReplyTracker object contains information on all the messages sent to
the lower tier, including messages without a response because they timed out. The response payload data is
owned by the FanoutReplyTracker object, and if it is needed later in a future continuation/callback, should
be std::moved to preserve it. After processing the replies, the continuation function can either continue
making requests to the lower tier using the provided FanoutManager object or to send a response to the
original message from the higher tier with the provided QueryContext.
RegisterRequestType is used to inform the ParentServerNode that it is capable of sending messages of the
specified type. Sending a message type that was not registered is an error.

APPENDIX A. OLDISIM: BENCHMARKING SCALE-OUT WORKLOADS 118
void ThreadStartup(oldisim::NodeThread& thread,
oldisim::FanoutManager& fanout_manager) {
// Connect to the two children with 20 connections each
fanout_manager.MakeChildConnections(0, 20);
fanout_manager.MakeChildConnections(1, 20);
}
void RequestHandler(oldisim::NodeThread& thread,
oldisim::FanoutManager& fanout_manager,
oldisim::QueryContext& context) {
// Send a message of type 1 and content "0" to all children
oldisim::FanoutRequest request;
request.request_type = 1;
request.request_data = "0";
request.request_data_length = 1;
fanout_manager.FanoutAll(std::move(context), request, FanoutDone);
}
void FanoutDone(oldisim::QueryContext& originating_query,
const oldisim::FanoutReplyTracker& results) {
// Send back the data to higher tier
originating_query.SendResponse("0", 1);
}
int main(int argc, char** argv) {
oldisim::ParentNodeServer server(1234); // Create server on port 1234
// Set thread startup callback to create connections
server.SetThreadStartupCallback(ThreadStartup);
server.RegisterQueryCallback(0, RequestHandler); // Handle messages of type 0
server.RegisterRequestType(1); // Can send children messages of type 1
server.AddChildNode("leaf1", 1234); // Add child nodes
server.AddChildNode("leaf2", 1234);
server.EnableMonitoring(8080); // Enable remote monitoring
server.Run(4, true); // Start with 4 worker threads and with thread pinning
return 0;
}
Figure A.14: Sample ParentNodeServer code

APPENDIX A. OLDISIM: BENCHMARKING SCALE-OUT WORKLOADS 119
A.4 Implementation details for OLDIsim
In this section we describe the internal implementation details for OLDIsim. This information could be useful
to developers wishing to further optimize OLDIsim or to understand performance subtleties of applications
written on top of OLDIsim.
A.4.1 Event handling
OLDIsim uses libevent2 [107] to handle events, such as incoming connections, incoming messages, timeout
timers, etc. For scalability purposes, there is one event base per worker-thread that handles the events for
each thread. The main thread (i.e. the thread that calls Run) has one event base to handle new connections.
OLDIsim uses a connection load balancing model similar to memcached, in that new connections are assigned
round-robin to worker threads for connection handling. When a new connection is established, the main
thread will select a worker-thread to assign the connection to, put the connection fd into a queue for that
thread, and activate an event telling the worker thread that it has a new connection. This is the only explicit
locking that occurs between the main thread and the worker threads.
When a worker-thread receives a complete message from a connection, it will take one of two actions
depending on whether load balancing is enabled. If load balancing is not enabled, it will immediately call
the user-provided callback to process the message. For the load-balancing case, applicable only to LeafN-
odeServers, refer to Section A.4.2.
A.4.2 LeafNodeServer load-balancing
OLDIsim supports worker-thread load balancing for the LeafNodeServer, as the bulk of the computation
should occur there. The load-balancing mechanism is similar to task-stealing parallel runtimes, such as
Cilk [11]. When enabled, each worker-thread has a lock-free task queue (provided by Boost C++ library’s
lockfree implementation) that holds outstanding messages. When this task queue has elements in it, an
event will be registered with the thread’s event base to process messages from its local queue. To enable
load-balancing via task-stealing, whenever new messages come in, the thread will also wake other threads to
perform task-stealing. If a worker-thread is unable to steal from all other threads, it will go back to sleep until
an event wakes it up again. To ensure that worker threads do not spend all their time processing requests,
the lb process request batch size parameter controls the maximum number of requests that can be processed
before it will check for new work from the connections it is responsible for. Compared to parallel task-
stealing runtimes, the task-stealing in OLDIsim will steal from the same end of the queue that the owner
thread dequeues from, the reason behind this being to drain the queue in the same order that requests arrive
in to minimize queueing delay.
We show the benefits of using load-balancing in Figure A.15. For this experiment, we used the LeafNodefrom the search example workload (see Section A.5 and measured the latency of requests with and without
load-balancing enabled. The benefits of load-balancing are especially pronounced for tail latencies. This is

APPENDIX A. OLDISIM: BENCHMARKING SCALE-OUT WORKLOADS 120
0
2
4
6
8
10
12
14
16
18
0 2000 4000 6000
Mea
n la
ten
cy (
ms)
QPS
Effect of load balancing on mean latency
No load balancing Load balancing
(a) Mean latency comparison
0
10
20
30
40
50
60
70
80
90
0 2000 4000 6000
99
.9%
-ile
late
ncy
(m
s)
QPS
Effect of load balancing on 99.9%-ile latency
No load balancing Load balancing
(b) 99.9%-ile latency comparison
Figure A.15: Different types of nodes in OLDIsim
Load Balancer
Root Root Root Root
Leaf Leaf Leaf Leaf
…
…
Figure A.16: Workload topology for websearch
because of the reduction of queueing delay caused by load-balancing, where messages that would be stuck
behind a long-running query are instead processed elsewhere.
A.5 Sample websearch workload
We provide a sample workload for OLDIsim modeled off of Google websearch called search. It can be found
in the workloads/search directory. While it does not perform the same computation as actual Google
websearch, it has approximately the same communication patterns and normalized request processing latency
distributions. search showcases the ease of writing OLDIsim applications, as the source code for the entire
benchmark is less than 1000 lines of code.
We show the topology of search in Figure A.16, which closely matches the topology of production Google
websearch. There is a top-level Load Balancer node that performs round-robin load-balancing between the

APPENDIX A. OLDISIM: BENCHMARKING SCALE-OUT WORKLOADS 121
0.E+00
1.E-05
2.E-05
3.E-05
4.E-05
5.E-05
6.E-05
7.E-05
8.E-05
9.E-05
1.E-04
0 10000 20000 30000 40000 50000
X
(a) PDF
0
0.1
0.2
0.3
0.4
0.5
0.6
0.7
0.8
0.9
1
0 10000 20000 30000 40000 50000
X
CDF
(b) CDF
Figure A.17: PDF and CDF of Γ(α = 0.7, β = 20000)
0%
20%
40%
60%
80%
100%
0% 20% 40% 60% 80% 100%
Me
an la
ten
cy v
s. p
eak
QPS vs. peak
Mean end-to-end latency
oldisim search
Figure A.18: Comparison of latency between Google websearch and websearch on OLDIsim.
various Root nodes. Each Root node then queries all the Leaf nodes in the system, only producing a result
when all the Leaf nodes have responded.
The Leaf nodes do not actually perform searches, but they do execute an instruction mix to simulate
some microarchitectural aspects of search: a low CPI and a high number of data-cache and instruction-cache
misses. The instruction mix is looped sufficient times to produce a request processing time distribution that
has the same shape as request processing latencies observed in production Google websearch. While the

APPENDIX A. OLDISIM: BENCHMARKING SCALE-OUT WORKLOADS 122
absolute values of the distribution obviously do not correspond to absolute latencies, the best fit model we
found is a Γ(α = 0.7, β = 20000) distribution, which we show in Figure A.17. Combined with the topology
of search, we validate that the end-to-end latencies observed at the test driver closely match the shape of
end-to-end latencies observed for production websearch, as shown in Figure A.18.
search is included in the Google PerfKitBenchmarker [40, 148] to benchmark the scaling efficiency of
various public clouds. As a metric, scaling efficiency captures the trade-offs of scaling-out the service to
handle larger datasets when a workload cannot fit on a single node. To measure scaling efficiency, the
benchmark first finds the maximum QPS supported by the system when only running with one leaf node
while meeting a latency service level objective (SLO) target (QPS1). Then the number of leaf nodes (l)
is increased and the corresponding maximum QPS that meets the SLO is recorded (QPSl). The scaling
efficiency is computed as El = QPSl
QPS1. As the number of leaf nodes is increased, the scaling efficiency
is expected to decrease due to probability: the slowest leaf node will determine the overall query latency,
and more leaf nodes means more chances of a slow leaf node. On public clouds, interference caused by co-
located workloads, jitter in the network, etc. can decrease the scaling efficiency further. Thus, search captures
performance variability in scaling efficiency, where an environment with higher performance variability will
suffer from lower scaling efficiencies.
A.6 Conclusions
In conclusion, OLDIsim is a benchmarking framework that fills the need for a performant yet easy to use
toolkit to develop scale-out applications. We show that OLDIsim takes advantage of multiple cores and
multiple threads to scale up performance on a single node, while exposing APIs to handle communication
patterns for scaling-out on several nodes. By abstracting away boilerplate logic for handling networking
and multithreading, OLDIsim makes it easy for developers to use to write their own scale-out benchmarks.
We also include search, an example OLDIsim benchmark that is also included in the open-source Google
PerfKitBenchmarker. OLDIsim is released as an open-source project under the Apache 2.0 license.
A.7 Acknowledgements
OLDIsim was developed with the support of several teams at Google while David Lo was an intern there.
Rama Govindaraju, Liqun Cheng, and Hui Huang from the Platforms Performance Team and Anthony
Voellm, Ivan Filho, and Connor McCoy from the Cloud Performance Team were instrumental in the de-
velopment of OLDIsim.

Bibliography
[1] ADVANCED MICRO DEVICES, INC. The New AMD OpteronTM
Processor Core Technology, 2011.
[2] AL-FARES, M., LOUKISSAS, A., AND VAHDAT, A. A Scalable, Commodity Data Center Network
Architecture. In Proc. of the ACM SIGCOMM 2008 Conference on Data Communication (New York,
NY, 2008), SIGCOMM ’08, ACM.
[3] ALIZADEH, M., GREENBERG, A., MALTZ, D. A., PADHYE, J., PATEL, P., PRABHAKAR, B., SEN-
GUPTA, S., AND SRIDHARAN, M. Data Center TCP (DCTCP). In Proc. of the ACM SIGCOMM 2010
Conference (New York, NY, 2010), SIGCOMM ’10, ACM.
[4] AYDIN, H., MELHEM, R., MOSSE, D., AND MEJIA-ALVAREZ, P. Power-Aware Scheduling for
Periodic Real-Time Tasks.
[5] BARROSO, L., AND HLZLE, U. The Case for Energy-Proportional Computing.
[6] BARROSO, L. A., CLIDARAS, J., AND HOLZLE, U. The Datacenter as a Computer: An Introduction
to the Design of Warehouse-Scale Machines, second ed. Morgan & Claypool, 2013.
[7] BARROSO, L. A., AND HOLZLE, U. The Datacenter as a Computer: An Introduction to the Design
of Warehouse-Scale Machines. Morgan & Claypool, 2009.
[8] BELAY, A., PREKAS, G., KLIMOVIC, A., GROSSMAN, S., KOZYRAKIS, C., AND BUGNION, E.
IX: A Protected Dataplane Operating System for High Throughput and Low Latency. In 11th USENIX
Symposium on Operating Systems Design and Implementation (OSDI 14) (10 2014), USENIX Asso-
ciation.
[9] BIENIA, C., KUMAR, S., SINGH, J. P., AND LI, K. The PARSEC benchmark suite: characterization
and architectural implications. In PACT 2008 (2008).
[10] BLAGODUROV, S., ZHURAVLEV, S., DASHTI, M., AND FEDOROVA, A. A Case for NUMA-aware
Contention Management on Multicore Systems. In Proc. of the 2011 USENIX Conference on USENIX
Annual Technical Conference (Berkeley, CA, 2011), USENIXATC’11, USENIX Association.
123

BIBLIOGRAPHY 124
[11] BLUMOFE, R. D., JOERG, C. F., KUSZMAUL, B. C., LEISERSON, C. E., RANDALL, K. H., AND
ZHOU, Y. Cilk: An Efficient Multithreaded Runtime System. SIGPLAN Not. 30, 8 (Aug. 1995),
207–216.
[12] BOUTIN, E., EKANAYAKE, J., LIN, W., SHI, B., ZHOU, J., QIAN, Z., WU, M., AND ZHOU, L.
Apollo: Scalable and Coordinated Scheduling for Cloud-Scale Computing. In 11th USENIX Sympo-
sium on Operating Systems Design and Implementation (OSDI 14) (2014), USENIX Association.
[13] BRISCOE, B. Flow Rate Fairness: Dismantling a Religion.
[14] BROOKS, D., BOSE, P., SCHUSTER, S., JACOBSON, H., KUDVA, P., BUYUKTOSUNOGLU, A.,
WELLMAN, J., ZYUBAN, V., GUPTA, M., AND COOK, P. Power-aware microarchitecture: design
and modeling challenges for next-generation microprocessors.
[15] BROWN, M. A. Traffic Control HOWTO. http://linux-ip.net/articles/
Traffic-Control-HOWTO/.
[16] CARVALHO, M., CIRNE, W., BRASILEIRO, F., AND WILKES, J. Long-term SLOs for Reclaimed
Cloud Computing Resources. In Proc. of SOCC (12 2014).
[17] CHARLES, J., JASSI, P., ANANTH, N., SADAT, A., AND FEDOROVA, A. Evaluation of the Intel R©
CoreTM
i7 Turbo Boost feature. In IISWC 2009 (2009).
[18] CHEN, Y., ALSPAUGH, S., BORTHAKUR, D., AND KATZ, R. Energy efficiency for large-scale
mapreduce workloads with significant interactive analysis. In Proc. of the 7th ACM european Conf. on
Computer Systems (2012).
[19] CHUN, B.-G., IANNACCONE, G., IANNACCONE, G., KATZ, R., LEE, G., AND NICCOLINI, L. An
energy case for hybrid datacenters.
[20] CISCO SYSTEMS, INC. Cisco Global Cloud Index: Forecast and Methodology 20132018 White Paper.
http://www.cisco.com/c/en/us/solutions/collateral/service-provider/
global-cloud-index-gci/Cloud_Index_White_Paper.html, 2013.
[21] COOK, H., MORETO, M., BIRD, S., DAO, K., PATTERSON, D. A., AND ASANOVIC, K. A Hard-
ware Evaluation of Cache Partitioning to Improve Utilization and Energy-efficiency While Preserving
Responsiveness. In Proc. of the 40th Annual Intl. Symp. on Computer Architecture (2013), ISCA ’13.
[22] CURINO, C., DIFALLAH, D. E., DOUGLAS, C., KRISHNAN, S., RAMAKRISHNAN, R., AND RAO,
S. Reservation-based Scheduling: If Youre Late Dont Blame Us! In Proc. of the 5th annual Symposium
on Cloud Computing (2014).
[23] CURK, T., DEMSAR, J., XU, Q., LEBAN, G., PETROVIC, U., BRATKO, I., SHAULSKY, G., AND
ZUPAN, B. Microarray data mining with visual programming.

BIBLIOGRAPHY 125
[24] DE KUNDER, M. WorldWideWebSize.com — The size of the World Wide Web (The Internet). http:
//www.worldwidewebsize.com/, 2015.
[25] DEAN, J. Challenges in Building Large-scale Information Retrieval Systems: Invited Talk. In Proc.
of the 2nd ACM Intl. Conf. on Web Search and Data Mining (2009), WSDM ’09.
[26] DEAN, J., AND BARROSO, L. A. The tail at scale.
[27] DEGRANDIS, W. Power Considerations in Siting Data Centers.
http://www.datacenterknowledge.com/archives/2011/02/08/
power-considerations-in-siting-data-centers/, 2011.
[28] DELIMITROU, C., AND KOZYRAKIS, C. Paragon: QoS-Aware Scheduling for Heterogeneous Dat-
acenters. In Proc. of the 18th Intl. Conf. on Architectural Support for Programming Languages and
Operating Systems (ASPLOS) (2013), Houston, TX, USA, 2013.
[29] DELIMITROU, C., AND KOZYRAKIS, C. Quasar: Resource-Efficient and QoS-Aware Cluster Man-
agement. In Proc. of the Nineteenth International Conference on Architectural Support for Program-
ming Languages and Operating Systems (ASPLOS) (2014).
[30] DENNARD, R. H., CAI, J., AND KUMAR, A. A perspective on todays scaling challenges and possible
future directions. Solid-State Electronics 51, 4 (2007), 518–525.
[31] EBRAHIMI, E., LEE, C. J., MUTLU, O., AND PATT, Y. N. Fairness via Source Throttling: A Con-
figurable and High-performance Fairness Substrate for Multi-core Memory Systems. In Proc. of the
Fifteenth Edition of ASPLOS on Architectural Support for Programming Languages and Operating
Systems (New York, NY, 2010), ASPLOS XV, ACM.
[32] ESMAEILZADEH, H., BLEM, E., ST.AMANT, R., SANKARALINGAM, K., AND BURGER, D. Dark
silicon and the end of multicore scaling. In Computer Architecture (ISCA), 2011 38th Annual Interna-
tional Symposium on (June 2011).
[33] EYERMAN, S., AND EECKHOUT, L. A Counter Architecture for Online DVFS Profitability Estima-
tion.
[34] FAN, X., WEBER, W.-D., AND BARROSO, L. A. Power Provisioning for a Warehouse-sized Com-
puter. In The 34th ACM International Symposium on Computer Architecture (2007).
[35] FERDMAN, M., ADILEH, A., KOCBERBER, O., VOLOS, S., ALISAFAEE, M., JEVDJIC, D., KAY-
NAK, C., POPESCU, A. D., AILAMAKI, A., AND FALSAFI, B. Clearing the clouds: a study of
emerging scale-out workloads on modern hardware. In ASPLOS 2012 (2012).
[36] FLAUTNER, K., AND MUDGE, T. Vertigo: Automatic Performance-setting for Linux.

BIBLIOGRAPHY 126
[37] GE, R., FENG, X., CHUN FENG, W., AND CAMERON, K. CPU MISER: A Performance-Directed,
Run-Time System for Power-Aware Clusters. In Parallel Processing, 2007. ICPP 2007. Intl. Conf. on
(2007).
[38] GLANZ, J. Power, Pollution and the Internet.
[39] GOODFELLOW, I. J., BULATOV, Y., IBARZ, J., ARNOUD, S., AND SHET, V. Multi-digit num-
ber recognition from street view imagery using deep convolutional neural networks. arXiv preprint
arXiv:1312.6082 (2013).
[40] GOOGLE INC. GoogleCloudPlatform/PerfKitBenchmarker. https://github.com/
GoogleCloudPlatform/PerfKitBenchmarker.
[41] GOOGLE INC. Protocol Buffers. https://developers.google.com/
protocol-buffers/.
[42] GOOGLE INC. Efficiency: How we do it. https://www.google.com/about/
datacenters/efficiency/internal/, 2015.
[43] GOVINDAN, S., LIU, J., KANSAL, A., AND SIVASUBRAMANIAM, A. Cuanta: quantifying effects
of shared on-chip resource interference for consolidated virtual machines. In Proc. of the 2nd ACM
Symposium on Cloud Computing (2011).
[44] GUO, F., KANNAN, H., ZHAO, L., ILLIKKAL, R., IYER, R., NEWELL, D., SOLIHIN, Y., AND
KOZYRAKIS, C. From Chaos to QoS: Case Studies in CMP Resource Management.
[45] GUO, F., SOLIHIN, Y., ZHAO, L., AND IYER, R. A Framework for Providing Quality of Service in
Chip Multi-Processors. In Proc. of the 40th Annual IEEE/ACM International Symposium on Microar-
chitecture (2007), MICRO 40, IEEE Computer Society.
[46] HAMILTON, J. Overall Data Center Costs. http://perspectives.mvdirona.com/2010/
09/18/OverallDataCenterCosts.aspx, 2010.
[47] HAMILTON, J. Keynote. In ISCA 2011 (2011).
[48] HARDAVELLAS, N., FERDMAN, M., FALSAFI, B., AND AILAMAKI, A. Toward Dark Silicon in
Servers.
[49] HARRIS, S. Microsoft Reinvents Datacenter Power Backup with New Open Compute Project Spec-
ification. http://blogs.technet.com/b/server-cloud/archive/2015/03/10/
microsoft-reinvents-datacenter-power-backup-with-new-open-compute-project-specification.
aspx, 2015.
[50] HERDRICH, A., ILLIKKAL, R., IYER, R., NEWELL, D., CHADHA, V., AND MOSES, J. Rate-based
QoS Techniques for Cache/Memory in CMP Platforms. In ICS-23 (2009).

BIBLIOGRAPHY 127
[51] HINDMAN, B., KONWINSKI, A., ZAHARIA, M., GHODSI, A., JOSEPH, A. D., KATZ, R.,
SHENKER, S., AND STOICA, I. Mesos: a platform for fine-grained resource sharing in the data
center. In Proc. of the 8th USENIX Conf. on Networked systems design and implementation (2011),
NSDI’11.
[52] HSU, L. R., REINHARDT, S. K., IYER, R., AND MAKINENI, S. Communist, Utilitarian, and Cap-
italist Cache Policies on CMPs: Caches As a Shared Resource. In Proc. of the 15th International
Conference on Parallel Architectures and Compilation Techniques (New York, NY, 2006), PACT ’06,
ACM.
[53] HUANG, M., RENAU, J., YOO, S.-M., AND TORRELLAS, J. A Framework for Dynamic Energy
Efficiency and Temperature Management. In Proc. of the 33rd Annual ACM/IEEE Intl. Symp. on
Microarchitecture (2000), MICRO 33.
[54] INTEL CORPORATION. Addressing power and thermal challenges in the datacenter,.
[55] INTEL CORPORATION. Intel R©Xeon R©Processor E5-2667 v2 (25M
Cache, 3.30GHz). http://ark.intel.com/products/75273/
Intel-Xeon-Processor-E5-2667-v2-25M-Cache-3_30-GHz.
[56] INTEL CORPORATION. Linux/drivers/idle/intel idle.c. http://lxr.free-electrons.com/
source/drivers/idle/intel_idle.c.
[57] INTEL CORPORATION. Serial ATA II Native Command Queuing Overview. http://download.
intel.com/support/chipsets/imsm/sb/sata2_ncq_overview.pdf, 2003.
[58] INTEL CORPORATION. Intel R© Turbo Boost Technology in Intel R© CoreTM
Microarchitecture (Ne-
halem) Based Processors, 2008.
[59] INTEL CORPORATION. Intel R©CoreTMi7 Processor Family for the LGA-2011 Socket.
[60] INTEL CORPORATION. Intel R©64 and IA-32 Architectures Software Developer’s Manual.
[61] IPERF. Iperf - The TCP/UDP Bandwidth Measurement Tool. https://iperf.fr/.
[62] ISCI, C., BUYUKTOSUNOGLU, A., CHER, C.-Y., BOSE, P., AND MARTONOSI, M. An Analysis
of Efficient Multi-Core Global Power Management Policies: Maximizing Performance for a Given
Power Budget. In MICRO-39 (2006).
[63] ISCI, C., BUYUKTOSUNOGLU, A., AND MARTONOSI, M. Long-term workload phases: duration
predictions and applications to DVFS. In MICRO-38 (2005).
[64] ISCI, C., AND MARTONOSI, M. Runtime power monitoring in high-end processors: methodology
and empirical data. In MICRO-36 (2003).

BIBLIOGRAPHY 128
[65] ISSARIYAKUL, T., AND HOSSAIN, E. Introduction to Network Simulator NS2, 1st ed. Springer
Publishing Company, Incorporated, 2010.
[66] ITU. Number of worldwide internet users from 2000 to 2014 (in millions). http://www.
statista.com/statistics/273018/number-of-internet-users-worldwide/,
2015.
[67] IYER, R. CQoS: A Framework for Enabling QoS in Shared Caches of CMP Platforms. In Proc. of the
18th Annual International Conference on Supercomputing (New York, NY, 2004), ICS ’04, ACM.
[68] IYER, R., ZHAO, L., GUO, F., ILLIKKAL, R., MAKINENI, S., NEWELL, D., SOLIHIN, Y., HSU,
L., AND REINHARDT, S. QoS Policies and Architecture for Cache/Memory in CMP Platforms. In
Proc. of the 2007 ACM SIGMETRICS Intl. Conf. on Measurement and Modeling of Computer Systems
(2007), SIGMETRICS ’07.
[69] JAHRE, M., GRANNAES, M., AND NATVIG, L. A Quantitative Study of Memory System Interference
in Chip Multiprocessor Architectures. In HPCC 2009 (2009).
[70] JALEEL, A., HASENPLAUGH, W., QURESHI, M., SEBOT, J., STEELY, JR., S., AND EMER, J. Adap-
tive insertion policies for managing shared caches. In PCT 2008 (2008).
[71] JANAPA REDDI, V., LEE, B. C., CHILIMBI, T., AND VAID, K. Web search using mobile cores:
quantifying and mitigating the price of efficiency.
[72] JEONG, M. K., EREZ, M., SUDANTHI, C., AND PAVER, N. A QoS-aware Memory Controller for
Dynamically Balancing GPU and CPU Bandwidth Use in an MPSoC. In Proc. of the 49th Annual
Design Automation Conference (New York, NY, 2012), DAC ’12, ACM.
[73] JERGER, N., VANTREASE, D., AND LIPASTI, M. An Evaluation of Server Consolidation Workloads
for Multi-Core Designs. In Workload Characterization, 2007. IISWC 2007. IEEE 10th Intl. Symp. on
(2007).
[74] JEYAKUMAR, V., ALIZADEH, M., MAZIRES, D., PRABHAKAR, B., KIM, C., AND GREENBERG,
A. EyeQ: Practical Network Performance Isolation at the Edge. In Proc. of the 10th USENIX Con-
ference on Networked Systems Design and Implementation (Berkeley, CA, 2013), nsdi’13, USENIX
Association.
[75] KANEV, S., HAZELWOOD, K., WEI, G.-Y., AND BROOKS, D. Tradeoffs between Power Manage-
ment and Tail Latency in Warehouse-Scale Applications. In IISWC (2014).
[76] KAPOOR, R., PORTER, G., TEWARI, M., VOELKER, G. M., AND VAHDAT, A. Chronos: Predictable
Low Latency for Data Center Applications. In Proc. of the Third ACM Symposium on Cloud Computing
(New York, NY, 2012), SoCC ’12, ACM.

BIBLIOGRAPHY 129
[77] KARPATHY, A., AND FEI-FEI, L. Deep visual-semantic alignments for generating image descriptions.
arXiv preprint arXiv:1412.2306 (2014).
[78] KASTURE, H., AND SANCHEZ, D. Ubik: Efficient Cache Sharing with Strict QoS for Latency-Critical
Workloads. In Proc. of the 19th international conference on Architectural Support for Programming
Languages and Operating Systems (ASPLOS-XIX) (March 2014).
[79] KHARE, R., AND CUTTING, D. Nutch: A flexible and scalable open-source web search engine.
[80] KIM, W., GUPTA, M., WEI, G.-Y., AND BROOKS, D. System level analysis of fast, per-core DVFS
using on-chip switching regulators. In HPCA 2008 (2008).
[81] KONDO, M., SASAKI, H., AND NAKAMURA, H. Improving Fairness, Throughput and Energy-
efficiency on a Chip Multiprocessor Through DVFS.
[82] LANG, W., AND PATEL, J. M. Energy management for mapreduce clusters.
[83] LE, Q., RANZATO, M., MONGA, R., DEVIN, M., CHEN, K., CORRADO, G., DEAN, J., AND NG,
A. Building high-level features using large scale unsupervised learning. In International Conference
in Machine Learning (2012).
[84] LEE, J., AND KIM, N. S. Optimizing Throughput of Power- and Thermal-constrained Multicore
Processors Using DVFS and Per-core Power-gating. In Proc. of the 46th Annual Design Automation
Conf. (2009), DAC ’09.
[85] LEVERICH, J., AND KOZYRAKIS, C. On the Energy (in)Efficiency of Hadoop Clusters.
[86] LEVERICH, J., AND KOZYRAKIS, C. Reconciling High Server Utilization and Sub-millisecond
Quality-of-Service. In SIGOPS European Conf. on Computer Systems (EuroSys) (2014).
[87] LEVERICH, J., MONCHIERO, M., TALWAR, V., RANGANATHAN, P., AND KOZYRAKIS, C. Power
Management of Datacenter Workloads Using Per-Core Power Gating.
[88] LEVERICH, J. B. Future Scaling of Datacenter Power-efficiency. PhD thesis, Stanford University,
2014.
[89] LI, B., ZHAO, L., IYER, R., PEH, L.-S., LEDDIGE, M., ESPIG, M., LEE, S. E., AND NEWELL, D.
CoQoS: Coordinating QoS-aware Shared Resources in NoC-based SoCs.
[90] LIM, K., MEISNER, D., SAIDI, A. G., RANGANATHAN, P., AND WENISCH, T. F. Thin Servers with
Smart Pipes: Designing SoC Accelerators for Memcached. In Proc. of the 40th Annual International
Symposium on Computer Architecture (2013).
[91] LIM, K., RANGANATHAN, P., CHANG, J., PATEL, C., MUDGE, T., AND REINHARDT, S. Under-
standing and Designing New Server Architectures for Emerging Warehouse-Computing Environments.

BIBLIOGRAPHY 130
[92] LIM, K., TURNER, Y., SANTOS, J. R., AUYOUNG, A., CHANG, J., RANGANATHAN, P., AND
WENISCH, T. F. System-level Implications of Disaggregated Memory. In Proc. of the 2012 IEEE
18th International Symposium on High-Performance Computer Architecture (2012), HPCA ’12, IEEE
Computer Society.
[93] LIN, C., AND BRANDT, S. A. Improving Soft Real-Time Performance Through Better Slack Re-
claiming. In Proc. of the 26th IEEE Intl. Real-Time Systems Symp. (2005), RTSS ’05.
[94] LIN, J., LU, Q., DING, X., ZHANG, Z., ZHANG, X., AND SADAYAPPAN, P. Gaining insights
into multicore cache partitioning: Bridging the gap between simulation and real systems. In High
Performance Computer Architecture, 2008. HPCA 2008. IEEE 14th International Symposium on (Feb
2008).
[95] LIU, H. A Measurement Study of Server Utilization in Public Clouds. In Dependable, Autonomic and
Secure Computing (DASC), 2011 IEEE Ninth Intl. Conf. on (2011).
[96] LIU, R., KLUES, K., BIRD, S., HOFMEYR, S., ASANOVI, K., AND KUBIATOWICZ, J. Tessellation:
Space-time Partitioning in a Manycore Client OS. In Proc. of the First USENIX Conference on Hot
Topics in Parallelism (Berkeley, CA, 2009), HotPar’09, USENIX Association.
[97] LIU, Y., DRAPER, S. C., AND KIM, N. S. SleepScale: Runtime Joint Speed Scaling and Sleep
States Management for Power Efficient Data Centers. In Proceeding of the 41st Annual International
Symposium on Computer Architecuture (Piscataway, NJ, 2014), ISCA ’14, IEEE Press.
[98] LO, D., CHENG, L., GOVINDARAJU, R., BARROSO, L. A., AND KOZYRAKIS, C. Towards energy
proportionality for large-scale latency-critical workloads. 2014 ACM/IEEE 41st International Sympo-
sium on Computer Architecture (ISCA) 0 (2014), 301–312. c©2014 IEEE. Reprinted with permission.
[99] LO, D., CHENG, L., GOVINDARAJU, R., RANGANATHAN, P., AND KOZYRAKIS, C. Heracles:
Improving Resource Efficiency at Scale. 2015 ACM/IEEE 42nd International Symposium on Computer
Architecture (ISCA) (2015).
[100] LO, D., AND KOZYRAKIS, C. Dynamic management of TurboMode in modern multi-core chips. In
High Performance Computer Architecture (HPCA), 2014 IEEE 20th International Symposium on (Feb
2014), pp. 603–613. c©2014 IEEE. Reprinted with permission.
[101] MALLADI, K. T., LEE, B. C., NOTHAFT, F. A., KOZYRAKIS, C., PERIYATHAMBI, K., AND
HOROWITZ, M. Towards Energy-proportional Datacenter Memory with Mobile DRAM.
[102] MANIKANTAN, R., RAJAN, K., AND GOVINDARAJAN, R. Probabilistic Shared Cache Management
(PriSM). In Proc. of the 39th Annual International Symposium on Computer Architecture (Washington,
DC, 2012), ISCA ’12, IEEE Computer Society.

BIBLIOGRAPHY 131
[103] MANYIKA, J., AND ROXBURGH, C. The great transformer: The impact of the Internet on economic
growth and prosperity. McKinsey Global Institute, October 1 (2011).
[104] MARS, J., TANG, L., SKADRON, K., SOFFA, M., AND HUNDT, R. Increasing Utilization in Modern
Warehouse-Scale Computers Using Bubble-Up.
[105] MARS, J., TANG, L., AND SOFFA, M. L. Directly characterizing cross core interference through
contention synthesis. In HiPEAC 2011 (2011), ACM.
[106] MARSHALL, P., KEAHEY, K., AND FREEMAN, T. Improving Utilization of Infrastructure Clouds. In
Proc. of the 2011 11th IEEE/ACM International Symposium on Cluster, Cloud and Grid Computing
(2011).
[107] MATHEWSON, N., AND PROVOS, N. libevent an event notification library. http://libevent.
org/.
[108] MCKINSEY & COMPANY. Revolutionizing data center efficiency.
[109] MEISNER, D., GOLD, B. T., AND WENISCH, T. F. PowerNap: Eliminating Server Idle Power. In
Proc. of the 14th Intl. Conf. on Architectural Support for Programming Languages and Operating
Systems (2009), ASPLOS XIV.
[110] MEISNER, D., SADLER, C. M., BARROSO, L. A., WEBER, W.-D., AND WENISCH, T. F. Power
Management of Online Data-Intensive Services. In Proc. of the 38th ACM Intl. Symp. on Computer
Architecture (2011).
[111] MEMCACHED. memcached. http://memcached.org/.
[112] MENAGE, P. CGROUPS. https://www.kernel.org/doc/Documentation/cgroups/
cgroups.txt.
[113] MERKEL, A., STOESS, J., AND BELLOSA, F. Resource-conscious scheduling for energy efficiency
on multicore processors. In EuroSys 2010 (2010).
[114] MURALIDHARA, S. P., SUBRAMANIAN, L., MUTLU, O., KANDEMIR, M., AND MOSCIBRODA,
T. Reducing Memory Interference in Multicore Systems via Application-aware Memory Channel
Partitioning. In Proc. of the 44th Annual IEEE/ACM International Symposium on Microarchitecture
(New York, NY, 2011), MICRO-44, ACM.
[115] NAGARAJAN, V., AND GUPTA, R. ECMon: Exposing Cache Events for Monitoring. In Proc. of the
36th Annual International Symposium on Computer Architecture (New York, NY, 2009), ISCA ’09,
ACM.
[116] NATHUJI, R., KANSAL, A., AND GHAFFARKHAH, A. Q-Clouds: Managing Performance Interfer-
ence Effects for QoS-Aware Clouds. In Proc. of EuroSys, France (2010).

BIBLIOGRAPHY 132
[117] NESBIT, K., AGGARWAL, N., LAUDON, J., AND SMITH, J. Fair Queuing Memory Systems. In Mi-
croarchitecture, 2006. MICRO-39. 39th Annual IEEE/ACM International Symposium on (Dec 2006).
[118] NOVAKOVIC, D., VASIC, N., NOVAKOVIC, S., KOSTIC, D., AND BIANCHINI, R. DeepDive: Trans-
parently Identifying and Managing Performance Interference in Virtualized Environments. In Proc. of
the USENIX Annual Technical Conference (ATC’13) (2013).
[119] PATEL, C. D., AND RANGANATHAN, P. Enterprise Power and Cooling: A Chip-to-DataCenter Per-
spective.
[120] PATEL, C. D., AND SHAH, A. J. Cost Model for Planning, Development and Operation of a Data
Center.
[121] PATTARA-AUKOM, W., BANERJEE, S., AND KRISHNAMURTHY, P. Starvation prevention and qual-
ity of service in wireless LANs. In Wireless Personal Multimedia Communications, 2002. The 5th
International Symposium on (Oct 2002), vol. 3.
[122] PILLAI, P., AND SHIN, K. G. Real-time Dynamic Voltage Scaling for Low-power Embedded Oper-
ating Systems. In Proc. of the Eighteenth ACM Symp. on Operating Systems Principles (2001), SOSP
’01.
[123] PODLESNY, M., AND WILLIAMSON, C. Solving the TCP-Incast Problem with Application-Level
Scheduling. In Modeling, Analysis Simulation of Computer and Telecommunication Systems (MAS-
COTS), 2012 IEEE 20th International Symposium on (Aug 2012).
[124] POUWELSE, J., LANGENDOEN, K., AND SIPS, H. Dynamic Voltage Scaling on a Low-power Mi-
croprocessor. In Proc. of the 7th Annual Intl. Conf. on Mobile Computing and Networking (2001),
MobiCom ’01.
[125] PUTNAM, A., CAULFIELD, A. M., CHUNG, E. S., CHIOU, D., CONSTANTINIDES, K., DEMME,
J., ESMAEILZADEH, H., FOWERS, J., PRASHANTH, G., JAN, G., MICHAEL, G., HAUCK, H. S.,
HEIL, S., HORMATI, A., KIM, J.-Y., LANKA, S., LARUS, J., PETERSON, E., POPE, S., SMITH,
A., THONG, J., YI, P., AND BURGER, X. D. A Reconfigurable Fabric for Accelerating Large-
scale Datacenter Services. In Proceeding of the 41st Annual International Symposium on Computer
Architecuture (Piscataway, NJ, 2014), ISCA ’14, IEEE Press.
[126] QURESHI, M. K., AND PATT, Y. N. Utility-based cache partitioning: A low-overhead, high-
performance, runtime mechanism to partition shared caches. In Proc. of the 39th Annual IEEE/ACM
Intl. Symp. on Microarchitecture (2006).
[127] RAGHAVAN, A., LUO, Y., CHANDAWALLA, A., PAPAEFTHYMIOU, M., PIPE, K. P., WENISCH, T.,
AND MARTIN, M. Computational sprinting. In HPCA-2012 (2012).
BIBLIOGRAPHY 133
[128] RAGHAVENDRA, R., RANGANATHAN, P., TALWAR, V., WANG, Z., AND ZHU, X. No ”Power”
Struggles: Coordinated Multi-level Power Management for the Data Center. In Proc. of the 13th Intl.
Conf. on Architectural Support for Programming Languages and Operating Systems (2008), ASPLOS
XIII.
[129] RAJAMANI, K., RAWSON, F., WARE, M., HANSON, H., CARTER, J., ROSEDAHL, T., GEISSLER,
A., SILVA, G., AND HUA, H. Power-performance management on an IBM POWER7 server. In
Low-Power Electronics and Design (ISLPED), 2010 ACM/IEEE Intl. Symp. on (2010).
[130] RANGANATHAN, P., ADVE, S., AND JOUPPI, N. P. Reconfigurable Caches and Their Application
to Media Processing. In Proc. of the 27th Annual International Symposium on Computer Architecture
(New York, NY, 2000), ISCA ’00, ACM.
[131] RANGANATHAN, P., LEECH, P., IRWIN, D., AND CHASE, J. Ensemble-level Power Management for
Dense Blade Servers. In Proc. of the 33rd Annual Intl. Symp. on Computer Architecture (2006), ISCA
’06.
[132] REISS, C., TUMANOV, A., GANGER, G. R., KATZ, R. H., AND KOZUCH, M. A. Heterogeneity and
Dynamicity of Clouds at Scale: Google Trace Analysis. In ACM Symp. on Cloud Computing (SoCC)
(10 2012).
[133] ROSENBERG, C. Improving Photo Search: A Step Across the Se-
mantic Gap. http://googleresearch.blogspot.com/2013/06/
improving-photo-search-step-across.html.
[134] ROTEM, E., NAVEH, A., RAJWAN, D., ANANTHAKRISHNAN, A., AND WEISSMANN, E. Power
management architecture of the 2nd generation Intel R© CoreTM
microarchitecture, formerly codenamed
Sandy Bridge. In HotChips 23 (2011).
[135] SAHA, S., AND RAVINDRAN, B. An Experimental Evaluation of Real-time DVFS Scheduling Algo-
rithms. In Proc. of the 5th Annual Intl. Systems and Storage Conf. (2012), SYSTOR ’12.
[136] SANCHEZ, D., AND KOZYRAKIS, C. Scalable and Efficient Fine-Grained Cache Partitioning with
Vantage.
[137] SCHURMAN, E., AND BRUTLAG, J. The User and Business Impact of Server Delays, Additional
Bytes, and HTTP Chunking in Web Search.
[138] SEONG, Y. J., NAM, E. H., YOON, J. H., KIM, H., YONG CHOI, J., LEE, S., BAE, Y. H., LEE,
J., CHO, Y., AND MIN, S. L. Hydra: A Block-Mapped Parallel Flash Memory Solid-State Disk
Architecture.

BIBLIOGRAPHY 134
[139] SHARIFI, A., SRIKANTAIAH, S., MISHRA, A. K., KANDEMIR, M., AND DAS, C. R. METE:
Meeting End-to-end QoS in Multicores Through System-wide Resource Management. In Proc. of
the ACM SIGMETRICS Joint International Conference on Measurement and Modeling of Computer
Systems (New York, NY, 2011), SIGMETRICS ’11, ACM.
[140] SHARMA, N., BARKER, S., IRWIN, D., AND SHENOY, P. Blink: Managing Server Clusters on Inter-
mittent Power. In Proc. of the 16th Intl. Conf. on Architectural Support for Programming Languages
and Operating Systems (2011), ASPLOS XVI.
[141] SHIN, Y., AND CHOI, K. Power conscious fixed priority scheduling for hard real-time systems. In
Design Automation Conf. (1999).
[142] SPILIOPOULOS, V., KAXIRAS, S., AND KERAMIDAS, G. Green governors: A framework for Con-
tinuously Adaptive DVFS. In Green Computing Conf. and Workshops (IGCC), 2011 Intl. (2011).
[143] SRIKANTAIAH, S., KANDEMIR, M., AND WANG, Q. SHARP Control: Controlled Shared Cache
Management in Chip Multiprocessors. In Proc. of the 42Nd Annual IEEE/ACM International Sympo-
sium on Microarchitecture (New York, NY, 2009), MICRO 42, ACM.
[144] STANDARD PERFORMANCE EVALUATION CORPORATION. SPEC CPUTM
2006. http://www.
spec.org/cpu2006/.
[145] STANDARD PERFORMANCE EVALUATION CORPORATION. SPECweb2009. http://www.spec.
org/web2009/.
[146] TANAKA, S., AND KOZYRAKIS, C. High Performance Hardware-Accelerated Flash Key-Value Store.
In The 2014 Non-volatile Memories Workshop (NVMW) (2014).
[147] TANG, L., MARS, J., VACHHARAJANI, N., HUNDT, R., AND SOFFA, M. The impact of memory
subsystem resource sharing on datacenter applications. In Computer Architecture (ISCA), 2011 38th
Annual International Symposium on (June 2011).
[148] TEAM, G. C. P. P. New open source tools for measuring cloud per-
formance. http://googlecloudplatform.blogspot.com/2015/02/
new-open-source-tools-for-measuring-cloud-performance.html.
[149] THE APACHE SOFTWARE FOUNDATION. Apache Spark R© - Lightning-Fast Cluster Computing!
https://spark.apache.org/.
[150] THE APACHE SOFTWARE FOUNDATION. The Apache Cassandra Project. https://cassandra.
apache.org/.
[151] THE APACHE SOFTWARE FOUNDATION. Welcome to ApacheTM
Hadoop R©! https://hadoop.
apache.org/.

BIBLIOGRAPHY 135
[152] TOLIA, N., WANG, Z., MARWAH, M., BASH, C., RANGANATHAN, P., AND ZHU, X. Delivering
Energy Proportionality with Non Energy-Proportional Systems-Optimizing the Ensemble.
[153] VASAN, A., SIVASUBRAMANIAM, A., SHIMPI, V., SIVABALAN, T., AND SUBBIAH, R. Worth
their watts? - an empirical study of datacenter servers. In Intl. Symp. on High-Performance Computer
Architecture (2010).
[154] VASI, N., NOVAKOVI, D., MIUIN, S., KOSTI, D., AND BIANCHINI, R. DejaVu: accelerating re-
source allocation in virtualized environments. In Proc. of the seventeenth international conference on
Architectural Support for Programming Languages and Operating Systems (ASPLOS) (2012).
[155] VERMA, A., PEDROSA, L., KORUPOLU, M. R., OPPENHEIMER, D., TUNE, E., AND WILKES, J.
Large-scale cluster management at Google with Borg. In Proceedings of the European Conference on
Computer Systems (EuroSys) (Bordeaux, France, 2015).
[156] VINYALS, O., TOSHEV, A., BENGIO, S., AND ERHAN, D. Show and tell: A neural image caption
generator. arXiv preprint arXiv:1411.4555 (2014).
[157] WAKABAYASHI, D. Apple to Build Data Command Center in Arizona.
[158] WILSON, C., BALLANI, H., KARAGIANNIS, T., AND ROWTRON, A. Better Never Than Late: Meet-
ing Deadlines in Datacenter Networks. In Proc. of the ACM SIGCOMM 2011 Conference (New York,
NY, 2011), SIGCOMM ’11, ACM.
[159] WU, C.-J., AND MARTONOSI, M. A Comparison of Capacity Management Schemes for Shared CMP
Caches. In Proc. of the 7th Workshop on Duplicating, Deconstructing, and Debunking (2008), vol. 15,
Citeseer.
[160] WU, Q., MARTONOSI, M., CLARK, D., REDDI, V., CONNORS, D., WU, Y., LEE, J., AND BROOKS,
D. Dynamic-Compiler-Driven Control for Microprocessor Energy and Performance.
[161] XIE, Y., AND LOH, G. H. PIPP: Promotion/Insertion Pseudo-partitioning of Multi-core Shared
Caches. In Proc. of the 36th Annual International Symposium on Computer Architecture (New York,
NY, 2009), ISCA ’09, ACM.
[162] XIE, Y., AND O’HALLARON, D. Locality in Search Engine Queries and Its Implications for Caching.
In IEEE Infocom 2002 (2002).
[163] YANG, H., BRESLOW, A., MARS, J., AND TANG, L. Bubble-flux: Precise Online QoS Management
for Increased Utilization in Warehouse Scale Computers. In Proc. of the 40th Annual Intl. Symp. on
Computer Architecture (2013), ISCA ’13.

BIBLIOGRAPHY 136
[164] ZHANG, X., TUNE, E., HAGMANN, R., JNAGAL, R., GOKHALE, V., AND WILKES, J. CPI2: CPU
performance isolation for shared compute clusters. In Proc. of the 8th ACM European Conference on
Computer Systems (EuroSys) (2013).
[165] ZHANG, Y., LAURENZANO, M. A., MARS, J., AND TANG, L. SMiTe: Precise QoS Prediction on
Real-System SMT Processors to Improve Utilization in Warehouse Scale Computers. In International
Symposium on Microarchitecture (MICRO) (2014).