reconnaissance investigation of water quality, bottom sediment
TRANSCRIPT

RECONNAISSANCE INVESTIGATION OF WATER QUALITY,
BOTTOM SEDIMENT, AND BIOTA ASSOCIATED WITH
IRRIGATION DRAINAGE IN THE ANGOSTURA RECLAMATION
UNIT, SOUTHWESTERN SOUTH DAKOTA, 1988-89
By Earl A. Greene, U.S. Geological Survey,
Charles L. Sowards, U.S. Fish and Wildlife Service, and
Eugene W. Hansmann, U.S. Fish and Wildlife Service
U.S. GEOLOGICAL SURVEY
Water-Resources Investigations Report 90-4152
Prepared in cooperation with the
U.S. FISH AND WILDLIFE SERVICE, and the
U.S. BUREAU OF RECLAMATION
Rapid City, South Dakota 1990

U.S. DEPARTMENT OF THE INTERIOR
MANUEL LUJAN, JR., Secretary
U.S. GEOLOGICAL SURVEY
Dallas L. Peck, Director
For additional information write to:
Subdistrict Chief U.S. Geological Survey Rm. 237, 515 9th St. Rapid City, SD 57701
Copies of this report can be purchased from:
U.S. Geological Survey Books and Open-File Reports Federal Center, Bldg. 810 Box 25425 Denver, CO 80225-0425

CONTENTS
Page
Abstract ................................ 1Introduction .............................. 2
Background ............................. 2Purpose and. scope ......................... 3Acknowledgments .......................... 4
General description of study area .................... 4Location and history ........................ 4Land and water management ..................... 4Fish and wildlife use ....................... 6Climate .............................. 7Geology .............................. 7Soils and agriculture ....................... 10Hydrologic setting ......................... 10
Previous investigations ......................... 13Surface-water quality ....................... 13Ground-water quality ........................ 18Bottom sediment .......................... 20Existing biota data ........................ 20
Sample collection and analysis ..................... 20Sampling sites ........................... 23
Water and bottom sediment ................... 23Biota ............................. 28
Sampling design .......................... 28Sampling techniques and analytical methods ............. 29
Water ............................. 29Bottom sediment ........................ 30Biota ............................. 30
Results of analyses ........................... 31Water quality ........................... 31Bottom sediment .......................... 40Biota ............................... 43
Aluminum ........................... 46Fish ........................... 46Aquatic invertebrates and plants ............. 46Blackbird eggs ...................... 46
Arsenic ............................ 46Fish ........................... 46Aquatic invertebrates .................. 51Aquatic plants ...................... 51Blackbird eggs ...................... 51
Copper ............................ 51Selenium ........................... 51
Fish ........................... 51Aquatic invertebrates .................. 52Aquatic plants ...................... 52Blackbird eggs ...................... 52
Zinc ............................. 52Pesticides .......................... 52
Summary and conclusions ......................... 55Selected references ........................... 57Supplemental data ............................ 61
3.3.3.

ILLUSTRATIONS
Page
Figure 1. Map showing location of study area ............. 52. Map showing geology of the study area ........... 83. Schematic diagram showing storage, diversions, and movement
of water through the Angostura Reclamation Unit ...... 114. Hydrograph showing annual and long-term mean annual
discharge of the Cheyenne River at Edgemont, water years 1947-88 .................... 12
5. Hydrograph showing annual and long-term mean annualdischarge of Angostura Canal, 1955-88 ........... 14
6. Idealized diagram showing hydrogeology of irrigatedland in the Angostura Reclamation Unit ........... 15
7. Map showing location of sampling sites ........... 278. Map showing chemical quality of water and dissolved-solids
concentration at sample sites, 1988 ............ 349. Graph showing trace-element concentrations in surface
water of the study area, 1988 ............... 3610. Map showing distribution of maximum trace-element
concentrations in surface water for the study area, 1988 ...................... 37
11. Graph showing trace-element concentrations in the less than 62-micrometer and 2-millimeter fractions of bottom sediment for the study area, 1988 .......... 42
12. Map showing distribution of maximum trace-elementconcentrations in the less than 62-micrometer fractionof bottom sediment for the study area, 1988 ........ 44
13-17. Graphs showing:13. Aluminum concentrations in fish tissue from
sample sites, 1988 .................. 4714. Arsenic concentrations in fish tissue from
sample sites, 1988 .................. 5015. Copper concentrations in fish tissue from
sample sites, 1988 .................. 5016. Selenium concentrations in fish tissue from
sample sites, 1988 .................. 5317. Zinc concentrations in fish tissue from
sample sites, 1988 .................. 53
TABLES
Table 1. Geologic formations within the study area .......... 92. Summary of trace-element concentrations in 202 samples
of Pierre Shale and equivalent rocks ............ 93. Statistical summary of selected water-quality data
for the Cheyenne River below Angostura Dam (station 06401500), water years 1968-88 ........... 16
4. Statistical summary of selected water-quality datafor the Cheyenne River near Buffalo Gap (station 06402600),water years 1968-80 ..................... 17
5. Statistical summary of selected water-quality data for ground water from the Pierre Shale throughout the study area ....................... 18
6. Statistical summary of ground-water-quality data forthe Hot Springs 1° x 2° quadrangle ............. 19
7. Statistical summary of trace-element data in stream-bottomsediment for the Hot Springs 1° x 2° quadrangle ....... 21
iv

TABLES Cont inued
Page
Table 8. Concentrations of trace elements in fish tissue fromseveral locations along the Cheyenne River, 1985-86 ..... 22
9. Major ions, trace elements, and pesticides analyzed in water, bottom sediment, and biota for the Angostura Reclamation Unit ...................... 24
10. Sampling sites, types of constituents analyzed, and scheduleof sampling during 1988 for water and bottom sediment .... 25
11. Sampling sites, types of constituents analyzed, number of samples collected, and schedule of sampling during 1988 for the various types of biota ............... 26
12. Statistical summary of major ions and trace-element concentrations in surface water throughout the study area, 1988 ...................... 32
13. Comparison of major-ion and trace-element concentrations in surface water from the study area to national baseline values in water for United States rivers .......... 33
14. Water-quality criteria, standards, or recommended limits of selected trace elements for human consumption, protection of freshwater aquatic life, irrigation, and livestock watering ................... 38
15. Summary of pesticide concentration in water for thestudy area, 1988 ...................... 40
16. Comparison of trace-element concentrations in the less than 62-micrometer fraction of bottom sediment in the study area, 1988, and geochemical baselines for soils from the western United States ........................ 41
17. Median and range of aluminum, arsenic, copper, selenium, and zinc concentrations for all biota sampled in the study area, 1988. ...................... 45
18. Median and range of aluminum, arsenic, copper, selenium, and zinc concentrations in fish samples from four biological sampling sites in the Cheyenne River, 1988 .... 48
19. Aluminum, arsenic, copper, and zinc concentrations in aquatic plants, invertebrates, and blackbird eggs from individual biological sampling sites in the study area, 1988 ...... 49
20. Concentrations of selected pesticides in biota, 1988 .... 5421. Field measurements and results of laboratory analyses
of water samples from the Angostura Reclamation Unit study area, 1988 ...................... 62
22. Selected trace-element and pesticide concentrations in the less than 62-micrometer fraction of bottom sediment from the study area, 1988 .................. 68
23. Selected trace-element concentrations in the less than 2-millimeter fraction of bottom sediment from the study area, 1988 .................... 69
24. Field measurements and results of laboratory analyses of biological data from the Angostura Reclamation Unit study area, 1988 ...................... 70

CONVERSION FACTORS
For readers who may prefer to use metric (International System) units rather than inch-pound units, the conversion factors for the terms in this report are listed below:
Multiply inch-pound unit
acreacre-foot (acre-ft)cubic foot per second (ft 3 /s)foot (ft)mile (mi)inchsquare mile (mi2 )
By.
4,0471,233
0.0283170.30481.609
25.42.590
To obtain metric unit
square metercubic metercubic meter per secondmeterkilometermillimetersquare kilometer
Temperature can be converted to degrees Fahrenheit (°F) or degrees Celsius (°C) by the following equations:
°F = 9/5 (°C) + 32 °C = 5/9 (°F-32)
Sea level; In this report "sea level" refers to the National Geodetic Vertical Datum of 1929 (NGVD of 1929) a geodetic datum derived from a general adjustment of the first-order level nets of both the United States and Canada, formerly called Sea Level Datum of 1929.
Trace-element concentrations in bottom sediment and biota are reported as weight per unit of weight, or micrograms per gram (pg/g) and micrograms per kilogram (^tg/kg), which are units equivalent to parts per million (ppm) and parts per billion, respectively.
vo.

RECONNAISSANCE INVESTIGATION OF WATER QUALITY, BOTTOM SEDIMENT, AND
BIOTA ASSOCIATED WITH IRRIGATION DRAINAGE IN THE ANGOSTURA
RECLAMATION UNIT, SOUTHWESTERN SOUTH DAKOTA, 1988-89
By Earl A. Greene, U.S. Geological Survey, Charles L. Sowards, U.S. Fish and Wildlife Service, and
Eugene W. Hansmann, U.S. Fish and Wildlife Service
ABSTRACT
A study was conducted during 1988 within the Angostura Reclamation Unit and adjacent areas in southwestern South Dakota to determine the concentra tions of major ions, selected trace elements, and pesticides in water, bottom sediment, and biota, and to compare the analytical results to various guide lines for environmental protection and to available baseline information.
In general, water in the study area is a sodium sulfate type. Concen trations of major ions in water samples were relatively large and elevated in relation to national baseline values.
Concentrations of trace elements in water delivered to Angostura Reservoir appeared to be similar to irrigation drain water conveyed in return-flow drains, and in the Cheyenne River downstream of the irrigated lands. Arsenic concentrations were 4 /xg/L (micrograms per liter) or less at all sample sites. The maximum concentration of boron (650 /jg/L) was measured in Horsehead Creek, a background site. The maximum (16 /*g/L) and second highest (13 /jg/L) concentrations of selenium were measured in Cottonwood Creek, a background site. The maximum uranium concentration (44 /jg/L) was measured in Iron Draw, an irrigation return flow drain, and was substantially greater than at the other sampling sites. Pesticide concentrations in water were small at all sites and most were less than analytical reporting limits.
In general, the study showed that toxic levels of selenium or other trace elements and pesticides in water probably is not a persistent problem within the project area or downstream of irrigation return flows.
Trace-element concentrations in bottom sediment were very similar to the geochemical baselines for soils of the western United States. The maximum measured concentration of selenium (14.0 ^g/g (micrograms per gram)) was from Cottonwood Creek, which is a background site. Because the majority of trace- element concentrations were within baseline ranges, there probably is no significant accumulation of trace-element concentrations due to irrigation. Pesticide concentrations in all samples of bottom sediment were less than laboratory analytical reporting limits.
With few exceptions, concentrations of trace elements and pesticides in biota generally were less than values known to produce harmful effects on growth or reproduction. Maximum aluminum concentrations in fish (6,350 /xg/g dry weight), invertebrates (7,150 /xg/g dry weight), and plants (9,370 /xg/g dry weight) were quite large; however, because of the lack of information on the correlation between aluminum concentrations and biological effects, it is difficult to make inferences in regard to toxicity. Selenium concentrations in the majority of whole-body fish tissue samples were greater than the baseline values. Selenium concentrations in eight fish samples and two invertebrate samples were near or exceeded levels that could cause detrimental effects. Several other trace elements were present in biota at

concentrations that were potentially elevated in comparison to the general range of values among the sampling sites, but no site or organism consistently had unusually large concentrations. At all sites, pesticide concentrations in biota were small relative to available toxicity data.
INTRODUCTION
Background
During the last several years, there has been increasing concern about the quality of irrigation drainage and its potential harmful effects on human health, fish, and wildlife. Concentrations of selenium greater than water- quality criteria for the protection of aquatic life (U.S. Environmental Protection Agency, 1986a) have been detected in subsurface drainage from irrigated land in the western part of the San Joaquin Valley in California. In 1983, incidences of mortality, birth defects, and reproductive failures in waterfowl were discovered by the U.S. Fish and Wildlife Service at the Kesterson National Wildlife Refuge in the western San Joaquin Valley, where irrigation drainage was impounded. In addition, potentially toxic trace elements and pesticide residues have been detected in other areas in Western States that receive irrigation drainage.
Because of concerns expressed by the U.S. Congress, the U.S. Department of the Interior started a program in late 1985 to identify the nature and extent of irrigation-induced water-quality problems that might exist in the Western States. In October 1985, an interbureau group known as the "Task Group on Irrigation Drainage" was formed within the Department of the Interior. The task group subsequently prepared a comprehensive plan for reviewing irrigation-drainage concerns in areas for which the Department of the Interior has responsibility.
The Department of the Interior developed a management strategy and the Task Group prepared a comprehensive plan for reviewing irrigation-drainage concerns. Initially, the Task Group identified 19 locations in 13 states that warranted reconnaissance-level field investigations. These locations relate to three specific areas of Department of the Interior responsi bilities: (1) Irrigation or drainage facilities constructed or managed by the Department, (2) national wildlife refuges managed by the Department, and (3) other migratory-bird or endangered-species management areas that receive water from Department-funded projects.
Nine of the 19 locations were selected for reconnaissance investigations during 1986-87. The nine areas are:
Arizona-California: Lower Colorado-Gila River valley area California: Salton Sea area
Tulare Lake Bed area Montana: Sun River Reclamation Project area
Milk River Reclamation Project areaNevada: Stillwater Wildlife Management area Texas: Lower Rio Grande-Laguna Atascosa National Wildlife
Refuge areaUtah: Middle Green River basin area Wyoming: Kendrick Reclamation Project area

In 1988, reports for seven of the reconnaissance investigations were published. Reports for the remaining two areas were published in 1990. On the basis of results of the first nine reconnaissance investigations, four detailed studies were initiated in 1988 in the Salton Sea area, Stillwater Wildlife Management area, Middle Green River basin area, and the Kendrick Reclamation Project area. Eleven more reconnaissance investigations were initiated in 1988:
California: Sacramento Refuge ComplexCalifornia-Oregon: Klamath Basin Refuge ComplexColorado: Gunnison and Uncompahgre River basins, and
Sweitzer LakeColorado: Pine River ProjectColorado-Kansas: Middle Arkansas River basinIdaho: American Falls ReservoirNew Mexico: Middle Rio Grande Project and Bosque del Apache
National Wildlife RefugeOregon: Malheur National Wildlife RefugeSouth Dakota: Angostura Reclamation UnitSouth Dakota: Belle Fourche Reclamation ProjectWyoming: Riverton Reclamation Project
All studies are conducted by interbureau field teams composed of a scientist from the U.S. Geological Survey as team leader, with additional Geological Survey, U.S. Fish and Wildlife Service, and U.S. Bureau of Reclamation scientists representing several different disciplines. The investigations are directed toward determining whether irrigation drainage: (1) has caused or has the potential to cause significant harmful effects on human health, fish, and wildlife, or (2) may adversely affect the suitability of water for other beneficial uses.
Purpose and Scope
This report describes the results of a 2-year reconnaissance study to determine if potentially toxic constituents are present at concentrations sufficiently large to cause, or have the potential to cause, harmful effects on human health or on fish and wildlife within or immediately downstream from the Angostura Reclamation Unit. Concentrations of selected constituents were measured in water, bottom material, and biota; these concentrations were then compared to various standards, criteria, and to concentrations reported from other locations.
Whereas a reconnaissance study such as this may indicate whether potential contamination exists, it will not isolate the cause, source, or degree of contamination. The results of this study cannot support definitive conclusions about adverse effects, but rather can be used to assess the need for further investigations.
The study area included all of the irrigable lands within the irrigation unit. The return flows from the irrigable lands do not discharge to a wildlife refuge and are not a direct source of drinking water. Return flows drain to the Cheyenne River, which is a major drainage for western South Dakota and is a major tributary to Oahe Reservoir and the Missouri River water system.
Acknowledgments
The authors thank Bruce Laymon of the U.S. Bureau of Reclamation for helping gather data on the history, background, and land management of the study area.
This manuscript was reviewed by members of the Department of the Interior Task Group on Irrigation Drainage; many individuals of this group spent a large amount of time assisting in preparation of this document. Their assistance is greatly appreciated.
GENERAL DESCRIPTION OF STUDY AREA
Location and History
Angostura Reservoir, formed by the damming of the Cheyenne River, is located 9 mi southeast of Hot Springs, South Dakota. The Angostura Reclamation Unit lands, consisting of 12,200 acres, are located on alluvial terraces and upland soils along both sides of the Cheyenne River from the reservoir downstream for approximately 24 mi. The entire Unit lies within Fall River and Custer Counties of South Dakota. The study area includes the Unit lands ^nd surrounding vicinity as shown in figure 1.
The Angostura Reclamation Unit was authorized under the Water Conserva tion and Utilization Act of August 11, 1939, and was approved on March 6, 1941. The Unit was originally included in the Missouri River Basin Project, currently named the Pick-Sloan Missouri Basin Program.
Angostura Dam was constructed during 1946-49 and is a composite concrete gravity structure and an earth embankment. Irrigation water deliveries to the Unit lands began in 1956. A hydroelectric powerplant and switchyard with an installed capacity of 1,200 kilowatts was discontinued in 1960.
Land and Water Management
The Cheyenne River basin upstream from Angostura Dam has an area of approximately 9,100 mi 2 located in parts of three States southwestern South Dakota, northwestern Nebraska, and east-central Wyoming. Although the Cheyenne River receives some flows that originate in the southern Black Hills, it predominantly drains semi-arid plains. Average annual net inflow to Angostura Reservoir is about 80,000 acre-ft.
Angostura Reservoir has a capacity of 130,700 acre-ft at the top of its conservation pool, a surface elevation of 3,187.2 ft above sea level, and inundates an area of approximately 4,600 acres.
The 12,200 acres of irrigated land are supplied by releases from Angostura Reservoir into Angostura Canal, a 30-mi-long canal with a design capacity of 290 ft 3 /s. The canal extends from the reservoir along the south edge of the Unit and crosses the Cheyenne River through an inverted siphon to reach the north side of the river. Average annual releases to the Unit lands are approximately 40,000 acre-ft of water, which provide an average onsite farm delivery of 2.5 acre-ft per acre. Individual farms are served by 39 mi of laterals and a total of 34 mi of open and closed drains.

4S»
0 . '9°0 (do Kit
LOCATION MAP
MILES
KILOMETERS
EXPLANATION
APPROXIMATE BOUNDARY OF ANGOSTURA RECLAMATION UNIT LANDS
Figure 1. Location of study area.
5

Irrigation return flows drain to the Cheyenne River throughout the length of the project and are not reused for irrigation. Except for flood- control releases during the spring and early summer runoff periods, there are usually no releases to the Cheyenne River from Angostura Reservoir during the irrigation season, which usually is from May through September. Therefore, most of the flow in the 4.5-mi reach of the Cheyenne River between Angostura Dam and the confluence with Fall River (fig. 1) during the irrigation season is composed of normal operational seepage from the dam and leakage from the radial gates.
There is no specific use of storage from Angostura Reservoir or use of irrigation return flow for public water supplies. Many farms and ranches within and immediately downstream of the project area use artesian springs and wells, which are several hundred feet in depth, as sources of domestic water. However, large concentrations of sulfate and dissolved solids are present in most of these sources. Many households utilize small distilling units, and many of the remaining users import their drinking water from the nearby community of Hot Springs.
Fish and Wildlife Use
Prior to construction of the Angostura Dam, small numbers of mule and white-tailed deer were present in the project area. Upland game birds present in the area were pheasant, sharp-tailed grouse, and Hungarian partridge. Other upland game animals included cottontail rabbits, jack- rabbits, and fox squirrels. As many as 2,000 ducks, primarily blue-winged teal, mallards, widgeons, and scaup, wintered in the area. Occasionally geese were seen. Furbearers included beaver, a few muskrat, and raccoon. Badger, mink, and striped skunk were present in the area in small numbers. Fish in the Cheyenne River were primarily channel catfish with fewer walleye pike, goldeye, carp, buffalo, bullhead, and largemouth bass (U.S. Fish and Wildlife Service, 1946).
A report on fish and wildlife changes due to the Angostura Reclamation Unit was completed by the U.S. Fish and Wildlife Service in 1964. The report indicated an increase in the numbers of mule and white-tailed deer, pheasant, and all fur-bearing animals. Waterfowl use increased from a few thousand ducks before construction in 1946 to more than 8,000 ducks in 1964. The species of fish in the Cheyenne River and Angostura Reservoir in 1964 were crappie, walleye pike, largemouth bass, bullhead, yellow perch, green sunfish, and rainbow trout (U.S. Fish and Wildlife Service, 1964).
Non-game use of the Angostura Reclamation Unit has not been investigated by the U.S. Fish and Wildlife Service. There are 377 bird species recognized in South Dakota, with 308 species regularly sighted. Thirty-four of these bird species occur primarily in the western part of South Dakota (South Dakota Ornithologists Union, 1978).
The pine forest and spruce stands of the Black Hills are the home of one endemic subspecies, the white-winged form of the dark-eyed junco, and are the eastern-most breeding area of many Rocky Mountain species. Federally threatened and endangered species that could occur in the area are the piping plover, bald eagle, peregrine falcon, least tern, and the black-footed ferret. Other species include the golden eagle, swift fox, Swainson's hawk, ferruginous hawk, and long-billed curlew. A number of small mammals and reptiles are present in the area.

Climate
The climate of the study area is semiarid continental, characterized by wide temperature ranges, low relative humidity, frequent high winds, and small amounts of precipitation. The study area typically is characterized by cold, dry winters; cool, moist springs; warm, dry summers; and cool, dry autumns. Recurring periods of drought and near-drought conditions have been common.
Average annual precipitation measured at Oelrichs is 16.35 inches (1951-80). Most of the annual precipitation occurs as rain from April to July; May is the wettest month. Site-specific evaporation data are unavail able, but average annual free-water-surface evaporation is about 47 inches (U.S. Department of Commerce, 1982).
In general, conditions during the data-collection phase of the study (1988) were drier than normal. Precipitation at Oelrichs during 1988 was 14.43 inches. During the 1988 irrigation season (May through September), precipitation at Oelrichs was 11.87 inches.
Geolocrv
The study area is located in the Great Plains Region at the southern flank of the Black Hills uplift. The core of the uplift is composed of hard and erosion-resistant Precambrian igneous and metamorphic rocks along with Precambrian and Cenozoic intrusive rocks. Surrounding the Precambrian core are outcrops of Paleozoic strata, which are primarily bands of dipping limestones, interbedded sandstones, and shales.
A hogback ridge of Mesozoic strata composed of resistant sandstones form the outer rim of the uplift. The older sandstones and shales of the Mesozoic strata dip steeply into the surrounding plains, which are composed of younger Cretaceous marine shales that include the Pierre Shale (fig. 2). Geologic formations within each of the Eras (Precambrian, Paleozoic, Mesozoic, and Cenozoic) are shown in table 1. Younger outcrops of Cenozoic rocks are present in the plains. These Cenozoic formations are primarily of the White River Group.
The surficial deposits over the majority of the irrigated lands and vicinity are Late Cretaceous marine shales, mostly Pierre Shale, overlaid with small areas of alluvial deposits adjacent to the many streams. These alluvial deposits are located mainly along the flood plains of Cascade Creek, Fall River, Horsehead Creek, Beaver Creek, Cottonwood Creek, and the Cheyenne River (fig. 2).
The Pierre Shale is a thick, dark gray to black, fine-grained clayey rock with seams of bentonite and zones of limestone concretions. The Pierre Shale is a known source of selenium and other trace elements. Schultz and others (1980) studied the chemical composition of the Pierre Shale and equivalent rocks throughout the northern Great Plains Region. The maximum selenium concentration in 202 samples was 160 pg/g. The average concentra tion in 7 samples in Fall River County was 9 A*g/g. Chemical concentrations for the Pierre Shale are summarized in table 2. Weathering of the shale will form a thin, relatively infertile, light-brown soil (Keene, 1973). This soil is found throughout the study area and is the primary soil type that is irrigated on the Unit lands.

Geology modified from Ed DeWitt and others (1989); N.H. Darton (195!)
EXPLANATION
CENOZOIC ROCKS
MESOZOIC ROCKS
Pierre Shale (Cretaceous)
PALEOZOIC ROCKS
y'; PRECAMBRIAN ROCKS
APPROXIMATE BOUNDARY OF ANGOSTURA RECLAMATION UNIT LANDS
CONTACT
Figure 2. Geology of the study area.
8

Table 1. Geologic formations within the study area
Era
Cenozoic
Mesozoic
Paleozoic
Precambrian
Formation
White River Group
Fox Hills Sandstone Pierre Shale Niobrara Formation Carlile Shale Greenhorn Limestone Belle Fourche and Mowry Shales, undivided Skull Creek Shale and Inyan Kara Group, undivided Sundance Formation Spear fish Formation
Spearfish Formation Minnekahta Limestone and Opeche Shale/ undivided Minnelusa Sandstone Madison Limestone and Englewood Limestone Formation, undivided Deadwood Formation
Undif ferentiated igneous and metamorphic rocks
Table 2. Summary of trace-element concentrations in 202 samples of Pierre Shale and equivalent rocks
[Source of data: Data modified from Schultz and others, 1980.Values are total concentration, in micrograms per gram, determined
by chemical analysis except where noted; <, less than]
Element
ArsenicBoron 1CadmiumChromium 1CopperLeadMolybdenumSeleniumUraniumVanadiumZinc
Geometric mean
9.283
.546628201.4.74
4.513696
Minimum
1<20
<.3467
<1<.51.3
2527
Maximum
490410100
26015044
35016028
740380
Median
9.3100
.57129221.5
3.014096
1 Spectrographic analysis.

Soils and Agriculture
Soils in the study area are alluvial and aeolian in origin and are located in the "Chestnut Soils" zone of the Great Plains Region. Parent material and position with relation to the Cheyenne River cause a range of textures from heavy clay to fine sand. Sand and gravel usually are found from 4 to 10 ft below land surface.
The dominant soil series of the irrigable lands within the Unit are Ascalon fine sandy loam and Dailey fine sand. These soils are deep, well- drained to excessively drained, level to sloping, sandy and loamy soils on uplands. The soils on flood plains are Glenberg-Bankard or Lohmiller- Haverson loamy silty soils. These soils are deep, well to excessively drained on nearly level flood plains (Kalvels, 1982).
Most of the farms include both irrigated and nonirrigated lands. This integrated irrigation-dryland type farming operation includes dryland cattle grazing areas adjoining the irrigated land. Approximately 98 percent of the irrigated land is planted with corn and alfalfa. Other crops, on the remaining 2 percent of the irrigated land, include barley, oats, wheat, pasture, and silage. Fattened livestock also are produced in the Unit area. Gross crop value on Unit lands for 1988 was more than 2 million dollars.
Approximately 90 percent of the corn and 20 percent of the alfalfa is treated with a carbamate insecticide (carbofuran) . Atrazine is applied to about 25 percent and parathion to 20 percent of the corn crop annually.
Hydroloqic Setting
Principal hydrologic features of the Angostura Reclamation Unit are Angostura Darn, Angostura Reservoir, Angostura Canal, laterals and drains, the Cheyenne River, and tributaries. A schematic diagram of water movement through the Unit is shown in figure 3. Hydrologic and streamflow conditions during the data-collection phase of the study were not typical due to the drought conditions in western South Dakota during 1988. Streamflow in unregulated streams was less than normal, with many no-flow days in intermittent and ephemeral streams.
The Cheyenne River is the major inflow to Angostura Reservoir. Flow during 1988 for the Cheyenne River at Edgemont (station 06395000), which is upstream of the study area, was much less than average (fig. 4). Discharge at this site during 1988 was 8,720 acre-ft, compared to the long-term mean annual discharge of 68,540 acre-ft for water years 1929-32 and 1947-88.
Horsehead Creek is the second major source of inflow to the Angostura Reservoir. The 5-year mean annual discharge (water years 1984-88) for Horsehead Creek is 6,030 acre-ft. Streamflow was 99 acre-ft during water year 1988, with only 6 days of measurable flow from June 1 through September 30.
Cascade Creek, Fall River, Beaver Creek, and French Creek are the principal tributaries to the Cheyenne River in the study area. The source of these creeks are springs discharging from limestone outcrops (Paleozoic strata), usually in contact with a shale formation (fig. 2).
The source of Cascade Creek is Cascade Springs, the largest single spring in the Black Hills. Cascade Springs near Hot Springs, station 06400497, has a 10-year mean annual discharge of 14,710 acre-ft. Flow at station 06400497 during water year 1988 was 14,230 acre-ft.
10

Cottonwood Creek
French Creek
Beaver Creek
Fall River
Cascade Creek
Cheyenne
Angostura Dam
River
Angostura Reservoi r
DIRECTION OF FLOWRiver or stream
' - Canal f. _ Drain
Horsehead Creek
Figure 3. Schematic diagram showing storage, diversions, and movement of water through the Angostura Reclamation Unit.
11

AN
NU
AL
DIS
CH
AR
GE
, IN
T
HO
US
AN
DS
O
F
AC
RE
-FE
ET
c 0> *»
ft
»-
M
PJ
O.
3to
a
IM §§
ft »
O
PI ft
0> l<
PJ0>
3
PJ vO
PJ
»0
I-
1 vO I
O.
OJ
p-
to n
oP>
3-
3 PJ
a n (Q
M a
> wo 4^
0
^J
H»
I 00 ft
oo c
r
a> o zr (D
>< a> H-
<J a>
_ o
to
CJI o
o
orv>
o
o01
o
o
01 CJI o
I m m
01 o <0

The confluence of Fall River and the Cheyenne River is approximately 4.5 mi downstream from Angostura Dam. The source of Fall River is several large springs above and in the city of Hot Springs. The mean annual discharge for 51 years of record for Fall River at Hot Springs, station 06402000, is 17,820 acre-ft. Discharge of Fall River during water year 1988 was 15,470 acre-ft.
The confluence of Beaver Creek and the Cheyenne River is an additional 15.5 mi downstream from the confluence of Fall River (fig. 1). The mean annual discharge for 51 years of record for Beaver Creek near Buffalo Gap, station 06402500, is 5,140 acre-ft. Discharge of Beaver Creek during water year 1988 was 4,310 acre-ft.
The confluence of the Cheyenne River and French Creek is approximately 4.75 mi upstream from the northern edge of the study area and is downstream of all irrigation return flow. Mean annual discharge for 6 years of record (water years 1983-88) for French Creek above Fairburn, station 06403300, is 4,250 acre-ft. The discharge of French Creek during water year 1988 was 2,210 acre-ft.
Irrigation releases to Angostura Canal during the 1988 irrigation season (44,142 acre-ft) were larger than the 36-year average (39,824 acre-ft) (fig. 5).
The hydrogeology of the study area has been modified by irrigation farming. Flood irrigation is the most common method of irrigation, though a number of center-pivot irrigation systems have been installed. Surface-water return flow moves downgradient through the fields to surface drains, tribu taries, and the Cheyenne River. Unconsolidated gravels readily transmit downward-percolating excess irrigation water, along with leakage from unlined reaches of canals and laterals, to the top of the nearly impermeable Pierre Shale. The shallow ground water forms a near-surface water table due to this recharge and is a source of water for domestic use. The shallow ground water discharges through hillside seeps as ground-water return flow (fig. 6).
PREVIOUS INVESTIGATIONS
Collection of surface-water data and investigations that have been conducted previously in and near the study area provided background and supplemental data for the current study. A summary of the data and/or results from these studies are presented in the following sections.
Surface-Water Quality
Past water-quality data have been collected by the U.S. Geological Survey at two sites on the Cheyenne River within the study area. These sites are the Cheyenne River below Angostura Dam (station 06401500), located 800 ft downstream from the dam, and the Cheyenne River near Buffalo Gap (station 06402600), located 12 mi east of Buffalo Gap. A statistical summary of selected water-quality data is presented for the Cheyenne River below Angostura Dam in table 3, and for the Cheyenne River near Buffalo Gap in table 4.
13

AN
NU
AL
D
ISC
HA
RG
E,
IN
TH
OU
SA
ND
S
OF
A
CR
E-F
EE
T
_0
ro
oO
l O
en
Ooo O
I O
I
hh >
3
ft 3
3*
C
(D
to
o a
(D ft
H-
C
O
»-{
3
p> v
Q
O ft
Pt
0) i
M
D)VD
3
«J1
01
D)I
3CD
3
CD
C a H-
(D
O sr
D>
m
_7
) U
) ^i-<
o
m

Evaporation Transpiration
NOT TO SCALE
EXPLANATION
IRRIGATED CROPLAND
BENCH GRAVEL
ONFARM SUPPLY CANAL AND RIVER
CRETACEOUS SHALE (Pierre Shale and equivalent rocks)
ALLUVIUM
_i_ WATER TABLE
DIRECTION OF FLOW-- Irrigation water
DIRECTION OF IRRIGATION RETURN FLOW AND CANAL LEAKAGE
Figure 6. Idealized diagram showing hydrogeology of irrigated land in the Angostura Reclamation Unit.
15

Table 3. Statistical summary of selected water-quality data for the Cheyenne River below Anqostura Dam (station 06401500 ). water years 1968-88
[Source of data: U.S. Geological Survey WATSTORE retrieval for September1968 to September 1988. Major ions in milligrams per liter; trace
elements in micrograms per liter; °C, degrees Celsius; <, less than]
Property or constituent
Number Value or concentrationof
samples Minimum Maximum Median
Specific conductance 221 690 4,100 2,100 (microsiemens per centimeter at 25 °C)
pH (pH units) 152 7.3 8.5 8.0Dissolved solids, residue 46 1,530 1,880 1,715
on evaporation at 180 °C (milligrams per liter)
Major ions (dissolved)Calcium 158 130 300 210 Magnesium 158 36 95 70 Sodium 162 120 230 180 Potassium 158 1 17 10 Sulfate 162 540 1,200 900 Chloride 158 27 140 100 Fluoride 138 .3 6.0 .6 Silica 136 4 22 8
Trace elements (dissolved)Boron 157 20 860 160 Iron 16 <10 220 44 Manganese 16 <10 230 55
16

Table 4. Statistical summary of selected water-quality data for the Cheyenne River near Buffalo Gap ( station 06402600), water years 1968-80
[Source of data: U.S. Geological Survey WATSTORE retrieval for September1968 to September 1980. Major ions in milligrams per liter; trace
elements in micrograms per liter; °C, degrees Celsius; <, less than]
Property or constituent
Number of
samples
Value or concentration
Minimum Maximum Median
Specific conductance 181 1,560 3,650 2,260 (microsiemens per centimeter at 25 °C)
pH (pH units) 170 7.3 8.7 8.0Dissolved solids, residueon evaporation at 180 °C 54 1,120 1,950 1,805 (milligrams per liter)
Major ions (dissolved)Calcium 175 120 370 240 Magnesium 174 35 120 74 Sodium 180 130 300 200 Potassium 174 2 22 15 Sulfate 180 590 1,400 980 Chloride 175 1 160 110 Fluoride 147 .4 1 .6 Silica 147 4 17 10
Trace elements (dissolved)Boron 174 20 1,700 300 Iron 17 20 600 51 Manganese 17 <10 240 60
17

Ground-Water Quality
There are few previous ground-water studies and data-collection programs that characterize the ground-water quality of the shallow Quaternary alluvium and Cretaceous shales throughout the study area. Some ground-water samples have been collected by the U.S. Geological Survey in the study area. A statistical summary of data on the major ions and trace elements in samples from 19 wells completed in the Pierre Shale is presented in table 5. Sele nium concentrations in all 19 samples were less than 1 /ig/L (micrograms per liter).
Water-quality data were obtained from various lithologic units within the area of the Hot Springs 1° x 2° quadrangle in a study conducted by the U.S. Department of Energy (1979). A total of 340 ground-water samples was obtained: 78 samples were from alluvium; 95 samples were from the White River Group, Fox Hills Sandstone, and Pierre Shale; and the remainder of the samples were from deeper ground-water sources. A statistical summary of the data obtained from the study is presented in table 6.
Table 5. Statistical summary of selected water-quality data for ground water from the Pierre Shale throughout the study area
[Source of data: U.S. Geological Survey WATSTORE retrieval. Major ions in milligrams per liter, trace elements in micrograms per liter; CaCO3 , calcium carbonate; mg/L, milligrams per liter]
Property or constituent
Numberof
samples
Value or concentration
Minimum Maximum Median
Specific conductance 19 (microsiemens per centimeter at 25 "Celsius)
pH (pH units) 19Hardness, total as CaCO3 (mg/L) 19Major ions (dissolved)
Calcium 19Magnesium 19Sodium 19Sulfate 19Chloride 19Silica 19
Trace elements (total)Arsenic 19Aluminum 19Barium 19Boron 19Chromium 19Cobalt 19Copper 19Iron ., 19Manganese 19Molybdenum 19Nickel 19Selenium 19Silver 19Strontium 19Uranium 19Zinc 19
300
6.610
311
15101
<100 20
<2 2
4 4
<1 2
280 13
4,450
7.72,200
420310500
1,70020014
50900
1,80024107440
640158
<1 5
9,600 70 57
2,410
7.3650
17055
190550169
<100 620
<22
30
4 4
<1 2
2,900 50 20
18
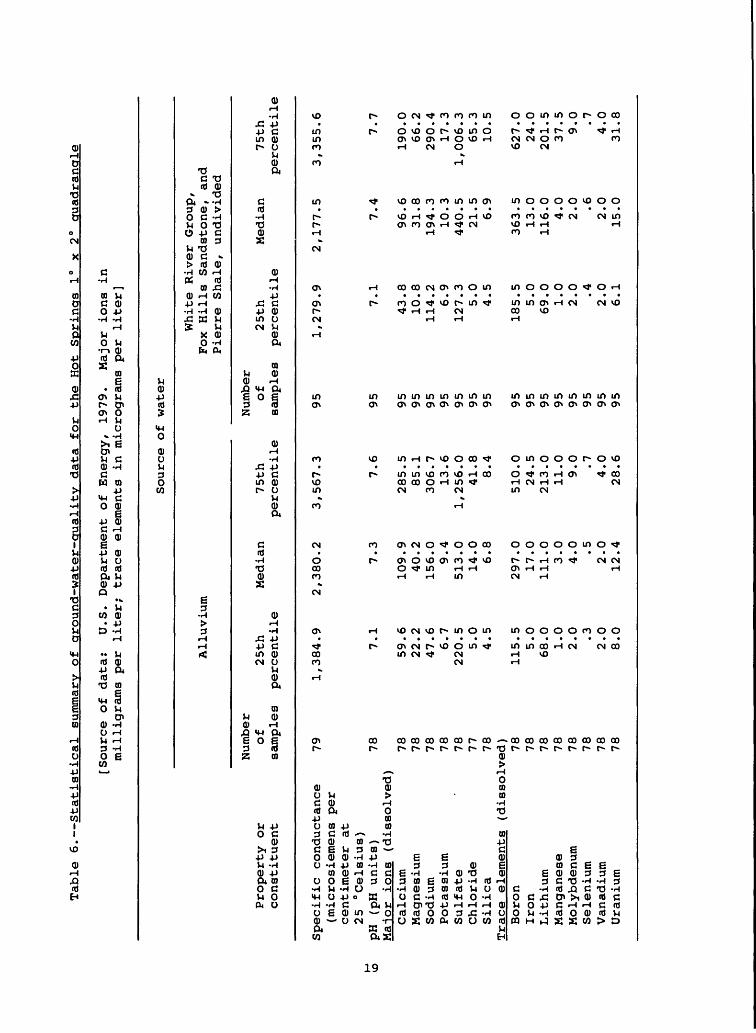
Table 6. Statistical summary of qround-water-gualitv data fo
r the Ho
t Springs 1° x
2° quadrangle
[Source of
da
ta:
U.S. Department of Energy,
1979.
Major io
ns in
milligrams per li
ter;
trace elements in
micrograms per li
ter]
Source of
water
Property or
constituent
Alluvium
Number
of
25th
samples
percentile
Median
75th
percentile
White River Gr
oup,
Fox Hills Sandstone, and
Pierre Shale, undivided
Number
of
25th
samples
percentile
Median
75th
percentile
Specific conductance
79
(microsiemens per
centimeter at
25 "Celsius)
pH (pH
units)
78Major ions (dissolved)
Calcium
78
Magnesium
78
Sodium
78
Potassium
78
Sulfate
' 78
Chloride
77
Silica
78Trace elements (dissolved)
Boron
78
Iron
78
Lithium
78
Manganese
78
Molybdenum
78
Selenium
78
Vanadium
78
Uranium
78
1,384.9
7.1
59.6
22.2
47.6
6.7
220.5
5.0
4.5
115.5
5.0
68.0
1.0
2.0 .3
2.0
8.0
2,380.2
7.3
3,567.3
7.6
109.9
40.2
156.0
9.4
51
3.0
14.0
6.8
29
7.0
17.0
11
1.0
3.0
4.0 .5
2.0
12
.4
285.5
85.1
30
6.7
13.6
1,2
56
.04
1.8
8.4
51
0.0
24.5
21
3.0
11.0
9.0 .7
4.0
28
.6
95 95 95 95 95 95 95 95 95 95 95 95 95 95 95 95 95
1,279.9
7.1
43.8
10.8
114.2
6.9
127.3
5.0
4.5
185.5
5.0
69.0
1.0
2.0 .4
2.0
6.1
2,177.5
7.4
363.5
13.0
116.0
4.0
2.0 .6
2.0
15.0
3,355.6
7.7
96
.63
1.8
194.3
10
.3440.5
21
.56
.9
190.0
66
.2290.4
17
.31,0
06.3
65.3
10.5
627.0
24.0
201.5
37.5
9.0 .7
4.0
31.8

Bottom Sediment
Previous data on trace-element concentrations in stream-bottom sediment are few for much of the study area. The U.S. Department of Energy (1979) collected stream sediment derived from the various lithologic units within the area of the Hot Springs 1° x 2° quadrangle. A total of 349 bottom- sediment samples were obtained: 79 samples were from the White River Group and alluvium, 119 samples from the Fox Hills Sandstone and Pierre Shale, 16 samples from the Niobrara Formation and Carlile Formation, and the remainder of samples from other geologic units. A statistical summary of geochemical data from the U.S. Department of Energy (1979) study for stream- bottom sediment is presented in table 7.
Existing Biota Data
No previous data are available for chemical analysis of waterfowl tissue, algae, or vascular plants from the study area. The U.S. Fish and Wildlife Service has analyzed a limited number of fish tissue from several locations in the Cheyenne River in the study area (table 8).
Seven fish tissue samples were collected in August 1985 and October 1986 (table 8) from the Cheyenne River near Edgemont, which is upstream of the irrigated land (fig. 1). Selenium dry-weight concentrations ranged from 2.0 to 4.1 /ig/g for the seven samples.
Selenium dry-weight concentrations in fish tissue from several locations in the Cheyenne River downstream of Angostura Dam and the irrigated land had levels of selenium ranging from 4.0 to 20 /ig/g. All of these samples exceed the National Contaminant Biomonitoring Program 85th-percentile baseline value of 2.8 /ig/g dry weight. The greatest dry-weight concentration of selenium in fish tissue (20 /ig/g) was from a location approximately three-fourths of a mile downstream from Angostura Dam. Water in this reach of the Cheyenne River is composed primarily of seepage from the dam and leakage from the radial gates. Three of eight fish tissue samples from the same location had selenium concentrations equal to or greater than 13 /ig/g (table 8), which may interfere with fish reproduction (Lemly and Smith, 1987).
Nine of 20 samples of fish tissue had copper concentrations that exceeded the National Contaminant Biomonitoring Program 85th-percentile baseline value of 3.67 /ig/g dry weight. The greatest dry-weight concentration of copper (21 /ig/g) was from a location three-fourths of a mile downstream from Angostura Dam.
There have been no reported fish or wildlife dieoffs, failures in avian reproduction, or avian embryo deformities in the study area that can be directly attributed to selenium or other trace elements.
SAMPLE COLLECTION AND ANALYSIS
The objective of the sample collection and analysis was to determine if there are elevated concentrations of potentially toxic constituents associated with irrigation drainage and whether they may occur in the water, bottom sediment, or biota in the Angostura Reclamation Unit or adjacent areas. Efforts were made to obtain samples at a sufficient number of locations to characterize the environmental conditions of the study area. The sample locations were selected to identify any problem areas where constituent concentrations exceeded established standards and/or criteria, or natural background (baseline) concentrations.
20

Table
7. Statistical summary of trace-element
data in stre
am-b
otto
m sediment
for
the
[Source
of data:
U.S.
Depa
rtme
nt of
Hot
Sprincrs 1° x
2° ouadranale
Energy,
1979.
Tota
l co
ncen
trat
ion,
in
micrograms pe
r gram]
Sour
ce of
stream-bottom
Alluvium an
dWh
ite
River
Grou
p, un
divi
ded
Element
Arsenic
Chromium
Molybdenum
Selenium
Zinc
Number
of
samp
les
79 79 79 79 79
25th
Median
per-
centile
3.0
3.8
23.0
29.0
2.0
2.0
.5
.7
45.0
63.0
75th
per-
centile
6.3
42.3 4.0 .9
82.3
Fox
Hills
Sandstone
sedi
ment
and
Pierre Shale, undivided
Numb
erof
samples
119
119
119
119
119
25th
Median
per
ce
nt ile
4.4
5.7
40.0
46.5
2.0
2.0
.8
.9
81.0
93.0
75th
per-
centile
7.9
55.0 4.0
1.2
107.3
Niob
rara
Formation
and
Carlile
Shale, undivided
Number
of
samp
les
16 16 16 16 16
25th
Median
per-
centile
3.8
6.8
43.0
57
.0
4.0
8.0
1.0
1.8
75.0
10
0.0
75th
per-
centile
11.7
64.0
11.0 3.5
143.
0

Table 8.--Concentrations of trace elements in fish tissue from several locations along the Cheyenne River. 1985-86
[Analyses by U.S. Fish and Wildlife Service. Concentrations in micrograms per gram dry weight;<, less than; , no data. Analyses performed by inductively coupled plasma-emission
spectroscopy (ICP), no preconcentration unless otherwise noted]
Site name
Cheyenne Riverat Edgemont
Cheyenne River3/4 miledownstream ofAngostura Dam
Cheyenne Rivernear Oral
Taxa
Fathead chubFlathead chub ,Channel catfishCarp composite Flathead chubPlains killifish. composite River carpsucker
Channel catfishShorthead redhorseSmallmouth bassBlack bullhead}Black bullhead 1Carp lGreen sunfish compositeWhite sucker
Carp*Carp ,Florthead redhorse.Shorthead redhorse.Shorthead redhorse
Collection date
08-03-8508-03-8510-03-8610-03-86
1 10-03-861 10-03-86
10-03-86
08-30-8508-30-8508-30-8509-04-8609-04-8609-04-8609-04-8609-04-86
09-04-8609-04-8609-04-8609-04-8609-04-86
Alumi- 2 Beryl- num Arsenic lium
<0.21 93
199 289
3,070 1,200
--
14250
31975
137
621171827
.21
.80 <0.07
.80 <.07
.80 <.07
.80 .15
.80 .09
.22
.20
.21
.80
.80
.80
.80
.80
.80
.80
.80
.80
.07
.07
.07
.07
.07
.07
.07
.07
.0760 .80 .07
Cadmium
<0.21<.21.11.16.13.17 .13
<.22<.24<.21.14.07.17.11.13
.35
.32
.13
.15
.13
Cobalt
16.028.0
::
15.651.88.6-- -- --
-- ""
Copper
2.82.81.98.9 6.87.3 2.8
4.43.02.52.23.82.63.4
21
5.74.65.52.43.4
Site name
Cheyenne Riverat Edgemont
Cheyenne River3/4 miledownstream ofAngostura Dam
Cheyenne Rivernear Oral
Collectiondate
08-03-8508-03-8510-03-8610-03-8610-03-8610-03-8610-03-86
08-30-8508-30-8508-30-8509-04-8609-04-8609-04-8609-04-8609-04-86
09-04-8609-04-8609-04-8609-04-8609-04-86
*ICP preconcentration B,This element was scanned
Iron
7677142163160
1,520638
21812210018213439895
156
4213296374
118
ratherusing
Lead
<0.42<.41<.50<.50<.50.69
<.50
<.45<.81<.43<.50<.50<.50<.50<.50
<.50<.50.78
<.50.79
than ICP,
Manganese
__
32148.0
8249
--
2011351438
2523404053
Mer-2 Molyb-cury denum
0.19 <0.23 <.30.15
<_ i<. l«-l
.26 <
.11 <
.22 <<. 1.17.15.1.2
.1
.1
.2
.1
.1
no preconcentration
4241 ---- --
454043 ---- --
-- -- --
, was
Nickel
<0.25<.25.54.62.65
2.71.4
.36<.28<.26.79.25
2.4.34
2.2
1.2.45.65.37.88
Selesnium
3.14.12.02.53.02.23.0
4.920174.54.2
137.26.6
7.17.44.44.64.0
performed for
Thallium
<2<2<5<5<5<5<5
<2<2<2<5<5<5<5<5
<5<5<5<5<5
this sample
Vanadium
<0.17.21 ---- --
.40
.36
.43 ----
-- --
Zinc
13812070
108988062
8777568490
17010468
242126574656
atomic absorption methods.
22

A number of samples were analyzed for potentially toxic constituents to address the possible effects of irrigation drainage on human health, wildlife, and associated water uses. The constituents analyzed were major ions, trace elements, and pesticides. A standard list of major ions and trace elements was designated by the Department of the Interior Task Group on Irrigation Drainage for consistency among all irrigation drainage studies. The pesticides analyzed in water, bottom sediment, and biota varied among study areas and were selected based upon the common types of agricultural chemicals used on the irrigated lands. Major ions, trace elements, and pesticides analyzed in the water, bottom sediment, and biota are listed in table 9.
The objective of the biota sampling was to determine and compare the concentrations of elements and pesticides in several life forms upstream and downstream of the project area. Fish samples represented the larger trophic levels of the aquatic food chain, whereas aquatic plant and aquatic inverte brate samples represented the smaller trophic levels of the aquatic food chain. Bird eggs were collected to determine the concentrations in terrestrial animals associated with the aquatic environment.
Samples of aquatic plants and invertebrates were collected from the same sites as the fish samples to provide comparisons among the sites. Samples also were obtained from miscellaneous locations that were influenced by irrigation return flow. Timing of sample collection generally was for mid summer periods after the rapid spring growth and exposure to irrigation return flow water.
Sampling Sites
Sampling sites, types of constituents analyzed at each site, number of samples collected (biota), and a schedule of sample-collection times are listed in table 10 for water and bottom sediment and table 11 for biota. Sampling sites were chosen to provide information for a diverse range of hydrologic, physical, and chemical conditions within the study area. Six biological sampling sites were located on or near the Cheyenne River to identify the presence of potentially elevated constituent concentrations in the biological community of the study area. The location of sampling sites within the study area is shown in figure 7.
Water and Bottom Sediment
The two major inflows to Angostura Reservoir, the Cheyenne River and Horsehead Creek, were sampled. The Cheyenne River near Hot Springs (site 2) served as a background site upstream of the Unit to determine water quality entering the reservoir. Horsehead Creek at Oelrichs (site 3) and Cottonwood Creek near Buffalo Gap (site 13) served as background sites to determine the influence that underlying geology has on water quality of the Unit.
Angostura Reservoir (site 4) was sampled in the deeper section for water-quality characteristics and near the delta of the Cheyenne River for bottom sediment. The reservoir stores all of the water for the Unit and is used extensively for fishing and recreation.
Angostura Canal near Hot Springs (site 6) was sampled because it is the outflow from Angostura Reservoir that conveys the irrigation water to the Unit lands. Fall River at the mouth near Hot Springs (site 7) is a major tributary to the Cheyenne River and contributes the majority of discharge in the Cheyenne River within the study area during most of the year.
23

Table 9. Manor io
ns,
trace
elements,
and
pesticides analyzed in
water.
bottom se
dime
nt,
and
Water
(dissolved concentration)
Major
ions
Alkalinity
(bic
ar
bonate
plus ca
rbo
nate
)Calcium
Chloride
Magnesium
Nitrogen
Potassium
Sodium
Dissolved
solids
Sulfate
Trac
eelements
Arsenic
Boro
nCa
dmiu
mChromium
Copper
Lead
Mercury
Molybdenum
Selenium
Uranium
Vanadium
Zinc
Pesticides
1-Na
ptho
l3-Hydroxy-
carbofuran
Alachlor
Aldicarb
Aldicarb
sulfone
Aldicarb
su If ox
ide
Ametryne
Atrazine
Carbaryl
Carbofuran
Cyanazine
Met homy 1
Metribuzin
Metolachlor
Oxamyl
Prometone
Prometryne
Prop
azin
ePropham
Sevin
Sima
zine
Sime
tryn
eTr
if lur
alin
biota
for
the An
cros
tura
Reclamation Un
it
Bott
om sediment
(tot
al concentration)
Trace
Pesticides
elements
Arsenic
Atrazine
Boron
Carbofuran
Cadmium
Chromium
Copp
erLe
adMercury
Molybdenum
Selenium
Uranium
Vanadium
Zinc
Biota
(tot
al co
ncen
trat
ion)
Elements
Aluminum
Ant im
ony
Arse
nic
Barium
Beryllium
Boro
nCadmium
Cobalt
Chromium
Copp
erIr
onLead
Magnesium
Manganese
Mercury
Molybdenum
Nickel
Selenium
Silver
Strontium
Thallium
Tin
Vanadium
Zinc
Pest
icid
es
Aldrin
Chlordane
Diel
drin
Endr
inHeptachlor
epoxide
Hexachloro-
benzene
Lindane
Mirex
cis-Non-
achlor
trans-
Nona
chlo
rOx
ychl
odan
ePC
BTo
xaph
ene
o,p'-DDT
p,p'
-DDT
o , p ' -DDE
p,p'-DDE
o,p'-DDD
p,p'-DDD
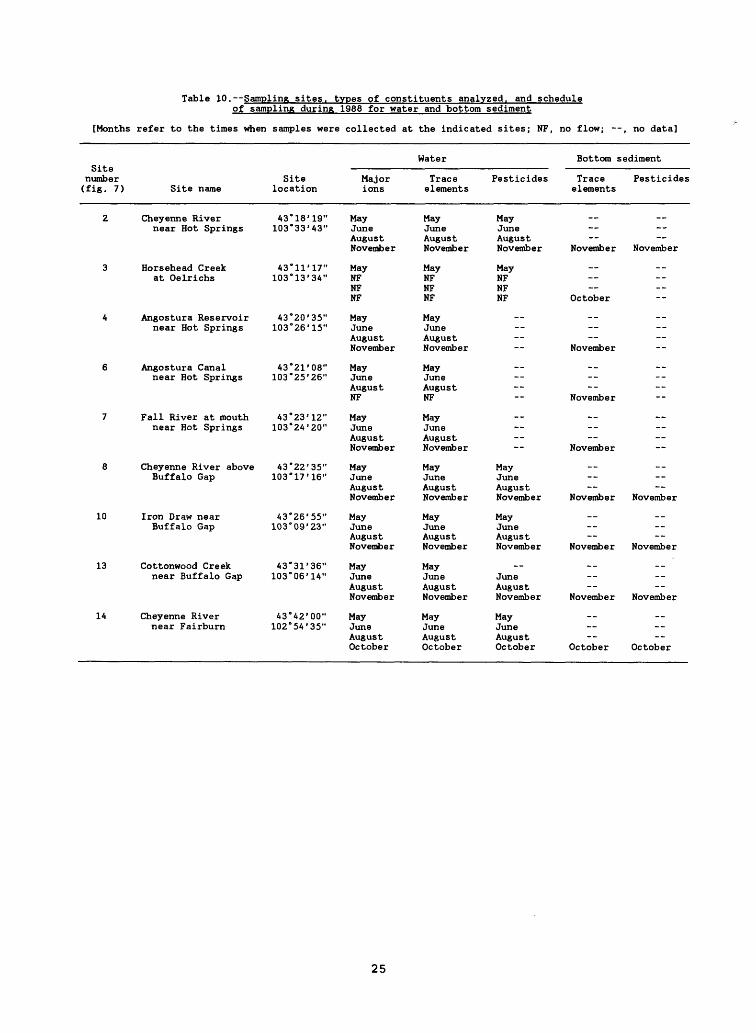
Table 10. Sampling sites, types of constituents analyzed, and scheduleof sampling during 1988 for water and bottom sediment
[Months
Site number (fig. 7)
2
3
4
6
7
8
10
13
14
refer to the times when
Site name
Cheyenne River near Hot Springs
Horsehead Creek at Oelrichs
Angostura Reservoir near Hot Springs
Angostura Canal near Hot Springs
Fall River at mouth near Hot Springs
Cheyenne River above Buffalo Gap
Iron Draw near Buffalo Gap
Cottonwood Creek near Buffalo Gap
Cheyenne River near Fairburn
samples were
Site location
43*18' 19" 103°33'43"
43*11'17" 103°13'34"
43*20'35" 103*26' 15"
43°21'08" 103*25'26"
43*23' 12" 103°24'20"
43*22' 35" 103°17'16"
43*26' 55" 103°09'23"
43*31'36" 103*06' 14"
43°42'00" 102°54'35"
collected
Major ions
May June August November
MayNF NF NF
May June August November
May June August NF
May June August November
May June August November
May June August November
May June August November
May June August October
at the indicated
Water
Trace elements
May June August November
May NF NF NF
May June August November
May June August NF
May June August November
May June August November
May June August November
May June August November
May June August October
sites; NF,
Pesticides
May June August November
May NF NF NF
May June August November
May June August November
June August November
May June August October
no flow; -
Bottom
Trace elements
November
October
November
November
November
November
November
November
October
-, no data]
sediment
Pesticides
November
November
November
November
October
25

Tabl
e 11. Sampling sites, types
of constituents analyzed,
number of
sa
mple
s co
llec
ted.
ro
and
sche
dule
of samolina
durincr
1988
fo
r th
e various tv
oes
of biota
[E,
elem
ents
; P, pesticides as gi
ven
in ta
ble
Site
number
Site
na
me(f
ig.
7)
1 Ch
eyen
ne River
near Edgemont
5 Ch
eyen
ne River
0.75 mile down
stream of
Angostura Dam
9 Ta
pesk
as Po
nd
11
Kimmies
Pond
12
Chey
enne
River
near
Custer County
656
brid
ge
14
Chey
enne
River
near
Fa
irbu
rn
Totals
o i
-t-o
oj.uc
location
43°18'20"
103°
49 '1
4"
43°21'21
ft103°25'26"
43°26'57"
103°
10 '0
0"
43°30'03"
103°05'28"
43°30'12"
103°
04 '2
0"
43°42'00"
102°54'35"
Blac
kbir
deggs
1
E P
April
July
September
July
September
June
4July
June
4
1July
April
July
September
April
July
September
8 1
8; ,
no sa
mple
]
Numb
er of
samples
collected
Fish
2 In
vert
ebra
tes
3
E P
E
10 10
9
1
__
__
__1
27
11
26 17
21
27
3
126
6 6
Vascular
plants
4
E __ 2 1 1
__1
1
2
8
1Bir
d eggs Composite samples
remo
ved
from
the
nests
of red-winged blackbirds.
2Fish Individual whole-body composites of available sm
all
fish species.
3Invertebrates Composites of free-swimming
water-column or bottom-dwelling aquatic
inse
cts.
4Vascular plants Composite of tubers,
leaves,
and
seed he
ads
from
aquatic
plants.

S 03°30!
PALL RIVER COUNTY
EXPLANATIONSAMPLING SITES Number indicates
site number
Surface-water quality
Bottom - sediment
Biota
Figure 7. Location of sample sites.
27

The Cheyenne River above Buffalo Gap (site 8) receives irrigation return flows from upstream irrigation. Iron Draw near Buffalo Gap (site 10) is a drain in which virtually all flow is due to surface-water and ground-water irrigation return flows.
The Cheyenne River near Fairburn (site 14) is downstream of the Angostura Reclamation Unit. This site was selected because it receives the composite of natural flow plus irrigation drainage from all irrigable land of the Unit.
Biota
The Cheyenne River near Edgemont (site 1) served as a background site upstream of the Unit lands to provide data on biota unaffected by irrigation drainage. Previous sampling of fish tissue had indicated elevated levels of selenium in the Cheyenne River below Angostura Dam; therefore, the Cheyenne River 0.75 mi downstream of Angostura Dam (site 5) was selected as a sampling site. The Cheyenne River at the Custer County 656 bridge (site 12) was selected because it receives additional irrigation drainage from the inter vening lands downstream from site 5. The Cheyenne River near Pairburn (site 14), downstream of the Unit, was selected to compare spatial variability of constituent concentrations between biota within and downstream of the Angostura Reclamation Unit. This site also was sampled for water quality and bottom sediment.
Biological samples also were collected at Tapeskas Pond (site 9) and Kimmies Pond (site 11) because of their proximity to the Cheyenne River. Both of these sites are directly influenced by irrigation return water. Blackbird eggs, macroinvertebrates, and vascular plants were collected for analysis.
Sampling Design
Water samples were collected to coincide with the various stages of irrigation diversion, with the application of agricultural chemicals, and with the life-cycle changes in biological activity. Samples were collected in early May when natural flows were expected to be at a maximum due to snowmelt runoff and spring rains, irrigation return flows were at a minimum, and precrop pesticides had been applied.
Water samples were collected in June after crops were established and initial irrigation water had moved downgradient through surface- and ground- water return flow. In August, water samples were collected when irrigation diversion had reached a maximum and irrigation return flow comprised the largest proportion of instream discharge. Sites were sampled at this time to identify any changes in water-quality due to late-season irrigation contributions.
Water and bottom sediment were sampled in late October and November after irrigation diversion had ended and during the time of maximum ground- water return flow. This also coincided with low flow in the streams, and the expected time of maximum trace-element concentrations in water and bottom sediment.
Biological samples of whole fish were the primary tissue analyzed to investigate possible bioaccumulation of trace elements or pesticides in biota. Fish may accumulate chemical elements, nutrients, and synthetic organic compounds through oral ingestion, dermal contact, or through respiration across gill membrane. The bioconcentration factor in fish, accumulating elements or synthetic organic chemicals through the gill
28

membrane, may result in a tissue concentration 100,000 times larger than concentrations in water. This is especially true of the chlorinated hydrocarbons and the polychlorinated biphenyls (PCBs), which often are incorporated into the lipid tissues.
Fish were collected at the same sampling sites during spring (April) and autumn (September) to compare seasonal concentrations of elements and pesti cides in whole body tissue. Blackbird eggs, invertebrates, and aquatic plants generally were collected at the same sites as fish during the summer (June and July) when growth rates, water temperature, and exposure to irriga tion drainage would be at a maximum. This also was the time when red-winged blackbirds were laying eggs and rearing young. A total of 155 samples were collected and submitted for laboratory analysis. Analysis of the various samples varied, but if there was adequate tissue, samples were analyzed for arsenic, boron, copper, selenium, and zinc. In addition, one or more types of inductively coupled plasma-emission spectroscopy (ICP) scans were conducted for additional elements.
Pesticide analysis of biological samples included organochlorine pesticides and polychlorinated biphenyls. Three fish samples from the spring collection, three fish samples from the autumn collection, and one sample of red-winged blackbird eggs from the summer collection were analyzed for pesticider.
Sampling Techniques and Analytical Methods
Water
Water samples for chemical quality were collected according to techniques recommended by the U.S. Geological Survey (1977). In flowing streams and canals, the water sample was a composite of depth-integrated subsamples collected in several vertical sections across the width of the stream. Samples collected from the reservoir were a composite sample obtained by subsampling each of the stratified layers of the reservoir.
Air temperature, water temperature, pH, field alkalinity, specific conductance, dissolved oxygen, and discharge were measured in flowing streams and canals. Temperature profile, depth of stratified layers, composite pH, field alkalinity, specific conductance, and dissolved oxygen were measured for the reservoir site.
Samples for analysis of dissolved major ions and trace elements were filtered through a 0.45-/zm (micrometer) filter to remove suspended materials and isolate the dissolved fraction. Pesticide samples were unfiltered. Sample treatment and preservation were conducted by field personnel according to the requirements of the U.S. Geological Survey (1986). Analysis of major ions, trace elements, and pesticides were performed by the U.S. Geological Survey Water Quality Laboratory in Arvada, Colorado, according to methods described in Fishman and Friedman (1985) for inorganic constituents, and Wershaw and others (1987) for pesticides. In addition to the normal quality- assurance practices of the U.S. Geological Survey for the chemical analysis of water (Friedman and Erdmann, 1982), replicates, splits, and field blanks were processed for major ion and trace-element analysis. Overall, the replicates, splits, and field-blanks data indicated that there was no inadvertent gross contamination of the water samples from the field procedures or laboratory analytical procedures.
29

Bottom Sediment
Samples of bottom sediment were collected at nine sites within the study area. Samples were collected from streams and canals using a stainless- steel, Teflon 1 -coated scoop. At least nine evenly spaced subsamples from the upper 2 to 4 inches of sediment were collected along each cross section. These subsamples were composited and mixed into a single sample, from which 300 g (grams) were submitted for trace-element analysis and 200 g for organic analysis.
Bottom sediment from site 4 (Angostura Reservoir) was sampled by obtaining 5 equal-volume subsamples. These subsamples were composited into a single sample and treated similar to the stream and canal samples.
Total concentration of trace elements, and organic content were determined by a geochemistry laboratory of the U.S. Geological Survey in Lakewood, Colorado. The samples were submitted to the laboratory where they were air dried and sieved through screens with a 2-mm (millimeter) opening. The samples were then split, and one split passed through a 62-/zm sieve. Both fractions (greater than 62 /zm (micrometers) and less than 62 /zm) were analyzed for trace elements and organic carbon content. Most elements were analyzed by inductively coupled argon-plasma atomic emission spectrometry (ICP) following complete mineral digestion with strong acids. Arsenic and selenium were determined by hydride generation atomic absorption, mercury by flameless cold-vapor atomic absorption, boron from hot-water extract, and uranium by ultra-violet fluoresence (Severson and others, 1987). Pesticide analyses of bottom material were conducted by the University Hygienic Laboratory of the University of Iowa, Iowa City, Iowa, using standard U.S. Environmental Protection Agency analytical methods (1986b).
Biota
Biota samples were collected using standard equipment and techniques (U.S. Fish and Wildlife Service, 1985a). Blackbird eggs were collected from individual nests and placed in jars cleaned to U.S. Fish and Wildlife specifications to preserve the integrity of the sample (U.S. Fish and Wildlife Service, 1985a) . All samples were held on ice until they could be transported to a refrigerator or freezer for storage. Samples were shipped to the laboratory for analysis in insulated boxes packed with dry ice.
Fish were collected using electrofishing equipment. Invertebrates were collected with a Surber square foot bottom sampler, sweep net, or kicknet, and then sorted in petri dishes with distilled water and stored in chemically clean jars. Aquatic plants were pulled by hand to assure sampling of stems and roots. Plants were collected in the river channel or near the bank adjacent to the fish-collection sites.
Fish and plant samples were washed in water from which they were collected. Samples submitted for inorganic chemical analysis were double wrapped in plastic wrap or plastic bags. Samples analyzed for pesticides were double wrapped in aluminum foil and then wrapped in plastic bags. Samples to be analyzed by the laboratory were shipped in insulated boxes packed with dry ice.
of the trade name Teflon in this report is for identification purposes only and does not constitute endorsement by the U.S. Geological Survey.
30

All biota samples were analyzed by the University of Missouri Environmental Trace Substances Research Center and the Mississippi State Chemical Laboratory according to analytical methods approved by the U.S. Fish and Wildlife Service's Patuxent Analytical Control Facility in Laurel, Maryland (U.S. Fish and Wildlife Service, 1985b). Trace-element analysis was done by ICP after a preconcentration treatment. Hydride-generation atomic- absorption spectroscopy was used for determination of arsenic and selenium levels in tissues. A cold-vapor reduction method was used for mercury. Quality-control procedures, including duplicate-sample analysis, spiked- reference samples, and procedural blanks, were conducted on all groups of biological samples according to quality-control standards established by the Patuxent Analytical Control Facility.
RESULTS OF ANALYSES
The data obtained from the reconnaissance investigation were used to evaluate the significance of constituent concentrations measured in water, bottom sediment, and biota. Data were compared to existing guidelines that consist of locally enforceable "standards" or recommended "criteria" for environmental protection, and baseline values where standards or criteria are not available. Baseline values represent the available data on background values for the environmental conditions in question and were used as the basis fur indicating elevated concentrations of measured constituents. In some instances, comparison of measured constituent concentrations to the guidelines was not appropriate, and comparison of data among sites within the study area was the most meaningful method of determining elevated constituent concentrations.
Water Quality
Analytical results for water samples collected during the study are shown in table 21 in the Supplemental data section at the back of the report. A statistical summary of major ion and trace-element concentrations in surface water throughout the study area is presented in table 12. Major-ion concentrations in water in the study area were relatively large; calcium, magnesium, sodium, sulfate, and chloride concentrations were larger than the national baseline values (table 13). Sulfate generally exceeded the U.S. Environmental Protection Agency (1976) water-quality criterion of 250 mg/L (milligrams per liter) for domestic water supplies. Chloride did not exceed the U.S. Environmental Protection Agency (1976) water-quality criterion (250 mg/L) at any site.
In general, water in the study area was a sodium sulfate type. Chemical quality of water from samples collected during 1988 throughout the study area is illustrated in figure 8. The water was a calcium sulfate type at site 2, and a calcium bicarbonate type at site 7. The source of water at these two sites is springflow, probably originating from Paleozoic limestones. The chemical quality of water flowing over alluvium and the Pierre Shale (sites 3, 6, 8, 10, 13, and 14) was a sodium sulfate type.
Average dissolved-solids concentration was the largest in the Cheyenne River upstream of irrigation (site 2) and smallest in Fall River (site 7). Except for Fall River, which had an average dissolved-solids concentration of 952 mg/L, water in the study area generally had an average dissolved-solids concentration of greater than 1,000 mg/L (fig. 8). Concentrations of dissolved solids of 1,000 to 2,000 mg/L in irrigation water can adversely affect many crops (National Technical Advisory Committee to the Secretary of the Interior, 1968).
31

Table 12. Statistical summary of major ions and trace-element concentrations in surface water throughout the study area, 1988
[Major ions in milligrams per liter; trace elements in micrograms per liter]
Constituent
Major ions CalciumMagnesium SodiumPotassiumBicarbonate plus
carbonate (HCO3 +CO3 ) Sulfate Chloride
Trace elementsArsenicBoronCadmiumChromiumCopper LeadMercury Molybdenum SeleniumUraniumVanadiumZinc
Number of samples
3232 323232
32 32
3232323232 3232 32 32323232
Dissolved concentration
Minimum
9723 67
<.l159
390 42
<1180<1<1
<5
^3.9
<1<3
Maximum
530100 51028
439
1,900 170
4650
54
11 11
16 16446
76
Median
25079
25010
206
1,200 130
1255<121
<5
7 39.92
10
1 Reported value is suspected to be inaccurate; next highest concentration measured was 0.7 micrograms per liter.
32

Table 13. Comparison of malor-ion and trace-element concentration^ in surface water from the study area to national baseline values in water for United States rivers
[Source of data: Modified from Smith and others, 1987. Trace elements in micrograms per liter, major ions in milligrams per liter]
Water-quality property National baseline Median value or constituent values from study
Major ionsCalcium 66.8 250 Magnesium 21.7 79 Sodium 68.9 250 Bicarbonate plus carbonate 2 161.8 206
(HCO3 +CO3 )Sulfate as SO4 116.9 1,200 Chloride 53.3 130
Trace elementsArsenic 3 1 Cadmium <2 <1 Chromium 10 2 Lead 6 <5 Mercury .3 <.1 Selenium 1 3 Zinc 21 10
*The National Stream Quality Accounting Network and the National Water Quality Surveillance System have provided information on the Nation's water quality since 1973. Smith and others (1987) used data from these two nationwide sampling networks to provide long-term water-quality trends (national baseline values) of major United States rivers. The national baseline value for each water-quality property or constituent is equal to the 75th station-mean concentration percentile.
2Reported as alkalinity (CaCO3 ).
33

2180 Red Sh,r» A
from U.S. Geo
EXPLANATIONSURFACE-WATER-QUALITY SAMPLING SITE~Number
indicates site number
WATER-ANALYSIS PATTERN Number indicates average dissolved solids in milligrams per liter. Concentrations, in milliequivalents per liter, are plotted for sodium plus potassium (NA + K), calcium (Ca), magnesium (Mg), chloride (Cl), bicarbonate plus carbonate (HC03 + CO.,), anc* sulfate (SO,). The anions are plotted to the right of the centerline, and the cations are plotted to the left. The area of the water- analysis pattern is an indication of the dissolved-solids concentration. The larger the area of the pattern, the greater the concentration of dissolved solids
2817
20 0 20 MILLIEQUIVALLENTS PER LITER
40
Figure 8. Chemical quality of water and dissolved-solids concentration at sample sites, 1988.
34

The distribution of selected trace-element concentrations (fig. 9) show most were distributed near the analytical reporting limit, with the exception of molybdenum, selenium, and uranium. Uranium and zinc had the widest range of sample concentrations.
Concentrations of water-quality constituents from previous surface-water data (tables 3 and 4), which represented wet and dry years, are similar to concentrations of constituents that existed during 1988 (table 12), a water- deficient year. Comparisons of trace-element concentrations measured during the study showed the median selenium concentration was slightly larger than the national baseline value (table 13).
Overall, there appeared to be little difference between the concentration of trace elements in Cheyenne River water (site 2) delivered to the Angostura Reservoir, irrigation drainage conveyed in return flow drains (site 10), and the Cheyenne River downstream of the Unit lands (site 14). This similarity may indicate that irrigation return water consists largely of excess surface runoff from irrigation and shallow ground-water return flow moving downgradient through the alluvium. Except for a few instances, trace- element concentrations measured at sites 2, 10, and 14 were similar. The median value of molybdenum (14 /ig/L) was slightly greater in water entering the study area (site 2) than at all other sites. The median values of uranium (14 /ig/L) and zinc (20 A*g/L) were slightly greater in water leaving the study area (site 14) than measured in the water entering the study area at site 2 (uranium = 7.1 /ig/L, zinc = 10 /ig/L). The median boron concentration of 480 /ig/L in water sampled from a background site (site 13) was greater than the boron concentration of 215 /ig/L in water entering the study area (site 2) and the boron concentration of 320 /ig/L in water leaving the study area (site 14).
Concentrations of trace elements in Angostura Reservoir (site 4) were not substantially different from Cheyenne River water upstream (site 2). Concentrations of copper, mercury, and zinc decreased slightly during August and November from the early-season maximum values (table 21).
Comparisons of maximum trace-element concentrations in water among sites are illustrated in figure 10 to indicate spatial variability and elevated concentrations of individual constituents. Arsenic concentrations were rela tively small at all the sample sites; the maximum concentration of arsenic (4 /ig/L) was measured in Fall River (site 7).
Maximum concentrations of boron were greater in background site 3 (650 /ig/L) and site 13 (560 /ig/L) than at all the other sites (table 21), possibly because Horsehead Creek (site 3) and Cottonwood Creek (site 13) flow over Pierre Shale for most of their course.
The maximum concentration of selenium (16 /ig/L) was greater at Cottonwood Creek (site 13), a background site, than at other sites (fig. 10). The second largest concentration of selenium (13 /*g/L) also was measured at this site (table 21). The next largest selenium concentration (6 A*g/L, table 21) was measured in the irrigation return drain, Iron Draw (site 10).
The maximum uranium concentration was 44 /ig/L in Iron Draw (site 10, fig. 10), an irrigation return flow drain, and was substantially greater than the other sites. The second largest concentration of uranium (38 /ig/L) also was measured at this site. Two other sites, Cottonwood Creek (site 13) and Cheyenne River near Fairburn (site 14), had uranium concentrations slightly elevated in comparison to other sites.
35

COUNTY
couUT yCu=llPb=ll
Zn=l50
Cd=5
EXPLANATIONSURFACE-WATER QUALITY SAMPING SITE--
Number indicates site number
TRACE ELEMENT Number indicates concentration in micrograms per liter
As, Arsenic
B, Boron
Cd, Cadmium
Cr, Chromium
Cu, Copper
Hg, Mercury
Mo, Molybdenum
Pb, Lead
Se, Selenium
U, Uranium
V, Vanadium
Zn, Zinc
Figure 10. Distribution of maximum trace-element concentrations in surface water for the study area, 1988.
37

The quality of water in the shallow alluvium within the area of the Hot Springs quadrangle (table 6) generally was similar to that from the Angostura Canal (site 6), and to the Cheyenne River water downstream of the reservoir (sites 8 and 14). Irrigation water from the canal is a source of recharge to the alluvial aquifer (fig. 6), which in turn discharges to the Cheyenne River. Differences in shallow alluvial water and canal water included a larger pH and chloride concentration in the canal water. The statistical summary for the alluvium within the area of the Hot Springs quadrangle (table 6) indicates that median concentrations of boron and uranium are similar to those in the canal, but 75th-percentile values are notably larger than canal values. This may indicate the occurrence of isolated areas of elevated boron and uranium concentrations of water in the alluvium.
Water in the Pierre Shale (tables 5 and 6) generally is similar to surface-water samples at the Horsehead Creek (site 3) and Cottonwood Creek (site 13) background sites, which flow over the Pierre Shale for most of their course. Ground water from the Pierre Shale probably reaches these streams from seepage. The major difference between the ground and surface water is the elevated concentrations of selenium in Cottonwood Creek compared to the water in the Pierre Shale or the water in Horsehead Creek.
There are only minor seasonal differences for most constituent concen trations between the May, June, August, and November samples. Generally, the seasonal maximums appear to be randomly distributed (table 21). However, maximum concentrations of uranium and selenium occurred in November.
Table 14. Water-quality criteria, standards, or recommended limitsof selected trace elements for human consumption, protection of
freshwater aquatic life, irrigation, and livestock watering
[All concentrations are from U.S. Environmental ProtectionAgency (1986a). Concentrations are in micrograms per liter;
, no criteria or standard available]
Maximum criteria or standards for water use
Constituent
ArsenicBoronCadmiumChromiumCopperLeadMercurySeleniumUraniumZinc
Human consumption
50 1050
5 1,000502
106 35
5 5, 000
Aquatic life 1
3 850 3.9
4 1618822.4
20
120
Irrigation2
10075010
100200
5,000 20
2,000
Livestock watering2
2005,000
501,000
5001001050
25,000
1 Specific criteria for the protection of freshwater aquatic life are based on acute criteria and a water hardness of 100 milligrams per liter.
2 Recommended limits (National Academy of Sciences-National Academy of Engineering, 1973).
O "
5 Secondary Maximum Contaminant Level (SMCL).6 Suggested No Adverse Response Level (SNARL), National Academy of Sciences (1983) .
38

Individual trace-element concentrations were compared to criteria, standards, or recommended limits to identify water-quality conditions that could impair beneficial uses of water. The water-quality criteria, standards, or recommended limits are listed in table 14. Only minor exceedances of criteria, standards, or recommended limits occurred in the study area during 1988. Concentrations were not particularly large at any one site. No constituent at any one site exceeded water-quality criteria or standards during all four sample periods. Median t r ace-e lement concentrations of all data for all sites (table 12) were less than the water- quality criteria or standards.
The cadmium acute criterion for freshwater aquatic life (3.9 /*g/L) was exceeded in Fall River (site 7), a background site, and in the Cheyenne River at site 8, which receives irrigation return flow (table 21). These exceedances occurred during the November sample period when all irrigation releases had been discontinued, and ground-water return flow was presumably at a maximum.
One mercury concentration (5.3 /*g/L on June 21, 1988, at site 8) exceeded the mercury acute criterion for protection of freshwater aquatic life (2.4 /ig/L). This reported value for mercury is suspected to be inaccurate and may be the result of sample contamination or laboratory analytical error.
Except for the Cheyenne River upstream of the Unit lands (site 2) and for Horsehead Creek (site 3), mercury concentrations exceeded the chronic mercury criterion (0.012 /*g/L, U.S. Environmental Protection Agency, 1986b) for protection of freshwater aquatic life in at least one sample from all sampling sites (table 21). This may be of concern because of the fishery and recreational use of Angostura Reservoir and the Cheyenne River. However, because most of the samples had mercury concentrations less than the analytical reporting limit and most exceedances were at or only slightly greater than the reporting limit, the mercury data may be inconclusive.
Selenium concentrations (13 and 16 /*g/L) exceeded the drinking water standards in two samples (May and November) in Cottonwood Creek (site 13), a background site. Water from this site is not used for human consumption. The U.S. Environmental Protection Agency (1988) has set a Federal selenium criterion for the protection of freshwater aquatic life of: (1) A 4-day average concentration not to exceed 5 /*g/L more than once every 3 years, or (2) a 1-hour average concentration not to exceed 20 /*g/L more than once every 3 years. For this investigation, 6 of 34 water samples, including spikes and replicates, equalled or exceeded 5 /*g/L, and no water samples exceeded 20 /ig/L (table 21) .
The Suggested No Adverse Response Level for uranium of 35 /*g/L for drinking water was exceeded in two samples (38 and 44 /*g/L) collected in May and November in Iron Draw (site 10), an irrigation return flow drain. Water from this site is not used for human consumption, and the significance of this uranium concentration to aquatic life is unknown.
Pesticide concentrations in water were small at all sites and most were less than analytical reporting limits (table 15). None of the concentrations measured during the study exceeded available pesticide water-quality criteria or standards. The largest concentration of a pesticide was Prometone (1.0 /ig/L) measured in the Cheyenne River at site 8, midway through the Unit lands.
39

Table 15. Summary of pesticide concentrations in water for the study area, 1988
[Units in micrograms per liter; <, less than]
Analytical Number of samplingreporting sites at which Maximum
Pesticide limit pesticides were detected concentration
Carbamate insecticides3-Hydroxycarbofuran <0.5 0 <0.5Aldicarb <.5 0 <.5Aldicarb sulfone <.5 0 <.5Aldicarb sulfoxide <.5 0 <.5Carbaryl <.5 0 <.5Carbofuran <.5 0 <.5Oxamyl <.5 0 <.5Propham <.5 0 <.5Sevin <.5 0 <.5
Triazine herbicidesAlachlor <.l - 0 <.lAmetryne <. 1 0 <. 1Atrazine <.l 4 .2Cyanazine <.l 2 .1Metribuzin <.l 0 <.lMetolachlor <.l 1 .1Prometone <.1 2 1.0Prometryne <.l 0 <.lPropazine <.l 0 <.lSimazine <.l 2 .3Simetryne <.l 0 <.l
Other1-Naphthol <.5 0 <.5Methomyl <.5 0 <.5Trifluralin <.l 0 <.l
Bottom Sediment
Trace elements may enter surface water from a variety of natural and human-related sources. Relation of water composition to source-rock type is complex, and is dependent on a number of factors. Some of these factors include water temperature and pH, biological activity, human activities, and solubility of individual constituents. The analyses of trace-element concen trations in bottom sediment for this study were used to indicate whether concentrations were elevated in comparison to background levels in soils.
Specific criteria or standards currently do not exist for assessing the toxic potential of trace-element concentrations in bottom sediment. However, background levels in the Unit lands and throughout the study area are assumed to be represented by geochemical baselines for soils of the western United States (R.C. Severson, U.S. Geological Survey, written commun., 1987; based on information in Shacklette and Boerngen, 1984). Although not specific to the study area, these baselines are one way of comparing study results to ambient conditions in the western United States. Analytical results from the bottom-sediment samples obtained during 1988 were compared to these baselines to determine possible elevated concentrations of trace elements in bottom sediment.
40

Analytical results of selected trace elements in the less than 62-pm and 2-mm fractions of bottom sediment from the study area are presented in tables 22 and 23 (Supplemental data at the back of the report). The distribution of selected trace-element concentrations in bottom sediment is illustrated in figure 11. The majority of trace-element concentrations were grouped fairly close to the median. Chromium, vanadium, and zinc had the widest range of concentrations among the data.
The smaller grain-size fractions usually contain the majority of trace- element concentrations (Horowitz, 1985). Concentrations of individual trace elements measured from the two size fractions were similar. The maximum concentrations of trace elements at each sample location generally were measured in the less than 62-/*m fraction. Arsenic, barium, chromium, lead, and mercury had maximum concentrations greater in the less than 2-mm size fraction than in the less than 62-/jm size fraction.
Trace-element concentrations in bottom sediment were very similar to the geochemical baselines for soils of the western United States (table 16). Some selenium concentrations were greater than the upper limit of the baseline range. Because the majority of trace-element concentrations were within baseline ranges, there probably is no significant accumulation of trace-element concentrations due to irrigation.
When comparing median trace-element concentrations of stream-bottom sediment from this study to data from the U.S. Department of Energy (1979) study (table 7), similar concentrations of elements are noted. Trace-element concentrations of bottom sediment derived from Fox Hills Sandstone and Pierre Shale surface exposures (table 7) were similar to values measured for this study.
Table 16. Comparison of trace-element concentrations in the less than 62-micrometer fraction of bottom sediment in the study area, 1988, and qeochemical baselines for soils from the western United States
[Total concentration, in micrograms per gram. <, less than; , no data]
Bottom sediment Western soils 1
Element
ArsenicBoronCadmiumChromiumCopperLeadMercuryMolybdenumSeleniumUraniumVanadiumZinc
Median
8.62.1
<2572118
.04<21.02.1
11090
Range
6.2-15.01.2-7.3<2-220-858-28
12-55<0. 02-0. 04
<2-40.6-14.01.9-5.331-20039-140
Geometric mean
5.523
412117
.046
.85
.232.5
7055
Baseline range 2
1.2-225.8-91
8.5-2004.9-905.2-55
0.0085-0.250.18-4.00.039-1.4
1.2-5.318-27017-180
1 Modified from Shacklette and Boerngen, 1984.2Range in which 95 percent of sample concentrations are expected to occur.
41

crUJa.
£.£.\J
210
200
190
180
170
160
150
140
130
120
100
90
80
70
60
50
40
30
20
10
n
_8 TOTAL SAMPLES0 SAMPLES EQUAL TO OR LESS THAN THE
REPORTING LIMIT
MAXIMUM .-U 75TH PERCENTILE
MEDIAN
-j- 25TH PERCENTILE
MINIMUM
-
As, Arsenic Pb, Lead
B, Boron Se, Selenium
Cr, Chromium U, Uranium
Cu, Copper V, Vanadium
Mo, Molybdenum Zn, Zinc
_
18 0 0
18 0
-1- o-
180
" i8 r*ii a i ' i
M
4
3r >
-
18.
"o" "-H _ UL
-AT 1 i| '
* fi * * -*- c:
/ > 18 <
0
=« &
0o
-
-
_
-
-
-
-r-
O
>
As Cr Cu Pb Mo
TRACE ELEMENTS
Se Zn
Figure 11. Trace-element concentrations in the less than 62-micrometer and 2-millimeter fractions of bottom sediment for the study area, 1988.
42
The maximum trace-element concentrations of bottom sediment among sites are shown in figure 12. The occurrence of the majority of maximum trace- element concentrations are in the background stream Cottonwood Creek (site 13) and the Cheyenne River, midway through the irrigated area (site 8).
Selenium concentrations in bottom sediment at all sites generally were at the upper end of the baseline range. The maximum selenium concentration in bottom sediment of 14 /ig/g (table 22) at site 13, a background site, was 10 times the upper end of the baseline range in soils (table 16). This relatively large concentration of selenium in bottom sediment at site 13 correlates with the highest concentrations of selenium in water that also were measured at this site.
Pesticides carbofuran and atrazine were analyzed in bottom sediment at sites 2, 8, 10, 13, and 14 (table 22). All samples of bottom sediment for pesticide concentrations had values less than the laboratory analytical reporting limit of 0.1 mg/kg (milligrams per kilogram).
Biota
Very few precise or universal guidelines have been established for concentrations of elements or pesticides that can cause physiological harm in birds, fish, aquatic plants, or aquatic invertebrates. Tolerance for element and pesticide concentrations may vary among species as well as within the same species in different localities. Because of the complexity and variability of biological responses in natural systems to chemical concentrations in biota, no single or universal guidelines have been established to explain how an organism will respond to potentially toxic concentrations of chemicals in various aquatic habitats.
The U.S. Fish and Wildlife Service has been involved in the National Contaminant Biomonitoring Program (NCBP), formerly part of the National Pesticide Monitoring Program, since 1967. The Fish and Wildlife Service periodically analyzes residues of selected organocholorine contaminants and potentially toxic trace elements in samples of fish and wildlife collected from a nationwide network of stations (Lowe and others, 1985).
The National Contaminant Biomonitoring Program 85th-percentile values of trace-element concentrations in fish tissue are used in this study and other irrigation drainage reconnaissance studies as national baseline values (Hoffman and others, 1990; Setmire and others, 1990; and Radtke and others, 1988). The data from this study were compared to these baselines. Even if concentrations were elevated in relation to these baseline values, this does not necessarily mean detrimental biological effects will result.
Discussions of elements and pesticides sampled in biota are limited to those considered to be associated with irrigation drainage. Analytical results of biological samples collected during the current study are presented in table 24 (Supplemental data).
The following discussions of elements are limited to aluminum, arsenic, copper, selenium, and zinc because of their toxicity to fish and wildlife, the potential for these elements to occur at elevated concentrations compared to baseline values, and the large concentrations of elements at the sample sites. For each of these elements, residue found in specific taxa (fish, aquatic invertebrates, aquatic plants, and blackbird eggs) are discussed. When available, literature is cited to help explain the potential effects of the element concentrations on the biological organism or on the relation to other organisms in the aquatic system. The median and range of aluminum, arsenic, copper, selenium, and zinc concentrations in fish, invertebrates, plants, and blackbird eggs are presented in table 17.
43

As = l5.0 8=7.3
Cu=28 Hg=0.04 Se=l4.0
= 5.3 Zn = l40
Cd=2 Cu = 28
= 0.04 Mo =
= 200
Mo=4
EXPLANATIONBOTTOM-SEDIMENT SAMPLING SITE--
Number indicates site number
TRACF ELEMENT Number indicates concentration in micrograms per liter
As, Arsenic
B, Boron
Cd, Cadmium
Cr, Chromium
Cu, Copper Hg, Mercury
Mo, Molybdenum
Pb, Lead
Se, Selenium U, Uranium
V, Vanadium Zn, Zinc
Figure 12. Distribution of maximum trace-element concentrations in the less than 62-micrometer fraction of bottom sediment for the study area, 1988.
44

yu
80
70
orUli-3 eoorUla. to
i 5°o or o
z40z"
o1-
ori-
§ 30z o o
20
10
f\
32 TOTAL SAMPLES26 SAMPLES EQUAL TO OR LESS THAN THE
ANALYTICAL REPORTING LIMIT
MAXIMUM1 TCTLJ r»rOA%rklTII C" * fOln rtrXUtlM 1 1 Lt
MEDIAN
ORTLJ DCDOC°KIT 1 1 C1 i ' cD 1 M rtKOtlMIILt
MINIMUM
3 1 (
As, Arsenic Pb, Lead
Cd, Cadmium Se, Selenium
Cr, Chromium U, Uranium
Cu, Copper V, Vanadium
Mo, Molybdenum Zn, Zinc 32 0 < k
32 32 3 3 f
32 32 _ 26 29
3232 || 32 U26 a IIT T T fl J_L _L i _L i <?
r
- 32 L
2 9 >
As Cd Cr Cu Pb Mo
TRACE ELEMENTS
Se 2r\
Figure 9. Trace-element concentrations in surface water of the study area, 1988.
36

Table 17. Median and range of aluminum, ar
seni
c, copper,
sele
nium
, and zinc
concentrations fo
r al
l biota sampled in
the study area,
1988
[Concentrations in micrograms per gram (d
ry weight); ,
no da
ta;
N =,
number of
samples; <, le
ss than]
Element
Aluminum
Arsenic
Copper
Selenium
Zinc
Fish
N =
126
Median:
200
Range:
4.9
- 6,350
Median:
0.2
Range:
<0.1 -
2.3
Median:
2.7
Range:
0.94
-
16.1
Median:
4 Range:
2.1
- 13
Median:
97
Rang
e:
45.2 -
401
Invertebrates
N =
6
1,815
100
- 7,150
1.4
0.5 -
2.7
18
5.8 -
25
3.7
2.8 -
5.8
121
92.7 -
224
Plants
N =
8
2,140
61 -
9,370
1.3
0.1
- 7.
3
6.9
1.8
- 9.
1
0.33
<0.1 -
2.9
29
9.5
- 37
Blackbird eggs
N =
4
4.0
<3.0 -
9.9
0.1
<0.1 -
0.2
2.2
1.0
- 2.8
*2.4
1.5
- 3.
0
57
36 -
64.7
= 8.

Aluminum
Fish
The concentration of aluminum in fish samples throughout the study area ranged from 4.9 to 6,350 Aig/g dry weight (table 17). The median (50th- percentile) concentration of aluminum for all fish samples from sites 1, 5, 12, and 14 was 200 /jg/g. The maximum concentration of 6,350 /jg/g (table 24) was from a sample near Edgemont (site 1).
The median aluminum concentration of fish sampled upstream of the Angostura Reservoir (at site 1 near Edgemont) was larger than samples obtained downstream of the reservoir at sites 5, 12, and 14 (fig. 13). Median aluminum concentrations in fish samples collected in April decreased downstream from site 1 (352 /*g/g) to site 12 (156 Aig/g) to site 14 (73 Aig/g) (table 18 and fig. 13). Median concentrations were less during September than during April at site 1 and greater during September than during April at sites 12 and 14 (fig. 13).
Aquatic invertebrates and plants
Median aluminum concentrations for all invertebrates and plants collected at sites 1, 5, 9, 11, 12, and 14 were 1,815 /ig/g for invertebrate samples and 2,140 /jg/g for plant samples (table 17). The largest aluminum concentrations for inverteorates (7,150 Atg/g) and plants (9,370 Atg/g) were from site 12. The second largest concentration of aluminum sampled in plants (9,250 /*g/g) was from site 5, which is 0.75 mi downstream of Angostura Dam. The large aluminum concentrations for plants at sites 5 and 12 and invertebrates at site 12 were substantially larger than aluminum concentrations in biota at the other biological sampling sites (table 19).
Blackbird eggs
The aluminum concentrations in blackbird eggs collected at Tapeskas Pond (site 9) and Kimmies Pond (site 11) were relatively small in comparison to other biota (table 19). Aluminum concentrations of the three blackbird egg samples were <3, 3, and 4 /jg/g at Kimmies Pond and the one sample from Tapeskas Pond had a concentration of 9.9 /ig/g (table 19).
Arsenic
Fish
Arsenic values measured in the fish samples from the Cheyenne River (sites 1, 5, 12, 14) had a median of 0.2 /ig/g and ranged from less than the analytical reporting limit of <0.1 to 2.3 Atg/g (table 17). No significant downstream trends were observed. The maximum arsenic concentration in fish tissue (2.3 /jg/g) was measured at site 14 (table 24). Percentile plots of arsenic concentrations in fish tissue showed the majority of samples were less than the National Contaminant Biomonitoring Program 85th-percentile baseline value of 0.81 Aig/g dry weight (Lowe and others, 1985). Site 1, a background site, had the largest number of samples greater than the baseline value for arsenic residue in fish tissue (fig. 14). Gilderhus (1966) found that an arsenic residue level of 4.68 A*9/9 dry weight (effect level) in juvenile bluegills was associated with poor growth and survival. No samples had arsenic concentration in fish tissue greater than this level (fig. 14).
46

10,000 cANNUAL
1,000
x tu
(T Q
(K O
(TtuCL
100
10
N=9
N= NUMBER OF SAMPLES MAXIMUM
75TH PERCENTILE
MEDIAN
25TH PERCENTILE MINIMUM
_______I
SITE I SITE 5 SITE 12
N=44
SITE 14
§ 10,000 SEASONAL(K O
1,000 r
100 r
10 r
[
f\_
1--
-
:
:
_
i=1
4
1C
r
>
N=IC>t
1
NODATA
N='
4
1
Q
'
>
f»J=
4
4
1
?-
>
>
f
^
y|=4
4
1
26 >
>
N='
4
'
\
\
N=27. r-_-
-
4»
APRIL SEPT SITE I
APRIL SEPT SITE 5
APRIL SEPT SITE 12
APRIL SEPT SITE 14
SAMPLING SITES
Figure 13. Aluminum concentrations in fish tissue from sample sites, 1988,
47

Table
18. Median and
range
of aluminum,
arse
nic,
copper,
sele
nium
, and
zinc
concentrations
CD
in fish sa
mple
sfr
om four biolocrical
samclincr
site
s in the
Chevenne Ri
ver,
19
88
[Concentrations
in micrograms per
gram (d
ry we
ight
);
Elements
Aluminum
Arsenic
Copper
Selenium
Zinc
Month
Biota
coll
ecte
d
Fish
Ap
ril
Sept
embe
r
Fish
Apri
l
Sept
embe
r
Fish
Ap
ril
Sept
embe
r
Fish
Apri
l
Sept
embe
r
Fish
Apri
l
Sept
embe
r
Medi
an:
Range :
Medi
an:
Range :
Medi
an:
Range :
Medi
an:
Range :
Medi
an:
Range :
Medi
an:
Range :
Medi
an:
Range :
Medi
an:
Range :
Medi
an:
Range :
Medi
an:
Range
:
1
Apri
l, N=
10
September, N=10
352
31 -
1,310
157
50.4
-
6,350
<0.2
<0.2 -
1.2
0.3
<0.1
-
1.4
4.3
2.4 -
7.5
2.9
1.7 -
8.90
3.0
2.1 -
3.2
3.2
2.5 -
5.0
139.5
94.2 -
289
127
80.7 -
277
,
no data;
N=,
number of sa
mple
s
Sampling site
(fig.
7)
5 12
Apri
l, N=27
September, N=
9 Se
ptem
ber,
N=
26
156
11 -
939
110
282
24 -
1,110
8 -
2,62
0
0.2
<0.1
-
0.97
0.
3 0.3
<0.1
-
0.6
<0. 2-2.0
2.94
1.20 -
6.74
2.4
2.3
1.8 -
7.8
1.1 -
6.7
5.2
3.2-10
11
5.2
6.9 -
13
2.8 -
8.0
98.4
53.9 -
391
91.1
85.3
45.2 -
131
58.1 -
277
; <,
less than]
14
April, N=17
September, N=27
73
4.9 -
847
240
13 -
2,730
0.1
<0.1 -
0.79
0.2
<0.1 -
2.3
2.74
1.20 -
7.31
2.6
0.94 -
16.1
3.5
2.1 -
6.6
4.0
2.8 -
6.2
102
47.5 -
401
88.5
52.3 -
345

Table 19. Aluminum, arsenic, copper,
sele
nium
, and
zinc concentrations in aquatic
plan
ts,
inve
rteb
rate
s;
10
and
blackbird
eqqs fr
om in
divi
dual
bi
oloq
ical
sa
mpli
nq si
tes
in th
e st
udv
area
,
[Con
cent
rati
ons
in micrograms per
gram
, 1988
(dry we
ight
); ,
no data;
N=,
number of samples; <, less than]
Sampling site (fig.
7)
Elem
ent
Aluminum
Arsenic
Copper
Selenium
Zinc
Aluminum
Arsenic
Copper
Selenium
Zinc
Aluminum
Arsenic
Mercury
Zinc
Selenium
Biot
a
Plants
Plants
Plan
tsPlants
Plan
ts
Invertebrates
Inve
rteb
rate
sIn
vert
ebra
tes
Inve
rteb
rate
sIn
vert
ebra
tes
Blackbird eg
gsBlackbird eggs
Blackbird eggs
Blackbird eggs
Blackbird eggs
1
N=2
1,940, 3,410
0.59, 3.0
6.8, 9.1
0.1, 0.2
33,
37
N=2
1,620, 1,670
0.93, 1.
218,
183.
0, 3.1
118, 140
__
5 9
N=l
N=l
9,250
617.3
0.2
7.4
2.2
2.9
<0.1
31
14 N=l
1,960 1.
925 5.8
224
N=l 9.9
0.1
2.2
64.7
N=4
2.2,
2.3,
2.6,
3.0
11
12
N=l
N=l
73
9,370
0.1
6.7
1.8
7.0
0.2
2.2
9.5
37
N=l
N=l
100
7,150
0.5
2.7
5.8
17
2.8
5.8
92.7
120
N=3
<3,
3, 4
<0.1, 0.1, 0.2
1.0, 2.2, 2.8
36,
53.9, 60.1
N=4
1.5, 1.5
2.5, 2.9
14
N=2
620,
2,340
1.2,
1.4
2.4, 7.71
0.46, 0.80
11,
27.4
N=l
4,230 1.5
174.3
121

X CD
UJ
cc. o
UJ O.
to
o os
NUMBER OF SAMPLESMAXIMUM75TH PERCENTILE
MEDIAN
25TH PERCENTILE MINIMUM
EFFECT LEVEL FOR POOR GROWTH AND SURVIVAL
NATIONAL CONTAMINANT BIOMONITORINGPROGRAM 85TH PERCENTILE BASELINE VALUE
ANALYTICAL REPORTING LEVEL
N=20
N=44
N=53
SITE I SITES SITE 12
SAMPLE SITES
SITE 14
Figure 14. Arsenic concentrations in fish tissue from sample sites, 1988,
h- 20
(£
UJ
tr o
cr
o cr o
a:UJa. a. o o
15
10
N= NUMBER OF SAMPLES 9 MAXIMUM
75TH PERCENTILE
MEDIANN=44
-T- 25TH PERCENTILE MINIMUM
NATIONAL CONTAMINANT BIOMONITORINGPROGRAM 85TH PERCENTILE BASELINE VALUE
N=20
1 N=9N=53
SITE I SITES SITE 12
SAMPLE SITESSITE 14
Figure 15. Copper concentrations in fish tissue from sample sites, 1988,
50

Arsenic concentrations in fish throughout the study area were small and are not expected to impact the fishery resources in the Cheyenne River. The largest arsenic value (2.3 pg/g dry weight, 0.69 /ig/g fresh wet weight) was significantly less than the 1.35 pg/g (fresh wet weight) in tissue residue of juvenile bluegills (Lepomis macrochirus) and 5 ng/g dry weight in adults considered elevated and potentially hazardous (Eisler, 1988).
Aquatic invertebrates
The median arsenic concentration of the six invertebrate samples was 1.4 /*g/g, with individual samples ranging from 0.5 to 2.7 A*g/g (table 17). The maximum arsenic concentration in invertebrates (2.7 ng/g) was measured at site 12 (table 19).
These levels of arsenic concentrations are not expected to cause harmful effects to other organisms that may feed upon them. Eisler (1988) reported that rainbow trout fed diets containing 90 /ig/g or more of arsenic (as As or As ), grew poorly, avoided food, and failed to metabolize food efficiently. No toxic effects were reported over 8 weeks of exposure to diets containing 1,600 ng/g as methylated arsenicals.
Aquatic plants
Median arsenic concentration in the eight plant samples (sites 1, 5, 9,11. 12, 14) was 1.3 /*g/g d^y weight, with individual samples ranging from 0.1 to 7.3 pg/g (table 17). The maximum arsenic concentration in plants (7.3 A*g/g) was measured at site 5, below Angostura Dam (table 19). The second largest arsenic concentration (6.7 pg/g) was measured at site 12. These two values, which were present in Sago pondweed, were significantly larger than those found at other sites, which ranged from 0.1 pg/g at Kimmies Pond (site 11) to 3.0 /xg/g near Edgemont (site 1).
Blackbird eggs
The arsenic concentrations sampled in the blackbird eggs collected at Tapeskas Pond (site 9) and Kimmies Pond (site 11) were very small compared to other biota, ranging from <0.1 to 0.2 /xg/g dry weight (table 19). The maximum concentration of 0.2 /ig/g was measured at site 11.
Copper
Lowe and others (1985) show that the National Contaminant Biomonitoring Program 85th-percentile baseline value for copper in fish is 3.67 pg/g dry weight. Median concentrations of copper in fish tissue at sample sites 1, 5,12. and 14 were less than this baseline value (fig. 15). Copper residues in fish tissue at site 1, a background site, generally were greater than at the other sample sites. Site 14, downstream of all irrigation return flow, had the least number of samples that exceeded the baseline value of 3.67 /xg/g dry weight (fig. 15).
Selenium
Fish
The National Contaminant Biomonitoring Program 85th-percentile baseline value of selenium concentrations in fish tissue is 2.8 ng/g dry weight (Setmire and others, 1990; Lowe and others, 1985). Lillebo and others (1988) suggest that the level of selenium residue in whole fish tissue that will adversely impact fish growth or reproduction is 10.0 /ig/g (effect level). The majority of selenium concentrations in fish tissue sampled were greater than the baseline value at the four sample sites (fig. 16). The largest
51

median concentration (11 ng/g dry weight) was at site 5 and is greater than the 10.0 ng/g effect level for selenium concentrations in whole fish. The smallest selenium concentrations in fish were at site I, a background site (fig. 16).
Seven of the nine fish samples collected in September at site 5 had selenium concentrations ranging from 10 to 13 /*g/g dry weight (table 24). One fish sample in April at site 12 had a selenium concentration of 10 /*g/g dry weight. These values are significant because they equal or exceed the effect level of 10.0 ng/g dry weight selenium concentrations suggested to cause detrimental effects in fish (Lillebo and others, 1988). At site 5, where selenium concentrations were the greatest, smallmouth bass and green sunfish were abundant.
Aquatic invertebrates
The median selenium concentration of the six invertebrate samples collected in the study area was 3.7 /Kj/g dry weight, with individual samples ranging from 2.8 to 5.8 /*g/g dry weight (table 17). The maximum selenium concentration (5.8 /Kj/g) was measured at sites 9 and 12 (table 19), which is slightly greater than the dietary level (5.0 /ig/g dry weight) for fish that may adversely impact growth or reproduction (Lemly and Smith, 1987). No invertebrate samples were available from site 5, 0.75 mi downstream of Angostura Dam.
Aquatic plants
The median selenium concentration for the eight plant samples collected from the biological sampling sites was 0.33 /*g/g dry weight, with individual samples ranging from <0.1 to 2.9 ng/g dry weight (table 17). The maximum (2.9 ng/g dry weight) was measured at site 5 (table 19). These concentra tions are less than the 7.0 /*g/g dry weight dietary level that may adversely impact growth or reproduction of birds (Hoffman and others, 1990).
Blackbird eggs
The selenium concentrations in blackbird eggs collected at sites 9 and 11 ranged from 1.5 /*g/g at site 11 to 3.0 /*g/g dry weight at site 9 (table 19). These small residues are not likely to have harmful effects, based on a 9.0-/*g/g dry weight level in duck tissue that may adversely impact growth or reproduction of ducks (Lemly and Smith, 1987).
Zinc
The National Contaminant Biomonitoring Program 85th-percentile baseline value of zinc concentrations in whole-body fish tissue is 155 pg/g dry weight (Lowe and others, 1985). The majority of samples collected at the biological sample sites had zinc concentrations less than this baseline value (fig. 17). The highest median concentration (131 pg/g dry weight) was at site 1, a background site for biota data.
Pesticides
One sample of blackbird eggs from a nest at Kimmies Pond (site 11) and six fish samples from the Cheyenne River (sites 12 and 14) were analyzed for organochlorine pesticides and PCB residues (table 20). Pesticide concen trations in the blackbird eggs were less than analytical reporting limits. Pesticide concentrations in fish tissue that exceeded the analytical reporting limit were detected in 13 of 85 analyses from site 14, which is downstream of irrigation return flow (table 20). None of the organochlorine
52

20
x CDUJ
ccCD
CC UJ Q.
CO
<ccCD Occ o
aUJ CO
15
10
N=9
N=20
4-
NUMBER OF SAMPLESMAXIMUM
75TH PERCENTILEMEDIAN25TH PERCENTILEMINIMUM
EFFECT LEVEL FOR REPRO DUCTION AND GROWTH
--- NATIONAL CONTAMINANT BIOMONITORING PROGRAM 85TH PERCENTILE BASELINE VALUE -'I/
N=44
SITE I SITE 5 SITE 12
SAMPLE SITES
SITE 14
Figure 16. Selenium concentrations in fish tissue from sample sites, 1988,
450
400
350
300
cc o or 250UJ Q.CO
o2 N
200
150
100
50
N= NUMBER OF SAMPLES MAXIMUM 75TH PERCENTILE MEDIAN25TH PERCENTILE MINIMUM
N=53N=44
NATIONAL CONTAMINANT BIOMONITORING PROGRAM 85TH PERCENTILE BASELINE VALUE
N=20
N=9
II
SITE SITE 5 SITE 12
SAMPLE SITES
SITE 14
Figure 17. Zinc concentrations in fish tissue from sample sites, 1988.
53

Table 20. Concentrations of selected pesticides in biota. 1988
[Analyses by U.S. Fish and Wildlife Service. Concentrations in micrograms per gram, wet weight; PCB, polychlorinated biphenyls; mm, millimeters; <, less than; , no date]
Site number (fig. 7)
11
12
14
Site name
Kimmies Pond
Cheyenne River near Custer County 656 Bridge
Cheyenne River near Fairburn
Biota
Blackbird eggs - 4
Carp
Carp Channel catfish Carp Sauger Shorthead redhorse
Date
May 29
Apr. 20
Apr. 20 Apr. 20 Sept. 7 Sept. 7 Sept. 7
Est. Age
(years)
5
57 3 6 4
Weight Length (grams) (nm)
20
1,400 483
1,625 488 1,750 584
591 361 1,250 508
403 351
Percent moisture
85.43
77.2
78.0 75.8 75.6 67.8 76.4
Site number (fig. 7)
11
12
14
Chlor- Aldrin dane
<0.05
<0.1
<0.02
<0.02 <0.02 <0.02 <0.02 <0.02
Dieldrin Endrin
<0.05 <0.05
O.01 <0.01
<0.01 <0.01 <0.01 <0.01 0.01 <0.01
<0.01 <0.01 <0.01 <0.01
Hepta- chlor epoxide
<0.05
<0.01
<0.01 <0.01 <0.01 <0.01 <0.01
Hexa- chloro- benzene
<0.05
<0.01
<0.01 <0.01 <0.01 <0.01 <0.01
Lindane Mirex
<0.05 <0.05
<0.01
<0.01 <0.01 <0.01 <0.01 <0.01
cis- Non- achlor
0.05
<0.01
<0.01 <0.01 <0.01 <0.01 <0.01
Site trans- Oxy-number Hon- chlor- Total Toxa-(fig. 7) achlor dane PCB's phene o'p'DDT p'p'DDT o'p'DDE p'p'DDE o'p'DDD p'p'DDD
1112
<0
<0
.05
.01
<0.05
<0.01
0.05
O.05
O.05
0.05
O.05
O.01
O.05
0.01
O.05
0.01
O.05
0.01
O.05
0.01
O.05
0.01
14 o.o.o.
0.0.
0101010202
0OO0O
.01
.01
.01
.01
.01
0o0
00
.05
.05
.05
.39
.23
O.0.O.O.0.
0505050505
O.0,0.O,O,
.01
.01
.01
.01
.01
0O00O
.01
.01
.01
.01
.01
O.01 O.01 O.01 0.01 0.01
0.010.010.030.050.02
O.01 0.01 O.01 O.01 0.01
0.020.010.010.030.01
54

pesticide concentrations in fish tissue exceeded the recommended limit of 1.0 A*g/g wet weight established by the National Academy of Sciences-National Academy of Engineering (1973) for protection of fish.
The PCB content of two of the three fish samples collected in September from the Cheyenne River near Fairburn (site 14) was 0.23 and 0.39 A*g/g wet weight. These concentrations are greater than the analytical reporting limits but less than the National Academy of Sciences-National Academy of Engineering (1973) recommended level of 2.00 A*g/g wet weight for protection of any aquatic organism.
SUMMARY AND CONCLUSIONS
Reconnaissance studies were conducted by scientists of the U.S. Geological Survey, U.S. Fish and Wildlife Service, and U.S. Bureau of Reclamation during 1986-89 to determine whether irrigation drainage from U.S. Department of Interior irrigation projects has caused or has the potential to cause: significant harmful effects on human health, fish, and wildlife; or adverse effects on the suitability of water for other beneficial uses. The Angostura Reclamation Unit in southwestern South Dakota was chosen for a reconnaissance study because most of the irrigated land and surrounding area overlie Cretaceous marine shales which are known to contain large concentrations of trace elements, including selenium. The Angostura Reclamation Unit is a flow-through system with one storage site, Angostura Reservoir, used to supply water for 12,200 acres of irrigated lands.
Even though drought conditions prevailed during the sampling phase of the study (1988), concentrations of dissolved constituents in water from the Cheyenne River both upstream and downstream of the Angostura Reclamation Unit lands were not substantially greater than values measured in previous years. This probably is due to the fact that spring-fed tributaries, originating at limestone outcrops, contribute large amounts of flow to the Cheyenne River.
In general, water in the study area was found to be a sodium sulfate type. Dissolved-solids concentrations in water generally were greater than 1,000 mg/L, which may have adverse effects on some crops.
Results of the study indicate that irrigation return flow had relatively small concentrations of trace elements. Overall, there appeared to be minor differences between concentrations of trace elements in water of the Cheyenne River upstream of irrigated land and in water downstream from all irrigation return flow. The largest concentration of selenium (16 /*g/L) was at Cottonwood Creek, a background site that drains a basin underlaid by Cretaceous shales. The largest concentration of uranium (44 /jg/L) was in Iron Draw, an irrigation return flow drain. There were only minor differences for most constituent concentrations among the May, June, August, and November samples. Maximum concentrations of selenium and uranium occurred in November.
Concentrations of trace elements measured in water generally were small in comparison to water-quality criteria, standards, or recommended limits. The few instances in which water-quality guidelines for human consumption were exceeded occurred in water that is not used for domestic water supplies. The few instances in which water-quality guidelines for aquatic life were exceeded are minor and indicates that there probably are no adverse water- quality effects on aquatic life in the study area. There were no exceedances of recommended water-quality limits for irrigation use or livestock watering.
55

Pesticide concentrations generally were less than the analytical report ing limits. The largest pesticide concentration was 1.0 /jg/L of Prometone measured in the Cheyenne River at site 8, midway through the Unit lands.
Concentrations of most trace elements in stream-bottom sediment were similar to geochemical baselines for soils of the western United States. The maximum concentration of selenium (14 /ig/g) in bottom sediment of Cottonwood Creek, a background site, was 10 times larger than the upper end of the baseline range in soils. The largest concentration of selenium measured in water (16 A*g/L) also was at this site.
Pesticides, carbofuran and atrazine, were analyzed in samples of bottom sediment from sites where pesticides in water were sampled. Pesticide concentrations in all samples of bottom sediment were less than laboratory analytical reporting limits.
Biota samples for analysis of trace-element concentrations were collected upstream, within, and downstream of the Angostura Reclamation Unit lands. Fish samples were collected during the spring and fall to compare trace-element concentrations in fish influenced by ground-water seepage during the winter and by irrigation return flow during the irrigation season. Aquatic plants and aquatic invertebrates were collected at the same sites as the fish, when possible. Blackbird eggs and other biota were collected at two ponds near the Cheyenne River. All samples were collected in areas where irrigation return flow was most likely to have significant influence on the biota.
Median concentrations of aluminum in fish were larger upstream of the Angostura Reservoir than downstream of the reservoir. Median aluminum concentrations in fish samples collected in April decreased from 352 /ig/g at a background site upstream of the reservoir to 73 A*g/g at a site near Fairburn, which is downstream of all irrigation return flow. The maximum aluminum concentration in fish was 6,350 /ig/g in a sample from the Cheyenne River near Edgemont, upstream of the Angostura Reclamation Unit lands. Because of the lack of information on the toxicity of aluminum to fish, it is difficult to determine the significance of the large concentrations of aluminum in fish. The maximum aluminum concentrations in invertebrates (7,150 A*g/g) and plants (9,370 A*g/g) were from a site on the Cheyenne River, midway through the Unit lands, that receives irrigation return flow from upstream irrigated lands. Because of the lack of information on the correlation between aluminum concentrations and biological effects, it is difficult to make inferences in regard to toxicity.
Seven of the nine fish samples collected in September from the Cheyenne River 0.75 mi downstream of Angostura Dam had selenium concentrations ranging from 10 to 13 /ig/g dry weight. One fish sample collected in April from the Cheyenne River midway through the irrigation Unit had a selenium concentration of 10 A*g/g dry weight. These values are significant because they equal or exceed the selenium concentration of 10.0 A*g/g dry weight, which is suggested to cause detrimental effects in fish. The majority of individual fish tissue samples at the biological sample sites exceeded the baseline values for selenium concentrations.
Even though median concentrations of arsenic, copper, and zinc in fish were less than baseline values, the concentrations of all three elements exceeded their respective baseline values in a number of individual samples. The median concentrations of these elements during the April and September sampling periods generally were similar at all sites. Concentrations of most other elements in fish were low and are not expected to affect reproduction of fish.
56

The maximum selenium concentration for invertebrate samples was 5.8 /ig/g dry weight in samples collected at Tapeskas Pond and in the Cheyenne River midway through the irrigation unit. Although only one sample was available from each of these two sites, this concentration is slightly greater than the dietary level for fish that may adversely impact growth or reproduction.
The six fish samples and one blackbird egg sample that were analyzed for organochlorine pesticides and PCB's had concentrations either less than analytical reporting limits or very low compared to levels of concern for human consumption. Data from the limited number of samples indicate that pesticide residues are not a problem in biota in the study area.
SELECTED REFERENCES
Baumann, P.C., and May, T.W., 1984, Selenium residues in fish from inland waters of the United States/ in The effects of trace elements on aquatic ecosystems: Electric Power Research Institute, Palo Alto, California, (Mar. 23-24, 1982), Proceedings, v. 7, p. 1-16.
Darton, N.H., compiler, 1951, Geologic map of South Dakota: U.S. Geological Survey Map, scale 1:5009,000, 1 sheet.
DeWitt, Ed, Redden, J.A., Buscher, David, and Burack Wilson, Anna, 1989, Geologic map of the Black Hills area, South Dakota and Wyoming: U.S. Geological Survey Miscellaneous Investigations Series Map 1-1910, scale 1:250,000, 1 sheet.
Eisler, Roger, 1988, Arsenic hazards to fish, wildlife, and invertebrates; a synoptic review: U.S. Fish and Wildlife Service Biological Report 85(1.12), 92 p.
Fishman, M.J., and Friedman, L.C., 1985, Methods for determination of inorganic substances in water and fluvial sediments: U.S. Geological Survey Techniques of Water-Resources Investigations, Book 5, Chap. Al, 70-9 p.
Friedman, L.C., and Erdmann, D.E., 1982, Quality assurance practices for the chemical and biological analyses of water and fluvial sediments: U.S. Geological Survey Techniques of Water Resources Investigations, Book 5, Chapter A6, 181 p.
Gilderhus, P.A., 1966, Some effects of sublethal concentrations of sodium arsenite on bluegills and the aquatic environment: Transactions of the American Fisheries Society, v. 95, no. 3, p. 289-296.
Hoffman, R.J., Hallock, R.J., Rowe, T.G., Lico, M.S., Burge, H.L., Thompson, S.P., 1990, Reconnaissance investigation of water quality, bottom sediment, and biota associated with irrigation drainage in and near Stillwater Wildlife Management Area, Churchill County, Nevada, 1986-87: U.S. Geological Survey Water-Resources Investigations Report 89-4105, 150 p.
Horowitz, A.J., 1985, A primer on trace metal-sediment chemistry: U.S. Geological Survey Water-Supply Paper 2277, 67 p.
Kalvels, John, 1982, Soil survey of Fall River County, South Dakota: U.S. Soil Conservation Service, 191 p.
57

Keene, J.R., 1973, Ground-water resources of the western half of Fall River County, South Dakota: South Dakota Geological Survey Report of Investigations No. 109, 82 p.
Lemly, A.D., and Smith, C.J., 1987, Aquatic cycling of selenium; implications for fish and wildlife: U.S. Fish and Wildlife Service Leaflet 12.
Lillebo, P.H., Shaner, S., Carlson, P., Richard, N., and Dubarry, Paul, 1988, Regulation of agricultural drainage to the San Joaquin River- Appendix D. Water quality criteria for selenium and other trace elements for protection of aquatic life and its uses in the San Joaquin Valley: California State Water Resources Control Board Report W.O.85-1, 151 p.
Lowe, T.P., May, T.W., Brumbaugh, W.G., and Kane, D.A., 1985, National Contaminant Biomonitoring Program Concentrations of seven elements in freshwater fish, 1978-81: Archives of Environmental Contamination of Toxicology, v. 14, p. 368-388.
National Academy of Sciences, 1983, Drinking water and health: Washington, D.C., v. 5, 157 p.
National Academy of Sciences-National Academy of Engineering, 1973, Water quality criteria, 1972: Washington, D.C., U.S. Government Printing Office, 594 p.
National Technical Advisory Committee to the Secretary of the Interior, 1968, Water quality criteria: Washington, D.C., U.S. Government Printing Office.
Radtke, D.B., Kepner, W.G., and Effertz, R.J., 1988, Reconnaissance investi gation of water quality, bottom sediment, and biota associated with irrigation drainage in the lower Colorado River Valley, Arizona, California, and Nevada, 1986-87: U.S. Geological Survey Water-Resources Investigation Report 88-4002, 77 p.
Schultz, L.G., Tourtelot, H.A., Gill, J.R., and Boerngen, J.G., 1980, Composition and properties of the Pierre Shale and equivalent rocks, Northern Great Plains Region: U.S. Geological Survey professional Paper 1064-B, 114 p.
Setmire, J.G., Wolfe, J.C., and Stroud, R.K., 1990, Reconnaissance investiga tion of water quality, bottom sediment, and biota associated with irrigation drainage in the Salton Sea Area, California, 1986-87: U.S. Geological Survey Water-Resources Investigations Report 89-4102, 68 p.
Severson, R.C., Wilson, S.A., and McNeal, J.M. , 1987, Analyses of bottom material collected at nine areas in the western United States for the DOI irrigation drainage task group: U.S.Geological Survey Open-File Report 87-490, 24 p.
Shacklette, H.T., and Boerngen, J.G., 1984, Element concentrations in soils and other surficial materials of the conterminous United States: U.S. Geological Survey Professional Paper 1270, 105 p.
Smith, R.A., Alexander, R.B., and Wolman, G.M., 1987, Water-quality trends in the Nation's rivers: Science, v. 235, p.607-1615.
58

South Dakota Ornithologists Union, 1978, The birds of South Dakota: South Dakota Ornithologists Union in cooperation with W.H. Over Museum, Vermillion, South Dakota, 311 p.
U.S. Department of Commerce, 1982, Evaporation atlas for the contiguous 48 United States: National Weather Service Technical Report NWS 33, 26 p.
U.S. Department of Energy, 1979, Hydrogeochemical and stream sediment recon naissance basic data for Hot Springs NTMS quadrangle, South Dakota: Uranium Resource Evaluation Project, K/UR-132, prepared by Union Carbide Corporation, Oak Ridge, Tennessee, contract number W-7405, 157 p.
U.S. Environmental Protection Agency, 1976, Quality criteria for water, 1976: Office of Water and Hazardous Materials, Washington, D.C., 256 p.
1986a, Quality criteria for water (updated May 1986), Update No. 2: Washington, D.C., Office of Water Regulations and Standards, EPA 4405/5-86-001.
1986b, Test methods for evaluating solid waste, physical/chemical methods, manual SW846, v. IB: Office of Solid Waste and Emergency Response, Washington, D.C.
1988, Water quality criteria documents: Federal Register, v. 53, no. 2, p. 177-179.
U.S. Fish and Wildlife Service, 1946, A report on fish and wildlife problems in relation to the water development plan for the Angostura Project, Cheyenne River, South Dakota: Internal U.S. Fish and Wildlife report prepared for the Bureau of Reclamation, Pierre, South Dakota, 21 p.
1964, Fish and Wildlife and the Angostura Unit - initial follow-up report: Internal U.S. Fish and Wildlife report prepared for the Bureau of Reclamation, Pierre, South Dakota, 18 p.
1985a, Field operations manual for resource contaminant assessment: U.S. Fish and Wildlife Service, Resource Contaminant Assessment Division, Washington, D.C., 331 p.
1985b, Procedures for resource contaminant assessment contract analytical work: Washington, D.C., Habitat Resources Instructional Memorandum RCA-130.01, 19 p.
U.S. Geological Survey, 1977, National handbook of recommended methods for water-data acquisition--Chapter 5, Chemical and physical quality of water and sediment: Office of Water-Data Coordination, 193 p.
1986, 1986 Water quality laboratory services catalog: U.S. Geological Survey Open-File Report 85-171, 5 parts, with various pagination.
Wershaw, R.L., Fishman, M.J., Grabbe, R.R., and Lowe, L.E., 1987, Methods for determination of organic substances in water and fluvial sediments: U.S. Geological Survey Techniques of Water-Resources Investigations, Book 5, Chap. A3, 80 p.
59

09

SUPPLEMENTAL DATA
61

Table 21. Field measurements and results of laboratory analyses of water samples from the Angostura Reclamation Unit study area. 1988
[Analyses by U.S. Geological Survey. Abbreviations: US/CM, microsiemens percentimeter at 25 *C; DEG C, degrees Celsius; MG/L, milligrams per liter;
UG/L, micrograms per liter. Symbols: <, less than; , no data]
SITE NUMBER (FIG. 7) STATION NAME
10101010
13131313
14141414
CHEYENNE R NEAR HOT SPRINGS SD CHEYENNE R NEAR HOT SPRINGS SD CHEYENNE R NEAR HOT SPRINGS SD CHEYENNE R NEAR HOT SPRINGS SD
HORSEHEAD CREEK AT OELRICHS
ANGOSTURA RESERVOIR NEAR HOT SPRINGS SD ANGOSTURA RESERVOIR NEAR HOT SPRINGS SD ANGOSTURA RESERVOIR NEAR HOT SPRINGS SD ANGOSTURA RESERVOIR NEAR HOT SPRINGS SD
ANGOSTURA ANGOSTURA ANGOSTURA ANGOSTURA ANGOSTURA ANGOSTURA
CANAL NR HOT CANAL NR HOT CANAL NR HOT CANAL NR HOT CANAL NR HOT CANAL NR HOT
SPRINGS, SDSPRINGS, SDSPRINGS, SDSPRINGS, SDSPRINGS, SDSPRINGS, SD
FALL RIVER AT MOUTH NR HOT SPRINGS, SDFALL RIVER AT MOUTH NR HOT SPRINGS, SDFALL RIVER AT MOUTH NR HOT SPRINGS, SDFALL RIVER AT MOUTH NR HOT SPRINGS, SD
CHEYENNE RIVER AB BUFFALO GAP, SD CHEYENNE RIVER AB BUFFALO GAP, SD CHEYENNE RIVER AB BUFFALO GAP, SD CHEYENNE RIVER AB BUFFALO GAP, SD
IRON DRAW NR BUFFALO GAP, SDIRON DRAW NR BUFFALO GAP, SDIRON DRAW NR BUFFALO GAP, SDIRON DRAW NR BUFFALO GAP, SD
COTTONWOOD CREEK NEAR BUFFALO GAP, SDCOTTONWOOD CREEK NEAR BUFFALO GAP, SDCOTTONWOOD CREEK NEAR BUFFALO GAP, SDCOTTONWOOD CREEK NEAR BUFFALO GAP, SD
CHEYENNE RIVER NR FAIRBURN, SD CHEYENNE RIVER NR FAIRBURN, SD CHEYENNE RIVER NR FAIRBURN, SD CHEYENNE RIVER NR FAIRBURN, SD
DATE
05-04-8806-22-8808-22-8811-01-88
05-05-88
05-04-8806-23-8808-25-8811-01-88
05-05-8806-22-8808-25-8808-25-8808-25-8811-01-88
05-05-8806-23-8808-24-8811-03-88
05-03-8806-21-8808-23-8811-02-88
05-06-8806-21-8808-23-8811-02-88
05-03-8806-24-8808-24-8811-02-88
05-06-8806-20-8808-26-8810-31-88
TIME
1700130013201500
1800
1200093010301000
14300800140014051410
"*""
1030143014000830
1500090009150930
1030130012451230
1000090011001500
1600140010001200
TEMPERATUREWATER(DEG C)
21.028.025.515.5
19.0
12.021.522.010.0
14.023.023.023.023.0
~~
18.030.024.015.0
15.524.018.010.0
18.027.021.014.0
9.522.015.510.0
20.531.019.59.5
62

Table 21. Field measurements and results of laboratory analyses of water samplesfrom the Angostura Reclamation Unit study
SITENUMBER(FIG. 7)
2222
3
4444
666666
7777
8888
10101010
13131313
14141414
DATE
05-04-8806-22-8808-22-8811-01-88
05-05-88
05-04-8806-23-8808-25-8811-01-88
05-05-8806-22-8808-25-8808-25-8808-25-8811-01-88
05-05-8806-23-8808-24-8811-03-88
05-03-8806-21-8808-23-8811-02-88
05-06-8806-21-8808-23-8811-02-88
05-03-8806-24-8808-24-8811-02-88
05-06-8806-20-8808-26-8810-31-88
TEMPERATUREAIR
(DEC C)
16.035.530.522.0
20.0
17.035.525.011.5
25.030.028.528.528.5
_
19.032.528.515.5
17.532.521.521.0
27.0--
31.524.0
18.032.029.019.0
20.040.027.521.0
DIS CHARGE, INST.CUBICFEETPER
SECOND
31161622
0.1
__----
69207162162162
_
23242125
31233035
2.01.43.22.5
0.240.220.070.23
78386671
SPE CIFICCONDUCTANCE(US/CM)
3550305028002890
3520
2500256025502700
25502520261026102610
1290129013601350
1810190019802020
2990309030002950
2660118028502660
2580267027502660
OXYGEN,DISSOLVED(MG/L)
7.67.27.98.8
9.0
1.37.6
9.1
10.27.36.66.66.6"~~
9.96.48.49.8
9.86.07.9
10.4
8.57.88.09.2
10.12.83.17.2
6.69.48.911.2
PH(STANDARD
UNITS)
8.268.008.118.21
8.30
8.108.028.008.39
8.338.188.108.108.10
~"~
8.518.238.408.39
8.268.128.108.24
8.328.168.138.29
7.957.807.667.88
8.338.188.208.25
area. 1988 Continued
NITRO GEN,
N02+N03DISSOLVED(MG/LAS N)
0.1000.1500.1300.170
<0.100
0.130<0.100<0.1000.100
<0.100<0.100<0.1000.160
<0.100
0.1800.1600.1800.420
0.9600.6500.9601.20
4.303.802.404.20
0.450<0.100<0.1000.440
0.5200.2300.6101.30
CALCIUMDISSOLVED(MG/LAS CA)
410460480530
190
200200250260
200250270270270 _
150150160160
180170160200
280360300300
20097
230250
230260270270
CHLO RIDE,DISSOLVED(MG/LAS CL)
1601308294
42
120130130140
140130140140140
92939996
95130120120
130140140130
13042
130130
120170140130
MAGNE SIUM,DISSOLVED(MG/LAS MG)
100929296
93
74777979
7579808284
38394140
59586767
811009082
61237162
80919282
POTAS SIUM,DISSOLVED(MG/LAS K)
9.18.06.96.8
14
9.18.8
1010
9.3109.0
1111
-.
8.48.28.58.0
10101116
28142026
<0.10101313
14101010
63

Table 21. Field measurements and results of laboratory analyses of water samples
SITENUMBER(FIG. 7)
2222
3
4444
666666
7777
8888
10101010
13131313
14141414
DATE
05-04-8806-22-8808-22-8811-01-88
05-05-88
05-04-8806-23-8808-25-8811-01-88
05-05-8806-22-8808-25-8808-25-8808-25-3811-01-88
05-05-8806-23-8808-24-8811-03-88
05-03-8806-21-8808-23-8811-02-88
05-06-8806-21-8808-23-8811-02-88
05-03-8806-24-8808-24-8811-02-88
05-06-8806-20-8808-26-8810-31-88
from
SODIUM,DISSOLVED(MG/LAS NA)
320160100110
510
240250270260
240250260260260~~
67707270
140140160150
300300300290
320120340320
260260260240
the Angostura Reclamation Unit study
SULFATEDISSOLVED(MG/L
AS SO4)
1900160016001700
1700
1100120013001300
11001100130012001200
~~
420420440420
710700760780
1400130014001400
1100390
12001100
1200120013001200
SOLIDS, RESIDUEAT 180DEG. CDISSOLVED(MG/L)
3160274026402730
2810
2000204020902210
20002020212021202110
--
942944961964
1380140015201560
2450248024702440
2090807
21502060
2110217022402200
ARSENICDIS
SOLVED(UG/LAS AS)
<11
<1<:L
1
<1<121
11111
--
4343
11
<11
<;L1
<1<l
<!311
111
<1
BORON,DISSOLVED(UG/LAS B)
270230190200
650
210200200230
210210210210200--
200200180200
230280260250
350360320330
490310470560
320370310320
area. 1988 Continued
CHRO-CADMIUM MIUM,
DIS- DISSOLVED SOLVED(UG/L (UG/LAS CD) AS CR)
<1 <11 4
<1 31 3
<i
<i <i<1 2<1 2<1 2
<1 <11 2
<1 3<1 3<1 2 - --
<1 2<1 2<1 24 1
<1 <1<1 1<1 25 3
<1 <11 2
<1 21 2
<1 <1<1 2<1 21 1
<1 <1<1 2<1 21 2
COPPER,DISSOLVED(UG/LAS CU)
1<11
<l
1
7112
112112
--
<l1
<11
1<11
<l
<1<111
<!3
<1<l
121
<1
LEAD,DISSOLVED(UG/LAS PB)
<5<5<5<5
<5
<5<5<5<5
11<510<55
--
<5<5<5<5
<5<5<5<5
<5<5<5<5
<5<5<5<5
<5<56
<5
MERCURYDISSOLVED(UG/LAS HG)
<0. 1<0. 1<0 . 1<0.1
<0.1
0.4<0. 10.2
<0.1
<0.1o!20.1
<o . i<0. 1
--
<0.1o!2
<0. 1<0.1
0.75.3
<0. 1<0.1
<0 . 1<0. 1<o . i0.1
<0.10.2
<0. 1<0 . 1
<0.1<0 . 1<o. i0.2
64

Table 21. Field measurements and results of laboratory analyses of water samplesfrom the Angostura Reclamation Unit study
SITENUMBER(FIG. 7)
2222
3
4444
666666
7777
8888
10101010
13131313
14141414
DATE
05-04-8806-22-8808-22-8811-01-88
05-05-88
05-04-8806-23-8808-25-8811-01-88
05-05-8806-22-8808-25-8808-25-8808-25-8811-01-88
05-05-8806-23-8808-24-8811-03-88
05-03-8806-21-8808-23-8811-02-88
05-06-8806-21-8808-23-8811-02-88
05-03-8806-24-8808-24-8811-02-88
05-06-8806-20-8808-26-8810-31-88
MOLYBDENUM,DISSOLVED(UG/LAS MO)
12141613
3
8786
108888
-
1078
10
6874
433
<1
3121
8786
SELENIUM,DISSOLVED(UG/LAS SE)
3323
1
2222
22122
--
3322
343
<1
6645
1353
16
43
<13
URANIUMNATURAL
DISSOLVED(UG/LAS U)
126.56.87.3
11
9.59.99.8
11
8.99.5
101110
--
5.15.35.66.1
9.08.5
109.5
38222844
163.9
1218
14101415
VANADIUM,DISSOLVED(UG/LAS V)
3222
<1
<1112
11211
-
6565
2322
<1211
1112
122
<1
ZINC,DISSOLVED(UG/LAS ZN)
1020
<1010
20
1060
<1020
<1020
150<1010-
55057
76<3
<103
<10201210
<1048
<1010
<10202050
area. 1988 Continued
ALA-CHLORTOTAL
RECOVER(UG/L)
<0.10<0.10<0.10<0.10
<0.10
__-- -
__-- ----
__-----
<0.10<0.10<0.10<0.10
<0.10<0.10
--<0.10
__
<0.10<0.10<0.10
<0.10<0.10<0.10<0.10
AME-TRYNETOTAL
<0.10<0.10<0.10<0.10
<0.10
__ -- -
__ -- --
__-- --
<0.10<0.10<0.10<0.10
<0.10<0.10
--<0.10
__
<0.10<0.10<0.10
<0.10<0.10<0.10<0.10
ATRA-ZINE,TOTAL(UG/L)
<0.10<0.10<0.10<0.10
0.10
__--
__---- -
__-- --
0.10<0.10<0.10<0.10
0.100.10
0.10
__
<0.10<0.10<0.10
0.200.100.100.10
CYAN-AZINETOTAL(UG/L)
0.10<0.10<0.10<0.10
0.10
__
__---- -
__
<0.10<0.10<0.10<0.10
<0.10<0.10
<0.10
__
<0.10<0.10<0.10
<0.10<0.10<0.10<0.10
METHO-MYLTOTAL(UG/L)
<0.5<0.5<0.5<0.5
<0.5
__ --
__ -- -
__----
<0.5<0.5<0.5<0.5
<0.5<0.5
<0.5
__<0.5<0.5<0.5
<0.5<0.5<0.5<0.5
65

Table 21. Field measurements and results of laboratory analyses of water samplesfrom the Ansostura Reclamation Unit study area, 1988 Continued
METRI- METOLA- BUZIN CHLOR
SITE WATER WATER PROME- PROME- PRO- NUMBER WHOLE WHOLE TONE TRYNE PAZINE PROPHAM (FIG. 7) DATE TOT.REC TOT.REC TOTAL TOTAL TOTAL TOTAL
(UG/L) (UG/L) (UG/L) (UG/L) (UG/L)
2222
3
AAAA
666666
7777
8888
10101010
13131313
1A1A1A1A
05-OA-8806-22-8808-22-8811-01-88
05-05-88
05-OA-8806-23-8808-25-8811-01-88
05-05-8806-22-8808-25-8808-25-8808-25-88ll-«l-88
05-05-8806-23-8808-2A-8811-03-88
05-03-8806-21-8808-23-8811-02-88
05-06-8806-21-8808-23-8811-02-88
05-03-8806-2A-8808-2A-8811-02-88
05-06-8806-20-8808-26-8810-31-88
<0.1 <0.1 <0.<0 . 1 <0.1 <0.1 <0.1 <0,<0 . 1 <0 . 1 <0.1 <0.1 <0.<0.1 <0.1 <0.1 <0.1 <0.
<0 . 1 <0 . 1 <0 . 1 <0.1 <0.
__ __ __ ____ -- -- -- --
_- __-_---- -- -- --
__ __ __ ______
<0.1 <0 . 1 1.0 <0.1 <0.<0.1 <0 . 1 <0.1 <0.1 <0.<0 . 1 <0 . 1 <0.1 <0.1 <0.<0.1 <0.1 <0.1 <0.1 <0.
-- -- <o . i <o . i <o .<0 . 1 <0 . 1 <0 . 1 <0 . 1 <0 .
-_<0 . 1 <0 . 1 <0.1 <0 . 1 <0 .
__
<0 . 1 <0 . 1 <0 . 1 <0 . 1 <0 .<0 . 1 <0 . 1 <0.1 <0.1 <0.<0 . 1 <0 . 1 <0 . 1 <0.1 <0.
<0 . 1 <0.1 0.2 <0.1 <0.<0.1 <0 . 1 <0 . 1 <0 . 1 <0 .<0 . 1 <0.1 <0 . 1 <0 . 1 <0 .<0 . 1 <0 . 1 <0.1 <0 . 1 <0 .
.10
.10
.10
.10
.10
__-- --
__ -- --
__ ----
.10
.10,10.10
.10
.10--.10
__
.10
.10
.10
,10.10.10.10
(UG/L)
<0<0<0<0
<0
<0<0<0<0
<0<0
<0
<0<0<0
<0<0<0<0
.5
.5
.5
.5
.5
__ --
__ --------
__----
.5
.5
.5
.5
.5
.5 .5
__.5.5.5
.5
.5
.5
.5
SEVIN, TOTAL(UG/L)
<0,<o.<0,<0.
<0,
<0.<0.<0,<0,
<0.<0.
<0,
<0.<0,<0.
<0.<0.<0,<0.
.50
.50
.50
.50
.50
__ ----
__ ---- --
__ --
50.50,50,50
.50,50 .50
__50,50,50
.50
.50,50.50
TRI- FLURA-
SIMA- SIME- LIN ZINE TRYNE TOTAL
TOTAL TOTAL RECOVER(UG/L) (UG/L) (UG/L)
<0,<0,<0,<0.
<0.
0,<0.<0.<0.
<0.<0.
<0.
<0.<0,<0,
0.<0,<0.<0,
,10.10.10.10
.10
__-- --
__------ -
__----
30.10,10.10
.10,10__.10
__
10.10,10
.10,10,10,10
<0.1 <0.<0.1 <0.<0.1 <0.<0.1 <0.
<0 . 1 <0 .
__ --
__ -- --
__ ----
<0 . 1 <0 .<0. 1 <0 .<0 . 1 <0 .<o . i <o .
<0 . 1 <0 .<0.1 <0.
--<0.1 <0.
__
<0 . 1 <0 .<0 . 1 <0 .<0 . 1 <0 .
<0 . 1 <0 .<0 . 1 <0 .<0 . 1 <0 .<0.1 <0.
10101010
10
__-- --
__-- ----
__
10101010
1010--
10
__
101010
10101010
66

Table 21.--Field measurements and results of laboratory analyses of water samples
SITE NUMBER (FIG. 7) DATE
2222
3
4444
666666
7777
8888
10101010
13131313
14141414
05-04-8806-22-8808-22-8811-01-88
05-05-88
05-04-8806-23-8808-25-8811-01-88
05-05-8806-22-8808-25-8808-25-8808-25-8811-01-88
05-05-8806-23-8808-24-8811-03-88
05-03-8806-21-8808-23-8811-02-88
05-06-8806-21-8808-23-8811-02-88
05-03-8806-24-8808-24-8811-02-88
05-06-8806-20-8808-26-8810-31-88
from the
1-NAPH- THOL(UG/L)
<0.5<0.5<0.5<0.5
__------
__---- --
__----
<0.5<0.5<0.5<0.5
<0.5<0.5<0.5<0.5
__<0.5<0.5<0.5
<0.5<0.5<0.5<0.5
AnRostura Reclamation Unit study area. 1988--Continued
3-HYDROXY- CARBO- ALDI- FURAN CARB(UG/L)
<0.5<0.5<0.5<0.5
__ ----
__------ --
__----
<0.5<0.5<0.5<0.5
<0.5<0.5<0.5<0.5
__<0.5<0.5<0.5
<0.5<0.5<0.5<0.5
(UG/L)
<0.5<0.5<0.5<0.5
.. --
__ -- --
__
<0.5<0.5<0.5<0.5
<0.5<0.5<0.5<0.5
__<0.5<0.5<0.5
<0.5<0.5<0.5<0.5
ALDI- CARB SULFONE(UG/L)
<0.5<0.5<0.5<0.5
__------
__ ---- --
__------
<0.5<0.5<0.5<0.5
<0.5<0.5<0.5<0.5
__<0.5<0.5<0.5
<0.5<0.5<0.5<0.5
ALDI- CARB SULFOX- IDE(UG/L)
<0.5<0.5<0.5<0.5
__-- --
__----------
__------
<0.5<0.5<0.5<0.5
<0.5<0.5<0.5<0.5
__<0.5<0.5<0.5
<0.5<0.5<0.5<0.5
CAR- BARYL(UG/L)
<0.5<0.5<0.5<0.5
__------
__----------
__------
0.5<0.5<0.5<0.5
<0.5<0.5<0.5<0.5
__<0.5<0.5<0.5
0.5<0.5<0.5<0.5
CAR- BOFURAN OXAMYL(UG/L)
<0.5<0.5<0.5<0.5
__------
____---- --
__-- --
<0.5<0.5<0.5<0.5
<0.5<0.5<0.5<0.5
._<0.5<0.5<0.5
<0.5<0.5<0.5<0.5
(UG/L)
<0.5<0.5<0.5<0.5
__------
__---- ----
..------
<0.5<0.5<0.5<0.5
<0.5<0.5<0.5<0.5
_.<0.5<0.5<0.5
<0.5<0.5<0.5<0.5
67

Table 22. Selected trace-element and pesticide concentrations in the less than62-micrometer fraction of bottom sediment from the study area, 1988
[Analyses by the U.S. Geological Survey. Concentrations of trace elements are reported as total in bottom material, with the exception of boron, which is reported as extractable.
Concentrations of pesticides are reported as recoverable from bottom material. <, less than; , no data; Mg/g, micrograms per gram; mg/kg, milligrams per kilogram]
Sitenumber(fig. 7)
2(split)
Carbon (percent)
Site name
Cheyenne Rivernear Hot Springs
Trace-element concentration
Cad- Chro- Cop-Date Total Organic Inorganic Arsenic Barium Boron mium mium per
11-01-88 44,
(replicate) 4,3
4
6
7
8
10
13
14
Horsehead Creekat Oelrichs
Angostura Reservoirnear Hot Springs
Angostura Canalnear Hot Springs
Fall River at mouthnear Hot SpringsCheyenne River above
Buffalo GapIron Draw nearBuffalo Gap
Cottonwood Creekn »ar Buffalo Gap
Cheyenne Rivernear Fairburn
10-31-88 5.
11-01-88 1,
11-01-88 3.
11-03-88 3.
11-02-88 3,
11-02-88 1,
11-02-88 3,
10-31-88 2,
.20 0.37
.61 .29
.03 .25
.53 5.09
.71 1.07
.95 1.66
.54 .66
.74 1.56
.76 .47
.47 2.84
.41 .89
3.83 11.04.32 7.63.78 6.6.44 8.6
.64 7.2
2 . 29 6.2
2.88 12.0
2.18 13.0
1.29 8.9
.63 15.0
1.52 6.5
510700480720
440
400
760
720
930
150
1,200
<2 23 8<2 22 9<2 20 7
5.5 <2 64 23
2.1 <2 85 26
2.1 <2 47 19
1.2 <2 50 20
1.8 2 72 28
<2 57 21
7.3 <2 67 28
1.4 <2 35 16
Trace-element concentration
Sitenumber(fig. 7)
2(split)
Site name
Cheyenne Rivernear- Hot Springs
(replicate)3
4
6
7
8
10
13
14
Horsehead Creekat Oelrichs
Angostura Reservoirnear Hot Springs
Angostura Canalnear Hot Springs
Fall River at mouthnear Hot SpringsCheyenne River above
Buffalo GapIron Draw nearBuffalo Gap
Cottonwood Creeknear Buffalo Gap
Cheyenne Rivernear Fairburn
Manga-Lead nese
12 1,30012 1,10012 78055 470
23 360
28 730
18 710
18 770
18 860
18 3,400
17 560
Mer- Molyb-cury denum
<0.02 <2<.02 <2<.02 <2.04 <2
.04 <2
<.02 <2
.02 <2
.04 4
.04 <2
.04 <2
.02 <2
(/ig/g)
Sele-Nickel nium
15 0.915 1.09 .6
26 1.0
26 1.0
24 2.1
19 .9
35 4.3
23 1.6
31 14.0
15 .6
Uranium
2.01.92.02.0
2.1
3.7
1.9
3.8
3.4
5.3
2.1
Pesticideconcentration
(mg/kg)
Vana- Atra- Carbo-dium Zinc zine furan
38 49 <0.1 <0.139 4931 39
110 96
140 110
74 67
84 76
200 120 <.l <.l
110 90 <.l <.l
140 140 <.l <.l
67 58 <.l <.l
68

Table 23. Selected trace-element concentrations in the less than 2-millimeterfraction of bottom sediment from the study area. 1988
[Analyses by the U.S. Geological Survey. Concentrations of trace elements are reported as total in bottom material, with the exception of boron, which is reported as extractable.
<, less than; , no data; /*g/g, micrograms per gram]
Site number(fig. 7)
2(split)
Carbon (percent)
Site name
Cheyenne Rivernear Hot Springs
(replicate)3
4
6
7
8
10
13
14
Horsehead Creekat Oelrichs
Angostura Reservoirnear Hot Springs
Angostura Canalnear Hot Springs
Fall River at mouthnear Hot SpringsCheyenne River above
Buffalo GapIron Draw nearBuffalo Gap
Cottonwood Creeknear Buffalo Gap
Cheyenne Rivernear Fairburn
Date Total
11-01-88 0.41.44.35
10-31-88 1.98
11-01-88 1.55
11-01-88 2.76
11-03-88 3.10
11-02-88 1.13
11-02-88 .32
11-02-88 4.54
10-31-88 .97
Organic
0.07.05.05
1.42
.94
1.16
.39
.45
.14
4.18
.12
Inorganic
0.34.39.30.56
.61
1.60
2.7
.68
.18
.36
.85
Trace-element concentration (^tg/g)
Arsenic
9.76.28.69.0
6.7
5.8
14.0
17.0
5.6
11.0
12.0
Barium Boron
820820810420
440
570
770
860
730
280
1,700
<0.4<.4<.45.3
1.6
1.8
.9
.7
.6
6.4
.6
Cadmium
<2<2<2<2
<2
<2
<2
<2
<2
<2
<2
C 4 4- aol ue number(fig. 7)
2(split)
Trace-element concentration (/ig/g)
Site name
Cheyenne Rivernear Hot Springs
(replicate)3
4
6
7
8
10
13
14
Horsehead Creekat Oelrichs
Angostura Reservoirnear Hot Springs
Angostura Canalnear Hot Springs
Fall River at mouthnear Hot SpringsCheyenne River above
Buffalo GapIron Draw nearBuffalo Gap
Cottonwood Creeknear Buffalo Gap
Cheyenne Rivernear Fairburn
Chromium Copper Lead
6 3 185 4 196 4 18
65 24 67
86 27 22
31 14 29
48 19 15
20 10 19
12 5 15
73 27 18
10 7 19
Manganese
360350300520
340
540
600
530
220
1,800
660
Mer- Molyb-cury denum
<0.02 <2<.02 <2<.02 <2.06 <2
.04 <2
<.02 <2
<.02 <2
<.02 2
<.02 <2
.02 <2
<.02 <2
Nickel
445
25
27
18
20
15
4
29
8
Selenium
0.2.2.3
1.0
1.0
1.2
.8
1.6
.4
10.0
.5
Uranium
1.11.11.51.9
2.3
2.7
1.6
2.2
1.2
3.5
1.5
Vanadium Zinc
13 2314 2212 21
100 97
140 110
50 55
83 78
56 51
26 25
140 120
24 31
69

Table 24.--Field measurements and results of laboratory analyses of
[Analyses by U.S. Fish and Wildlife Service. Number in parenthesesin micrograms per gram dry weight; Wt, weight, in grams; Lgth,
Sb, antimony; As, arsenic; Ba, barium; Be, beryllium; B, boron;MS, magnesium; Mn, manganese; Hg, mercury; Mo, molybdenum; Ni,
V, vanadium; Zn, zinc; <, less than; --, no data. Analyses
Site number (fig. 7) and name
1
5
9
11
CheyenneRivernearEdgemont
CheyenneRiver3/4 miledownstreamofAngosturaDam
TapeskasPond
KimmiesPond
Taxa
Carp* (6)CarpfCarp-Carp
Channel catfish
Flathead chub^ (5)Flathead chub* (4)Flathead chub..Flathead chub.Flathead chubJ
Green sunfish^ (17)Green sunfish.Green sunfish..Green sunfish..Green sunfish
Plains killifishi? (17)Plains kiilifish^ (19)Plains killifish* (16)Plains killifish.Plains killifishj
3 Gross invertebrate
Odanata
3 Three square bulrush
3 Softstem bulrush
3 Green sunfish.,Green sunfish_Green sunfish.Green sunfish
Smallmouth bass., (7)Smallmouth bass, (8)Smallmouth bass
* White suckerWhite sucker
Sago pondweed
Gross invertebrate
Softstem bulrush
Blackbird eggsBlackbird eggsBlackbird eggsBlackbird eggs
Gross invertebrate
Narrow leaf cattail
Blackbird eggsBlackbird eggs (3)Blackbird eggs (4)Blackbird eggs (4)
Col- Est. lection Age Wt date (years)
09-07-8804-20-8804-20-8804-20-88
09-07-88
09-07-8809-07-8804-20-8804-20-8804-20-88
09-07-8809-07-8809-07-8804-20-8804-20-88
09-07-8809-07-8809-07-8804-20-8804-20-88
04-20-88
04-20-88
04-20-88
04-20-88
09-08-8809-08-8809-08-8809-08-88
09-08-8809-08-8809-08-88
09-08-8809-08-88
07-27-88
07-27-88
07-27-88
06-29-8806-29-8806-29-8806-29-88
07-27-88
07-27-88
06-29-8806-29-8806-29-8806-29-88
0222
2
22533
__2222
22222
2333
002
33
5.541.051.075.0
46
5.07.5
43.068.070.0
3.2222540.041.0
2.42.52.840.042.0
23.0
30.0
343.5
297.5
48747772
6.08.0
107
157199
429.5
12.0
175.5
3.53.53.53.5
10.0
431.5
3.54.74.55.0
Lgth
71.0151.0128.5142.5
195
84.695.0166.0118.4117.4
53.410211280.866.1
62.164.867.057.764.2
--
136157156151
74.083.0
203
251256
__
--
----""
__
--
-- --
Mstr
80.378.378.779.5
75.0
76.975.074.371.972.1
79.874.975.968.374.0
76.376.474.274.175.0
85.7
85.9
6.3
87.9
75.777.276.273.5
75.076.074.4
79.078.1
88.5
89.3
85.6
80.384.283.183.7
58.8
81.3
79.983.884.882.2
Al1 Sb2
306 <0.1562343270
106 <.l
110114 <.l31
360877
20050.4 <.l53.3 <.l88
190
6,3506,1504,730 <.l1,1801,310
1,620
1,670
1,940
3,410
4195
11024 <.l
110120105 <.l
1,110 <.l852
9,250
1,960
61
__ __9.9 --..
100
73
43
<3
As2
0.5< .2<.2<.2
.3
.1<.2<. 2.3.3
.1< .2.2
< _ 2<.2
1.41.11.21.21.0
.93
1.2
.59
3.0
< l.38.1
<.2
.60
.4
.3
.3
.5
7.3
1.9
.2
--.1--"
.5
.1
.2.1
<. 1
Ba
4.89.26.65.4
1.2
3.64.13.96.914.5
2.62.01.82.94.3
34.332.327.19.611.6
18.7
20.1
15.3
71.9
3.08.33.95.7
3.94.23.5
19.216.8
135
15.5
11.5
--2.0 "
7.9
2.9
1.12.0.59
Be2
0.02<. l<. 1< !
.02
<-:L.03
<_ i<_ i!i
<.!.01
<.01< _ i<.l
.2
.2
.16
.1
.1
<.l
<.l
<.l
<-l
.1
.1
.1
.01
.1
.1
.01
.03<.l
.2
<.!
< !
< . 1
--""
< 2
< !
<. 1<. 1<.!
70

biological data from the Angostura Reclamation Unit study area. 1988
under taxa indicates number of fish or eggs. Concentrations, Length, in millimeters; Mstr, percent moisture; Al, aluminum; Cd, cadmium; Cr, chromium; Cu, copper; Fe, iron; Pb, lead; nickel; Se, selenium; Ag, silver; Sr, strontium; Tl, thallium; performed by ICP, no preconcentration, unless otherwise noted]
B
<l<3<3
<3
<3<33
<3<3
<3<3<3<3<3
55
<335
5
4
14
15
<3<3<3<3
<3<34
3<3
210
5
11
--<2
<4
9.7
--<2<2<2
Cd 1
0.46 .3.2.4
.34
<.6.39.2
<.2<.3
<>5^23.22
<.2<.2
< -5<. 6.23
<.2.2
.6
.3
.3
.5
<i5<.5<. 6.07
< -5<. 6.1
.1<.6
<.3
<.3
<.2
<.2
--
<.5
<.2
--<.2<.2<.2
Cr 1
<0.2 2
<1<:L
<.2
3.84
<1<14.2
3.57
<.2<1<:L
8.47.4.64
32
2
2
10
85
<22
<2<.2
3<21.4
1.6<2
29
2
3.4
<1
<2
<1
--<1<1<1
Cu1
8.90 5.96.44.8
2.0
2.83.032.92.43.2
2.61.72.42.63.8
7.8 2,7.1 2,7.08 2,6.07.5
18 1,
18 1,
6.8 1,
9.1 6,
2.13.6 1,2.31.8
2.22.46.10
4.287.8
7.4 19,
25 1,
2.2
2.2
--"
5.8
1.8
--2.22.81.0
Fe 1
562 379318263
133
13919766
263559
15920267.5
115162
730630220616650
240
280
420
240
560409756.3
9610085.3
643949
300
930
90
169 ""
190
113
18918291
Pb 1
<0.5 <4<4<4
<-5
<5<. 5
<4<4<6
<5<. 5<.5
<4<4
<5<62.1
<4<4
<4
<4
<4
<4
<5<5<5< -5
<5<5< - 5
<.6<s'
5.0
<5
<4
<4
--"
<8
<4
<4<4<4
Mg
1,580 2,1302,0301,890
1,200
1,5401,3301,4901,5801,520
1,7001,5801.6901,3901.870
2,4102,2901,9801,5501,600
1,410
1,400
2,570
3,090
1,6202,0801,8601,750
1.5701,6301.580
2,0101.920
5,240
1,590
1,810
_-419 "
1,080
1,690
392438220
Mn
47.1 50.966.434.2
36.9
33.734.412.064.1
131
48.232.625.929.553.2
601592440120126
1,580
1,710
901
738
1126.4119.76
40.942.811.9
80.674.7
1,230
107
863
6.5 ~~
24
229
4.83.62.2
Hg Mo
0.19 0.42 .23 <1.20 <1.21 <1
.28 1.0
.22 <1
.15 .2
.16 <1
.11 <1
.091 3
.23 <122 < 1.37 .66.32 <1.28 <1
.17 <1
.17 <1
.18 .32
.12 <1
.17 <1
.09 <1
.091 <1
.005 <1
.008 2.0
.14 <1
.31 <1
.19 <1
.25 .33
.13 <1
.13 <1
.15 .61
.12 .2
.13 <1
.016 <2
.075 <1
.005 <1
.028 <1--__ _
.017 <2
.005 <1
.120 <1.250 <1.058 <1
Ni
0.9
<1*1
4.3
<25.7
<1<118
3.4
2.4<1*1
54<. 32
126
3
3
5.7
46
<2<2<2
.7
<2<22.6
.8<2
22
<1
2.0
__<1
--~~
<2
<1
<1<1<1
Se
2.7 3.22.42.8
3.3
5.03.83.13.02.1
3.93.13.92.33.2
2.82.82.52.93.1
3.0
3.1
.1
.2
8.811106.9
121113
1211
2.9
5.8
<.l
3.02.22.62.3
2.8
.2
1.52.92.51.5
Ag
0.076 <2<2<2
.01
<2.02
<2<2<2
<2<. 01!02
<2<2
<2<2
.058<2<2
<2
<2
<2
<2
<2<2<2
.01
<2<2
.02
.02<2
<2
<2
<2
__<2
----
<4
<2
<2<2<2
Sr
220 384399321
157
242230222291253
185206201244323
201190176141160
32.4
27.5
84.8
107
209318278219
186201233
221169
335
33.1
66.7
__12.9
--~~
24.1
70.3
__15.010.15.5
Tl
<0.8 <6<6<6
<.8
<5<. 8
<6<6<6
<5<. 8<. 8
<6<6
<5<5<. 9
<6<6
<4
<4
<4
<4
<5<5<5<.8
<5<5<.9
<.9<5
<4
<5
<4
__<4
--~~
<8
<4
__<4<4<4
V Zn
0.72 277 1.1 289.7 273.7 283
.82 80.7
.4 133
.49 129
.3 94.2
.97 1221.7 99.1
.5 117
.46 110
.49 111
.5 102
.6 152
9.7 1378.9 135.32 125
2.2 1322.4 147
4.3 140
4.4 118
3.4 37
6.8 33
<.3 96.6.8 131.5 98.5.41 108
<.3 78.8.6 81.0.30 45.2
1.5 91.11.9 63.1
16 31
5.2 224
<.3 14
__<.3 64.7
____
<.6 92.7
.4 9.5
-_
<.3 60.1<.3 53.9<.3 36
71

Table 2A.--Field measurements and results of laboratory analyses of biological
Site number (fig. 7) and name Taxa
12 Cheyenne Black crappieRiver Black crappienear Black crappieCusterCounty 656 CarpBridge Carp
CarpCarpCarpCarpACarpCarp,Carp-Carp,Carp,Carp,CarpCarp
Channel catfishChannel catfish.Channel catfishChannel catfishChannel catfish.Channel ~ .-tf ishChannel catfishChannel catfish,Channel catfish?Channel catfish^Channel catfish
Flathead chub3 (3)
Goldeye,Goldeye^Goldeye,GoldeyeGoldeye, Goldeye^Goldeye
Shorthead redhorse.Shorthead redhorse.Shorthead redhorseShorthead redhorseShorthead redhorseShorthead redhorseShorthead redhorseShorthead redhorse.Shorthead redhorse.Shorthead redhorse.Shorthead redhorse^Shorthead redhorseShorthead redhorse.Shorthead redhorseShorthead redhorseShorthead redhorseShorthead redhorse
3 Gross invertebrate
Sago Pondweed
1A Cheyenne Carp,River Carp,near CarpFairburn Carp
CarpCarp
3 Channel catfishChannel catfish,(6)Channel catfish AChannel catfish.Channel catfishChannel catfishChannel catfish
Col lection date (
OA-20-88OA-20-88OA-20-88
OA-20-88OA-20-88OA-20-88OA-20-88OA-20-88OA-20-8809-08-88OA-20-8809-08-8809-08-8809-08-8809-08-8809-08-88OA-20-88
09-08-88OA-20-8809-08-88OA-20-88OA-20-8809-08-88OA-20-88OA-20-8809-08-8809-08-8809-08-88
09-08-88
OA-20-8809-08-8809-08-8809-08-88OA-20-88 09-08-8809-08-88
09-08-8809-08-8809-08-88OA-20-88OA-20-88OA-20-88OA-20-88OA-20-8809-08-8809-08-8809-08-8809-08-88OA-20-8809-08-88OA-20-88OA-20-88OA-20-88
07-27-88
07-27-88
09-1A-8809-1A-8809-1A-88OA-20-88OA-20-88OA-20-88
09-1A-88OA-20-8809-1A-88OA-20-8809-1A-88OA-20-88OA-20-88
Est
years
223
22222233AA555A
12222223333
3
A333A 3A
222223233333AAAA5
23333A
1111122
Wt)
3956
1A8
7782
115122126136A08562665803
1,1251,1751,2501,300
55577A919598
135180192220276
19
27029032A336377 AA3A56
70709710112012A1331782A62A62A831A395A98538615769
18
337
268AA6A6AA79701
1,300
2528AAA970
131139
0
5
5
000
7
0
00
Lgth
150.156.202.
17A.186.207.212.212.203.32336A.367A 17A61A50A79A91.
19320A.2152A2.2A3.237277 .300.296297318
127.
331.322350351366. 3A6368
18719A19022A.236.237.2A2.268.302286293321357.370377.395.A03.
-
-
278335262338.A03.A68.
151167.188200.216277.285.
000
000000
0
0
0
00
00
0
0
0
00000
0
000
-
-
000
5
0
00
Mstr
75.275.272. A
77. A77.878.378.277.077.076. A78.075.976. A75. A75.576.577.1
73.677.37A.875. A76.276.679.080.678.079.079.2
71.2
70.269.172.169.371.5 70.669.5
69.270.769.972. A72.972.969.773.270.271.169.368.372.571.967.273.168.3
87.8
86.3
76.172.871.579.079.582.8
7A.581.275.578.37A.176.377.0
Al1
A7.22236.9
A3118A17812 A7A7370320All13611
2001,000
A77939
2602262601776A371083.2
2031,250
938981
2,620
189.6
118
11 1216
379250A9011669.518888.9
156303230218A75A8.8
A6092.3
183111
7,150
9,370
1,18013
A97396ASA8A7
290369ASS72.7
112129237
Sb2 As2
.3
.2
.31
.50
.1
.3
.2
.53
.A<. 1 <.2
.3<. 1 <.2
<.2.3.65.3.3A
.3*. 1.71
<. 1.1.5
<. 1.2
<.l .A<.l 1.0<.l .95
2.0
<.l.3
<. 1 <.2.A
: - <:l<.l <.2
.2
.31
.2<. 1.3.2
<. 1.1
<. 1 <.2.1
<.l .2<.l .3
.1<.l .6
.3A
.67
.97
2.7
-- 6.7
<.l .A<. 1 <.2<.l .2
.31
.79
.55
<.2!i
<.l .A<. 1
<.l .2.1.1
Ba I
5.71.7 '1.3 '
9.53.23.83. A9.21A.53.88.12.01.18.010.6A. 9
13.3
2.62.15.23.99.06.21.23.27. A9.17.3
21.1
1.1.7A
1.8.87.78 .65.61
6. A5. A7.16. AA. 5A. 6A . A
10.05. A5.05.0
1A2A. 38.6
11.316111.1
55.8
117
17.2A. 87.68.0
18.012.8
A. 519.65.61.22.31A.83.9
Je2
= .01= .01= .01
.02= .01.01.02.03.02.01.02.01.1.1.1.1.037
:-1!02
= .1.01.03
= .1.02.02.065.OA.OAO
= .1
.01
.1
.01
.1
.01
.1
.01
<l
.1
.1
.01
.01
.01
.01
.01
.01
.1
.01
.02
.01
.02
.02
.02
.02
.2
.3
.OA9= .01.02.02.02.03
c>1!o2.02
= .01.02
= .01.01
72

data from the Angostura Reclamation Unit study area. 1988 Continued
B Cd1 Cr 1 Cu 1 Fe 1 Pb 1 M« Mn1 Hg Mo Ni Se Ag Sr Tl V Zn
3<33
3<3<3<333
<3<3<3<3<3<3<33
<3<3<3<34
<33
<347.76
<3
3<3<3<3<3<3<3
<3<3<3<3<33
<33
<2<334
<33
<3<3<3
7.8
285
<3<3<34
<3<3
<3<3<3<3<3<3<3
<.03<.03<.02
.17
.14
.12
.15
.15
.11
.1
.18
.1<. 5<.6<. 6< .6.23
<.6!l3
<. 5.094.11
<. 6.14.15.23.1.16
<-5
.082<.6.1
<. 6.08
<.6.1
<.6<.5<. 6.05.04.05
<.06.04.1
<. 6.1.18.07.2.13.11.09
.3
.3
.17
.24
.17
.088
.40
.61
<. 5.11.23.07.29.07.11
1.41.01.2
1.1.87
1.81.11.81.2<. l2.0<.63
<2<222.7
<21.4
<21.82.4
<2.67.98
<.2.80.75
5.4
1.2<21.2
<2.75
<21.5
4353.2.56
1.44.2.57
1.623.01.41.41.53.44.65.7
9.1
21
.3<. 12.21.31.63.4
22.01.31.4<.21.21.0
1.401.301.20
5.514.606.005.324.734.893.975.481.94.55.46.74.85.98
1.83.841.82.202.661.62.001.902.31.92.1
3.2
2.052.52.01.12.001.41.7
2.31.82.32.753.742.652.632.942.32.12.862.36.743.02.593.632.99
17
7.0
5.103.694.495.595.987.31
2.13.30
16.13.181.82.302.34
14550.873.2
484201263179591367295472129208320901611
1,100
307284467263480544150250727617639
1,660
1176196.98687.793
112
230165285171106199129196234166196346161789947
1,7601,250
5,690
8,740
83488.3
449383916810
254468462127189195257
.5
.5
.4
.5
.4
.4
.5
.5
.4
.5
.4
.5<5<5<5<5*- 5
<6<.5
<5<. 5<. 5
<6<. 5<. 5<. 5.6
< - 5
<5
<.4<5
.6<61.00
<5*-5
<6<5<6
.5
.5
.5
.5
.5
.5<
.5
.5
.5
.7
.5
.5
.5
5
<4
< 5<. 5<.5<. 5.6.7
<5<. 5<. 5<. 5<.5<.5<.5
1,8901,7101,460
1,7601,8001,7701,8201,8601,8801,5001,5601,6301,2701,5101,5301,3901,650
1,3101,7701,3201,6101,8001,7001,8901,7201,6301,9101,810
1,680
1,3201,2301,4401,1901,4301,4201,130
1,4401,4801,4701,6201,7201,6701,5201,6301,3801,3601,4301,5101,5501,4701,2201,3201,100
1,810
5,800
1,8101,4501,5301,5601,6601,780
1,4201,8001,4101,7201,5101,6801,630
33.79.208.86
48.727.823.723.142.843.921.736.613.06.4
146.7
2037.9
22.318.124.818.841.737.117.828.751.953.257.4
64.8
7.395.36.865.35.546.15.47
73.260.589.382.760.563.857.963.263.147.857.282.738.297.094.989.265.1
502
2,430
23.614.715.519.636.325.9
1731.820.317.415.516.223.4
.28 <1
.28 <1
.25 <1
.12 <1
.095 <1
.11 <1
.14 <1
.090 <1
.14 <1
.10 .1
.23 <1
.31 .1
.29 <1
.919 <1
.25 <1
.46 <1
.532 <1
.14 <1
.33 <1
.18 <1
.22 <1
.23 <1
.24 <1
.23 <1
.24 <1
.27 .3
.26 .1
.32 .3
.11 <1
.652 <1
.45 <1
.647 3.9
.624 1
.49 <1
.791 <1
.619 .3
.13 <1
.14 <1
.14 <1
.14 <1
.14 <1
.19 <1
.14 2
.14 <1
.17 <.l
.18 <1
.21 <.l
.19 <.l
.37 <1
.47 .2
.25 1
.37 <1
.30 2
.063 2.0
.016 3
.16 <.l
.30 .31
.21 .1
.16 <1
.48 <1
.753 <1
.23 <1
.24 <1
.12 .2
.22 <1
.32 .65
.32 <1
.35 <1
.79
.46
.60
.70
.72
.97
.911.1.69
<.31.1<. 4
<2<2<5<21.6
<2.70
<21.01.2
<2.40.75
<. 3<. 3<.3
4
.65<2
.63.46
<22.6
<2<27.43.21.0.70
8.7.40.8
51.51.71.715.43.4
11
7.7
21
.6<. 3.9.83
1.01.7
<21.8.8
1.12.63.5.60
5.55.74.6
5.26.66.45.55.45.95.28.03.67.78.06.97.8
10
4.96.55.13.43.64.14.33.24.02.83.7
5.9
4.25.44.44.84.66.65.7
5.45.95.85.24.15.05.94.45.55.15.24.73.45.13.85.84.7
5.8
2.2
5.63.54.95.36.66.6
5.74.96.23.03.32.42.9
<.01<.01<-01
.031
.02
.01
.02
.01
.01
.03
.01<.01
<2<22
<2.01
<2<. 01
<2<. 01<. 01
<2<.01<. 01<. 01<. 01<.01
<2
<.01<2
.01<2<.01
<2<.01
<2<2<2<. 01<.01<.01<. 01<.01<. 01
<2<. 01<.01<. 01<. 01<. 01<. 01<.01
<2
<2
.01
.02
.02<. 01< .01<.01
<2<. 01.02
<. 01<. 01<.01<. 01
263239172
276259247278257261203195176108193166138146
104170118172201163221194163236194
144
88.110211588.510511593.2
19418618223124923020921518717317622622021217011492.1
90.2
561
240230194191203207
125194165201160190192
<<.*
<.<.<.<.<.<.<.<.<.<s'
<5<5<5<
<5<..
<5<. ,<. ,
<5<. ,<. ,<.{<.*<.i
<5
< .<5<.£
<5<. ;
<5<.{
<5<5<5<_ ;<_ f<. f< t ;<.f<.£
<5<.£<.£<_ f
<1<. f<_ f< -
<4
<4
<.£<. 8<.8<_ 5<_ 5<.s
<5<.6<.9<.7<.£<.7<.6
5 .55 .35 <.3
5 1.65 .85 .75 .65 2.55 1.35 1.05 1.73 .49
<. 3.8
3.31.7
5 3.4
1.65 1.2
1.55 1.15 2.5
2.35 .85 1.23 4.63 2.63 3.4
7.8
) <.3<.3
3 .2<. 3
> <_3'.3
3 .2
1.11.11.7
) .9> .6) 1.0) .7> .93! 1.1
1.01.11.3
> .81.8.97
> 1.4.8
25
33
3.6.51
1.41.01.52.1
1.21.21.5.9.90
1.11.1
10798.571.1
266219212288225222222391101234274266277197
80.012378.298.496.793.498.680.989.996.687.2
84.4
10581.6
10680.293.397.586.2
69.064.867.984.179.581.571.270.965.858.164.359.672.968.953.964.857.1
120
37
307345312401401248
104149201134107108102
73

Table 24. Field measurements and results of laboratory analyses of biological
Site number (fig. 7) and name Taxa
14 (Cont.) Flathead chub* (7)Flathead chub-1 (6)Flathead chub-Flathead chub
A GoldeyeGoldeyeGoldeyeGoldeyeGoldeye,GoldeyeGoldeye
A
Green sunfish., (3)Green sunfish..Green sunfish
3 River carpsucker..River carpsucker..River carpsucker.. River carpsucker
SaugerSaugor
Shorthead redhorse-Shorthead redhorse..Shorthead redhorse..Shorthead redhorse..Shorthead redhorse.Shorthead redhorseShorthead redhorseShorthead redhorse.Shorthead redhorse.Shorthead redhorse
A
Smallmouth bass
3 Gross invertebrate
3 Three square bulrush
Sago pondweed
Col- Est. lection Age Wt date (years)
09-14-8809-14-8809-14-8809-14-88
09-14-8804-20-8804-20-8804-20-8804-20-8809-14-8804-20-88
09-14-8809-14-8809-14-88
09-14-8809-14-8809-14-88 09-14-88
04-20-8804-20-88
04-20-8809-14-8809-14-8809-14-8809-14-8809-14-8804-20-8804-20-8809-14-8809-14-88
09-14-88
07-27-88
07-27-88
07-27-88
2344
3343434
211
112 2
34
2222222233
1
7.12.2126
198264.279.279.320.325344.
8.1920
486099
156
443.1,175
93,97116141156209230.230.256352
90
17,
130,
497,
.4,5
,0.0.0.0
.0
,3
.0
.0
.0
.0
.0
.5
.5
.5
Lgth
97115142148
324327355331354357353
83102105
161167188 244
382513
220219226249244279240282301338
182
.6
.0
.0
.0
.0
.0
.0
.7
.0
.0
.0
.0
.0
--
Mstr
69.867.874.171.5
76.167.777.070.770.270.774.7
75.175.576.5
71.472.975.2 74.9
67.469.7
70.370.370.971.271.170.273.067.572.168.2
67.8
87.9
79.7
90.5
Al1 Sb2
2,730 <.l2,060 <.l
812,040
32 <.l8.3
268.6 --9.1
106 <.l58.7 --
165 <.l14
160
2,1401,8302,090 1,050
65.5 4.9
411240280210200221 <.l15432
240 <.l239 <.l
13 <.l
4,230
620
2,340
As2
2.31.6.62
1.8
<.2.2
<. 1.2.1.2
<-l
<.2<. 1.1
.961.0.96 .6
.6
.52
.1<. 1.3.1
<. 1'.3
< . i< f i<.2<.2
.3
1.5
1.2
1.4
Ba
24.820.310.328.2
2.11.42.01.11.42.42.9
2.91.53.1
33.931.035.2 18.1
1.2.98
23.87.09.89.5
12.911.37.52.312.026.5
0.58
51.9
22.9
103
Be2
.099
.070<. 1.1
<.01<. 01<.01<.01<.01<. 01<.01
.01<. 1<.l
.1<. 1
<;J<.01<.01
<.01<. 1<. 1<. 1<. 1.02
<.01< _ 01<.01<.01
<.01
.10
<.l< - 1
*ICP, preconcentration B - pH 6 - was performed for this element. ^Individual Atomic Absorption was performed for this element. "TlCP, no preconcentration, was the only ICP scan performed on this sample. Molybdenum and vanadium were scanned by Atomic Absorption techniques for this sample.
74

data from the Angostura Reclamation Unit study area. 1988 Continued
B Cd 1 Cr 1 Cu1 Fe 1 Pb 1 Mg Mn1 Hg Mo Ni Se Ag Sr Tl V Zn
<3<3<3<3
4<3<3<3<3<3<3
<3<3<3
7.8<3<3<3
<3<3
<2<3<33
<33
<3<333
<3
6.8
14
294
.1
.1<. 6<.6
.1<.02.03.04.03.1.093
.2<.5<.5
<.6<.6<.6<.6
<.02<.02
<.04< . 5<. 6<. 4<. 6.28.07.03.19.20
.2
.3
<.2
.39
.622.336.0
.5
.731.0.45.92
1.41.7
<.l<22
3443
1.6.87
4.232
<122.41.8.3
1.61.0
.85
4.4
5.9
36
3.02.71.63.1
1.21.202.102.971.501.73.33
2.1.94
1.8
3.23.53.32.8
1.301.20
2.742.02.22.62.02.82.872.312.42.6
1.2
17
2.4
7.71
1,5501,220
1051,200
10156.3
12984.073.6
119124
11944
130
1,2501,1801,250
641
85.047.1
36518526031717623318171.7
226211
40.4
2,690
954
2,100
1.7
<5<6
1.4.5.4.4.5.5
<. 5<5<5
<5<5<5<5
<.5< - 5
<. 5<5<5<4<5<. 5<.5<. 5<. 5<.5
<.5
<4
<4
1.7
1,5501,4301,5701,830
1,6501,2501,7201,2101,3801,4701,750
1,6301,2701,620
1,7801,8202,1201,880
1,1501,080
1,6601,5101,4701,6801,5801,4901,7001,3801,6201,510
1,240
1,610
1.520
5,930
55.145.61548.7
9.178.287.777.038.258.319.55
23.78.4
13
50.140.950.434.2
6.314.60
51.347.356.74052.141.171.741.470.373.4
13.4
160
640
251
.082
.11
.17
.12
.618
.26
.46
.745
.35
.35
.682
.25
.24
.31
.11
.11
.14
.599
.341.3
.13
.22
.22
.27
.22
.35
.13
.13
.32
.49
.32
.078
.005
.01
4.02.3
<1<1
<.l<1<1<1<1
.34<1
.3<1<1
<1<1<1<1
<1<1
<1<1<1<1<11.7
<1<1<_ i<-l
.62
2.0
<1
4.7
.41.243
<.4'.30
.41
.20
.52
.72.1
<.3<2<2
<2322
1.0.51
2.4<22
<335.11.7.41.8.6
1.2
4.2
3.0
24.9
3.93.34.04.1
3.92.13.62.33.02.83.0
4.25.25.0
3.54.03.33.0
3.54.2
4.15.34.34.63.74.56.33.53.83.5
5.6
4.3
.46
.80
.01
.02<2<2
.01
.01
.01
.01
.01
.01
.01
.01<2<2
<2<2<2<2
<.01<.01
<.02<2<2<2<2< . 01* . 01<. 01<.01< . 01
<.01
<2
<2
<.01
128130203212
17099.0
13383.597.0
131148
190132170
215214258240
69.256.2
247203211206248195249165233193
101
68.6
73.2
320
<.9<. 9
<5<5
<!<.6<. 6<.6<.6<. 9<.6
<-8<5<5
<5<5<5<5
<.6<.6
< 5<5<5<4<5
.9
.6
.6
.9
.9
<.8
<4
<4
<1
4.63.7.6
4.3
.36<. 3<. 3<.3<.3.3.30
.87
.5
.8
4.64.34.42.4
<.3<.3
1.2.8.8
1.8.77.8.3.99.93
.1
12
1.5
7.43
88.593.284.793.4
14488.7
13892.390.499.5
146
11691.296.2
59.964.474.066.1
49.247.5
78.671.067.68277.582.084.563.480.975.0
52.3
121
11
27.4
75