reconsidering initial pb in titanite in the context of in...
TRANSCRIPT

1
Reconsidering initial Pb in titanite in the context of in situ dating 1
(Revision 1) 2
3
Chloë E. Bonamici* 4
Tyler B. Blum 5
Department of Geoscience, University of Wisconsin-Madison, 1215 W. Dayton St., Madison, 6
WI 53706 7
8
9
Abstract 10
In situ U-Pb dating of titanite, which can preserve trace-element records of various 11
petrologic processes but also incorporates significant initial Pb, has proliferated in recent years. 12
The widespread use of titanite data to construct tectonic P-T-t paths warrants careful assessment 13
of the available dating techniques, as well as attention to the assumptions that underpin the U-Pb 14
data analysis. This contribution provides the first direct comparison of the two major analytical 15
methods – SHRIMP (SIMS) and LA-ICP-MS – for in situ U-Pb titanite dating. A set of well-16
characterized titanite grains from Harrisville, NY, in the Adirondack Mountains were analyzed 17
for U-Th-Pb isotopes along the same cross-grain traverses by SHRIMP and LA-ICP-MS. Both 18
LA-ICP-MS and SHRIMP datasets define approximately linear arrays on the Tera-Wasserburg 19
Concordia (semi-total Pb/U) diagram and would commonly be interpreted as representing a 20
single date population with minor scatter. However, previous studies have suggested that 21
Adirondack titanite actually records two regionally well-defined thermal events, ~50-100 m.y. 22
apart. When titanite data arrays are treated in detail, attempts to determine concordia-intercept 23 * Corresponding author. E-mail: [email protected]. Phone: +1 608 263 7754.
This is a preprint, the final version is subject to change, of the American Mineralogist (MSA) Cite as Authors (Year) Title. American Mineralogist, in press.
DOI: https://doi.org/10.2138/am-2020-7274
Always consult and cite the final, published document. See http:/www.minsocam.org or GeoscienceWorld

2
ages by robust three-dimensional linear regression produce large uncertainties and/or poor fit 24
statistics that suggest that the data are not, in fact, isochronous. Grain-by-grain analysis of U-Pb 25
titanite data shows that different subsets of titanite (determined by additional geochemical and 26
microstructural data) show different patterns of U-Pb data. By comparing predictions for Pb-27
ingrowth evolution paths in Tera-Wasserburg diagrams with observed data, it is possible to 28
recognize both a change in initial Pb composition and Pb loss in the Adirondack titanite U-Pb 29
dataset. This study provides an example of how greater geochronologic detail can be extracted 30
from large in situ U-Pb titanite datasets. Even when precise dates are not recovered, geological 31
processes and events that cause data scatter can be recognized through analysis of U-Pb data 32
patterns using the Tera-Wasserburg diagram. 33
34
Keywords: titanite; U-Pb geochronology; initial Pb correction; LA-ICP-MS; SHRIMP 35
36
37
38
39
40
41
42
43
44
45
46
47
48
This is a preprint, the final version is subject to change, of the American Mineralogist (MSA) Cite as Authors (Year) Title. American Mineralogist, in press.
DOI: https://doi.org/10.2138/am-2020-7274
Always consult and cite the final, published document. See http:/www.minsocam.org or GeoscienceWorld

3
Introduction 49
Titanite is an increasingly popular U-Pb geochronometer and petrogenetic indicator in the 50
study of crystalline rocks (e.g., Aleinikoff et al., 2002; 2004; Chen et al., 2016; Essex and 51
Gromet, 2000; Gao et al., 2012; Garber et al., 2017; Holder and Hacker, 2019; Jung and 52
Hellebrand, 2007; Kirkland et al., 2016, 2017; Kohn, 2017; Kohn and Corrie, 2011; Li et al., 53
2010; Marsh and Smye, 2017; Olierook et al., 2019; Papapavlou et al., 2017, 2018; Scibiorski et 54
al., 2019; Stearns et al., 2015; Storey et al., 2007; Timms et al., 2019). By comparison to zircon, 55
titanite is more reactive and therefore has the potential to display a greater range of petrologic, 56
geochemical, and microstructural variations to inform interpretations of petrogenesis and 57
deformation (Kohn, 2017). The major challenges in applying titanite as a geochronometer are its 58
generally low U and radiogenic Pb concentrations and its tendency to incorporate substantial 59
initial Pb (e.g., Aleinikoff et al., 2002; Frost et al., 2000; Prowatke and Klemme, 2005; Tiepolo 60
et al., 2002). 61
Initial Pb (Pbi) must be corrected for and therefore complicates accurate U-Pb 62
geochronometry of high-Pbi phases, like titanite, apatite, allanite, and rutile (e.g., Chew et al., 63
2014; Kirkland et al., 2017; Rubatto and Scambelluri, 2003; Schoene and Bowring, 2006; 64
Wohlgemuth-Ueberwasser et al., 2017) Here, we use Pbi to mean the Pb that is incorporated into 65
a mineral at the time of crystallization or recrystallization, irrespective of its source and isotopic 66
composition. Pbi includes what is often called “common Pb”, Pb representing long-term 67
ingrowth from actinides incorporated in the primordial Earth (Stacey and Kramers, 1975). Pbi 68
can also include Pb acquired from nearby actinide-partitioning minerals that have ingrown Pb 69
with a non-primordial isotopic composition. The most widely used Pbi corrections derive from 70
the models of Stacey and Kramers (1975) and involve assumptions about Pbi composition based 71
This is a preprint, the final version is subject to change, of the American Mineralogist (MSA) Cite as Authors (Year) Title. American Mineralogist, in press.
DOI: https://doi.org/10.2138/am-2020-7274
Always consult and cite the final, published document. See http:/www.minsocam.org or GeoscienceWorld

4
on the average, reservoir-scale geochemical behavior of Pb – i.e., assumptions about crustal 72
evolution at the scale of an orogenic region, a crustal domain, or even bulk silicate Earth. For Pbi 73
corrections that employ these models to be accurate, the geochronology sample to which they are 74
applied must be compositionally representative of the large-scale reference reservoir, a 75
requirement that is problematic in the context of intragrain U-Pb measurements. Techniques for 76
in situ U-Pb dating, like SIMS/SHRIMP and LA-ICP-MS, complicate Pbi corrections because 77
they sample micron-scale intracrystalline domains (compositional zones), which may now be 78
chemically and isotopically decoupled from their original environments of formation, including 79
coexisting phase assemblages and fluids. For instance, even when Pbi is measured in a low-U 80
phase (e.g., K-feldspar) co-located with a zoned geochronometer, it can be difficult to determine 81
which zone within the geochronometer formed in equilibrium with that phase. 82
A common approach for correcting U-Pb isotope data for Pbi is to calculate a Pbi 83
composition based on an estimated age and a crustal evolution model, often the one- or two-stage 84
model of Stacey and Kramers (1975). The two most common variants of this approach are the 85
‘204 method’ and the ‘207 method’. In the 204 method, Pbi 204Pb/206Pb is can be calculated 86
based on a crustal evolution model; measured in a reference material considered representative 87
of the crustal Pb isotope composition for the sample; or measured in a co-existing low-U phase 88
within the sample, such as K-feldspar (DeWolf and Mezger 1994; McGregor et al., 2019), and 89
the total 204Pb/206Pb is measured to determine Pbi abundance (e.g., Ireland and Williams, 2003; 90
Stern, 1997; Storey et al., 2006; Williams, 1998) (Appendix). In the 207 method, Pbi 207Pb/206Pb 91
is based on either a model value or a measured value in a co-existing phase, as well as an 92
expected age for the titanite (Appendix). The 204 method has traditionally been preferred for 93
data collected by SIMS/SHRIMP analysis, during which 204Pb is readily measured (Stern et al., 94
This is a preprint, the final version is subject to change, of the American Mineralogist (MSA) Cite as Authors (Year) Title. American Mineralogist, in press.
DOI: https://doi.org/10.2138/am-2020-7274
Always consult and cite the final, published document. See http:/www.minsocam.org or GeoscienceWorld

5
2009; Stern, 1997; Storey et al., 2006). The 207 method is commonly preferred for data collected 95
by LA-ICP-MS analysis, during which 204Hg contaminants in the Ar plasma interfere on mass 96
204 (Gehrels et al., 2008; Horstwood et al., 2003; Schoene, 2014; Storey et al., 2006), though 97
recent developments in quadrapole LA-ICP-MS analysis can mitigate this problem. The 98
underpinning assumption for the 204 and 207 method corrections that rely on model values is 99
that the continental crust has evolved as a coherent and largely closed reservoir with respect to U 100
and Pb isotope systematics, and that titanite will crystallize with Pbi composition representative 101
of this bulk crustal reservoir. The idea of an “average” or “bulk” composition, however, can 102
break down at the grain scale, where Pb isotope compositions of individual phases depend on 103
phase-specific U and Pb partitioning. For instance, titanite forming from breakdown of rutile 104
may partition radiogenic Pb from rutile in addition to average, ambient Pb, and thus have a 105
different effective Pbi composition from the bulk rock (Marsh and Smye, 2018). Thus, in situ 106
geochronology of phases that incorporate both U and Pbi require careful evaluation of Pbi 107
sources and possible grain-scale U-Pb fractionation. 108
Another approach for titanite U-Pb data correction is equivalent to the classic isochron 109
regression method and employs the semi-total Pb/U (Tera-Wasserburg) or total Pb/U diagrams 110
(Ludwig, 1998, 2009, 2012). The samples used to define the linear regression can be 111
permutations of grain separates or individual grains but can also be multiple (e.g., Amelin, 2009; 112
Verts et al., 1996), in situ intergrain or intragrain analyses (e.g., Holder and Hacker, 2019; Kohn 113
and Corrie, 2011; Olierook et al., 2018; Storey et al., 2006). In practice, it is common to 114
constrain the Pbi 207Pb/206Pb composition based on a Stacey and Kramers (1975) model and force 115
the regression through this Pbi composition (e.g., Kohn and Corrie, 2011). However, it is 116
becoming more common to treat Pbi composition as a variable that is retrieved from the 117
This is a preprint, the final version is subject to change, of the American Mineralogist (MSA) Cite as Authors (Year) Title. American Mineralogist, in press.
DOI: https://doi.org/10.2138/am-2020-7274
Always consult and cite the final, published document. See http:/www.minsocam.org or GeoscienceWorld
6
regression process (e.g., Kirkland et al., 2017). The Tera-Wasserburg-based isochron regression 118
correction method can avoid the pitfalls of assuming a crustal Pb isotope composition but only 119
works if i) the Pbi composition is uniform in the grains or domains used to determine the 120
isochron ii) measured grains/domains formed at the same time (are isochronous), and iii) in the 121
case that the Pbi composition is not fixed a priori, a sufficiently large range of intracrystalline 122
U/Pb and Pb/Pb ratios are sampled to tightly constrain the regression. With recent detailed 123
characterizations of titanite (e.g., Essex and Gromet, 2000; Bonamici et al., 2015; Garber et al., 124
2017; Marsh and Smye, 2017; Olierook et al., 2018), it is clear that Pbi can and does vary over 125
timescales of titanite growth and/or recrystallization, undercutting the first requirement for the 126
isochron regression approach in some cases. 127
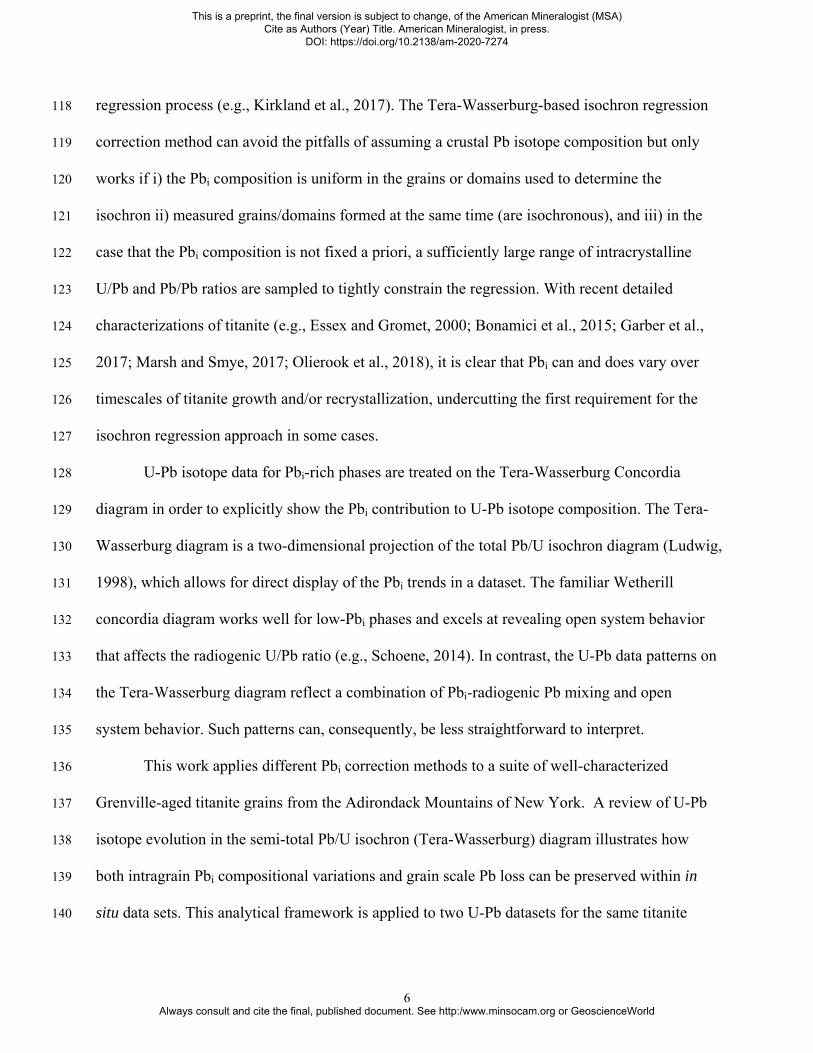
U-Pb isotope data for Pbi-rich phases are treated on the Tera-Wasserburg Concordia 128
diagram in order to explicitly show the Pbi contribution to U-Pb isotope composition. The Tera-129
Wasserburg diagram is a two-dimensional projection of the total Pb/U isochron diagram (Ludwig, 130
1998), which allows for direct display of the Pbi trends in a dataset. The familiar Wetherill 131
concordia diagram works well for low-Pbi phases and excels at revealing open system behavior 132
that affects the radiogenic U/Pb ratio (e.g., Schoene, 2014). In contrast, the U-Pb data patterns on 133
the Tera-Wasserburg diagram reflect a combination of Pbi-radiogenic Pb mixing and open 134
system behavior. Such patterns can, consequently, be less straightforward to interpret. 135
This work applies different Pbi correction methods to a suite of well-characterized 136
Grenville-aged titanite grains from the Adirondack Mountains of New York. A review of U-Pb 137
isotope evolution in the semi-total Pb/U isochron (Tera-Wasserburg) diagram illustrates how 138
both intragrain Pbi compositional variations and grain scale Pb loss can be preserved within in 139
situ data sets. This analytical framework is applied to two U-Pb datasets for the same titanite 140
This is a preprint, the final version is subject to change, of the American Mineralogist (MSA) Cite as Authors (Year) Title. American Mineralogist, in press.
DOI: https://doi.org/10.2138/am-2020-7274
Always consult and cite the final, published document. See http:/www.minsocam.org or GeoscienceWorld

7
grains – one collected by SHRIMP and the other collected by LA-ICP-MS. Comparison of the 141
two in situ analytical techniques allows recognition of non-isochronous data and highlights the 142
relative strengths of each technique. These results reinforce both the complexity and 143
opportunities in microanalysis of geochronometers with significant initial Pb. 144
145
Samples and Methods 146
Titanite-bearing samples used in this study are high-grade, midcrustal tectonites from the 147
Adirondack region of upstate New York. Titanite grains are hosted in metasyenite collected 148
within the Carthage-Colton mylonite zone, a major structure developed at the boundary between 149
Grenville-aged crustal domains. The Adirondack Lowlands to the northwest of the CCMZ record 150
peak metamorphic conditions during the Shawinigan-AMCG phase of the Grenville orogeny at 151
ca. 1150 Ma, whereas the Adirondack Highlands to the east-southeast of the CCMZ record peak 152
metamorphic conditions during the Ottawan phase at ca. 1050 Ma (Mezger et al., 1993; 1991a; 153
1991b). The tectonic context of the CCMZ has been previously discussed by Mezger et al. 154
(1991a), Mezger et al. (1991b), Mezger et al. (1992), Mezger et al. (1993), Cartwright et al. 155
(1993), Streepey et al. (2001), Baird and MacDonald (2004), Johnson et al. (2004), Johnson and 156
Selleck (2005), McLelland et al. (2010), and Bonamici et al. (2014). Structural, petrologic, and 157
geochemical characteristics of the specific Harrisville location of samples for the current study 158
have been addressed by Lamb (1993), Cartwright et al. (1993), Baird and MacDonald (2004), 159
Heumann (2004), Johnson and Selleck (2005), Bonamici et al. (2014), and Bonamici et al. 160
(2015). 161
Regional geochronology provides constraints within which to study and interpret U-Pb 162
titanite data from the CCMZ. Bonamici et al. (2015) documented the intragrain zoning patterns 163
This is a preprint, the final version is subject to change, of the American Mineralogist (MSA) Cite as Authors (Year) Title. American Mineralogist, in press.
DOI: https://doi.org/10.2138/am-2020-7274
Always consult and cite the final, published document. See http:/www.minsocam.org or GeoscienceWorld

8
of SHRIMP U-Pb dates within six Harrisville titanite samples (Table 1). Four different 164
generations of titanite were distinguished on the basis of microstructure and reinforced on the 165
basis of chemistry and oxygen-isotope zoning patterns (Bonamici et al., 2014, 2015). These 166
generations are interpreted to be igneous titanite crystallized in the protolith syenite at ~1160 Ma 167
(Type-1); igneous grains variably reset during later granulite-facies metamorphism at ca. 1050 168
Ma (Type-2); titanite from veins that likely intruded at ca. 1050 Ma (Type-3); and igneous 169
titanite with metamorphic overgrowths (Type-4). Table 1 provides grain descriptions and further 170
information summarizing these interpretations. LA-ICP-MS data presented in this study 171
significantly expand the number of Harrisville titanite grains investigated for U-Pb zoning. U-Pb 172
ratios were measured in a total of fourteen titanite grains, including one Type-1 grain, five Type-173
2 grains, six Type-3, and two Type-4 grains. 174
Titanite was analyzed in thin sections of metasyenite cut into one-inch rounds. Thus, all 175
analyzed titanite grains are in situ with respect to their host microstructures and phase 176
assemblages. Grains of U-Pb titanite reference material BLR-1 (accepted 206Pb/238U age 1047 177
0.4 Ma, Aleinikoff et al., 2007) were embedded in every sample each mount. BLR-1 was used 178
for calibration under the designation BLS at the Arizona Laserchron Center, along with 179
secondary reference material Ecstall West zircon (accepted 206Pb/238U age 91.5 1 Ma, Butler et 180
al., 2002), also embedded in each analysis mount. Weighted average ages showing the 181
performance of the reference material grains in each mount during LA-ICP-MS analysis are 182
compiled in the Supplementary Materials. Within 2 analytical uncertainties, the dates 183
determined for these reference materials during SHRIMP and LA-ICP-MS analysis overlap the 184
accepted ages. 185
This is a preprint, the final version is subject to change, of the American Mineralogist (MSA) Cite as Authors (Year) Title. American Mineralogist, in press.
DOI: https://doi.org/10.2138/am-2020-7274
Always consult and cite the final, published document. See http:/www.minsocam.org or GeoscienceWorld

9
SIMS U-Pb dates were collected with the SHRIMP II instrument at the Research School 186
of Earth Sciences (RSES) at the Australian National University using a focused, 4.5-nA O2- 187
primary beam. Data were acquired in single-collector mode with seven successive scans through 188
species 200CaTi2O4, 204Pb, 206Pb, 207Pb, 208Pb, 238U, 248ThO, and 254UO, with each individual 189
analysis taking 20 minutes. SHRIMP analysis sputtered pits 35-40 µm in diameter and 2-3 µm 190
deep (Fig. 1A). Grains of U-Pb titanite standard BLR-1 were analyzed at regular bracketing 191
intervals throughout each analysis session. Total 238U/206Pb, 207Pb/206Pb, and 204Pb/206Pb ratios 192
reported in Table S1 are corrected for U/Pb instrumental fractionation but are not corrected for 193
Pbi. SHRIMP radiogenic ratios and 206Pb/238U dates were initially reported in Bonamici et al 194
(2015), where they were corrected for Pbi with the 204 method using 204Pb/206Pb measured on 195
long-term RSES lab reference material, Broken Hills feldspar (206Pb/204Pb = 16.00, 207Pb/204Pb = 196
15.39, and 208Pb/204Pb = 35.66; Gulson, 1984). For the current study, SHRIMP data have been 197
re-corrected (Table S1) with the 204 method using both (1) the Stacey and Kramers (1975) 198
model and (2) the K-feldspar Pb-Pb ratios reported by Mezger et al. (1992) for a shear zone in 199
the Diana metasyentite (sample 90-49: 206Pb/204Pb = 17.132, 207Pb/204Pb = 15.427, and 200
208Pb/204Pb = 36.461). The dates corrected with Mezger et al. (1992) are preferred because these 201
Pb values come from the same outcrops as the titanite samples used in the current study. To 202
facilitate comparison with LA-ICP-MS data, the SHRIMP data have also been corrected with the 203
207 method (Table S1) using the Stacey and Kramers (1975) Pb isotope model implemented 204
through the Arizona Laserchron Center spreadsheet software, “Titanite AgeCalc 207Pbc”. 205
Prior to LA-ICP-MS analysis, SHRIMP pits and carbon coats were removed from 206
samples by repolishing with 1-µm diamond-grit suspension. Samples were cleaned with several 207
cycles of sonication in distilled water and ethanol. LA-ICP-MS U-Pb dates were collected on a 208
This is a preprint, the final version is subject to change, of the American Mineralogist (MSA) Cite as Authors (Year) Title. American Mineralogist, in press.
DOI: https://doi.org/10.2138/am-2020-7274
Always consult and cite the final, published document. See http:/www.minsocam.org or GeoscienceWorld

10
Nu HR ICP-MS coupled to a Photon Machines Analyte G2 Excimer laser at the Arizona 209
Laserchron Center at the University of Arizona. Data were acquired in static multicollector mode, 210
with 202Hg and 204Pb collected on ion counters and 206Pb, 207Pb, 208Pb, 238U, and 232Th collected 211
on 1011-ohm resistor Faraday cups. Each analysis included 15 seconds of background counting, 212
15 one-second laser pulses for sample signal and 30 seconds of wash-out time for a total of 213
approximately 60 seconds per analysis. Laser ablation produced pits 35-40 µm in diameter and 214
~15 µm deep (Fig. 1B). Grains of U-Pb titanite standard BLR-1 (206Pb/238U age 1047 Ma, 215
Aleinikoff et al., 2007; also called BLS in the Laserchron lab) were analyzed at regular 216
bracketing intervals throughout each analysis session. Total 238U/206Pb, 207Pb/206Pb, and 217
204Pb/206Pb ratios reported in Table S2 were corrected for U/Pb instrumental fractionation, as 218
well as the 204Hg interference on 204Pb. The 204Pb interference correction is accomplished by 219
subtraction of mass 204 counts that are inferred to come from 204Hg based on the measurement 220
of mass 202 and an assumed natural 202Hg/204Hg ratio of 4.34 (Gehrels et al. 2008). Data in 221
Table S2 and Figures 2, 3, 4, and 6 are not corrected for Pbi. Radiogenic ratios and 206Pb/238U 222
dates reported for LA-ICP-MS data (Table S2) were corrected for Pbi by an iterative 207 method 223
implemented using internal Arizona Laserchron Center spreadsheet-based software (“Titanite 224
AgeCalc 207Pbc”). This correction uses the raw 206Pb/238U ratio before Pbi correction as an 225
initial estimate of expected age and the Stacey and Kramers (1975) model for an estimate of the 226
Pbi composition (Appendix). The 207-corrected age then recalculated several more times with 227
the 207-corrected age from the previous iteration used as the expected age for each subsequent 228
iteration. For titanite U-Pb measurements in this study, the calculation rapidly converges to a 229
stable corrected age within ≤5 iterations. To facilitate comparison with the SHRIMP data, the 230
This is a preprint, the final version is subject to change, of the American Mineralogist (MSA) Cite as Authors (Year) Title. American Mineralogist, in press.
DOI: https://doi.org/10.2138/am-2020-7274
Always consult and cite the final, published document. See http:/www.minsocam.org or GeoscienceWorld

11
LA-ICP-MS data have also been corrected with the 204 method (Table S2) using the Stacey and 231
Kramers (1975) model. 232
Data are compared using total isotope ratios, uncorrected for Pbi, on Tera-Wasserburg 233
Concordia plots. Error ellipses in Figures 2, 3 and 9 represent 2σ analytical uncertainties, 234
including counting statistics and U/Pb instrumental fractionation (as calibrated with titanite 235
BLR/BLS reference material). Uncertainties on 204Pb/206Pb for SHRIMP data have been 236
conservatively estimated at 3% (1σ), which is double the largest 207Pb/206Pb uncertainty reported 237
for SHRIMP data. Uncertainties on all other ratios are as reported by the respective lab (Tables 238
S1 and S2). Error correlations between 238U/206Pb, 207Pb/206Pb, and 204Pb/206Pb ratios are 239
considered to be small and are neglected for the sake of more direct comparison of data arrays. 240
Two- and three-dimensional linear regressions were implemented in Isoplot 3.75 using 241
Model 1, which weights each measurement by the inverse square of the analytical errors under 242
the assumption that analytical errors are the only source of uncertainty in the data (Ludwig, 243
2012). A Model 1 regression fit is considered reasonable if the probability of fit is ≥ 0.05. 244
Probability of fit for each regression is used as an indicator of additional (geological) sources of 245
scatter. Other models for regression (Models 2 and 3) were not considered to avoid additional 246
assumptions about sources of uncertainty (beyond analytical). 247
248
Results 249
When considered in aggregate, LA-ICP-MS and SHRIMP datasets for Harrisville titanite 250
grains define steep, approximately linear trends on Tera-Wasserburg or semi-total Pb/U diagrams 251
(Fig. 2). The LA-ICP-MS data array spread is larger for two reasons: 1) more than twice as many 252
titanite grains were analyzed by LA-ICP-MS as by SHRIMP (Fig. 3) and many of the grains 253
This is a preprint, the final version is subject to change, of the American Mineralogist (MSA) Cite as Authors (Year) Title. American Mineralogist, in press.
DOI: https://doi.org/10.2138/am-2020-7274
Always consult and cite the final, published document. See http:/www.minsocam.org or GeoscienceWorld

12
analyzed by laser had lower Pbi that extends the array farther toward concordia; and 2) the large 254
207Pb/206Pb uncertainties on the LA-ICP-MS data for the highest-Pbi grains appear to stretch the 255
laser data array vertically. However, close comparison of the grains analyzed by both LA-ICP-256
MS and SHRIMP in Figure 3, shows that, regardless of error ellipse shape, the individual data 257
points are centered at nearly identical locations. 258
Tera-Wasserburg-based, two-dimensional regression of the aggregate SHRIMP dataset 259
yields a concordia intercept age of 1138 ± 19 Ma with MSWD = 4.4, whereas 2D regression of 260
the aggregate LA-ICP-MS dataset yields a concordia intercept age of 1067± 12 Ma with MSWD 261
= 2.0 (Table S3). We note that the regression of SHRIMP data yield a MSWD indicating well 262
scatter beyond that expected based on analytical uncertainty alone, whereas that the precision of 263
LA-ICP-MS data result in a more ambiguous MSWD value. No concordia-intercept ages can be 264
obtained for either aggregate dataset (LA-ICP-MS or SHRIMP) using a total Pb/U isochron 265
(linear 3D) regression that includes the 204Pb/206Pb ratio (Table 1). 266
For Harrisville titanite samples, greater 238U/206Pb (average 2.3% 1σ) than 207Pb/206Pb 267
analytical uncertainties (average 1.0% 1σ) suggest that the U/Pb calibration dominates overall 268
SHRIMP analytical uncertainties. In contrast, greater 207Pb/206Pb (average 5.1% 1σ) than 269
238U/206Pb (average 2.6% 1σ) analytical uncertainties indicate that abundance sensitivity 270
dominates overall LA-ICP-MS analytical uncertainties. 271
On a grain-by-grain basis, both SHRIMP and LA-ICP-MS U-Pb measurements show a 272
range of behavior, with several grains having tightly clustered data (i.e. showing limited 273
238U/206Pb or 207Pb/206Pb dispersion) (Fig. 3). For those grains with tightly clustered spot analyses, 274
both 2D and 3D regressions of the U-Pb measurements yield large concordia-intercept age 275
uncertainties (> ±50 Ma), as well as large MSWD values for SHRIMP data sets. Titanite grains 276
This is a preprint, the final version is subject to change, of the American Mineralogist (MSA) Cite as Authors (Year) Title. American Mineralogist, in press.
DOI: https://doi.org/10.2138/am-2020-7274
Always consult and cite the final, published document. See http:/www.minsocam.org or GeoscienceWorld

13
from sample HA13 are an exception, showing sufficient analysis dispersion to provide 277
moderately tight constraints on concordia-intercept ages regressed from LA-ICP-MS data (Fig. 278
3). SHRIMP U-Pb measurements for the HA13 S2 grain show a similar dispersion to LA-ICP-279
MS measurements and similar concordia-intercept age but with high MSWD values. 280
Results from 3D linear isochron regressions for each titanite Type are described below 281
with respect to the concordia-intercept age and the regressed Pbi 207Pb/206Pb value (Table 1, Fig. 282
4). Several unconstrained 3D regressions produce negative 207Pb/206Pb (y-axis) intercept values 283
because tightly clustered data do not adequately constrain the linear regression toward the 284
common Pb plane, resulting in a very large range of possible intercept values with a negative 285
mean. Several constrained 3D regressions produce undefined 207Pb/206Pb values because very 286
large uncertainties push the mean regressed 206Pb/204Pb value to zero (Table 1), the lowest 287
allowed 206Pb/204Pb value for a constrained regression solution. Table S3 shows 2D regression 288
results, but these are not discussed in the text in order to avoid redundancy and because the larger 289
uncertainties on the 2D regression results generally hide details within the datasets. 290
Type 1 titanite results 291
Constrained 3D linear concordia intercept dates for the Type-1 grain for both LA-ICP-292
MS and SHRIMP data are > 1200 Ma, with large uncertainties of > 200 m.y. (Table 1). The 293
unconstrained regression of LA-ICP-MS data intercepts concordia within analytical uncertainties, 294
but the unconstrained regression of more precise SHRIMP data set does not (Fig 4B). The Type-295
1 titanite grain has both the highest and largest range of 204Pb/206Pb ratios (Tables S1 and S2). 296
The Type-1 grain also has the lowest overall U, Th, and Pb concentrations. LA-ICP-MS data 297
points from this low-Pb grain all overlap significantly within error and no interpretable 298
207Pb/206Pb intercept is obtained with either constrained or unconstrained 3D regressions (Table 299
This is a preprint, the final version is subject to change, of the American Mineralogist (MSA) Cite as Authors (Year) Title. American Mineralogist, in press.
DOI: https://doi.org/10.2138/am-2020-7274
Always consult and cite the final, published document. See http:/www.minsocam.org or GeoscienceWorld

14
1). An unconstrained regression of the more precise SHRIMP data yields an upper intercept 300
207Pb/206Pb value of 0.967, similar to the Stacy and Kramers common Pb value of 0.922, though 301
with large uncertainties (Table 1). 302
Type 2 titanite results 303
Type-2 titanite grains yield tightly clustered U-Pb data points, both within individual 304
grains (Fig. 3) and between grains (Fig. 2). Constrained 3D linear regressions of LA-ICP-MS 305
data return concordia-intercept ages of 1143-1111 Ma, whereas regressions of SHRIMP data 306
return consistently older concordia-intercept ages of 1182-1146 Ma (Table 1). Both methods 307
produce intercept-age uncertainties of 48-130 m.y., and the SHRIMP data regressions are also 308
associated with large MSWD values. Both constrained and unconstrained regressions yield 309
largely uninterpretable 207Pb/206Pb upper intercept values (Table 1), with the possible exception 310
of grain HA09A S15, which gives values consistent with a mixture of primordial (Stacey and 311
Kramers common Pb) and radiogenic Pbi. 312
Type 3 titanite results 313
Aggregated Type-3 data show greater dispersion than Type-2 data, but data for individual 314
Type-3 grains are more clustered than the aggregate dataset (Fig. 3). Constrained 3D isochron 315
regressions of LA-ICP-MS Type-3 data yield the youngest concordia intercept ages, ranging 316
from 935 Ma to 1101 Ma (Table 1, Fig. 4). Some of the older LA-ICP-MS dates have moderate 317
analytical uncertainties of 28-38 m.y., but many LA-ICP-MS dates are associated with large 318
analytical uncertainties of 63-190 m.y.. Constrained 3D regression for the one SHRIMP-319
analyzed Type-3 grain produces an imprecise concordia intercept age of 1220 ± 370 Ma. 320
Constrained and unconstrained regressions for most LA-ICP-MS-analyzed grains produce 321
207Pb/206Pb upper intercepts intermediate between the expected radiogenic value (~0.08) and the 322
This is a preprint, the final version is subject to change, of the American Mineralogist (MSA) Cite as Authors (Year) Title. American Mineralogist, in press.
DOI: https://doi.org/10.2138/am-2020-7274
Always consult and cite the final, published document. See http:/www.minsocam.org or GeoscienceWorld

15
expected Stacey and Kramers common-Pb model value (~0.92), though often with very large 323
uncertainties. 324
Type 4 titanite results 325
Data from the Type-4 grains, in aggregate and individually, define approximately linear 326
or apparently offset linear trends. Whereas overlap in LA-ICP-MS data for grain HA13A-S1 327
obscures distinct internal data populations, three data populations can be distinguished in both 328
the LA-ICP-MS and SHRIMP data for HA13A-S2 (Fig. 3). Constrained and unconstrained 329
regressions of both LA-ICP-MS and SHRIMP data produce very similar Tera-Wasserburg plane 330
intercepts and concordia intercept ages at 1124-1128 Ma (Table 1, Fig. 4). Uncertainties on LA-331
ICP-MS data are ~25 m.y. and those for the SHRIMP data are three times larger at 75 m.y.. In 332
addition, the MSWD value for the regression of the SHRIMP data is much larger than the 333
MSWD value for LA-ICP-MS data. Most constrained and unconstrained regressions for both 334
analytical techniques produce 207Pb/206Pb upper intercepts intermediate between the expected 335
radiogenic value (~0.08) and the expected Stacy and Kramers common Pb model value (~0.92). 336
The constrained regression for the SHRIMP-analyzed grain produces a 207Pb/206Pb upper 337
intercept greater than the expected Stacy and Kramers common Pb model value, though with 338
large uncertainties. 339
Zoning trends within titanite grains 340
In situ U-Pb data can also be assessed in the context of their spatial distribution within 341
titanite grains (Fig 5; Supplemental Figures; Bonamici et al., 2015). The lower precision of LA-342
ICP-MS measurements precludes definitive recognition of intragrain zoning as the oldest and 343
youngest Pbi-correct dates determined for any given grain overlap within 2σ uncertainties; 344
however, similarity of intragrain trends in grains for which both more precise SHRIMP data and 345
This is a preprint, the final version is subject to change, of the American Mineralogist (MSA) Cite as Authors (Year) Title. American Mineralogist, in press.
DOI: https://doi.org/10.2138/am-2020-7274
Always consult and cite the final, published document. See http:/www.minsocam.org or GeoscienceWorld

16
LA-ICP-MS data exist (Fig. 5), suggests that the LA-ICP-MS data are indicative of zoning. 346
Generally, both LA-ICP-MS and SHRIMP yield older 206Pb/238U dates toward grain centers and 347
younger dates near grain edges (Fig 5; Supplemental Figures); however, there is considerable 348
intragrain variability in Pbi-corrected dates (particularly for SHRIMP data), which range from 349
pre-Shawinigan (>1180 Ma) to post-Ottawan (975 Ma). This result is the same, whether the Pbi 350
model is the traditional Stacey and Kramers (1975), the ANU lab Broken Hill feldspar, or the 351
Mezger et al. (1992), providing that the same Pbi composition is used for all corrections (Table 352
S1). For a given grain, most Pbi-corrected dates differ significantly from the mean constrained 353
concordia-intercept date (Fig 5; Supplemental Figures); however, almost all dates overlap within 354
large uncertainties associated with both the individual Pbi date corrections and the isochron 355
regressions. 356
357
Discussion 358
Comparison of LA-ICP-MS and SHRIMP analysis of titanite 359
The collection and comparison of parallel U-Pb data sets for Harrisville titanite allows us 360
to examine the tradeoffs in analytical precision and data collection rates between the two 361
techniques for these grains. In general, both techniques recover very similar ranges in isotope 362
ratios, but the higher analytical precision of the SHRIMP data resolves intragrain complexity that 363
is obscured by the lower analytical precision of the LA-ICP-MS data. Consequently, the 364
precision of dates determined through individual Pbi correction is generally lower for LA-ICP-365
MS than for SHRIMP (Fig. 5; Tables S1 and S2), reflecting larger uncertainties in the Pb isotope 366
measurements by LA-ICP-MS and their propagation through the 207-method correction. On the 367
other hand, the precision of concordia intercepts is generally poorer for SHRIMP than for LA-368
This is a preprint, the final version is subject to change, of the American Mineralogist (MSA) Cite as Authors (Year) Title. American Mineralogist, in press.
DOI: https://doi.org/10.2138/am-2020-7274
Always consult and cite the final, published document. See http:/www.minsocam.org or GeoscienceWorld

17
ICP-MS (Fig. 4), reflecting greater resolvable geologic scatter in the more precise SHRIMP data 369
and thus poorer fits for linear regressions. 370
In situ U-Pb data collected within titanite grains are commonly assumed to represent 371
single age and Pbi populations and are treated as such through the isochron regression method. 372
The facts that the aggregated Harrisville data (1) cannot be fit with a 3D regression and (2) yield 373
dates ~70 m.y. apart for 2D regressions (Table 2) point toward significant grain-to-grain age 374
and/or Pbi heterogeneity. Dates determined by the isochron regression method for within-grain 375
U-Pb data generally overlap the time period spanning the two known orogenic events in the 376
Adirondack Mountains, from beginning of the AMCG-Shawinigan phase at ca. 1180 Ma through 377
the end of the Ottawan phase at ca. 1010 Ma (Fig. 4). The poor precision on these regression 378
dates, however, rarely allows a given date to be clearly assigned to one orogenic phase or the 379
other, let alone to a restricted period within one of the orogenic phases (Figs. 3, 4). The spread of 380
regression-determined dates is consistent with the conclusion from previous work that the 381
Harrisville titanite grains record both the AMCG-Shawinigan and Ottawan events (Bonamici et 382
al., 2015). It also suggests that regressions are not true isochrons, but rather that they are fits to 383
mixed, non-isochronous data that are variably resolved with different in situ measurement 384
techniques (see below for further discussion). Larger analytical uncertainties for LA-ICP-MS 385
data, especially, mask the probable geologic scatter within the data, producing isochron 386
regressions with MSWD values ≤ 1 and probabilities of fit > 0.05. Only relatively large 387
propagated uncertainties, typically ≥ ±50 m.y., suggest the presence of geologic scatter within 388
the LA-ICP-MS datasets. By comparison, geologic scatter is more apparent in regressions of 389
SHRIMP data for the same titanite grains, which produce large MSWD values, probabilities of 390
fit close to zero, and large propagated uncertainties (Fig. 3). 391
This is a preprint, the final version is subject to change, of the American Mineralogist (MSA) Cite as Authors (Year) Title. American Mineralogist, in press.
DOI: https://doi.org/10.2138/am-2020-7274
Always consult and cite the final, published document. See http:/www.minsocam.org or GeoscienceWorld

18
Regression-determined dates and Pbi-corrected dates for a given grain can be compared 392
to check for internal consistency between the analytical and correction methods. An ideal titanite 393
grain that has crystallized at a single time, though with a range of Pbi concentrations, should 394
produce Pbi-corrected dates that are identical to one another and to the regressed concordia-395
intercept date. Differences in Pbi-corrected dates and/or discrepancy between Pbi-corrected and 396
regression-determined concordia-intercept dates would suggest internal zoning and non-397
isochronous grain crystallization. Pbi-corrected dates are, in fact, not identical across Adirondack 398
titanite grains. Intragrain zoning of Pbi-corrected dates is statistically resolvable along most 399
traverses measured by SHRIMP, though not by LA-ICP-MS (Fig. 5); nonetheless, the similarity 400
between several SHRIMP and LA-ICP-MS profile shapes suggests that LA-ICP-MS is detecting 401
similar isotopic variability. Similarly, Pbi-corrected dates and regressed concordia-intercept dates 402
for a given grain generally overlap within the propagated uncertainties of the respective 403
correction methods (Fig. 5). However, the resolvable intragrain zoning of Pbi-corrected SHRIMP 404
dates and the poor fit metrics for many of the concordia-intercept regressions suggest that this 405
overlap is an artefact of temporally close events (≤100 m.y. apart at greater than 1 Ga) and 406
relatively large analytical uncertainties on the in situ data. 407
The LA-ICP-MS and SHRIMP datasets for several Adirondack titanite grains also allow 408
for assessment of differential Pb isotope sensitivity and its potential effects on the accuracy of 409
Pbi-corrected dates. Specifically, differential sensitivity to higher-abundance 206Pb relative to 410
lower-abundance 204Pb or 207Pb could skew measured Pb/Pb ratios used for Pbi corrections. A 411
quick check for differential Pb isotope sensitivity is to compare 204-corrected versus 207-412
corrected dates for both the SHRIMP and LAICPMS datasets. SHRIMP data corrected with the 413
204 and 207 methods yield dates that are essentially identical (Table S1), suggesting that 414
This is a preprint, the final version is subject to change, of the American Mineralogist (MSA) Cite as Authors (Year) Title. American Mineralogist, in press.
DOI: https://doi.org/10.2138/am-2020-7274
Always consult and cite the final, published document. See http:/www.minsocam.org or GeoscienceWorld

19
SHRIMP Pb/Pb ratios are not skewed by differential Pb isotope sensitivity. LA-ICP-MS data 415
corrected by the 204 and 207 methods yield different dates, with those corrected by the 204 416
method always systematically younger (Table S2). Differences between the LA-ICP-MS and 417
SHRIMP datasets can be compared graphically by plotting total 207Pb/206Pb vs. total 204Pb/206Pb 418
covariation trends (Fig. 6). The slopes of the covariation trends are markedly different, with the 419
steeper slope for the LA-ICP-MS data arising from the systematically lower 204Pb/206Pb values 420
and indicating lower 204Pb sensitivity relative to SHRIMP. On the other hand, the similar range 421
of 207Pb/206Pb measured by LA-ICP-MS and SHRIMP indicates that LA-ICP-MS-determined 422
207Pb/206Pb ratios are unaffected by differential Pb isotope sensitivity in these samples. Note that 423
for the purposes of this discussion, the term Pb sensitivity includes the effects of instrument 424
sensitivity, the 204Hg interference correction applied to LA-ICP-MS-measured ratios, and 425
downhole Pb isotope fractionation. Because LA-ICP-MS 204Pb/206Pb ratios but not 207Pb/206Pb 426
ratios are affected, correction for 204Hg, which affects only the 204Pb/206Pb ratio, seems a likely 427
culprit for creating a differential Pb isotope sensitivity problem. This comparison suggests 428
cautious application of 204Hg corrections to LA-ICP-MS data for high Pbi phases and use of the 429
207 method if differential Pb isotope sensitivity is suspected. 430
431
U-Pb isochron evolution on the Tera-Wasserburg (semi-total Pb/U) diagram 432
Ideally, when a set of titanite grains or domains crystallizes at the same time, the U-Pb 433
data for this population will define sloped linear arrays in Tera-Wasserburg space. Such arrays 434
are often referred to as discordia by analogy with the familiar Wetherill-diagram zircon discordia, 435
which form as a result of changes to the U/Pb ratio due to open-system U or Pb loss. In titanite 436
with no Pbi, open-system modification of the U/Pb ratio would also produce a sloped, discordant 437
This is a preprint, the final version is subject to change, of the American Mineralogist (MSA) Cite as Authors (Year) Title. American Mineralogist, in press.
DOI: https://doi.org/10.2138/am-2020-7274
Always consult and cite the final, published document. See http:/www.minsocam.org or GeoscienceWorld

20
array of data (Tera and Wasserburg 1974; Schoene 2014). However, most titanite incorporates 438
Pbi, and sloped, linear arrays are more often mixing arrays treated as isochrons resulting from 439
variable U/Pbi ratio (µ). If the data are precise and well-spaced (have a range of U/Pbi), then a 440
regression provides a tightly constrained upper y-axis intercept at the shared Pbi 207Pb/206Pb 441
value and lower intercept with the Tera-Wasserburg concordia at the age of crystallization. 442
The Tera-Wasserburg concordia is the locus of the time-integrated 207Pb/206Pb and 443
238U/206Pb ratios resulting from U decay in the absence of Pbi; each point along the concordia is 444
an implicit function of initial 235U/238U, and thus time of crystallization. Paths in Figure 7A show 445
the temporal evolution of radiogenic 207Pb/206Pb and 238U/206Pb ratios for several initial 235U/238U 446
ratios. For titanite crystallized since ~3.0 Ga, the temporal evolution paths are nearly parallel to 447
the 238U/206Pb axis because of the much greater relative change in 238U/206Pb as compared to 448
207Pb/206Pb during radiogenic Pb ingrowth. 449
The addition of Pbi to titanite constrains the starting points of the temporal evolution 450
paths to a fixed 207Pb/206Pb value (Fig. 7B). The shapes of the evolution paths depend on the 451
evolving relative proportions of Pbi with a fixed 207Pb/206Pb composition and radiogenic Pb, 452
growing in with a time-varying 207Pb/206Pb composition (Fig. 7B, pale gray curves). For 453
proportionally higher Pbi, evolution paths are steeper, reflecting the dominance of the fixed 454
207Pb/206Pb value of the Pbi. For lower Pbi, evolution paths are shallower, reflecting dominance 455
of the time-varying radiogenic 207Pb/206Pb ratio. Titanite domains that crystallize at the same 456
time and have remained closed throughout their evolution but contain varying concentrations of 457
Pbi will defined a mixing line between the Pbi composition and the radiogenic Pb composition at 458
any given time. This mixing line will evolve in a systematic way with time, sweeping toward 459
lower 207Pb/206Pb and 238U/206Pb, and is thus an isochron (Fig. 7B, dark gray lines). When the Pbi 460
This is a preprint, the final version is subject to change, of the American Mineralogist (MSA) Cite as Authors (Year) Title. American Mineralogist, in press.
DOI: https://doi.org/10.2138/am-2020-7274
Always consult and cite the final, published document. See http:/www.minsocam.org or GeoscienceWorld

21
composition incorporated into titanite has a lower 207Pb/206Pb, the initial Pb-radiogenic Pb 461
mixing line and the resulting isochrons will have shallower slopes (Fig. 7C, blue lines). 462
Consequently, linear arrays of titanite U-Pb data that show changes in slope (curve or bend) or 463
appear to intersect with other linear arrays are indicative of changes in Pbi composition during 464
crystallization or recrystallization. 465
Fractionation of U and Pb results in titanite with variable U/Pb ratio and can arise from 466
differential mobility of these elements during crystallization, recrystallization or intragrain 467
diffusion. In titanite that also incorporates Pbi, fractionation of U and Pb manifests as 468
subhorizontal data arrays that approximately parallel the 238U/206Pb axis on the Terra-Wasserburg 469
diagram (Fig. 7D, E). Changes in U/Pb ratio that occur long after initial titanite crystallization 470
should generate more horizontal arrays than changes to U/Pb ratios that occur shortly after 471
crystallization (Fig. 7E; Tera and Wasserburg, 1974) because Pbi makes ups a larger proportion 472
of total Pb in titanite early on. Pb loss can occur by Pb diffusion or by recrystallization that 473
produces a higher U/Pb ratio than present in earlier-formed titanite. Significant U diffusion in 474
titanite is unlikely (Frost et al., 2000); however, real or apparent U loss can occur when 475
recrystallization produces a lower U/Pb ratio than present in earlier-formed titanite. Significant U 476
loss can produce reverse discordance on the Tera-Wasserburg diagram (Fig. 7D). 477
Pb isotopic fractionation during diffusion is expected to be negligible because of the 478
small relative mass differences between Pb isotopes. Pb isotopic variations during 479
recrystallization will also be negligible in the case that earlier-formed titanite is the primary 480
source of Pb to later-formed titanite (e.g., interface coupled dissolution-precipitation 481
recrystallization of Holder and Hacker (2019)). Significant changes to both the U/Pb and Pb/Pb 482
ratios of titanite are anticipated when recrystallization occurs in the presence of fluids that are 483
This is a preprint, the final version is subject to change, of the American Mineralogist (MSA) Cite as Authors (Year) Title. American Mineralogist, in press.
DOI: https://doi.org/10.2138/am-2020-7274
Always consult and cite the final, published document. See http:/www.minsocam.org or GeoscienceWorld

22
not in equilibrium with respect to the titanite-stabilizing phase assemblage – i.e. fluids external to 484
the local rock system. 485
486
Interpretation of the Harrisville titanite data from Tera-Wasserburg data patterns 487
The curvature in Adirondack titanite U-Pb data arrays suggest variation in Pbi 488
composition. Both LA-ICP-MS and SHRIMP data show an approximately linear trend with a 489
slight curvature toward lower slope at 207Pb/206Pb ~0.12 (Fig. 2). This is expressed by a small 490
offset of some Type-3 and Type-4 data relative to Type-1 and Type-2 data, as well as by greater 491
dispersion of data within Type-3 and Type-4 grains relative to Type-2 grains (Fig. 3). Departure 492
from a single linear isochron is also supported by the lack of a three-dimensional model solution 493
for the aggregate data sets (Table 1). The curvature of the Adirondack data arrays suggests that 494
titanite incorporated at least two different compositions of Pbi, as do linear regressions that 495
project toward varied Pbi 207Pb/206Pb values, some of which are significantly lower than ~0.92 496
(Table 1). The subtlety of the array curvature makes defining linear segments by eye and 497
dividing the data into Pbi compositional groups challenging and potentially quite arbitrary. 498
Differences in Pbi composition can arise from variations in growth or recrystallization 499
environment (Bonamici et al., 2015; Kohn, 2017; Lucassen et al., 2011; Marsh and Smye, 2017; 500
Romer and Rötzler, 2003; Scibiorski et al., 2019), which should also be reflected in other 501
compositional proxies, such as REE content, 18O, or Th/U ratio. Thus, additional compositional 502
information might be used to identify and define data populations that can appropriately be 503
regressed together. 504
In addition to multiple Pbi components, titanite U-Pb data also show evidence for Pb loss. 505
For a given 207Pb/206Pb ratio, U-Pb data are dispersed subparallel to the 238U/206Pb axis (Fig. 8). 506
This is a preprint, the final version is subject to change, of the American Mineralogist (MSA) Cite as Authors (Year) Title. American Mineralogist, in press.
DOI: https://doi.org/10.2138/am-2020-7274
Always consult and cite the final, published document. See http:/www.minsocam.org or GeoscienceWorld

23
The 204Pb/206Pb ratio decreases toward the concordia (Fig. 8A), but for a given 204Pb/206Pb value, 507
the 204Pb-corrected dates decrease systematically parallel to the 238U/206Pb axis (Fig. 8B). This 508
subhorizontal date gradient is consistent with Pb loss altering the 238U/206Pb ratio (Fig. 7D, E). 509
Diffusive Pb loss has been suggested for these grains based on previous work demonstrating 510
diffusion of oxygen isotopes, which have similar diffusivity to Pb at granulite facies conditions 511
(Cherniak, 1993; Zhang et al., 2006), and a lack of correlation between chemical and isotopic 512
zoning in the Harrisville grains (Bonamici et al., 2014; 2015). 513
A quantitative model of Pb ingrowth and Pb loss can be constructed to approximate the 514
Harrisville titanite history (Fig. 9; Supplemental Materials). It shows that significant Pb loss 515
~100 m.y. after initial titanite crystallization produces data scatter that is consistent with both the 516
direction and magnitude of offset of Harrisville U-Pb data relative to a 1150-Ma isochron (cf. Fig. 517
8). The model predicts that more recent Pb loss would have shifted the U-Pb data toward 518
significantly higher 238U/206Pb than observed. Thus, the relatively small, subhorizontal dispersion 519
of U-Pb data on the Tera-Wasserburg diagram is consistent with magmatic titanite crystallization 520
at ca. 1160 Ma followed by Pb loss during granulite-facies metamorphism at ca.1050 Ma. 521
522
Implications for interpreting (in situ) U-Pb titanite data 523
Generalizing the geometric considerations of the Tera-Wasserburg diagram and the 524
results from the Harrisville titanite example, U-Pb data patterns can be used to recognize both 525
Pbi compositional variations on the grain scale and open-system U/Pb fractionation. Previous 526
workers have long understood that data that form sloped linear arrays indicate a shared Pbi 527
composition and isochronous formation (Ludwig, 1998; Storey et al., 2006; Tera and 528
Wasserburg, 1972; 1974). Indeed, these types of datasets were the motivation for the 529
This is a preprint, the final version is subject to change, of the American Mineralogist (MSA) Cite as Authors (Year) Title. American Mineralogist, in press.
DOI: https://doi.org/10.2138/am-2020-7274
Always consult and cite the final, published document. See http:/www.minsocam.org or GeoscienceWorld

24
development of the Tera-Wasserburg diagram. In many cases, linear data arrays can be 530
appropriately regressed to find both the shared, single crystallization age and Pbi composition 531
(e.g., Stearns et al., 2016; Marsh and Smye, 2017). 532
In contrast, intersecting and/or curved arrays (e.g., Kirkland et al., 2016) suggest non-533
isochronous (re)crystallization and variations in the Pbi composition. Ideally, if distinct linear 534
segments can be recognized within a curved array, the subset of data defining a given segment 535
can be regressed to find an isochron. This analysis also suggests that curved arrays with 536
progressively shallower slopes toward the right, toward higher U/Pb, on the Tera-Wasserburg 537
diagram, are expected because ingrowth of radiogenic Pb over time potentially supplies an 538
increasing radiogenic component to the Pbi being incorporated into newly (re)crystallized titanite. 539
Data arrays that are dispersed parallel to the 238U/206Pb axis (e.g., Scibiorski et al., 2019) 540
suggest open-system alteration of the U/Pb ratio in an existing titanite grain by diffusion or 541
(re)crystallization, possibly in the presence of a variable-composition fluid. In general, 542
horizontally dispersed data should be treated with caution in choosing isochron regressions 543
because data may have been shifted toward either lower or higher 238U/206Pb by open-system 544
U/Pb fractionation. Depending on the length scale of U or Pb mobility, 238U/206Pb may be shifted 545
to both higher and lower values within the same grain (i.e., dispersed horizontally away from the 546
central, true isochron location). Bidirectional dispersal would be expected in the case that Pb 547
diffusion depletes Pb from some regions of a grain while enriching other regions. Our results 548
also suggest that reversely discordant points (data that fall to the left of the Tera-Wasserburg 549
concordia) have been shifted subparallel to the 238U/206Pb axis as a result of open-system 550
recrystallization that decreases the U/Pb ratio. 551
This is a preprint, the final version is subject to change, of the American Mineralogist (MSA) Cite as Authors (Year) Title. American Mineralogist, in press.
DOI: https://doi.org/10.2138/am-2020-7274
Always consult and cite the final, published document. See http:/www.minsocam.org or GeoscienceWorld

25
In some cases, a subset of titanite U-Pb data form a linear array that can be regressed with 552
the isochron method whereas other data fall significantly off the linear array (e.g., Garber et al. 553
2017). Analyses that do not form part of the linear isochron array represent titanite domains that, 554
relative to the data the define the linear isochron array, have incorporated a different Pbi 555
composition, (re)crystallized at a different time, or a combination of both. These patterns cannot 556
be created by simple variations in the relative proportions of the same Pbi and radiogenic Pb 557
between analyses. 558
Finally, data that form a cloud above concordia without well defined, linear or curvilinear, 559
sloped or horizontal, arrays (e.g., Kohn and Corrie, 2011; Garber et al., 2017) reflect some 560
combination of U/Pb fractionation, changing Pbi composition, and/or variable crystallization age 561
during titanite formation. Interpretation of age significance from such datasets requires additional 562
geologic, petrologic, and microstructural constraints and/or a prior knowledge of expected age 563
populations. 564
565
Implications 566
Titanite is an opportunistic mineral with highly adaptive crystal chemistry (e.g., Frost et 567
al., 2001; Kohn, 2017), and, as yet, the connections between titanite trace element content and 568
titanite (re)crystallization environment remain only partially explored, especially in subsolidus 569
hydrothermally altered and/or metamorphic titanite. Multiple processes can apparently produce 570
similar trace element variations and patterns in titanite. For instance, microscale intragrain 571
variations in high field strength elements have been linked to fine-scale fluid composition 572
variations (Lucassen et al., 2010a; 2010b; 2011; Gao et al., 2012; Chen et al., 2016), sector 573
zoning and trace element entrapment during growth (Hayden et al., 2008; Kohn, 2017), and 574
This is a preprint, the final version is subject to change, of the American Mineralogist (MSA) Cite as Authors (Year) Title. American Mineralogist, in press.
DOI: https://doi.org/10.2138/am-2020-7274
Always consult and cite the final, published document. See http:/www.minsocam.org or GeoscienceWorld

26
equilibrium or disequilibrium dissolution-reprecipitation processes (Romer and Rötzler, 2003; 575
Olierook et al., 2018; Hartnady et al., 2019; Holder and Hacker, 2019). Trends in titanite rare 576
earth element and actinide contents have also been linked to dissolution-reprecipitation (Garber 577
et al., 2017), as well as to coeval allanite or garnet growth (Garber et al., 2017; Scibiorski et al., 578
2019), and sector zoning (Kohn, 2017; Bruand et al., 2019). Collectively, these studies suggest 579
that titanite chemistry can record equilibrium trace-element partitioning, especially between 580
titanite and melt, but that equilibrium may be very local (at the scale of grains) and/or that 581
titanite can reflect kinetic limitations on element mobility, attachment, or detachment. 582
Approaches like the Tera-Wasserburg analysis utilized in this study help to reduce the effect of 583
these poorly understood controls on the interpretation of U-Pb systematics by allowing Pbi 584
variations to be distinguished from U/Pb ratio variations, regardless of the exact process(es) 585
responsible. 586
Moreover, when combined with grain-scale characterization of element and isotopic 587
zoning, the Tera-Wasserburg-based analysis of this study demonstrates an approach for 588
maximizing geochronologic information obtained by in situ U-Pb titanite analysis, especially for 589
rocks with polyphase thermal histories. The approach described here also aids in identifying 590
sources of uncertainty in U-Pb data, whether arising from the analysis itself or from actual 591
geological variability. Even when precise dates are not recovered, geological processes and 592
events that cause data scatter can be recognized through analysis of U-Pb data patterns using the 593
Tera-Wasserburg diagram. 594
595
Acknowledgements 596
This is a preprint, the final version is subject to change, of the American Mineralogist (MSA) Cite as Authors (Year) Title. American Mineralogist, in press.
DOI: https://doi.org/10.2138/am-2020-7274
Always consult and cite the final, published document. See http:/www.minsocam.org or GeoscienceWorld

27
We thank C. Mark Fanning of the Research School of Earth Sciences at the Australian National 597
University for enabling SHRIMP U-Th-Pb data collection. We thank Nicki Geisler and Mark 598
Pecha of the Arizona Laserchron Center for supporting LA-ICP-MS U-Th-Pb analysis and 599
providing data analysis spreadsheets. Brian Hess expertly prepared samples. This work was 600
supported through the National Science Foundation [grant number EAR-0838058] (award to 601
John Valley). We also thank two anonymous reviewers for useful comments and suggestions for 602
the improvement of this manuscript. 603
This is a preprint, the final version is subject to change, of the American Mineralogist (MSA) Cite as Authors (Year) Title. American Mineralogist, in press.
DOI: https://doi.org/10.2138/am-2020-7274
Always consult and cite the final, published document. See http:/www.minsocam.org or GeoscienceWorld

28
References Cited 604
Aleinikoff, J.N., Wintsch, R.P., Fanning, C.M., and Dorais, M.J. (2002) U–Pb geochronology of 605
zircon and polygenetic titanite from the Glastonbury Complex, Connecticut, USA: an 606
integrated SEM, EMPA, TIMS, and SHRIMP study. Chemical Geology, 188, 125–147. 607
Aleinikoff, J.N., Horton, J.W., Drake, A.A., Wintsch, R.P., Fanning, C.M., and Yi, K. (2004) 608
Deciphering multiple Mesoproterozoic and Paleozoic events recorded in zircon and 609
titanite from the Baltimore Gneiss, Maryland: SEM imaging, SHRIMP U-Pb 610
geochronology, and EMP analysis. In Proterozoic Tectonic Evolution of the Grenville 611
Orogen in North America Vol. 197, pp. 411–434. Geological Society of America. 612
Aleinikoff, J.N., Wintsch, R.P., Tollo, R.P., Unruh, D.M., Fanning, C.M., and Schmitz, M.D. 613
(2007) Ages and origins of rocks of the Killingworth dome, south-central Connecticut: 614
Implications for the tectonic evolution of southern New England. American Journal of 615
Science, 307, 63–118. 616
Amelin, Y. (2009) Sm–Nd and U–Pb systematics of single titanite grains. Chemical Geology, 617
261, 53–61. 618
Baird, G.B., and MacDonald, W.D. (2004) Deformation of the Diana syenite and Carthage-619
Colton mylonite zone: Implications for timing of Adirondack Lowlands deformation. In 620
Memoir 197: Proterozoic Tectonic Evolution of the Grenville Orogen in North America 621
Vol. 197, pp. 285–297. Geological Society of America. 622
Bonamici, C.E., Kozdon, R., Ushikubo, T., and Valley, J.W. (2014) Intragrain oxygen isotope 623
zoning in titanite by SIMS: Cooling rates and fluid infiltration along the Carthage-Colton 624
Mylonite Zone, Adirondack Mountains, NY, USA. Journal of Metamorphic Geology, 32, 625
71–92. 626
This is a preprint, the final version is subject to change, of the American Mineralogist (MSA) Cite as Authors (Year) Title. American Mineralogist, in press.
DOI: https://doi.org/10.2138/am-2020-7274
Always consult and cite the final, published document. See http:/www.minsocam.org or GeoscienceWorld

29
Bonamici, C.E., Fanning, C.M., Kozdon, R., Fournelle, J.H., and Valley, J.W. (2015) Combined 627
oxygen-isotope and U-Pb zoning studies of titanite: New criteria for age preservation. 628
Chemical Geology, 398, 70–84. 629
Butler, R.F., Gehrels, G.E., Baldwin, S.L., and Davidson, C. (2002) Paleomagnetism and 630
geochronology of the Ecstall pluton in the Coast Mountains of British Columbia: Evidence 631
for local deformation rather than large-scale transport. Journal of Geophysical Research: 632
Solid Earth, 107, EPM 3-1. 633
Bruand, E., Storey, C., Fowler, M., and Heilimo, E. (2019) Oxygen isotopes in titanite and 634
apatite, and their potential for crustal evolution research. Geochimica et Cosmochimica 635
Acta, 255, 144–162. 636
Cartwright, I., Valley, J., and Hazelwood, A.-M. (1993) Resetting of oxybarometers and oxygen 637
isotope ratios in granulite facies orthogneisses during cooling and shearing, Adirondack 638
Mountains, New York. Contributions to Mineralogy and Petrology, 113, 208–225. 639
Chen, Y.-X., Zhou, K., Zheng, Y.-F., Gao, X.-Y., and Yang, Y.H. (2016) Polygenetic titanite 640
records the composition of metamorphic fluids during the exhumation of ultrahigh-641
pressure metagranite in the Sulu orogen. Journal of Metamorphic Geology, 34, 573–594. 642
Cherniak, D.J. (1993) Lead diffusion in titanite and preliminary results on the effects of radiation 643
damage on Pb transport. Chemical Geology, 110, 177–194. 644
——— (2010) Diffusion in Accessory Minerals: Zircon, Titanite, Apatite, Monazite and 645
Xenotime. Reviews in Mineralogy and Geochemistry, 72, 827–869. 646
Chew, D.M., Petrus, J.A., and Kamber, B.S. (2014) U–Pb LA–ICPMS dating using accessory 647
mineral standards with variable common Pb. Chemical Geology, 363, 185–199. 648
This is a preprint, the final version is subject to change, of the American Mineralogist (MSA) Cite as Authors (Year) Title. American Mineralogist, in press.
DOI: https://doi.org/10.2138/am-2020-7274
Always consult and cite the final, published document. See http:/www.minsocam.org or GeoscienceWorld

30
DeWolf, C.P., and Mezger, K. (1994) Lead isotope analyses of leached feldspars: Constraints on 649
the early crustal history of the Grenville Orogen. Geochimica et Cosmochimica Acta, 58, 650
5537–5550. 651
Essex, R.M., and Gromet, L.P. (2000) U-Pb dating of prograde and retrograde titanite growth 652
during the Scandian orogeny. Geology, 28, 419–422. 653
Frost, B.R., Chamberlain, K.R., and Schumacher, J.C. (2001) Sphene (titanite): phase relations 654
and role as a geochronometer. Chemical Geology, 172, 131–148. 655
Gao, X.-Y., Zheng, Y.-F., Chen, Y.-X., and Guo, J. (2012) Geochemical and U–Pb age 656
constraints on the occurrence of polygenetic titanites in UHP metagranite in the Dabie 657
orogen. Lithos, 136–139, 93–108. 658
Garber, J.M., Hacker, B.R., Kylander-Clark, A.R.C., Stearns, M., and Seward, G. (2017) 659
Controls on Trace Element Uptake in Metamorphic Titanite: Implications for 660
Petrochronology. Journal of Petrology, 58, 1031–1057. 661
Gehrels, G.E., Valencia, V.A., and Ruiz, J. (2008) Enhanced precision, accuracy, efficiency, and 662
spatial resolution of U-Pb ages by laser ablation–multicollector–inductively coupled 663
plasma–mass spectrometry. Geochemistry, Geophysics, Geosystems, 9. 664
665 Gulson, B.L. (1984) Uranium-lead and lead-lead investigations of minerals from the Broken Hill 666
lodes and mine sequence rocks. Economic Geology, 79, 476–490. 667
Hartnady, M.I.H., Kirkland, C.L., Clark, C., Spaggiari, C.V., Smithies, R.H., Evans, N.J., and 668
McDonald, B.J. (2019) Titanite dates crystallisation; slow Pb diffusion during super-669
solidus re-equilibration. Journal of Metamorphic Geology, 37, 823–838. 670
Heumann, Mattew J. (2004) Thermochronological and Geochronological studies in the 671
Adirondack Highlands and Lowlands, New York. Syracuse University. 672
This is a preprint, the final version is subject to change, of the American Mineralogist (MSA) Cite as Authors (Year) Title. American Mineralogist, in press.
DOI: https://doi.org/10.2138/am-2020-7274
Always consult and cite the final, published document. See http:/www.minsocam.org or GeoscienceWorld

31
Holder, R.M., and Hacker, B.R. (2019) Fluid-driven resetting of titanite following ultrahigh-673
temperature metamorphism in southern Madagascar. Chemical Geology, 504, 38–52. 674
Horstwood, M.S., L. Foster, G., R. Parrish, R., R. Noble, S., and M. Nowell, G. (2003) 675
Common-Pb corrected in situ U–Pb accessory mineral geochronology by LA-MC-ICP-676
MS. Journal of Analytical Atomic Spectrometry, 18, 837–846. 677
Ireland, T.R., and Williams, I.S. (2003) Considerations in Zircon Geochronology by SIMS. 678
Reviews in Mineralogy and Geochemistry, 53, 215–242. 679
Johnson, E.L., Goergen, E.T., and Fruchey, B.L. (2004) Right lateral oblique slip movements 680
followed by post-Ottawan (1050–1020 Ma) orogenic collapse along the Carthage-Colton 681
shear zone: Data from the Dana Hill metagabbro body, Adirondack Mountains, New 682
York. In Memoir 197: Proterozoic Tectonic Evolution of the Grenville Orogen in North 683
America Vol. 197, pp. 357–378. Geological Society of America. 684
Johnson, E.L., Selleck, B.W., DeLorraine, B., and Lupulescu, M. (2005) The nature and 685
significance of the Carthage-Colton shear zone and related late-to-post tectonic granites 686
and ore deposits. Friends of the Grenville. 687
Jung, S., and Hellebrand, E. (2007) Textural, geochronological and chemical constraints from 688
polygenetic titanite and monogenetic apatite from a mid-crustal shear zone: An integrated 689
EPMA, SIMS, and TIMS study. Chemical Geology, 241, 88–107. 690
Kirkland, C.L., Spaggiari, C.V., Johnson, T.E., Smithies, R.H., Danišík, M., Evans, N., Wingate, 691
M.T.D., Clark, C., Spencer, C., Mikucki, E., and others (2016) Grain size matters: 692
Implications for element and isotopic mobility in titanite. Precambrian Research, 278, 693
283–302. 694
This is a preprint, the final version is subject to change, of the American Mineralogist (MSA) Cite as Authors (Year) Title. American Mineralogist, in press.
DOI: https://doi.org/10.2138/am-2020-7274
Always consult and cite the final, published document. See http:/www.minsocam.org or GeoscienceWorld

32
Kirkland, C.L., Hollis, J., Danišík, M., Petersen, J., Evans, N.J., and McDonald, B.J. (2017) 695
Apatite and titanite from the Karrat Group, Greenland; implications for charting the 696
thermal evolution of crust from the U-Pb geochronology of common Pb bearing phases. 697
Precambrian Research, 300, 107–120. 698
Kohn, M.J. (2017) Titanite Petrochronology. Reviews in Mineralogy and Geochemistry, 83, 699
419–441. 700
Kohn, M.J., and Corrie, S.L. (2011) Preserved Zr-temperatures and U–Pb ages in high-grade 701
metamorphic titanite: Evidence for a static hot channel in the Himalayan orogen. Earth 702
and Planetary Science Letters, 311, 136–143. 703
Lamb, W.M. (1993) Retrograde deformation within the Carthage-Colton Zone as recorded by 704
fluid inclusions and feldspar compositions: tectonic implications for the southern 705
Grenville Province. Contributions to Mineralogy and Petrology, 114, 379–394. 706
Li, J.-W., Deng, X.-D., Zhou, M.-F., Liu, Y.-S., Zhao, X.-F., and Guo, J.-L. (2010) Laser 707
ablation ICP-MS titanite U–Th–Pb dating of hydrothermal ore deposits: A case study of 708
the Tonglushan Cu–Fe–Au skarn deposit, SE Hubei Province, China. Chemical Geology, 709
270, 56–67. 710
Lucassen, F., Dulski, P., Abart, R., Franz, G., Rhede, D., and Romer, R.L. (2010a) Redistribution 711
of HFSE elements during rutile replacement by titanite. Contributions to Mineralogy and 712
Petrology, 160, 279–295. 713
Lucassen, F., Franz, G., Rhede, D., and Wirth, R. (2010b) Ti-Al zoning of experimentally grown 714
titanite in the system CaO-Al2O3-TiO2-SiO2-NaCl-H2O-(F): Evidence for small-scale 715
fluid heterogeneity. American Mineralogist, 95, 1365. 716
This is a preprint, the final version is subject to change, of the American Mineralogist (MSA) Cite as Authors (Year) Title. American Mineralogist, in press.
DOI: https://doi.org/10.2138/am-2020-7274
Always consult and cite the final, published document. See http:/www.minsocam.org or GeoscienceWorld

33
Lucassen, F., Franz, G., Dulski, P., Romer, R.L., and Rhede, D. (2011) Element and Sr isotope 717
signatures of titanite as indicator of variable fluid composition in hydrated eclogite. 718
Lithos, 121, 12–24. 719
Ludwig, K.R. (1998) On the Treatment of Concordant Uranium-Lead Ages. Geochimica et 720
Cosmochimica Acta, 62, 665–676. 721
Ludwig, K (2009) SQUID 2: A User’s Manual, rev. 12 Apr, 2009, 110 p. 722
Ludwig, K.R. (2012) User’s Manual for Isoplot 3.75: A Geochronlogical Toolkit for Microsoft 723
Excel, 75 p. 724
Marsh, J.H., and Smye, A.J. (2017) U-Pb systematics and trace element characteristics in titanite 725
from a high-pressure mafic granulite. Chemical Geology, 466, 403–416. 726
McGregor, M., McFarlane, C.R.M., and Spray, J.G. (2019) In situ multiphase U–Pb 727
geochronology and shock analysis of apatite, titanite and zircon from the Lac La Moinerie 728
impact structure, Canada. Contributions to Mineralogy and Petrology, 174, 62. 729
McLelland, J.M., Selleck, B.W., and Bickford, M.E. (2010) Review of the Proterozoic evolution 730
of the Grenville Province, its Adirondack outlier, and the Mesoproterozoic inliers of the 731
Appalachians. Geological Society of America Memoirs, 206, 21–49. 732
Mezger, K., Pluijm, B. a. V.D., Essene, E.J., and Halliday, A.N. (1991a) Synorogenic Collapse: 733
A Perspective from the Middle Crust, the Proterozoic Grenville Orogen. Science, 254, 734
695–698. 735
Mezger, K., Rawnsley, C.M., Bohlen, S.R., and Hanson, G.N. (1991b) U-Pb Garnet, Sphene, 736
Monazite, and Rutile Ages: Implications for the Duration of High-Grade Metamorphism 737
and Cooling Histories, Adirondack Mts., New York. The Journal of Geology, 99, 415–738
428. 739
This is a preprint, the final version is subject to change, of the American Mineralogist (MSA) Cite as Authors (Year) Title. American Mineralogist, in press.
DOI: https://doi.org/10.2138/am-2020-7274
Always consult and cite the final, published document. See http:/www.minsocam.org or GeoscienceWorld

34
Mezger, K., Pluijm, B.A. van der, Essene, E.J., and Halliday, A.N. (1992) The Carthage-Colton 740
Mylonite Zone (Adirondack Mountains, New York): The Site of a Cryptic Suture in the 741
Grenville Orogen? The Journal of Geology, 100, 630–638. 742
Mezger, K., Essene, E.J., van der Pluijm, B.A., and Halliday, A.N. (1993) U-Pb geochronology 743
of the Grenville Orogen of Ontario and New York: constraints on ancient crustal 744
tectonics. Contributions to Mineralogy and Petrology, 114, 13–26. 745
Olierook, H.K.H., Taylor, R.J.M., Erickson, T.M., Clark, C., Reddy, S.M., Kirkland, C.L., Jahn, 746
I., and Barham, M. (2019) Unravelling complex geologic histories using U–Pb and trace 747
element systematics of titanite. Chemical Geology, 504, 105–122. 748
Papapavlou, K., Darling, J.R., Storey, C.D., Lightfoot, P.C., Moser, D.E., and Lasalle, S. (2017) 749
Dating shear zones with plastically deformed titanite: New insights into the orogenic 750
evolution of the Sudbury impact structure (Ontario, Canada). Precambrian Research, 291, 751
220–235. 752
Papapavlou, K., Darling, J.R., Moser, D.E., Barker, I.R., White, L.F., Lightfoot, P.C., Storey, 753
C.D., Dunlop, J., and EIMF (2018) U–Pb isotopic dating of titanite microstructures: 754
potential implications for the chronology and identification of large impact structures. 755
Contributions to Mineralogy and Petrology, 173, 82. 756
Prowatke, S., and Klemme, S. (2005) Effect of melt composition on the partitioning of trace 757
elements between titanite and silicate melt. Geochimica et Cosmochimica Acta, 69, 695–758
709. 759
Romer, R.L., and Rötzler, J. (2003) Effect of metamorphic reaction history on the U-Pb dating of 760
titanite. Geological Society, London, Special Publications, 220, 147–158. 761
This is a preprint, the final version is subject to change, of the American Mineralogist (MSA) Cite as Authors (Year) Title. American Mineralogist, in press.
DOI: https://doi.org/10.2138/am-2020-7274
Always consult and cite the final, published document. See http:/www.minsocam.org or GeoscienceWorld

35
Rubatto, D., and Scambelluri, M. (2003) U-Pb dating of magmatic zircon and metamorphic 762
baddeleyite in the Ligurian eclogites (Voltri Massif, Western Alps). Contributions to 763
Mineralogy and Petrology, 146, 341–355. 764
Schoene, B. (2014) 4.10-U–Th–Pb Geochronology. Treatise on Geochemistry, 4, 341–378. 765
Scibiorski, E., Kirkland, C.L., Kemp, A.I.S., Tohver, E., and Evans, N.J. (2019) Trace elements 766
in titanite: A potential tool to constrain polygenetic growth processes and timing. 767
Chemical Geology, 509, 1–19. 768
Stacey, J.S., and Kramers, J.D. (1975) Approximation of terrestrial lead isotope evolution by a 769
two-stage model. Earth and Planetary Science Letters, 26, 207–221. 770
Stearns, M.A., Hacker, B.R., Ratschbacher, L., Rutte, D., and Kylander-Clark, A.R.C. (2015) 771
Titanite petrochronology of the Pamir gneiss domes: Implications for middle to deep 772
crust exhumation and titanite closure to Pb and Zr diffusion. Tectonics, 34, 784–802. 773
Stearns, M.A., Cottle, J.M., Hacker, B.R., and Kylander-Clark, A.R.C. (2016) Extracting thermal 774
histories from the near-rim zoning in titanite using coupled U-Pb and trace-element depth 775
profiles by single-shot laser-ablation split stream (SS-LASS) ICP-MS. Chemical Geology, 776
422, 13–24. 777
Stern, Robert (1997) The GSC sensitive high resolution ion microprobe (SHRIMP): analytical 778
techniques of zircon U–Th–Pb age determinations and performance evaluation. 779
Geological Survey of Canada Report, 10, 1–31. 780
Storey, C.D., Jeffries, T.E., and Smith, M. (2006) Common lead-corrected laser ablation ICP–781
MS U–Pb systematics and geochronology of titanite. Chemical Geology, 227, 37–52. 782
This is a preprint, the final version is subject to change, of the American Mineralogist (MSA) Cite as Authors (Year) Title. American Mineralogist, in press.
DOI: https://doi.org/10.2138/am-2020-7274
Always consult and cite the final, published document. See http:/www.minsocam.org or GeoscienceWorld

36
Storey, C.D., Smith, M.P., and Jeffries, T.E. (2007) In situ LA-ICP-MS U–Pb dating of 783
metavolcanics of Norrbotten, Sweden: Records of extended geological histories in 784
complex titanite grains. Chemical Geology, 240, 163–181. 785
Streepey, M., E. L. Johnson, K. Mezger, and B. A. van der Pluijm (2001) Early History of the 786
Carthage‐Colton Shear Zone, Grenville Province, Northwest Adirondacks, New York 787
(U.S.A.). The Journal of Geology, 109, 479–492. 788
Tera, F., and Wasserburg, G.J. (1972) U-Th-Pb systematics in three Apollo 14 basalts and the 789
problem of initial Pb in lunar rocks. Earth and Planetary Science Letters, 14, 281–304. 790
Tera, F., and Wasserburg, G.J. (1974) U-Th-Pb systematics on lunar rocks and inferences about 791
lunar evolution and the age of the moon. In Lunar and Planetary Science Conference 792
Proceedings Vol. 5, pp. 1571–1599. 793
Tiepolo, M., Oberti, R., and Vannucci, R. (2002) Trace-element incorporation in titanite: 794
constraints from experimentally determined solid/liquid partition coefficients. Chemical 795
Geology, 191, 105–119. 796
Timms, N.E., Pearce, M.A., Erickson, T.M., Cavosie, A.J., Rae, Auriol S. P., Wheeler, J., 797
Wittmann, Axel, Ferrière, Ludovic, Poelchau, Michael H., Tomioka, Naotaka, and others 798
(2019) New shock microstructures in titanite (CaTiSiO5) from the peak ring of the 799
Chicxulub impact structure, Mexico. Contributions to Mineralogy and Petrology, 174, 38. 800
Verts, L.A., Chamberlain, K.R., and Frost, C.D. (1996) U-Pb sphene dating of metamorphism: 801
the importance of sphene growth in the contact aureole of the Red Mountain pluton, 802
Laramie Mountains, Wyoming. Contributions to Mineralogy and Petrology, 125, 186–803
199. 804
This is a preprint, the final version is subject to change, of the American Mineralogist (MSA) Cite as Authors (Year) Title. American Mineralogist, in press.
DOI: https://doi.org/10.2138/am-2020-7274
Always consult and cite the final, published document. See http:/www.minsocam.org or GeoscienceWorld

37
Williams, I.S. (1998) U-Th-Pb geochronology by ion microprobe. Reviews in Economic 805
Geology, 7, 1–35. 806
Wohlgemuth-Ueberwasser, C.C., Tegner, C., and Pease, V. (2017) LA-Q-ICP-MS apatite U/Pb 807
geochronology using common Pb in plagioclase: Examples from layered mafic intrusions. 808
American Mineralogist, 102, 571–579. 809
Zhang, X.Y., Cherniak, D.J., and Watson, E.B. (2006) Oxygen diffusion in titanite: Lattice 810
diffusion and fast-path diffusion in single crystals. Chemical Geology, 235, 105–123. 811
812
This is a preprint, the final version is subject to change, of the American Mineralogist (MSA) Cite as Authors (Year) Title. American Mineralogist, in press.
DOI: https://doi.org/10.2138/am-2020-7274
Always consult and cite the final, published document. See http:/www.minsocam.org or GeoscienceWorld

38
Figure Captions 813
Figure 1. Post-analysis images of U-Pb LA-ICP-MS and SHRIMP analysis pits at a similar scale. 814
Both sets of analysis pits have similar diameters, 35-40 µm. SHRIMP pits are 2-3 µm deep; LA-815
ICP-MS pits are 15 µm deep. 816
817
Figure 2. Total LA-ICP-MS and SHRIMP U-Pb titanite datasets, colored by grain ‘Type’ as 818
determined by microstructural setting (Bonamici et al., 2014; 2015). The LA-ICP-MS dataset is 819
more extensive (n = 280) than the SHRIMP dataset (n = 101) because of the shorter analysis time. 820
821
Figure 3. Total Pb/U plots for each Adirondack titanite grain. Grain designations are listed in 822
upper right corner of each plot with the Type in parentheses behind. See Table 1 for grain Type 823
explanations. LA-ICP-MS data shown in gray; SHRIMP data shown in black. Constrained 3D 824
linear regressions are projected into the 2D space of the Tera-Wasserburg diagram. Lower 825
concordia intercepts and MSWDs for constrained 3D and 2D regressions are given for each grain. 826
Leftmost column contains Type-1 and -2 grains, which show generally small U/Pb ratio spread 827
and highly clustered analyses. Center column contains Type-3 grains, which show greater U/Pb 828
variations. The rightmost column contains Type-4 grains showing the largest spread in U/Pb 829
ratios. 830
831
Figure 4. Results of 3D linear isochron regressions (Ludwig, 2012) for individual Adirondack 832
titanite grains, showing large uncertainties and relatively poor age constraints provided by this 833
type of analysis. See also Figure 3 and Table 1. (A) Concordia-intercept ages and 2SD 834
uncertainties from regressions with constrained Pbi 207Pb/206Pb. Light gray fields show the 835
This is a preprint, the final version is subject to change, of the American Mineralogist (MSA) Cite as Authors (Year) Title. American Mineralogist, in press.
DOI: https://doi.org/10.2138/am-2020-7274
Always consult and cite the final, published document. See http:/www.minsocam.org or GeoscienceWorld

39
known age ranges for the Shawinigan and Ottawan phases of the Grenville orogenic cycle for 836
reference. (B) Lower intercepts and 2SD uncertainties, in the Tera-Wasserburg plane, of 837
unconstrained regressions. Within large uncertainties, all but one grain (HA12B) give lower 838
intercepts the overlap concordia. All regressions of SHRIMP data return MSWD values greater 839
than 2. Approximate ages for the Shawinigan and Ottawan phases are indicated on the concordia 840
for reference. 841
842
Figure 5. Comparison of individually Pbi-corrected U-Pb dates for a subset of Adirondack 843
titanite grains that were analyzed by both LA-ICP-MS and SHRIMP. Traverses show the spatial 844
variations in Pbi-corrected 238U/206Pb dates. Profiles are generated using the preferred Pbi-845
correction for each analytical technique—207 method for LA-ICP-MS and 204-method for 846
SHRIMP. Vertical bars show average, external 1σ uncertainties for SHRIMP (red) and LA-ICP-847
MS (blue). Dashed horizontal lines show mean concordia-intercept ages from 3D linear isochron 848
regressions; note that uncertainties on these regression ages are not shown but are generally large 849
(see Fig. 4). U-Pb profiles for all grains in this study can be found in Supplemental Figures S1 850
through S13. 851
852
Figure 6. Plot of total 207Pb/206Pb vs. total 204Pb/206Pb measured in Harrisville titanite by LA-853
ICP-MS (blue) and SHRIMP (red). See text for discussion. 854
855
Figure 7. Schematic diagrams showing the behavior of U-Pb data on a Tera-Wasserburg diagram. 856
(A) Selected paths showing the ingrowth of radiogenic Pb in the absence of Pbi as function of 857
various starting U isotope compositions. Topmost path shows ingrowth trajectory for a titanite 858
This is a preprint, the final version is subject to change, of the American Mineralogist (MSA) Cite as Authors (Year) Title. American Mineralogist, in press.
DOI: https://doi.org/10.2138/am-2020-7274
Always consult and cite the final, published document. See http:/www.minsocam.org or GeoscienceWorld

40
grain crystallized at the time of Earth formation with the primodial (meteoritic) U isotope 859
composition. (B) Evolution of a mixing line (isochron) between Pb* and Pbi with 207Pb/206Pb = 860
0.96. Black line with the steepest slope represents the present-day isochron. Gray lines with 861
negative slopes show the position of the isochron at different arbitrary times during its evolution 862
from its initial to its present-day position. Gray lines with positive slopes show ingrowth curves 863
for Pb* mixed with variable proportions of Pbi. Pbi composition is shown by the horizontal 864
dashed line. (C) Same as B with a different isochron evolution superimposed (blue lines), 865
demonstrating the effect of later titanite (re)crystallization with a different, more radiogenic Pbi 866
(207Pb/206Pb = 0.6). (D) Schematic representation of Pb ingrowth trajectories for titanite suffering 867
open-system modification of its U/Pb ratio. Thin colored lines are normal ingrowth trajectories 868
(with varying proportions of Pbi); heavier arrows simulate instantaneous change in U/Pb ratio by 869
either recent or ancient open-system event. Subsequently, Pb ingrowth returns to closed-system 870
behavior (thin lines). (E) Schematic representation of the U-Pb data arrays expected in the case 871
of open-system U/Pb ratio modification, as demonstrated in D. 872
873
Figure 8. U-Pb analyses with color scaling showing covariation with additional isotopic data. (A) 874
SHRIMP data and (B) LA-ICP-MS data with color scaling showing total 204Pb/206Pb. The 875
transition from warm to cool colors toward concordia is consistent with decreasing relative 876
abundance of Pbi. (C) SHRIMP data and (D) LA-ICP-MS data with color scaling showing 204-877
corrected date. Comparison with A and B suggests that for a given 204Pb/206Pb value (Pbi 878
abundance), variation in Pbi-corrected dates reflects variation in U/Pb ratio. Only Type 1 and 879
Type 2 data, which retain evidence for oxygen isotope and Pb diffusion (Bonamici et al. 2014; 880
2015), are shown in B and D. 881
882
This is a preprint, the final version is subject to change, of the American Mineralogist (MSA) Cite as Authors (Year) Title. American Mineralogist, in press.
DOI: https://doi.org/10.2138/am-2020-7274
Always consult and cite the final, published document. See http:/www.minsocam.org or GeoscienceWorld

41
Figure 9. Quantitative models showing the effect of Pb loss on U-Pb systematics for titanite with 883
Pbi on the Terra-Wasserberg diagram. Model is constructed to simulate possible scenarios for the 884
Harrisville titanite grains: initial crystallization at 1150 Ma with low Pbi followed by Pb loss 885
shortly after crystallization at 1050 Ma (orange curve) or Pb loss long after crystallization at 650 886
Ma (green curve). Modeling details in Supplemental Materials. (A) Ingrowth curves showing full 887
ingrowth trajectories, including Pb loss events. (B) Expanded region of A showing where 888
evolution curves end (X's), relative to the 1150 Ma and 1050 Ma isochrons, and depending on 889
the timing of Pb loss. 890
891
This is a preprint, the final version is subject to change, of the American Mineralogist (MSA) Cite as Authors (Year) Title. American Mineralogist, in press.
DOI: https://doi.org/10.2138/am-2020-7274
Always consult and cite the final, published document. See http:/www.minsocam.org or GeoscienceWorld

42
Appendix 892
Stacey and Kramers (1975) determined modern-day crustal average Pb isotope ratios to be 893
206Pb/204Pb = 18.70, 207Pb/204Pb = 15.63, and 208Pb/204Pb = 38.63, based on Pb isotopic data from 894
“conformable” galena. They then fitted a two-stage Pb evolution curve, the second stage having 895
= 238U/204Pb = 9.74. In practice, Pbi ratios based on the Stacey and Kramers (1975) model can 896
be calculated for materials younger than 3.7 Ga from equations 1 and 2 below, using the modern-897
day crustal average Pb isotope ratios and an approximate age (Stacey and Kramers model Pb 898
ratios are superscipted SK). 899
900
901
902
903
The 204 method initial Pb correction (Stern, 1997) subtracts the initial Pb fraction (204cf206), 904
calculated using Stacey and Kramers (1975) Pbi ratios, from the total measured 206Pb/238U to 905
determine the radiogenic 206Pb/238U ratio. 906
907
908
909
206Pb204Pb
æ
èç
ö
ø÷i
SK
=206Pb204Pb
æ
èç
ö
ø÷today
SK
-m el238t -1( ) [eq.1]
207Pb204Pb
æ
èç
ö
ø÷i
SK
=207Pb204Pb
æ
èç
ö
ø÷today
SK
-1
137.82m el235t -1( ) [eq.2]
204c f206 =206Pbi
206Pbtotal=
204Pb 206Pb( )measured
unknown
204Pb 206Pb( )i
SK[eq.3]
206Pb*
238U
æ
èç
ö
ø÷corrected
unknown
= 1- 204c f206( )206Pb238U
æ
èç
ö
ø÷measured
unknown
[eq.4]

43
The 207 method Pbi correction (Stern, 1997) subtracts the initial Pb fraction (207cf206), calculated 910
using Stacey and Kramers (1975) Pbi values and a starting guess or “expected” radiogenic 911
207Pb/206Pb ratio, from the total measured 207Pb/206Pb to determine the corrected radiogenic 912
207Pb/206Pb ratio. 913
914
915
916
917
918
919
920
207c f206 =206Pbi
206Pbtotal=
206Pb207Pb
æ
èç
ö
ø÷measured
unknown
-206Pb*
207Pb*
æ
èç
ö
ø÷expected
unknown
206Pb207Pb
æ
èç
ö
ø÷i
SK
-206Pb*
207Pb*
æ
èç
ö
ø÷expected
unknown[eq.5]
f207 = 207c f206 ´
207Pb 206Pb( )i
SK
207Pb 206Pb( )measured
unknown[eq.6]
207Pb*
206Pb*
æ
èç
ö
ø÷corrected
unknown
=207Pb206Pb
æ
èç
ö
ø÷measured
unknown
´1- f207( )
1- 207c f206( ) [eq.7]

Table 1. Summary descriptions and interpretations of titanite types from Harrisville area from previous work.
Titanite
Type
Microstructural and Zoning Description Reference
1 Anhedral grains (100-500 µm) within lenses of grain-size-reduced augite + quartz + oxides hornblende that define local S1 protomylonitic fabric. Subtle oscillatory zoning in major, minor elements and Th/U. Core-to-rim decreasing 18O of ≤0.8‰. Interpretation: Magmatic titanite crystallized in AMCG Diana syenite; solid-state grain-size reduction during Ottawan deformation.
Bonamici et al. 2011; 2014; 2015
2 Rounded porphyroclasts (100-1300 µm) within local S2 shear zones. Some show subgrain development and/or recrystallization at margins. Some are transected by one set of thin deformation twins. Chemical zoning marked by small, step-like and oscillating changes in minor and trace elements and Th/U. Core-to-rim decreasing 18O of ≤1.5‰ Interpretation: Late magmatic titanite crystallized in AMCG Diana syenite, sheared as porphyroclasts during Ottawan deformation
Mezger et al. 1992; Bonamici et al., 2014; 2015
3 Anhedral/xenoblastic grains and grain aggregates (~500-5000 m) within veins that crosscut local S1 foliation and variably contain local S2 foliation. Grains commonly contain one or two sets of deformation twins. Veins vary in mineralogy but commonly contain augite, K-feldspar, apatite, scapolite, and other calcsilicate minerals in addition to titanite. Sharply oscillating zoning in minor and trace elements. Interpretation: Vein titanite crystallized from alkaline fluids cross-cutting Diana metasyenite during Ottawan deformation and metamorphism.
Johnson et al. 2005; Heumann, 2006; Bonamici et al. 2014; 2015
4 Xenoblastic grains partially overgrowing local S3 mylonitic fabric. Pronounced zoning marked by sharp changes in minor and trace elements and Th/U. Nearly uniform 18O across grain interiors with increasing 18O (up to 1‰) in outer grain domains, coincident with pronounced chemical zoning. Interpretation: Magmatic titanite crystallized in AMCG Diana syenite; solid-state grain-size reduction during Ottawan metamorphism and deformation; solid-state rim growth during waning Ottawan metamorphism.
Bonamici et al. 2014; 2105

Table 2. Total Pb/U (3D) isochron regressions of U-Pb titanite data and associated go
Concordia Intercept Age (Ma) 2σ ± (Ma) MSWD Prob. of Fit
TW plane incercept 238/2061
TYPE 1HA12BSHRIMP - uncon4 2.5 0 5.1SHRIMP - BH con5 1251 460 3.5 0LAICPMS - uncon 0.2 0.999 4.78LAICPMS - con6 1206 210 0.2 1
TYPE 2HA03A S1SHRIMP - uncon 4.7 0 4.76SHRIMP - BH con 1146 120 5.8 0LAICPMS - uncon 0.62 0.98 5.27LAICPMS - con 1111 48 0.63 0.98HA03A S2SHRIMP - uncon 3 0 4.4SHRIMP - con 1182 390 3.1 0LAICPMS - uncon 0.49 0.999 3.31LAICPMS - con 1128 130 1.5 0.016HA09A2 S3SHRIMP - uncon 5.5 0 4.03SHRIMP - con 1167 110 6.4 0HA09A S2LAICPMS - uncon 1.2 0.17 4.76LAICPMS - con 1143 110 1.2 0.18HA09A S15LAICPMS - uncon 0.56 0.98 5.33LAICPMS - con 1120 69 0.57 0.98
TYPE 3HA07B S1LAICPMS - uncon no solutionLAICPMS - con 1064 63 0.55 0.99HA07B S9LAICPMS - uncon 0.57 0.81 6.4LAICPMS - con 935 190 0.54 0.85HA08A S1LAICPMS - uncon 2.2 0.001 6.31LAICPMS - con 947 110 2.1 0.002HA12A S1LAICPMS - uncon 1.03 0.42 5.86LAICPMS - con 1016 44 1.03 0.41

HA18SHRIMP - uncon 4 0 4.3SHRIMP - con 1220 370 4.1 0LAICPMS - uncon 1.3 0.14 5.38LAICPMS - con 1101 38 1.3 0.13HA10DLAICPMS - uncon 0.71 0.96 5.7LAICPMS - con 1043 28 0.72 0.96
TYPE 4HA13 S1LAICPMS - uncon 0.37 1 5.24LAICPMS - con 1127 27 0.39 1HA13 S2SHRIMP - uncon 4.5 0 5.53SHRIMP - con 1124 75 5.8 0LAICPMS - uncon 0.74 0.94 5.23LAICPMS - con 1128 23 0.78 0.9
ALLSHRIMP - uncon no solutionSHRIMP - con no solutionLAICPMS - uncon no solutionLAICMPS - con no solution
63D isochron solution constrained with initial Pb composition based on present day Stacey and Kramers (1975) Pb
1Regressed Tera-Wasserburg plane intercept value. For grains formed between ~1200 and 1000 Ma, concordia (ra2Regressed common Pb plane intercept value. For grains formed between ~1200 and 1000 Ma, concordia (radioge3Ratio of regressed mean 207/204 and 206/204 values giving the upper intercept 207/206 value. Errors on 206/2044Unconstrained 3D isochron solution with no restriction on initial Pb composition. 53D isochron regression constrained with initial Pb composition based on the Broken Hills feldspar standard. Brokedoes not return a solution. Ratios less than zero are not allowed.

odness-of-fit metrics.
2σ ±
TW plane intercept 207/2061 2σ ±
Common Pb plane
intercept 206/2042 2σ ±
Common Pb plane
intercept 207/2042 2σ ±
1.4 0.128 0.025 9 27 8.7 4.40 45 12.8 6.2
0.95 0.06 0.12 -4 42 27 270 39 23.3 5.2
0.53 0.089 0.0081 -35 51 5.6 5.80 49 13.5 6.3
0.25 0.0807 0.0084 -8 37 21.5 7.30 37 25.3 4.5
1.6 0.097 0.016 -53 170 9 180 160 13 21
0.73 0.096 0.015 -448 270 -32 290 100 26 12
0.46 0.0888 0.0045 -14 54 6.3 5.40 56 13.3 6.8
0.56 0.078 0.012 -75 110 18 140 90 24 11
0.36 0.0811 0.008 56 54 26.1 7.948 54 28.7 6.4
100 87 37.1 9.9
1.3 0.078 0.028 280 210 28 35280 220 56 23
0.8 0.079 0.033 127 68 33 20128 68 38 7.5
0.27 0.081 0.013 75 30 26.9 9.675 30 32 3.8

1.6 0.094 0.022 -42 140 6 160 110 14 15
0.2 0.087 0.016 51 23 27 1050 23 33.7 3.8
0.17 0.0765 0.004 143 50 37.2 8.6141 51 41.1 5.9
0.14 0.0832 0.0084 36 11 25.5 3.936 11 28 1.9
0.36 0.0844 0.0045 28 19 14.1 2.314 23 15.1 2.8
0.11 0.0838 0.0067 46 11 27.5 3.946 11 30.9 2
values: 6/4 = 18.5 and 7/4 = 15.6, thus 7/6 = 0.843. Ratios less than zero are not allowed
adiogenic) values are in the range of 5-6.
enic) values are in the range 0.07-0.08.4 and 207/204 propagated in quadrature to determine uncertainty on 207/206.
en Hills fsp Pb ratios are: 6/4 = 16.0, 7/4 = 15.39, 8/4 = 35.66, thus 7/6 = 0.962. Used only when a present day Stace

Common Pb plane
intercept 207/2063 2σ ±
0.967 2.94undef undef-6.750 71.20undef undef
-0.160 0.29undef undef-2.688 12.46undef undef
-0.170 0.64undef undef0.071 0.08undef undef
-0.450 1.78undef undef
-0.240 0.40undef undef
0.466 0.470.598 0.69
0.371 0.34
0.100 0.150.200 0.18
0.260 0.210.297 0.17
0.359 0.190.427 0.18

-0.143 0.61undef undef0.529 0.310.674 0.32
0.260 0.110.291 0.11
0.708 0.240.778 0.24
0.504 0.351.079 1.780.598 0.170.672 0.17
y and Kramers (1975) correction


2400
2000
1600
1200800
0.04
0.08
0.12
0.16
0.20
0.24
0.28
0.32
1 3 5 7 9 11 13
238U/206Pb
207Pb/206Pb
data-point error ellipses are 2σ
Type 1
Type 2
Type 3
Type 4
207Pb/206Pb
800
1200
1600
2000
2400
0.04
0.08
0.12
0.16
0.20
0.24
1 3 5 7 9 11 13
data-point error ellipses are 2σ
SIMS
(SHRIMP)
LA-ICP-MS

2400
2000
1600
1200
800
0.04
0.08
0.12
0.16
0.20
0.24
1 3 5 7 9 11 13
20
7P
b/2
06P
b
LAICPMS
3D Lower: 1206 ± 210 Ma
3D MSWD: 0.20
2D Lower: 1247 ± 180 Ma
2D MSWD: 0.20
SHRIMP
3D Lower: 1251 ± 460 Ma
3D MSWD: 3.5
2D Lower: 1173 ± 280 Ma
2D MSWD: 0.78
HA12B S1 (1)
HA03A S1 (2)
0.04
0.08
0.12
0.16
0.20
0.24
1 3 5 7 9 11 13
2400
2000
1600
1200
800
LAICPMS
3D Lower: 1111 ± 48 Ma
3D MSWD: 0.63
2D Lower: 1098 ± 51 Ma
2D MSWD: 0.87
SHRIMP
3D Lower: 1146 ± 120 Ma
3D MSWD: 5.8
2D Lower: 1247 ± 160 Ma
2D MSWD: 5.9
20
7P
b/2
06P
b
HA03A S2 (2)
0.04
0.08
0.12
0.16
0.20
0.24
1 3 5 7 9 11 13
20
7P
b/2
06P
b
2400
2000
1600
1200
800
LAICPMS
3D Lower: 1128 ± 130 Ma
3D MSWD: 1.5
2D Lower: -799 ± 1400 Ma
2D MSWD: 0.36
SHRIMP
3D Lower: 1182 ± 390 Ma
3D MSWD: 3.1
2D Lower: 513 ± 390 Ma
2D MSWD: 2.4
HA09A S2 (2)
0.04
0.08
0.12
0.16
0.20
0.24
1 3 5 7 9 11 13
20
7P
b/2
06P
b
2400
2000
1600
1200
800
LAICPMS
3D Lower: 1143 ± 110 Ma
3D MSWD: 1.2
No 2D solution
HA09A S15 (2)
0.04
0.08
0.12
0.16
0.20
0.24
1 3 5 7 9 11 13
20
7P
b/2
06P
b
2400
2000
1600
1200
800
238U/
206Pb
LAICPMS
3D Lower: 1120 ± 69 Ma
3D MSWD: 0.57
2D Lower: 1036 ± 110 Ma
2D MSWD: 0.80
HA07B S1 (3)
0.04
0.08
0.12
0.16
0.20
0.24
1 3 5 7 9 11 13
2400
2000
1600
1200
800
LAICPMS
3D Lower: 1064 ± 63 Ma
3D MSWD: 0.55
2D Lower: 997 ± 110 Ma
2D MSWD: 0.51
HA07B S9 (3)
0.04
0.08
0.12
0.16
0.20
0.24
1 3 5 7 9 11 13
2400
2000
1600
1200
800
238U/
206Pb
LAICPMS
3D Lower: 935 ± 190 Ma
3D MSWD: 0.54
2D Lower: 752 ± 530 Ma
2D MSWD: 0.14
HA08A S1 (3)
0.04
0.08
0.12
0.16
0.20
0.24
1 3 5 7 9 11 13
2400
2000
1600
1200
800
LAICPMS
3D Lower: 947 ± 110 Ma
3D MSWD: 2.1
2D Lower: 717 ± 240 Ma
2D MSWD: 0.61
HA12A S1 (3)
0.04
0.08
0.12
0.16
0.20
0.24
1 3 5 7 9 11 13
2400
2000
1600
1200
800
LAICPMS
3D Lower: 1016 ± 44 Ma
3D MSWD: 1.03
2D Lower: 877 ± 130 Ma
2D MSWD: 0.67
HA01D (3)
0.04
0.08
0.12
0.16
0.20
0.24
1 3 5 7 9 11 13
2400
2000
1600
1200
800
LAICPMS
3D Lower: 1043 ± 28 Ma
3D MSWD: 0.72
2D Lower: 1004 ± 56 Ma
2D MSWD: 0.90
HA09A2 S3 (2)
0.04
0.08
0.12
0.16
0.20
0.24
1 3 5 7 9 11 13
20
7P
b/2
06P
b
2400
2000
1600
1200
800
SHRIMP
3D Lower: 1167 ± 110 Ma
3D MSWD: 6.4
2D Lower: 1155 ± 130 Ma
2D MSWD: 4.7
HA18 (3)
0.04
0.08
0.12
0.16
0.20
0.24
1 3 5 7 9 11 13
2400
2000
1600
1200
800
LAICPMS
3D Lower: 1101 ± 38 Ma
3D MSWD: 1.3
2D Lower: 879 ± 220 Ma
2D MSWD: 1.4
SHRIMP
3D Lower: 1220 ± 370 Ma
3D MSWD: 4.1
2D Lower: 1380 ± 290 Ma
2D MSWD: 2.6
σ
HA13 S1 (4)
0.04
0.08
0.12
0.16
0.20
0.24
1 3 5 7 9 11 13
2400
2000
1600
1200
800
LAICPMS
3D Lower: 1127 ± 27 Ma
3D MSWD: 0.39
2D Lower: 1117 ± 33 Ma
2D MSWD: 0.46
238U/
206Pb
HA13 S2 (4)
0.04
0.08
0.12
0.16
0.20
0.24
1 3 5 7 9 11 13
2400
2000
1600
1200
800
LAICPMS
3D Lower: 1128 ± 23 Ma
3D MSWD: 0.78
2D Lower: 1107 ± 31 Ma
2D MSWD: 0.87
SHRIMP
3D Lower: 1124 ± 75 Ma
3D MSWD: 5.8
2D Lower: 1044 ± 67 Ma
2D MSWD: 2.8

3000
2500
2000
800 700
1500
1000
1 2 3 4 5 6 7 8 9 10
0.05
0.10
0.15
0.20
0.25
A
BUnconstrained Tera-Wasserburg plane intercepts
1200
1400
1300
1200
1100
1000
900
800Co
nco
rdia
In
terc
ep
t A
ge (
Ma)
Type 1 Type 4Type 2 Type 3
LA-ICP-MS
SHRIMP
LA-ICP-MS
SHRIMP
20
7P
b/2
06P
b
238U/206Pb
Ottawan
Shawinigan
OttawanShawinigan

1175
1150
1125
1100
1075
1050
1025
1000
975
100 200 300 400 500 6000
Co
rrecte
d D
ate
(M
a)
Distance (micrometers)
HA03 S1.2 (Type 2)
SHRIMP 204-corr Date
LAICPMS 207-corr Date
1140
1120
1100
1080
1060
1040
1020
1000
0 100 200 300 400 500
1140
1120
1100
1080
1060
1040
1160
0 200 400 600 800 1000 1200
100 200 300 400 500 600
1200
1175
1150
1125
1100
1075
1050
0 200 400 600 800 1000 1200 1400
1175
1150
1125
1100
1075
1050
1200
1225
0 200 400 600 800 1000 1200 1400
1250
1200
1150
1100
1050
HA12B S1 (Type 1)
Co
rrec
ted
Date
(M
a)
Distance (micrometers)
Co
rrecte
d D
ate
(M
a)
Distance (micrometers)
Co
rrecte
d D
ate
(M
a)
Distance (micrometers)
Co
rrecte
d D
ate
(M
a)
Distance (micrometers)
Co
rrec
ted
Date
(M
a)
Distance (micrometers)
HA03 S2.2 (Type 2)
HA03 S1.1 (Type 2)
HA18 (Type 3) HA13 S2.1 (Type 4)
Mean concordia-
intercept ages:
1206 Ma (LA-ICP-MS)
1251 Ma (SHRIMP)

To
tal
20
7P
b/2
06P
b
Total 204Pb/206Pb
0.22
0.20
0.18
0.16
0.14
0.12
0.10
0.08
0.000 0.002 0.004 0.006 0.008 0.010 0.012
LA-ICP-MS
SHIRMP
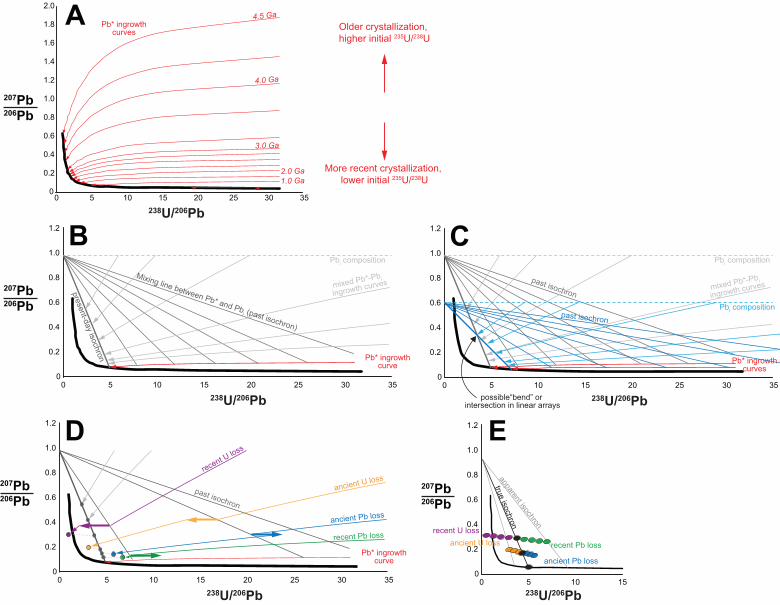
0 5 10 15 20 25 30 350
0.2
0.4
0.6
0.8
1.0
1.2
1.4
1.6
1.8
2.0
238U/206Pb
Older crystallization,
higher initial 235U/238U
More recent crystallization,
lower initial 235U/238U
A Pb* ingrowth
curves
4.5 Ga
4.0 Ga
3.0 Ga
2.0 Ga
1.0 Ga
207Pb206Pb
0 5 10 15 20 25 30 35
0
0.2
0.4
0.6
0.8
1.0
1.2
Pb* ingrowth
curve
pre
sent-d
ay is
ochro
n
238U/206Pb
B
Mixing line between Pb* and Pbi (past isochron)
207Pb206Pb
mixed Pb*-Pb i
ingrowth curves
Pbi composition
0 5 10 15 20 25 30 35
0
0.2
0.4
0.6
0.8
1.0
1.2
Pb* ingrowth
curve
238U/206Pb
D
recent Pb loss
ancient Pb loss
ancient U loss
recent U
loss
207Pb206Pb
past isochron
0 5 10 15 20 25 30 35
0
0.2
0.4
0.6
0.8
1.0
1.2
past isochron
Pb* ingrowth
curves
238U/206Pb
C
mixed Pb*-Pb i
ingrowth curves
Pbi composition
Pbi composition
past isochron
possible“bend” or
intersection in linear arrays
0 5 10 15
0
0.2
0.4
0.6
0.8
1.0
1.2
207Pb206Pb
true is
ochro
n
appare
nt is
ochro
n
ancient Pb loss
recent Pb loss
recent U loss
ancient U loss
238U/206Pb
E

2400
2000
1600
1200
800
0.04
0.08
0.12
0.16
0.20
0.24
1 3 5 7 9 11 13
204Pb/206Pb
.001
.012
20
7P
b/2
06P
b
238U/
206Pb
No 3D solution
2D Lower: 1138 ± 19 Ma
2D MSWD: 4.4
SHRIMP
A
2400
2000
1600
1200
800
0.04
0.08
0.12
0.16
0.20
0.24
1 3 5 7 9 11 13
204Pb-corrected206Pb/238U date
960
1220
20
7P
b/2
06P
b
238U/
206Pb
No 3D solution
2D Lower: 1144 ± 20 Ma
2D MSWD: 4.4
Type 1
Type 2
SHRIMP
C
No 3D solution
2D Lower: 1095 ± 17 Ma
2D MSWD: 1.9
1200
800
1600
2400
2000
1 3 5 7 9 11 13
238U/
206Pb
0.04
0.08
0.12
0.16
0.20
0.24
0.28
0.32
204Pb-corrected206Pb/238U date
980
1180
20
7P
b/2
06P
b
LA-ICP-MS
D
Type 1
Type 2
1 3 5 7 9 11 130.04
0.08
0.12
0.16
0.20
0.24
0.28
0.32
204Pb/206Pb
0
.0055
No 3D solution
2D Lower: 1067 ± 12 Ma
2D MSWD: 2.0
238U/
206Pb
20
7P
b/2
06P
b
800
1600
2400
2000
LA-ICP-MS
B

10 20 30 40 50 60 70 80 90 100
0.2
0.4
0
0.6
0.8
1.0
238U/206Pb
207Pb206Pb
1150 M
a is
ochro
n
mixed ingrowth curve (6% Pbi)
Pb* ingrowth curve
6% Pbi, no Pb loss
6% Pbi, 50% Pb loss, shorly after xllzn
6% Pbi, 50% Pb loss, long after xllzn
0% Pbi, no Pb loss
A
B
X X
2 3 4 5 6 7 8 9 10
0.05
0.10
0
0.15
0.20
0.25
238U/206Pb
207Pb206Pb
1150 Ma isochron
1050 Ma isochron