reconstructing mammalian phylogenies: a detailed
TRANSCRIPT
Reconstructing Mammalian Phylogenies: A DetailedComparison of the Cytochrome b and CytochromeOxidase Subunit I Mitochondrial GenesShanan S. Tobe1*, Andrew C. Kitchener2,3, Adrian M. T. Linacre4
1 Centre for Forensic Science, WestCHEM, Department of Pure and Applied Chemistry, University of Strathclyde, Glasgow, United Kingdom, 2 Department of Natural
Sciences, National Museums Scotland, Edinburgh, United Kingdom, 3 Institute of Geography, School of Geosciences, University of Edinburgh, Edinburgh, United Kingdom,
4 School of Biological Sciences, Flinders University, Adelaide, Australia
Abstract
The phylogeny and taxonomy of mammalian species were originally based upon shared or derived morphologicalcharacteristics. However, genetic analyses have more recently played an increasingly important role in confirming existingor establishing often radically different mammalian groupings and phylogenies. The two most commonly used genetic lociin species identification are the cytochrome oxidase I gene (COI) and the cytochrome b gene (cyt b). For the first time thisstudy provides a detailed comparison of the effectiveness of these two loci in reconstructing the phylogeny of mammals atdifferent levels of the taxonomic hierarchy in order to provide a basis for standardizing methodologies in the future.Interspecific and intraspecific variation is assessed and for the first time, to our knowledge, statistical confidence is appliedto sequence comparisons. Comparison of the DNA sequences of 217 mammalian species reveals that cyt b more accuratelyreconstructs their phylogeny and known relationships between species based on other molecular and morphologicalanalyses at Super Order, Order, Family and generic levels. Cyt b correctly assigned 95.85% of mammal species to SuperOrder, 94.31% to Order and 98.16% to Family compared to 78.34%, 93.36% and 96.93% respectively for COI. Cyt b also givesbetter resolution when separating species based on sequence data. Using a Kimura 2-parameter p-distance (x100) thresholdof 1.5–2.5, cyt b gives a better resolution for separating species with a lower false positive rate and higher positive predictivevalue than those of COI.
Citation: Tobe SS, Kitchener AC, Linacre AMT (2010) Reconstructing Mammalian Phylogenies: A Detailed Comparison of the Cytochrome b and CytochromeOxidase Subunit I Mitochondrial Genes. PLoS ONE 5(11): e14156. doi:10.1371/journal.pone.0014156
Editor: Robert DeSalle, American Museum of Natural History, United States of America
Received May 12, 2010; Accepted November 5, 2010; Published November 30, 2010
Copyright: � 2010 Tobe et al. This is an open-access article distributed under the terms of the Creative Commons Attribution License, which permitsunrestricted use, distribution, and reproduction in any medium, provided the original author and source are credited.
Funding: This project was funded by the Leverhulme Trust (Grant number A20080076) awarded to AMTL. The funders had no role in study design, datacollection and analysis, decision to publish, or preparation of the manuscript.
Competing Interests: The authors have declared that no competing interests exist.
* E-mail: [email protected]
Introduction
Species classification depends on our understanding of mor-
phology, behavior, ecology and genetics of organisms. Taxonomy
and systematics are dynamic disciplines, changing frequently
owing to new evidence and changing consensuses on species
definitions. Species boundaries and higher taxonomic categories
within the Mammalia are historically based on morphological
characteristics (e.g. [1–6]). More recently genetic comparisons
have led to greater understanding of lineages of related species,
especially at higher taxonomic levels, where derived morpholog-
ical characteristics can be difficult to determine owing to ancient
divergences, thus leading to often radically different phylogenies
and species groupings [1,7–13]. In recent years several molecular
and combined molecular and morphological studies have
confirmed the presence of four main Super Orders, the Afrotheria,
Xenarthra, Laurasiatheria and Euarchontoglires, which have
radically superseded previous taxonomic groupings [1,9,10].
The genetic loci of choice for many taxonomic and phylogenetic
studies are primarily found on the mitochondrial genome [14].
Within mitochondrial DNA (mtDNA) some gene sequences are
thought to exhibit little intraspecific variability, but show sufficient
interspecific variation to allow for estimation of degrees of
relatedness and divergence times via calibrated molecular clocks.
Studies have used many different loci on the mitochondrial
genome such as 12S rRNA (e.g. [15,16]), 16S rRNA (e.g. [17,18]),
COII (e.g. [19–21]) and others. However, the main locus used in
species discrimination until recently was cytochrome b (cyt b)
[22,23], which occurs between bases 14,747 and 15,887 in human
mtDNA [24,25]. More recently use of cytochrome oxidase subunit
I (COI) has increased owing primarily to its adoption by the
Barcode for Life Consortium [26,27]. COI is found between bases
5,904 and 7,445 in human mtDNA [24,25]. No previous study has
quantified intraspecific variation in these two loci and made direct
comparisons of their effectiveness in reconstructing mammalian
phylogeny, although a few previous studies have investigated a
limited number of species or gene fragments for particular Orders
(e.g. [28–31]).
Being able to diagnose species and determine interspecific
relationships are of primary importance in biology, ecology,
evolution, systematics, wildlife management, conservation and
forensic science. Typically phylogenetic studies depend on
sequencing one or, more usually, part of one of COI or cyt b,
followed by comparison with DNA sequences held on databases
(e.g. EMBL or GenBank) [32]. These comparisons assume that
registered sequence data are: i) correct and the sequence is not
PLoS ONE | www.plosone.org 1 November 2010 | Volume 5 | Issue 11 | e14156

from another species or contains errors; ii) diagnostic for each
representative of the species rather than being a rare example of
subspecies or individual variation; iii) and that all individuals of a
species have identical, or very similar, DNA sequences. It would be
expected that two members of the same species have nearly 100%
identity at either cyt b or COI. If the identity match is less than
100% then either there is some intraspecific variation, or the
compared sequence comes from an unknown, but closely related,
species. Although the degrees of intraspecific variation and
divergence between closely related species have been investigated
by some authors (e.g. 7.93% between and 0.43% within bird
species for COI [33]; 5.7% between and 1.5% within Stenella
species for cyt b [22]), these are generally poorly studied.
In addition many authors construct phylogenetic trees from
sequence data on the assumption that any tree based on genetic data
is the ‘true’ evolutionary history of those organisms (e.g. [33–35]).
When anomalies arise, these are often interpreted as cryptic species
[33]. However, cryptic species may be designated based on levels of
expected intraspecific variation observed between as few as two
individuals [36]. Currently the use of multiple genetic loci to infer
phylogeny is routine (e.g. [37,38]). However, if a single gene could
be used this would be beneficial because it would standardize the
loci used, and reduce cost, time and complexity of comparisons.
This study aims to compare entire sequences of COI and cyt b
from the same individuals to assess patterns of variation within and
between different mammalian species and to see how these relate
to their evolutionary histories. Specifically we wish to (i) identify if
either gene sequence can be used to reconstruct mammalian
evolutionary history and if so which one does this more accurately;
(ii) determine levels of variation within each gene between different
mammalian species; (iii) determine levels of intraspecific variation
within COI and cyt b and; (iv) identify which gene provides the
greatest power in distinguishing between closely related species.
For the first time this study will provide an unbiased analysis of
both genes using the same criteria for each and will make
recommendations based on their use in phylogenetic reconstruc-
tion and species discrimination in mammals.
Materials and Methods
2.1 Sequence Data and AlignmentAll sequence data were obtained from GenBank on the NCBI
website (http://www.ncbi.nlm.nih.gov/). For the interspecific
comparisons of cyt b and COI genes, whole mitochondrial genome
sequences from 236 mammals (comprising 29 Orders, 89 Families,
174 genera and 217 species) were obtained; a full list can be found in
Table S1 with references in Text S1. The cyt b and COI genes were
isolated from the complete sequences for alignment. It was assumed
that the sequences were correct and that species designations were
accurate, although it is possible that errors may have occurred.
Complete mitochondrial genome sequences were obtained for
945 humans, Homo sapiens, 130 domestic cattle, Bos taurus, and 35
domestic dogs, Canis familiaris, to assess intraspecific variation
(Table S2).
Sequences were aligned using ClustalW in the Molecular
Evolutionary Genetics Analysis (MEGA) software package version
4.0 [39–41] on a desktop PC. Pairwise and multiple alignment
parameters were gap opening penalty 15; gap extension penalty
6.66; delay divergent sequences 30%; DNA transition weight 0.5;
and no use of a negative matrix.
2.2 Phylogenetic Trees and AnalysisPhylogenetic trees were constructed for cyt b and COI sequence
alignments using the Maximum Parsimony, Neighbor-Joining,
Minimum Evolution and Maximum Likelihood methods. The
Maximum Parsimony, Neighbor-Joining and Minimum Evolution
methods were calculated in MEGA 4.0 [39,40,42]. Maximum
Likelihood trees were calculated using RAxML 7.2.3 [43] and
MrBayes 3.1.2 [44–48]. The trees were then exported as Newick
files and edited online, to assign color ranges using the Interactive
Tree Of Life (iTOL) [49]. Each taxonomic Order was assigned a
different color. Analysis of the phylogenetic trees showed that
overall the Maximum Likelihood phylogenetic trees compiled
using MrBayes showed the highest congruence with conventional
taxonomic species groupings (as described below in 2.2.1), so these
were used as the phylogenetic trees for detailed comparison.
The Maximum Parsimony trees were calculated using the
complete deletion option, all codon positions and a CNI level of 3
with an initial tree by random addition of sequences (10 replicates).
The Neighbor-Joining trees were calculated using complete
deletion, all codon positions, a Kimura 2-parameter model and
a CNI level of 1. The Minimum Evolution trees were calculated
using complete deletion, all codon positions and a Kimura 2-
parameter model, including transitions and transversions. All trees
were calculated using 1,000 bootstrap repetitions and a random
seed.
Maximum Likelihood trees calculated in RAxML [43] used
rapid bootstrapping and searched for the best ML Tree.
Bootstrapping was performed using a random seed, 100
repetitions, a general time reversible model of nucleotide
substitution [50] with the I model of rate heterogeneity [51] and
four discrete rate categories. Maximum Likelihood trees calculated
in MrBayes [44–48] were set to a DNA data type, a 464
nucleotide model, Nst of 6 with a Dirichlet prior, no covarion, four
states with frequencies of a Dirichlet prior, an invariable gamma
(default settings), vertebrate mitochondrial code and were
partitioned by codon position (1st, 2nd or 3rd base of a codon).
Markov chain Monte Carlo (MCMC) was executed in two
independent analyses starting from different random seeds and
calculated for 1 million generations, sampling every 100
generations and performing diagnostics every 1,000 generations.
Final trees were compiled from the two analyses with a burnin of
25% (15,002 total samples).
2.2.1 Phylogenetic Trees Used to Determine Degree of
Congruence. The phylogenies for cyt b and COI were assessed
for their ability to show the highest degree of congruence with
conventional taxonomic classifications in Super Orders, Orders,
Families and genera. Although the true evolutionary history of any
Class of organisms is unknown, for the purposes of comparison the
following phylogenies were used. For species-level classification,
Wilson and Reeder [52] (with minor modifications) was followed,
so that the number of taxa that did not correctly associate with
their taxonomic ranks was calculated and the percentage of
correctly associated taxa was calculated. Higher level taxonomic
ranks for placental mammals (Order and above) followed Murphy
et al. [53] and marsupial Orders followed Phillips et al. [54] and
Cardillo et al. [55]. For example, in the COI ML MrBayes tree
four of 24 species were not associated with the other Rodentia to
give a percentage correct classification of 85.7% compared with
64.3% for cyt b. Two values were calculated for each taxonomic
group for each gene. One included all the samples that were used,
whereas the second only included the putative full species.
Therefore, the five samples for Asian black bear subspecies
(Ursus thibetanus sspp.) were firstly treated as five samples for the
first percentage and then recalculated as one species for the second
percentage. Similar calculations were done for percentage correct
assignment to Families, but inter- and intrageneric inconsistencies
were noted and are commented on in the text, where applicable.
Mammalian Phylogeny Best Gene
PLoS ONE | www.plosone.org 2 November 2010 | Volume 5 | Issue 11 | e14156
For primates, carnivorans and cetaceans (excluding artiodactyls,
which are not represented as well in this study) good morpholog-
ical trees or super trees (combining molecular and morphological
data) are available for comparison with the molecular data from
this study [2,5,11,30,56–66]. These allowed more detailed
comparisons with those Orders, for which we have a good
taxonomic representation. Significant differences from these
classifications and phylogenies are discussed.
2.3 Data AnalysisSequence alignments were transferred to Excel for some
statistical analyses. Variation at each base position was estimated
by calculating the uncertainty according to Shannon [67] adapted
to aligned sequences, both DNA and amino acid, by Schneider
and Stephens [68]. This value, Rs, gives the degree of sequence
conservation per site:
Rs~ log 2N{ {Sp log 2pð Þ
where N is the number of options per site and p is the frequency of
each option per site. 100% identity at any given site for a DNA
alignment would result in an Rs of 2 (log24 = 2 bits of information).
Points of heteroplasmy were noted and included for the number of
sequences, but not counted as a separate ‘base’. For example, at
one base position, if out of 100 sequences 99 had an A and one
had an A/G heteroplasmy, then the probability was recorded as
99% A and 0% for T, C and G.
Moving averages of identity were calculated in 101 bp, 401 bp
and 601 bp sliding windows by taking a sum of the Rs values and
dividing it by 2X (2 being the Rs value for 100% identity and X
being the size of the window). Therefore, if a 101 bp sequence was
100% identical between all sequences a value of 1 would be
obtained. Boxes of 401 and 601 bps were used as these are the
approximate fragment sizes generally used for sequencing, when
working with cyt b and COI, respectively. This calculation was
also used to assess the level of variation over the entire genes.
MEGA 4.0 [39,40] was used to calculate nucleotide p-distance;
Kimura 2-parameter p-distance (K2P) and; synonymous and non-
synonymous p-distances using the Nei-Gojobori method. Nucle-
otide p-distance and K2P were calculated for the first, second and
third bases of each codon as well as an overall value for all bases.
Synonymous and non-synonymous differences were calculated
pairwise and as an overall value. Standard error estimates were
calculated using 1,000 bootstrap replicates from a random seed.
The data from the 236 mammal samples, 945 humans, 130
domestic cattle and 35 domestic dogs were calculated separately.
K2P values (x 100) were plotted according to their frequency.
Thresholds were identified where there was a split between K2P
values for within species (low values) and between species (high
values). Three potential thresholds were identified. Synonymous
differences were calculated per synonymous site (dS) and non-
synonymous differences were calculated per non-synonymous (dN)
site in both pairwise and as overall values, and dS and dN were
plotted against each other. Owing to the large number of
comparison points and the low variation within species, the
intraspecific dS and dN were plotted as overall means with error
bars representing the observed maximum and minimum values.
In addition, inter- and intraspecific data sets were combined
(1,343 sequences in total – duplicate sequences were removed, one
of each for dog, cattle and human) for both cyt b and COI to
produce a single database. K2P values were calculated pairwise for
all samples in the database. These values were compared to the
threshold values obtained. A comparison was considered positive if
it had a K2P (x100) falling below the threshold, which would
indicate that the comparison was between two members of the
same species. A comparison was considered negative if the K2P
(x100) was greater than the threshold, which would indicate that
the comparison was between two different species. A two-by-two
contingency table was calculated (Table 1) where nAB represents
true positives; naB represents false positives; nAb represents false
negatives; nab represents true negatives; nA represents all samples/
values from the same species; na represents all samples/values from
different species; nB represents total positive samples; and nb
represents total negative samples. Based on the contingency table
(Table 1), the frequency of obtaining a false positive was estimated
from the ratio of naB to na [69]. The frequency of obtaining a false
negative was estimated by the ratio from nAb to nA [69]. The true
sensitivity (nAB/nA), specificity (nab/na), positive predictive value
(nAB/nB) and negative predictive value (nab/nb) were also calculated
for each gene at each threshold [70].
Receiver Operator Characteristic (ROC) curves were plotted
using SPSS 17.0.0 (SPSS UK Ltd., Surry) and were plotted as 1–
specificity (X-axis) against sensitivity (Y-axis). The ROC curves
were analyzed with the smaller values indicating a positive result.
Standard errors of area were calculated in a non-parametric
distribution assumption with a 99% confidence level.
Results
3.1 Phylogenetic TreesFull phylogenetic trees for Maximum Parsimony, Neighbor-
Joining, Minimum Evolution and Maximum Likelihood methods
for the COI and cyt b genes can be found in the Figures S1–S11
and Tables S3 and S4. Analysis of the tree types (Table 2 and
Figure 1) demonstrated that the Maximum Likelihood trees
compiled using MrBayes [44–48] showed the highest congruence
with conventional classifications and expected evolutionary history
for both genes and were therefore used for detailed analysis
(Figure 2).
3.2 Data analysisSequence data, both interspecific and intraspecific, were
analyzed and results are summarized in Table 3.
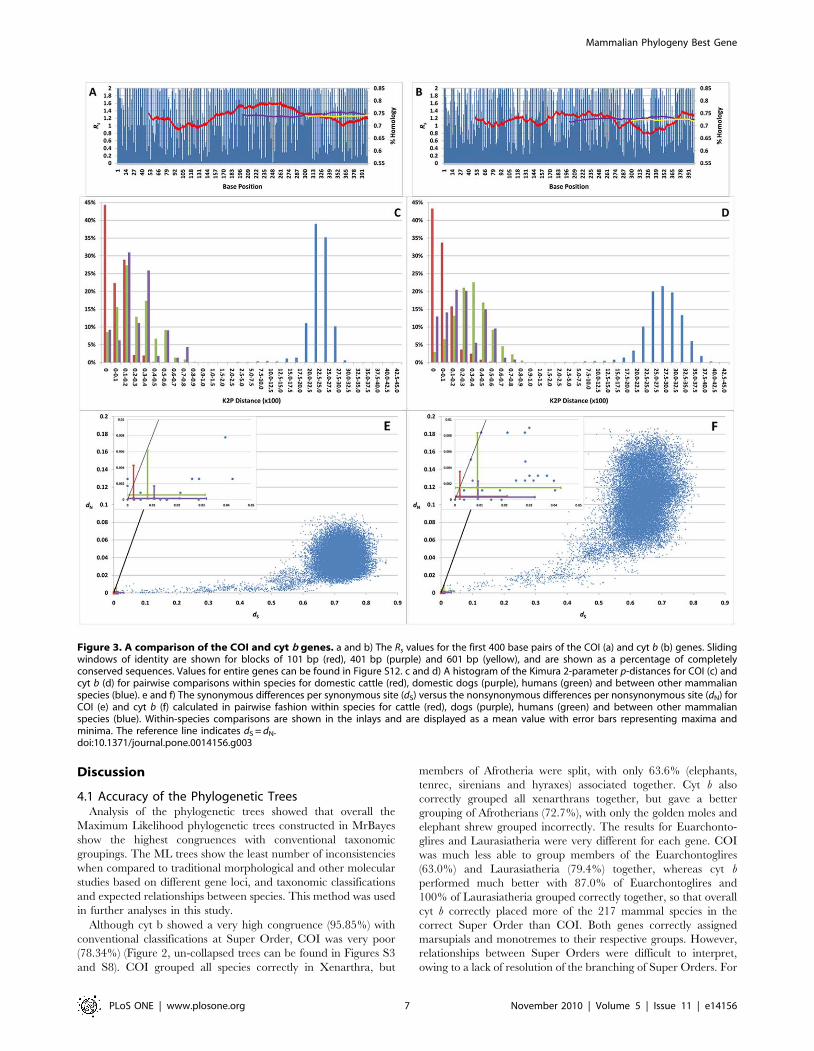
Variability (Rs) was determined at each base position for each
gene (Figure 3a, b and Figure S12). Between-species COI showed
an average Rs value of 74.5% of a completely conserved gene. Of
1,557 base pairs (bp) (largest variant), 56.3% were variable in at
least one sample. Sliding windows within COI of 101, 401 and
601 bp showed average Rs values of 74.6, 75.2 and 75.4% of a
conserved sequence, respectively. Cyt b showed an average Rs
Table 1. A two-by-two contingency table for K2P frequenciesfor the tabulation of the same species (A) or different species(a) with a K2P value (x 100) falling below or above (B or b) athreshold.
Same species (A) Different species (a) Total
, Threshold (B) nAB naB nB
. Threshold (b) nAb nab nb
Total nA na n
nAB represents true positives; naB represents false positives; nAb represents falsenegatives; nab represents true negatives; nA represents all samples/values fromthe same species; na represents all samples/values from different species; nB
represents total positive samples; nb represents total negative samples and; nrepresents the total number of samples/values. Adapted from [69].doi:10.1371/journal.pone.0014156.t001
Mammalian Phylogeny Best Gene
PLoS ONE | www.plosone.org 3 November 2010 | Volume 5 | Issue 11 | e14156
Table 2. A direct comparison of the five phylogenetic trees compiled for each of COI and cyt b.
Order Family
n total ,100% accuracy n chart ,100% accuracy n total ,100% accuracy
COI Neighbor-Joining 22 8 10 7 37 3
Maximum Parsimony 22 11 10 9 37 6
Minimum Evolution 22 7 10 6 37 3
Maximum Likelihood MrBayes 22 5 10 4 37 2
Maximum Likelihood RAxML 22 4 10 4 37 2
Cyt b Neighbor-Joining 22 3 10 3 37 1
Maximum Parsimony 22 9 10 4 37 4
Minimum Evolution 22 6 10 5 37 2
Maximum Likelihood MrBayes 22 3 10 3 37 2
Maximum Likelihood RAxML 22 4 10 4 37 2
n total refers to the total number of groups (Orders or Families) present in the trees. n chart refers to only those Orders which were used in Figure 1. ,100% accuracyrefers to any grouping which did not correspond to the expected grouping as given by conventional morphological and taxonomic analysis as described in Materialsand Methods section 2.2.1. The MrBayes Maximum Likelihood trees show the most accuracy overall. The Maximum Parsimony trees showed the least accuracy for bothgenes at both the Order and Family levels.doi:10.1371/journal.pone.0014156.t002
Figure 1. Analysis and comparison of different phylogenetic trees. An analysis of the correctly grouped Orders (a and b) and Families (c andd) for COI (a and c) and cyt b (b and d) from the different phylogenetic trees. Only Orders containing n$6 were included for analysis and all Familieswere included for n$2 (n is displayed in parentheses following the name of the Family). Bars indicate the percentage of correctly assigned taxonomicgroups and points indicate the percentage of correctly assigned species groups within the larger taxonomic designation. NJ- Neighbor-Joining tree;MP- Maximum Parsimony tree; ME- Minimum Evolution tree; MrBayes- MrBayes Maximum Likelihood; RAxML- RAxML Maximum Likelihood; NJ S-Neighbor-Joining species placement; MP S- Maximum Parsimony species placement; ME S- Minimum Evolution species placement; MrBayes S-MrBayes Maximum Likelihood species placement and; RAxML S - RAxML Maximum Likelihood species placement.doi:10.1371/journal.pone.0014156.g001
Mammalian Phylogeny Best Gene
PLoS ONE | www.plosone.org 4 November 2010 | Volume 5 | Issue 11 | e14156
Figure 2. Maximum Likelihood phylogenetic trees calculated using MrBayes [44–48] for COI and cyt b. Clades have been collapsedbased on Order at nodes where all subsequent branches belong to a particular Order. Full versions of these trees can be found in the Figures S3 andS8. Details of the collapsed orders can be found in Text S2.doi:10.1371/journal.pone.0014156.g002
Mammalian Phylogeny Best Gene
PLoS ONE | www.plosone.org 5 November 2010 | Volume 5 | Issue 11 | e14156
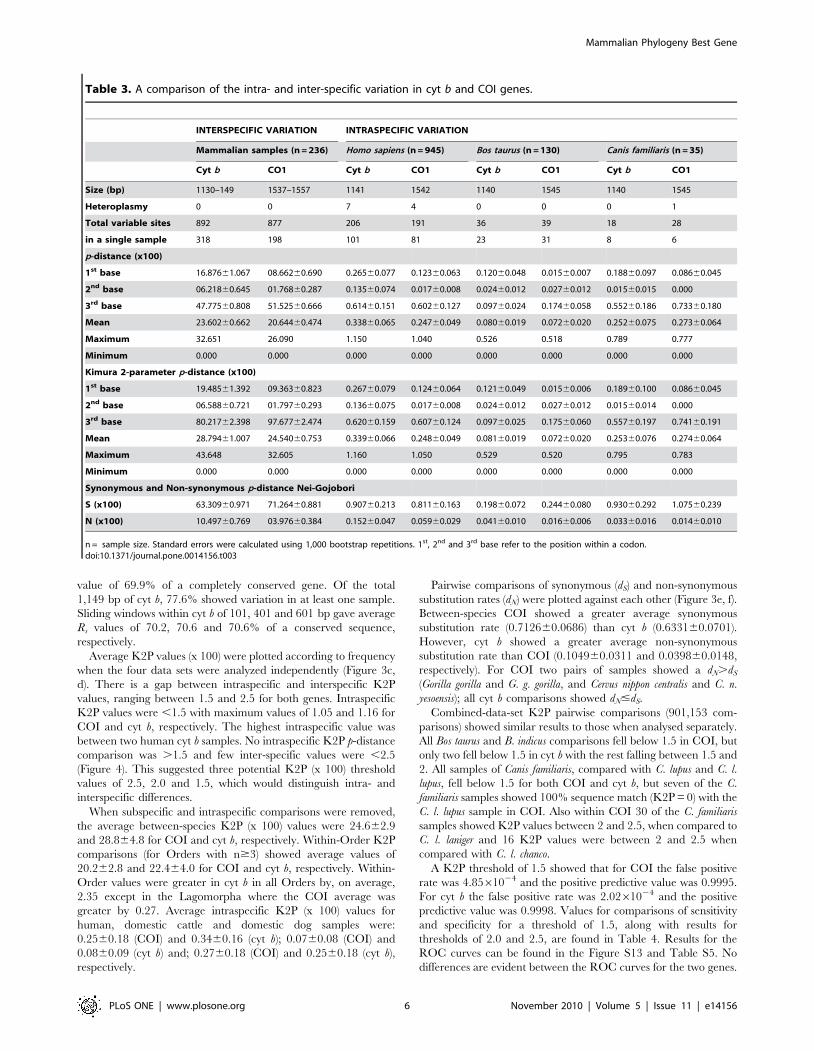
value of 69.9% of a completely conserved gene. Of the total
1,149 bp of cyt b, 77.6% showed variation in at least one sample.
Sliding windows within cyt b of 101, 401 and 601 bp gave average
Rs values of 70.2, 70.6 and 70.6% of a conserved sequence,
respectively.
Average K2P values (x 100) were plotted according to frequency
when the four data sets were analyzed independently (Figure 3c,
d). There is a gap between intraspecific and interspecific K2P
values, ranging between 1.5 and 2.5 for both genes. Intraspecific
K2P values were ,1.5 with maximum values of 1.05 and 1.16 for
COI and cyt b, respectively. The highest intraspecific value was
between two human cyt b samples. No intraspecific K2P p-distance
comparison was .1.5 and few inter-specific values were ,2.5
(Figure 4). This suggested three potential K2P (x 100) threshold
values of 2.5, 2.0 and 1.5, which would distinguish intra- and
interspecific differences.
When subspecific and intraspecific comparisons were removed,
the average between-species K2P (x 100) values were 24.662.9
and 28.864.8 for COI and cyt b, respectively. Within-Order K2P
comparisons (for Orders with n$3) showed average values of
20.262.8 and 22.464.0 for COI and cyt b, respectively. Within-
Order values were greater in cyt b in all Orders by, on average,
2.35 except in the Lagomorpha where the COI average was
greater by 0.27. Average intraspecific K2P (x 100) values for
human, domestic cattle and domestic dog samples were:
0.2560.18 (COI) and 0.3460.16 (cyt b); 0.0760.08 (COI) and
0.0860.09 (cyt b) and; 0.2760.18 (COI) and 0.2560.18 (cyt b),
respectively.
Pairwise comparisons of synonymous (dS) and non-synonymous
substitution rates (dN) were plotted against each other (Figure 3e, f).
Between-species COI showed a greater average synonymous
substitution rate (0.712660.0686) than cyt b (0.633160.0701).
However, cyt b showed a greater average non-synonymous
substitution rate than COI (0.104960.0311 and 0.039860.0148,
respectively). For COI two pairs of samples showed a dN.dS
(Gorilla gorilla and G. g. gorilla, and Cervus nippon centralis and C. n.
yesoensis); all cyt b comparisons showed dN#dS.
Combined-data-set K2P pairwise comparisons (901,153 com-
parisons) showed similar results to those when analysed separately.
All Bos taurus and B. indicus comparisons fell below 1.5 in COI, but
only two fell below 1.5 in cyt b with the rest falling between 1.5 and
2. All samples of Canis familiaris, compared with C. lupus and C. l.
lupus, fell below 1.5 for both COI and cyt b, but seven of the C.
familiaris samples showed 100% sequence match (K2P = 0) with the
C. l. lupus sample in COI. Also within COI 30 of the C. familiaris
samples showed K2P values between 2 and 2.5, when compared to
C. l. laniger and 16 K2P values were between 2 and 2.5 when
compared with C. l. chanco.
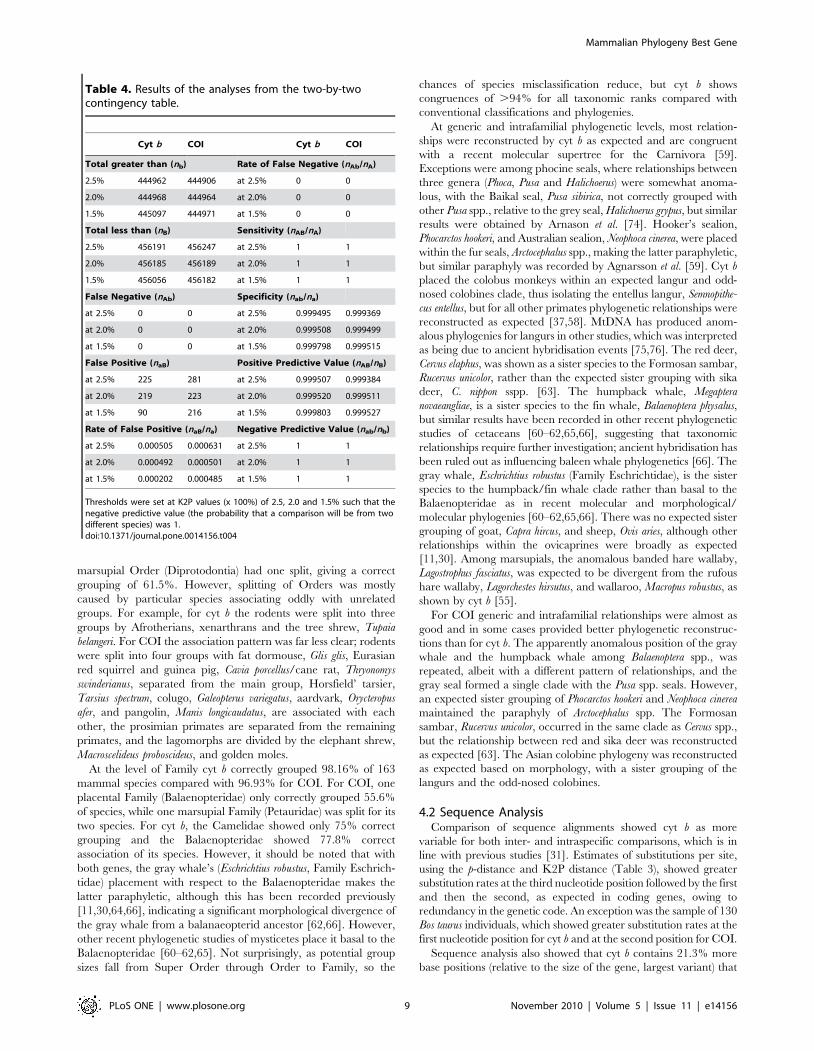
A K2P threshold of 1.5 showed that for COI the false positive
rate was 4.8561024 and the positive predictive value was 0.9995.
For cyt b the false positive rate was 2.0261024 and the positive
predictive value was 0.9998. Values for comparisons of sensitivity
and specificity for a threshold of 1.5, along with results for
thresholds of 2.0 and 2.5, are found in Table 4. Results for the
ROC curves can be found in the Figure S13 and Table S5. No
differences are evident between the ROC curves for the two genes.
Table 3. A comparison of the intra- and inter-specific variation in cyt b and COI genes.
INTERSPECIFIC VARIATION INTRASPECIFIC VARIATION
Mammalian samples (n = 236) Homo sapiens (n = 945) Bos taurus (n = 130) Canis familiaris (n = 35)
Cyt b CO1 Cyt b CO1 Cyt b CO1 Cyt b CO1
Size (bp) 1130–149 1537–1557 1141 1542 1140 1545 1140 1545
Heteroplasmy 0 0 7 4 0 0 0 1
Total variable sites 892 877 206 191 36 39 18 28
in a single sample 318 198 101 81 23 31 8 6
p-distance (x100)
1st base 16.87661.067 08.66260.690 0.26560.077 0.12360.063 0.12060.048 0.01560.007 0.18860.097 0.08660.045
2nd base 06.21860.645 01.76860.287 0.13560.074 0.01760.008 0.02460.012 0.02760.012 0.01560.015 0.000
3rd base 47.77560.808 51.52560.666 0.61460.151 0.60260.127 0.09760.024 0.17460.058 0.55260.186 0.73360.180
Mean 23.60260.662 20.64460.474 0.33860.065 0.24760.049 0.08060.019 0.07260.020 0.25260.075 0.27360.064
Maximum 32.651 26.090 1.150 1.040 0.526 0.518 0.789 0.777
Minimum 0.000 0.000 0.000 0.000 0.000 0.000 0.000 0.000
Kimura 2-parameter p-distance (x100)
1st base 19.48561.392 09.36360.823 0.26760.079 0.12460.064 0.12160.049 0.01560.006 0.18960.100 0.08660.045
2nd base 06.58860.721 01.79760.293 0.13660.075 0.01760.008 0.02460.012 0.02760.012 0.01560.014 0.000
3rd base 80.21762.398 97.67762.474 0.62060.159 0.60760.124 0.09760.025 0.17560.060 0.55760.197 0.74160.191
Mean 28.79461.007 24.54060.753 0.33960.066 0.24860.049 0.08160.019 0.07260.020 0.25360.076 0.27460.064
Maximum 43.648 32.605 1.160 1.050 0.529 0.520 0.795 0.783
Minimum 0.000 0.000 0.000 0.000 0.000 0.000 0.000 0.000
Synonymous and Non-synonymous p-distance Nei-Gojobori
S (x100) 63.30960.971 71.26460.881 0.90760.213 0.81160.163 0.19860.072 0.24460.080 0.93060.292 1.07560.239
N (x100) 10.49760.769 03.97660.384 0.15260.047 0.05960.029 0.04160.010 0.01660.006 0.03360.016 0.01460.010
n = sample size. Standard errors were calculated using 1,000 bootstrap repetitions. 1st, 2nd and 3rd base refer to the position within a codon.doi:10.1371/journal.pone.0014156.t003
Mammalian Phylogeny Best Gene
PLoS ONE | www.plosone.org 6 November 2010 | Volume 5 | Issue 11 | e14156
Discussion
4.1 Accuracy of the Phylogenetic TreesAnalysis of the phylogenetic trees showed that overall the
Maximum Likelihood phylogenetic trees constructed in MrBayes
show the highest congruences with conventional taxonomic
groupings. The ML trees show the least number of inconsistencies
when compared to traditional morphological and other molecular
studies based on different gene loci, and taxonomic classifications
and expected relationships between species. This method was used
in further analyses in this study.
Although cyt b showed a very high congruence (95.85%) with
conventional classifications at Super Order, COI was very poor
(78.34%) (Figure 2, un-collapsed trees can be found in Figures S3
and S8). COI grouped all species correctly in Xenarthra, but
members of Afrotheria were split, with only 63.6% (elephants,
tenrec, sirenians and hyraxes) associated together. Cyt b also
correctly grouped all xenarthrans together, but gave a better
grouping of Afrotherians (72.7%), with only the golden moles and
elephant shrew grouped incorrectly. The results for Euarchonto-
glires and Laurasiatheria were very different for each gene. COI
was much less able to group members of the Euarchontoglires
(63.0%) and Laurasiatheria (79.4%) together, whereas cyt b
performed much better with 87.0% of Euarchontoglires and
100% of Laurasiatheria grouped correctly together, so that overall
cyt b correctly placed more of the 217 mammal species in the
correct Super Order than COI. Both genes correctly assigned
marsupials and monotremes to their respective groups. However,
relationships between Super Orders were difficult to interpret,
owing to a lack of resolution of the branching of Super Orders. For
Figure 3. A comparison of the COI and cyt b genes. a and b) The Rs values for the first 400 base pairs of the COI (a) and cyt b (b) genes. Slidingwindows of identity are shown for blocks of 101 bp (red), 401 bp (purple) and 601 bp (yellow), and are shown as a percentage of completelyconserved sequences. Values for entire genes can be found in Figure S12. c and d) A histogram of the Kimura 2-parameter p-distances for COI (c) andcyt b (d) for pairwise comparisons within species for domestic cattle (red), domestic dogs (purple), humans (green) and between other mammalianspecies (blue). e and f) The synonymous differences per synonymous site (dS) versus the nonsynonymous differences per nonsynonymous site (dN) forCOI (e) and cyt b (f) calculated in pairwise fashion within species for cattle (red), dogs (purple), humans (green) and between other mammalianspecies (blue). Within-species comparisons are shown in the inlays and are displayed as a mean value with error bars representing maxima andminima. The reference line indicates dS = dN.doi:10.1371/journal.pone.0014156.g003
Mammalian Phylogeny Best Gene
PLoS ONE | www.plosone.org 7 November 2010 | Volume 5 | Issue 11 | e14156
cyt b most Afrotherians were closest to the Xenarthra, which is
regarded as basal among placentals (e.g. [1,10,71]), although not
in all phylogenies (e.g. [72]) as found here. The high degree of
splitting among members of the Laurasiatheria and Euarchonto-
glires for COI makes further interpretation difficult. The
monotremes grouped together correctly for both genes; for cyt b
they were the sister group to marsupials and basal to a mixed
grouping of Afrotherians, rodents and xenarthrans, but for COI
the Eurasian red squirrel, Sciurus vulgaris, was a sister species to the
monotremes between the perissodactyls and Afrotherians.
One notable aspect of these phylogenetic reconstructions is the
difference in branch lengths for different mammal groups. Larger
species, such as carnivorans, cetaceans, artiodactyls, primates, etc.,
tended to have much shorter branch lengths than for smaller
species, such as bats, rodents, hedgehogs, shrews, marsupials and
monotremes. This has been noted in previous phylogenetic
reconstructions and different explanations have been proposed,
including differences in generation times and longevity, but recent
analyses suggest that mutation rates differ for mtDNA between
different mammal lineages [73]. These differences would signif-
icantly affect phylogenetic reconstruction, owing to the distortion
of relationships between otherwise closely related taxonomic
groups. However, this is only understood for a limited number
of species.
At the level of Order cyt b grouped correctly 94.31% of 211
mammal species and COI gave a slightly lower percentage of
93.36%. For COI six placental mammal Orders were split with
maximum correct groupings ranging from 66.7% to 85.7%, and
one marsupial Order (Diprotodontia) was split with 92.3% correct
membership. In contrast, for cyt b only two placental Orders
(Lagomorpha and Rodentia) did not correctly group species,
varying between 60.0 and 64.3% correct membership, and one
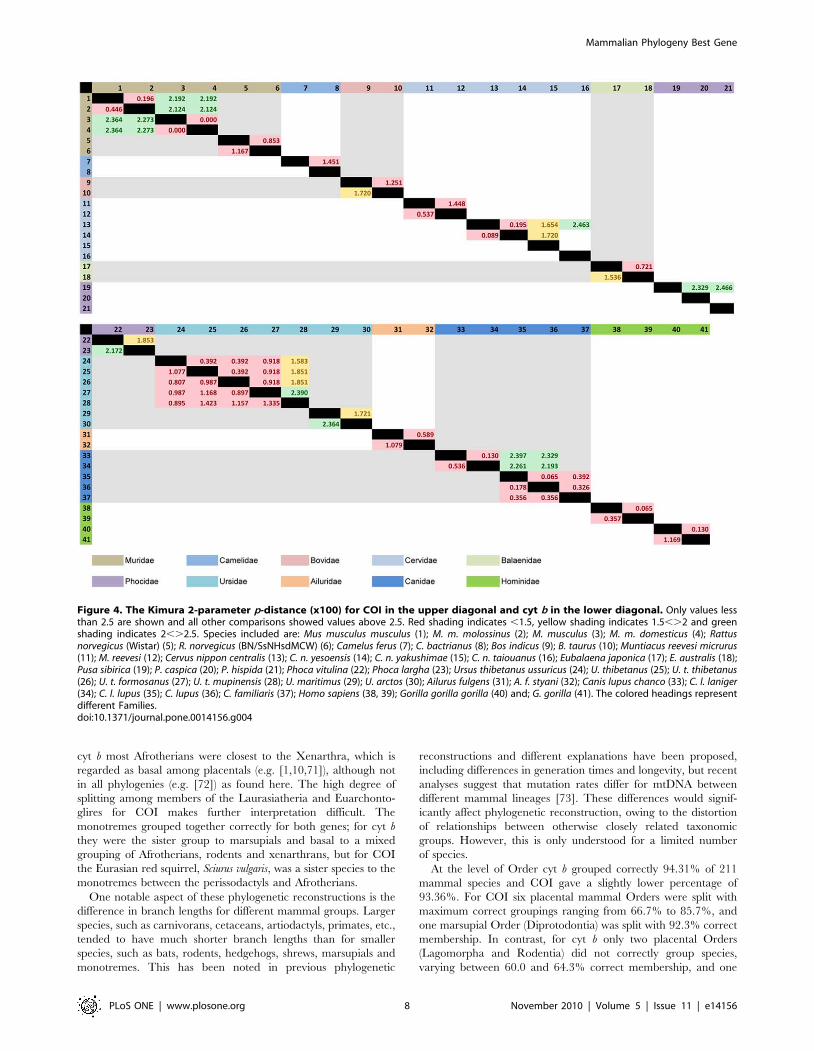
Figure 4. The Kimura 2-parameter p-distance (x100) for COI in the upper diagonal and cyt b in the lower diagonal. Only values lessthan 2.5 are shown and all other comparisons showed values above 2.5. Red shading indicates ,1.5, yellow shading indicates 1.5,.2 and greenshading indicates 2,.2.5. Species included are: Mus musculus musculus (1); M. m. molossinus (2); M. musculus (3); M. m. domesticus (4); Rattusnorvegicus (Wistar) (5); R. norvegicus (BN/SsNHsdMCW) (6); Camelus ferus (7); C. bactrianus (8); Bos indicus (9); B. taurus (10); Muntiacus reevesi micrurus(11); M. reevesi (12); Cervus nippon centralis (13); C. n. yesoensis (14); C. n. yakushimae (15); C. n. taiouanus (16); Eubalaena japonica (17); E. australis (18);Pusa sibirica (19); P. caspica (20); P. hispida (21); Phoca vitulina (22); Phoca largha (23); Ursus thibetanus ussuricus (24); U. thibetanus (25); U. t. thibetanus(26); U. t. formosanus (27); U. t. mupinensis (28); U. maritimus (29); U. arctos (30); Ailurus fulgens (31); A. f. styani (32); Canis lupus chanco (33); C. l. laniger(34); C. l. lupus (35); C. lupus (36); C. familiaris (37); Homo sapiens (38, 39); Gorilla gorilla gorilla (40) and; G. gorilla (41). The colored headings representdifferent Families.doi:10.1371/journal.pone.0014156.g004
Mammalian Phylogeny Best Gene
PLoS ONE | www.plosone.org 8 November 2010 | Volume 5 | Issue 11 | e14156
marsupial Order (Diprotodontia) had one split, giving a correct
grouping of 61.5%. However, splitting of Orders was mostly
caused by particular species associating oddly with unrelated
groups. For example, for cyt b the rodents were split into three
groups by Afrotherians, xenarthrans and the tree shrew, Tupaia
belangeri. For COI the association pattern was far less clear; rodents
were split into four groups with fat dormouse, Glis glis, Eurasian
red squirrel and guinea pig, Cavia porcellus/cane rat, Thryonomys
swinderianus, separated from the main group, Horsfield’ tarsier,
Tarsius spectrum, colugo, Galeopterus variegatus, aardvark, Orycteropus
afer, and pangolin, Manis longicaudatus, are associated with each
other, the prosimian primates are separated from the remaining
primates, and the lagomorphs are divided by the elephant shrew,
Macroscelideus proboscideus, and golden moles.
At the level of Family cyt b correctly grouped 98.16% of 163
mammal species compared with 96.93% for COI. For COI, one
placental Family (Balaenopteridae) only correctly grouped 55.6%
of species, while one marsupial Family (Petauridae) was split for its
two species. For cyt b, the Camelidae showed only 75% correct
grouping and the Balaenopteridae showed 77.8% correct
association of its species. However, it should be noted that with
both genes, the gray whale’s (Eschrichtius robustus, Family Eschrich-
tidae) placement with respect to the Balaenopteridae makes the
latter paraphyletic, although this has been recorded previously
[11,30,64,66], indicating a significant morphological divergence of
the gray whale from a balanaeopterid ancestor [62,66]. However,
other recent phylogenetic studies of mysticetes place it basal to the
Balaenopteridae [60–62,65]. Not surprisingly, as potential group
sizes fall from Super Order through Order to Family, so the
chances of species misclassification reduce, but cyt b shows
congruences of .94% for all taxonomic ranks compared with
conventional classifications and phylogenies.
At generic and intrafamilial phylogenetic levels, most relation-
ships were reconstructed by cyt b as expected and are congruent
with a recent molecular supertree for the Carnivora [59].
Exceptions were among phocine seals, where relationships between
three genera (Phoca, Pusa and Halichoerus) were somewhat anoma-
lous, with the Baikal seal, Pusa sibirica, not correctly grouped with
other Pusa spp., relative to the grey seal, Halichoerus grypus, but similar
results were obtained by Arnason et al. [74]. Hooker’s sealion,
Phocarctos hookeri, and Australian sealion, Neophoca cinerea, were placed
within the fur seals, Arctocephalus spp., making the latter paraphyletic,
but similar paraphyly was recorded by Agnarsson et al. [59]. Cyt b
placed the colobus monkeys within an expected langur and odd-
nosed colobines clade, thus isolating the entellus langur, Semnopithe-
cus entellus, but for all other primates phylogenetic relationships were
reconstructed as expected [37,58]. MtDNA has produced anom-
alous phylogenies for langurs in other studies, which was interpreted
as being due to ancient hybridisation events [75,76]. The red deer,
Cervus elaphus, was shown as a sister species to the Formosan sambar,
Rucervus unicolor, rather than the expected sister grouping with sika
deer, C. nippon sspp. [63]. The humpback whale, Megaptera
novaeangliae, is a sister species to the fin whale, Balaenoptera physalus,
but similar results have been recorded in other recent phylogenetic
studies of cetaceans [60–62,65,66], suggesting that taxonomic
relationships require further investigation; ancient hybridisation has
been ruled out as influencing baleen whale phylogenetics [66]. The
gray whale, Eschrichtius robustus (Family Eschrichtidae), is the sister
species to the humpback/fin whale clade rather than basal to the
Balaenopteridae as in recent molecular and morphological/
molecular phylogenies [60–62,65,66]. There was no expected sister
grouping of goat, Capra hircus, and sheep, Ovis aries, although other
relationships within the ovicaprines were broadly as expected
[11,30]. Among marsupials, the anomalous banded hare wallaby,
Lagostrophus fasciatus, was expected to be divergent from the rufous
hare wallaby, Lagorchestes hirsutus, and wallaroo, Macropus robustus, as
shown by cyt b [55].
For COI generic and intrafamilial relationships were almost as
good and in some cases provided better phylogenetic reconstruc-
tions than for cyt b. The apparently anomalous position of the gray
whale and the humpback whale among Balaenoptera spp., was
repeated, albeit with a different pattern of relationships, and the
gray seal formed a single clade with the Pusa spp. seals. However,
an expected sister grouping of Phocarctos hookeri and Neophoca cinerea
maintained the paraphyly of Arctocephalus spp. The Formosan
sambar, Rucervus unicolor, occurred in the same clade as Cervus spp.,
but the relationship between red and sika deer was reconstructed
as expected [63]. The Asian colobine phylogeny was reconstructed
as expected based on morphology, with a sister grouping of the
langurs and the odd-nosed colobines.
4.2 Sequence AnalysisComparison of sequence alignments showed cyt b as more
variable for both inter- and intraspecific comparisons, which is in
line with previous studies [31]. Estimates of substitutions per site,
using the p-distance and K2P distance (Table 3), showed greater
substitution rates at the third nucleotide position followed by the first
and then the second, as expected in coding genes, owing to
redundancy in the genetic code. An exception was the sample of 130
Bos taurus individuals, which showed greater substitution rates at the
first nucleotide position for cyt b and at the second position for COI.
Sequence analysis also showed that cyt b contains 21.3% more
base positions (relative to the size of the gene, largest variant) that
Table 4. Results of the analyses from the two-by-twocontingency table.
Cyt b COI Cyt b COI
Total greater than (nb) Rate of False Negative (nAb/nA)
2.5% 444962 444906 at 2.5% 0 0
2.0% 444968 444964 at 2.0% 0 0
1.5% 445097 444971 at 1.5% 0 0
Total less than (nB) Sensitivity (nAB/nA)
2.5% 456191 456247 at 2.5% 1 1
2.0% 456185 456189 at 2.0% 1 1
1.5% 456056 456182 at 1.5% 1 1
False Negative (nAb) Specificity (nab/na)
at 2.5% 0 0 at 2.5% 0.999495 0.999369
at 2.0% 0 0 at 2.0% 0.999508 0.999499
at 1.5% 0 0 at 1.5% 0.999798 0.999515
False Positive (naB) Positive Predictive Value (nAB/nB)
at 2.5% 225 281 at 2.5% 0.999507 0.999384
at 2.0% 219 223 at 2.0% 0.999520 0.999511
at 1.5% 90 216 at 1.5% 0.999803 0.999527
Rate of False Positive (naB/na) Negative Predictive Value (nab/nb)
at 2.5% 0.000505 0.000631 at 2.5% 1 1
at 2.0% 0.000492 0.000501 at 2.0% 1 1
at 1.5% 0.000202 0.000485 at 1.5% 1 1
Thresholds were set at K2P values (x 100%) of 2.5, 2.0 and 1.5% such that thenegative predictive value (the probability that a comparison will be from twodifferent species) was 1.doi:10.1371/journal.pone.0014156.t004
Mammalian Phylogeny Best Gene
PLoS ONE | www.plosone.org 9 November 2010 | Volume 5 | Issue 11 | e14156
are variable than does COI. Rs values demonstrated more
variability (+3.1%) than COI in a sequence that is 408 bp shorter
(1149 bp for cyt b and 1557 bp for COI, largest variants). For both
genes within the 945 human samples <50% of the variable sites
were variable in only one sample (Table 3) with similar results
between the 130 domestic cattle individuals. Domestic dog
samples showed a different pattern in both genes with less
mutations appearing in only one sample.
The average number of synonymous substitutions per synon-
ymous site was greater in both genes than the average number of
nonsynonymous substitutions per nonsynonymous site for all data
sets. Pairwise comparisons showed dS.dN and are almost equal
between the two genes, indicating that both genes are in states of
purifying and neutral selection. Two COI pairwise comparisons
showed dN.dS; Gorilla gorilla and G. g. gorilla, and Cervus nippon
centralis and C. n. yesoensis. However, these two comparisons showed
a dN almost equal to dS, and almost on the reference line (Figure 3e
inlay). They are within the dN and dS values obtained for domestic
cattle and human intraspecific comparisons.
4.3 Determining ThresholdsBased on the K2P histogram (Figure 3), a clear separation
between inter- and intraspecific comparisons can be seen, falling
between 1.5 and 2.5. This is similar to what has been identified in
similar studies with other Classes of organisms [22,33,77–81].
With all intraspecific comparisons falling well below K2P = 1.5,
the largest being 1.16, our analysis suggests that a K2P = 1.5 can
be adopted as a minimum threshold for mammalian species
separation. A K2P ,1.5 indicates the samples come from the same
species and a K2P.2.5 indicates that the sample comes from a
different mammalian species for COI and cyt b. This leaves a gray
area of 1.5#K2P#2.5, where there is the possibility that
intraspecific variation is greater than predicted and would require
analysis of more than one locus. We feel that this gray area is
important because, despite the huge number of sequences on the
databases, there are still insufficient data to properly assess
intraspecific variability for all organisms. These thresholds can
be refined as more intraspecific analyses are undertaken.
4.4 Inter- and Intra-specific AnalysesThe K2P distance [82] is the most widely used metric in
analyses using COI [83] and was used for our comparisons of
inter- and intraspecific differences. Using 217 species (236 samples)
to examine interspecific variation, cyt b demonstrated greater K2P
values (x100) with a greater standard deviation at both the species
(average 28.864.8) and Order (average 22.464.0) levels com-
pared with those from COI (24.662.9 and 20.262.8 on average
for species and Order, respectively).
Interspecific analysis showed that most (.99.99%) interspecific
comparisons fell above K2P = 2.5 (27 and 37 out of 27,727
comparisons for cyt b and COI, respectively, fell below). Those
comparisons falling below a K2P distance (x100) of 2.5 were
generally between species (or some subspecies) or genera. COI
K2P values showed two intrageneric comparisons with values
,1.5 (1.251 between Bos indicus and B. taurus; 0.721 between
Eubalaena japonica and E. australis), but cyt b K2P values for these
two comparisons were .1.5 (1.720 between B. indicus and B. taurus;
1.536 between E. japonica and E. australis). All cyt b K2P values
,1.5 were between subspecies (Figure 4). However, the different
levels of K2P values for COI and cyt b reflect taxonomic
uncertainty as to how these taxon pairs are treated; in some cases
they are full species, and in others they are regarded as conspecific
with B. taurus and E. australis respectively.
One comparison gave K2P = 0 for both COI and cyt b between
Mus musculus and M. m. domesticus, which was almost certainly
because of inaccurate taxonomic designation of the M. musculus
sample, which is likely to be M. m. domesticus (N.B. The subspecies
musculus and domesticus are often treated as separate species). This
misclassification is a recognized problem associated with online
databases [84,85]. Conversely, all Palaearctic badgers were treated
as a single species, Meles meles, until a recent morphological analysis
revealed three species, including the Japanese badger, M. anakuma
[86], which is confirmed by K2P values of 8.736 for cyt b and
6.734 for COI in this study.
Intraspecific variation was examined using mtDNA data from
945 human, 35 domestic dog and 130 domestic cattle samples. For
both genes and all three data sets, intraspecific variation was below
a K2P value (x100) of 1.5. This is similar to what was found in a
similar, but smaller study [81]. Comparisons of the two genes
showed that cyt b demonstrated greater intraspecific K2P values
for human and domestic cattle samples (1.367 and 1.125 times
greater than average COI values, respectively). However, domestic
dog samples showed average K2P values 1.083 times greater in the
COI comparison. The amalgamation of all four data sets showed
all Bos taurus and B. indicus comparisons falling below K2P = 1.5 in
COI, but only two fell below 1.5 in cyt b, with the rest falling
between 1.5 and 2. This could be due to misclassification of some
of the B. indicus samples (which may have been B. taurus) or might
be due to potential hybrid individuals.
Conversely, even though COI showed greater intraspecific
variation within the domestic dog samples, it did not perform as
well as cyt b in the combined data set. Seven of the Canis familiaris
samples showed 100% sequence match (K2P = 0) with the C. l. lupus
sample in COI. The closest sequence match between C. familiaris and
C. l. lupus in cyt b was K2P (x100) = 0.09 for one sample. C. lupus
from the Middle East is known to be the ancestor of domestic dogs,
perhaps with various genetic infusions from local northern wolf
populations [87]. Also within COI, 30 of the C. familiaris samples
showed K2P values between 2 and 2.5, when compared to C. l. laniger
and 16 domestic dog samples had K2P values between 2 and 2.5
when compared with C. l. chanco. This was not observed within the
cyt b comparison. This indicates that cyt b is better suited for species
differentiation, being able to better separate closely related
congeneric species. However, it should be noted that recent
molecular studies have suggested that C. lupus may well represent
more than one species, with Himalayan/Tibetan wolves, C. l. chanco/
laniger, regarded as possibly specifically distinct from C. lupus [88].
Other anomalies within the combined dataset K2P comparisons
are: Camelus bactrianus and C. b. ferus show K2P ,1.5 with COI but
.2.5 with cyt b and Ursus thibetanus mupinensis with U. t. ussuricus, U.
thibetanus, U. t. thibetanus and U. t. formosanus show K2P .1.5 with
COI but ,1.5 for cyt b. Domestic and wild Bactrian camels are
morphologically similar, but it is increasingly normal for wild
counterparts for domestic mammals to be treated as distinct
species, following the ruling of the International Commission for
Zoological Nomenclature [89]. A recent mtDNA study supports
the specific differentiation between wild and domestic Bactrian
camels [90]. The intraspecific taxonomy of the Asian black bear is
in much need of revision [91], but only U. t. ussuricus and island
populations (e.g. U. t. formosanus) are likely to be regarded as
subspecifically distinctive, owing to geographical isolation. In both
cases cyt b is likely to be giving a more accurate assessment of the
taxonomic distinctiveness of these taxa.
4.5 Statistical AnalysisStatistical tests have been applied, for the first time to our
knowledge, to sequence comparisons for identification purposes.
Mammalian Phylogeny Best Gene
PLoS ONE | www.plosone.org 10 November 2010 | Volume 5 | Issue 11 | e14156
Although the statistical results are similar for both genes (ROC
curves show no differences, see Figure S13 and Table S5), cyt b
displays a greater ability to distinguish between samples originat-
ing from the same or different species.
All potential threshold values showed no false negatives for both
genes, meaning that none of the intraspecific comparisons in our
study would be shown to originate from two different species. The
two genes do start to be differentiated by the rate of false positives,
where COI has a value (at a threshold of 1.5) 2.4 times great than
cyt b. This is shown in the false positives obtained; 90 for cyt b
versus 216 for COI. These values become almost equal if the
threshold is increased to 2.0, but an increase of the threshold also
decreases the positive predictive value. This demonstrates that a
K2P value of 1.5 provides the most accurate threshold value to
determine the specific identity of unknown samples.
This is the first report that applies a statistical approach to
determine the accuracy of sequence data being used for
identification purposes; the key threshold value of 1.5 for cyt b
will now allow unknown samples to be identified with confidence
when compared to database or reference samples. This method
sets a precedent that can be applied for use with other online
sequence databases. These methods can also be applied to other
studies or for other genes, for validation purposes.
4.6 ConclusionsAlthough our comparisons for COI and cyt b show similar
results, cyt b demonstrates: (i) greater congruence with conven-
tional mammalian phylogeny; (ii) greater variation in base pairs in
a shorter sequence; (iii) that its intraspecific variation is similar to
that of COI and still remains below a nominal threshold and; (iv)
that it has a rate of false positive less than half that of COI and a
greater positive predictor value. This is the first study to compare
the relative values of cyt b and COI for phylogenetic reconstruc-
tion and identification of mammalian species despite much
investment in the previous use of both these loci. For the first
time statistical confidence has been applied to species identifica-
tion. If one locus is to be used as a standard for mammalian species
phylogeny and identification, our data supports the use of cyt b
over that of COI.
Supporting Information
Text S1 Supplementary references.
Found at: doi:10.1371/journal.pone.0014156.s001 (0.05 MB
DOC)
Text S2 Supplementary Figure 2 caption.
Found at: doi:10.1371/journal.pone.0014156.s002 (0.03 MB
DOC)
Figure S1 The evolutionary history inferred using the Minimum
Evolution method [S115] for COI. The optimal tree with the sum of
branch length = 17.26235975 is shown. The percentage of replicate
trees in which the associated taxa clustered together in the bootstrap
test (1,000 replicates) [S116] are show as symbols on the branches
(for values .75%). The tree is drawn to scale, with branch lengths in
the same units as those of the evolutionary distances used to infer the
phylogenetic tree. The evolutionary distances were computed using
the Kimura 2-parameter method [S117] and are in the units of the
number of base substitutions per site. The ME tree was searched
using the Close-Neighbor-Interchange (CNI) algorithm [S118] at a
search level of 1. The Neighbor-joining algorithm [S119] was used
to generate the initial tree.
Found at: doi:10.1371/journal.pone.0014156.s003 (10.30 MB
EPS)
Figure S2 The evolutionary history inferred using the Maxi-
mum Parsimony method [S120] for COI. The consensus tree
inferred from 15 most parsimonious trees is shown. The
consistency index is 0.051612, the retention index is (0.500358),
and the composite index is 0.027801 (0.025824) for all sites and
parsimony-informative sites (in parentheses). The percentage of
parsimonious trees in which the associated taxa clustered together
are shown as symbols (for values .75%). The MP tree was
obtained using the Close-Neighbor-Interchange algorithm [S118]
with search level 3 [S110–18] in which the initial trees were
obtained with the random addition of sequences (10 replicates).
There were a total of 1537 positions in the final dataset, out of
which 744 were parsimony informative.
Found at: doi:10.1371/journal.pone.0014156.s004 (10.29 MB
EPS)
Figure S3 The evolutionary history inferred using the Maxi-
mum Likelihood method as calculated using MrBayes [S111–112]
for COI. Markov chain Monte Carlo (MCMC) [S121] was
executed in two independent analyses starting from different
random seeds, parameters were DNA data type, a 464 nucleotide
model, Nst of 6 with a Dirichlet prior, no covarion, four states with
frequencies of a Dirichlet prior, an invariable gamma (default
settings), vertebrate mitochondrial code and were partitioned by
codon position (1st, 2nd or 3rd base of a codon) [S122–123]. The
consensus tree was inferred from 15,002 trees. Total tree length is
59.710509 with variance of 2.341455. The median tree length of
all sampled trees is 59.749; the lower and upper boundaries of the
95% credibility interval are 56.876 and 62.723, respectively. The
six reversible substitution rates, four stationary state frequencies
(pi), the shape of the gamma distribution (a) and the proportion of
invariable sites (pinvar) can be found in Table S3. Posterior
probabilities are shown as symbols on the branches (for values
.75%).
Found at: doi:10.1371/journal.pone.0014156.s005 (10.28 MB
EPS)
Figure S4 The evolutionary history inferred using the Neighbor-
Joining method [S119] for COI. The optimal tree with the sum of
branch length = 17.29940543 is shown. The percentage of
replicate trees in which the associated taxa clustered together in
the bootstrap test (1,000 replicates) [S116] are show as symbols on
the branches (for values .75%). The tree is drawn to scale, with
branch lengths in the same units as those of the evolutionary
distances used to infer the phylogenetic tree. The evolutionary
distances were computed using the Kimura 2-parameter method
[S117] and are in the units of the number of base substitutions per
site.
Found at: doi:10.1371/journal.pone.0014156.s006 (10.29 MB
EPS)
Figure S5 The evolutionary history inferred using the Maxi-
mum Likelihood method as calculated using RAxML [S113] for
COI. Rapid bootstrapping was used followed by searching for the
best ML Tree. Bootstrapping was performed using a random seed,
100 repetitions, a general time reversible model of nucleotide
substitution [S124] with the I model of rate heterogeneity [S125]
and four discrete rate categories. Tree length is 52.96548. The six
reversible substitution rates, four stationary state frequencies (pi),
the shape of the gamma distribution (a) and the proportion of
invariable sites (pinvar) can be found in Table S4. Posterior
probabilities are shown as symbols on the branches (for values
.75%).
Found at: doi:10.1371/journal.pone.0014156.s007 (10.27 MB
EPS)
Mammalian Phylogeny Best Gene
PLoS ONE | www.plosone.org 11 November 2010 | Volume 5 | Issue 11 | e14156
Figure S6 The evolutionary history inferred using the Minimum
Evolution method [S115] for cyt b. The optimal tree with the sum
of branch length = 19.25186677 is shown. The percentage of
replicate trees in which the associated taxa clustered together in
the bootstrap test (1,000 replicates) [S116] are shown as symbols
on the branches (for values .75%). The tree is drawn to scale,
with branch lengths in the same units as those of the evolutionary
distances used to infer the phylogenetic tree. The evolutionary
distances were computed using the Kimura 2-parameter method
[S117] and are in the units of the number of base substitutions per
site. The ME tree was searched using the Close-Neighbor-
Interchange (CNI) algorithm [S118] at a search level of 1. The
Neighbor-joining algorithm [S119] was used to generate the initial
tree.
Found at: doi:10.1371/journal.pone.0014156.s008 (10.27 MB
EPS)
Figure S7 The evolutionary history inferred using the Maxi-
mum Parsimony method [S120] for cyt b. The consensus tree
inferred from 15 most parsimonious trees is shown. The
consistency index is 0.065208, the retention index is (0.508168),
and the composite index is 0.034876 (0.033137) for all sites and
parsimony-informative sites (in parentheses). The percentage of
parsimonious trees in which the associated taxa clustered together
are shown as symbols (for values .75%). The MP tree was
obtained using the Close-Neighbor-Interchange algorithm [S118]
with search level 3 [S110–118] in which the initial trees were
obtained with the random addition of sequences (10 replicates).
There were a total of 1124 positions in the final dataset, out of
which 710 were parsimony informative.
Found at: doi:10.1371/journal.pone.0014156.s009 (10.27 MB
EPS)
Figure S8 The evolutionary history inferred using the Maxi-
mum Likelihood method as calculated using MrBayes [S111–112]
for cyt b. Markov chain Monte Carlo (MCMC) [S121] was
executed in two independent analyses starting from different
random seeds, parameters were DNA data type, a 464 nucleotide
model, Nst of 6 with a Dirichlet prior, no covarion, four states with
frequencies of a Dirichlet prior, an invariable gamma (default
settings), vertebrate mitochondrial code and were partitioned by
codon position (1st, 2nd or 3rd base of a codon) [S122–123]. The
consensus tree was inferred from 15,002 trees. Total tree length is
59.66446 with variance of 2.882398. The median tree length of all
sampled trees is 59.532; the lower and upper boundaries of the
95% credibility interval are 56.701 and 63.177, respectively. The
six reversible substitution rates, four stationary state frequencies
(pi), the shape of the gamma distribution (a) and the proportion of
invariable sites (pinvar) can be found in Table S3. Posterior
probabilities are shown as symbols on the branches (for values
.75%).
Found at: doi:10.1371/journal.pone.0014156.s010 (10.28 MB
EPS)
Figure S9 The evolutionary history inferred using the Neighbor-
Joining method [S119] for cyt b. The optimal tree with the sum of
branch length = 19.31726074 is shown. The percentage of replicate
trees in which the associated taxa clustered together in the bootstrap
test (1,000 replicates) [S116] are shown as symbols on the branches
(for values .75%). The tree is drawn to scale, with branch lengths in
the same units as those of the evolutionary distances used to infer the
phylogenetic tree. The evolutionary distances were computed using
the Kimura 2-parameter method [S117] and are in the units of the
number of base substitutions per site.
Found at: doi:10.1371/journal.pone.0014156.s011 (10.27 MB
EPS)
Figure S10 The evolutionary history inferred using the Maxi-
mum Likelihood method as calculated using RAxML [S113] for
cyt b. Rapid bootstrapping was used followed by searching for the
best ML Tree. Bootstrapping was performed using a random seed,
100 repetitions, a general time reversible model of nucleotide
substitution [S124] with the I model of rate heterogeneity [S125]
and four discrete rate categories. Tree length is 66.78724. The six
reversible substitution rates, four stationary state frequencies (pi),
the shape of the gamma distribution (a) and the proportion of
invariable sites (pinvar) can be found in Table S4. Posterior
probabilities are shown as symbols on the branches (for values
.75%).
Found at: doi:10.1371/journal.pone.0014156.s012 (10.27 MB
EPS)
Figure S11 Legend for Figures S1–S10. Phylogenetic trees
based on the aligned sequences for cyt b and COI of 236 mammals
(compromising 29 Orders, 89 Families, 174 genera and 217
species). Color ranges are the same for all trees and correspond to
the Order of the species. Minimum Evolution, Maximum
Parsimony and Neighbor-Joining phylogenetic trees were created
in MEGA 4.0 [S109–110]. Maximum Likelihood phylogenetic
trees were calculated in MrBayes [S111–112] and RAxML
[S113]. All trees were exported and edited online using the
Interactive Tree Of Life (iTOL) [S114] to define color ranges and
export as image files.
Found at: doi:10.1371/journal.pone.0014156.s013 (9.07 MB EPS)
Figure S12 The Rs values for COI (A) and cyt b (B) over the
entire genes represented by the blue bars. A value of 2 represents
100% conservation over all species at that base. Moving averages
of homology are shown for blocks of 101 bp (red) 401 bp (purple)
and 601 bp (yellow).
Found at: doi:10.1371/journal.pone.0014156.s014 (8.24 MB EPS)
Figure S13 Receiver Operator Characteristic (ROC) curves for
COI and cyt b. A reference line is given. The two genes cannot be
differentiated based on their ROC curves. Area under the curves
and statistical results can be found in Table S5. Calculated in
SPSS 17.0.0.
Found at: doi:10.1371/journal.pone.0014156.s015 (1.26 MB EPS)
Table S1 The list of complete mitochondrial sequences used for
the cyt b and COI alignments. Accession number, common name,
Order, Family, species and reference as given by the NCBI listing
are shown. DS: Direct Submission.
Found at: doi:10.1371/journal.pone.0014156.s016 (0.40 MB
DOC)
Table S2 The list of human (Homo sapiens), domestic cattle (Bos
taurus) and domestic dog (Canis familiaris) complete mitochondrial
sequences used for the cyt b and COI alignments. Accession
number, ethnicity/breed (if known) and reference as given by the
NCBI listing are shown.
Found at: doi:10.1371/journal.pone.0014156.s017 (0.27 MB
DOC)
Table S3 The statistical results from the Maximum Likelihood
phylogenetic trees calculated using MrBayes [S111–112] from
15,002 trees sampled. Tree length, six reversible substitution rates,
four stationary state frequencies (pi), the shape of the gamma
distribution (a) and the proportion of invariable sites (pinvar) are
displayed.
Found at: doi:10.1371/journal.pone.0014156.s018 (0.07 MB
DOC)
Table S4 The statistical results from the Maximum Likelihood
phylogenetic trees calculated using RAxML [S113] from 100 trees
Mammalian Phylogeny Best Gene
PLoS ONE | www.plosone.org 12 November 2010 | Volume 5 | Issue 11 | e14156
sampled. Tree length, six reversible substitution rates, four
stationary state frequencies (pi), the shape of the gamma
distribution (a) and the proportion of invariable sites (pinvar) are
displayed.
Found at: doi:10.1371/journal.pone.0014156.s019 (0.03 MB
DOC)
Table S5 The statistical results from the ROC curve (Figure S3).
Calculated in SPSS 17.0.0.
Found at: doi:10.1371/journal.pone.0014156.s020 (0.03 MB
DOC)
Acknowledgments
We would like to thank Dr. Peter Gill and Dr. Hilary Buchanan for advice
with the statistical methods.
Author Contributions
Conceived and designed the experiments: SST AL. Performed the
experiments: SST. Analyzed the data: SST AK. Contributed reagents/
materials/analysis tools: SST. Wrote the paper: SST AK AL.
References
1. Asher R (2007) A web-database of mammalian morphology and a reanalysis of
placental phylogeny. BMC Evol Biol 7: 108.
2. Groves C (2001) Primate Taxonomy. Washington, DC: Smithsonian Institution
Press.
3. Kemp TS (2005) The Origin and Evolution of Mammals. Oxford: Oxford
University Press.
4. Novacek MJ (1992) Mammalian phytogeny: shaking the tree. Nature 356:
121–125.
5. Rose KD (2006) The beginning of the age of mammals. Baltimore and London:
Johns Hopkins University Press.
6. Shoshani J, McKenna MC (1998) Higher Taxonomic Relationships among
Extant Mammals Based on Morphology, with Selected Comparisons of Results
from Molecular Data. Mol Phylogenet Evol 9: 572–584.
7. Buckley-Beason VA, Johnson WE, Nash WG, Stanyon R, Menninger JC, et al.
(2006) Molecular evidence for species-level distinctions in clouded leopards. Curr
Biol 16: 2371–2376.
8. Peng R, Zeng B, Meng X, Yue B, Zhang Z, et al. (2007) The complete
mitochondrial genome and phylogenetic analysis of the giant panda (Ailuropoda
melanoleuca). Gene 397: 76–83.
9. Arnason U, Adegoke JA, Bodin K, Born EW, Esa YB, et al. (2002) Mammalian
mitogenomic relationships and the root of the eutherian tree. Proc Natl Acad
Sci U S A 99: 8151–8156.
10. Liu F-GR, Miyamoto MM, Freire NP, Ong PQ, Tennant MR, et al. (2001)
Molecular and Morphological Supertrees for Eutherian (Placental) Mammals.
Science 291: 1786–1789.
11. Price SA, Bininda-Emonds ORP, Gittleman JL (2005) A complete phylogeny of
the whales, dolphins and even-toed hoofed mammals (Cetartiodactyla).
Biological Reviews 80: 445–473.
12. Stanhope MJ, Waddell VG, Madsen O, de Jong W, Hedges SB, et al. (1998)
Molecular evidence for multiple origins of Insectivora and for a new order of
endemic African insectivore mammals. Proc Natl Acad Sci U S A 95:
9967–9972.
13. Tabuce R, Asher RJ, Lehmann T (2008) Afrotherian mammals: a review of
current data. Mammalia 72: 2–14.
14. Simon C, Buckley TR, Frati F, Stewart JB, Beckenbach AT (2006)
Incorporating molecular evolution into phylogenetic analysis, and a new
compilation of conserved polymerase chain reaction primers for animal
mitochondrial DNA. Annu Rev Ecol Evol Syst 37: 545–579.
15. Balitzki-Korte B, Anslinger K, Bartsch C, Rolf B (2005) Species identification by
means of pyrosequencing the mitochondrial 12S rRNA gene. Int J Leg Med 119:
291–294.
16. Melton T, Holland C (2007) Routine forensic use of the mitochondrial 12S
ribosomal RNA gene for species identification. J Forensic Sci 52: 1305–1307.
17. Mitani T, Akane A, Tokiyasu T, Yoshimura S, Okii Y, et al. (2009)
Identification of animal species using the partial sequences in the mitochondrial
16S rRNA gene. Leg Med (Tokyo) 11(Suppl 1): S449–450.
18. Dubey B, Meganathan PR, Haque I (2009) Multiplex PCR assay for rapid
identification of three endangered snake species of India. Conserv Genet 10:
1861–1864.
19. Roe AD, Sperling FAH (2007) Patterns of evolution of mitochondrial
cytochrome c oxidase I and II DNA and implications for DNA barcoding.
Mol Phylogenet Evol 44: 325–345.
20. Alessandrini F, Mazzanti M, Onofri V, Turchi C, Tagliabracci A (2008)
MtDNA analysis for genetic identification of forensically important insects.
Forensic Sci Int Gen Sup 1: 584–585.
21. Ascunce M, Oklander L, Murdy M (2003) Amplification of mitochondrial COII
gene from DNA extracted from hair samples in some species of new world
monkeys. Folia Primatol (Basel) 74: 165–167.
22. Irwin D, Kocher T, Wilson A (1991) Evolution of the cytochrome b gene of
mammals. J Mol Evol 32: 128–144.
23. Kocher TD, Thomas WK, Meyer A, Edwards SV, Paabo S, et al. (1989)
Dynamics of mitochondrial DNA evolution in animals: amplification and
sequencing with conserved primers. Proc Natl Acad Sci U S A 86: 6196–6200.
24. Anderson S, Bankier AT, Barrell BG, de Bruijn MHL, Coulson AR, et al. (1981)
Sequence and organization of the human mitochondrial genome. Nature 290:
457–465.
25. Andrews RM, Kubacka I, Chinnery PF, Lightowlers RN, Turnbull DM, et al.
(1999) Reanalysis and revision of the Cambridge reference sequence for human
mitochondrial DNA. Nat Genet 23: 147–147.
26. Hebert PDN, Cywinska A, Ball SL, deWaard JR (2003) Biological identifications
through DNA barcodes. Proceedings of the Royal Society B: Biological Sciences
270: 313–321.
27. Borisenko AV, Lim BK, Ivanova NV, Hanner RH, Hebert PDN (2008) DNA
barcoding in surveys of small mammal communities: a field study in Suriname.
Mol Ecol Resour 8: 471–479.
28. Honeycutt RL, Nedbal MA, Adkins RM, Janecek LL (1995) Mammalian
mitochondrial DNA evolution: A comparison of the cytochrome b and
cytochrome c oxidase II genes. J Mol Evol 40: 260–272.
29. Alter S, Palumbi S (2009) Comparing evolutionary patterns and variability in the
mitochondrial control region and cytochrome b in three species of Baleen
whales. J Mol Evol 68: 97–111.
30. Agnarsson I, May-Collado LJ (2008) The phylogeny of Cetartiodactyla: The
importance of dense taxon sampling, missing data, and the remarkable promise
of cytochrome b to provide reliable species-level phylogenies. Mol Phylogenet
Evol 48: 964–985.
31. Kartavtsev YP, Lee JS (2006) Analysis of nucleotide diversity at the cytochrome
b and cytochrome oxidase 1 genes at the population, species, and genus levels.
Russ J Genet 42: 341–362.
32. Weir JT, Schluter D (2007) The Latitudinal Gradient in Recent Speciation and
Extinction Rates of Birds and Mammals. Science 315: 1574–1576.
33. Hebert PDN, Stoeckle MY, Zemlak TS, Francis CM (2004) Identification of
Birds through DNA Barcodes. PLoS Biol 2: e312.
34. Su B, Wang Y-x, Lan H, Wang W, Zhang Y (1999) Phylogenetic study of
complete cytochrome b genes in musk deer (Genus Moschus) using museum
samples. Mol Phylogenet Evol 12: 241–249.
35. Abiadh A, Chetoui Mb, Lamine-Cheniti T, Capanna E, Colangelo P (2010)
Molecular phylogenetics of the genus Gerbillus (Rodentia, Gerbillinae):
Implications for systematics, taxonomy and chromosomal evolution. Mol
Phylogenet Evol 56: 513–518.
36. Moritz C, Cicero C (2004) DNA Barcoding: Promise and Pitfalls. PLoS Biol 2:
e354.
37. Chatterjee H, Ho S, Barnes I, Groves C (2009) Estimating the phylogeny and
divergence times of primates using a supermatrix approach. BMC Evol Biol 9:
259.
38. Rakotoarisoa J-E, Raheriarisena M, Goodman SM (2010) Phylogeny and
species boundaries of the endemic species complex, Eliurus antsingy and E.
carletoni (Rodentia: Muroidea: Nesomyidae), in Madagascar using mitochon-
drial and nuclear DNA sequence data. Mol Phylogenet Evol 57: 11–22.
39. Kumar S, Nei M, Dudley J, Tamura K (2008) MEGA: A biologist-centric
software for evolutionary analysis of DNA and protein sequences. Brief
Bioinform 9: 299–306.
40. Tamura K, Dudley J, Nei M, Kumar S (2007) MEGA4: Molecular Evolutionary
Genetics Analysis (MEGA) software version 4.0. Mol Biol Evol 24: 1596–1599.
41. Thompson JD, Higgins DG, Gibson TJ (1994) CLUSTAL W: improving the
sensitivity of progressive multiple sequence alignment through sequence
weighting, position-specific gap penalties and weight matrix choice. Nucleic
Acids Res 22: 4673–4680.
42. Nei M, Kumar S (2000) Molecular Evolution and Phylogenetics. New York:
Oxford University Press. 333 p.
43. Stamatakis A, Hoover P, Rougemont J (2008) A Rapid Bootstrap Algorithm for
the RAxML Web Servers. Syst Biol 57: 758–771.
44. Geyer CJ (1991) Markov chain Monte Carlo maximum likelihood. 23rd
Symposium on the Interface. pp 156–163.
45. Goldman N, Yang Z (1994) A codon-based model of nucleotide substitution for
protein-coding DNA sequences. Mol Biol Evol 11: 725–736.
46. Huelsenbeck JP, Ronquist F (2001) MRBAYES: Bayesian inference of
phylogenetic trees. Bioinformatics 17: 754–755.
47. Muse SV, Gaut BS (1994) A likelihood approach for comparing synonymous
and nonsynonymous nucleotide substitution rates, with application to the
chloroplast genome. Mol Biol Evol 11: 715–724.
48. Ronquist F, Huelsenbeck JP (2003) MrBayes 3: Bayesian phylogenetic inference
under mixed models. Bioinformatics 19: 1572–1574.
Mammalian Phylogeny Best Gene
PLoS ONE | www.plosone.org 13 November 2010 | Volume 5 | Issue 11 | e14156
49. Letunic I, Bork P (2007) Interactive Tree Of Life (iTOL): an online tool for
phylogenetic tree display and annotation. Bioinformatics 23: 127–128.
50. Tavare S (1986) Some probabilistic and statisical problems on the analysis of
DNA sequences. Lect Math Life Sci 17: 57–86.
51. Yang Z (1996) Among-site rate variation and its impact on phylogenetic
analyses. Trends Ecol Evol 11: 367–372.
52. Wilson DE, Reeder DM, eds (2005) Mammal Species of the World. A
Taxonomic and Geographic Reference. 3rd ed. Baltimore: Johns Hopkins
University Press. 2142 p.
53. Murphy WJ, Pringle TH, Crider TA, Springer MS, Miller W (2007) Using
genomic data to unravel the root of the placental mammal phylogeny. Genome
Res 17: 413–421.
54. Phillips MJ, McLenachan PA, Down C, Gibb GC, Penny D (2006) Combined
Mitochondrial and Nuclear DNA Sequences Resolve the Interrelations of the
Major Australasian Marsupial Radiations. Syst Biol 55: 122–137.
55. Cardillo M, Bininda-Emonds ORP, Boakes E, Purvis A (2004) A species-level
phylogenetic supertree of marsupials. J Zool 264: 11–31.
56. Berta A, Sumich JL, Kovacs KM (2006) Marine mammals: evolutionary biology.
London: Academic Press.
57. Fleagle JG (1999) Primate adaptation and evolution. London: Academic Press
Inc.
58. Purvis A (1995) A Composite Estimate of Primate Phylogeny. Philos Trans R Soc
Lond B Biol Sci 348: 405–421.
59. Agnarsson I, Kuntner M, May-Collado LJ (2010) Dogs, cats, and kin: A
molecular species-level phylogeny of Carnivora. Mol Phylogenet Evol 54:
726–745.
60. Steeman ME, Hebsgaard MB, Fordyce RE, Ho SYW, Rabosky DL, et al. (2009)
Radiation of Extant Cetaceans Driven by Restructuring of the Oceans. Syst Biol
58: 573–585.
61. Demere TA, McGowen MR, Berta A, Gatesy J (2008) Morphological and
Molecular Evidence for a Stepwise Evolutionary Transition from Teeth to
Baleen in Mysticete Whales. Syst Biol 57: 15–37.
62. Nikaido M, Hamilton H, Makino H, Sasaki T, Takahashi K, et al. (2006) Baleen
Whale Phylogeny and a Past Extensive Radiation Event Revealed by SINE
Insertion Analysis. Mol Biol Evol 23: 866–873.
63. Marcot J (2007) Molecular phylogeny of terrestrial artiodactyls. In: Prothero D,
Foss S, eds. The evolution of artiodactyls. Baltimore: Johns Hopkins University
Press. pp 4–18.
64. McGowen MR, Spaulding M, Gatesy J (2009) Divergence date estimation and a
comprehensive molecular tree of extant cetaceans. Mol Phylogenet Evol 53:
891–906.
65. Sasaki T, Nikaido M, Hamilton H, Goto M, Kato H, et al. (2005) Mitochondrial
Phylogenetics and Evolution of Mysticete Whales. Syst Biol 54: 77–90.
66. Hatch LT, Dopman EB, Harrison RG (2006) Phylogenetic relationships among
the baleen whales based on maternally and paternally inherited characters. Mol
Phylogenet Evol 41: 12–27.
67. Shannon CE (1948) A mathematical theory of communication. The Bell System
Technical Journal 27: 379–423, 623–656.
68. Schneider TD, Stephens RM (1990) Sequence logos: a new way to display
consensus sequences. Nucleic Acids Res 18: 6097–6100.
69. Aitken C, Taroni F (2004) Statistics and the Evaluation of Evidence for Forensic
Scientists; Barnett V, ed. Chichester: John Wiley & Sons, Ltd.. 509 p.
70. Stewart A (2002) Basic Statistics and Epidemiology: A Practical Guide. Oxon:
Radcliffe Medical Press. 151 p.
71. Prasad AB, Allard MW, NISC Comparative Sequencing Program, Green ED
(2008) Confirming the Phylogeny of Mammals by Use of Large ComparativeSequence Data Sets. Mol Biol Evol 25: 1795–1808.
72. Reyes A, Gissi C, Catzeflis F, Nevo E, Pesole G, et al. (2004) Congruent
Mammalian Trees from Mitochondrial and Nuclear Genes Using BayesianMethods. Mol Biol Evol 21: 397–403.
73. Nabholz B, Glemin S, Galtier N (2009) The erratic mitochondrial clock:variations of mutation rate, not population size, affect mtDNA diversity across
birds and mammals. BMC Evol Biol 9: 54.
74. Arnason U, Gullberg A, Janke A, Kullberg M, Lehman N, et al. (2006) Pinnipedphylogeny and a new hypothesis for their origin and dispersal. Mol Phylogenet
Evol 41: 345–354.75. Osterholz M, Walter L, Roos C (2008) Phylogenetic position of the langur
genera Semnopithecus and Trachypithecus among Asian colobines, and genusaffiliations of their species groups. BMC Evol Biol 8: 58.
76. Ting N, Tosi AJ, Li Y, Zhang Y-P, Disotell TR (2008) Phylogenetic
incongruence between nuclear and mitochondrial markers in the Asiancolobines and the evolution of the langurs and leaf monkeys. Mol Phylogenet
Evol 46: 466–474.77. Desmyter S, Gosselin M (2009) COI sequence variability between Chrysomyi-
nae of forensic interest. Forensic Sci Int Gen 3: 89–95.
78. Tavares E, Baker A (2008) Single mitochondrial gene barcodes reliably identifysister-species in diverse clades of birds. BMC Evol Biol 8: 81.
79. Smith MA, PoyarkovJr NA, Hebert PDN (2008) CO1 DNA barcodingamphibians: take the chance, meet the challenge. Mol Ecol Resour 8: 235–246.
80. Wiemers M, Fiedler K (2007) Does the DNA barcoding gap exist? - a case studyin blue butterflies (Lepidoptera: Lycaenidae). Frontiers in Zoology 4: 8.
81. Santamaria M, Lanave C, Vicario S, Saccone C (2007) Variability of the
mitochondrial genome in mammals at the inter-species/intra-species boundary.Biol Chem 388: 943–946.
82. Kimura M (1980) A simple method for estimating evolutionary rates of basesubstitutions through comparative studies of nucleotide sequences. J Mol Evol
16: 111–120.
83. Ward RD (2009) DNA barcode divergence among species and genera of birdsand fishes. Mol Ecol Resour 9: 1077–1085.
84. Vilgalys R (2003) Taxonomic misidentification in public DNA databases. NewPhytol 160: 4–5.
85. Zhang G, Strasser BJ (2009) Specimens Versus Sequences. Science 323: 1672.86. Abramov AV, Puzachenko AY (2006) Geographical variability of skull and
taxonomy of Eurasian badgers (Mustelidae, Meles). Zoologichesky Zhurnal 85:
641–655.87. Driscoll C, Macdonald D (2010) Top dogs: wolf domestication and wealth. J Biol
9: 10.88. Aggarwal RK, Kivisild T, Ramadevi J, Singh L (2007) Mitochondrial DNA
coding region sequences support the phylogenetic distinction of two Indian wolf
species. J Zool Syst Evol Res 45: 163–172.89. International Commission on Zoological Nomenclature (2003) Opinion 2027
(Case 3010). Usage of 17 specific names based on wild species which are pre-dated by or contemporary with those based on domestic animals (Lepidoptera,
Osteichthyes, Mammalia): conserved. Bull Zool Nomencl 60: 81–84.90. Silbermayr K, Orozco-terWengel P, Charruau P, Enkhbileg D, Walzer C, et al.
(2009) High mitochondrial differentiation levels between wild and domestic
Bactrian camels: a basis for rapid detection of maternal hybridization. AnimGenet In Press.
91. Kitchener AC (2010) Taxonomic issues in bears: impacts on conservation inzoos and the wild, and gaps in current knowledge. Int Zoo Yearb 44: 33–46.
Mammalian Phylogeny Best Gene
PLoS ONE | www.plosone.org 14 November 2010 | Volume 5 | Issue 11 | e14156