reconstructing prehistoric african population structure · is a lower molar from context 301...
TRANSCRIPT

STAR+METHODS
KEY RESOURCES TABLE
REAGENT or RESOURCE SOURCE IDENTIFIER
Biological Samples
Ancient skeletal element This study I9028
Ancient skeletal element This study I9133
Ancient skeletal element This study I9134
Ancient skeletal element This study I4427
Ancient skeletal element This study I4468
Ancient skeletal element This study I4421
Ancient skeletal element This study I4422
Ancient skeletal element This study I2966
Ancient skeletal element This study I2967
Ancient skeletal element This study I4426
Ancient skeletal element This study I3726
Ancient skeletal element This study I0589
Ancient skeletal element This study I1048
Ancient skeletal element This study I2298
Ancient skeletal element This study I0595
Chemicals, Peptides, and Recombinant Proteins
Pfu Turbo Cx Hotstart DNA Polymerase Agilent Technologies 600412
Herculase II Fusion DNA Polymerase Agilent Technologies 600679
2x HI-RPM hybridization buffer Agilent Technologies 5190-0403
0.5 M EDTA pH 8.0 BioExpress E177
Sera-Mag Magnetic Speed-beads
Carboxylate-Modified (1 mm, 3EDAC/PA5)
GE LifeScience 65152105050250
USER enzyme New England Biolabs M5505
UGI New England Biolabs M0281
Bst DNA Polymerase2.0, large frag. New England Biolabs M0537
PE buffer concentrate QIAGEN 19065
Proteinase K Sigma Aldrich P6556
Guanidine hydrochloride Sigma Aldrich G3272
3M Sodium Acetate (pH 5.2) Sigma Aldrich S7899
Water Sigma Aldrich W4502
Tween-20 Sigma Aldrich P9416
Isopropanol Sigma Aldrich 650447
Ethanol Sigma Aldrich E7023
5M NaCl Sigma Aldrich S5150
1M NaOH Sigma Aldrich 71463
20% SDS Sigma Aldrich 05030
PEG-8000 Sigma Aldrich 89510
1 M Tris-HCl pH 8.0 Sigma Aldrich AM9856
dNTP Mix Thermo Fisher Scientific R1121
ATP Thermo Fisher Scientific R0441
10x Buffer Tango Thermo Fisher Scientific BY5
T4 Polynucleotide Kinase Thermo Fisher Scientific EK0032
T4 DNA Polymerase Thermo Fisher Scientific EP0062
T4 DNA Ligase Thermo Fisher Scientific EL0011
(Continued on next page)
e1 Cell 171, 59–71.e1–e14, September 21, 2017

CONTACT FOR REAGENT AND RESOURCE SHARING
Further information and requests for resources and reagents should be directed to and will be fulfilled by the Lead Contact, DavidReich ([email protected]).
EXPERIMENTAL MODEL AND SUBJECT DETAILS
We generated new genome-wide data from skeletal remains of 15 prehistoric individuals: 5 from eastern Africa, 7 from south-central Africa, and 3 from southern Africa (Tables 1, S1, and S2). One of these individuals, from St. Helena Bay and directly dated
Continued
REAGENT or RESOURCE SOURCE IDENTIFIER
Maxima SYBR Green kit Thermo Fisher Scientific K0251
50x Denhardt’s solution Thermo Fisher Scientific 750018
SSC Buffer (20x) Thermo Fisher Scientific AM9770
GeneAmp 10x PCR Gold Buffer Thermo Fisher Scientific 4379874
Dynabeads MyOne Streptavidin T1 Thermo Fisher Scientific 65602
Salmon sperm DNA Thermo Fisher Scientific 15632-011
Human Cot-I DNA Thermo Fisher Scientific 15279011
DyNAmo HS SYBR Green qPCR Kit Thermo Fisher Scientific F410L
Methanol, certified ACS VWR EM-MX0485-3
Acetone, certified ACS VWR BDH1101-4LP
Dichloromethane, certified ACS VWR EMD-DX0835-3
Hydrochloric acid, 0.6N, 0.5N & 0.01N VWR EMD-HX0603-3
Critical Commercial Assays
High Pure Extender from Viral Nucleic Acid
Large Volume Kit
Roche 05114403001
MinElute PCR Purification Kit QIAGEN 28006
NextSeq 500/550 High Output Kit v2
(150 cycles)
Illumina FC-404-2002
Deposited Data
Raw and analyzed data This paper ENA: PRJEB21878
Software and Algorithms
Samtools Li et al., 2009 http://samtools.sourceforge.net/
BWA Li and Durbin, 2009 http://bio-bwa.sourceforge.net/
ADMIXTOOLS Patterson et al., 2012 https://github.com/DReichLab/AdmixTools
POPSTATS Skoglund et al., 2015 https://github.com/pontussk/popstats
R https://www.r-project.org/ https://www.r-project.org/
EAGER Peltzer et al., 2016 https://github.com/apeltzer/EAGER-GUI
Schmutzi Renaud et al., 2015 https://github.com/grenaud/schmutzi
SeqPrep https://github.com/jstjohn/SeqPrep https://github.com/jstjohn/SeqPrep
bamrmdup https://bitbucket.org/ustenzel/biohazard https://bitbucket.org/ustenzel/biohazard
smartpca Patterson et al., 2006 https://www.hsph.harvard.edu/alkes-
price/software/
ADMIXTURE Alexander et al., 2009 https://www.genetics.ucla.edu/software/
admixture/download.html
PMDtools Skoglund et al., 2014a https://github.com/pontussk/PMDtools
Haplogrep 2 Weissensteiner et al., 2016 http://haplogrep.uibk.ac.at/
Yfitter Jostins et al., 2014 https://sourceforge.net/projects/yfitter/
ALDER Loh et al., 2013 http://cb.csail.mit.edu/cb/alder/
F2KWIN Ognibene pers. comm. [email protected]
Cell 171, 59–71.e1–e14, September 21, 2017 e2

to !2100 BP, previously yielded a complete mitochondrial genome (Morris et al., 2014). We directly dated a second South Africanindividual buried in a hunter-gatherer context from Faraoskop to!2000 BP, and a third individual buried in a pastoralist context fromKasteelberg to!1,200 BP.We also directly dated and used in-solution enrichment to obtain genome-wide DNA from four individualsfrom coastal eastern Africa: From the cave site of Panga ya Saidi in the coastal region of southeastern Kenya (!400BP), Kuumbi Cavein the southeast of Zanzibar Island (Tanzania; !1,400 BP), and Makangale Cave in the northwest of Pemba Island (Tanzania;!1,400BP and!600BP).We also obtained genome-wide data from a!3100 BP individual from a pastoralist context in north-centralTanzania, and !8100-2500 year old individuals from Malawi.
TerminologyThere is no widely accepted term with neutral connotations for indigenous communities in southern Africa (Schlebusch, 2010). In thismanuscript, we follow San council recommendations in using population-specific terms whenever possible, and alternatively theterms San for Tuu and K’xaa speaking hunter-gatherer groups and Khoe for Khoe-khoe speakers. When necessary we collectivelyrefer to groups with southern Africa-specific ancestry as Khoe-San, or as having San-related ancestry.
Panga ya Saidi Cave, Kilifi County, Kenya (n = 1)Panga ya Saidi is a large limestone cave complex formed within an escarpment c. 15 km from the Indian Ocean coast in southernKenya. Excavated in multiple Sealinks Project campaigns, the cave’s long and complex depositional sequence spans, discontinu-ously, more than 76,000 years, and contains mainly Later Stone Age (LSA) deposits, overlain by Middle Iron Age (MIA) and Later IronAge (LIA) deposits dating to the last two thousand years (Helm et al., 2012). The sampled specimen (I0595, Kenya_400BP) is a pha-lanx recovered from an in situ burial (context 403) and directly AMS radiocarbon dated to 496-322 BP (388 ± 27 uncalibrated BP,OxA-30803). The individual was a tall, robust young adult male. He was buried in a shallow grave in a crouched position with twohands and one foot in the small of the back and the skull disarticulated and placed by the knees. The individual was buried by sedi-ment containing marine shell beads, small knapped stone tools, and Tana Tradition potsherds. The associated faunal remains areexclusively wild, with the exception of a single possible caprine bone. Large numbers of remains of birds, rodents, and other micro-fauna suggest that the cave may have only been sporadically occupied when the human remains were deposited. We infer from thematerial culture and fauna that the cave was occupied by foragers during the time the individual was buried, although food producerswere present at nearby settlements such as Mtsengo and Mbuyuni (Helm, 2000). Crop remains of African sorghum, pearl millet andfinger millet found at the site suggest these foragers had access to agricultural resources.
Makangale Cave, Pemba, Tanzania (n = 2)This limestone cave at the northern end of Pemba Island in the Zanzibar archipelago has been excavated in multiple campaigns, themost recent two seasons conducted by the ERC-funded Sealinks Project at Oxford University in 2012 and then theMax Planck Insti-tute for the Science of Human History in 2016 (unpublished; see also (Chami et al., 2009)). The sequence shows clear evidence ofhuman occupation beginning around 1400 BP with an escargotiere layer of giant African land snail shells, pottery, and disarticulatedhuman remains. Above this layer, the sequence shows regular human use of the cave into the last thousand years. The first sampledspecimen (I0589, Tanzania_Pemba_1400BP) is a sacral vertebra from context 204 (Sealinks Project faunal catalog no. 15336),directly dated to 1421-1307 BP (1520 ± 30 uncalibrated BP, Beta-434912). The second specimen (I2298, Tanzania_Pemba_600BP)is a lower molar from context 301 (Sealinks Project faunal catalog no. 15624), which lies just below the surface and was dated to639-544 BP (623 ± 20 uncalibrated BP, Wk-43308). Both specimens are associated with a highly unusual faunal assemblage, domi-nated by fragmented crocodile (Crocodylus cf. niloticus) remains and diverse microfauna, including Rattus rattus (Asian black rat), anonnative rodent that must have arrived to the area via maritime exchange routes. There are no taphonomic indicators in the faunalassemblage of hunting by humans, nor of crocodile predation on humans. During both of the occupational phases targeted in thisstudy, there were nearby settlements occupied by farmers whose ancestors likely came from the mainland, for example at the sitesof Tumbe (c. 1400-1000 BP) and Chwaka (1000-400 BP) (Fleisher and LaViolette, 2013).
Kuumbi Cave, Zanzibar, Tanzania (n = 1)Kuumbi Cave is a limestone solutional cave excavated in multiple campaigns (Chami, 2009; Sinclair et al., 2006). Sealinks Projectexcavations in 2012 documented a complex depositional sequence stretching discontinuously over 20,000 years, containingevidence of LSA and MIA occupations in five discernible phases (Shipton et al., 2016). The analyzed specimen (I0589, Tanzania_Zanzibar_1400BP) is a complete second phalanx of an adult (Sealinks Project faunal catalog no. 4353). It was recovered from context1011, in association with local Tana Tradition ceramics typical of theMIA, moderately-sized limestone lithic artifacts, and diverse wildgame animals, but no additional human remains (Prendergast et al., 2016). The specimen is directly dated to 1370-1303 BP (1479 ±23 uncalibrated BP, OxA-31427), thus placing it at the beginning of theMIA phase.While Kuumbi Cave is interpreted as a forager site,elsewhere on the island at this time, large settlements such as Unguja Ukuu emerge, occupied by farmers whose origins are likely onthe mainland (Crowther et al., 2015; Juma, 2004).
e3 Cell 171, 59–71.e1–e14, September 21, 2017

Luxmanda, Babati District, Tanzania (n = 1)Luxmanda is an open-air settlement sitting atop the Rift Valley escarpment (1878 m above sea level) at the southern edge of theMbulu Plateau, just north of Lake Balangida andMount Hanang. Excavations in 2012, 2013, and 2015 by the RAPT project (Researchon the Archaeology of Pastoralism in Tanzania) have shown Luxmanda to be the largest and southernmost known settlement site ofthe Pastoral Neolithic (PN), the era corresponding to the spread of mobile livestock herding in eastern Africa (Prendergast et al., 2013)(K.M.G. and M.E.P., unpublished data). Despite its isolated location, Luxmanda shows strong material culture affinities to sites ofsouthern Kenya classified as Savanna Pastoral Neolithic (SPN), in particular the Narosura type-site (Odner, 1972); Luxmanda’sties to SPN sites are further supported by sourcing of obsidian stone tools to the Naivasha Basin in the Central Rift Valley of Kenya.Faunal remains from Luxmanda indicate a diet almost exclusively focused on sheep, goat, and cattle; botanical remains are currentlyunder study. A suite of eleven radiocarbon dates provides a tightly constrained window of occupation c. 3000-2900 BP, which is atthe early end of the range for SPN sites. The analyzed specimen (Tanzania_Luxmanda_3100BP) is a petrous bone from a perinatalinfant. The infant was found complete and buried just to thewest of, and c. 35 cmbelow, a burnt earth feature, interpreted as a hearth.The burnt earth feature was then overlain by domestic refuse. Collagen from the same petrous bone was AMS radiocarbon dated to3141-2890 BP (2925 ± 20 uncalibrated BP, ISGS-A3806), a date nearly identical to those of charcoal samples taken from the over-lying burned earth feature and domestic refuse.
Hora, Malawi (n = 2)The Hora 1 and Hora 2 skeletons from Malawi were excavated from the Hora 1 site in the Mzimba District of Malawi, located on thenortheastern side of Mount Hora. Mount Hora lies south of the Nyika Plateau andwest of the ViphyaMountains, wheremiombo vege-tation grades southwest into edaphic grasslands (DeBusk, 1997). The region divides the Luangwa River Basin in Zambia from LakeMalawi!130km to the east, which receives all water from the district via the South Rukuru River (Figure S1). The South Rukuru flowssouth-to-north along the Zambian border before turning east to intersect the Kasitu, a major interior waterway that flows past MountHora and divides themountains to the east from plains to the west. It is notable that in the Hora region, rock art, stone tools, and burialpractices all have substantial differences from those even in the nearby Luangwa Valley of Zambia, suggesting cultural subdivisionsacross relatively small areas (Clark, 1959; Phillipson, 1976; Sandelowsky, 1972).Hora is a distinctive granite-gneiss inselberg that rises 110 m from superficial floodplain deposits. Hora 1 is a large overhang at the
base (1,420 m AMSL) that covers !80 m2. Although the shelter has no surviving rock art, at least four other shelters on the inselbergcontain paintings that include white stars and abstract red ‘‘gridirons’’ or ‘‘nets,’’ both of which are motifs replicated at other sites onMount Hora and nearby localities (Clark, 1956; Cole-King, 1973). Hora 1 was excavated by Clark in 1950, and produced a 2.2 m cul-tural sequence containing pottery and iron slag at the top, faunal remains and LSA lithic assemblages with mollusk shell beads belowthis, and two human burials approximately 70cmbelow the surface (Clark, 1956). The first burial to be revealedwasHora 1 (UCT-242),a short-staturedmale in his thirties or forties at death, whomay have been buriedwith a flaked stone axe (Morris andRibot, 2006). Theskeleton was left partially in situ during the original excavation and later exhumed by Rangeley (Clark, 1956). About 3 m to the south,the skeleton of a female was recovered (Hora 2, UCT-243); she was of similar stature to themale and died in her early twenties (Morrisand Ribot, 2006). The female was found in a flexed position on her left side, andmost of the bones of the hands and feet weremissingor had been displaced – suggesting a degree of exposure prior to burial (Clark, 1956).A previous study (Clark, 1956) reports three major stratigraphic units at Hora 1, and places the burials in the upper part of the sec-
ond unit in association with the ‘‘Nachikufan II’’ – an industry with a type site !300 km to the east in Zambia. Clark does not considerthe burials intrusive, noting that they are overlain exclusively by hunter-gatherer material culture. The earliest occupation layer at thesite is ‘‘reddish brown earth’’ that begins at about 1.7 m depth, and contains a lithic assemblage assigned by Clark to the Nachikufu I.On the basis of typology, the earliest deposits at the site were inferred to date to between 16000-11000 BP, the burials to between10000-5000 BP, andmaterials in the uppermost unit are likely as recent as the last few hundred years (Miller, 1971). This is supportedby a direct AMS age on the Hora 2 skeleton of 8173-7957 BP (7230±60 uncalibrated BP, PSUAMS-2535). Although insufficientcollagen was present in the Hora 1 skeleton for a direct age, its archaeological context and genetic similarity to the directly-datedHora 2 skeleton place it most probably in the early Holocene. New excavations at the Hora 1 site were conducted in 2016 and2017 within 2-5m of the original burial locations (based on archival photographs), achieving a maximum depth of 1m. A sample of6842 plotted objects recovered from 3m3 confirmed that below !30cm depth there is no Iron Age or historical material culture(e.g. slag, pottery, or glass), further establishing that the two skeletons are from a resident hunter-gatherer population.
Fingira, Malawi (n = 3)The three Fingira samples derived from ex situ human remains (2 adult femora and one subadult femur) recovered in 2016 from FingiraRock, a large shelter locatedwithin the boundaries of Nyika National Park in northernMalawi. The climate is cool andmoist comparedto the surrounding regions (!1,600 mm annual rainfall, and average daily highs 10 – 20"C). Fingira Rock is an isolated inselberg at!2100 m above sea level, near the upper limit of the miombo woodland. Within this inselberg is set a single deep rock shelterwith 160m2 of deposit (Figure S1). First excavated in 1966, Fingira yielded fragmentary remains of at least 15 human individuals (sub-adults and adults), plus one more complete burial near the front, in association with rich lithic, archaeofaunal, and archaeobotanicalassemblages. All human remains previously recovered from Fingira were studied by Brothwell, and reported in in a previous study(Sandelowsky, 1972). They are curated at the Natural History Museum in London.
Cell 171, 59–71.e1–e14, September 21, 2017 e4

In addition to human remains, the Fingira deposits contained bone tools, pigments, and ornaments (Robinson and Sandelowsky,1968; Sandelowsky, 1972). Two conventional 14C ages obtained near the base of the ca. 50cm-deep excavation were returned instratigraphic sequence as 3,260 ± 80 BP and 3,430 ± 80 BP (Sandelowsky 1972). Geometric rock paintings at the site exhibit whiteoverpainting on red, which has been interpreted elsewhere in Malawi as re-use by food producers (Smith, 1995; Zubieta, 2016).Ceramics are rare but present at the site, where the large deposit exhibits predominately Later Stone Age material culture. Thiswas confirmed during 2016 pilot excavations, permitted by the Departments of Antiquities and National Parks and Wildlife.
The deposits at Fingira had not been backfilled after the 1966 excavation, and had undergone extensive erosion and slumping. Asthe site is accessible to the public, piles of materials had been pulled from the section and placed on fallen rocks. Two of those spec-imens comprised the two adult femoral specimens reported here. Using original site plans, we identified the extent of the 1966 ex-cavations prior to slumping, including the relative positions of originally-recovered human remains. A large part of this area had beencovered with a central termite mound, and it was within this that the partial skeleton of a neonate was recovered. This comprised thesubadult sample from Fingira. Direct 14C AMS ages on these three specimens are reported in Table S2, and show that LSA peoplewere using the site as a cemetery for at least 3,700 years, from 6177-5923 BP (5290±25 uncalibrated BP, UCIAMS-186347) to 2676-2330 BP [2676-2343BP (2425±20 uncalibrated BP, PSUAMS-1734), 2483-2330 BP (2400±20 uncalibrated BP, PSUAMS-1881)]. Thetwo adult specimens therefore significantly pre-date the earliest known age inMalawi for the Bantu expansion, which derives from theKasitu Valley (containing Hora Mountain) at 1,750 ± 60 BP (Robinson, 1982). If the Bantu expansion into Malawi began more than!700 years before what is currently known, then the neonate from Fingira could potentially overlap in timewith it. However, the overallantiquity of these specimens makes admixture attributable to the Bantu expansion highly unlikely in light of current knowledge.
Chencherere II, Malawi (n = 2)Mwana wa Chencherere II is a painted rock shelter set in a granitic inselberg at ca. 1,700 m above sea level in the Chongoni Rock ArtRegion (Smith, 1995). Its relatively high altitude results in cool, moist year-round conditions between 10 – 20"C. It was excavated byClark in 1972 (Clark, 1972, 1973), and the faunal assemblage published in detail by Crader (Crader, 1984a), who also reports one adultmale burial and the fragmentary remains of seven other individuals (adult and subadult). The site contained large lithic and faunalassemblages, bone and shell tools and ornaments, and increasing abundances of pottery and other evidence of interaction withfood-producers over time. The youngest reported date from the site is a conventional 14C age on charcoal from the top of Level3, at 800 ± 50 BP. The oldest date is from near the base of Level 4, and is 2,480 ± 200 BP.
All human remains are reported from Levels 2, 3, and 4 – with most in Level 3. The original description of human remains was byBrothwell, and Crader (1984b:Appendix 2) later listed several more individuals that had been discovered within the faunal material. Allhuman remains recovered from Chencherere II were thought to be held at the Natural History Museum in London, but during a 2016visit to the Malawi National Repository in Nguludi (near Blantyre), six additional specimens were identified. Five of these derived froma cluster in square A3 (Figure S1): right ilium, left femur (sampled), and 3 partial ribs. These were inferred to belong to the same in-dividual, a subadult aged 3-5. An upper right incisor (sampled) was labeled as deriving from square E2, and therefore although ofsimilar ontogenetic age it was deemed likely to be from a different individual.
Although the genetic analysis confirms that these are two different individuals, insufficient material remained from the incisor root ofthe second individual for a direct age. The first individual returned a direct 14C AMS age of 5293-4979 BP (4525 ± 25 uncalibrated BP,UCIAMS-186348). As with Fingira, the direct AMS ages on the human remains are substantially older than the conventional charcoalages suggested, indicating either intrusive charcoal or problems with the original dates.
St. Helena Bay, South Africa (n = 1)In June 2010, an intact skeleton was excavated by Andrew B Smith along the southwest coastal region of South Africa at St. HelenaBay. The skeleton is stored in the Department of Human Biology at the University of Cape Town under the accession number UCT-606. The body had been placed on an impermeable consolidated dune surface, on its right side in a fully flexed position. The bonesoriginate from a single male who stood no more than 1.5 m in height. Dental wear and significant areas of osteoarthritis suggest thathe was at least 50 years of age at time of death. Lack of any evidence of tooth decay and excessive occlusal wear suggests a diettypical of hunter-gatherer subsistence. The presence of abnormal bone growths in the right auditory meatus (ear canal opening)caused a condition known as ‘‘surfer’s ear’’ (auditory exostosis) and provides evidence that this individual most likely spent consider-able time in the cold coastal waters sourcing food No obvious cause of death was evident. The results of carbon-14 to stable carbon-13 isotope ratio analysis of a rib provided a date of 2241-1965 BP (2330 ± 25 uncalibrated BP, UGAMS-7255) years before present(UGAMS-7255) with a d13C value of #14.6%. Although the minimum date falls right on the edge of the arrival of pastoralism in theWestern Cape, anatomical and archaeological analysis of this skeleton and the associated burial site clearly defines this individual asan indigenous Southern African, predating pastoral arrival into the region. This individual has previously been sampled for mtDNAanalysis (Morris et al., 2014).
Faraoskop, South Africa (n = 1)The site of Faraoskop is a rock shelter about 30 km inland from Elands Bay on the west coast of the Western Cape Province of SouthAfrica. The shelter is on the highest ridge of a small hill at an altitude of 300 m about the surrounding plain. Seven skeletons werecollected by a local farmer in 1984, but the site was subsequently excavated under controlled conditions in 1987 and 1988 (Manhire,
e5 Cell 171, 59–71.e1–e14, September 21, 2017

1993) and five more skeletons were collected including the one referred to here as UCT-386. The shelter has no rock paintings butthere is a rich assemblage of Later Stone Age artifacts including stone tools, ostrich eggshell beads, workedmarine shell, leather andtwine (Manhire, 1993). No pottery is associated with the site. Six skeletons have been C14 dated with resulting dates ranging from2300 years BP to 1900 years BP (Manhire, 1993; Sealy et al., 1992) but all the dates overlap at the 2nd standard deviation. UCT-386 isthe skeleton of a female about 40-50 years at death. A bone sample provided a date of 2017-1748 BP (2000 ± 50 uncalibrated BP,Pta-5283) with a d13C value of #16.8% (Manhire, 1993). A recent re-evaluation of the site indicates the possibility that all of the in-dividuals died in one event. Not only do all of the dates overlap, but the excavation data suggest no separate grave shafts and at leasttwo of individuals show signs of perimortem injury and violent death (Parkington and Dlamini, 2015). The Faraoskop human skeletonsare stored in the Department of Human Biology at the University of Cape Town.
Kasteelberg, South Africa (n = 1)The site of Kasteelberg is on a granite hill on the Vredenberg Peninsula about 4 km from the coastal village of Paternoster, approx-imately 150 km north of Cape Town (Smith, 1992a). There are several sites on the hill including a small rockshelter, but the humanskeleton was excavated from square 22 extension at KBB on the eastern side of the base of the hill. UCT-437 is the nearly completeskeleton of a child of about 4 years of age excavated by LitaWebley in 1986. The body was in a shallow pit about 1.5 m deep and withno stone cover. The specimen has a date of 1282-1069 BP (1310 ± 50 uncalibrated BP, Pta-4373). There were no grave goods inassociation with the skeleton. The earliest sites on top of the hill provide evidence of domestic sheep at around 2100 years ago.The KBB site at the base of the hill is dated to the latter part of the occupation but present the first appearance of cattle in the region(Smith, 1992b). Overall, the Later Stone Age occupation of the Kasteelberg indicates the presence of herder-foragers who practicedseasonal economic systems, sometimes relying on domestic stock while at other times hunting seals (Sadr et al., 2003). The humanskeleton from Kasteelberg is stored in the Department of Human Biology at the University of Cape Town.
METHOD DETAILS
Direct AMS 14C Bone DatesWe report new direct AMS 14C bone dates in this study from multiple laboratories. In general, bone samples were manually cleanedand demineralized in weak HCl and, in most cases (PSU, UCIAMS, OxA, ISGS), soaked in an alkali bath (NaOH) at room temperatureto remove contaminating soil humates. Samples were then rinsed to neutrality in Nanopure H2O and gelatinized in HCL (Longin,1971). The resulting gelatin was lyophilized and weighed to determine percent yield as a measure of collagen preservation (% crudegelatin yield).Collagen was then directly AMS 14C dated (ISGS, Pta) or further purified using ultrafiltration (PSUAMS, UCIAMS, OxA, Wk, Beta)
(Brown et al., 1988; Kennett et al., 2017) or a modified XAD method (Lohse et al., 2014; Stafford et al., 1991). It is standard in somelaboratories (PSUAMS, UCIAMS, Wk, OxA) to use stable carbon and nitrogen isotopes as an additional quality control measure. Forthese samples, the %C, %N and C:N ratios were evaluated before AMS 14C dating. C/N ratios for well-preserved samples fallbetween 2.9 and 3.6, indicating good collagen preservation (Van Klinken, 1999). Additional quality control work was carried outon the samples from Malawi using FTIR spectra (Figure 1E).All 14C ages were d13C-corrected for mass dependent fractionation with measured 13C/12C values (Stuiver and Polach, 1977) and
calibrated with OxCal version 4.3 using the southern hemisphere calibration curve (SHCal13). Given their proximity to the equator,AMS 14C dates for sites in coastal Kenya and Tanzania were calibrated using OxCal v. 4.3 (Bronk Ramsey, 2009) at 95.4% probabilityemploying a mixed curve that combines the SHCal13 (Hogg et al., 2013) and IntCal13 (Reimer et al., 2013) curves at ratios of 70:30 toaccount for the differential effects of the intertropical convergence zone.
Ancient DNA sample processing in Leipzig: St. Helena Bay sampleDNA extraction and library preparation30.4mg of bone powder was removed from the internal root canal of the tooth (SP2809) using a sterile dentistry drill in the clean roomfacilities of the Max Planck Institute for Evolutionary Anthropology in Leipzig, Germany. A DNA extract (E649) was prepared with asilica-based method, described in detail previously (Rohland and Hofreiter, 2007). 15 mL (15% of the total volume) of the extractwas converted into a single-stranded DNA library (A5354) using a modified version of the single-stranded DNA library preparationprotocol (Gansauge andMeyer, 2013; Korlevi!c et al., 2015). Library positive and negative controls were carried throughout the librarypreparation process. Library A5354 was pre-treated with the USER enzyme, a mixture of uracil-DNA glycosylase (UDG) and endo-nuclease VIII, in order to remove uracils from the internal parts of ancient DNAmolecules (Briggs et al., 2010; Meyer et al., 2012). Thenumber of DNAmolecules in the library (Table S1) was determined by digital droplet PCR (Bio-Rad QX200), using 1 mL of a 5,000-folddilution of the library in EBT buffer (10 mM Tris-HCl pH 8.0, 0.05% Tween 20) as template in an Eva Green assay (Bio-Rad) withprimers IS7 and IS8 (Meyer and Kircher, 2010). The library was amplified into the PCR plateau in a 100 mL reaction with AccuPrimePfx DNA polymerase (Dabney and Meyer, 2012) using a pair of primers with two unique index sequences according to a doubleindexing scheme described in detail elsewhere (Kircher et al., 2011). 50 mL of amplification products were purified using the MinElutePCR Purification Kit (QIAGEN) and eluted in 30 mL TE buffer (10 mM Tris-HCl pH 8.0, 1 mM EDTA). The DNA concentration of theindexed library (A5369) was determined using a NanoDrop 1000 Spectrophotometer.
Cell 171, 59–71.e1–e14, September 21, 2017 e6

Size fractionation for shotgun sequencingFrom the amplified library A5369, 1 mL was taken as template for a second round of amplification in a 100 mL PCR reaction usingprimers IS5 and IS6 (Meyer and Kircher, 2010) with Herculase II Fusion DNA polymerase (Agilent Technologies) under the conditionsdescribed in detail previously (Dabney andMeyer, 2012). The concentration of the final library was determined on a Bioanalyzer 2100instrument (Agilent Technologies) using a DNA-1000 chip. Library A5369 was pooled and sequenced with libraries from anotherexperiment, occupying 33%of one lane of a flow cell on the Illumina HiSeq 2500 platform in rapid mode, using a double index config-uration (2 3 76 + 2 3 76) (Kircher et al., 2011).
For a more effective use of sequencing capacity, 10 mL of the library A5369 was additionally separated on a Criterion Precast poly-acrylamide gel (10% TBE, BioRad), and the fraction of library molecules with insert sizes larger than 40 bp was gel-excised asdescribed in detail previously (Meyer et al., 2012). Gel-excised library molecules were subjected to a second round of amplificationand the concentration of the final library (A5386) was determined using a DNA 1000 chip on the Bioanalyzer 2100.
Ancient DNA sample processing in Tubingen: Faraoskop and Kasteelberg samplesSampling and extractionSampling took place in the clean room facilities of the Institute for Archaeological Sciences at the University of Tubingen. Both sam-ples were irradiated with UV light for 10 min from all sides to remove surface contamination. The tooth from the South African foragerfrom Faraoskop (UCT386) was sawed apart transversally at the border of crown and root, and dentine from inside the crown wassampled using a sterile dentistry drill, resulting in 56 mg dentine powder. For the femur fragment from the South African pastoralistfromKasteelberg (UCT437), the surface layer from the sampling area was removedwith a dentistry drill prior to obtaining four aliquotsbetween 51 and 80 mg of bone powder from the inside of the bone by drilling.
Extraction was performed following a protocol optimized for the recovery of small ancient DNA molecules (Dabney et al., 2013),resulting in 100 mL of DNA extract per sample. Three of the bone powder aliquots from UCT437 underwent a 10 min pre-digestionstep after which the extraction buffer was removed (pre-digest) and replaced by fresh extraction buffer followed by over-night diges-tion (ON-digest), the powder from UCT386 and one aliquot of UCT437 were extracted without the pre-digestion step (full-digest). Alleight resulting extracts were taken along for further library preparation. Negative controls were included in the extraction and takenalong for all further processing steps.ScreeningTwo double-indexed libraries were produced from an aliquot of 20 mL of the full-digest extractions of UCT386 and UCT437 (Kircheret al., 2011; Meyer and Kircher, 2010). Positive and negative controls were included in library preparation and taken along intosequencing. Libraries were enriched for human mitochondrial DNA (Maricic et al., 2010) and both enriched and shotgun librarieswere sequenced on aHiSeq2500 with 2x101+8 cycles. Processing by the EAGER pipeline (Peltzer et al., 2016) and schmutzi (Renaudet al., 2015) resulted in an endogenous DNA content of 39% and 8% and an estimated mitochondrial contamination of 0%–2% and1%–3% for UCT386 and UCT437, respectively.Library preparation for shotgun sequencingFor UCT386 four more libraries were produced from an aliquot of 20ul of full-digest extract each, including a DNA repair step withUDG and endonuclease VIII to remove deaminated bases (Briggs and Heyn, 2012). For UCT437, six additional UDG-treated librarieswere produced from 20ul each of extract from the three pre-digest and the three ON-digest extracts. After indexing PCR (Kircheret al., 2011), aliquots of the UDG-treated libraries were size selected on a PAGE gel to remove fragments of sizes below 35 and above80 bp (Meyer et al., 2012).
Ancient DNA sample processing in Dublin: Malawi samplesSampling took place in ancient DNA-dedicated clean room facilities at University College Dublin. The petrous part of the temporalbonewas selected for analysis from each individual fromHora, and other skeletal parts for the two other sites. Each complete petrouswasUV irradiated for 10min on each side prior to processing to reduce surface contamination. Any remaining sediment was removedusing a Renfert Basic Classic Sandblaster (Renfert GmbH) at low power. Bone powder was retrieved from the petrous of UCT242(Hora 1) by drilling a small hole on the superior surface of the petrous with a 4.8mm High Speed Cutter (Dremel) until the cochleawas accessible. Bone powder was then collected directly from the cochlea using a 3.2mm Tungsten Carbide Cutter (Dremel). Thepetrous from UCT243 (Hora 2) was cut from anterior to posterior using a Dremel drill at a location that transected the cochlea.The powder was collected directly from the cochlea using a 3.2mm Tungsten Carbide Cutter (Dremel). Powder aliquots from bothsamples were then UV irradiated for 5 min and placed in 2.0mL Eppendorf tubes.
Ancient DNA sample processing in Boston: Tanzania samples, Kenya samples, and Malawi sample powderSampling and DNA extractionIn a dedicated ancient DNA facility at Harvard Medical School, samples were UV-irradiated for 10 min in a UVP crosslinker. At thechosen part of each sample (root for teeth and compact part for bones) the surface was removed with a sanding disk. About75 mg (±10 mg) of fine powder was obtained by drilling into the physically cleaned part with a sterile dentist drill bit and collectedfor DNA extraction (Table S1). In the case of KC-10-1011(4353) (I0589), additional bone powder was collected for a second DNAextraction attempt. The seven Malawi_Holocene samples arrived in the Boston laboratory as powders prepared in Dublin, Ireland.
e7 Cell 171, 59–71.e1–e14, September 21, 2017

Starting from the sample powder, we followed the Dabney et al., 2013 extraction protocol for all samples, but replaced the funnel/MinElute assemblage with the pre-assembled Roche columns (Korlevi!c et al., 2015) and eluted two times in 45 mL for a total of 90 mLDNA extract.Initial library preparationOne initial barcoded library (L1) was prepared from 30 mL DNA extracts for all but two samples (Hora1 and Hora2), which were dis-colored and we reduced the volume to 3 mL (reducing the volume seems to mitigate library preparation inhibition, which we often findto be associated with discolored DNA extracts) following protocols published previously (Rohland et al., 2015) (Table S1). For threesamples (I0589, I0595, I1048) the initial library wasUDG-treated (Briggs et al., 2010) following amodification fromRohland et al., 2015(partial UDG treatment) that is tailored to inefficiently remove terminal Uracils therefore leaving the aDNA authenticity signal in theterminal bases while efficiently removing miscoding damage within the molecules. The initial libraries for the other samples(I2298, I2966, I2967) were not UDG-treated. The last step of the library preparation, the amplification with universal primers, wasset up in the cleanroom, but the thermal cycling happened in another laboratory physically separated from the cleanroom. The finalproducts of our barcoded libraries cannot be sequenced right away; an additional PCR step is needed to finalize the adaptor sites.This is advantageous in that we can incorporate a second set of barcodes through dual indexing to differentiate two or more exper-iments done with the same barcoded library within the same sequencing run (see below).ScreeningEach initial library underwent screening that consisted, first, of shallow shotgun sequencing after an indexing PCR (that adds dualindices to each library, (Kircher et al., 2011), and second, target capture enrichment for mitochondrial DNA and a varying numberof nuclear loci to assess mitochondrial haplogroup, mitochondrial contamination, aDNA authenticity and nuclear complexity (Meyeret al., 2014; Rohland et al., 2015). This experiment is finished by adding unique index combinations to each captured library, which isthen subsequently pooled with the shotgun indexing PCR product for sequencing. Sequencing was done on an Illumina NextSeq500with 2x76cycles + 2x7cycles.We demultiplexed reads to be sample-specific requiring that that the 7bp P5 and P7 indices matched (allowing one mismatch).
Sample identification was further ensured by requiring that additional 7bp internal barcodes matched, again allowing one mismatch.We merged with a modified form of SeqPrep (https://github.com/jstjohn/SeqPrep) (the modification ensures that the highest qualitybase is retained in the overlap region), requiring at least 15bp overlap between forward and reverse reads, allowing one mismatch,retaining only reads of length greater than or equal to 30 base pairs, generating single ended reads.Reads were then aligned using the samse algorithm of BWA (version 0.6.1) (Li and Durbin, 2009) using ancient parameters to allow
an increased mismatch rate, and to disable seeding (‘‘-n 0.01 #0 2 -l 16500’’). Multiple sequencing runs were run to increasecoverage, and merged together. Duplicates were then removed by identifying clusters of reads which have the same start andstop position, and the samemapped orientation. The highest base quality representative of each set is used to represent the cluster.The mix of mitochondrial and nuclear loci necessitates two different references for the alignment process: for mitochondrial analysis,we use the RSRS (Behar et al., 2012) mitochondrial genome; for nuclear analysis we use the hg19/GRCh37, 1000 Genomes releasereference genome.Additional libraries and processingTo collect more nuclear data for a subset of the samples, we prepared additional barcoded libraries (I0589, I0595, I1048, I3726)without UDG-treatment from existing DNA extracts (L2-L5). For sample I0589 we collected more bone powder than necessary forone extraction, and therefore prepared three additional libraries from a newly prepared DNA extract (E2). Four additional librariesfor one sample (I3726) were prepared on an Agilent Bravo Workstation using an automated protocol based on the partial UDG pro-tocol that replaced the MinElute cleanups with magnetic bead cleanups.All libraries underwent the same procedure as outlined, screening (see above) and nuclear target enrichment (see below), with the
exception that up to 4 libraries from the same sample were pooled in equimolar concentrations before screening and nuclear targetcapture (Table S1). Preprocessing and alignment for nuclear data used the same procedure as performed in screening, withoutrequiring the mitochondrial alignments.
Shotgun genome sequencingShotgun sequencing of the ancient South African fromSt. Helena Baywas performed at theMax Planck Institute in Leipzig, Germany,on four lanes of the Illumina HiSeq 2500 platform in rapid mode, using a double index configuration (2 3 76 + 2 3 76) (Kircher et al.,2011). An indexed FX174 control library was spiked in prior to sequencing. Base calling was done with the machine-learning algo-rithm freeIBIS (Renaud et al., 2013). Overlapping pair-end reads were merged (Kircher, 2012) and mapped to the human referencegenome (hg19/GRCh37, 1000 Genomes release) using the Burrows-Wheeler Aligner (BWA) (Li and Durbin, 2009). BWA parameterswere adjusted for ancient DNA sequences (‘‘-n 0.01 –o 2 –l 16500’’), to allow for moremismatches and indels and to turn off the seed-ing (Meyer et al., 2012). A total of 64,128,220 raw sequences were obtained from the first shotgun sequencing of the library A5369.Another 800,205,849 raw sequences were generated from the size-selected library using four lanes of the Illumina HiSeq 2500. Onlymapped sequences longer than 35 bp were retained and duplicates removed (bam-rmdup; https://bitbucket.org/ustenzel/biohazard), leaving 9,880,908 sequences from the first shotgun run and 52,551,348 sequences from sequencing the size-fraction-ated library. Duplication rates were 1.02 and 1.06, respectively, indicating that both libraries were not sequenced to exhaustion.The proportion of sequences R 35bp that mapped to the human reference genome was !28%.
Cell 171, 59–71.e1–e14, September 21, 2017 e8

Shotgun sequencing of the ancient South African from St. Helena Bay (UCT386) and the ancient South African from Kasteelberg(UCT437) was performed at the University of Tuebingen using two lanes of an Illumina HiSeq2500 instrument for 2x101+8 cycles(UCT386 non-UDG-treated library), on 50% of two lanes of an Illumina NextSeq500 instrument for 2x151+8 cycles (UCT437 non-UDG-treated library), on a complete run of an Illumina HiSeq2500 instrument for 2x125+8 cycles (four UCT386 UDG-treated andsize-selected libraries and six UCT437 UDG-treated and size-selected libraries), and on 5.5 lanes of an Illumina HiSeq2500 instru-ment for 2x125+8 cycles (four UCT386 UDG-treated libraries without size-selection and three UCT437 UDG-treated full-digestlibraries without size-selection). The samples were processed using the EAGER pipeline (Peltzer et al., 2016), clipping adaptersand merging reads subsequently with an overlap of 10bp. Resulting reads were then mapped within the pipeline against the humanreference genome GrCh37 and using BWA 0.7.5 (Li and Durbin, 2009) for further downstream analysis.
Shotgun sequencing of the Malawi_Hora_8100BP samples was performed at Harvard Medical School using an IlluminaNextSeq500 instrument. Preprocessing and alignment used the same procedure as performed in screening.
In-solution nuclear target enrichmentAfter libraries passed screening QC (that is, there was evidence of authentic ancient DNA), we performed nuclear target enrichment ofthe short (but barcoded) libraries following (Fu et al., 2015) aiming to enrich for about 1.24M SNPs in total (Fu et al., 2015; Haak et al.,2015; Mathieson et al., 2015) using a semi-automated approach on a Perkin Elmer Evolution P3 liquid handler. For two libraries(S0589.E1.L1 and S2595.E1.L1) the desired 1.24M targeted SNPs were captured in two independent reactions by enriching, first, forabout 0.39MSNPs, andsecond, for 0.84MSNPs. Theother first libraries (L1)were enriched inone single reaction (1240k). After indexingPCRs with dual indices and equimolar pooling sequencing was performed on an Illumina NextSeq500 with 2x76cycles + 2x7cycles.Preprocessing and alignment used the same procedure as performed in screening, without requiring the mitochondrial alignments.
Genotyping and initial processing of 34 present-day individuals from MalawiGenome-wide data was collected from 34 present-day individuals from Malawi using the Affymetrix Human Origins SNP array (Pat-terson et al., 2012), under a protocol for analysis of de-identified DNA samples approved by the Harvard Human Research ProtectionProgram (Protocol 11681, most recently reviewed on 12 July 2016). Quality control of the data prior to merging involved screening foroutlier individuals, excess missingness, as well as deviations from Hardy-Weinberg equilibrium, and was performed in a mannersimilar to what has previously been described (Lazaridis et al., 2014).
Data processing and preparationWe extracted genotypes from the ancient genomes by drawing a random sequence read at each position, ignoring the first and last3 bp of every read and any read containing insertions or deletions in their alignment to the human reference genome. If the randomlydrawn haploid genotype of an ancient individual did not match either of the alleles of the biallelic SNP in the reference panel, we setthe genotype of the ancient individual as missing.
We added these pseudohaploid genotypes to 17 million dinucleotide transversion SNPs identified between present-day genomesfrom the Simons Genome Diversity Panel (which includes human-fixed differences to chimpanzee). We also added the ancientgenotypes to 550 individuals from 56 African populations genotyped on the Affymetrix Human Origins array (Lazaridis et al., 2014;Patterson et al., 2012; Pickrell et al., 2012; Pickrell et al., 2014; Skoglund et al., 2015). To all these datasets we added diploid geno-types from two archaic human genomes – a Neanderthal and a Denisovan (Meyer et al., 2012; Prufer et al., 2014). The populationsshown in Figure S2 are individuals from the Affymetrix Human Origins array, when we in the text refer to Khomani_San, they are theindividuals from the Simons Genome Diversity panel and so are not shown in the legend in Figure S2.
QUANTIFICATION AND STATISTICAL ANALYSIS
Population genetic approaches that quantify shared genetic drift, such as f-statistics and admixture graph fitting, are maximallyrobust when ascertainment of SNPs are performed in an outgroup (Patterson et al., 2012; Wang and Nielsen, 2012), such that thereis no bias in allele frequencies between the analyzed populations and the polymorphism that appeared by mutation in the ancestralpopulation of all analyzed populations. Whereas the Human Origins Array that we use for most analyses comprises 13 differentpanels ascertained in modern humans (Patterson et al., 2012), none of these can be regarded as outgroup-ascertained for the pur-pose of African populations. To obtain an outgroup-ascertained set of SNPs for African populations for our modeling of deep phylo-genetic relationships, we identified 814,242 transversion SNPs polymorphic between the archaic Denisovan (Meyer et al., 2012) andNeanderthal (Prufer et al., 2014) genomes (together labeled as ‘Archaic’ here). Since the ancestors of Denisovans and Neanderthalsare consistent with having diverged from sub-Saharan lineages before those lineages separated from each other (Green et al., 2010;Mallick et al., 2016; Meyer et al., 2012; Prufer et al., 2014; Reich et al., 2010), the ascertained SNPs that were also present as poly-morphisms in sub-Saharan Africa were highly likely to have been polymorphic before the African populations diversified. We ex-tracted these positions from the 1000 genomes project MSL (Mende from Sierra Leone; 81 unrelated individuals), and YRI (Yorubafrom Ibadan, Nigeria; 107 unrelated individuals), to increase power. These 1000 genomes project sequences were processed bysampling a random sequence at each position as for the ancient data, setting the genotype as missing if it did not match either ofthe two alleles in the ascertained SNP set.
e9 Cell 171, 59–71.e1–e14, September 21, 2017

Principal component analysis and ADMIXTURE clustering analysesWe used smartpca (Patterson et al., 2006) to compute principal components using all transversion and transitions SNPs, and thepresent-day populations shown in Figure 1 and Figure S2. We projected the ancient individuals the option lsqproject: YES, oneigenvectors computed using the present-day populations on the Affymetrix HumanOrigins array. To deal with the confounder factorof recent admixture with western Eurasian-related populations on the PCA, we removed all northern Africans, eastern AfricanCushitic speakers, Nama, and 8 Khomani individuals that had 5% or more cluster membership in the shared with Europeans inan ADMIXTURE analysis.For ourmain ADMIXTURE clustering analysis (Alexander et al., 2009) (Figure 1B; Figure S3) we excluded 166,439 SNPs that were in
a CpG context and thus retain postmortem damage, and used 431,134 SNPs and 208 selected ancient- and present-day individualsgenotyped on the Human Origins Array. In Figure 1B, we show only eight representative individuals for the non-African Japanese(originally n = 29), and Sardinian (n = 27) populations. For the authentication analysis investigating evidence of contamination, weused PMDtools (Skoglund et al., 2014a) to isolate sequences from each sample that had clear evidence of contamination accordingthe postmortem damage score (PMD score > 3, using only based with phred-scaled quality of at least 30 to compute the score), andperformed clustering analysis only on 111,208 transversion SNPs (Figure S3). The exclusion of transition SNPs is due to the PMDscore approach enriching for C>T and G>A substitutions indicative of ancient DNA.
Symmetry statistics and admixture testsD-statistics, f4-statistics, and f3-statistics (Patterson et al., 2012; Reich et al., 2009) were computed with POPSTATS (Skoglund et al.,2015). f4-statistics test whether two pairs of populations are symmetric with respect to one another, and quantify any asymmetryarising from admixture. More specifically, if p1, p2, p3, and p4 are the derived allele frequencies at a biallelic SNP locus in population 1,population 2, population 3, and population 4, we can estimate f4 as a sum over all SNP loci f4 =
Pðp1 # p2Þðp3 # p4Þ (Reich et al.,
2009).D-statistics (Green et al., 2010), which are also used in this study, are a version of f4-statistics with a denominator to normalizefor heterozygosity, but in practice both statistics have similar power to detect deviations from the null model, and f4-statistics havethe additional advantage of being directly informative about admixture proportions and shared genetic drift (Patterson et al., 2012).For the statistics in Figure 3B and Figure 3C, we used 814,242 transversion SNPs polymorphic between the archaic Denisovan
(Meyer et al., 2012) and Neanderthal (Prufer et al., 2014) genomes (together labeled as ‘Archaic’ here). We extracted these locifrom the 1000 genomes project MSL (Mende from Sierra Leone; 81 unrelated individuals), and YRI (Yoruba from Ibadan, Nigeria;107 unrelated individuals). The statistics in Figure S2C used either complete genome sequences from the Simons Genome DiversityPanel (Mallick et al., 2016), or panel 5 of the Human Origins Array, which comprises 119,413 SNPs that were originally ascertained aspolymorphic positions in a single Yoruba individual. We used this set to test whether the ancient individuals were closer to one of twoSan groups because some of the SNPs on the Human Origins array were ascertained in one of the San groups, potentially affectingthe statistic. In Table S6 we report multiple D-statistics for different configurations of populations using transversion SNPs in com-plete genomes from the Simons Genome Diversity Project and ancient shotgun sequences.
Y chromosome and mitochondrial haplogroupsFor Y chromosome haplogroup calling, we filtered reads with mapping quality < 30 and bases with base quality < 30, and determinedthe most derived mutation for each sample using the tree of the International Society of Genetic Genealogy (http://www.isogg.org)version 11.110 (21 April 2016). We also used Yfitter (Jostins et al., 2014) to confirm the haplogroups of the male Faraoskop andSt. Helena Bay individuals using the entire shotgun sequence data, with identical haplogroup calls as the other approach.For mitochondrial DNA haplogroups, we used Haplogrep2 (Weissensteiner et al., 2016) with Phylotree 17 (van Oven and Kayser,
2009), restricting analysis to sites with base quality 10, and depth 1. These relatively permissive thresholds were used to maximizecoverage on the mitogenome. For sample I2966, which was found to have mitochondrial contamination, we first restricted todamaged reads using a PMD score threshold of 3 (Skoglund et al., 2014a).
Ancestry model and estimates with qpAdmClustering analyses and PCA are sensitive to genetic drift, such as the genetic drift that occurs in a population after the time ancientindividuals lived (Skoglund et al., 2014b), and may thus not provide an accurate view of shared ancestry between ancient and pre-sent-day individuals. We employed a framework for estimating ancestry proportions that is based on f4-symmetry statistics, takingadvantage of the fact that f4-statistics are proportional to admixture proportions and genetic drift. In the well-documented case ofNeanderthal admixture into non-African populations, for example, the statistic f4(chimpanzee, Neanderthal; African, non-African)is proportional to ax, where a is the proportion of Neanderthal-related ancestry (approximately 2%) and x is proportional to theamount of genetic drift that occurred from the divergence of Neanderthal ancestors and African ancestors, to the divergence ofthe sampled Neanderthal genome and the Neanderthal population that admixed with non-Africans. By analyzing many such f4-sta-tistics, (Lazaridis et al., 2014) and (Haak et al., 2015) showed that it is possible to estimate admixture proportions for a target pop-ulation without detailed assumptions about population phylogeny, and also to perform hypothesis tests for whether a particularmixture model fits the data (Reich et al., 2012) and to estimate standard errors for admixture proportions with a weighted block jack-knife procedure over large segments over the genome (in this study 5 cM). This has been implemented as the qpAdm algorithm in theADMIXTOOLS package and requires the proposal of a set of source populations aswell as a set of outgroups that are proposed to not
Cell 171, 59–71.e1–e14, September 21, 2017 e10

share drift with the target population more recently than the source populations. In other words, appropriate source populations donot need to be the true source populations but instead, need only bemore closely related to the true source populations than they areto any of the outgroups. Violations of these assumptions can be detected as an increase in rank in thematrix of f4-statistics computed(Reich et al., 2012). We also analyze a statistic using fitted allele frequencies predicted using the estimated mixture proportions, f4(Target population, Fitted Target population; Mbuti, Test). Deviations of this statistic from 0 are informative about whether some out-groups have an excess, or deficiency, of shared drift with the Target population under the fitted mixture proportions.
Here, we used amodel with 19 populations (Mbuti, Dinka, Mende, South_Africa_2000BP, Tanzania_Luxmanda_3100BP, Ethiopia_4500BP, Levant_Neolithic (PPNB), Anatolia_Neolithic, Iran_Neolithic, Denisova, Loschbour, Ust_Ishim, Georgian, Iranian, Greek,Punjabi, Orcadian, Ami, and Mixe), using previously published complete genomes (Fu et al., 2014; Lazaridis et al., 2014; Mallicket al., 2016; Meyer et al., 2012) and ancient DNA data enriched using the 1240k SNP set (Lazaridis et al., 2016; Mathieson et al.,2015) to maximize the power to infer admixture proportions for the ancient African populations. These populations, and in particularthe ones from Africa, were chosen to capture major strands of ancestry and extremes in population differentiation found in sub-Saharan Africa (Figure 1)
We then successively moved a set of candidate source populations (Mende, Dinka, Mbuti, South_Africa_2000BP, Tanzania_Luxmanda_3100BP, Ethiopia_4500BP, PPNB Anatolia_Neolithic, Iran_Neolithic) from the outgroup set to test if they fit as sourcesin admixture models. Using these 9 candidate sources populations, for each target population we thus tested 9 one-source ancestry
models,
!92
"= 36 two-source admixture models, and
!93
"= 84 three source admixture models, for a total of 9+36+84 = 129
models. In Figure S2 and Table S5, we show admixture proportions for the model with the lowest chi-square score (or highestp value), if that model had a p value > 0.01. If a one-source model did not fulfill this criterion, we considered two-source models,and then subsequently three-source models if no two-source model fulfilled the criteria.
We successfully obtained mixture models for 55 Target populations, comprising both ancient populations (we excluded Malawi_Chencherere_5200BP due to low SNP coverage) and populations genotyped on the Affymetrix Human Origins array, all shown inTable S5. In one analysis, Tanzania_Luxmanda_3100BP was also used as a target population, and in these analyses it was droppedfrom the outgroup set. We highlight some notable mixture models inferred here:
d Kenya_400BP, Tanzania_Pemba_1400BP and Hadza1 are all fitted as having !100% Ethiopia_4500BP-related ancestry. Theother group of Hadza samples are fitted as having 19% ± 8% Dinka-related ancestry (the remainder being Ethiopia_4500BP-related).
d Tanzania_Pemba_600BP, Malawi_Chewa, Malawi_Ngoni, Malawi_Tumbuka, Malawi_Yao, Yoruba, Esan, Gambian, Luo,BantuKenya, BantuSA_Ovambo, Himba, Wambo, BantuSA_Herero are all fitted as consistent with having !100% Mende-related western African-related ancestry. The Mandenka, from the western African coast, are fitted as having 2.8% ± 0.6%Levant Neolithic-related ancestry (PPNB).
d The Luhya, an eastern Bantu-speaking group, are fitted as having 40% ± 6%Dinka-related ancestry, with the remainder beingwestern African Mende-related ancestry.
d The Biaka, a western rainforest hunter-gatherer group in Cameroon, is fitted as having 72% ± 2% Mbuti-related ancestry (theMbuti are an eastern rainforest hunter-gatherer group), with the remainder being western African Mende-related ancestry.
d Theminimum indigenous southern African ancestry observed in Khoe-groups and Bantu-speakers in southern Africa is!8% ±2% in the Damara, and the remainder is western African-related.
d The maximum indigenous southern African ancestry observed in the present-day populations is the 91% ± 1% inferred for theJu_hoan_North, with the remainder being related to Tanzania_Luxmanda_3100BP.
d Some populations in northern and eastern Africa are fitted as having large proportions of Tanzania_Luxmanda_3100BP-relatedancestry. This includes the Maasai (49% ± 2%) and Datog (66% ± 3%) who have ancestry also related to the Dinka; the Kikuyu(63% ± 2%) who also have ancestry related to the Mende; and finally, the Afar (79% ± 3%) and Somali (62% ± 6%) who havelarge amounts of inferred Tanzania_Luxmanda_3100BP-related ancestry in addition to ancestry related to the Iran Neolithic.
Maximum likelihood tree modelWeused the four ancient African shotgun genomes together with complete genomes fromAfrican populations in the SimonsGenomeDiversity project (Mallick et al., 2016), excluding populations with evidence of asymmetrical allele sharing with non-Africans indicativeof gene flow (Table S6), to reconstruct a maximum likelihood tree using Treemix v1.12 (Pickrell and Pritchard, 2012). We performed100 bootstrap replicates to assess the uncertainty of the fitted model. While this tree is not an adequate representation of humanpopulation history in Africa, we found 100% bootstrap support for the Ethiopian_4500BP Mota being most closely related to theancestral population of all non-Africans (Figure 3A).
Testing a tree-like model of African population historyThe maximum-likelihood tree based on allele frequency covariance between the ancient African genomes and complete genomesfrom the SGDP panel (Figure 3A) recapitulates many aspects of previous analyses of African populations (Pickrell et al., 2012;
e11 Cell 171, 59–71.e1–e14, September 21, 2017

Schlebusch et al., 2012). When African populations are forced into a tree (not allowing for mixture), southern African ancestorsdiverge first, followed by Central African rainforest hunter-gatherers (e.g., Mbuti), western Africans, ancient and present-day easternAfricans (Dinka, Hadza), then non-Africans.To scrutinize this tree-like model in more detail, we computed all 35 D-statistics that include the outgroup and have an expected
value of 0 if a tree-like model (chimpanzee, (South_Africa_2000BP, (Mbuti, (Mende, (Dinka, Ethiopia_4500BP))))) is true. We find thatmost statistics computed are inconsistent with the null model (Figure S4A). Notably, we reject the hypothesis that the ancient SouthAfricans are an outgroup to other African populations for several pairs of present-day populations (Table S6; Figure S4A). Forinstance, with genome sequence data we find that the Ethiopian_4500BPMota genome shares more derived alleles with the ancientSouth Africans thanwith present-day western Africans (D[chimpanzee, South_Africa_2000BP; Yoruba, Ethiopia_4500BP] > 0). This isalso true when West Africans are compared to Mbuti (D[chimpanzee, South_Africa_2000BP; Yoruba, Mbuti] > 0). Similar excess ofshared derived alleles is observed for the eastern Pygmies (Mbuti) compared to western Pygmies, and even when contrasting west-ern African populations such as the Yoruba and Mende (Figure 3B; Figure 3C; Table S6; Figure S4). This could be explained in twoways: 1) there has been gene flow between ancient southern Africans and a broad set of other populations that has resulted in agradient of southern African relatedness, or 2) there is a gradient of ancestry in western Africans that is basal to southern Africans,causing an attraction to the outgroup (chimpanzee in this case) (see below).
Testing admixture graph models of African population historyTo reconstruct admixture graph models relating the histories of African populations, we used South_Africa_2000BP (South Africa),Mende (MSL; West Africa), and Ethiopia_4500BP (East Africa) to represent major lineages contributing to present-day Africans. Inaddition, we sought to explain one of the most surprising observations in our data, that the Mende and Yoruba West African popu-lations are not symmetrically related to South_Africa_2000BP, and so we also included the Yoruba (YRI) in these analyses. For alladmixture graph analyses, we used 814,242 transversion SNPs polymorphic between the archaic Denisovan (Meyer et al., 2012)and Neanderthal (Prufer et al., 2014) genomes (together labeled as ‘Archaic’ here).A tree-like model does not fit the dataWe first tested a strict tree-like model with no admixture edges, hypothesizing that the topology obtained from basic tree reconstruc-tions where southern Africans are the earliest diverging lineage, and Yoruba and Mende are a clade to the exclusion of theEthiopia_4500BP, is true (Figure S4B). We found that this model is strongly rejected by the data with 19 predicted f4-statistics devi-ating from the empirically observed data by jZj > 3. The most deviating f4-statistic was f4 (Archaic, Ethiopia_4500BP; MSL, YRI),which is predicted to be 0 in the tree-like model but is empirically observed to be f4 = 0.000427, Z = 9.157. Insight into the imperfectfit can be obtained by inspecting all four significant f4-statistics that are predicted to be zero in the model:
d f4(Archaic, Ethiopia_4500BP; MSL, YRI) = 0.000427, Z = 9.157d f4(Archaic, South_Africa_2000BP; MSL, YRI) = 0.000193, Z = 4.742d f4(South_Africa_2000BP, Ethiopia_4500BP; MSL, YRI) = 0.000235, Z = 4.583d f4(Archaic, South_Africa_2000BP; Ethiopia_4500BP, MSL) = #0.000728, Z = #3.068
The three most significant deviations all test the (MSL,YRI) clade. The deviations thus indicate shared history either between MSLand the outgroup Archaics, or between YRI and South_Africa_2000BP/Ethiopia_4500BP. These observations could be parsimoni-ously explained by any of the following gene flow events
d Gene flow from a basal human lineage (separating from the ancestors of all sub-Saharan Africans before their separation fromeach other) into the ancestors of MSL to a greater extent than YRI (there is no evidence of specifically Neanderthal/Denisovangene flow since f4(chimpanzee, Archaics; MSL,YRI) = #1.6 in this data)
d Gene flow related to YRI into the ancestors of Ethiopia_4500BP and South_Africa_2000BPd Gene flow related to Ethiopia_4500BP into the ancestors of YRI more than MSLd Gene flow most closely related to MSL into the common ancestors of the archaic Neanderthals and Denisovans (we exclude
this as implausible)
The fourth deviating statistic f4(Archaic, South_Africa_2000BP; Ethiopia_4500BP,MSL) (Z = 3.068) suggests that Ethiopia_4500BPandMSL are not a clade with respect to South_Africa_2000BP. This weakens the case for gene flow into Yoruba alone as a sufficientexplanation, since the Yoruba do not enter into this statistic. Instead, either excess basal ancestry in the Mende and gene flow be-tween South_Africa_2000BP and Ethiopia_4500BP could explain this particular statistic.Admixture models with gene flow eventsWe proceeded by testing models with one gene flow event positing that YRI have mixture related to either South_Africa_2000BP orEthiopia_4500BP, or that MSL have ancestry from a basal lineage (Figure S4C; Figure S4D; Figure S4E). We found that neither ofthese fit the data, with between 4 and 13 f4-statistic outliers with jZj>3.Testing admixture graphs with two admixture events, we found that a model where both YRI and MSL have ancestry from a basal
African lineage had its single outlier in an f4 statistic f4(Archaic, Ethiopia_4500BP; Ethiopia_4500BP, YRI) that is more negative in the
Cell 171, 59–71.e1–e14, September 21, 2017 e12

data than the model (Figure S4F). This f4-statistic has Ethiopia_4500BP appearing twice, and can thus be rearranged to be an f3statistic f3(Archaic, YRI; Ethiopia_4500BP) that is not positive enough (Z = 3.157), and can thus be interpreted as the model under-representing the external drift in the Ethiopia_4500BP genome. We do not consider this outlier to compromise the model, as the pro-cessing of the Ethiopia_4500BP (Mota) genome that we use is pseudo-haploid (single random sequence read), and thus there is noreal information about the external drift of the Mota lineage. This outlier may thus reflect a difficulty in modeling external drift forpseudo-haploid samples.
In addition, we found that an admixture graph where both Ethiopia_4500BP and YRI are mixed between MSL- and South_Africa_2000BP lineages does not fit the data (Figure S4G), with 3 outliers, and the worst being Z =#4.835. However, a model where the YRIhas !2% ancestry from a population that is mixed between South_Africa_2000BP and Ethiopia_4500BP fits the data with 2 outliersthat are not too surprising after correcting for multiple hypothesis testing (Figure S4H). These outliers are f4(Archaic, South_Africa_2000BP; Ethiopia_4500BP, MSL) (Z = 3.068) which was also significant for the tree model without admixture, and f4(Archaic, South_Africa_2000BP; Ethiopia_4500BP, YRI) (Z = 3.018). Both these outliers could be consistent with the presence of basal Africanancestry in YRI and MSL, or unmodeled gene flow between the ancestors of South_Africa_2000BP and Ethiopia_4500BP.
We thereby conclude that themost parsimonious admixture graphmodels identified here posit either the presence of basal Africanancestry inMende and Yoruba (Figure 3D; Figure S4F), or alternatively admixture from a source related to both South_Africa_2000BPand Ethiopia_4500BP in the Yoruba but not theMende (with evidence also for gene flow between South_Africa_2000BP and Ethiopia)(Figure 3F; Figure S4G).
Automated grafting of populations onto a skeleton admixture graphUsing the admixture graph model in which the Yoruba and Mende both carry ancestry from a basal western African population, weautomatically added additional populations to each possible node in the graph. We evaluated the fit in terms of the number and de-viation of outlying f4-statistics, as well as whether the added branches had zero drift length. We show the results of this procedure inTable S7, with the key to the node labels used shown in Figure S5A. We highlight topologies that we consider optimal fits in Fig-ure S5B-5G.
We find that the Malawi_Hora_8100BP shotgun sequence data can be best fitted as mixed between the lineage leading to South_Africa_2000BP, and the lineage related to Ethiopia_4500BP that also is fitted as forming part of the ancestry of YRI and MSL (Fig-ure S5B). Similarly, theMbuti can be best fitted asmixed between the lineage related to Ethiopia_4500BP that also is fitted as formingpart of the ancestry of YRI and MSL, and second a lineage that diverged prior to South_Africa_2000BPbut after the basal westernAfrican lineage (Figure S5C). Non-Africans (Japanese) are fitted as having part Archaic ancestry (Green et al., 2010), with theremainder of their ancestry again being derived from the lineage related to Ethiopia_4500BP that also is fitted as forming part ofthe ancestry of YRI and MSL (Figure S5D). This analysis is consistent with the possibility that the same human lineage contributedancestry both to the source of non-Africans and many African populations today.
Support for a single out-of-Africa founding populationSimple tree models suggest that non-African variation represented by Sardinian, English, Han Chinese and Japanese falls within thevariation of African populations. To test whether non-Africans are indeed consistent with being descended from a homogeneouspopulation that separated earlier from the ancestors of a subset of African populations – beyond the known effects of archaic admix-ture in non-Africans –we used African populations with little or no knownWest Eurasianmixture (South_Africa_2000BP,Mbuti, Biaka,Mende, Ethiopia_4500BP, Dinka) and testedwhether they are consistent with being an unrooted clade with respect to a diverse set ofnon-Africans (Orcadian, Onge, Mixe, Motala_Mesolithic, Japanese, Anatolia_Neolithic) using qpWave (Patterson et al., 2012; Reichet al., 2012). We found that this model was consistent with the data (p = 0.53) (transition SNPs excluded to a final set of 110,507 trans-version SNPs). Even when we add New Guinean highlanders to the set of non-Africans, the single-source model for the out-of-Africafounders is not rejected (p = 0.11).
Date of admixture between expanding agriculturalists and previously established foragersWeestimated thedate of admixture betweenexpanding agriculturalists related towestern Africans (probablyBantu-speakers) and thepreviously established foragers using the ALDER software (Loh et al., 2013), which uses the rate of decay per generation of the linkagedisequilibrium that is created in admixed populations and that can be detected using signed linkage disequilibriumweighted by allelefrequency differences between populations taken as proxies for the ancestral populations (Moorjani et al., 2011). To maximize statis-tical power, we used the full 1240k data merged with 1000 genomes phase 3 genotype data. We then estimated weighted linkagedisequilibrium in 99 unrelated LWK individuals (Luhya fromWebuye, Kenya) a Bantu-speaking group, using 85 unrelatedWest AfricanMSL individuals (Mende from Sierra Leone) and 4 ancient eastern African hunter-gatherer individuals (Ethiopia_4500BP, Tanzania_Pemba_1400BP, Tanzania_Zanzibar_1400BP, Kenya_400BP). The analysis used a total of 1,070,197 SNPs. We obtained significantevidence for one-reference weighted LD decay for both putative source populations (Z!6), as well as for the two-reference weightedLD decay (Z = 4.89, p = 10#5). The estimated date of mixture was 16.8 generations ago, with a standard error of 3.4. Assuming a gen-eration timeof 30years, this suggests that admixtureoccurredonaverage380 to760yearsago (95%confidence interval).Wenote thata previous study (Pickrell et al., 2014) did not obtain high-confidence support for West African related admixture in the Luhya, and we
e13 Cell 171, 59–71.e1–e14, September 21, 2017

hypothesize that our clear demonstration of this is due to both the availability of amore accurate ancestral population in the formof theancient eastern Africans, as well as to the increased leverage from the large samples size 1000 Genomes data.
Evidence for selective sweeps in the ancestry of present-day SanWe performed a genome-wide scan for large genomic regions with excessive allele frequency between present-day San (Khomaniand Ju_hoan_North) and the two ancient South_Africa_2000BP, with the Mbuti as a second outgroup. Previous statistics such as theLocus-Specific Branch length (LSBL) (Shriver et al., 2004) and the derivative Population Branch Statistic (PBS) (Yi et al., 2010) alsoestimate a branch length in a three-population phylogeny, but use FST as their base, which can be undefined when used for loci withfixed differences. Thus, we computed the statistic f3 = (pSan-pSouth_Africa_2000BP)(pSan-pMbuti) for windows of 500kb, separated by10kb. We only retained windows with at least 50 SNPs, resulting in a total of l = 262,047 autosomal loci. We approximated the neutralgenome-wide average mf and its standard deviation sf by subsampling 546 of the windows, requiring that these were separated by atleast 5 million base pairs (Mb) and thus approximately independent. We then standardized the distribution of the test statistic fw ineach window as Z(fw) = (fw - mf )/sf. We show the most deviating windows in Table 2.
Evidence for polygenic selectionInvestigating evidence for polygenic selection in African populations is complicated by the fact that most information on the genomicbasis of human phenotypic variation has been based on analysis of highly differentiated populations from Africans such as Euro-peans. In the absence of rich phenotypic information about sub-Saharan African populations, we used gene ontology (GO) informa-tion, which draws on information from a wide array of studies on humans and non-human model organisms. We focused on 208 GOcategories that contained at least 50 genes each, which allows us to compute genome-wide block jackknife standard errors using theentire genic regions. We focus on f3-statistics that measure the length of one of the branches in a hypothetical three-way tree-likepopulation history (assuming no admixture). The three populations we focused on were the ancient South_Africa_2000BP (n = 2pseudohaploid draft genomes), the present-day San (n = 6 complete genomes), and the Mbuti (n = 4 complete genomes). The avail-ability of the two ancient South_Africa_2000BP genomes can in principle inform us about selection in the last !2000 years sincethese individuals lived, or starting further back in time in case they are not from a direct ancestral population of the present-daySan (our data suggest that they are more closely related to the Khomani San than to the Juj’hoan). We thus computed the statisticf3(Mbuti, South_Africa_2000BP; San) which is proportional to allele frequency differentiation in the present-day San compared to theother two populations.We find that the ‘‘RESPONSE_TO_RADIATION’’ GO category is an outlier that shows the greatest degree of differentiation in this
analysis. However, this could also be due to genes in this category constantly being under rapid evolution or having other differencescompared to other categories. To test this, we computed the statistic f3(San, South_Africa_2000BP; Mbuti), and found no strongsignal in the response to radiation category. Instead, the category with the strongest evidence of differentiation in the Mbuti lineagesince the divergence from the San groups is ‘‘REGULATION_OF_GROWTH,’’ suggesting the possibility of relatively recent evolutionof the shorter stature of present-day rainforest hunter-gatherer populations.
DATA AVAILABILITY
Raw sequence data (bam files) from the 15 newly reported ancient individuals is available from the European Nucleotide Archive. Theaccession number for the sequence data reported in this paper is ENA: PRJEB21878. The newly reported SNP genotyping data isavailable to researchers who send a signed letter to D.R. containing the following text: ‘‘(a) I will not distribute the data outside mycollaboration; (b) I will not post the data publicly; (c) I will make no attempt to connect the genetic data to personal identifiers forthe samples; (d) I will use the data only for studies of population history; (e) I will not use the data for any selection studies; (f) I willnot use the data for medical or disease-related analyses; (g) I will not use the data for commercial purposes.’’
Cell 171, 59–71.e1–e14, September 21, 2017 e14

Supplemental Figures
Figure S1. Archaeological Context and Dating of Newly Reported Human Remains from Malawi, Related to Figure 1(A) Locations of the three sites in Malawi.
(B) Plan of the Hora rock shelter showing locations of the original Hora 1 (male) and Hora 2 (female) burials relative to new excavations from 2016 and 2017.
(C) Plan of Fingira Cave showing locations of human remains recovered in 1966 (green dots) and 2016 (green stars).
(D) Plan of Chencherere II rock shelter redrawn fromCrader (1984a), showing approximate locations where human remains were recovered in 1972 (red and green
stars), and the approximate locations of the remains sampled from Nguludi for this study (blue stars).
(E) Ultrafiltered collagen FTIR spectra for three individuals fromMalawi (MW2 =UCIAMS-186346,MW3=UCIAMS-18647,MW4=UCIAMS-186348) compared to
well-preserved standards and samples (Modern Carabou, BU4, RP01, POR1). These samples show the typical features for well-preserved collagen. The top of
the figure shows the FTIR spectra for a single XAD purified sample (MW1 =PSUAMS-1734) compared against a well preserved standard (BeaufordWhale). These
data, along with the stable isotopes and C:N ratios, indicate that these samples are well preserved and that the AMS 14C dates are reliable.
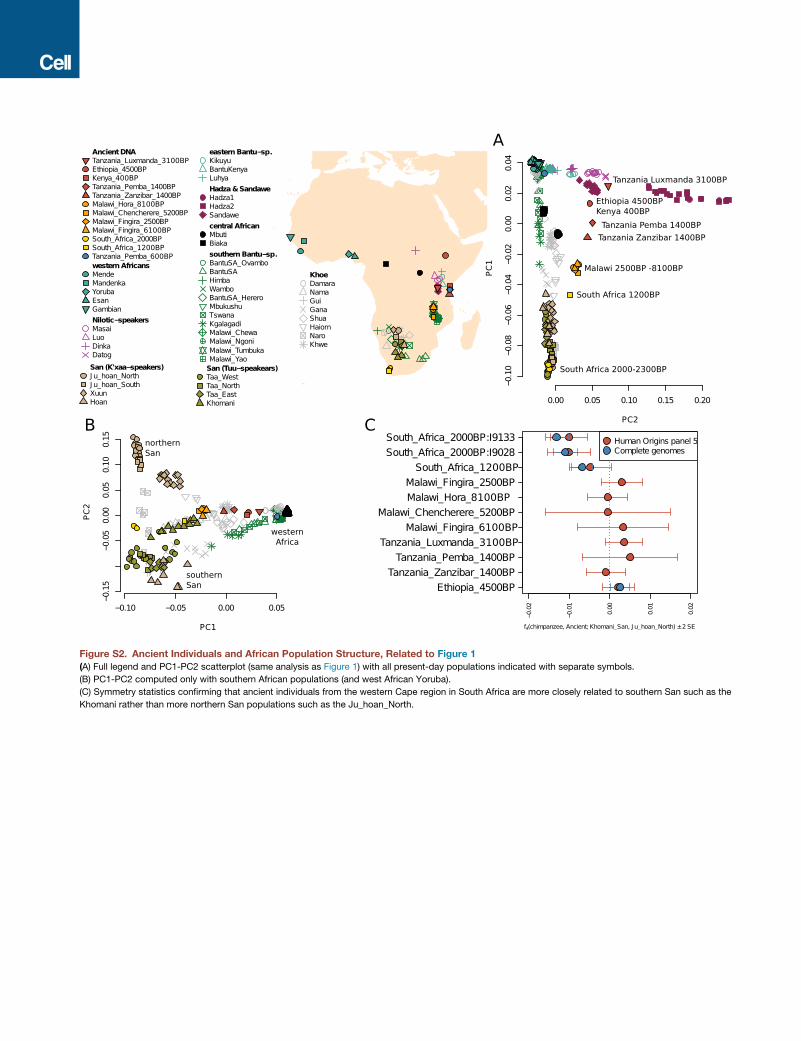
Figure S2. Ancient Individuals and African Population Structure, Related to Figure 1(A) Full legend and PC1-PC2 scatterplot (same analysis as Figure 1) with all present-day populations indicated with separate symbols.
(B) PC1-PC2 computed only with southern African populations (and west African Yoruba).
(C) Symmetry statistics confirming that ancient individuals from the western Cape region in South Africa are more closely related to southern San such as the
Khomani rather than more northern San populations such as the Ju_hoan_North.

Figure S3. Admixture Clustering Analysis of K = 2–K = 7 Clusters, Related to Figure 1Each bar shows inferred cluster membership in each individual for a given number of clusters. This analysis used 431,134 SNPs that were not in a CpG dinu-
cleotide context. We also show an inset with cluster membership inferred for damage-restricted ancient DNA sequences (PMD-score > 3) in a parallel run with
only 111,208 transversion SNPs.

(legend on next page)

Figure S4. Admixture Models of African Population History, Related to Figure 3(A) A tree-like model. Tests of all possible triplet topologies predicted to be symmetric by the tree obtained for major African population lineages in the maximum
likelihood model in Figure 3A.
(B–H) Under each graph we show the outlier f4 statistic with the greatest Z-score betweenmodel and empirical values. When the same group appears twice in an
f4 statistic (e.g., f4(Archaic, South_Africa_HGs; South_Africa_HGs,YRI), this corresponds to an f3 statistic. Graphs F andH are themost parsimonious fits with only
two admixture events.

(legend on next page)

Figure S5. Automatically Adding Additional Populations to a Skeleton Graph, Related to Figure 3(A) Skeleton graph invoking widespread admixture from a hypothesized ancestral northeast African population.
(B–D) Best fitting insertion points for Malawi_Hora_8100BP shotgun sequence data (B), Mbuti (C), and Japanese non-Africans (D), in the skeleton graph displayed
in (A). For details see Table S7.
(E–G) Best three graph solutions, all without outliers, for grafting Malawi_Hora_8100BP (Malawi_HGs) onto the skeleton graph in (A). For details see Table S6.