reconstruction of glacier equilibrium-line altitudes for the last
TRANSCRIPT

JOURNAL OF QUATERNARY SCIENCE (2005) 20(7–8) 789–800Copyright � 2005 John Wiley & Sons, Ltd.Published online in Wiley InterScience (www.interscience.wiley.com). DOI: 10.1002/jqs.974
Reconstruction of glacier equilibrium-linealtitudes for the Last Glacial Maximum on the HighPlain of Bogota, Eastern Cordillera, Colombia:climatic and topographic implicationsBRYAN G. MARK1* and KARIN F. HELMENS21 Department of Geography, The Ohio State University, Columbus, OH, USA2 Department of Physical Geography and Quaternary Geology, Stockholm University, Stockholm, Sweden
Mark, B. G. and Helmens, K. F. 2005. Reconstruction of glacier equilibrium-line altitudes for the Last Glacial Maximum on the High Plain of Bogota, Eastern Cordillera,Colombia: climatic and topographic implications. J. Quaternary Sci., Vol. 20 pp. 789–800. ISSN 0267-8179.
Received 29 July 2005; Revised 16 September 2005; Accepted 16 September 2005
ABSTRACT: The High Plain of Bogota in the Andes of Colombia provides an exceptionally detailedrecord of glaciation. A two-stage Last Glacial Maximum (LGM) is noted in Bogota; the older stage(max) presents an opportunity to reconstruct individual valley glaciers and explore spatial patterns.Well-mapped geomorphic features on topographic base maps permit the reconstruction of 23 palaeo-glacier surfaces. Glacier extent varies across the region, with lower altitudes reached farther to theeast. Equilibrium line altitudes (ELAs) are reconstructed using the area–altitude balance ratio (AABR)method, with BRs in three groups reflecting the W–E gradient in glacier extent and selected by mini-mising variation from group means. Average LGM ELA for all palaeoglaciers is 3488 m with a stan-dard deviation of 182 m. The average lowering in ELA from LGM to modern of ca. 1300 m is bestexplained by a considerable drop in temperature. Significant intra-regional variance in LGM ELAcan be ascribed to topography and its influence on precipitation and/or glacier form, with lowerheadwall elevations being correlated to larger accumulation areas. Copyright � 2005 John Wiley& Sons, Ltd.
KEYWORDS: Last Glacial Maximum; equilibrium line altitudes; hypsometry; Colombia; glacial geology.
Introduction
The mountainous highlands in the region around Bogota,Colombia, comprise an important region for evaluating theextent, timing and distribution of glacial advances thatoccurred during the Last Glacial Maximum (LGM) in SouthAmerica. Located at 4–5 �N on the South American continent,within the northern reaches of the Andes, this tropical regionlies at a climatic juncture between hemispheres and featuresclear evidence of previous glaciations. It is within the influenceof the northeastern trade winds, and likewise has been groupedwith circum-Caribbean sites in previous glacial histories (e.g.Lachniet and Vazquez-Selem, 2005). Located in the eastern-most branch of the Andes, the region receives moisture fromboth the Amazon basin to the east, as well as the Pacific tothe west (Helmens, 1988). ENSO dominates the interannualclimate variability (Poveda et al., 2001). Moreover, well-preserved glacial geomorphic evidence has yielded constraintson the chronology of tropical Andean glaciation and allows to
test important hypotheses related to the interaction of glacierclimate and topography.
At an altitude just below 4000 m, the mountains around theSabana de Bogota are currently not glacierised, but are highenough to have experienced repeated glaciations that pre-datethe Holocene. There is an excellent record of moraines andgeomorphologic features that have been mapped (Helmens,1988, 1990). Moreover, the high plain on which Bogota islocated, the Sabana de Bogota, is a closed sedimentary basinthat supported large lakes during the Pleistocene. This basinwas situated at an elevation between the extreme tree levelsof glacial and interglacial periods, and contains well-dated lakesediment sequences and multiple pollen records (van derHammen and Hooghiemstra, 1995, 2003). These independentchronostratigraphic records provide ecological proxy recordsto constrain contemporaneous climate conditions at the timethe moraines were formed.
Analysis of the extent and timing of glacial events in thisregion provides an important point of comparison to link gla-cial activity between hemispheres during the last glacial cycle.It is a critical location between well-dated sites farther to thesouth along the Andes and to the north into the North AmericanCordillera not only to test the inter-hemispheric synchroneity ofglaciation (i.e. Clapperton, 2000), but also to compare the
* Correspondence to: Bryan G. Mark, Department of Geography, The Ohio StateUniversity, Columbus, OH 43210, USA. E-mail: [email protected]

relative spatial extent and climatic forcing of earlier glacieradvances. The bounding dates of the last glacial cycle in tropi-cal South America are not well constrained, but the longestsedimentary records from Lake Titicaca would imply that theinitiation (the last interglacial–glacial transition) occurredafter ca. 64 000 yr BP (Seltzer et al., 2003). Furthermore, thesame records indicate that the onset of deglaciation pre-datedthat of the Northern Hemisphere by a couple of millennia(Seltzer et al., 2002). Other sites in the Central Andes haveyielded mapped moraines with cosmogenic dates recordingmultiple glacial advances during this time, with a much dimin-ished glacier extent during the LGM (Smith et al., 2005). Radio-carbon-dated geomorphic evidence from the mountainsaround Bogota have indicated five successively less extensiveglaciations during the last 50 000 yr BP (Helmens, 1988, 1990;Helmens and Kuhry, 1995; Helmens et al., 1997). While theglacial chronology (discussed below) suggests much closertiming to the global maximum in ice volume at the LGM asdefined by the EPILOG project at 21 000� 2000 yr BP (Mixet al., 2001), the evidence indicates a two-stage LGM separatedby a distinct warming episode and potentially abrupt deglacia-tion (Helmens et al., 1996).
The existence of good moraine maps and valley topographicdata for this region allows individual palaeoglacier surfaces tobe reconstructed. A preliminary reconstruction of individualpalaeoglaciers was incorporated as a regional case study intoa global database of individual tropical palaeoglacier equili-brium line altitudes (ELAs) at the LGM (Mark et al., 2005),but remained undocumented. Other previously publishedreconstructions of palaeoglacier ELAs have utilised onlythe average moraine altitudes to derive a regional averageusing simple altitude ratios (Lachniet and Vazquez-Selem,2005). However, regional averages based on such simplifiedaltitude-based methods are problematic since local topographycan alter regional climate and affect glacier morphology (i.e.Kerr, 1993). Analyses of the global database concluded thatlocal topographic influence can predominate over regional cli-mate, causing intra-regional variation in ELA to complicate anyregional climatic interpretation (Mark et al., 2005). Therefore,meaningful regional climatic interpretations from glacier ELAsmust be based on individual palaeoglaciers over the spatialrange of glaciation.
In this paper, we review the glacial geology and presentdetailed methodology and mapped models of individual gla-cier forms used to estimate palaeo-ELAs in the Bogota region.We discuss the results in the context of local precipitation gra-dients and also explore other topographical factors influencingthe intra-regional variance in ELA.
Geographical setting
The high plain of Bogota, or Sabana de Bogota, is a large tec-tonic basin flanked by mountains reaching close to4000 m a.s.l. located in the eastern-most chain (CordilleraOriental) of the tropical Andes between 4 �300–5 �150N lati-tude. Presently, the mountains are glacier-free, but extensiveglacial landforms (Helmens, 1988, 1990) give evidence of for-mer glaciation. The nearest presently glacierised mountainsare the Sierra Nevada del Cocuy, with a modern snowlineabove 4700 m a.s.l (Helmens et al., 1997). This study focuseson three sub-regions surrounding Bogota where the LatePleistocene glacial sequence was mapped in detail by Helmens(1988): the Paramo de Palacio, the Paramo de Sumapaz, andthe Paramo de Pena Negra (Fig. 1). Present-day climate condi-
tions in the Northern High Andes are reflected in the name;paramo refers to the altitudinal belt between the tree lineand permanent snow, as well as to the vegetation that occursin it (Rull, 1998). Climate in the paramos is generally coldand humid, with a mean annual temperature in thenearby Venezuelan highlands ranging from zero to 10 �C(Salgado-Labouriau, 1979). Over the Sabana de Bogota,situated at an altitude of about 2600 m a.s.l. in the upper partof the Andean forest belt, mean annual temperatures are about13–15 �C, with an estimated lapse rate of 0.66 �C per 100 m(van der Hammen and Gonzalez, 1963). As is typical of tropi-cal highlands, the temperature shows little seasonal but largediurnal variation, and is mainly controlled by altitude and clou-diness (Schubert and Clapperton, 1990).
The primary feature of regional climatic variability in this iso-thermal tropical highland setting is the strong seasonality inprecipitation, which is locally modified by topography. Thetropical region features two annual precipitation maxima,March–June and September–November, associated with thesolar zenith and meridionally migrating equatorial trough.Between these high mountains, the Sabana de Bogota formsthe upper drainage of the Rıo Bogota that drains to the SW.The general NE–SW trend of the Andes in this region directsthe outward drainage from the mountains to the SE, down thesteep ‘Llanos slope’ on the side of the Llanos Orientales, and tothe NW, down the ‘Magdalena slope’ towards the inter-Andean Rıo Magdalena (Fig. 1). The principal source of atmo-spheric moisture to the region is the Pacific Ocean to the west,except for the eastern slopes. The easterly trade winds enhancethe moisture flux from the east, resulting in only one annual dryseason, and feature a higher peak in strength in July–August(Helmens, 1988). Total annual precipitation is strongly con-trolled by local topography, with maxima of over 2000 mmto ca. 1400 mm along the Llanos and Magdalena slopes,respectively. A rainshadow effect causes a decrease in precipi-tation totals elsewhere, down to annual totals of 600–900 mmon the Sabana proper and in its adjacent valleys. Interannualvariability in the hydroclimatology of the region is most signif-icantly impacted by ENSO (Poveda et al., 2001).
Glacial geology
Glacial landforms in the high mountain ranges of the Paramode Guerrero, the Paramo de Pena Negra, the westernmost partof the Paramo de Palacio and the northern part of the Paramode Sumapaz have been mapped in detail by Helmens (1988)and reviewed in the context of the Quaternary glacial recordof the Colombian Andes (Helmens, 2004). The glacial geologi-cal mapping focused on the mountain slopes that are drainedtowards the high plain of Bogota, because it formed part of aproject on the Pliocene–Quaternary stratigraphy, palaeoenvir-onments and landscape evolution of the Bogota basin and sur-rounding mountains (Helmens, 1990). For comparison studies,Helmens (1988) also mapped glacial landforms in one ofthe valleys of the Paramo de Palacio along the outer, easternslope of the Cordillera, and in the northern valleys of theParamo de Sumapaz that are drained directly towards theinter-Andean Magdalena River. Here we summarise the princi-pal moraine formations and ages. To simplify notation, allradiocarbon dates in this paper are in uncalibrated years beforepresent, where ka¼ 14C yr BP.
Based on general morphology and degree of modificationby erosion and denudation, the maps by Helmens (1988)differentiate four morainic complexes, defined from oldest to
790 JOURNAL OF QUATERNARY SCIENCE
Copyright � 2005 John Wiley & Sons, Ltd. J. Quaternary Sci., Vol. 20(7–8) 789–800 (2005)

youngest as morainic complexes 1 to 4. Yet sites with ‘olderglacial deposits’, which no longer display a morainic topogra-phy, have been additionally encountered beyond the sequenceof moraines (van der Hammen et al., 1980; Helmens, 1990).Therefore, radiocarbon dates of organic-rich sediments andpalaeosols associated with the glacial moraine complexes, inaddition to older evidence provided by the radiocarbon-datedpalaeosol sequence in the Bogota area, place glacial eventsbetween probably 43 and 38 ka, 36 to 31 ka (complex 1),23.5 to 19.5 ka (complex 2), 18.0 to 15.5 ka (complex 3), and13.5 to 12.5 ka (complex 4) (Helmens, 1988, 1990; Helmens
and Kuhry, 1995; Helmens et al., 1997). The study of theBogota morainic sequence is characterised by its great detail,and provides one of the best-dated Late Pleistocene glacialrecords for the Andes (Clapperton, 2000).
Maximum glaciation in the Bogota mountains pre-dated theMarine Isotope Stage 2 (MIS 2) glacial maximum (LGM). One(possibly two) major glacier advance(s) during MIS 3 are recog-nised, the moraines of which are only very locally preserved(complex 1), occurring at elevations some 200 m below theLGM moraines. Palaeosols found stratigraphically boundingmoraines and reworked till suggest these glacier fluctuations
4.20
4.30
4.40
4.50
4.60
4.70
4.80
4.90
5.00
5.10
-74.30 -74.20 -74.10 -74.00 -73.90 -73.80 -73.70
Group 1Group 2Group 3
1 P ramo de Palacio2 P ramo de Sumapaz3 P ramo de Pe a Negra
ááá
3
2
1
South America
Equator 0
Eastern Cordillera
Llanos Orientales
Rio
Mag
dale
na
Colombia
Andes
> 1000 m> 3000 m> 4000 m
N0 100 km4
7
-74 -72
Sabanade Bogotá
Sierra Nevadadel Cocuy
Sabanade Bogotá
P ramo de Pe a Negraá ñ
P ramo de Sumapazá
P ramo de Palacioá
Bogotá
Latit
ude
(ºN
)
Longitude (ºW)
ñ
Figure 1 Map showing the Sabana de Bogota in the Eastern Cordillera of Colombia with locations of the three Paramo regions indicated, with thelower panel showing the groupings of the reconstructed palaeoglaciers
ICE AGE SNOWLINES, COLOMBIA 791
Copyright � 2005 John Wiley & Sons, Ltd. J. Quaternary Sci., Vol. 20(7–8) 789–800 (2005)

occurred between 43 and 38 ka and between 36 and 31 ka(Helmens et al., 1997). Major glacier advances during MIS 3seem to have been caused by cool and humid climatic condi-tions. The LGM consisted of two glacial maxima just before19.5 and 15.5 ka, separated by an interval of glacier retreat.The moraines of complex 2 (early stade of LGM) partiallyenclose the moraines of complex 3 but reach ca. 100–150 mfarther down-valley. Morainic complex 2, however, has beendistinctly more affected by erosional and denudational pro-cesses, is generally incomplete, and displays more subduedridges than the sharp crests of morainic complex 3. The young-est of the two LGM morainic complexes, complex 3 (late stadeof LGM), shows the most impressive morainic morphology ofthe different morainic complexes recognised in the Bogotamountains. The arcuate, multiple ridge system rises tens ofmetres above the valley floors and the related maximum iceextent can be continuously traced throughout the mountainranges studied. The Bogota mountains were deglaciated atca. 12.5 ka following a Lateglacial advance of cirque glaciersthat left a distinct system of winding morainic ridges standinga few metres high (complex 4) (Helmens, 2004).
Two radiocarbon dates provide minimum ages for the retreatof glaciers from morainic complex 3, i.e. 15 510� 19014C yr BP (site Colorado 5 in Helmens et al., 1997) and14 660� 280 14C yr BP (Boca Grande 3; Helmens, 1988)obtained from basal lake sediments enclosed by the moraines.Minimum ages for complex 2 of 19 190� 120 and18 130� 170 14C yr BP, obtained from organic-rich sedimentsfound overlying glacio-fluvial gravel directly behind the mor-aines of complex 2 (Pena Negra 6; Helmens, 1988), are inaccordance with a radiocarbon date of 19 370� 230 14C yr BPfor a Palaeosol found on top of the complex (section 9; Khobzi,pers. comm., in Helmens, 1988). The maximum age for morai-nic complex 2 probably is not older than 23.5 ka (Helmens andKuhry, 1995). This age corresponds to a period of widespreadformation of organic-rich soils in the Bogota area; the period isnot represented in the dated Palaeosol sequence covering themorainic complex, nor is it expressed in the sediment sequencebehind the moraines.
Independent chronologies for the glacial and palynologicalrecords of the eastern Cordillera suggest a close match betweenstadials characterised by low upper Andean forest limits andglacier advances in the surrounding high-mountain ranges(Helmens and Kuhry, 1995). A pollen record obtained from aseries of lake sediments collected from an ecologically sensi-tive location on the western slopes of the eastern Cordillerahas revealed that cold glacial conditions did not persistthroughout the LGM (ca. 21–14 ka), but instead were inter-rupted by a distinct interval of climate warming around ca.18 ka (Helmens et al., 1996). The La Laguna pollen record indi-cates a lowering of the forest limit by 1100 to 900 m beneath itspresent altitude at ca. 3300 m a.s.l. (mean annual 9 �C iso-therm) for the stadial intervals directly preceding and followingthe 18 ka interval, implying a drop in mean annual tempera-tures of 8 to 6 �C using a modern thermal lapse rate of0.66 �C per 100 m (van der Hammen and Gonzalez, 1963;Kuhry, 1988). Glaciers advanced down-valley during the sta-dial periods to altitudes of ca. 3350 (morainic complex 2) to3500 m a.s.l. (complex 3), reflecting a lowering of the ice-frontby ca. 1200 to 1100 m respectively, compared to presentvalues. Between 19.5 and 17 ka, the ice front retreated, exten-sive soil formation took place, and the upper Andean forestlimit shifted to altitudes similar to that of the La Laguna site(2900 m). At the same time temperatures rose considerably tovalues only 3 to 4 �C lower than those in the present intergla-cial period. The interval between 19.5 and 17 ka has beendefined as the La Laguna Interstadial (Helmens et al., 1996).
Following Kuhry (1988), the preceding stadial period (21 to19.5 ka) and the following stadial period (17 to 14 ka) aretermed the Early Fuquene Stadial and the Late Fuquene Stadial,respectively.
Methods
Given the high-quality geomorphologic mapping of moraines(Helmens, 1988), and data on the valley topography, we wereable to estimate ELAs for individual palaeoglaciers in theregion using the area–altitude balance ratio (AABR) method(Osmaston, 2005). This method is considered more rigorousbecause it accommodates divergences from the standard gla-cier shape and also accounts for non-linear mass balancegradients (Kaser and Osmaston, 2002). Rather than dependingon the simple altitude ratio between head wall and terminus(i.e. toe-to-headwall-altitude ratio, or THAR), or meanmorphological ratio of accumulation and ablation areas (i.e.accumulation area ratio, or AAR), the AABR method makesuse of the palaeoglacier hypsometry and weights the area ofsurface altitude contour bands by relative altitude above orbelow the ELA.
To begin, palaeoglacier forms and ice surfaces were recon-structed using digital elevation data in a geographical informa-tion system (ArcGISTM). We digitised the original field maps ofglacial moraines for moraine complex 2 (early stade of LGM)made by Helmens (1988), drawn on national 1:25 000 and1:50 000 topographic maps of the IGAC with 25 to 50 m con-tour intervals. These base maps were geo-referenced and pro-jected to the WGS-84 datum, to be compatible with available3-arcsecond (90 m) Shuttle Radar Topographic Mission (SRTM)digital elevation data. The 100 m contours were both hand-digitised from the base maps and generated from the SRTMdata using ArcGIS. Based on the digitised moraine positionsfrom the field maps overlaid on the contour map, the extentand ice surface elevation were reconstructed digitally for 23palaeoglaciers according to conventional considerations (e.g.Sissons, 1974; Seltzer, 1992). The hypsometry, or vertical dis-tribution of surface area, of each palaeoglacier was computedfor 100 m elevation bands and used in the AABR calculation.
We utilised the iterative routine outlined by Osmaston(2005) to compute palaeo-ELAs with the AABR method for dif-ferent balance ratios (BRs). The balance ratio is the ratio of massbalance gradients below and above the ELA. For BR¼ 1, thereis a linear gradient of mass balance assumed throughout theglacier, a condition that is not often observed on modern tropi-cal glaciers. Tropical mass balance curves vary in detail, but ingeneral display steeper gradients below the ELA than above it,resulting in BR> 1 (Kaser and Osmaston, 2002). When themass balance gradient below the ELA is two times greater thanthat above the ELA, the BR¼ 2 and the ELA is shifted lower thanin the linear case with BR¼ 1. In this study, we considered BRsover a range of values considered for tropical glaciers in otherpublications: BR¼ 1–7, and BR¼ 25 (following: Lachniet andVazquez-Selem, 2005).
To explore the nature of intra-regional ELA variability, weconsidered different groupings of glaciers and computed bothmean ELA and standard deviation for the range of BRs. Initially,the glaciers were all considered together in one group. Then,the glaciers were classified a priori into three groups by theirregional location (by paramo), which is assumed to have afirst-order control over precipitation. The BR selected to com-pute the palaeo-ELA for each group was the one that minimisedthe variation of ELA (standard deviation, or SD) within the
792 JOURNAL OF QUATERNARY SCIENCE
Copyright � 2005 John Wiley & Sons, Ltd. J. Quaternary Sci., Vol. 20(7–8) 789–800 (2005)

respective groups (following Osmaston (2005)). We computed�ELA as the change in ELA from LGM to modern(�ELA¼ ELAmod� ELALGM), using a modern ELA of 4800 mfor all palaeoglacier localities as a conservative estimate basedon the published observations. This necessarily introduces asmall error for the valley-specific �ELA since there is likelyto be a gradient in modern ELA as a result of the precipitationgradient. The position of the modern ELA in the ColombianAndes corresponds closely to the 0 �C annual isotherm (Kuhn,1981). Despite considerable differences in topographic setting,from flat- to steep-topped volcanoes in the central Cordilleraand to an alpine topography in the eastern Cordillera, presentglacier extent on these mountains is very similar, with differ-
ences in precipitation amounting to only a few hundred metresof variation in present ELA (Hoyos-Patino, 1998).
Results
Palaeoglacier ELA reconstructions
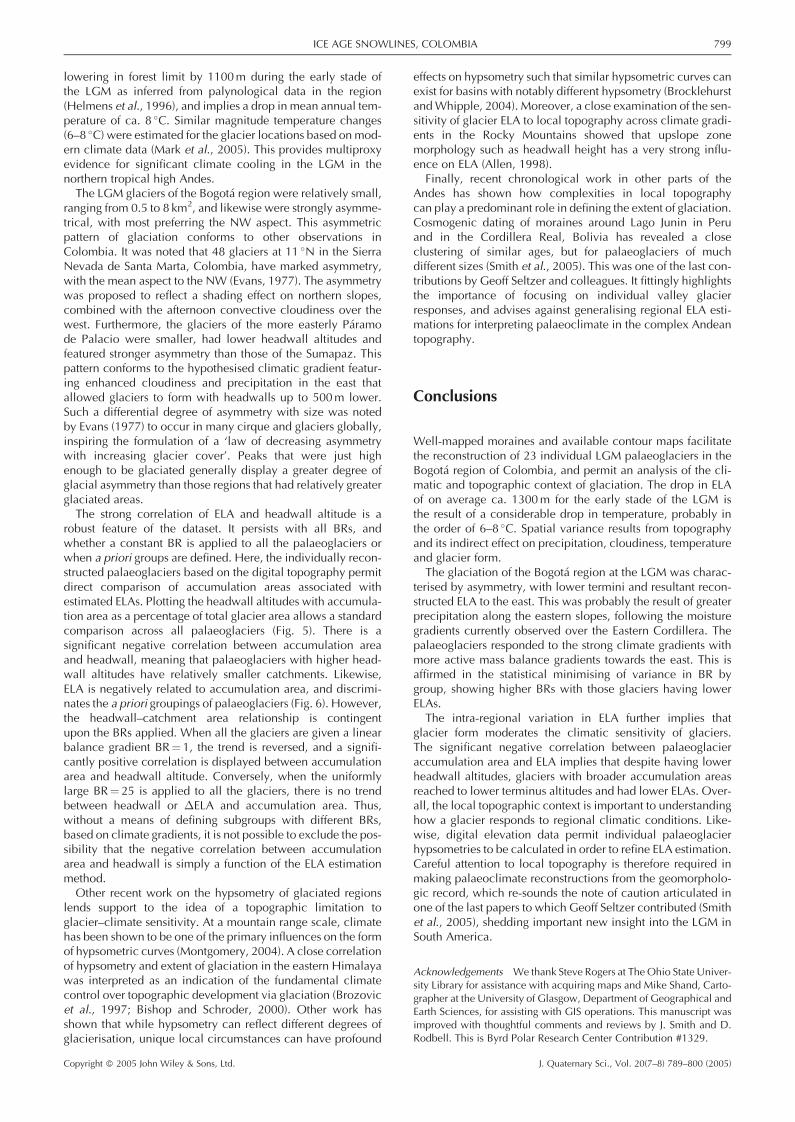
Twenty-three individual palaeoglaciers were reconstructed onthe basis of the geomorphologic field data gathered andmapped for moraine complex 2 (early stade of LGM) in the highplain of Bogota region (Fig. 2). The mapped palaeoglaciers are
Figure 2 Contour maps showing palaeoglacier surface reconstructions for moraine complex 2 (LGM) glaciers numbered in Table 1. Palaeoglaciercontour interval is 50 m, and background map contour interval is 100 m
ICE AGE SNOWLINES, COLOMBIA 793
Copyright � 2005 John Wiley & Sons, Ltd. J. Quaternary Sci., Vol. 20(7–8) 789–800 (2005)
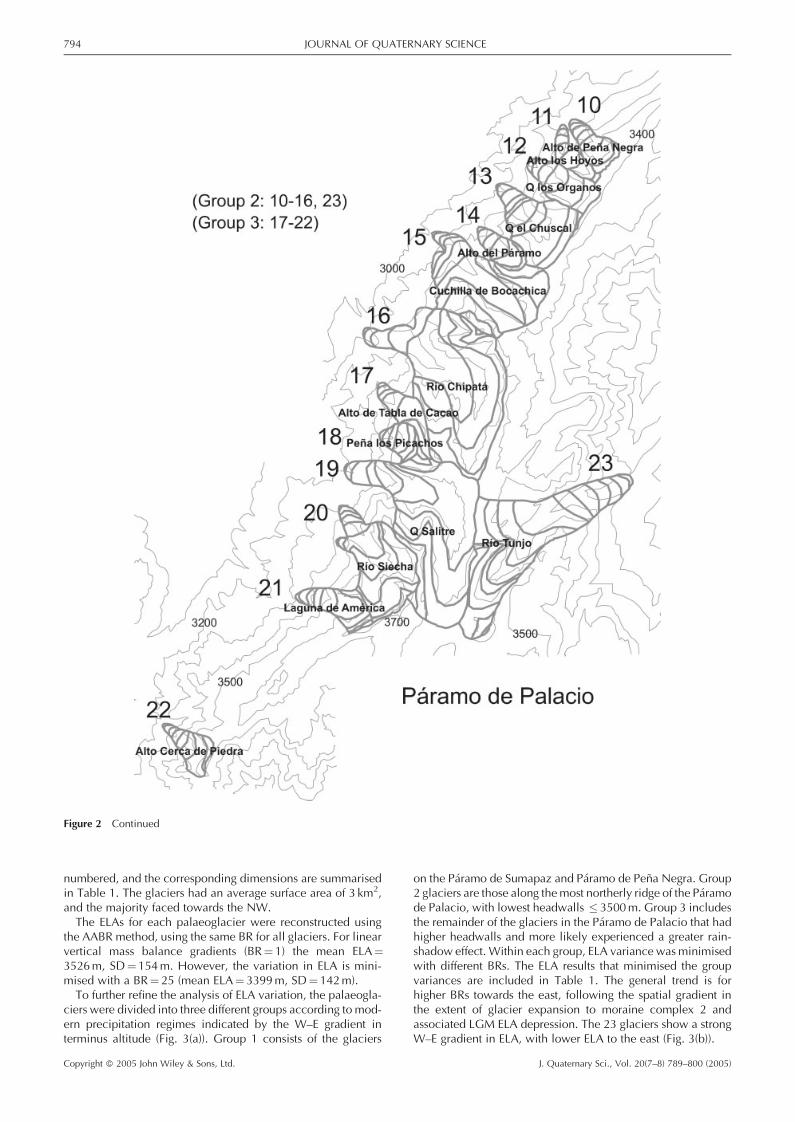
numbered, and the corresponding dimensions are summarisedin Table 1. The glaciers had an average surface area of 3 km2,and the majority faced towards the NW.
The ELAs for each palaeoglacier were reconstructed usingthe AABR method, using the same BR for all glaciers. For linearvertical mass balance gradients (BR¼ 1) the mean ELA¼3526 m, SD¼ 154 m. However, the variation in ELA is mini-mised with a BR¼ 25 (mean ELA¼ 3399 m, SD¼ 142 m).
To further refine the analysis of ELA variation, the palaeogla-ciers were divided into three different groups according to mod-ern precipitation regimes indicated by the W–E gradient interminus altitude (Fig. 3(a)). Group 1 consists of the glaciers
on the Paramo de Sumapaz and Paramo de Pena Negra. Group2 glaciers are those along the most northerly ridge of the Paramode Palacio, with lowest headwalls � 3500 m. Group 3 includesthe remainder of the glaciers in the Paramo de Palacio that hadhigher headwalls and more likely experienced a greater rain-shadow effect. Within each group, ELA variance was minimisedwith different BRs. The ELA results that minimised the groupvariances are included in Table 1. The general trend is forhigher BRs towards the east, following the spatial gradient inthe extent of glacier expansion to moraine complex 2 andassociated LGM ELA depression. The 23 glaciers show a strongW–E gradient in ELA, with lower ELA to the east (Fig. 3(b)).
Figure 2 Continued
794 JOURNAL OF QUATERNARY SCIENCE
Copyright � 2005 John Wiley & Sons, Ltd. J. Quaternary Sci., Vol. 20(7–8) 789–800 (2005)

Tab
le1
LGM
pal
aeogl
acie
rdat
afo
rth
eSa
ban
ade
Bogo
tare
gion
LGM
pal
aeogl
acie
rnam
eM
apno.
Par
amo
Long.
Lat.
Asp
ect
Gro
up
Hig
hes
tsu
mm
itH
eadw
all
Ter
min
us
LGM
ELA
BR
�EL
ATota
lA
bla
tion
alti
tude
(m)
alti
tude
(m)
alti
tude
(m)
estim
ate
(m)
area
(km
)(%
)
Lagu
na
de
Colo
rado
1Su
map
az�
74.2
34.3
8W
13829
3850
3350
3671
11129
3.7
50.3
7M
edia
Nar
anja
2Su
map
az�
74.2
54.2
1N
W1
3990
3925
3275
3743
11057
5.6
40.3
2R
ıoC
hic
asa
3Su
map
az�
74.2
24.2
8N
13990
3975
3450
3765
11035
7.9
30.5
2B
oca
Gra
nde
4Su
map
az�
74.1
44.3
0N
NW
13900
3850
3400
3711
11089
6.5
60.3
Q.
Bla
nca
5Su
map
az�
74.1
34.3
2N
W1
3900
3850
3325
3699
11101
3.4
40.3
4Q
.Se
ca6
Sum
apaz
�74.1
34.3
3N
W1
3900
3850
3400
3696
11104
2.3
0.4
5Q
.Lo
sSa
litr
es7
Sum
apaz
�74.1
24.3
3N
W1
3900
3825
3475
3703
11097
2.6
10.4
Q.
Pie
dra
gord
a8
Sum
apaz
�74.1
14.3
5N
W1
3900
3700
3225
3593
11207
3.2
10.5
4C
arra
sposo
9Pen
aN
egra
�74.1
05.0
7SW
13750
3725
3375
3596
11204
0.9
40.4
1A
lto
de
Pen
aN
egra
10
Pal
acio
�73.8
04.8
7N
W2
3500
3450
3150
3306
71494
0.7
60.1
8A
lto
los
Hoyo
s11
Pal
acio
�73.8
04.8
6N
NW
23500
3450
3150
3295
71505
0.5
80.1
9Q
.de
los
Org
anos
12
Pal
acio
�73.8
04.8
5N
W2
3500
3450
3150
3323
71477
1.2
0.1
6Q
.el
Chusc
al13
Pal
acio
�73.8
14.8
4N
W2
3500
3450
3075
3279
71521
2.2
30.1
3A
lto
del
Par
amo
14
Pal
acio
�73.8
24.8
4N
W2
3450
3425
3150
3275
71525
0.6
80.2
Cuch
illa
de
Boca
chic
a15
Pal
acio
�73.8
24.8
3N
W2
3500
3450
3025
3247
71553
4.1
70.1
6R
ıoC
hip
ata
16
Pal
acio
�73.8
34.8
1N
NE
23500
3500
3050
3267
71533
7.2
50.1
8R
ıoTunjo
23
Pal
acio
�73.8
24.7
8N
E2
3725
3700
3000
3282
71518
5.6
80.1
7A
lto
de
laTab
lade
Cac
ao17
Pal
acio
�73.8
44.8
1N
W3
3650
3600
3275
3429
51371
0.8
60.1
5Pen
alo
sPic
achos
18
Pal
acio
�73.8
44.8
0W
NW
33650
3600
3350
3475
51325
0.5
60.2
Q.
Salitr
e19
Pal
acio
�73.8
34.7
8N
NE
33700
3700
3175
3439
51361
6.7
30.1
7R
ıoSi
echa
20
Pal
acio
�73.8
54.7
8N
W3
3775
3750
3275
3529
51271
2.9
50.2
2La
guna
de
Am
eric
a21
Pal
acio
�73.8
54.7
7W
NW
33775
3750
3300
3492
51308
1.0
50.2
Alt
oC
erca
de
Pie
dra
22
Pal
acio
�73.8
84.7
3N
W3
3650
3600
3225
3415
51385
0.7
50.1
9
ICE AGE SNOWLINES, COLOMBIA 795
Copyright � 2005 John Wiley & Sons, Ltd. J. Quaternary Sci., Vol. 20(7–8) 789–800 (2005)

Intra-regional variability of ELA
There is a considerable amount of intra-regional variance inthe ELA, with values ranging over 500 m from a minimum of3247 m to a maximum of 3765 m. Most of the variance inELA (87%) can be explained by the altitude of the headwall(Fig. 4). There is a significant correlation (P< 0.0001), such
that higher headwall altitudes are associated with higherELAs. To explore the relationship between ELA and catchmentarea, the relative accumulation area for the palaeoglaciers wascomputed at the ELA from the hypsometric curve. Accumula-tion area displays a significant negative correlation(P< 0.0001) with both headwall altitude (Fig. 5) and ELA(Fig. 6).
2900
3000
3100
3200
3300
3400
3500
-74.30 -74.20 -74.10 -74.00 -73.90 -73.80 -73.70
longitude
term
inu
s (m
)
Group 1
Group 2
Group 3
(b)
(a)
3200
3300
3400
3500
3600
3700
3800
-74.30 -74.20 -74.10 -74.00 -73.90 -73.80 -73.70
longitude
EL
A (
m)
Group 1
Group 2
Group 3
Figure 3 (a) Moraine terminus altitude (m) plotted by longitude for all LGM palaeoglaciers, separated by group. (b) Reconstructed ELA (m) as esti-mated using the AABR method with BR as listed in Table 1, plotted by longitude for all LGM palaeoglaciers
796 JOURNAL OF QUATERNARY SCIENCE
Copyright � 2005 John Wiley & Sons, Ltd. J. Quaternary Sci., Vol. 20(7–8) 789–800 (2005)

Discussion
There are many methods to estimate the ELA of a palaeoglacier,and these have been more thoroughly reviewed elsewhere (i.e.Porter, 2001). The AABR has been noted to be a much morerigorous and precise method of estimating palaeo-ELAs than
simple ratio methods such as AAR and THAR (Kaser andOsmaston, 2002). By incorporating the full glacier hypsometry,the AABR method accounts for the area distribution of glaciermass relative to the ELA. The premise is that glacier areasfurther above or below the ELA should have greater influenceon the overall mass balance. This allows non-standard glaciershapes to be accommodated (i.e. Furbish and Andrews, 1984),
R2 = 0.87
3200
3300
3400
3500
3600
3700
3800
3900
3300 3400 3500 3600 3700 3800 3900 4000 4100
headwall (m)
EL
A (
m)
Group 1
Group 2
Group 3
Figure 4 Relationship between headwall altitude (m) and �ELA (m) for all the LGM palaeoglaciers, coded by group
R2 = 0.51
0
0.1
0.2
0.3
0.4
0.5
0.6
0.7
0.8
0.9
1
3300 3400 3500 3600 3700 3800 3900 4000 4100
headwall (m)
accu
m (
%)
Group 1
Group 2
Group 3
Figure 5 Relationship between headwall altitude (m) and accumulation area (% glacier area) for all the LGM palaeoglaciers, coded by group
ICE AGE SNOWLINES, COLOMBIA 797
Copyright � 2005 John Wiley & Sons, Ltd. J. Quaternary Sci., Vol. 20(7–8) 789–800 (2005)

as well as non-linear vertical mass balance gradients. Simplemean morphological altitude ratios of accumulation and abla-tion areas treat all areas above and below the ELA equally, asimplification that does not account for the vertical mass bal-ance variation inherent to tropical glaciers (Kaser and Osmaston,2002). Moreover, the parameters adopted with THAR or AARmethods usually involve assuming a standard alpine glacierform. Tropical glaciers show a stronger vertical mass balancegradient than those in mid-high latitudes (i.e. Kaser, 2001),and both the topography and geomorphologic field evidencesuggests that glaciers in the Bogota region took on non-standard forms. The glaciers are best described as poorlydeveloped valley glaciers or ice caps, rather than distinctU-shaped valley forms.
Selecting the appropriate BR to apply the AABR methodrequires making assumptions about the palaeoglacier equili-brium mass balance regime for the relevant moraine position.Where no present-day glaciers with mass balance data exist inthe same or similar climate, this requires making an implicitinference about the former climate and glacier response. How-ever, local topography and glacier form strongly moderate theclimatic sensitivity of glaciers and effectively require each gla-cier to have a unique BR. Moreover, local topo-climatic condi-tions of low-latitude glaciers present particular challenges forreconstructing and interpreting former ELAs (Benn et al.,2005). Since precise former climatic environmental informa-tion is not available, an effective means of selecting BR is basedon the principle that homogeneous groups of glaciers willrespond to climate in a similar manner. Thus minimising thestatistical variance in ELA estimate for each group provides aself-validating means of assigning BR (Osmaston, 2005). In thiscase, the a priori grouping of palaeoglaciers was affirmed byevidence of precipitation gradients and palaeoglacier form.
The groups of palaeoglaciers defined in this analysis for mor-ainic complex 2 imply that precipitation gradients stronglyinfluenced intra-regional ELA response in a similar manner asseen in the better-preserved moraine complex 3. Glaciers on,and in close proximity to, the easternmost flank of the regionwere under the influence of moist Llanos winds, and accumu-
lated more mass that subsequently flowed further downslope.The distribution of the most complete moraine complex 3was used in Helmens (1988) to show that limits of former gla-cier systems were strongly influenced by local climatologicalconditions (Helmens, 1988). It appears that glaciers reachedfarther down-valley in areas with high orographic precipita-tion, most significantly on the wet, eastern slopes of theCordillera, where morainic complex 3 was found at the lowaltitude of 3100 m. In the rainshadow created by largetopographic barriers, complex 3 occurs at altitudes as highas 3750 m. Moraine complex 2 terminated as low as 3000 mon the east-facing slope of the Paramo de Palacio along the‘Llanos slope’ (palaeoglacier 23), and as high as 3475 m onthe northwest-facing, inter-montane slopes of the Palacio deSumapaz (palaeoglacier 7).
The BRs greater than unity for Groups 2 and 3 also substanti-ate the strong climate gradients over the region. This signifiesthat the palaeoglaciers experienced steeper mass balancegradients in the ablation zones, a form that typifies tropicalglaciers (Kaser, 2001). The increased ablation on tropicalglacier tongues results in a theoretical increase in theequilibrium accumulation area ratio (AAR) for tropical glaciersto a value on the order of 0.82 (Kaser and Osmaston, 2002,section 5.4). This is seen in the smaller ablation areas ofgroups 2 and 3.
The glacial geomorphology indicates that the palaeoglaciersattained forms that would accommodate broad accumulationareas. Glaciers were flat, and not formed in distinct U-shapedvalleys. In several locations, glaciers overtopped adjacent val-ley walls and spread out laterally on surrounding slopes, andmost likely coalesced into an ice cap form. Likewise, themorphology featured broader accumulation areas, with morearea in the vertical distance from ELA to headwall than fromELA to terminus.
Evidence of predominant regional gradients notwithstand-ing, the overall average lowering in ELA from LGM to moderncalculated at ca. 1300 m can only be explained by a consider-able lowering in temperature. Our calculated average loweringin ELA for the Bogota glaciers is of similar magnitude to the
R2 = 0.66
0
0.1
0.2
0.3
0.4
0.5
0.6
0.7
0.8
0.9
1
3200 3300 3400 3500 3600 3700 3800
ELA (m)
accu
m (
%)
Group 1
Group 2
Group 3
Figure 6 Relationship between �ELA (m) and accumulation area (% glacier area) for all the LGM palaeoglaciers, coded by group
798 JOURNAL OF QUATERNARY SCIENCE
Copyright � 2005 John Wiley & Sons, Ltd. J. Quaternary Sci., Vol. 20(7–8) 789–800 (2005)
lowering in forest limit by 1100 m during the early stade ofthe LGM as inferred from palynological data in the region(Helmens et al., 1996), and implies a drop in mean annual tem-perature of ca. 8 �C. Similar magnitude temperature changes(6–8 �C) were estimated for the glacier locations based on mod-ern climate data (Mark et al., 2005). This provides multiproxyevidence for significant climate cooling in the LGM in thenorthern tropical high Andes.
The LGM glaciers of the Bogota region were relatively small,ranging from 0.5 to 8 km2, and likewise were strongly asymme-trical, with most preferring the NW aspect. This asymmetricpattern of glaciation conforms to other observations inColombia. It was noted that 48 glaciers at 11 �N in the SierraNevada de Santa Marta, Colombia, have marked asymmetry,with the mean aspect to the NW (Evans, 1977). The asymmetrywas proposed to reflect a shading effect on northern slopes,combined with the afternoon convective cloudiness over thewest. Furthermore, the glaciers of the more easterly Paramode Palacio were smaller, had lower headwall altitudes andfeatured stronger asymmetry than those of the Sumapaz. Thispattern conforms to the hypothesised climatic gradient featur-ing enhanced cloudiness and precipitation in the east thatallowed glaciers to form with headwalls up to 500 m lower.Such a differential degree of asymmetry with size was notedby Evans (1977) to occur in many cirque and glaciers globally,inspiring the formulation of a ‘law of decreasing asymmetrywith increasing glacier cover’. Peaks that were just highenough to be glaciated generally display a greater degree ofglacial asymmetry than those regions that had relatively greaterglaciated areas.
The strong correlation of ELA and headwall altitude is arobust feature of the dataset. It persists with all BRs, andwhether a constant BR is applied to all the palaeoglaciers orwhen a priori groups are defined. Here, the individually recon-structed palaeoglaciers based on the digital topography permitdirect comparison of accumulation areas associated withestimated ELAs. Plotting the headwall altitudes with accumula-tion area as a percentage of total glacier area allows a standardcomparison across all palaeoglaciers (Fig. 5). There is asignificant negative correlation between accumulation areaand headwall, meaning that palaeoglaciers with higher head-wall altitudes have relatively smaller catchments. Likewise,ELA is negatively related to accumulation area, and discrimi-nates the a priori groupings of palaeoglaciers (Fig. 6). However,the headwall–catchment area relationship is contingentupon the BRs applied. When all the glaciers are given a linearbalance gradient BR¼ 1, the trend is reversed, and a signifi-cantly positive correlation is displayed between accumulationarea and headwall altitude. Conversely, when the uniformlylarge BR¼ 25 is applied to all the glaciers, there is no trendbetween headwall or �ELA and accumulation area. Thus,without a means of defining subgroups with different BRs,based on climate gradients, it is not possible to exclude the pos-sibility that the negative correlation between accumulationarea and headwall is simply a function of the ELA estimationmethod.
Other recent work on the hypsometry of glaciated regionslends support to the idea of a topographic limitation toglacier–climate sensitivity. At a mountain range scale, climatehas been shown to be one of the primary influences on the formof hypsometric curves (Montgomery, 2004). A close correlationof hypsometry and extent of glaciation in the eastern Himalayawas interpreted as an indication of the fundamental climatecontrol over topographic development via glaciation (Brozovicet al., 1997; Bishop and Schroder, 2000). Other work hasshown that while hypsometry can reflect different degrees ofglacierisation, unique local circumstances can have profound
effects on hypsometry such that similar hypsometric curves canexist for basins with notably different hypsometry (Brocklehurstand Whipple, 2004). Moreover, a close examination of the sen-sitivity of glacier ELA to local topography across climate gradi-ents in the Rocky Mountains showed that upslope zonemorphology such as headwall height has a very strong influ-ence on ELA (Allen, 1998).
Finally, recent chronological work in other parts of theAndes has shown how complexities in local topographycan play a predominant role in defining the extent of glaciation.Cosmogenic dating of moraines around Lago Junin in Peruand in the Cordillera Real, Bolivia has revealed a closeclustering of similar ages, but for palaeoglaciers of muchdifferent sizes (Smith et al., 2005). This was one of the last con-tributions by Geoff Seltzer and colleagues. It fittingly highlightsthe importance of focusing on individual valley glacierresponses, and advises against generalising regional ELA esti-mations for interpreting palaeoclimate in the complex Andeantopography.
Conclusions
Well-mapped moraines and available contour maps facilitatethe reconstruction of 23 individual LGM palaeoglaciers in theBogota region of Colombia, and permit an analysis of the cli-matic and topographic context of glaciation. The drop in ELAof on average ca. 1300 m for the early stade of the LGM isthe result of a considerable drop in temperature, probably inthe order of 6–8 �C. Spatial variance results from topographyand its indirect effect on precipitation, cloudiness, temperatureand glacier form.
The glaciation of the Bogota region at the LGM was charac-terised by asymmetry, with lower termini and resultant recon-structed ELA to the east. This was probably the result of greaterprecipitation along the eastern slopes, following the moisturegradients currently observed over the Eastern Cordillera. Thepalaeoglaciers responded to the strong climate gradients withmore active mass balance gradients towards the east. This isaffirmed in the statistical minimising of variance in BR bygroup, showing higher BRs with those glaciers having lowerELAs.
The intra-regional variation in ELA further implies thatglacier form moderates the climatic sensitivity of glaciers.The significant negative correlation between palaeoglacieraccumulation area and ELA implies that despite having lowerheadwall altitudes, glaciers with broader accumulation areasreached to lower terminus altitudes and had lower ELAs. Over-all, the local topographic context is important to understandinghow a glacier responds to regional climatic conditions. Like-wise, digital elevation data permit individual palaeoglacierhypsometries to be calculated in order to refine ELA estimation.Careful attention to local topography is therefore required inmaking palaeoclimate reconstructions from the geomorpholo-gic record, which re-sounds the note of caution articulated inone of the last papers to which Geoff Seltzer contributed (Smithet al., 2005), shedding important new insight into the LGM inSouth America.
Acknowledgements We thank Steve Rogers at The Ohio State Univer-sity Library for assistance with acquiring maps and Mike Shand, Carto-grapher at the University of Glasgow, Department of Geographical andEarth Sciences, for assisting with GIS operations. This manuscript wasimproved with thoughtful comments and reviews by J. Smith and D.Rodbell. This is Byrd Polar Research Center Contribution #1329.
ICE AGE SNOWLINES, COLOMBIA 799
Copyright � 2005 John Wiley & Sons, Ltd. J. Quaternary Sci., Vol. 20(7–8) 789–800 (2005)

References
Allen TR. 1998. Topographic context of glaciers and perennialsnowfields, Glacier National Park, Montana. Geomorphology 21:207–216.
Benn DI, Owen LA, Osmaston HA, Seltzer GO, Porter SC,Mark BG. 2005. Reconstruction of equilibrium-line altitudes for tro-pical and sub-tropical glaciers. Quaternary International 138–139:8–21.
Bishop MP, Schroder JF. 2000. Remote sensing and geomorphometricassessment of topographic complexity and erosion dynamics in theNanga Parbat massif. In Tectonics of the Nanga Parbat Syntaxis andthe Western Himalaya, Khan MA, Treloar PJ, Searle MP, Jan MQ(eds). Special Publication no. 170, Geological Society: London;181–200.
Brocklehurst SH, Whipple KX. 2004. Hypsometry of glaciated land-scapes. Earth Surface Processes and Landforms 29: 907–926.
Brozovic N, Burbank DW, Meigs AJ. 1997. Climatic limits on land-scape development in the northwestern Himalaya. Science 276:571–574.
Clapperton CM. 2000. Interhemispheric synchroneity of marineoxygen isotope stage 2 glacier fluctuations along the Americancordilleras transect. Journal of Quaternary Science 15: 435–468.
Evans IS. 1977. World-wide variations in the direction and concentra-tion of cirque and glacier aspects. Geografiska Annaler A 59: 151–175.
Furbish DJ, Andrews JT. 1984. The use of hypsometry to indicate long-term stability and response of valley glaciers to changes in masstransfer. Journal of Glaciology 30: 199–211.
Helmens KF. 1988. Late Pleistocene glacial sequence in the area of theHigh Plain of Bogota (Eastern Cordillera Colombia). Palaeogeogra-phy, Palaeoclimatology, Palaeoecology 67: 263–283.
Helmens KF. 1990. Neogene–Quaternary Geology of the High Plain ofBogota, Eastern Cordillera, Colombia (Stratigraphy, Paleoenviron-ments and Landscape Evolution). Dissertationes Botanicae 163.J. Cramer: Berlin.
Helmens KF. 2004. The Quaternary glacial record of the ColombianAndes. In Quaternary Glaciations—Extent and Chronology, EhlersJ, Gibbard PL (eds). Elsevier: Amsterdam; 115–134.
Helmens KF, Kuhry P. 1995. Glacier fluctuations and vegetationchange associated with Late Quaternary climatic oscillations in theAndes near Bogota, Colombia. Quaternary of South America andAntarctic Peninsula 9: 117–140.
Helmens KF, Kuhry P, Rutter NW, vanderBorg K, deJong AFM. 1996.Warming at 18,000 yr BP in the tropical Andes. Quaternary Research45: 289–299.
Helmens KF, Rutter NW, Kuhry P. 1997. Glacier fluctuations in theEastern Andes of Colombia (South America) during the last 45,000radiocarbon years. Quaternary International 38–9: 39–48.
Hoyos-Patino F. 1998. Glaciers of South America–Glaciers ofColombia. In Satellite Image Atlas of Glaciers of the World, WilliamsJ, Ferringo J (eds). Professional Paper 1386-I, US Geological Society:Denver, CO; 11–30.
Kaser G. 2001. Glacier–climate interaction at low latitudes. Journal ofGlaciology 47: 195–204.
Kaser G, Osmaston HA. 2002. Tropical Glaciers. International Hydrol-ogy Series, Cambridge University Press: Cambridge.
Kerr A. 1993. Topography, Climate and Ice Masses—a Review. TerraNova 5: 332–342.
Kuhn M. 1981. Vergletscherung, Nullgradgrenze, und Niederschlag inden Anden. In Jahresbericht des Sonnblick-Vereines fur de Jahre1978–1980. Springer Verlag: Vienna; 3–13.
Kuhry P. 1988. Palaeobotanical-palaeoecological studies of tropicalhigh Andean peatbog sections (Cordillera Oriental, Colombia). Dis-sertationes Botanicae 116. J. Cramer: Berlin.
Lachniet MS, Vazquez-Selem L. 2005. Last glacial maximum equili-brium line altitudes in the circum-Caribbean (Mexico, Guatemala,Costa Rica, Colombia, and Venezuela). Quaternary International138–139: 129–144.
Mark BG, Harrison SP, Spessa A, New M, Evans DJA, Helmens KF.2005. Tropical snowline changes at the last glacial maximum: a glo-bal assessment. Quaternary International 138–139: 168–201.
Mix AC, Bard E, Schneider R. 2001. Environmental processes of the iceage: land, oceans, glaciers (EPILOG). Quaternary Science Reviews20: 627–657.
Montgomery DR. 2004. GIS in tectonic geomorphology and landscapeevolution. In Geographic Information Science and MountainGeomorphology, Bishop MP, Schroder JF (eds). Springer-Praxis:Chichester, UK; 425–460.
Osmaston HA. 2005. Estimates of glacier equilibrium line altitudesby the Area�Altitude, the Area x Altitude Balance Ratio andthe Area�Altitude Balance Index methods and their validation.Quaternary International 138–139: 22–31.
Porter SC. 2001. Snowline depression in the tropics during the LastGlaciation. Quaternary Science Reviews 20: 1067–1091.
Poveda G, Jaramillo A, Gil MM, Quiceno N, Mantilla RI. 2001.Seasonality in ENSO-related precipitation, river discharges, soilmoisture, and vegetation index in Colombia. Water ResourcesResearch 37: 2169–2178.
Rull V. 1998. Palaeoecology of pleniglacial sediments from theVenezuelan Andes. Palynological record of El Caballo stadial,sedimentation rates and glacier retreat. Review of Palaeobotanyand Palynology 99: 95–114.
Salgado-Labouriau M. 1979. Modern pollen deposition in theVenezuelan Andes. Grana 18: 53–68.
Schubert C, Clapperton CM. 1990. Quaternary glaciations in theNorthern Andes (Venezuela, Colombia and Ecuador). QuaternaryScience Reviews 9: 123–135.
Seltzer GO. 1992. Late Quaternary glaciation of the Cordillera Real,Bolivia. Journal of Quaternary Science 7: 87–98.
Seltzer GO, Rodbell DT, Baker PA, Fritz SC, Tapia PM, Rowe HD,Dunbar RB. 2002. Early warming of tropical South America at theLast Glacial–interglacial transition. Science 296: 1685–1686.
Seltzer GO, Baker PA, Farrell JL, Fritz SC, Rodbell DT. 2003. Therecord of tropical glaciation from drill cores in Lake Titicaca, Peru/Bolivia. Abstracts with Programs—Geological Society of America35: 539.
Sissons JB. 1974. A late glacial ice-cap in the Grampians, Scotland.Transactions of the Institute of British Geographers 62: 95–114.
Smith JA, Seltzer GO, Farber DL, Rodbell DT, Finkel RC. 2005. Earlylocal last glacial maximum in the tropical Andes. Science 308:678–681.
van der Hammen T, Gonzalez E. 1963. Historia de clima y vegetaciondel Pleistoceno Superior y del Holoceno de la Sabana de Bogota.Boletın Geololgico (Ingeominas, Bogota) 11: 189–266.
van der Hammen T, Hooghiemstra H. 1995. The El Abra stadial, aYounger Dryas equivalent in Colombia. Quaternary ScienceReviews 14: 841–851.
van der Hammen T, Hooghiemstra H. 2003. Interglacial—glacialFuquene-3 pollen record from Colombia: an Eemian to Holoceneclimate record. Global and Planetary Change 36: 181–199.
van der Hammen T, Duenas H, Thouret JC. 1980. Guıa de excursion—Sabana de Bogota. In Primer Seminario sobre el Cuaternario deColombia, Bogota, Colombia, 22–29 August 1980. Centro Intera-mericano de Fotointepretacıon (CIAF) et al., Bogota.
800 JOURNAL OF QUATERNARY SCIENCE
Copyright � 2005 John Wiley & Sons, Ltd. J. Quaternary Sci., Vol. 20(7–8) 789–800 (2005)