reconstruction of threaded conversations in online discussion forums
TRANSCRIPT
Reconstruction of Threaded Conversationsin Online Discussion Forums
Erik Aumayr and Jeffrey Chan and Conor HayesDigital Enterprise Research Institute
NUI Galway, IrelandEmail: {erik.aumayr, jkc.chan, conor.hayes}@deri.org
Abstract
Online discussion boards, or Internet forums, are a significantpart of the Internet. People use Internet forums to post ques-tions, provide advice and participate in discussions. Theseonline conversations are represented as threads, and the con-versation trees within these threads are important in under-standing the behaviour of online users. Unfortunately, thereply structures of these threads are generally not publiclyaccessible or not maintained. Hence, in this paper, we in-troduce an efficient and simple approach to reconstruct thereply structure in threaded conversations. We contrast its ac-curacy against three baseline algorithms, and show that ouralgorithm can accurately recreate the in and out degree dis-tributions of forum reply graphs built from the reconstructedreply structures.
1 Introduction
Internet forums are an important part of the Web. Alongwith Twitter, web logs and wikis, they provide a platform forquestions to be asked and answered, information to be dis-seminated and public discussions on all types of topics. Ac-cording to Internet Brands1, 11% of Internet traffic in 2009consists of visits to online forums, showing forums are stillan integral part of the Web.
In forums, conversations are represented as sequences ofposts, or threads, where the posts reply to one or more earlierposts. For example, Figure 1 shows a thread from the pokerforum on www.boards.ie. It consists of a sequence of postsdiscussing how to become a Texas Hold’em poker dealer.Links exist between posts if one is the reply of another.
The threaded nature of forums allows us to follow the con-versations, and thus study interesting problems. For exam-ple, users can be profiled and analysed based on their reply-ing behaviour, which is extracted from the reply structureof forums. In (Chan, Daly, and Hayes 2010), users wereprofiled using this method, then grouped together into userroles of common behaviour. The roles were then used todecompose forums into percentage of users playing partic-ular roles. Another sample application is in topic and trendtracking (Allan 2002). By recovering the reply structure, wecan follow the actual conversation stream in threads, which
Copyright c© 2011, Association for the Advancement of ArtificialIntelligence (www.aaai.org). All rights reserved.
1http://www.internetbrands.com
might not be in the order the posts are posted. As it can beseen, the reply structure of threads have many applications.
There are many forums and many datasets of forums on-line. However, the reply structure of threads is not alwaysavailable. This can be due to the failure of the board systemto properly log them, it is not maintained by the providers, itis not publicly available or even lost. Therefore in this paper,we propose a new method to reconstruct the reply structureof posts in forums.
Prior work in reconstructing the thread structure is limited(Wang et al. 2008). They focus on either detecting ques-tion and answers in forums (Cong et al. 2008), which isonly one type of thread in online forums, or only use con-tent to reconstruct thread structure, which results in low ac-curacy (Wang et al. 2008). We propose a new approachto reconstructing thread structures. It uses a set of simplefeatures and a classifier (a decision tree) to reconstruct thereply structure of threads. We evaluate the accuracy of thealgorithm against the existing and a baseline algorithm us-ing traditional notions of precision and recall and the abilityof the algorithms to recreate the in and out degree distribu-tions of reply graphs built from the reconstructed replyingstructure. We also analyse how well the algorithms performin recreating the local in and out degrees and the clusteringcoefficient for individual vertices in the reply graphs.
In summary, the contributions of this work are:
• Proposal of a classification approach to reconstruct replybehaviours in threads, that uses content and non-contentfeatures.
• Show that the algorithm can accurately recreate the in andout degree distributions of the forum reply graphs that arecreated from the reconstructed reply structures.
• Show that the difference in accuracy of our algorithm anda baseline algorithm result in significant differences in thelocal degree and clustering coefficient values of the replyforum graphs.
The remainder of this paper is as follows. In Section 2we describe related work, then we explain our approach toreconstructing threaded conversations in Section 3. In thenext section, we present our evaluate and contrast the resultsof the different approaches. Finally, Section 5 concludes thispaper and presents possible future work.
26
Proceedings of the Fifth International AAAI Conference on Weblogs and Social Media

Figure 1: Example thread in the poker forum of Boards.ie.
2 Related Work
There is a number of related areas of work, including topicsummarisation and discourse disentanglement, question andanswer (Q & A) detection and ranking, and thread recon-struction. In this section, we will discuss each area in turn.
Much work has been done in summarising threaded con-versations (Zhou, Hovy, and Rey 2005) (Shen et al. 2006)(Elsner and Charniak 2010), particularly from the perspec-tive of topic detection and tracking (Allan 2002) and dis-course disentanglement. All of these works summarize theconversations by defining a similarity on posts, typicallycontent, and then clustering similar posts into segments ofconversations. An exception is in discourse disentangle-ment (Elsner and Charniak 2010) (Wang and Oard 2009),that uses similar features to our work and can be used indi-rectly to build the reply structures. Elsner and Charniak usedlogistic regression to group utterances in a chat room conver-sation to separate topics, while Wang and Oard probabilisti-cally expanded the messages by information about their con-text. However, their emphasis lies on grouping utterances,
not finding the explicit thread structure, hence their featuresare not directly applicable to our problem. Nevertheless, westill think it is appropriate to compare Elsner and Charniak’smethod to ours in section 4. In summary, all these works intopic detection and tracking and discourse disentanglementare successful in summarizing and detecting topic segments,but this is a different task from reply structure reconstruc-tion, as posts can be replies to each other but not related toeach other.
In question and answering, there are two streams of sim-ilar work: one is to find the best set of answers for a query,and the other is to identify question and answer pairs to builda querying system knowledge base. Xi et al. (Xi, Lind, andBrill 2004) associated posts that are most likely to answera user’s query. They used content, thread based, and authorbased features to train a linear regression and SVM classi-fier. In (Feng et al. 2006), Feng et al. aimed to discoverthe most relevant answer in question threads. They combinelexical similarity, speech acts and reputation of the author ofposts into a similarity measure, and use the HITS algorithmto find posts that are most likely to be answers to the initialquestion post. Similar to Feng et al., Hong et al. (Hongand Davison 2009) detected threads whose first posts arequestions and its corresponding answers in the thread. Todetect answers, they used features including the positions ofthe candidate answer posts, authorship (experts vs. newbies)and likelihood models based on content. Hong et al. testeddifferent combinations of these features with an SVM clas-sifier and found post position and authorship result in thehighest accuracies. Cong et al. (Cong et al. 2008) took amore general approach, where they allow questions to occuranywhere in a thread. Questions were found using a ruleclassifier that discovered which frequent sequential Part-of-speech patterns in sentences lead to questions. For answers,Cong et al. used language models to construct weighted sim-ilarity graphs between each question and the set of candidateanswers. For each detected question, a page-rank like prop-agation algorithm was utilised to determine and rank the setof candidate answers. In (Ding et al. 2008) and (Yang, Cao,and Lin 2009), the same set of authors extended their previ-ous work (Cong et al. 2008) to incorporate the idea of con-text sentences and posts that provide indirect links betweena question and answer pair. The authors used conditionalrandom fields and structural support vectors to learn the con-texts. In summary, much novel work has been conducted inquestion and answer detection, but the focus of this type ofwork is to detect a question and rank the candidate answers,while in the reply reconstruction task, we are trying to linkposts together, regardless whether they are question-answerpairs or not.
There are few works in the literature that directly addressthe problem of thread reply reconstruction. In (Yeh andHarnly 2006), Yeh and Harnly reconstructed reply chainsof emails, or email threads. They proposed two approaches,one based on using header meta-information, the other basedon timing, subject and content of the emails themselves. Thereconstruction heuristic consists of a number of thresholdtests on the features. The main difference is that this ap-proach is specific for emails, and the features and heuristic
27

cannot be easily extended for forum thread reconstruction.The work by Wang et al. (Wang et al. 2008) is most simi-lar to ours. In that work, the authors reconstructed the replystructure of threads using content similarity and three dif-ferent windowing schemes. The windowing schemes definedifferent temporal constraints placed on possible parent postcandidates. In their testing, very low precision and recallwere obtained for a small forum dataset. In our experiments,we will show that this approach also has low precision andrecall on our testing datasets.
3 Methodology
In this section we describe our approaches to reconstructingthe threaded conversations. We first define the information athread provides and the nature of replies in it, then introducethe classification features we extract from this informationand finally the classification methods.
3.1 Definitions
In order to recover the reply structure in a thread, we need tospecify what information we expect from it. Our goal is toapply our approach to as many forums as possible. There-fore we want to only rely on a few basic criteria. Most fo-rums provide the following information about a post:
• Creation date
• Name of author
• Quoted section of another post
• Content
• Thread length
Although some forums may save the id of a quoted post,most do not, instead they save the name of the quoted user.Therefore in our work, we only assume we know the nameof the quoted user and of course the quoted text section. Thelength of a thread simply states how many posts it consistsof. Note that the creation dates of posts establish a chrono-logical ordering. From that ordering we can compute thedistance of one post to another. For instance, in figure 1 post#3 has a distance of 2 to post #1 because there is one otherpost in between.
Next, we describe the nature of replies. In the currentforum user interfaces, a reply is initiated when a user hitsthe Reply-button of the post she wants to answer. The datawe used stores this type of reply interaction, i.e., each postcan only reply to one other posts. Although it is possible forpeople to reply to several posts at once, and it is possible forour approaches to return more than one reply candidate, inour evaluation we limit each post to one reply as this was thereplying structure of the training and testing dataset.
3.2 Baseline Approaches
In the dataset we used, we found most replies are located inclose reply distance to the post they are replying to. Mostof them (79.7%) follow immediately after the post they arereplying to. This implies that the post reply distance is likelyto be a strong feature and that we can construct a simplereconstruct method based on this fact.
Therefore, as a baseline approach, we link each post to itsimmediate predecessor. Any proposed algorithm should per-form better than this baseline. We will refer to this baselineapproach as the “1-Distance” linking algorithm.
Further, we implemented the approach from (Wang et al.2008) and investigated the logistic regression classifier from(Elsner and Charniak 2010). The authors of the latter worktrained the classifier with features similar to ours, like timedifference, content similarity and distance. However, theyused discourse based features like the likelihood of a postbeing an answer to a question post. When evaluating themethod of (Elsner and Charniak 2010), we did not applythese features as they are not relevant to the reply recon-struction problem.
3.3 Reply Reconstruction Features
When choosing the features for our classification approachwe carefully focus on features that are simple, easy to obtainand fast to compute. This enables a real-time reconstructionof the thread reply structures. The features we use are:• In section 3.2 we found that the reply distance might be a
strong feature. Because of the chronological order the dis-tance between two posts expresses how many other mes-sages had been posted in the time between.
• Similar to the distance the time difference between postscan express the message behaviour of users and thereforeis considered a useful feature. In figure 1 the time differ-ence between post #1 and post #2 is two days and 13.5hours whereas the time difference between post #4 andpost #5 is only 28 minutes.
• Only 20% of replies have quotes. But whenever a quoteoccurs in the content of a message, the user name and asection of the quoted message is given, see figure 1 in post#6. This provides a very accurate reply indication.
• The most complex feature we investigate is cosine simi-larity. Cosim calculates the angle between two vectors.In this case these two vectors are the contents of two mes-sages. Because a message content is typically a plaintext tf-idf (term frequency-inverse document frequency) isused to convert text into vectors with numerical elementswhich then can be computed by cosim. Before applyingtf-idf we pre-process the contents to get texts that are asgeneral as possible. To reduce the dimensions of the vec-tors we filter out stop words (inclusive the word “quote”since it marks a quotation) and words that appear onlyonce. In addition we stem the words by using the PorterStemmer (Porter 1980).
• When having the distance the thread length is an ad-ditional feature that, combined with the distance, couldwork as an indicator which limits the reply distance. Thelength of a thread is the number of posts it contains. Sincea classifier will not learn when a thread begins or ends, thelength categorizes threads which can help to improve thereply distance feature. Thread length will not work as afeature on its own.The computation of tf-idf and cosine similarity between
two messages is clearly the most costly operation we choose
28

to perform. We get the information about post distance andtime difference from the time stamp of posts and the lengthof a thread can easily be summed up.
We also considered author activity as a possible feature,and investigated whether there is viable information in thedifference between the amount of messages an author postsand receives. We found that users who post a lot of messagesalso receive a lot of messages simply by providing manyposts other users can reply to. Rather than finding popularityamong users and thus a higher probability to receive replies,the sending and receiving is linearly dependent and does nothold any information a classifier can make use of.
3.4 Classifiers
In this subsection, we describe the classifiers we use. Thereis a huge diversity of classifiers that can be used to pre-dict missing data. We focus on two widely used classifiers,namely Support Vector Machines (SVM) and the C4.5 De-cision Tree.
Support Vector Machines are commonly used for clas-sification and regression analysis. For example, recall Honget al. (Hong and Davison 2009) used them for detectingquestions and corresponding answers in Internet forums. AnSVM partitions the training data into two classes using a setof multi-dimensional hyperplanes. These hyperplanes sepa-rate the data into the two classes. The SVM then predicts theclass of new data points by deciding which side of the hyper-plane(s) the data points lie. We use the SVN implementationfor Weka (EL-Manzalawy and Honavar 2005).
Although Support Vector Machines can be very powerfulin terms of accuracy they are known to be very slow. There-fore we use C4.5 decision tree algorithm (Salzberg 1994)as a comparison. The decision trees’ big advantage is itsability to handle huge amounts of data very efficiently, dueto the relative simplicity of its model and training approach.It consists of a tree of branching decisions like “is the re-ply distance ≤ 5?”. If so, the tree evaluates further featuresand thresholds until it can decide which class a data pointbelongs to. An additional benefit is that the resulting tree iseasy to interpret by humans.
However, decision trees can overfit the training data bygrowing too large and hence, at times, not generalize well.To overcome this the decision tree must be restricted in sizeand number of resulting leaves. C4.5 provides backwardpruning to do so. We use C4.5’s Java implementation inWeka, called J48. In the next section, we will these twoclassifiers, with different combinations of the features.
4 Evaluation
In the following we present the results of our thread re-construction algorithm and compare them to the results ofthe baseline approaches. First, we provide details about thedataset we use for evaluation. We then describe the accuracymeasurements and compare the accuracy of using differentcombinations of the features and classifiers. Finally, weevaluate the 1-Distance approach against the decision treeapproach in recreating the in and out degree and clusteringcoefficient distributions.
4.1 Dataset
The dataset we use for training and evaluation is from the fo-rum Boards.ie. It is the largest Irish online discussion boardand the dataset covers ten years. The dataset has the re-plying structure of posts, which allows us to train and testour supervised approaches. We limit the data for our ex-periments to threads around the years 2006 and 2007 andwe further introduce a lower and upper boundary regardingthe number of posts a thread contains. The lower bound-ary of 3 posts filters out threads with only one or two posts,which are trivial to classify and cause a lot of bias regard-ing the post distance. 27.7% of the original threads haveone or two posts and are subsequently removed from thedataset. The restriction of 40 posts filters out very long, un-common threads which, if left in the dataset, would causemuch bias. Some of these threads have several thousandsof posts. An example is a sticky thread in which moderatorswelcome new members and explain forum rules. This actionreduces the dataset by another 5.1% to 120,100 threads, with≈ 827,900 posts. In our experiments we have noticed thatthe SVM takes a very long time to train on this amount ofdata. Therefore we further reduce the size of the considereddata by random sampling over the same period of time andfinally end up with 13,100 threads containing 133,200 mes-sages. The smaller dataset shows how well the classifierswork with limited data.
The next step towards classification is to extract both pos-itive and negative samples to train the classifiers. Our posi-tive instances are pairs of posts which are actually replying,i.e., the second post replies to the first. Negative samples arecreated in the following way: in each thread, we link eachpost to a random set of earlier posts that it is not actuallyreplying to. Using this method we generated an equally dis-tributed set of positive and negative samples for training andtesting, with 213,800 pairs of posts.
4.2 Evaluation Approach
In order to compare the different approaches we use the wellknown measurements precision, recall and F-score.
Precision =TP
TP + FP, Recall =
TP
TP + FN
TP, FP and FN stand for true positive, false positive and falsenegative respectively and express correct or incorrect classi-fied instances. The F-score is the harmonic mean betweenPrecision and Recall:
F -Score = 2 ∗ Precision ∗Recall
Precision+Recall
For training and testing of the classifiers and features, weuse the Weka toolkit (Waikato Environment for KnowledgeAnalysis, (Hall et al. 2009)) and applied 5 fold cross valida-tion to minimise bias.
4.3 Evaluation of the Existing and BaselineApproaches
In this subsection, we first present the results for the existingand baseline algorithms.
29
• (Wang et al. 2008): Evaluating this thread structure re-covering approach, we obtained a precision, recall and F-score of 0.444 on our dataset, which is slightly higher thanon their dataset.
• 1-Distance linking: We found in section 3.2 that 79.7%of the replies have a post distance of 1. Assuming a replydistance of 1 over all messages results in both a precisionand recall as well as F-score of 0.797.
• (Elsner and Charniak 2010): With the logistic regressionclassifier, we achieved an F-score of 0.875 (0.824 and0.932, precision and recall respectively).
We will contrast the C4.5 classifier with the best workingset of features against these three approaches at the end ofsection 4.5.
4.4 Evaluation of the Features
In this subsection we evaluate the usefulness of single fea-tures and combinations of features for reply structure recon-struction. The results for SVM (Table 2) and decision tree(Table 1) have similar trends for the attributes, hence welimit our discussion to the results of C4.5 here.
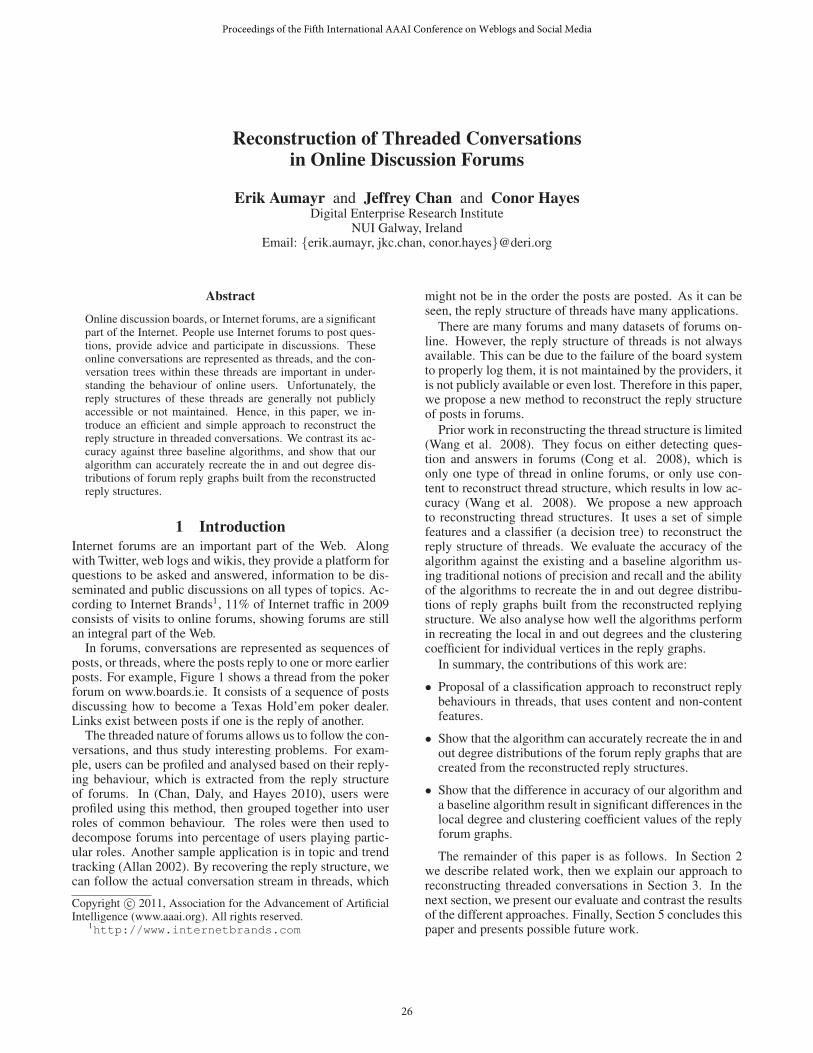
As Table 1 shows, the post distance is the best singlefeature. It achieves the highest recall (0.773) and F-score(0.848), whereas the quotes feature has the highest preci-sion of 0.981. However, the quoting feature has very lowrecall (0.235), due to the fact that only about 20% of postsin the training and testing data have quotes. Using the mostpromising single features, we constructed different combi-nations of two or more features. For two features, the bestperforming combination is distance + quotes with the high-est precision (0.943), recall (0.898) and accordingly F-score(0.92). This pair of features works best because it combinesthe high precision of the quotes feature with the high re-call of the post distance. We also added the thread length tothe distance to see whether the thread length categorizationhelps. The distance + length combination has increased re-call but decreased precision, however we will show that thethread length does not perform well in larger feature combi-nations. Again taking the best numbers together and form-ing triples of features we get the highest recall with distance+ time difference + quotes (0.942) and the highest preci-sion and F-score with distance + quotes + cosim (0.91 and0.925). The features post distance and quotes reappear inthese two triples, augmented by time difference (precision)and cosim (recall). Now combining all single features dis-tance + time difference + quotes + cosim the precision dropsa little from 0.942 to 0.939 but recall and F-score rises to0.915 and 0.927. As said earlier the thread length, which isnot a single feature, does not help the classifier much. Ta-ble 1 shows that thread length has very little impact on thefigures when using C4.5, i.e., there is almost no differencebetween the combination of the four single features and thesame combination with the thread length. Feeding the threadlength into the SVM classifier makes it even worse as shownin Table 2. So the best combination for C4.5 is all featurescombined, for the SVM it is distance + quotes + cosim.
Features Prec. Recall F-scoreDistance 0.938 0.773 0.848
Time Difference 0.671 0.574 0.619Quotes 0.981 0.235 0.379
Cosine Similarity 0.763 0.377 0.505Distance + Length 0.923 0.79 0.851
Distance + TimeDiff 0.928 0.793 0.855Distance + Quotes 0.943 0.898 0.92Distance + Cosim 0.926 0.891 0.908
Dist + TimeDiff + Quotes 0.942 0.904 0.922Dist + TimeDiff + Cosim 0.928 0.895 0.911Dist + Quotes + Cosim 0.94 0.91 0.925
All Single Features 0.939 0.915 0.927All Singles + Length 0.939 0.918 0.928
Table 1: Impact of Features with Decision Tree – the bestresults for each measure and feature category is highlightedin bold.
4.5 Classifiers
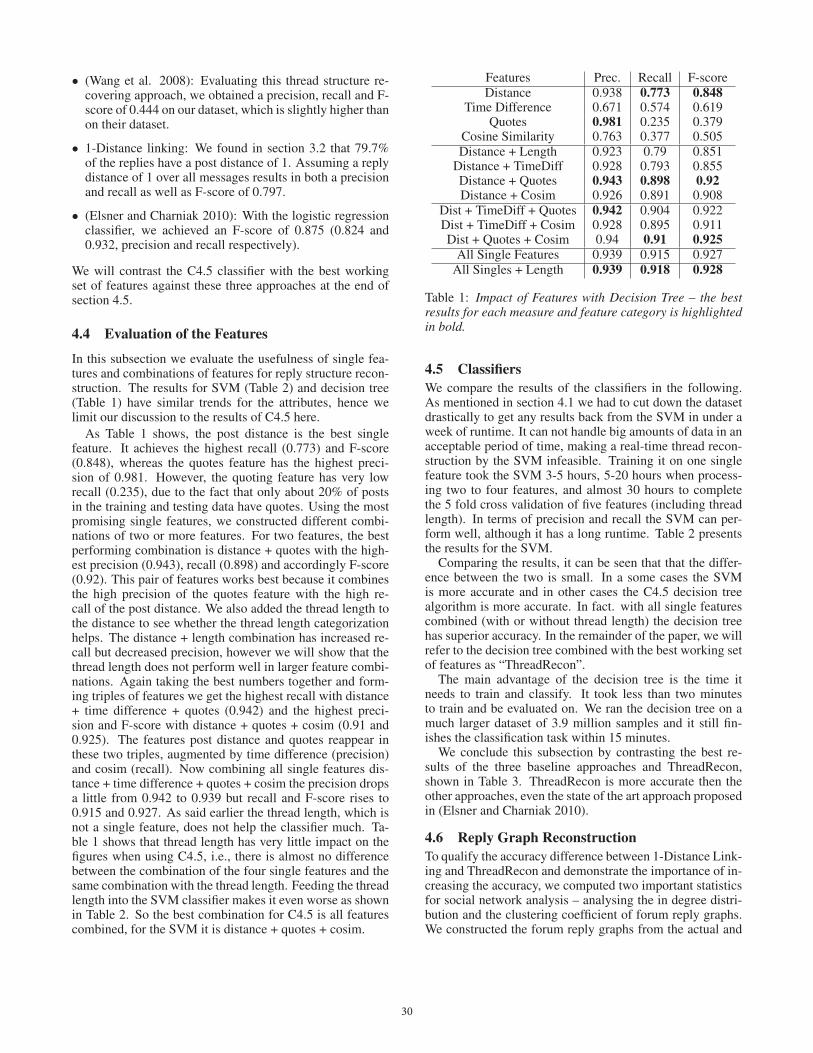
We compare the results of the classifiers in the following.As mentioned in section 4.1 we had to cut down the datasetdrastically to get any results back from the SVM in under aweek of runtime. It can not handle big amounts of data in anacceptable period of time, making a real-time thread recon-struction by the SVM infeasible. Training it on one singlefeature took the SVM 3-5 hours, 5-20 hours when process-ing two to four features, and almost 30 hours to completethe 5 fold cross validation of five features (including threadlength). In terms of precision and recall the SVM can per-form well, although it has a long runtime. Table 2 presentsthe results for the SVM.
Comparing the results, it can be seen that that the differ-ence between the two is small. In a some cases the SVMis more accurate and in other cases the C4.5 decision treealgorithm is more accurate. In fact. with all single featurescombined (with or without thread length) the decision treehas superior accuracy. In the remainder of the paper, we willrefer to the decision tree combined with the best working setof features as “ThreadRecon”.
The main advantage of the decision tree is the time itneeds to train and classify. It took less than two minutesto train and be evaluated on. We ran the decision tree on amuch larger dataset of 3.9 million samples and it still fin-ishes the classification task within 15 minutes.
We conclude this subsection by contrasting the best re-sults of the three baseline approaches and ThreadRecon,shown in Table 3. ThreadRecon is more accurate then theother approaches, even the state of the art approach proposedin (Elsner and Charniak 2010).
4.6 Reply Graph Reconstruction
To qualify the accuracy difference between 1-Distance Link-ing and ThreadRecon and demonstrate the importance of in-creasing the accuracy, we computed two important statisticsfor social network analysis – analysing the in degree distri-bution and the clustering coefficient of forum reply graphs.We constructed the forum reply graphs from the actual and
30
Features Prec. Recall F-scoreDistance 0.938 0.773 0.848
Time Difference 0.656 0.609 0.632Quotes 0.981 0.235 0.379
Cosine Similarity 0.828 0.32 0.462Distance + Length 0.925 0.789 0.851
Distance + TimeDiff 0.919 0.792 0.851Distance + Quotes 0.943 0.898 0.92Distance + Cosim 0.935 0.876 0.905
Dist + TimeDiff + Quotes 0.942 0.885 0.912Dist + TimeDiff + Cosim 0.934 0.858 0.895Dist + Quotes + Cosim 0.942 0.903 0.922
All Single Features 0.941 0.888 0.914All Singles + Length 0.936 0.872 0.903
Table 2: Impact of Features with SVM – the best results foreach measure and feature category is highlighted in bold.
Wang 2008 1-Distance Elsner 2010 ThreadRecon0.444 0.797 0.875 0.926
Table 3: F-score comparison between ThreadRecon andbaseline approaches.
predicted reply structures of the 1-Distance and our threadreconstruction algorithms, and compared the in and out de-gree and clustering coefficient statistics of the actual replygraph versus the predicted reply graphs. The forum replygraph represents the replying structure of the users in a fo-rum, and is used in applications like role analysis (Chan,Daly, and Hayes 2010). The vertices in the graph representthe users, and a directed edge represents one user replyingto another user. Edge weights can represent the amount ofreplies from one user to another, but in the following anal-ysis we just concentrate on the existence of edges and notconsider the edge weights.
In/Out Degree To evaluate the in and out degree distri-butions, we initially plotted the histogram of the in and outdegree distributions of the three reconstructed reply graphs,actualGraph, oneDistGraph and threadReconGraph for thegraphs constructed from the actual, the 1-Distance algorithmand our thread-reconstruction algorithm respectively. Fig-ure 2a shows the in-degree histograms for the actualGraph.We do not plot the other two histograms because they arevery similar to Figure 2a. To quantify their similarity, weuse the KL-divergence measure (Cover and Thomas 2006),a well known measure for comparing histograms. It is an in-formation theoretic measure which measures the uncertaintyremaining about a distribution (or histogram) given knowl-edge of the other. The lower the measure, the closer thetwo distributions are. To use the KL-divergence measure,we normalise the frequencies of each bin, such that the nor-malised frequencies sum to 1. The KL-divergence of thein-degree distributions of the actualGraph and the oneDist-Graph is 0.0139 bits, and for the in-degree distribution ofthe actualGraph and the threadReconGraph, it is 0.0036 bits.Both these values are very low. We also analysed the number
of elements that were placed in the incorrect bin, and foundonly 487 and 227, out of 9877 elements, that were misplacedfor oneDistGraph and threadReconGraph respectively. Wegot similar results for the out-degree distributions. Theseresults suggest both approaches can reproduce reply graphsthat have highly accurate in and out degree distributions.
To investigate if the in and out degree of the reconstructedgraphs were similar on a vertex level, we computed the dif-ference or error between the in and out degrees of each ver-tex. As most vertices have low in and out degrees (see his-tograms of Figures 2a and 3a respectively), indicating thatmost vertices would have low absolute error by default, wecomputed the relative or percentage error instead. It is de-fined as:
PE(vka, vkp) =|dvka
− dvkp|
max(dvka, dvkp
)
where dvkais the degree (in or out) of vertex vka. The per-
centage error measures the relative difference in the degreesof the vertices of the actualGraph against oneDistGraph andthreadReconGraph and is more agnostic to the skewed de-gree distributions. However, low degree vertices can have avery large percentage error, and to avoid them unnecessar-ily distorting the results, we focus on vertices with a totaldegree of 10 or more in the actualGraph.
We plotted the in-degree histograms of the percentage er-ror in Figures 2b and 2c and the out-degree histograms inFigures 3b and 3c. The figures confirm that on a vertexbasis, there is some difference between the graphs. In ad-dition, the figures indicate that the threadReconGraph hasmore vertices with a small percentage error, compared tothe results of the oneDistGraph. This is shown more clearlyin the cumulative distribution function (CDF) plot of the thetwo results, in Figures 2d and 3d. For example, 80% of ver-tices in the threadReconGraph have a percentage error 0.05or less, compared with only 30% for the oneDistGraph. Thisindicates the difference in the precision, recall and F-scorevalues do result in differences in the individual in and outdegrees of the reconstructed reply graphs, and has an effecton subsequent analysis.
This analysis shows that the reply reconstruction algo-rithms can accurately reproduce the in and out degree dis-tributions. However, when the degrees are analysed vertexby vertex basis, we found local differences, with the thread-ReconGraph doing better than the oneDistGraph.
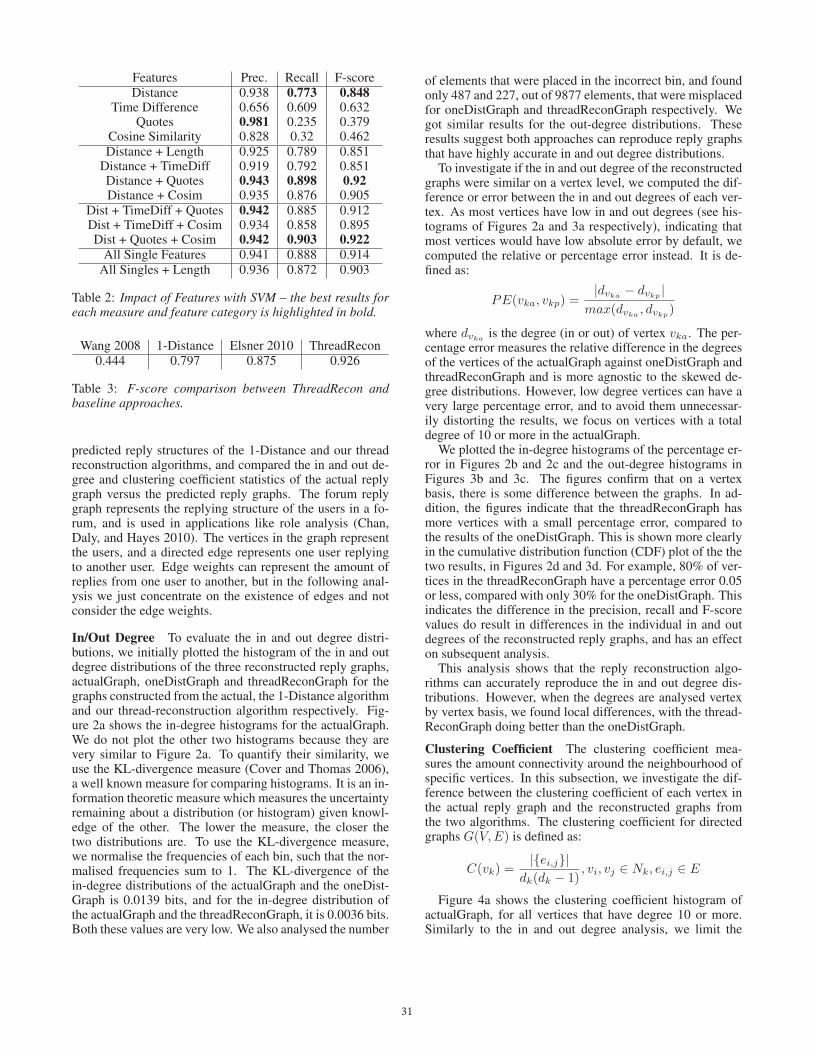
Clustering Coefficient The clustering coefficient mea-sures the amount connectivity around the neighbourhood ofspecific vertices. In this subsection, we investigate the dif-ference between the clustering coefficient of each vertex inthe actual reply graph and the reconstructed graphs fromthe two algorithms. The clustering coefficient for directedgraphs G(V,E) is defined as:
C(vk) =|{ei,j}|
dk(dk − 1), vi, vj ∈ Nk, ei,j ∈ E
Figure 4a shows the clustering coefficient histogram ofactualGraph, for all vertices that have degree 10 or more.Similarly to the in and out degree analysis, we limit the
31

(a) Histogram of the in-degree ofall vertices of the actualGraphreply graph.
(b) In-degree percentage errorbetween the vertices of actual-Graph and oneDistGraph, for allvertices with degree ≥ 10.
(c) In-degree percentage errorbetween the vertices of actual-Graph and threadReconGraph,for all vertices with degree ≥ 10.
(d) CDF plot of the in-degreepercentage error, comparing theresults for oneDistGraph andthreadReconGraph.
Figure 2: Histogram and CDF plots for the in-degree evaluation.
(a) Histogram of the out-degreeof all vertices of the actualGraphreply graph.
(b) Out-degree percentage errorbetween the vertices of actual-Graph and oneDistGraph, for allvertices with degree ≥ 10.
(c) Out-degree percentage errorbetween the vertices of actual-Graph and threadReconGraph,for all vertices with degree ≥ 10.
(d) CDF plot of the out-degreepercentage error, comparing theresults for oneDistGraph andthreadReconGraph.
Figure 3: Histogram and CDF plots for the out-degree evaluation.
analysis to vertices of degree of 10 or more to reduce thedistortion of low clustering coefficient vertices. To measurethe difference between the clustering coefficients, we againused the percentage error of the coefficient for each 10 de-gree plus vertex in the actualGraph against the correspond-ing coefficients in the reconstructed graphs.
Figure 4b and 4c shows the histogram of the percentagedifference of the coefficients between the 1-Distance recon-structed graph and the actualGraph, and between the thread-ReconGraph and the actualGraph respectively. As the fig-ures illustrate, the threadReconGraph has a larger percent-age of low difference vertices than the 1-Distance recon-structed graph. This is made more clear in Figure 4d, whichis the CDF of the histogram figures. For example, 80% ofvertices of the threadReconGraph has percentage differenceless than 17% while it is only 22% for the oneDistGraph.
In this section, we have evaluated different combinationsof the features and two reconstruction algorithms on theirprecision, recall and F-score. We found using all the fea-tures and the C4.5 decision tree resulted in the best balanceof accuracy and efficiency. We have also shown the dif-ference in the in and out degrees and clustering coefficientof individual vertices between the 1-Distance algorithm andour thread-reconstruction algorithm ThreadRecon (C4.5 de-cision tree with all features). This quantifies the effect thatthe differences in precision, recall and F-score has on twoimportant real graph analysis measures.
5 Conclusion and Future Work
The goal of this work is to investigate methods to recoverreply structures in forum threads in an accurate and efficientway. We have extracted a number of features from the ba-sic information a thread provides, i.e., post distance, timedifference, quoting and cosine similarity. We found that thefeatures thread length and author activity do not augmentthe accuracy. For the classification task we examined sup-port vector machines and the C4.5 decision tree algorithm.The decision tree outperforms the SVM in learning and clas-sification speed as well as in the size of data it can processin a feasible time. In terms of precision, recall and F-scorethe decision tree achieves the best results (0.939, 0.918 and0.926) with the combination of all features. Compared to thethree baseline approaches (Wang et al. 2008), “1-Distance”Linking and (Elsner and Charniak 2010), this is an F-scoreimprovement of 52.1%, 13.9% and 5.5% respectively. Wehave also investigated the in and out degree and the clus-tering coefficient between the vertices of the reconstructedreply graph and showed the reconstruction approaches canaccurately reproduce in and out degree distributions. Fur-thermore, on the vertex level, we have shown how the deci-sion tree algorithm produces more accurate reconstructionsthan the 1-Distance baseline algorithm.
For future work, we look at improving our set of featuresfor the thread reconstruction. One additional characteristicwe can consider is the history of interaction between users.When users reply to each other in a thread, there might be
32
(a) Histogram of the clusteringcoefficient for the actualGraphreply graph.
(b) Clustering coefficient per-centage error between thevertices of actualGraph andoneDistGraph.
(c) Clustering coefficient per-centage error between the ver-tices of actualGraph and thread-ReconGraph.
(d) CDF plot of the clustering co-efficient percentage error, com-paring the results for oneDist-Graph and threadReconGraph.
Figure 4: Histogram and CDF plots for the clustering coefficient evaluation, based on vertices with degree ≥ 10.
an increased probability that they reply to each other againlater on; for example, this can occur in a dialogue betweentwo people. We are also interested in investigating contex-tual features, like the topic and trends of a thread. If weknow the sub-topics within a thread, we can limit our searchto posts related to a sub-topic, as the likelihood of repliesacross topics is lower.
Acknowledgements
This work was carried out in the CLIQUE Strategic Re-search Cluster which is funded by Science Foundation Ire-land (SFI) under grant number 08/SRC/I1407. We wouldlike to thank John Breslin for providing the Boards.ie data.
ReferencesAllan, J. 2002. Topic detection and tracking. Norwell, MA, USA:Kluwer Academic Publishers.Chan, J.; Daly, E.; and Hayes, C. 2010. Decomposing discussionforums and boards using user roles. In Proceedings of the AAAIICWSM conference.Cong, G.; Wang, L.; Lin, C.; Song, Y.; and Y. 2008. Find-ing question-answer pairs from online forums. Proceedings of theACM SIGIR conference.Cover, T. M., and Thomas, J. A. 2006. Elements of informationtheory. New York, NY, USA: Wiley-Interscience, 2 edition.Ding, S.; Cong, G.; Lin, C.-Y.; and Zhu, X. 2008. Using con-ditional random fields to extract contexts and answers of questionsfrom online forums. Proceedings of the ACL-HLT conference 710–718.EL-Manzalawy, Y., and Honavar, V. 2005. WLSVM: IntegratingLibSVM into Weka Environment. Software available at http://www.cs.iastate.edu/˜yasser/wlsvm.Elsner, M., and Charniak, E. 2010. Disentangling chat. Computa-tional Linguistics 36:389–409.Feng, D.; Shaw, E.; Kim, J.; and Hovy, E. 2006. Learning to detectconversation focus of threaded discussions. In Proceedings of theNAACL-HLT conference, 208–215.Hall, M.; Frank, E.; Holmes, G.; Pfahringer, B.; Reutemann, P.;and Witten, I. H. 2009. The WEKA Data Mining Software: Anupdate. 11.Hong, L., and Davison, B. D. 2009. A Classification-based Ap-proach to Question Answering in Discussion Boards. In Proceed-ings of the ACM SIGIR conference, 171–178.
Porter, M. F. 1980. An algorithm for suffix stripping. Program14(3):130–137.Salzberg, S. L. 1994. C4.5: Programs for Machine Learning by J.Ross Quinlan. Morgan Kaufmann Publishers, Inc., 1993. MachineLearning 16:235–240.Shen, D.; Yang, Q.; Sun, J.-t.; and Chen, Z. 2006. Thread Detectionin Dynamic Text Message Streams. In Proceedings of the ACMSIGIR conference, 35–42.Wang, L., and Oard, D. W. 2009. Context-based message expan-sion for disentanglement of interleaved text conversations. Pro-ceedings of the NAACL-HLT conference 200–208.Wang, Y.; Joshi, M.; Cohen, W.; and Rose, C. 2008. Recover-ing implicit thread structure in newsgroup style conversations. InProceedings of the AAAI ICWSM conference, 152–160.Xi, W.; Lind, J.; and Brill, E. 2004. Learning effective rankingfunctions for newsgroup search. In Proceedings of the ACM SIGIRconference, 394–401.Yang, W.-Y.; Cao, Y.; and Lin, C.-Y. 2009. A Structural SupportVector Method for Extracting Contexts and Answers of Questionsfrom Online Forums. Proceedings of the 2009 Conference on Em-pirical Methods in Natural Language Processing 514–523.Yeh, J.-y., and Harnly, A. 2006. Email Thread Reassembly UsingSimilarity Matching. In 3rd Conference on Email and Anti-Spam.Zhou, L.; Hovy, E.; and Rey, M. 2005. Digesting Virtual “ Geek” Culture : The Summarization of Technical Internet Relay Chats.In Proceedings of the ACL conference, 298–305.
33