recovery and resolution plans: dealing with financial distress
TRANSCRIPT

MILLIMAN RESEARCH REPORT
Recovery and Resolution Plans: Dealing with financial distressDecember 2016
Eoin King, FSAI (Dublin)
Bridget MacDonnell, FSAI (Dublin)


MILLIMAN RESEARCH REPORT
Table of Contents
AUTHORS AND ACKNOWLEDGEMENTS . . . . . . . . . . . . . . . . . . . . . . . . . . . . . . . . . . . . . . . . . . . . . . . . . . . . . . 5Lead Authors . . . . . . . . . . . . . . . . . . . . . . . . . . . . . . . . . . . . . . . . . . . . . . . . . . . . . . . . . . . . . . . . . . . . . . . . . . . . . . . . . . . . 5
Contributing Authors . . . . . . . . . . . . . . . . . . . . . . . . . . . . . . . . . . . . . . . . . . . . . . . . . . . . . . . . . . . . . . . . . . . . . . . . . . . . . 5
Acknowledgements . . . . . . . . . . . . . . . . . . . . . . . . . . . . . . . . . . . . . . . . . . . . . . . . . . . . . . . . . . . . . . . . . . . . . . . . . . . . . . 5
1 . EXECUTIVE SUMMARY . . . . . . . . . . . . . . . . . . . . . . . . . . . . . . . . . . . . . . . . . . . . . . . . . . . . . . . . . . . . . . . . . 6
2 . INTRODUCTION . . . . . . . . . . . . . . . . . . . . . . . . . . . . . . . . . . . . . . . . . . . . . . . . . . . . . . . . . . . . . . . . . . . . . . . 82 .1 . Regulatory Background . . . . . . . . . . . . . . . . . . . . . . . . . . . . . . . . . . . . . . . . . . . . . . . . . . . . . . . . . . . . . . . . . . . . 8
2 .2 . Impact of Regulatory Regime . . . . . . . . . . . . . . . . . . . . . . . . . . . . . . . . . . . . . . . . . . . . . . . . . . . . . . . . . . . . . . .11
2 .3 . Focus of this Paper . . . . . . . . . . . . . . . . . . . . . . . . . . . . . . . . . . . . . . . . . . . . . . . . . . . . . . . . . . . . . . . . . . . . . . . . 12
3 . GOVERNANCE AND DECISION-MAKING . . . . . . . . . . . . . . . . . . . . . . . . . . . . . . . . . . . . . . . . . . . . . . . . . . 133 .1 . Introduction . . . . . . . . . . . . . . . . . . . . . . . . . . . . . . . . . . . . . . . . . . . . . . . . . . . . . . . . . . . . . . . . . . . . . . . . . . . . . . 13
3 .2 . Parties to be involved . . . . . . . . . . . . . . . . . . . . . . . . . . . . . . . . . . . . . . . . . . . . . . . . . . . . . . . . . . . . . . . . . . . . . . 13
3 .3 . Guidelines for Drafting Recovery and Resolution Plans . . . . . . . . . . . . . . . . . . . . . . . . . . . . . . . . . . . . . . . . 13
3 .4 . Possible Recovery and Resolution Strategies . . . . . . . . . . . . . . . . . . . . . . . . . . . . . . . . . . . . . . . . . . . . . . . . . 15
3 .5 . Considerations When Choosing a Strategy . . . . . . . . . . . . . . . . . . . . . . . . . . . . . . . . . . . . . . . . . . . . . . . . . . 16
3 .6 . Monitoring . . . . . . . . . . . . . . . . . . . . . . . . . . . . . . . . . . . . . . . . . . . . . . . . . . . . . . . . . . . . . . . . . . . . . . . . . . . . . . . 19
3 .7 . Governance Considerations for Groups . . . . . . . . . . . . . . . . . . . . . . . . . . . . . . . . . . . . . . . . . . . . . . . . . . . . . . 20
4 . RECOVERY STRATEGIES: IMPROVING LIQUIDITY . . . . . . . . . . . . . . . . . . . . . . . . . . . . . . . . . . . . . . . . . . 214 .1 . Introduction . . . . . . . . . . . . . . . . . . . . . . . . . . . . . . . . . . . . . . . . . . . . . . . . . . . . . . . . . . . . . . . . . . . . . . . . . . . . . . 21
4 .2 . VIF Monetisation . . . . . . . . . . . . . . . . . . . . . . . . . . . . . . . . . . . . . . . . . . . . . . . . . . . . . . . . . . . . . . . . . . . . . . . . . . 22
4 .3 . Financial Reinsurance . . . . . . . . . . . . . . . . . . . . . . . . . . . . . . . . . . . . . . . . . . . . . . . . . . . . . . . . . . . . . . . . . . . . . 25
4 .4 . Securitisation . . . . . . . . . . . . . . . . . . . . . . . . . . . . . . . . . . . . . . . . . . . . . . . . . . . . . . . . . . . . . . . . . . . . . . . . . . . . 25
4 .5 . Investment Portfolio Rebalancing . . . . . . . . . . . . . . . . . . . . . . . . . . . . . . . . . . . . . . . . . . . . . . . . . . . . . . . . . . . 26
4 .6 . Debt Financing . . . . . . . . . . . . . . . . . . . . . . . . . . . . . . . . . . . . . . . . . . . . . . . . . . . . . . . . . . . . . . . . . . . . . . . . . . . 29
4 .7 . Product Restructuring . . . . . . . . . . . . . . . . . . . . . . . . . . . . . . . . . . . . . . . . . . . . . . . . . . . . . . . . . . . . . . . . . . . . . 30
4 .8 . Other Measures . . . . . . . . . . . . . . . . . . . . . . . . . . . . . . . . . . . . . . . . . . . . . . . . . . . . . . . . . . . . . . . . . . . . . . . . . . 31
5 . RECOVERY STRATEGIES: RAISING CAPITAL . . . . . . . . . . . . . . . . . . . . . . . . . . . . . . . . . . . . . . . . . . . . . . 325 .1 . Introduction . . . . . . . . . . . . . . . . . . . . . . . . . . . . . . . . . . . . . . . . . . . . . . . . . . . . . . . . . . . . . . . . . . . . . . . . . . . . . . 32
5 .2 . Equity Capital . . . . . . . . . . . . . . . . . . . . . . . . . . . . . . . . . . . . . . . . . . . . . . . . . . . . . . . . . . . . . . . . . . . . . . . . . . . . 32
5 .3 . Hybrid Capital . . . . . . . . . . . . . . . . . . . . . . . . . . . . . . . . . . . . . . . . . . . . . . . . . . . . . . . . . . . . . . . . . . . . . . . . . . . . 33
5 .4 . Subordinated Debt . . . . . . . . . . . . . . . . . . . . . . . . . . . . . . . . . . . . . . . . . . . . . . . . . . . . . . . . . . . . . . . . . . . . . . . . 34
5 .5 . Group Finance . . . . . . . . . . . . . . . . . . . . . . . . . . . . . . . . . . . . . . . . . . . . . . . . . . . . . . . . . . . . . . . . . . . . . . . . . . . . 35
5 .6 . Off-Balance-Sheet Capital . . . . . . . . . . . . . . . . . . . . . . . . . . . . . . . . . . . . . . . . . . . . . . . . . . . . . . . . . . . . . . . . . 36
6 . RECOVERY STRATEGIES: DE-RISKING . . . . . . . . . . . . . . . . . . . . . . . . . . . . . . . . . . . . . . . . . . . . . . . . . . . 376 .1 . Introduction . . . . . . . . . . . . . . . . . . . . . . . . . . . . . . . . . . . . . . . . . . . . . . . . . . . . . . . . . . . . . . . . . . . . . . . . . . . . . . 37
6 .2 . Reinsurance and Capital Market Solutions . . . . . . . . . . . . . . . . . . . . . . . . . . . . . . . . . . . . . . . . . . . . . . . . . . . 37
6.2.1. Reinsurance . . . . . . . . . . . . . . . . . . . . . . . . . . . . . . . . . . . . . . . . . . . . . . . . . . . . . . . . . . . . . . . . . . . . . . . 37
6.2.2. Longevity Transfer. . . . . . . . . . . . . . . . . . . . . . . . . . . . . . . . . . . . . . . . . . . . . . . . . . . . . . . . . . . . . . . . . . 39
6.2.3. Catastrophe Bonds and Swaps . . . . . . . . . . . . . . . . . . . . . . . . . . . . . . . . . . . . . . . . . . . . . . . . . . . . . . 39
6 .3 . Investment Strategy . . . . . . . . . . . . . . . . . . . . . . . . . . . . . . . . . . . . . . . . . . . . . . . . . . . . . . . . . . . . . . . . . . . . . . 41
6.3.1. Asset Liability Management . . . . . . . . . . . . . . . . . . . . . . . . . . . . . . . . . . . . . . . . . . . . . . . . . . . . . . . . . 41
6.3.2. Hedging . . . . . . . . . . . . . . . . . . . . . . . . . . . . . . . . . . . . . . . . . . . . . . . . . . . . . . . . . . . . . . . . . . . . . . . . . . . 42
6 .4 . Other Options . . . . . . . . . . . . . . . . . . . . . . . . . . . . . . . . . . . . . . . . . . . . . . . . . . . . . . . . . . . . . . . . . . . . . . . . . . . . 44

MILLIMAN RESEARCH REPORT
7 . RECOVERY STRATEGIES: RESTRUCTURING . . . . . . . . . . . . . . . . . . . . . . . . . . . . . . . . . . . . . . . . . . . . . . 467 .1 . Introduction . . . . . . . . . . . . . . . . . . . . . . . . . . . . . . . . . . . . . . . . . . . . . . . . . . . . . . . . . . . . . . . . . . . . . . . . . . . . . . 46
7 .2 . Portfolio Transfers . . . . . . . . . . . . . . . . . . . . . . . . . . . . . . . . . . . . . . . . . . . . . . . . . . . . . . . . . . . . . . . . . . . . . . . . 46
7 .3 . Options Related to New Business . . . . . . . . . . . . . . . . . . . . . . . . . . . . . . . . . . . . . . . . . . . . . . . . . . . . . . . . . . . 47
7 .4 . Options Related to Existing Business . . . . . . . . . . . . . . . . . . . . . . . . . . . . . . . . . . . . . . . . . . . . . . . . . . . . . . . . 47
7 .5 . Closure to New Business . . . . . . . . . . . . . . . . . . . . . . . . . . . . . . . . . . . . . . . . . . . . . . . . . . . . . . . . . . . . . . . . . . 48
7 .6 . Enhanced Diversification . . . . . . . . . . . . . . . . . . . . . . . . . . . . . . . . . . . . . . . . . . . . . . . . . . . . . . . . . . . . . . . . . . 49
7 .7 . Internal Restructuring Measures . . . . . . . . . . . . . . . . . . . . . . . . . . . . . . . . . . . . . . . . . . . . . . . . . . . . . . . . . . . . 50
7 .8 . Group Restructuring . . . . . . . . . . . . . . . . . . . . . . . . . . . . . . . . . . . . . . . . . . . . . . . . . . . . . . . . . . . . . . . . . . . . . . 50
7.8.1. Branch Structure. . . . . . . . . . . . . . . . . . . . . . . . . . . . . . . . . . . . . . . . . . . . . . . . . . . . . . . . . . . . . . . . . . . 50
7.8.2. Mergers and Acquisitions . . . . . . . . . . . . . . . . . . . . . . . . . . . . . . . . . . . . . . . . . . . . . . . . . . . . . . . . . . . 51
7.8.3. Splitting Up the Group . . . . . . . . . . . . . . . . . . . . . . . . . . . . . . . . . . . . . . . . . . . . . . . . . . . . . . . . . . . . . . 54
7.8.4. Other Options Available to Groups . . . . . . . . . . . . . . . . . . . . . . . . . . . . . . . . . . . . . . . . . . . . . . . . . . . 55
8 . RESOLUTION AND EXTREME RECOVERY MEASURES . . . . . . . . . . . . . . . . . . . . . . . . . . . . . . . . . . . . . . 568 .1 . Introduction . . . . . . . . . . . . . . . . . . . . . . . . . . . . . . . . . . . . . . . . . . . . . . . . . . . . . . . . . . . . . . . . . . . . . . . . . . . . . . 56
8 .2 . Winding Up . . . . . . . . . . . . . . . . . . . . . . . . . . . . . . . . . . . . . . . . . . . . . . . . . . . . . . . . . . . . . . . . . . . . . . . . . . . . . . . 56
8 .3 . Dismantling Operations . . . . . . . . . . . . . . . . . . . . . . . . . . . . . . . . . . . . . . . . . . . . . . . . . . . . . . . . . . . . . . . . . . . 56
8 .4 . Changing Ownership . . . . . . . . . . . . . . . . . . . . . . . . . . . . . . . . . . . . . . . . . . . . . . . . . . . . . . . . . . . . . . . . . . . . . . 59
8 .5 . Reducing Policyholder Benefits . . . . . . . . . . . . . . . . . . . . . . . . . . . . . . . . . . . . . . . . . . . . . . . . . . . . . . . . . . . . .60
8 .6 . Resolutions in Japan . . . . . . . . . . . . . . . . . . . . . . . . . . . . . . . . . . . . . . . . . . . . . . . . . . . . . . . . . . . . . . . . . . . . . .60
8.6.1. Roots of the Crisis. . . . . . . . . . . . . . . . . . . . . . . . . . . . . . . . . . . . . . . . . . . . . . . . . . . . . . . . . . . . . . . . . . 60
8.6.2. Defining an Approach for Resolution . . . . . . . . . . . . . . . . . . . . . . . . . . . . . . . . . . . . . . . . . . . . . . . . . 61
8.6.3. Lessons Learned . . . . . . . . . . . . . . . . . . . . . . . . . . . . . . . . . . . . . . . . . . . . . . . . . . . . . . . . . . . . . . . . . . . 64
8 .7 . ‘Bail-Ins’ and Bail-Outs . . . . . . . . . . . . . . . . . . . . . . . . . . . . . . . . . . . . . . . . . . . . . . . . . . . . . . . . . . . . . . . . . . . . 65
9 . REFERENCES . . . . . . . . . . . . . . . . . . . . . . . . . . . . . . . . . . . . . . . . . . . . . . . . . . . . . . . . . . . . . . . . . . . . . . . . 74

MILLIMAN RESEARCH REPORT
Recovery and Resolution Plans: Dealing with financial distress
5 DECEMBER 2016
Authors and acknowledgementsLEAD AUTHORSEoin King, FSAI, is a consulting actuary with the Dublin office of Milliman. Contact him at [email protected].
Bridget MacDonnell, FSAI, is a consulting actuary with the Dublin office of Milliman. Contact her at [email protected].
CONTRIBUTING AUTHORSIreland: Eamonn Phelan, Principal (Dublin)
United States: Lin Sun, Consulting Actuary (Chicago), and Laird Zacheis, Principal, Consulting Actuary (Chicago)
Spain: Luca Inserra, Principal (Madrid)
Japan: Stephen Conwill, Principal, CEO – Japan (Tokyo)
ACKNOWLEDGEMENTSThe authors would like to thank Paul Sinnott, Principal (Hong Kong), for his contribution to the production of this research report.

MILLIMAN RESEARCH REPORT
Recovery and Resolution Plans: Dealing with financial distress
6 DECEMBER 2016
1. Executive summaryAcross all territories, a common theme among regulators is that recovery plans generally relate to situations where a company can find a solution in order to restore financial viability. The Financial Stability Board (FSB) states that a recovery plan ‘identifies options to restore financial strength and viability when the firm comes under severe stress’ whereas it defines resolution as the situation ‘when a firm is no longer viable or likely to be no longer viable, and has no reasonable prospect of becoming so.’ 1
However, there can be a fine line between recovery and resolution. Extreme measures such as closing the company to new business or changing the corporate or ownership structure such that the company survives, albeit in a different form, probably lie somewhere between recovery and resolution.
Recovery and Resolution Plans (RRPs) are becoming increasingly important for insurance and reinsurance companies. RRP requirements already apply to Global Systemically Important Insurers (G-SIIs) and in some territories we are also seeing requirements coming into force which apply to smaller insurers that have not been classified as G-SIIs. Useful insights into the recovery and resolution planning process can be found in these regulations and RRPs which have been implemented in the banking industry.
Companies must consider the governance arrangements of their RRPs. This will involve consideration of the roles of the parties involved, the monitoring arrangements, and the process for deciding on the most appropriate course of action. There are a number of guidelines and papers that have been issued by regulatory bodies that discuss such governance arrangements. For example, the ‘Key Attributes of Effective Resolution Regimes for Financial Institutions’ paper from the FSB discusses the structure of RRPs. It calls for plans to contain, amongst other things, analyses of the strategies considered, conditions and triggers for intervention, and responsibilities for executing preparatory actions and full implementation.
There are a number of different strategies that companies may consider when formulating or enacting RRPs. This paper analyses recovery and resolution strategies which range from relatively simple to more complex mechanisms. Figure 1 summarises the strategies explored in this paper in terms of their levels of complexity. Of course, where exactly a strategy lies on the spectrum of complexity depends on the company’s specific circumstances. For example, the type of business written by the company, the investment strategy, the company’s ownership structure, the regulatory jurisdiction, credit history, and profitability of the business are all key inputs into the analysis.
FIGURE 1: INVESTMENT PORTFOLIO REBALANCING
1 FSB (October 2014) . Key Attributes of Effective Resolution Regimes for Financial Institutions .
Bank overdraft
Convertingreceivables
Extending credit
Expense management
Investment portfolio rebalancing
Review charges andpremiums
Reprice/changeunderwriting
Proportionalreinsurance
Less complex More complex
Non-proportionalreinsurance
Underfunding of unitliability
Enhanceddiversi�cation
Group capital
Asset-liabilitymanagement
Closure to newbusiness
Undertaking speci�cparameter
Static hedging
O�-balance sheetcapital
Debt issuance
Subordinated debt
Equity issuance
Contingent capital
Partial internal model
Cat bond/swap
Longevity transfer
Financialreinsurance
Dynamic hedging
Internal model
Securitisation
Group restructuring
Portfolio transfer
Mergers andacquisitions
Resolution tools

MILLIMAN RESEARCH REPORT
Recovery and Resolution Plans: Dealing with financial distress
7 DECEMBER 2016
There are many factors that companies should consider when deciding on the most appropriate course of action that would be taken in a recovery or resolution situation. Companies should analyse the options available to them if they get into financial difficulty, and weigh up the benefits and drawbacks of each. Figure 2 summarises key considerations that companies should work through in deriving recovery and resolution strategies.
FIGURE 2: CONSIDERATIONS WHEN CHOOSING A RECOVERY OR RESOLUTION STRATEGY
In order to illustrate the application and effectiveness of the strategies discussed in this paper, we have included a number of real-life examples, or case studies, from around the world. Some of these case studies deal with companies that found themselves in financial difficulty, while others merely serve to highlight examples of particular strategies in practice which could be used in recovery and resolution planning. The main case studies outlined within this paper are shown in Figure 3.
FIGURE 3: CASE STUDIES FROM ACROSS THE GLOBE
Liquidity or Solvency Will this strategy improve the company’s liquidity or solvency position?
Recovery or ResolutionIs the company facing a recovery or a resolution scenario? Will this strategy help restore the company’s financial position or it is a resolution strategy?
Time Has the company time to implement this strategy and for its benefits to materialise?
Availability Is this strategy available to the company i .e . are there third parties willing to facilitate it?
Cost Can the company afford the cost of this strategy and is it the most cost-efficient approach?
Complexity, Ease of Implementation & Ongoing Maintenance
Has the company access to the necessary skills, expertise and resources in order to implement this strategy and carry out any ongoing maintenance required in terms of its complexity and ease of implementation?
Great-West Lifecosubordinated debt
Gjensidige Forsikringrestricted Tier 1 bonds
AIG sale of Alico;Conceso sale ofnon-core assets;Hannover Re cat bonds;Scottish Re restructuring
Old Mutualseparation ofgroup entities
Irish Banking Crisis;New Ireland securitisation;FBD convertible bond
VIF monetisationin Spain & Portugal
AIA changeof ownershipas part of theAIG solutionin the UnitedStates
HH insuranceresolution
Resolutionsin Japan
Equitable Liferesolution

MILLIMAN RESEARCH REPORT
Recovery and Resolution Plans: Dealing with financial distress
8 DECEMBER 2016
2. Introduction2 .1 . REGULATORY BACKGROUNDRecovery and Resolution Plans (RRPs) have been attracting a lot of regulatory attention of late. The Financial Stability Board (FSB) states that a recovery plan ‘identifies options to restore financial strength and viability when the firm comes under severe stress’ whereas it defines resolution as the situation ‘when a firm is no longer viable or likely to be no longer viable, and has no reasonable prospect of becoming so.’
Recovery plans, therefore, generally relate to situations where a company can find a solution in order to restore financial viability. Resolution plans, on the other hand, most commonly relate to situations where a firm has failed and needs to look at options in order to wind up or otherwise terminate the company in its existing form. Regulators would typically be heavily involved in the resolution stages, either working with the company to refine and implement the resolution plan or taking over the company and implementing a resolution plan themselves.
The FSB requirements for Global Systemically Important Financial Institutions (G-SIFIs) to undertake recovery and resolution planning are set out in the ‘Key Attributes of Effective Resolution Regimes for Financial Institutions’ document (Key Attributes Paper). The Key Attributes Paper outlines ‘Essential Elements of Recovery and Resolution Plans,’ including the need for recovery plans to contain stress scenarios to address capital and liquidity issues. The paper also states that regulatory authorities should establish Crisis Management Groups (CMGs) for all G-SIFIs ‘with the objective of enhancing preparedness for, and facilitating the management and resolution of, a cross-border financial crisis affecting the firm.’
These requirements have been adopted by the International Association of Insurance Supervisors (IAIS) for Global Systemically Important Insurers (G-SIIs). The IAIS published a paper entitled ‘Global Systemically Important Insurers: Initial Assessment Methodology’ in July 2013 (updated in June 2016) outlining the methodology for identifying G-SIIs, as well as a set of policy measures that apply to them.
In some territories we are also seeing requirements which apply to smaller insurers that have not been classified as G-SIIs such as:
· In the United States, there is a requirement for non-bank financial companies designated by the Financial Stability Oversight Council (FSOC) for supervision by the Federal Reserve to periodically submit resolution plans to the Federal Reserve and the Federal Deposit Insurance Corporation (FDIC). Currently, a small number of insurers fall under this category. The requirement is that:
Each plan, commonly known as a living will, must describe the company’s strategy for rapid and orderly resolution in the event of material financial distress or failure of the company, and include both public and confidential sections.
· At a European level, the European Insurance and Occupational Pensions Authority (EIOPA) has included the following operational objective in its Annual Work Programme for 2016:
… to actively contribute to the development of a European approach to crisis management with particular focus on recovery and resolution plan as a preventive tool.
EIOPA chairman, Gabriel Bernardino, spoke about recovery and resolution planning in his keynote speech at the EIOPA annual conference in Frankfurt on 18 October 2016, including EIOPA’s plans to:
...publish a discussion paper before the end of the year, covering an overview of the national regimes currently in place, discussing the rationale for harmonisation and putting forward first ideas on the building blocks of a minimum harmonized recovery and resolution framework for insurers in the European Union.

MILLIMAN RESEARCH REPORT
Recovery and Resolution Plans: Dealing with financial distress
9 DECEMBER 2016
The EIOPA chairman also referenced lessons learned from the recent global financial crisis, in particular:
...the need to have in place adequate recovery and resolution tools which will enable national authorities to intervene in failing institutions and resolve failures when these materialise in an effective and orderly manner.
This focus on developing adequate recovery and resolution tools at the national level is likely to ultimately lead to increased attention on industry activities in this area.
Under the Solvency II Directive ‘ladder of supervisory intervention,’ (re)insurance companies must submit a realistic recovery plan to the regulator within two months of noncompliance with the Solvency Capital Requirement, with a window of six months since non-compliance to restore the financial position. Those time frames tighten to one month and three months respectively for non-compliance with the Minimum Capital Requirement, where a short-term realistic finance scheme must be submitted.
In Europe, the Bank Recovery and Resolution Directive (BRRD)2 came into force on 1 January 2015 (with the exception of the ‘bail-in tool’ which came into force on 1 January 2016). Banks and large investment firms subject to the BRRD must draw up their own recovery plans and are the subject of individual resolution plans, which are drawn up by Resolution Authorities,3 sometimes with assistance from the relevant institution. Whilst not directly applicable for (re)insurers, regulations such as the BRRD provide an insight into supervisors’ views in the area of recovery and resolution planning.
The recovery plans under the BRRD must contain ‘measures to be taken by the institution to restore its financial position following a significant deterioration of its financial situation.’ The objectives of the resolution plans under the BRRD, on the other hand, include ensuring the continuity of critical functions, preventing contagion spreading distress to other institutions, and protecting taxpayers and policyholders as much as possible from bearing losses.
· Recovery and Resolution Plans (RRPs) are also coming more into focus with national supervisory authorities in Europe. For example, in the UK, Rule 8 of the Prudential Regulation Authority (PRA) Fundamental Rules is that:
A firm must prepare for resolution so, if the need arises, it can be resolved in an orderly manner with a minimum disruption of critical services.
The PRA’s ‘Recovery and Resolution Instrument 2013’ came into force on 1 January 2014, and requires UK banks, building societies, and designated investment firms to prepare and maintain a ‘recovery plan’ and ‘resolution pack.’ In addition, appropriate governance must be exercised in relation to the recovery plan and resolution pack. The firm’s governing body is responsible for oversight and approval of these items, with the audit committee responsible for periodically reviewing same.
The recovery and resolution policy statement defines recovery plans as ‘outlining credible recovery actions that they could implement in the event of severe stress to restore their business to a stable and sustainable condition.’
It refers to resolution as follows:
The PRA is aiming for a position where the failure of any firm is orderly: this means that in the event of failure, it will be feasible to resolve that firm without severe systemic disruption and without exposing taxpayers to loss, while protecting vital economic functions and imposing losses on bank creditors.
2 Directive 2014/59/EU of the European Parliament and of the Council of 15 May 2014 .
3 The Resolution Authority is generally the local regulator .

MILLIMAN RESEARCH REPORT
Recovery and Resolution Plans: Dealing with financial distress
10 DECEMBER 2016
As regulators begin to call for firms to have RRPs in place, an increased focus is needed on developing plans for companies that could be used in the event of financial difficulty—which may include those breaching (or coming close to breaching) their solvency capital requirements or encountering liquidity problems.
Other insights into RRPs provided by various bodies are summarised below:
· Globally, the FSB issued a fifth report to the G20 on progress in resolution in August 2016, ‘Resilience through resolvability – moving from policy design to implementation,’ which notes that:
…more work is needed to put in place effective policies and regimes for systemically important non-bank financial institutions, in particular central counterparties and systemic insurers…
· In the United States, the public content of RRPs for in-scope companies can be seen on the Federal Reserve website. The Federal Reserve has provided feedback to companies in relation to their RRPs, which included feedback to three non-bank institutions in July 2015, that more detail is needed in relation to ‘obstacles to resolvability, including global cooperation, interconnectedness, and adequate funding and liquidity.’
Feedback was also provided to eight systemically important banks in April 2016, including the need to ensure that plans are credible and that they facilitate the orderly resolution of the company. A summary of the firm-specific feedback letters is outlined in Appendix A of the ‘Resolution Plan Assessment Framework and Firm Determinations (2016).’
· The European Banking Authority (EBA) publications include a report on the approach taken across the banking industry to determining critical functions and core business lines in recovery plans and a report on the approach taken on recovery plan scenarios. The latter paper highlights that scenarios are important in recovery plans to determine whether the strategies outlined in the plan are sufficient to cover a wide range of eventualities and that the indicators and triggers would be sufficiently timely and accurate in such situations. The general feedback from this paper concerns the need:
− For scenarios to be company-specific, yet relevant
− To clearly describe scenarios and their impacts
− To consider the impact of the occurrence of an event over time and the sequence of events that may follow
− To clearly align scenarios with the indicators and triggers for recovery action and strategies
While RRPs are attracting increasingly more focus from a regulatory perspective, the need to have effective RRPs in place essentially stems from robust risk management practices. Companies are used to having disaster recovery plans and business continuity plans in place for situations in which there are information technology (IT) failures, or loss of key information, personnel, or buildings, but many do not have similar plans in place for situations potentially involving an issue in relation to capital or liquidity needs. In such situations, the company may need to act quickly in order to recover its position or alternatively it may need a ‘strategy for rapid and orderly resolution.’ Having a plan in place can ensure that the situation does not deteriorate further while the company is devising a strategy from first principles.
Throughout the world, there is a common theme of regulatory requirements including some form of stress testing and/or financial projections. The Own Risk and Solvency Assessment (ORSA) is becoming an international requirement for (re)insurance companies, given the IAIS requirement for an ORSA as part of Enterprise Risk Management.4 Stress tests are also required by many regulators, with the Federal Reserve and EU-wide banking stress tests and the EIOPA stress tests for insurance and reinsurance companies among these requirements. The natural follow-on from these assessments is that companies may need to develop RRPs in order to devise strategies which could be used in order to restore financial viability in the event that some of these adverse scenarios materialise.
4 Further details on the ORSA requirements for various territories around the world can be found in the Milliman paper entitled ‘ORSA: An International Requirement’ (2013) .
MILLIMAN RESEARCH REPORT
Recovery and Resolution Plans: Dealing with financial distress
11 DECEMBER 2016
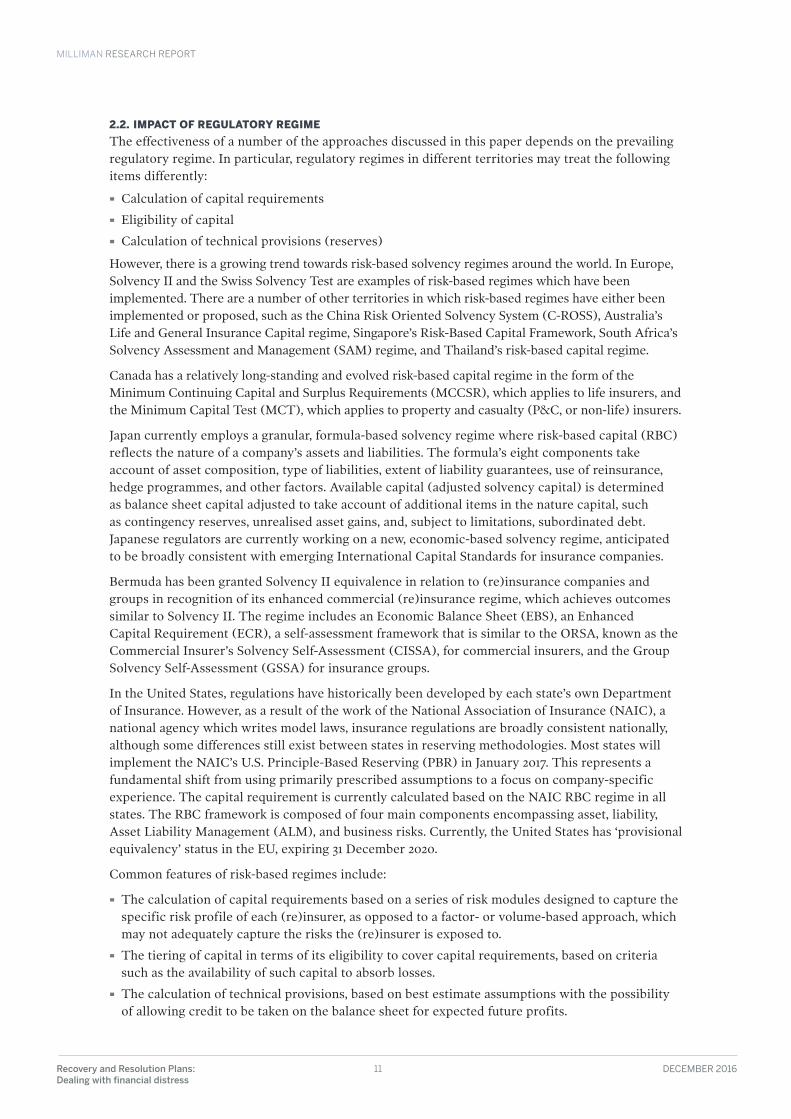
2 .2 . IMPACT OF REGULATORY REGIMEThe effectiveness of a number of the approaches discussed in this paper depends on the prevailing regulatory regime. In particular, regulatory regimes in different territories may treat the following items differently:
· Calculation of capital requirements
· Eligibility of capital
· Calculation of technical provisions (reserves)
However, there is a growing trend towards risk-based solvency regimes around the world. In Europe, Solvency II and the Swiss Solvency Test are examples of risk-based regimes which have been implemented. There are a number of other territories in which risk-based regimes have either been implemented or proposed, such as the China Risk Oriented Solvency System (C-ROSS), Australia’s Life and General Insurance Capital regime, Singapore’s Risk-Based Capital Framework, South Africa’s Solvency Assessment and Management (SAM) regime, and Thailand’s risk-based capital regime.
Canada has a relatively long-standing and evolved risk-based capital regime in the form of the Minimum Continuing Capital and Surplus Requirements (MCCSR), which applies to life insurers, and the Minimum Capital Test (MCT), which applies to property and casualty (P&C, or non-life) insurers.
Japan currently employs a granular, formula-based solvency regime where risk-based capital (RBC) reflects the nature of a company’s assets and liabilities. The formula’s eight components take account of asset composition, type of liabilities, extent of liability guarantees, use of reinsurance, hedge programmes, and other factors. Available capital (adjusted solvency capital) is determined as balance sheet capital adjusted to take account of additional items in the nature capital, such as contingency reserves, unrealised asset gains, and, subject to limitations, subordinated debt. Japanese regulators are currently working on a new, economic-based solvency regime, anticipated to be broadly consistent with emerging International Capital Standards for insurance companies.
Bermuda has been granted Solvency II equivalence in relation to (re)insurance companies and groups in recognition of its enhanced commercial (re)insurance regime, which achieves outcomes similar to Solvency II. The regime includes an Economic Balance Sheet (EBS), an Enhanced Capital Requirement (ECR), a self-assessment framework that is similar to the ORSA, known as the Commercial Insurer’s Solvency Self-Assessment (CISSA), for commercial insurers, and the Group Solvency Self-Assessment (GSSA) for insurance groups.
In the United States, regulations have historically been developed by each state’s own Department of Insurance. However, as a result of the work of the National Association of Insurance (NAIC), a national agency which writes model laws, insurance regulations are broadly consistent nationally, although some differences still exist between states in reserving methodologies. Most states will implement the NAIC’s U.S. Principle-Based Reserving (PBR) in January 2017. This represents a fundamental shift from using primarily prescribed assumptions to a focus on company-specific experience. The capital requirement is currently calculated based on the NAIC RBC regime in all states. The RBC framework is composed of four main components encompassing asset, liability, Asset Liability Management (ALM), and business risks. Currently, the United States has ‘provisional equivalency’ status in the EU, expiring 31 December 2020.
Common features of risk-based regimes include:
· The calculation of capital requirements based on a series of risk modules designed to capture the specific risk profile of each (re)insurer, as opposed to a factor- or volume-based approach, which may not adequately capture the risks the (re)insurer is exposed to.
· The tiering of capital in terms of its eligibility to cover capital requirements, based on criteria such as the availability of such capital to absorb losses.
· The calculation of technical provisions, based on best estimate assumptions with the possibility of allowing credit to be taken on the balance sheet for expected future profits.

MILLIMAN RESEARCH REPORT
Recovery and Resolution Plans: Dealing with financial distress
12 DECEMBER 2016
However, there are many differences in the specifics of each regulatory regime. Companies will need to verify the regulations in the territory involved when assessing whether any of the strategies outlined in this paper are appropriate.
2 .3 . FOCUS OF THIS PAPERThis paper analyses the realities of what might happen and the options available to firms in financial difficulty. We examine recovery and resolution planning for (re)insurers, the options that are available and the governance required for successful implementation. Our analysis focuses on market practice, including case studies of past actions taken by banks or other financial services firms (and lessons that could be learned by insurers from their experience).
There is undoubtedly an overlap between recovery and resolution strategies, given that certain approaches, such as transferring blocks of business, could be used in either situation. Sections 4 to 7 of this paper therefore contain measures that are focused on recovery but could also be used as part of a resolution plan. Section 8, on the other hand, describes strategies that are focused on resolution, including extreme measures that would likely only be implemented as a last resort and in conjunction with the relevant regulatory authority.
Although this paper is structured in sections that detail individual strategies which could be used as part of recovery and resolution planning, it is important to bear in mind that RRPs are not generally made up of a single action but rather a series of well thought out and complementary actions that fit together in a sensible way in order to tackle the problem at hand. Examples of combinations of strategies which have been used in RRPs can be found in many of the case studies throughout this paper. The case studies do not always deal with companies that found themselves in financial difficulty. In many instances, the case studies serve to highlight examples of practical strategies which could be used in recovery and resolution planning.
This paper is structured as follows:
· Section 3 outlines the governance and decision-making process relating to RRPs.
· Section 4 outlines strategies to improve liquidity.
· Section 5 outlines strategies to raise capital.
· Section 6 outlines strategies to de-risk the balance sheet.
· Section 7 outlines corporate and portfolio restructuring strategies.
· Section 8 outlines possible resolution and ‘extreme recovery’ strategies (where the company may continue to exist but in a dramatically different form).
· Lastly, Section 9 lists the references used in this paper, including useful links to industry body and regulatory guidance, requirements, and reports.

MILLIMAN RESEARCH REPORT
Recovery and Resolution Plans: Dealing with financial distress
13 DECEMBER 2016
3. Governance and decision making3 .1 . INTRODUCTIONAn important consideration in recovery and resolution planning is the governance arrangements that need to be put in place when drafting and maintaining plans. The plans will need to consider the parties to be involved, regulatory guidance and feedback on drafting plans, monitoring arrangements, and the process for deciding on the most appropriate course of action to take.
3 .2 . PARTIES TO BE INVOLVEDAnnex 4 of the FSB’s Key Attributes Paper focuses on ‘Essential Elements of Recovery and Resolution Plans.’ It discusses objectives and governance of plans and sets out steps to be taken by firms and by regulatory authorities in relation to the plans. Paragraph 1.18 of this annex states that:
Firms should be required to have in place a robust governance structure and sufficient resources to support the recovery and resolution planning process. This includes clear responsibilities of business units, senior managers up to and including board members, and identifying a senior level executive responsible for ensuring the firm is and remains in compliance with RRP requirements and for ensuring that recovery and resolution planning is integrated into the firm’s overall governance processes.
Furthermore, in July 2016, the EBA issued a report entitled ‘EBA Recovery Planning - Comparative Report on Governance Arrangements and Recovery Indicators’ (EBA Report). The executive summary of the EBA Report notes that:
In order to be effective, a recovery plan needs clear governance arrangements, both in terms of the processes and procedures that govern its development (who develops the plan), maintenance (who updates the plan), implementation (who applies it when needed) and execution (who makes sure that the plan is applied).
Even though the EBA Report was written with banks in mind, this extract serves as a useful indicator of the governance process that needs to be associated with RRPs within (re)insurance companies. It will be important for (re)insurance companies to identify the key teams and individuals with responsibility for the development, maintenance, implementation, and execution actions mentioned above. These parties should ideally be involved from the beginning of the development of any plans in order for them to be executable—assigning responsibilities for implementation to different teams without soliciting their input could lead to plans that are not realistic or achievable in practice.
In summary, ideally a number of different parties will need to be involved in the development and maintenance of RRPs. These would include members of the business units that may be called on to implement plans, senior management, and directors.
3 .3 . GUIDELINES FOR DRAFTING RECOVERY AND RESOLUTION PLANSThere are a number of guidelines which have been issued over time by various regulatory oversight bodies that could assist with the drafting of RRPs.
As mentioned earlier, the FSB’s Key Attributes Paper is a useful reference point on what a plan should contain. This paper states that:
Recovery plans should include:
1. credible options to cope with a range of scenarios including both idiosyncratic and market wide stress;
2. scenarios that address capital shortfalls and liquidity pressures; and
3. processes to ensure timely implementation of recovery options in a range of stress situations.
It also states that a resolution plan ‘should include a substantive resolution strategy agreed by top officials and an operational plan for its implementation…’
MILLIMAN RESEARCH REPORT
Recovery and Resolution Plans: Dealing with financial distress
14 DECEMBER 2016
Paragraph 2.1 of Annex 4 of the FSB’s Key Attributes Paper discusses the structure of RRPs. It states:
To support rapid execution, both recovery and resolution plans should include:
1. a high-level substantive summary of the key recovery and resolution strategies and an operational plan for implementation;
2. the strategic analysis that underlies the recovery and resolution strategies;
3. conditions for intervention, describing necessary and sufficient prerequisites for triggering the implementation of recovery or resolution actions;
4. concrete and practical options for recovery and resolution measures;
5. preparatory actions to ensure that the measures can be implemented effectively and in a timely manner;
6. details of any potential material impediments to an effective and timely execution of the plan; and
7. responsibilities for executing preparatory actions, triggering the implementation of the plan and the actual measures.
In addition, in October 2014, the FSB adopted additional guidance on the Key Attributes Paper, which included sector-specific guidance. Annex 2 of Appendix II of this guidance focuses on insurers, with Section 9 discussing recovery and resolution planning. This discusses how RRPs should be tailored to the specific situation of each company and how stress tests should be used as a means of identifying the impact of different risks, with a view to informing the (re)insures what the most material risks are and enabling them to develop strategies to mitigate such risks.
In June 2016, the FSB published guidance on Developing Effective Resolution Strategies and Plans for Systemically Important Insurers. The guidance sets out considerations for determining a preferred resolution approach based on a strategic analysis of insurers’ business models, the criticality of insurers’ functions, and policyholder protection arrangements. It also identifies a range of elements that need to be in place so that a resolution strategy can be credibly and feasibly implemented, including effective cross-border cooperation, information systems, and resources to absorb loss.
In August 2016, the FSB published further guidance on resolution planning in the form of ‘Guidance on Arrangements to Support Operational Continuity in Resolution,’ which outlines approaches to ensure that critical functions, such as IT infrastructure and software-related services, are maintained during resolution, and ‘Guiding Principles on the Temporary Funding Needed to Support the Orderly Resolution of a Global Systemically Important Bank (G-SIB),’ which aim to ensure that banks retain sufficient liquidity to maintain critical operations during resolution.
EBA publications also include guidelines on business reorganisation plans which specify that concrete performance indicators must be included in reorganisation plans, as well as other criteria for plans to be approved by resolution authorities.
Recovery and resolution planning is not a one-off exercise. Plans will need to be appropriate for the (re)insurer at all times reflecting the dynamics of the firm. The FSB’s Key Attributes Paper notes that:
Supervisory and resolution authorities should ensure that RRPs are updated regularly, at least annually or when there are material changes to a firm’s business or structure, and subject to regular reviews within the firm’s CMG [Crisis Management Group].
A number of regulatory guidelines, including the FSB Key Attributes Paper, call for companies to maintain Management Information Systems that are capable of producing information that may be required to implement any resolution strategies in a timely manner. Such information might include details of intra-group exposures, asset and liability exposures, and data that might be included in an information memorandum as part of a sale, such as number of policyholders, value of reserves, embedded value results, description of products sold, details on management structure, operating experience, etc.

MILLIMAN RESEARCH REPORT
Recovery and Resolution Plans: Dealing with financial distress
15 DECEMBER 2016
3 .4 . POSSIBLE RECOVERY AND RESOLUTION STRATEGIESThere are a number of different recovery strategies that (re)insurers could take depending on the nature and cause of their financial difficulty. Paragraph 9.7 of the Resolution of Insurers Annex of the FSB Key Attributes Paper lists actions such as:
1. actions to strengthen the capital situation, for example, recapitalisations after extraordinary losses, capital conservation measures such as suspension of dividends and payments of variable remuneration;
2. triggering of contingent capital instruments;
3. possible sales of subsidiaries, portfolios of insurance contracts, or spin-off of business units;
4. changes to the reinsurance programme;
5. changes to the investment strategy and hedging programme;
6. changes to business mix, sales volumes and product designs, including options to close books of business to new sales or business;
7. changes to underwriting and claims handling practices; and
8. modifications to contract terms and conditions, the level of charges, fees and surrender payments, the amount and timing of any discretionary benefits and the operation of discretionary incentives to renew contracts (such as ‘no-claims discounts’ or contract renewals without new underwriting).
We have grouped strategies into four broad segments: improving liquidity, raising capital, de-risking the balance sheet, and restructuring the company/group. Figure 4 lists some of the recovery strategies that fall into each of these four segments. In some cases, a strategy could fall into more than one segment. Where this happens, we include it in what we believe to be the most appropriate segment. Each of the strategies and segments are discussed further in Sections 4 to 7 of this paper.
FIGURE 4: RECOVERY STRATEGIES
In relation to resolution strategies, Paragraph 3.2 of the FSB Key Attributes Paper sets out a number of resolution powers that authorities should have at their disposal. These include the power to:
· Remove and replace senior management
· Appoint an administrator to manage the firm
· Transfer or sell assets and/or liabilities
· Effect the closure and wind-down of the company (or a part of the company)
Whilst these are strategies that would be pursued by the regulatory authorities, (re)insurers should be aware that they may be considered when resolution plans are being drafted. Furthermore, Paragraph 9.10 of the Resolution of Insurers Annex of the FSB Key Attributes Paper lists possible resolution measures, including identifying if policyholders are covered by a policyholder protection scheme, preparing for a portfolio transfer, and a consideration of different sources of funding. We discuss resolution measures further in Section 8.
ADDRESSING THE PROBLEM – RECOVERY MEASURES
RESTRUCTURE IMPROVE LIQUIDITY DE-RISK RAISE CAPITAL
· Portfolio transfer
· Closure
· Group restructure
· Other options
· VIF monetisation
· ILS (insurance-linked securities)
· Investment portfolio rebalancing
· Product structure
· Other options
· Reinsurance
· Capital markets
· Investment strategy
· Equity and debt
· Contingent capital
· Group finance
· Off-balance sheet

MILLIMAN RESEARCH REPORT
Recovery and Resolution Plans: Dealing with financial distress
16 DECEMBER 2016
3 .5 . CONSIDERATIONS WHEN CHOOSING A STRATEGYOften the solution to financial difficulty can depend on the nature of the cause(s). Therefore, companies should ideally have several different strategies outlined in their plans, with each one designed to address a different set of circumstances.
If possible, a company looking to enact its plan should trace back the causes of its financial difficulty and analyse the effects these events had on the company in order to determine which of the strategies set out in their plan need to be implemented, bearing in mind that separate short-, medium-, and long-term solutions may be required.
For example, if financial difficulty has been caused by very large claims leading to liquidity problems, then solutions may include seeking to extend loan or credit facilities, or issuing debt or equity capital in order to source the liquidity needed. These concepts are discussed in Section 4. The (re)insurer could also look to enter into a reinsurance treaty to mitigate the risk of additional large future claims. Likewise, improving asset-liability matching, improving underwriting, or repricing products might be longer-term solutions to the problem. These concepts are discussed further in Sections 6 and 7.
Of course, situations can arise where it is not possible to trace the precise causes of financial difficulty. There may also be circumstances where the cause of financial difficulty is known but there are a number of associated factors which mean that a single strategy in itself might not be sufficient. For example, if the main driver was some form of global economic crisis this might lead to falls in the value of investments, increased lapses, increased claims, and a drop in sales all at the same time. Therefore, several strategies might be taken consecutively. They might include raising additional capital to make up for any solvency issues arising from losses incurred, de-risking the balance sheet to reduce capital requirements when capital is scarce, redesign of products to prevent increased claims from anti-selection or to prevent lapses (for example, by introducing loyalty bonuses or surrender penalties on unit-linked business), and the implementation of reinsurance to cover the risk of increased claims costs.
An important factor to consider in designing RRPs is the specific circumstances of the company. This view is reinforced by Paragraph 9.2 of the Resolution of Insurers Annex of the FSB Key Attributes Paper. It says, ‘Recovery and resolution plans (RRPs) need to be tailored to the specific risks and systemic implications that each insurer...’
The following characteristics might determine what recovery options are most suitable for a (re)insurer:
· Type of business: Some actions may be more associated with or more appropriate for life or non-life business. For example, catastrophe bonds are more often used to cover non-life perils than life risks.
· Products: The products offered may make certain options more or less effective. For example, hedging will be more effective for a company that writes business with investment guarantees, e.g., variable annuity business, than for a company that does not offer such guarantees.
· Ownership structure: Companies that are subsidiaries of groups and which therefore only have one shareholder may be able to access capital or other forms of support from their parents, while listed companies might be able to issue more shares to the public (i.e., they have less reliance on a single source of capital).
· Nature of assets and liabilities: The nature of the company’s assets and liabilities will affect the strategies chosen within RRPs.
· Regulatory jurisdiction: As introduced in Section 2.2 above, certain options might be more effective in particular territories than others or they might only be permitted in certain territories. For example, in certain regimes off-balance-sheet items (‘ancillary own funds’) such as unpaid callable capital can be used to cover a portion of companies’ capital requirements.
· Credit history: A proven track record of repaying, borrowing or a strong credit rating might make it easier and less costly for a (re)insurer to borrow money or issue debt.
· Profitability: Profitable companies might be more attractive prospects for potential acquirers in a merger and acquisition or portfolio transfer situation.

MILLIMAN RESEARCH REPORT
Recovery and Resolution Plans: Dealing with financial distress
17 DECEMBER 2016
Before choosing a strategy, companies should consider the following aspects of possible solutions:
· Liquidity or solvency: Certain strategies may only be used for improving a company’s liquidity position or solvency position, while others can be used for either.
· Recovery or resolution: Certain strategies are more appropriate as measures to recover the company’s financial position, such as capital injections from the group, whereas others could be used as part of the resolution of a company, such as the write-down of debt or closure to new business.
· Time: Both the time required to implement a strategy and the time until the benefits of the strategy actually impact the company’s financial position are important considerations.
· Availability: Often, whether or not a company can pursue a particular strategy depends on the ability and willingness of third parties to provide capital, put in place reinsurance, act as counterparties, etc.
· Cost: The cost of a strategy, such as interest repayments on debt, is an important consideration, given that it could dampen the effect of the approach taken.
· Ease of implementation: Certain strategies involve complex legal, administrative, and operational processes, which can be difficult to co-ordinate and achieve, whilst others are much simpler to implement.
· Impact: The potential magnitude of the impact of a strategy is important. If a company is facing serious financial difficulties, then there is little value in pursuing measures that would not have sufficient impact on the company.
The diagram in Figure 5 illustrates the type of decision-making process a company may follow in deciding on a recovery strategy. We summarise the steps involved and the questions and considerations using a decision tree with the example of a company that, having considered all options and factors, ultimately decides that quota share reinsurance is the best strategy for dealing with its solvency issues. The idea is that a company would begin by identifying the type and cause of difficulty faced and then work from this point to identify its preferred strategy by considering the factors set out above. Clearly, this is a single example of a path that could be followed; (re)insurers would need to map out options and possible paths for different types of financial issues before deciding what course of action would be appropriate in different circumstances.
Once a company has investigated the course (or courses) of action it might take in the event of various adverse scenarios materialising in the future, and how they may be implemented, it can then determine a broad set of principles which it can apply to almost any situation. As solutions will inevitably need to be tailored to the exact circumstances giving rise to an adverse financial situation, a well-developed set of principles can prove invaluable in enabling an effective and coordinated response to be implemented within as short a time frame as possible.

MILLIMAN RESEARCH REPORT
Recovery and Resolution Plans: Dealing with financial distress
18 DECEMBER 2016
FIGURE 5: DECISION-MAKING TREE
Entry into�nancial di�culty(determine cause)
Analyse whether�nancial di�cultyis a liquidity orsolvency issue
Analyse whetherin recovery orresolution space
Decide on broadapproach that willlead to recovery
Choose strategy
Choose strategy
Implement strategyand iron out details
Choose strategy.Consider: availability,time, cost, complexity
Financialdi�culty
Liquidity
RecoveryResolution
......
RecoveryResolution
... De-riskRestructureRaise
capital
Underfunding
Productlines
Internalmodel
internalmodel Reinsurance
Quotashare
Excess ofloss
Otherreinsurance
Implement
Solvency
ALM/hedging
Longevitytransfer
Catbond/swap
TreatyFacultative

MILLIMAN RESEARCH REPORT
Recovery and Resolution Plans: Dealing with financial distress
19 DECEMBER 2016
3 .6 . MONITORINGHaving developed RRPs, (re)insurers will then need to monitor their solvency and liquidity positions in order to identify when such plans may need to be implemented. Therefore, the use of indicators to highlight when certain actions are required is an important step in embedding recovery and resolution planning within an organisation.
The executive summary of the EBA Report says that ‘…institutions should feature an appropriate set of quantitative and qualitative indicators that adequately reflect the size and complexity of the bank and allow a proper and regular monitoring of potential risks. In turn, the breach of indicators should signal a potential threat to the institution’s viability and indicate that recovery actions may be required.’
Many companies will already have risk indicators in place as part of their risk management and risk monitoring processes. For example, most (re)insurance companies will have risk appetite statements, with indicators that identify breaches of appetite and near misses. These indicators in themselves might not be appropriate for monitoring the need for the commencement of recovery actions. For example, in its risk appetite, a company might target a particular level of solvency coverage to maintain a buffer against adverse experience. A breach of such a target might not in itself be a trigger for the implementation of a recovery action, as the company could still be in a healthy solvency position, albeit slightly less healthy than it would like. It might, however, act as an early warning sign that there is potential for financial difficulty ahead. This early warning might be linked to some preparatory or remedial actions. For example, a company might begin to engage with reinsurers if claims experience is showing signs of deterioration so that, if there is a continuation of the trend, which ultimately requires the enactment of the RRPs, it will at least have begun the early steps in the process rather than starting from scratch. The breach of an early warning indicator might act as a signal for the insurer to pay closer attention to the metric in question, possibly with enhanced, or more frequent, monitoring.
The same metric (e.g., degree of solvency coverage) could then be used but with a different trigger level to signal the need for the implementation of recovery actions.
It will be important for several indicators to be used, to identify not only liquidity issues or solvency issues, but also to anticipate future financial distress. For example, if a company is writing business that is loss-making then this could be a sign that its pricing is flawed and that the company will ultimately face solvency issues. Likewise, a company that is writing small volumes of new business, or that is experiencing high lapse rates, might face trouble in covering its fixed expenses from a declining book, meaning it needs to put in place plans to address such a decline. Similarly, a company that writes guaranteed business might need to monitor interest rates to see if the guarantees it offers are still viable in times of declining interest rates.
An effective tool in identifying the possible causes and effects of financial difficulty is forward-looking stress/scenario testing. This is something that is noted in Paragraph 9.4 of the Resolution of Insurers Annex of the FSB Key Attributes Paper, which states that:
Recovery plans should be developed on the basis of severe stress scenarios that combine adverse systemic and idiosyncratic conditions.

MILLIMAN RESEARCH REPORT
Recovery and Resolution Plans: Dealing with financial distress
20 DECEMBER 2016
As mentioned in Section 2 above, the ORSA is becoming an international requirement for (re)insurance companies. The purpose of the ORSA is generally for an insurance company or group to consider all of the risks it faces with a forward-looking assessment of available capital and capital requirements under a range of stresses and scenarios. By examining several adverse stresses (e.g., high claims, poor investment performance, lower sales, higher lapses, operational risk losses, etc.) or combinations of such stresses (i.e., scenarios), the (re)insurer should get a good picture of the key risks that it faces and the possible impact of adverse events. This helps management to focus its attention on monitoring the most important risk drivers. It also helps it to put protection in place to mitigate the effects of such events. For example, an insurer that is heavily exposed to the risk of increases in claims costs could decide to implement a strategy of reinsurance, while an insurer that is exposed to market risks could mitigate these risks via hedging, better ALM, or the disposal of riskier assets such as equities. Under Solvency II and many other regimes, an annual report on the ORSA has to be submitted to local supervisors to help them understand the risks faced by each company under its supervision and highlight any reasons for concern.
In addition to the ORSA requirements, EIOPA has conducted several stress tests in recent years. These stress tests focus on the larger insurers in each country, with the stresses prescribed by EIOPA rather than at the discretion of the insurer. The Federal Reserve and EU-wide banking stress tests are further examples of stress test requirements. Like the ORSA, the idea of stress tests is to highlight areas of potential exposure, with the fact that the same stresses are applied to all companies that are in scope, enabling comparisons to be made between how different insurers are impacted by a particular risk.
3 .7 . GOVERNANCE CONSIDERATIONS FOR GROUPSThe above sections apply equally to individual (re)insurers and to groups. In addition, from a group perspective, RRPs will need to consider not only the group as a whole but also any subsidiaries within the group. The executive summary of the EBA Report noted that:
The main area for improvement was the limited involvement of local management in developing and updating the group plan, and—consequently—the need for more detail on the steps taken to ensure the coordination of actions at the group and local levels.
In devising any plan, the group will need to consider how capable a subsidiary is of implementing the recovery plans devised for it by the group. Furthermore, the group will need to have a holistic view of the state of all subsidiaries as part of its monitoring of the need to implement plans.
Likewise, any plans within subsidiaries will need to be cognisant of the plan for the group as a whole. A group may have decided that there are certain subsidiaries that are not core to the group’s strategy. It might be happy to support them if they are performing well, but in times of financial difficulty it may look to sever ties and sell them to another party. Therefore, the subsidiary’s recovery plan should not be based solely around reliance on capital support from the group.

MILLIMAN RESEARCH REPORT
Recovery and Resolution Plans: Dealing with financial distress
21 DECEMBER 2016
4. Recovery strategies: improving liquidity4 .1 . INTRODUCTIONThe U.S. Federal Reserve defines liquidity as follows:5
Liquidity is a financial institution’s capacity to meet its cash and collateral obligations without incurring unacceptable losses.
This definition is broader than other definitions of liquidity risk, such as the following definition under the Solvency II Directive in Europe:
Liquidity risk means the risk that insurance and reinsurance undertakings are unable to realise investments and other assets in order to settle their financial obligations when they fall due.
This section focuses on strategies to improve a company’s liquidity in the broader sense, i.e., including cases where companies can only meet their liabilities as they fall due by incurring unacceptable losses.
Insurance companies could face liquidity issues for a number of reasons. For example, the need to source cash in order to post collateral under certain reinsurance or hedging arrangements can be a major source of liquidity risk for insurers.
Insurance companies could also face liquidity issues that are due to large claims, for example as a result of a catastrophe, or that are due to inappropriate investments. While reinsurance may be used to cover a portion of large claims, the insurer would still be liable for its share of the claims and there would also most likely be a timing issue between claims payment and receipt of reinsurance recoveries, leading to liquidity strain. Mass surrenders could be considered the insurance equivalent of a ‘run on the bank,’ leading to liquidity issues, where a loss of confidence in the company or reputational damage leads to the company having to pay out large amounts of guaranteed surrender values to policyholders.
The investment strategy of (re)insurance companies can also be a source of liquidity risk. Investing directly in illiquid assets such as property (real estate) can result in the company having insufficient cash flows to meet liabilities as they fall due, if the company has not properly matched its asset cash flows to its liability cash flows. ALM is one obvious tool open to (re)insurance companies in order to mitigate the risk of this situation arising. ALM is discussed further in Section 6.3.1. Liquidity strain also typically arises because of the structure of certain insurance products, such as regular premium life business, where there may be a large up-front initial commission payment to intermediaries.
Of course, a liquidity crisis for a company can turn into a solvency crisis. For example, divesting assets from relatively high-yielding but riskier, illiquid assets, such as property, and moving the investments into cash or bonds will reduce the expected returns for the company, which could also lead to solvency issues if this outweighs the reduction to the company’s capital requirements in risk-based regulatory regimes, such as Solvency II. In addition, focussing attention on the liquidity of the company and making changes in order to correct it could reduce the company’s future growth, again possibly affecting solvency. Companies should therefore give due consideration to recovery measures to improve liquidity in order to ensure that recovery actions minimise the risk of creating a solvency issue.
In Ireland, the banking crisis in 2008 saw the regulator misdiagnose solvency issues as liquidity issues. The reliance of Irish banks on wholesale funding from international markets meant that, with the tightening of liquidity, Irish banks faced a shortfall in funds. However, given the loan portfolios of Irish banks, the underlying issues were in fact of a solvency nature, and failure to recognise that meant that the focus from August 2007 (when indications of an international crisis came to light) was on improving liquidity and not on building capital buffers.6 This stresses the importance of not only effectively dealing with liquidity issues, but also correctly diagnosing financial difficulties before devising a strategy to address the problem.
5 U .S . Federal Reserve (11 May 2016) . Supervisory Policy and Guidance Topics: Liquidity Risk Management . Banking Information and Regulation . Retrieved 25 October 2016 from https://www.federalreserve.gov/bankinforeg/topics/liquidity_risk.htm .
6 Honohan (2010) . The Irish Banking Crisis Regulatory and Financial Stability Policy 2003-2008 .

MILLIMAN RESEARCH REPORT
Recovery and Resolution Plans: Dealing with financial distress
22 DECEMBER 2016
4 .2 . VIF MONETISATIONValue of in-force (VIF) is the term often given to the economic value of future profits associated with an in-force book of business. VIF monetisation involves realising a portion of this value as an up-front payment from a third party in exchange for a share of this expected future profit stream as it emerges. The benefits of VIF monetisation for an insurance company are that liquidity can be boosted by an up-front payment, with the secondary benefit that the insurer may transfer some of the risk associated with future profits to the third party involved in the transaction. Such arrangements can have a significant impact on a company’s liquidity position and risk profile, depending on the size of the monetised block of business and the terms available.
The impact of VIF monetisation on the regulatory balance sheet depends on the prevailing regulatory regime. For example, in jurisdictions such as the United States and Japan, the current solvency regime does not allow for credit to be taken on the regulatory balance sheet for the expected future profits of the business. Therefore, moving the VIF onto the balance sheet through a VIF monetisation arrangement could significantly improve the company’s solvency position. Under Europe’s Solvency II, on the other hand, the VIF is already included as an asset on the regulatory balance sheet (Tier 1 own funds) and the implementation of a VIF monetisation arrangement may require the establishment of a contingent liability. Therefore, VIF monetisation may not significantly improve the company’s regulatory capital position. However, the capital requirements under Solvency II may reduce following such a transaction, given the risk transfer involved. In any case, regardless of the impact on the solvency position of the company, the liquidity position will always be improved through VIF monetisation where the transaction is structured as an up-front payment to the company in exchange for future uncertain cash flows.
The degree of availability of VIF monetisation generally depends on the reputation and stability of the insurance market involved, as well as the size of the transaction. There is generally good availability of counterparties for VIF monetisation deals in markets or companies with, for example, stable lapse rates and good distribution practices, for transactions greater than EUR 100 million.
In terms of the time required to structure and implement a VIF monetisation transaction, negotiating directly with a reinsurer would normally be quicker than with a consortium, where risks and financing is split between the parties. The actuarial valuations and the contractual and legal sides are the main stages of the process, which can take anything from a number of months and up to a year for more complex transactions.
The cost of a VIF monetisation transaction depends on the complexity of the structure but would typically include the initial actuarial, accounting, and legal consultants’ fees involved in executing the transaction, as well as the more minor ongoing cost of the regular reporting to the counterparty. The cost of this type of funding to the counterparty is usually through the implied discount rate in arriving at the up-front value of the deal.
Many VIF monetisation transactions involving reinsurers took place in Spain and Portugal throughout 2012 and 2013 in the second wave of the financial crisis. The following case study gives some background and outlines the details of these types of transactions.

MILLIMAN RESEARCH REPORT
Recovery and Resolution Plans: Dealing with financial distress
23 DECEMBER 2016
CASE STUDY: VIF MONETISATION IN SPAIN AND PORTUGAL
Spanish banks were already looking at alternative sources of financing by June 2012, when Spain finally reached the point of having to ask the EU for a bail-out of its banking system. At this time, the risk premium above German bonds on 10-year Spanish government bonds was in excess of 500 basis points, ratings were down to BBB, and unemployment had surged to almost 25%. In addition, as part of the financial assistance measures approved by the Eurogroup7 in July 2012, banks had to formulate recapitalisation and restructuring plans, and execute them by June 2013.
One of the many solutions used by the largest banks was to monetise the significant amount of future profits that were expected to emerge from large life risk protection portfolios of their bancassurance subsidiaries.
In July 2012, Santander was the first bank in Spain to announce that it had entered into an agreement to monetise its life risk protection portfolios in Spain and Portugal, with a consortium structure led by Deutsche Bank and its recently sold insurance affiliate Abbey Life. Although the proceeds totalled EUR 490 million,8 Santander went further with its objective to unlock the value of its insurance business by selling 51% of its future life risk protection and P&C businesses to AEGON, through a joint venture arrangement in 2012 in Spain and in 2014 in Portugal. In addition, in 2014 CNP Assurances announced the purchase of 51% of Santander Consumer Finance’s life and non-life insurance subsidiaries, covering 10 European countries.
In November 2012, CaixaBank reached an agreement with Berkshire Hathaway, which involved two main transactions relating to its fully owned life insurance subsidiary, VidaCaixa. The first was the monetisation of VidaCaixa’s life risk protection portfolio via a reinsurance structure releasing proceeds of EUR 600 million. The second was the effective purchase by VidaCaixa of an asset, again by way of a reinsurance structure from Berkshire Hathaway, that guaranteed the following 10 years of annuity payments on a given annuity book. The outlay for this annuity treaty was EUR 597 million, meaning that the net cash outlay for both parties was almost zero. The agreement released assets underlying the annuity portfolio that were high-quality liquid assets, and also led to profit recognition of EUR 524 million.
FIGURE 6: MAIN VIF MONETISATIONS IN SPAIN AND PORTUGAL
In March 2013, SCOR reached an agreement to monetise BBVA Seguros’s life risk protection portfolio via a 90% quota share reinsurance structure for EUR 630 million that also included a profit-sharing mechanism for the additional 10%.
In June 2013, Portuguese bank NovoBanco (formerly, Banco Espirito Santo) monetised the life risk protection portfolio of its bancassurance subsidiary via a reinsurance structure with Munich Re, which increased the bank’s Core Tier 1 capital ratio by 40 basis points. In the same year, Munich Re closed a similar, but smaller, transaction with Spain’s KutxaBank, for which the consideration was in the order of EUR 40 million.
7 The Eurogroup is an informal body of ministers of the euro area member states who discuss matters regarding their shared responsibilities related to the euro .
8 Santander (19 July 2012) . Santander signs a reinsurance agreement with Abbey Life Assurance Ltd, a unit of Deutsche Bank AG, for its life risk insurance portfolio in Spain and Portugal . Press release . Retrieved 25 October 2016 from http://www.santander.com/csgs/Satellite/CFWCSancomQP01/en_GB/Corporate/Press-Room/no-sc-np-190712_en_GB.html.
% MONETISED SIZE SCOPE ANNOUNCED
SANTANDER / DEUTSCHEBANK & ABBEY LIFE
100% €490M SPAIN & PORTUGAL JUL 2012
CAIXABANK / BERKSHIREHATHAWAY
100% €600M SPAIN NOV 2012
BBVA / SCOR 90% €630M SPAIN MAR 2013
NOVOBANCO / MUNICH RE 100% 40BP CT1 PORTUGAL JUN 2013

MILLIMAN RESEARCH REPORT
Recovery and Resolution Plans: Dealing with financial distress
24 DECEMBER 2016
CASE STUDY: VIF MONETISATION IN SPAIN AND PORTUGAL (CONTINUED)
In most cases, the monetisations were effected through a reinsurance treaty, except in the case of Santander, where the structure was more complex. In Figure 7 we set out a simplified structure for a VIF monetisation. Reserves, future premiums, and future claims were swapped with the reinsurer in exchange for an up-front reinsurance commission.
FIGURE 7: SIMPLIFIED STRUCTURE OF BANCASSURANCE PORTFOLIO VIF MONETISATION USING A REINSURANCE TREATY
The reinsurance commission effectively brought the present value of future profits onto the insurer’s accounting balance sheet that could be used by the bank as capital, and in some cases could be used to “dividend up” to the parent bank. In all cases, the respective regulators were very clear that the recognition of such additional value could only occur in the case that the up-front commission was irrevocable, the structure involved a real and symmetric transfer of all the risks in the portfolio, and contingent repayments were not present.
These VIF monetisations were feasible for the resolution of funding /capital requirements that are due to:
· Material impact. The size of the value in the insurance portfolios was large enough to make a material impact on bank capital.
· Ease of execution and implementation. The ability to effect the transaction via a reinsurance treaty allowed the transaction to complete in a markedly shorter time frame compared with a sale process and also at a lower cost.
· Operational efficiency. The operational impacts of the transaction were manageable, especially because all the administration of the business remained with the banks.
· Acceptable cost of funding. The cost of funding (implied discount rate) was favourable and acceptable compared with going to the capital markets for funding during the banking crisis. Solution providers also had access to capital at a cheaper price than the banks.
· Little impact on customer. The banks maintained their relationships with and administration of their own clients.
The foremost objective of the transactions was capital creation at the bank level. Collateral arrangements were an important factor in most transactions in order to keep counterparty risks manageable, resulting in reasonable prices at which both parties could agree to transact. These arrangements affected the impact of the VIF monetisation structures on the banks’ capital ratios. For example, in a simplified structure where the reinsurance commission resulted in a significant cash outlay, the amount of collateral required from the bank was a significant portion of that outlay; meaning that there was a trade-off between the capital created from the reinsurance commission and the risk weighting attached to the assets supporting the collateral.
The transactions were effected in a pre-Solvency II context and structured to maximise the final impact on capital creation at the bank level.
Bancassurer
REINSURANCE COMMISSIONGUARANTEES & COVENANTS
RESERVES
DIVIDEND
COLLATERAL One-o� �ows
Impacts onbank capital
Regular �owsCOLLATERAL RUN-OFF
PREMIUMSLESS CLAIMS
Bank
Reinsuranceentity
MILLIMAN RESEARCH REPORT
Recovery and Resolution Plans: Dealing with financial distress
25 DECEMBER 2016
4 .3 . FINANCIAL REINSURANCEFinancial Reinsurance (Fin Re) typically involves an insurer transferring the risks on its balance sheet to a reinsurer and receiving an up-front commission in return for future payments, which are typically related to the insurer’s future profits. Fin Re is similar to VIF monetisation; however, the degree of risk transfer achieved can be lower under Fin Re deals, depending on the terms of the transaction.
The receipt of up-front reinsurance commissions, however, should lead to an improvement in the insurer’s liquidity position. It may also increase available assets (capital) if the prevailing regulatory regime is prudent and does not allow for the present value of future profits to be counted as negative technical provisions. However, while it is possible that Fin Re may slightly reduce capital requirements under risk-based regimes, the primary impact is likely to be an improvement to the company’s liquidity position.
4 .4 . SECURITISATIONA securitisation typically involves packaging the future profits on a block of life insurance business into a marketable security, which can be issued to capital market investors. This raises capital for the insurance company and enables the company to transfer risk to investors, while at the same time often providing valuable diversification to investors’ portfolios. However, a securitisation can be a complex mechanism and there are many costs involved in terms of the legal, administrative, and operational requirements accompanying such an instrument. There are many practical considerations involved which can make the implementation process more complex and time-consuming. For example, a securitisation generally requires the creation of a vehicle such as a special purpose vehicle (SPV), which in turn requires a credit rating. Therefore, there can be a lengthy process with rating agencies in order to determine the vehicle’s credit rating (further details on obtaining a credit rating are outlined in Section 4.6). Nonetheless, companies may choose this type of VIF monetisation, as it gives the company access to the capital markets rather than just relying on individual reinsurers.
The following case study focuses on quite an innovative and complex life insurance securitisation. It was particularly beneficial for the company as a pre-emptive measure in light of the dramatic financial turmoil, which would not fully hit the insurer’s banking parent until a year after the transaction.
CASE STUDY: NEW IRELAND SECURITISATIONBank of Ireland’s EUR 400 million securitisation of a portion of its life insurance subsidiary, New Ireland Assurance, in October 2007 was highly complex. The bank is one of the largest in Ireland and it owns the country’s second-largest life insurer based on new business9 market share. The bank ultimately required a government bail-out of EUR 4.7 billion during the global financial crisis, but the securitisation of a segment of its life insurance subsidiary a year prior to the onset of the crisis helped bolster the bank’s capital position and in that sense acted as a pre-emptive measure. In October 2007, before the public became aware of any signs of financial distress in the Irish banks, Bank of Ireland wished to increase its Tier 1 capital and did so by capitalising the International Financial Reporting Standards (IFRS) VIF underlying its unit-linked insurance business, as it was not possible to take credit for this on its regulatory balance sheet. The bank issued a EUR 400 million securitisation to investors. Ambac Assurance, a guarantor of public finance and structured finance obligations, provided a wrapper covering EUR 380 million, which was rated AAA, and the balance of EUR 20 million was rated A-.10 This was an innovative securitisation for many reasons. It was a public, Euro-denominated securitisation and it included new business. The layering in of new business (under defined criteria) meant that the term of the securitisation was increased, thus providing investors with a more attractive investment.
9 As at 31 December 2015 . Source: Bank of Ireland Group Annual Report 2015 .
10 The Actuarial Profession Current Issues in Life Assurance Seminar (30 May 2008) .

MILLIMAN RESEARCH REPORT
Recovery and Resolution Plans: Dealing with financial distress
26 DECEMBER 2016
CASE STUDY: NEW IRELAND SECURITISATION (CONTINUED)The structure prevented dividends from being paid by the bank if the securitisation repayments were not made because surplus did not emerge (thereby effectively using the non-securitised life business to also provide a guarantee for the securitisation) and it was “index-based.” The index-based feature meant that New Ireland’s emerging surplus acted as a trigger for repayments from the bank to investors, but New Ireland was not required to pass this surplus to the bank—the repayments could be made by the bank itself. Hence this securitisation successfully increased the bank’s Tier 1 regulatory capital without affecting New Ireland’s liquidity position.
Securitisation can be used to boost a company’s capital or liquidity position, as it provides an up-front payment in exchange for future profits expected from an insurance portfolio. The counterparties involved in a securitisation normally include investment banks, legal advisors, actuarial consultants, tax and accountancy consultants, and rating agencies. In addition, for securitisations such as that issued by New Ireland, where the note was ‘wrapped up’ to AAA, a mono-line insurer covering the default risk on the securities (Ambac in this case) would be involved and due diligence would be needed on this counterparty.
A somewhat similar mechanism for improving liquidity is a contingent loan. Contingent loan structures typically involve borrowing funds from a third party with interest and principal repayments that are contingent on surpluses emerging on a defined block of business. Such arrangements therefore provide a buffer for the company against adverse experience and hence may improve their capital and liquidity positions in times of financial difficulty.
4 .5 . INVESTMENT PORTFOLIO REBALANCINGCompanies which have surplus assets (i.e., excess assets available after meeting liabilities and capital requirements) could sell some assets in order to generate cash to cover liquidity needs. Rebalancing the investment portfolio in order to ensure sufficient funds are available in cash or other liquid assets can be a ‘quick fix’ to short-term liquidity strain. An important consideration, however, is that assets such as government bonds and exchange-traded equities should be relatively easy and quick to sell, whereas selling corporate bonds and over-the-counter (OTC) equities at short notice may result in the company accepting lower prices.
Asset classes such as property, on the other hand, may take more time to sell and may not be as effective in terms of improving liquidity in the short term. Property is typically regarded as an illiquid asset class, especially where a company has direct holdings, as it can take time to find a buyer, to agree a price, and to complete all of the required legal and administrative procedures. A key issue with liquidating equity is that, because of the high-risk/high-return nature of this asset class, the market prices of such instruments can be very volatile and there is a risk that the values may be low at the time when the company is facing liquidity issues.
While direct property holdings are probably not the most common asset class for investment of (re)insurance shareholder funds, the following example illustrates the issues which can arise in terms of fluctuations in market values, when rebalancing an investment portfolio in order to improve liquidity.

MILLIMAN RESEARCH REPORT
Recovery and Resolution Plans: Dealing with financial distress
27 DECEMBER 2016
There have been many significant property market crashes across the globe throughout history. For example, both Denmark’s and Spain’s property bubbles burst in 2008, and, of course, the role of the U.S. property market crash in the global financial crisis in 2008 is well chronicled. However, one of the starkest examples, where property prices fell by staggering amounts in a very short period of time, occurred in Ireland around the time of the global financial crisis. The Irish Residential Property Price Index fell by 28% from November 2007 to November 2009, which compares, for example, with a fall of 13% in the U.S. House Price Index over the two-year period from September 2007 to September 200911 and a fall of 17% in Denmark over a similar period of time.12 The scale of the Irish property collapse is more reminiscent of the bursting of the Japanese property bubble in the 1980s.
Figure 8 illustrates statistical data from the Central Statistics Office in Ireland in relation to the Residential Property Price Index (up to June 2016). It shows the peaks and troughs experienced in the Irish property market over the last 10 years, including the increases before, and decline after, Ireland’s property crash. Of course, commercial property prices have different characteristics to residential prices. However, as illustrated in the European Central Bank (ECB) paper on ‘Experimental Indicators of Commercial Property Prices,’13 the movement of residential property prices can also be used to estimate the pattern of commercial price movements. Clearly, companies wishing to liquidate property investments in order to improve liquidity can face challenges if the liquidity problems arise at a time when credit is tight and property values are depressed. In addition, ‘fire sales,’ whereby assets are sold at a substantial discount, can weaken the company’s solvency position and have knock-on impacts on other organisations and a whole economy.
FIGURE 8: IRISH RESIDENTIAL PROPERTY PRICE INDEX14
Sometimes it can be a positive move for a company to divest from positions that are not core to their strategies, such as property holdings. Therefore, selling property could be a longer-term solution in order to reduce liquidity risk in future. However, as mentioned above, this may not be a ‘quick fix’ for a company facing a liquidity crisis. Another example of selling non-core investments is that of the U.S. insurer Conseco, which is covered in the case study.
11 Federal Housing Finance Agency (21 July 2016) . FHFA House Price Index up 0 .2 percent in May . News release . Retrieved 26 October 2016 from http://www.fhfa.gov/AboutUs/Reports/ReportDocuments/MonthlyHPI72116.pdf .
12 Trading Economics (2016) . Denmark House Price Index . Retrieved 26 October 2016 from http://www.tradingeconomics.com/denmark/housing-index .
13 ECB Monthly Bulletin (February 2014) . Experimental indicators of commercial property prices . Retrieved 26 October 2016 from https://www.ecb.europa.eu/pub/pdf/other/mb201402_focus07.en.pdf .
14 Data from the Irish Central Statistics Office .
0
20
40
60
80
100
120
140
Residential Property Price Index (Base Jan 2005 = 100)Ireland (National - all residential properties)
Jan
05
Jun
05
Nov
05
Apr
06
Sep
06
Feb
07
Jul 0
7D
ec 0
7M
ay 0
8O
ct 0
8M
ar 0
9A
ug 0
9Ja
n 10
Jun
10N
ov 1
0A
pr 1
1S
ep 1
1Fe
b 12
Jul 1
2D
ec 1
2M
ay 1
3O
ct 1
3M
ar 1
4A
ug 1
4Ja
n 15
Jun
15N
ov 1
5A
pr 1
6

MILLIMAN RESEARCH REPORT
Recovery and Resolution Plans: Dealing with financial distress
28 DECEMBER 2016
CASE STUDY: CONSECOCNO Financial Group (formerly known as Conseco) is a U.S.-based financial services holding company that was founded as a life insurance company in 1979.
Over the course of 20 years, Conseco grew rapidly through debt-fuelled acquisitions; some involving forays into non-insurance sectors. One example was the purchase in 1998 of Green Tree Financial, a subprime mortgage lender. In December 2002, the company filed for Chapter 11 bankruptcy, becoming the third-largest bankruptcy in U.S. history at the time when measured by assets.
As part of its attempts to escape financial difficulty, Conseco engaged in the sale of a number of non-core assets, including selling its 29% stake in a riverboat casino for USD 260 million and selling some artwork from its executive offices (albeit at a recognised loss). The company also sold Conseco Variable Annuity Insurance Company to Inviva in 2002. In 2003, Conseco, together with other parties, sold the General Motors Building in New York City for USD 1.4 billion. Later that year, Conseco agreed to sell Conseco Finance (previously known as Green Tree Financial) for USD 1.01 billion.
In October 2003, Conseco emerged from Chapter 11 bankruptcy. Conseco’s debt and preferred securities obligations were cut by approximately USD 5.2 billion, with a combination of common stock, preferred stock, and warrants issued to the company’s pre-bankruptcy creditors. William J. Shea, Conseco’s president and CEO, said, ‘We are very pleased to announce that Conseco has emerged from bankruptcy court protection as a financially stable company now totally focused on the insurance business.’15 In 2010, it rebranded itself as CNO Financial. It has since rebounded and is among the largest 700 U.S. companies by revenue.
KEY POINTS IN CNO’S TURNAROUND16
CNO has divested underperforming and riskier (‘legacy’) books of business. For example, in 2008, it disposed of Conseco Senior Health Insurance. It retained profitable segments (Bankers Life, Washington National, Colonial Penn) with a primarily middle-income customer base, as opposed to Conseco’s original focus on the low-income demographic.
Even among the retained segments, gains were made through consolidation and unified underwriting, administration, and marketing efforts.
In terms of financial discipline, CNO has strengthened its capital position and improved the consistency of its earnings. Management worked hard towards the goal of achieving investment-grade status, which would be expected to allow for cheaper cost of debt financing. As at October 2016, all companies were at an investment-grade credit rating (S&P BBB+ and Moody’s Baa1).
The company has also engaged in ‘shareholder friendly’ behaviour such as splitting out ‘legacy’ or ‘noncore’ business performance from the profitable core in financial reporting, as well as implementing share buybacks.
15 LTC Consultants (2003) . Conseco Emerges From Bankruptcy .
16 Jared Council (2014) . How CNO returned from the brink .

MILLIMAN RESEARCH REPORT
Recovery and Resolution Plans: Dealing with financial distress
29 DECEMBER 2016
While liquidity may not be a problem facing a company now, its financial projections, or ORSA, as discussed in Sections 2 and 3 above, could bring to light a liquidity problem that is expected to arise, such as a large outflow in a particular month. Companies could pre-empt such problems by selling illiquid assets ahead of this point so that cash will be available when it is needed. Indeed, sale proceeds could be invested in bonds of appropriate duration in order to generate some yield for the company in the interim period, noting of course the challenges that currently exist in relation to the prevailing low interest rate environment.
There can be second-order impacts of selling assets, such as property and unlisted or private equity holdings, in order to improve liquidity. For example, the company will generally have to accept a lower yield if it moves investments into less risky assets such as cash and bonds. In addition, the diversification benefits of having investments in a variety of asset classes will be reduced. However, under Solvency II and other risk-based regimes, the capital requirements for less risky asset classes are generally lower and so, overall, they should reduce following the changes to investment strategy, all other things being equal. Section 6 discusses these concepts in more detail.
In summary, rebalancing the company’s investment portfolio by moving into more liquid asset classes, or selling assets that are not core to the company’s strategy, can work well in order to improve the company’s liquidity position. However, a longer-term solution is normally needed which incorporates a well thought out asset liability matching strategy that is regularly monitored and rebalanced. Selling relatively illiquid types of assets, such as property, in order to raise cash can be perilous, depending on the circumstances, and relying on this route should be considered with caution and only as a last resort. Finally, transaction costs and the risk of realising losses when selling assets should be taken into consideration when deciding on a possible strategy.
4 .6 . DEBT FINANCINGDebt financing involves receiving loans from banks or other lenders. The company is obliged to pay interest in exchange for the loan, which must be repaid under specified terms and conditions. The main advantages of debt financing are that the company receives an injection of funding which does not need to be repaid until a later date and can be used to ease liquidity pressure or to fund the growth of the company. In addition, there is no loss of ownership and the pattern of repayments is known in advance (as long as there are no early repayment or conversion options). The main drawback is the cost of debt financing in terms of the company’s obligation to pay instalments at specified points in time. Although the current low interest rate environment would typically provide favourable rates at present, interest repayments can be costly in the longer term and there is a risk of their rising, given that floating rate notes would normally be issued. It would, however, be possible to hedge this risk using an interest rate swap. In addition, having too much debt on the balance sheet can affect the company’s perceived financial strength, which in turn can affect the cost of financing and the ability to raise equity finance in future. Obtaining a loan would be a quick and straightforward approach if additional funding were needed.
An alternative to obtaining a loan from a bank or other lending institution is to raise debt finance by issuing bonds in the capital markets. There are some additional considerations with this type of finance. Firstly, a company will most likely need to obtain a credit rating if it wishes to issue debt securities to the capital markets. The main rating agencies are Standard and Poor’s (S&P), Moody’s, and Fitch. Rating agencies typically charge a fee in order to provide a credit rating for either an issuer or a debt security and there is typically a short-term (less than one year) and long-term (more than one year) rating provided. According to S&P Global Ratings U.S. Ratings Fees Disclosure (January 2016),17 the cost of obtaining a transaction for companies is up to 6.25 basis points for most transactions, subject to a minimum fee of USD 100,000. The fees increase for more complex transactions. Multi-year ratings service arrangements are also available. In addition, the process of obtaining a credit rating will require company resources to be available in order to prepare material for the rating agency to analyse and liaise with their requests for information. The diagram in Figure 9 illustrates how to obtain a rating from Moody’s.18
17 S&P (January 2016) . S&P Global Ratings U .S . Ratings Fee Disclosure . Retrieved 26 October 2016 from http://www.standardandpoors.com/usratingsfees .
18 Moody’s (2016) . How to Get Rated . Retrieved 26 October 2016 from https://www.moodys.com/Pages/amr002001.aspx .

MILLIMAN RESEARCH REPORT
Recovery and Resolution Plans: Dealing with financial distress
30 DECEMBER 2016
FIGURE 9: MOODY’S RATING PROCESS
It is worth noting that there are a variety of types of debt securities which can be issued to capital markets, including ‘callable’ bonds, whereby the company can repay the loan to the bondholder before the maturity date. In addition, ‘perpetual’ bonds can be issued which have no maturity date. An example of this would be Aegon N.V.’s 6.50% perpetual, callable bond.19 The company should consider the pros and cons of a variety of different instruments if issuing debt.
4 .7 . PRODUCT RESTRUCTURINGLiquidity strain may arise because of the structure of certain insurance products, such as regular premium life business, where there may be a large up-front initial commission payment to intermediaries. Companies could improve liquidity by reducing the amount of up-front initial commissions and increasing renewal commissions. However, this may reduce new business volumes if intermediaries are receiving more favourable commission levels from competitors. Other examples of changes to product structure would be reducing allocation rates20 or introducing up-front charges on unit-linked products, which would improve liquidity. However, the commercial implications of such a change would have to be taken into account.
The process of changing the product structure for new business requires company resources in order to redesign and test the impact of any changes. This will take time and the company will also incur the cost of implementing such changes with respect to systems, etc.
Other options related to product structure that might be more beneficial from a solvency perspective in the medium to long term (e.g., repricing products) are discussed in Section 7.3.
19 Aegon (29 April 2015) . Capital Securities . Investors and Media . Retrieved 26 October 2016 from http://www.aegon.com/en/Home/Investors/Managing-capital/Debt-Programs/Capital-Securities/ .
20 The allocation rate represents the amount of the premium that is actually invested on behalf of the policyholder .
Rating Application:Issuer requests and signsrating application .
Analytical Team Assigned:Issuer is assignedLead analyst .
Collection of Information:Lead analyst assembles relevant information from available sources .
Rating Notification:Issuer is notified of therating committee decision .
Rating Dissemination:Credit ratings are communicated to the general public (for public ratings) .
Surveillance:Moody’s monitors the credit rating on an ongoing basis, if appropriate .
Rating Committee:Rating committee convenes to consider credit rating recommendation .
Analysis: Analysts review and evaluate relevant information and apply appropriate credit rating methodology .
Interaction with Issuer:Analytical team and Issuer, or agent of the Issuer, conduct discussions .
3
9
4
2
8
5
1
7
6
MILLIMAN RESEARCH REPORT
Recovery and Resolution Plans: Dealing with financial distress
31 DECEMBER 2016
4 .8 . OTHER MEASURESThis section outlines a number of other, more minor, measures which could be used to improve liquidity if a company is experiencing extreme difficulty in this area. They are unlikely to have large impacts on their own.
Clearly, the suspension of dividends is likely to be one of the first measures a company facing financial problems would take, while other steps are taken in order to improve its liquidity and/or solvency position.
Alternatively, the company could contact credit institutions, such as banks, or possibly the parent company if operating within a group, to arrange an overdraft or loan facility. If the company has a good credit history, then accessing this kind of finance should not be an issue. A short-term loan can be a better option in terms of lowering the cost of finance, although it may be more difficult to access. Ideally, if such credit facilities can be arranged before any liquidity issues arise, the company should find it easier to utilise them when needed.
The company could try to convert receivables into cash. This could entail following up with debtors who are late making payments, or sending reminders to debtors who are approaching their deadlines. Good management of receivables should be a quick, easy-to-implement, and relatively cost-free way to manage liquidity issues. Another option is to convert receivables into cash by entering into a ‘factoring’ arrangement. This is where a third party will pay a company up-front for its receivables, which the third party receives as they are paid.
The company may be able to contact its creditors and request a credit extension if, for example, the company is owned by a large multinational that could use its influence and purchasing power to request an extension for the subsidiary. It is unlikely that this option would be available in any other circumstances, as creditors may demand payment if contacted about the company’s difficulties in meeting payments. In addition, the impact of such measures would not likely be sufficient in themselves to recover from liquidity difficulties. A larger liability for companies can be to reinsurers, if reinsurance is in place. Setting up a funds withheld arrangement, as discussed in Section 6.2.1, could be more effective in reducing the need to settle this liability immediately, thereby improving the company’s liquidity position.
Under the extreme scenario where a company is unable to meet its payment obligations, it may be possible in certain jurisdictions to seek court protection from creditors in order to delay repayments, until the company has had time to reorganise and prepare a plan to improve its financial position. For example, in the United States, a company can file for a ‘Chapter 11’ bankruptcy, which allows it to keep possession of its assets while it undergoes a reorganisation.21 Insurance companies are not entitled to file for a Chapter 11 bankruptcy but their holding companies may do so. This was the approach taken by Conseco, Inc., the holding company for the Conseco insurance companies in the United States, which filed for a Chapter 11 bankruptcy in 2002.22 Conseco emerged from bankruptcy in late 2003 as a new company with approximately USD 5.2 billion of its debt cancelled and with new shares and warrants issued and distributed to the company’s creditors.23 Further information on the Conseco case study may be found in Section 4.5 above. Seeking court protection from creditors may be a form of extreme recovery, whereby the company continues as a going concern but some or all of its ownership may be transferred to its creditors, as was the case with Conseco.
21 U .S . Courts . Chapter 11 - Bankruptcy Basics . Services and Forms . Retrieved 26 October 2016 from http://www.uscourts.gov/services-forms/bankruptcy/bankruptcy-basics/chapter-11-bankruptcy-basics .
22 Gilpin, K .N . (18 December 2002) . Conseco files for Chapter 11 . New York Times . Retrieved 26 October 2016 from http://www.nytimes.com/2002/12/18/business/18CND-CONS.html .
23 CNO Financial Group (9 September 2003) . Conseco, Inc . announces confirmation of plan of reorganization . Press release . Retrieved 26 October 2016 from http://cno.mediaroom.com/press-releases?item=33 .

MILLIMAN RESEARCH REPORT
Recovery and Resolution Plans: Dealing with financial distress
32 DECEMBER 2016
5. Recovery strategies: raising capital5 .1 . INTRODUCTIONWhen a firm is having difficulties meeting solvency capital requirements or other solvency targets, e.g., in order to maintain a certain solvency ratio such that financial strength indicators used by rating agencies and the markets are not affected, the most effective way to restore or improve the solvency position can sometimes be to raise capital.
There are many ways in which companies can raise capital and there are various issues to be considered in relation to each.
5 .2 . EQUITY CAPITALEquity capital involves raising finance by issuing shares in the capital markets or to the parent, if the company is a wholly owned subsidiary.
The benefits of equity capital are that it does not have to be repaid to shareholders—instead, ordinary shareholders receive dividends at the amount declared, while preference shareholders are, of course, entitled to a fixed rate of dividend, which is typically paid unless the company is unable, or if dividends have been suspended due to exceptional circumstances. In addition, payments that are due to preference shareholders rank after bondholders, in terms of the payment of dividends and in the event of wind-up of the company. The company benefits from increasing the size of its balance sheet, as this can improve financial strength indicators used by credit rating agencies and others, thereby reducing the cost of loan finance, etc.
The availability of equity capital depends on many factors, such as the company’s prospects, market conditions, and shareholder ‘appetite.’ The time required to raise equity capital can be relatively short, depending on a number of factors, such as general market conditions and specific perceptions of the company and its management.
The main drawback of issuing new equity capital is the loss of ownership to investors (typically only ordinary shareholders), unless they choose to subscribe, in which case they will incur the cost of purchasing further equity. In addition, shareholders may expect and demand large dividends, which could work out to be higher than interest payments on loans, for example. For companies that already have equity capital and are looking to sell more shares, a disadvantage is that the share price may fall after more shares are issued, as this can be perceived as a sign of weakness by the market. Of course, the company will benefit from the additional capital raised and used, but this must be balanced with the reduced ownership. Another option is to do a rights issue, whereby existing shareholders have the option to buy the new shares at a discount (or sell this option to other investors).
CASE STUDY: SCOTTISH RE CONVERTIBLE PREFERENCE SHARES
Scottish Re Group Limited (Scottish Re), a reinsurance holding company with principal offices in Bermuda and once the second-largest reinsurer in the United States,24 entered into financial difficulty in 2006. In late 2006, a deal was announced between Scottish Re and investors MassMutual Capital Partners LLC and SRGL Acquisition LDC (an affiliate of Cerberus Capital Management), whereby USD 600 million of convertible preferences shares were issued to investors, with the option to convert into 150 million ordinary shares each, or equivalent, to give almost 70% voting rights. The conversion price was USD 4.00, a discount from the USD 4.66 share price at the issue date.25 Although this dilution of shares led to a further 12%26 fall in the share price for existing shareholders, it was a very effective strategy in keeping the company afloat. Further details on the recovery measures implemented by Scottish Re are outlined in Section 8.4.
24 Dave Howell, former CEO of Scottish Re’s international business (January 2008) . What happened at Scottish Re . Presentation to the Society of Actuaries in Ireland .
25 SRGL Financial Statements as at 30 June 2010 .
26 Kuykendall, L . (28 November 2006) . Scottish Re gets funding deal, but its stock falls nearly 12% . Wall Street Journal . Retrieved 26 October 2016 from http://www.wsj.com/articles/SB116468068907434104 .

MILLIMAN RESEARCH REPORT
Recovery and Resolution Plans: Dealing with financial distress
33 DECEMBER 2016
Another option that may be used to raise capital is for the company to issue warrants. Warrants give the right, not the obligation, for investors to purchase stocks at a specified price. Unlike options, which may be issued by third parties, warrants are issued by the company itself and they result in share dilution as new shares are issued by the company whenever investors exercise their warrants and purchase shares. Warrants can be added to bonds or other securities as an additional benefit, which would be attractive to investors, and may lead to more capital being raised by the company or on more favourable terms. Alternatively, warrants could be sold by the company in order to raise capital, for example as part of an initial public offering (IPO). Warrants may be traded by investors on exchanges, similar to options.
CASE STUDY: AIG WARRANTSAIG, discussed further in Section 7.8.2, distributed warrants as a dividend to shareholders in January 2011 as part of its recapitalisation plans.27 A total of 75 million warrants were distributed with a 10-year expiry date and an exercise price of USD 45 per share, compared with a closing share price of USD 60.4528 on 6 January, just before the announcement of the warrants issuance. These warrants were then traded on the New York Stock Exchange (NYSE).
5 .3 . HYBRID CAPITALOne hybrid between debt and equity is ‘contingent capital.’ Contingent capital is debt that a company is allowed to convert to equity following the occurrence of certain pre-specified events, such as a fall in solvency cover below a given level. Converting debt to equity alleviates financial pressure the company may be under, as it removes the obligation to make debt repayments because the company is not obliged to repay equity. Instead, the company may simply choose to pay dividends in the future, when its financial situation improves. A potential issue with contingent capital is that it may not be eligible to cover solvency capital requirements until it is converted to equity, or there may be limitations on its eligibility. For example, in Europe, under Solvency II, contingent capital must be classified as ‘ancillary own funds,’ which reduces its eligibility to cover the Solvency Capital Requirement.29 It is not eligible to cover any of the Minimum Capital Requirement.
Other forms of hybrid capital include convertible bonds, as outlined in the following example.
CASE STUDY: FBD FBD, one of the largest non-life insurers in Ireland, reported a pre-tax loss from operations of EUR 84.8 million for 2015 (EUR 3 million in 2014). In August 2015, the company announced a number of recovery measures planned in order to restore the company to profitability and improve its regulatory capital position. FBD, like many in the Irish P&C (or non-life) industry, was facing challenges that were due to the adverse claims environment (particularly in relation to severe weather claims and the treatment of injury claims in the courts), as well as prevailing low interest rates and the resulting struggle to generate adequate investment returns. In order to return to profitability, the company cited a planned reduction in expenses of EUR 7 million, significant price increases, and the closure to new business of its ‘No-Nonsense’ brand (an online channel with a broad market within Ireland) in an attempt to focus its efforts on its core farming and agriculture target market.
27 AIG Annual Report 2011 .
28 Via Yahoo! Finance at http://finance.yahoo.com/ .
29 Contingent capital may be classified as either Tier 2 or Tier 3 ancillary own funds depending on the quality of the instrument . The Solvency Capital Requirement must be covered by at least 50% Tier 1 capital and Tier 3 capital may be used to cover up to 15% of the Solvency Capital Requirement .
MILLIMAN RESEARCH REPORT
Recovery and Resolution Plans: Dealing with financial distress
34 DECEMBER 2016
CASE STUDY: FBD (CONTINUED)The company unveiled a number of measures that were taken during 2015 in order to strengthen its Solvency II regulatory capital position. Changes were made to the staff pension scheme, such as no longer accepting new entrants, which transformed the EUR 54 million deficit in the scheme in 2014 into a EUR 9 million surplus the following year. The company sold its shares in FBD Property & Leisure Ltd.—the owner of FBD Hotels & Resorts, which invests in a group of hotels—raising EUR 48.5 million. Then, later in 2015, FBD further increased capital by issuing a EUR 70 million convertible bond to the Canadian holding company Fairfax Financial Holdings Limited. The debt was structured as a 10-year instrument with an annual coupon of 7% (payable twice yearly). The debt is convertible into ordinary share capital at a price of EUR 8.50 per share. This price was 37% higher than the company’s share price at the time, which showed confidence in the company’s prospects. The debt could be converted any time between years 3 and 10, but if the share price (calculated as a volume-weighted average over 30 days) exceeded EUR 8.50 for 180 days, then the debt would automatically convert to equity. The debt instrument is admissible as Tier 2 capital under Solvency II, which means that it is eligible to be used to meet up to 35% of the capital requirements.
Source: 2015 Annual Report FBD Holdings, at http://www.fairfax.ca.
CASE STUDY: SUBORDINATED DEBT IN PRACTICEA number of companies currently use subordinated debt in order to improve their capital positions. For example, Great-West Lifeco, an insurance conglomerate headquartered in Canada, had CAD 2.3 billion in subordinated debentures in their consolidated financial statements balance sheet as at 31 December 2015.30 In Canada, under the Minimum Continuing Capital and Surplus Requirements (MCCSR) of the Office of the Superintendent of Financial Institutions (OSFI),31, 32 insurers may classify hybrid (debt/equity) capital instruments as Tier 2 capital if they are subordinate to policyholders and general creditors of the company.
30 Great-West Lifeco Annual Report (2015) .
31 OSFI (November 2014) . Guideline: Minimum Continuing Capital and Surplus Requirements . Retrieved 26 October 2016 from http://www.osfi-bsif.gc.ca/Eng/Docs/MCCSR2015.pdf .
32 OSFI (November 2015) . Guideline: Minimum Continuing Capital and Surplus Requirements . Retrieved 26 October 2016 from http://www.osfi-bsif.gc.ca/Eng/fi-if/rg-ro/gdn-ort/gl-ld/Pages/MCCSR2016.aspx .
5 .4 . SUBORDINATED DEBTSubordinated debt is another possible strategy to raise capital. Subordinated debt functions in the same way as regular debt. However, in the event of liquidation, the company will not repay the lenders of subordinated debt until all other liabilities and secured creditors have been paid. The interest payments on subordinated debt are typically higher than regular debt, which is due to the increased risk the lender bears. This cost of capital will depend, amongst other things, on the company’s creditworthiness. Subordinated liabilities have many of the advantages of debt without risking the company being unable to meet interest payments upon getting into financial difficulty. Subordinated debt does not increase the net assets of a company, as a liability must also be created. However, a company’s capital that is eligible to cover its capital requirements may increase as a result of such an arrangement. For example, in Europe (under Solvency II) subordinated liabilities may be used to cover a (re)insurance company’s capital requirements and they are added to net assets in order to arrive at the company’s ‘own funds.’ Subordinated debt may be used as ‘basic own funds,’ which is a higher-quality classification than ‘ancillary own funds.’ The quality of capital depends on issues such as whether the subordinated liabilities are paid in or not and incentives to repay the debt.

MILLIMAN RESEARCH REPORT
Recovery and Resolution Plans: Dealing with financial distress
35 DECEMBER 2016
CASE STUDY: SUBORDINATED DEBT IN PRACTICE (CONTINUED)
One example of Great-West Lifeco’s debt is the USD 300 million worth of subordinated debentures which are guaranteed by the holding company for the group’s U.S. life subsidiary, on a junior subordinated basis. The bonds were issued in 2006 by Great-West Life & Annuity Insurance Capital, LP II, with a term of 40 years. The debentures include loss-absorbing features, such as a mandatory deferral triggered by specified thresholds in relation to the subsidiary’s U.S.-based RBC ratio. Should such a deferral be triggered, the holding company is required to issue a certain amount of preferred stock that would compensate bondholders. Great-West Lifeco would be required to contribute sufficient equity to the holding company in the event that it was unable to fulfil these obligations.
In Europe, Norwegian insurer Gjensidige Forsikring issued bonds to the value of NOK 1 billion (USD 120 million) in August 2016, which allow the company to write down the debt upon breaching certain thresholds based on the Solvency II capital requirements. Under Solvency II, such capital is classified as restricted Tier 1 and can be used to cover up to 20% of the company’s Solvency Capital Requirement. This is an option for (re)insurers in Europe, although there are a number of considerations to bear in mind before issuing such an instrument. For example, the above bond was rated BBB by Standard & Poor’s given its subordinated nature, compared with the company’s A rating, which impacts the cost of the note. In addition, issuing Tier 2 debt would achieve largely the same outcome from a capital perspective and possibly at a lower cost. This is because companies can cover up to 50% of their Solvency Capital Requirement using Tier 2 capital and most (re)insurers are well below this limit. Therefore, companies may have capacity to increase their Tier 2 capital before considering restricted Tier 1 items.
5 .5 . GROUP FINANCEWhen a subsidiary of a group is in financial difficulty, the first port of call is usually to seek financial support from the group parent company and main shareholder. This can be in the form of additional share capital (sometimes in the form of a ‘capital contribution’), an intragroup loan, or other financial arrangements (such as off-balance-sheet capital, discussed in Section 5.6).
In terms of the availability of this source of capital, it is, of course, generally in the interests of parent companies to ensure any of their subsidiaries in difficulty are restored to financial health. The parent company would typically want to avoid the loss of its investment in the subsidiary, the damage to its brand or reputation, the loss of synergies, and the associated legal, operational, and administrative complexities that would accompany the failure of a subsidiary.
However, it would be naïve to assume that group finance will always be available to a subsidiary. There is a risk that the group will not be able to provide financial support or that it may not be willing to do so if it is not in its strategic interests, bearing in mind the benefits of limited liability, which means that the group generally cannot be pursued for the debts of bankrupt subsidiaries. In addition, RRPs should not include a plan to access group finance if the company does not have a strategy to rectify its underlying problems. For example, in Europe, the BRRD33 states that group financial support may only be provided during resolution if there is a reasonable prospect that this support will remedy the financial difficulty of the entity.
33 Directive 2014/59/EU of the European Parliament and of the Council of 15 May 2014 .

MILLIMAN RESEARCH REPORT
Recovery and Resolution Plans: Dealing with financial distress
36 DECEMBER 2016
5 .6 . OFF-BALANCE-SHEET CAPITALOff-balance-sheet sources of capital may be used in order to improve a company’s capital position. For example, unpaid and uncalled share capital can be established, whereby investors do not pay the funds up-front but instead the company may call the capital to be paid in ‘on demand.’ The benefit of this structure is that the company has capital available which it can call up whenever it is needed, for example should the company get into financial difficulty, but the company is not obliged to make that call. However, it can be difficult to find investors to establish such an arrangement other than group or parent companies. Furthermore, such off-balance-sheet capital may not be eligible to contribute to regulatory capital in all territories. In Europe, under Solvency II, such off-balance-sheet capital would be termed ‘ancillary own funds’ and could be counted as Tier 2 regulatory capital. It would not be permitted to cover the Minimum Capital Requirement but it would be permitted to cover a portion of the Solvency Capital Requirement, within the prescribed limits. Regulatory approval of the item would need to be sought, however. In the United States, such off-balance-sheet capital would generally not currently be counted as regulatory capital. In addition, the risk of default of the counterparty to the agreement should be taken into consideration, given the risk that the capital is not available when called upon. Nonetheless, the advantage of flexibility and the cushion such an arrangement could provide in times of financial difficulty would be attractive to any company in terms of having a recovery plan in place, regardless of whether or not the capital could be counted as regulatory capital before it is called up or paid in.
Other Solvency II ‘ancillary own funds’ items include letters of credit and guarantees received by the company. They would typically be provided by group or parent companies for their subsidiaries. However, the application process for such capital to be counted as regulatory capital can be quite onerous in certain territories. For example, in the UK the requirements include details of the counterparty risk associated with the guarantor, the term sheet of the instrument, confirmation of the lack of encumbrances, and availability of the item on demand. An example of the kind of ancillary own fund items which have been approved would be partly paid share capital, whereby investors agree to purchase shares but only pay part of the value of the shares initially and are required to pay the remainder either at a set date or when the company requests it.

MILLIMAN RESEARCH REPORT
Recovery and Resolution Plans: Dealing with financial distress
37 DECEMBER 2016
6. Recovery strategies: de-risking6 .1 . INTRODUCTIONIn this section we consider a de-risking of the balance sheet as a means of improving a (re)insurer’s solvency position. A reduction in the risks faced by the company could result in either a reduction in technical provisions, leading to an increase in net assets, or a reduction in regulatory capital requirements. Either way, the company’s solvency position should improve, with some changes having an immediate effect.
6 .2 . REINSURANCE AND CAPITAL MARKET SOLUTIONSOne way that a firm can de-risk its balance sheet is to use reinsurance (or retrocession for reinsurers) and/or capital market solutions to reduce its risk exposures. The use of such techniques may result in a reduction in the level of a company’s net technical provisions,34 its capital requirements, or both. In addition, certain reinsurance structures that involve the payment of reinsurance commissions to the cedant may also provide liquidity, or lead to increased net assets (capital) through an increase in the assets on the company’s balance sheet. The introduction of reinsurance or capital market third parties will lead to increased counterparty risk, although this can be offset to some extent via the use of collateral, through dealing with highly rated reinsurers, and through diversifying reinsurer exposures. In this section we discuss a range of different reinsurance and capital market options that are available.
6.2.1. ReinsuranceReinsurance can be distinguished between proportional reinsurance, such as quota share reinsurance (where reinsurers cover a proportion of claims amounts), and non-proportional reinsurance, such as excess of loss reinsurance or stop-loss reinsurance (where the amount covered is not a direct proportion of the claim).
As noted above, quota share reinsurance serves to reduce a company’s share of claims in proportion to the amount of risk transferred to the reinsurer, thereby reducing net technical provisions. However, companies also cede a share of premiums, which represents a cost. This is particularly an issue where business is profitable and the company forgoes the profits that it would make from the premiums on the reinsured part of the business. Quota share reinsurance can be of some benefit to insurers in financial difficulty as, in some cases, it can lead to reductions in capital requirements. This is especially the case for risk-based capital regimes such as Solvency II, where capital is determined by applying a series of shocks to a firm’s balance sheet. For underwriting risk stresses that look at increases in claims (e.g., mortality stresses), the impact of any such increases is dampened by the increased reinsurance recoveries, thereby leading to a lower capital requirement than would otherwise be the case. That said, the insurer will still have to bear a proportion of the claims payments, which could be a significant monetary amount, especially for more extreme catastrophe stresses. For example, in calculating Solvency II capital requirements, life (re)insurers need to consider the impact on available assets of mortality catastrophes such as a 1.5-per-thousand increase in mortality rates.
Unlike quota share reinsurance, where risks are shared between the direct writer and the reinsurer (or between reinsurers where retrocession agreements are in place), in line with a pre-defined proportion, non-proportional reinsurance, such as excess of loss reinsurance, is focussed on limiting an insurer’s exposure to a single event (e.g., a claim on a single exposure with a very large sum assured) or to more extreme risk events (e.g., catastrophes), with reinsurers accepting claims above a pre-agreed threshold (often with an upper limit). Therefore, the benefit of this type of reinsurance is that it leads to a reduction in capital requirements rather than technical provisions. This will of course depend on the point at which the reinsurance cover applies and how this relates to the stresses used in determining capital requirements—if the reinsurance cover would not apply in the event of a stress of the severity used in determining the capital requirement, there may be no benefit. In addition, companies should consider the extent to which credit is permitted to be taken for non-proportional reinsurance in the calculation of solvency capital requirements in the
34 In some jurisdictions, reinsurance may be presented as a reduction in the value of liabilities instead, and this is what is meant by ‘net technical provisions .’ Under Solvency II, reinsurance is treated as an asset on the balance sheet . The term ‘net technical provisions’ in this context means technical provisions minus the reinsurance asset .

MILLIMAN RESEARCH REPORT
Recovery and Resolution Plans: Dealing with financial distress
38 DECEMBER 2016
territories in which they operate, as there may be some restrictions. They will also need to consider if there is an upper limit on their cover and whether they will need to layer further coverages on top to cater for more extreme events or for the situation where the reinsurance cover is exhausted.
Furthermore, companies will need to ensure that there is a reasonable level of risk transfer associated with any reinsurance arrangements. There has been some evidence of late that certain regulators are not in favour of reinsurance deals that are structured with the primary aim of reducing capital requirements, e.g., by only covering losses associated with very specific extreme stresses. From a regulator’s perspective, this makes sense. In theory, a relatively inexpensive35 reinsurance arrangement could be structured in such a way as to reduce capital requirements by having a trigger level that is equal to the level of the stress on which capital requirements are based (e.g., in the case of Solvency II, a 1-in-200-year stress). Such an arrangement would mean that (re)insurers could reduce their capital requirements in relation to this stress. However, the (re)insurer might be left exposed to a slightly less severe, but still extreme, stress (e.g., a 1-in-199-year event). If this slightly less severe stress were to occur, the (re)insurers would not receive anything from their reinsurance arrangement and, equally, they would not be holding any capital to offset against any losses that emerge. This could threaten the company’s solvency position. Regulators might be more receptive to reinsurance arrangements with a less extreme trigger point that protect (re)insurers if more likely events were to occur. The trigger point could be informed by the company’s ORSA—it could be set at the level below which the company has the financial resources to deal with the stress without requiring reinsurance recoveries.
In a speech at the 2016 Bulk Annuities and Longevity Risk Transfer Conference in April 2016, Andrew Bulley, then Director of Life Insurance at the UK’s Prudential Regulation Authority,36 stated: ‘… the Bank will be monitoring closely if firms become active in longevity reinsurance regularly and exclusively for motivations other than seeking a genuine transfer of risk...’
Also, in recent months, the International Monetary Fund (IMF) issued a report on Ireland’s insurance sector.37 One of the IMF’s recommendations was listed as follows:
To avoid regulatory arbitrage, the authorities are recommended to analyze unusual reinsurance transactions where material, to see if sufficient risk has been mitigated or transferred to justify the capital benefits gained.
There are a number of reinsurers in the market willing to arrange quota share and excess of loss deals for traditional products (e.g., term assurance or private motor insurance), so the availability of cover may not really be an issue. However, for newer or more niche products, or for riskier exposures, there may be issues in attaining reinsurance or, at least, in attaining reinsurance on favourable terms.
Quota share and excess of loss treaties are relatively easy to structure and so they can generally be put in place quite quickly. From a liquidity perspective,38 there could be a delay between the time a claim is made to the reinsurer and the time it takes for the reinsurer to recover its share of the claims. Operating on a funds withheld basis—whereby the cedant only passes premiums to the reinsurer periodically (e.g., annually), using the retained reinsurance premiums to settle claims—is one way of limiting this liquidity risk. Such an approach will also reduce reinsurer counterparty risk. However, in the event of a large claims event, the funds withheld might not be sufficient to cover the full level of reinsurance recoveries.
One other form of reinsurance that serves as a source of liquidity is Fin Re. This is discussed in more detail in Section 4.3 above.
Conversely, a company with an existing reinsurance treaty could seek to recapture the treaty with a view to retaining a greater share of profits by not paying reinsurance premiums. However, this means that the insurer would also be exposed to a greater level of risk.
35 Such a structure would be relatively inexpensive because of the low probability of the stress materialising .
36 Bulley, A . (28 April 2016) . Risk transfer—and the risks it creates: A prudential regulatory perspective . Speech to 2016 Bulk Annuities and Longevity Risk Transfer Conference . Retrieved 26 October 2016 from http://www.bankofengland.co.uk/publications/Documents/speeches/2016/speech903.pdf.
37 IMF (September 2016) . Technical Note—Insurance Sector and Update on the Assessment of Observance of the Insurance Core Principles . Ireland . Retrieved 26 October 2016 from http://www.imf.org/external/pubs/ft/scr/2016/cr16311.pdf .
38 Measures to improve liquidity are discussed in more detail in Section 4 above .

MILLIMAN RESEARCH REPORT
Recovery and Resolution Plans: Dealing with financial distress
39 DECEMBER 2016
6.2.2. Longevity transferGiven historic improvements in mortality and expected future improvements that are due to medical advances, healthier lifestyles, and better healthcare, mortality rates might be expected to reduce further over time. However, the rate of reduction is difficult to predict. In addition, events such as pandemics could lead to future increases in mortality rates (or to fluctuations in mortality rates). Uncertainty about future mortality rates means that longevity risk poses a significant risk for certain insurers, particularly those writing annuity business, which is due to the long-term nature of the contracts involved. As a result, firms may seek to pass this uncertainty on to third parties. One means of doing so is through the use of longevity swaps.
In a cash flow indemnity-based longevity swap, an insurer will pass the uncertain payments associated with its annuity portfolio to a third party in return for it making a series of fixed payments. Another option would be to use an index-based (parametric) longevity swap where, instead of making payments based on the insurer’s own experience, counterparties make payments based on a population index, thereby exposing the cedant to basis risk if its portfolio experience differs from that of the population underlying the index used. From an insurer’s perspective, not only do these swaps give greater certainty over future payments, they may also reduce risk-based capital requirements relating to longevity risk, as this risk is effectively transferred to another party.
Longevity swaps may be attractive to investors looking for diversified exposure but they may also be popular with (re)insurers looking for a natural hedge against mortality exposures. Under Solvency II, for example, there may be very little additional capital associated with writing longevity risks as a result of the diversification benefit stemming from the offset between mortality risk capital and longevity risk capital. Therefore, insurers should be able to find interested counterparties willing to engage in a swap. The market for such transactions is growing, with a number of examples of longevity transactions in recent years. For example, in 2014 Aviva transferred British pound sterling (GBP) 5 billion of longevity risk associated with its staff pension scheme to a group of reinsurers (Munich Re, Swiss Re, and SCOR).
From an insurer’s perspective, there are a number of factors to consider when entering into a longevity swap. For example, the level of fixed payment it is willing to pay in return for receiving a variable payment that is dependent on how many lives covered by the agreement survive. To ensure that the correct amounts are swapped every time a payment is due, there will also be an increased administrative workload involved in monitoring the metrics that form the basis of the transaction, although this should not be overly burdensome.
More traditional, single premium longevity reinsurance is still available. However, not all reinsurers are willing to accept the large investment risk associated with accepting a single premium and having to invest it so as to generate sufficient returns to be able to afford annuity payments over such a long period (especially given current low interest rates).
6.2.3. Catastrophe bonds and swapsQuite often, as mentioned in Section 6.2.1 above, insurers will pass the risk related to catastrophes (especially natural catastrophes such as earthquakes, windstorm damage, etc.) to reinsurers using quota share and excess of loss treaties. Large insurers or reinsurers may also transfer the risks that they assume to the capital markets. The most common means of doing this is via catastrophe bonds (Cat Bonds) and swaps.

MILLIMAN RESEARCH REPORT
Recovery and Resolution Plans: Dealing with financial distress
40 DECEMBER 2016
Investors purchase a Cat Bond which pays coupons, and sometimes a final maturity amount, provided that pre-defined trigger events, such as hurricanes and earthquakes, do not occur. Companies can raise liquidity and possibly capital by issuing Cat Bonds (provided the coupon payments do not need to be counted as a contingent liability) and at the same time de-risk their balance sheets by transferring catastrophe risk to investors. If the trigger events are aligned with the stresses that form the basis of the calculation of regulatory capital, then the capital requirements should be reduced, as any increase in claims from the stress will be offset by the payout on the Cat Bond (i.e., by the company not making future coupon payments and instead keeping the investors’ principal). Catastrophe swaps are similar, but the trigger event is related to a catastrophe index and not the specific risk faced by the (re)insurer. This means that the (re)insurer will be exposed to basis risk. Of course, these options will only be available to (re)insurers that have a sizeable exposure to catastrophe risk. They will not be available to all companies—it is more likely a (re)insurer that is not in financial difficulty would choose this option to enable them to write large risks, rather than a company in financial difficulty availing of this option to improve its solvency position. However, a company in financial difficulty may be able to trigger the cessation of Cat Bond payments, depending on what events have occurred, and could also still benefit from setting up such an arrangement if it results in a lower capital requirement.
The drawbacks of such an arrangement are the cost of making payments to the bondholders and the time needed to implement. The structuring of such bonds may be quite complicated, involving a number of different parties to design, price, and sell the bond. In addition, such bonds may not be available at a time when the capital markets are depressed.
As with longevity swaps, these arrangements offer an alternative investment to investors seeking diversification. They may also offer a more attractive yield than other investments, as compensation for the inherent risk involved. A recent Bloomberg article noted that ‘Catastrophe bonds in the U.S. yield 3.3 percent on average, a Swiss RE AG index shows, beating the 1.5 percent yield on 10-year Treasuries and the minus 0.095 percent for similar-maturity Japanese sovereigns.’39 As a result, in recent years, there has been a reasonably active market for these bonds. A report issued by the Bermudan company Artemis and coedited by GC Securities entitled ‘Q1 2016 catastrophe Bond & ILS Market Report’40 states:
For the first time in its history the catastrophe bond and ILS market has ended a quarter with more than US$26 billion of outstanding market capacity, driven by a record-breaking start to the year that saw US$2.215 billion of new risk capital issued from ten transactions.
CASE STUDY: HANNOVER REHannover Re, one of the largest reinsurers in the world, has a history of transferring insurance risk to the capital markets since 1994. In 2015, the company issued a catastrophe bond which transferred U.S. storm risk to the capital markets. This decision was a strategic choice and not because the company was in financial difficulty. The company raised USD 1 billion in total from this transaction (USD 700 million in respect of Texas Windstorm Insurance Association and USD 300 million in respect of Massachusetts Property Insurance Underwriting Association).41 This followed the issue of USD 400 million in respect of Texas Windstorm Insurance Association the previous year. In 2008, Hannover Re pooled a portion of its U.S. property catastrophe risk business into a securitisation, through a Bermuda-based SPV named Globe Re, which was capitalised at USD 133 million. USD 100 million of this was funded through three tranches of bonds, rated BBB-, BB, and B by Standard & Poor’s. The remaining USD 33 million was funded through an equity tranche which both Hannover Re and Benfield, who brokered the deal, invested in.
39 Chu, K . and Ito, K . (18 August 2016) . More Japanese investors are piling into catastrophe bonds . Bloomberg . Retrieved 26 October 2016 from http://www.bloomberg.com/news/articles/2016-08-18/hurricanes-worth-the-risk-as-yields-vanish-for-japan-s-investors .
40 Artemis (2014) . Q1 2016 Catastrophe Bond and ILS Market Report . Retrieved 26 October 2016 from http://www.ilsbermuda.com/wp-content/uploads/2016/04/q1_2016_cat_bond_ils_market_report-1.pdf.
41 Hannover Re (3 June 2015) . Hannover Re completes new ILS transactions . Press release . Retrieved 26 October 2016 from https://www.hannover-re.com/45299/press-releases#/overlay/707651 .

MILLIMAN RESEARCH REPORT
Recovery and Resolution Plans: Dealing with financial distress
41 DECEMBER 2016
6 .3 . INVESTMENT STRATEGYBy changing its investment strategy, a company can reduce the market risks to which it is exposed, which can in turn lead to lower capital requirements under a risk-based capital regime such as Solvency II or the Swiss Solvency Test. Possible investment strategies include enhanced asset-liability matching, hedging, and reinvestment of funds in assets that attract lower capital charges (subject to ALM considerations—see Section 6.3.1).
There may also be benefits from a technical provision perspective. For example, under Solvency II, insurers that write certain long-term business (such as annuity business) and try to match their asset and liability cash flows closely can increase the discount rate used in valuing their liabilities through the use of a concept known as the Matching Adjustment. In this section we explore some of the investment strategy options available to (re)insurers.
6.3.1. Asset liability managementBy matching assets and liabilities as closely as possible, companies can limit their exposure to market risk, which may in turn lead to lower capital requirements. For example, by investing in bonds or money market instruments of a similar currency, value, and duration to its liabilities, a company can limit its exposure to interest rate risk, as any changes in the value of liabilities arising from a change in the discount rate would be, at least partially, offset by a change in the value of the bond assets held. Of course, there may be a number of reasons why it is not practical or even possible to match assets and liabilities exactly. Generally, assets of a suitably long duration are not available to match long-term liabilities such as whole of life assurance and annuity liabilities. Furthermore, investment in bonds leads to other risks, such as the credit risk associated with the bond issuer, in addition to other factors such as the transaction costs incurred with regularly rebalancing the investment portfolio to match assets and liabilities.
Another consideration is the fact that any investment in less risky assets, such as government bonds, will come at the opportunity cost of possibly earning a higher yield on alternative assets, such as corporate bonds. At times, companies may be willing to invest a proportion of their assets in riskier investments, accepting a higher resulting capital requirement, with a view to earning a higher yield (whilst still matching liabilities as closely as possible). In times of financial difficulty, however, companies may need to implement strategies leading to immediate reductions in capital requirements rather than seeking higher returns.
Depending on the type of liabilities that a company has, it may be relatively quick and straight-forward to implement a simple ALM strategy. For example, a company with a block of term assurance contracts would need to calculate the duration of these contracts and then seek to purchase a portfolio of bonds with the same value and currency as the liabilities and also a similar duration, to protect itself against changes in interest rates. In addition to matching the currency and duration, however, the company would also need to consider the timing of liability cash flows and the liquidity of the matching assets. It will also need to regularly monitor its asset portfolio and rebalance it, as the liability moves with factors such as new business or changes in mortality assumptions.
On the other hand, a company that writes business with investment guarantees might not be able to match its assets and liabilities as closely by simply using fixed-interest investments such as bonds. The company may instead need to engage in a hedging programme, using a portfolio of derivatives to counteract liability movements. Hedging is discussed in Section 6.3.2.
There is a recent innovation in the ALM space that some European unit-linked insurers are beginning to consider. It relates to a particular interpretation of the term ‘technical provisions’ under Solvency II that could have favourable implications for capital requirements. In summary, Article 132 of the Solvency II Directive says that, for unit-linked contracts, ‘the technical provisions in respect of those benefits must be represented as closely as possible by those units or, in the case where units are not established, by those assets.’ Technical provisions include the best estimate liability (which could be negative, i.e., a present value of future profits) and the risk margin. It may be possible to under-invest in units so that the value of the unit-linked assets is equal to the value of the unit-linked liabilities net of the present value of future profits, i.e., the value of unit-linked assets equals the value of unit-linked technical provisions. This technique can serve to reduce volatility in the Solvency II own funds, as demonstrated by the graphic in Figure 10.

MILLIMAN RESEARCH REPORT
Recovery and Resolution Plans: Dealing with financial distress
42 DECEMBER 2016
By investing in cash, the NAV becomes less sensitive to price movements because the cash value will not vary due to movements in unit-linked prices.
The SCR is also likely to reduce as the cash will not be as sensitive to market shocks as unit-linked assets (ignoring any new risks introduced by the cash holding, e.g., counterparty risk).
However, the solvency coverage ratio is likely to be more volatile in this scenario, as the movements in the NAV and SCR will be less aligned than under a fully matched scenario.
Overall, the effectiveness of ALM as a recovery tool will depend on the level of difficulty in which an insurer finds itself. Depending on the specific actions chosen, the short-term benefit of enhanced ALM may be limited to reducing capital requirements for market risks which, for some companies, might not lead to a significant improvement in the solvency position. For example, a company that writes short term business and invests most of its assets in cash spread across highly rated banks might not have a large market risk capital requirement to begin with. On the other hand, a company with long-term liabilities that invests some assets in equities and cash might benefit greatly from improved ALM. Over the longer term, enhanced ALM should help any company better manage market volatility.
6.3.2. HedgingHedging is a form of ALM that involves the use of assets, such as derivatives, to counteract movements in the value of other assets and any associated liabilities. Hedging is often associated with the use of financial instruments that lead to a reduction in market risks. That is what we focus on in this section, although longevity swaps (as discussed in Section 6.2.2 above), where payments depend on mortality rates rather than financial metrics, are equally a form of hedge.
In insurance, hedging is most commonly used for products which offer a financial guarantee, for example variable annuity contracts. It may be possible to invest in a portfolio of financial derivatives (e.g., forwards, futures, options, swaps, and swaptions) to offset movements in financial metrics (such as equity values, interest rates, volatility, etc.), so that any change in these metrics which results in a guarantee becoming more ‘in-the-money’ (i.e., an increase in liabilities) will be offset by an increase in the value of the hedge assets. Of course, hedging might also limit the potential upside—if markets move in favour of the company, e.g., an increase in asset values, then its hedge assets may fall in value. Hedging can also be used for other purposes, such as managing currency risk or other market risks within a pension scheme. In addition, credit risks, such as counterparty default risk and credit spread widening risk, are also hedgeable via the use of credit derivatives, e.g., credit default swaps (CDS) or total return swaps (TRS).
42 Clarke, S . et al . (July 2014) . Capital Management in a Solvency II World . Milliman Research Report . Retrieved 26 October 2016 from http://www.milliman.com/uploadedFiles/insight/2014/capital-management-solvency-II.pdf .
FIGURE 10: MATCHED UNIT-LINKED ASSETS AND UNIT-LINKED TECHNICAL PROVISIONS (EXAMPLE)42
MATCHED UNIT-LINKED ASSETS AND UNIT-LINKED TECHNICAL PROVISIONS
UNIT PRICE 0 .80 1 .00 1 .20
UNIT-LINKED ASSETS 760 950 1,140
CASH 50 50 50
TOTAL ASSETS (A) 810 1,000 1,190
UNIT-LINKED LIABILITIES 800 1,000 1,200
BEST ESTIMATE LIABILITIES (40) (50) (60)
TOTAL UNIT-LINKED TECHNICAL
PROVISIONS (B)760 950 1,140
NAV (A - B) 50 50 50
SCR 8 10 12
COVERAGE RATIO 625% 500% 417%

MILLIMAN RESEARCH REPORT
Recovery and Resolution Plans: Dealing with financial distress
43 DECEMBER 2016
HEDGING FACTFILE: VARIABLE ANNUITY EXAMPLERisks that can be hedgedThe risk of a fall in equity markets resulting in a variable annuity guarantee being more ‘in-the-money’ can be hedged through the purchase of a series of forwards or put options, whereby the derivative becomes more valuable as equity markets fall. Hedging against falls in asset values is known as delta hedging. It is also possible to hedge other market movements (often referred to as the ‘Greeks’ because they are represented by Greek letters), such as interest rates (rho hedging), volatility (vega hedging), and convexity (gamma hedging), as well as movements in the value of liabilities over time (theta hedging). Likewise, some insurers might want to hedge cross Greeks, i.e., the interaction between some of the above items. However, such hedges can be quite difficult to put in place, as calculating exposure to volatility risk or convexity risk and then determining the appropriate hedge assets can be quite complex. Therefore, it is not unusual for insurers to leave some of these exposures unhedged.
When hedging, some firms segment their portfolios into different levels of in-the-moneyness, as the sensitivity to various market movements can differ at different levels. The hedge portfolio for each level will be selected so as to best-fit each sensitivity.
To protect against extreme events, some firms also trade derivatives that are very far out-of-the-money and are hence quite inexpensive.
Companies can also engage in interest rate pre-hedging, where they lock in the current interest rate curve before selling a certain volume of new business.
Types of hedging strategyHedging can be static, whereby it is based on exposures at a point in time with infrequent trades to rebalance the portfolio, or it can be more dynamic, where trades are executed on an almost continuous basis. Static hedging can be relatively easy to set up and manage as it does not require regular rebalancing. This is also the major drawback of static hedging—the hedge might not be appropriate at future points if there are substantial changes in a company’s risk exposures, e.g., because of the company writing large volumes of new business.
Dynamic hedging should mean that the hedges are always reflective of the company’s risks.
Risk associated with hedgingThere are a number of risks associated with hedging, such as the operational risk associated with implementing the hedging programme (potential for incorrect trades), basis risk (where the derivatives do not replicate the assets that determine the liability exactly), counterparty risk, and liquidity risk associated with having to make collateral payments as derivative values change. There is also the roll over risk associated with having to replace the current portfolio of derivatives as they expire. Some of these risks can be mitigated, for example counterparty risk can be reduced via collateral arrangements. Basis risk can be reduced by purchasing exchange-traded derivatives that are based on assets that are most representative of the insurer’s underlying exposures or by purchasing bespoke derivatives that are based on the insurers’ underlying exposures (provided there is a counterparty willing to provide them).
Another potential issue is that it might not be possible to hedge non-market risks, such as mortality and lapses, which are inherent in unit-linked insurance products. Therefore, the company is still exposed to an increase in its liabilities from non-market sources. In addition, it can be difficult to hedge inflation-linked liabilities, as there is limited supply of inflation-linked securities, e.g., inflation-linked government bonds, while over-the-counter derivatives may present a large counterparty risk.

MILLIMAN RESEARCH REPORT
Recovery and Resolution Plans: Dealing with financial distress
44 DECEMBER 2016
HEDGING FACTFILE: VARIABLE ANNUITY EXAMPLE (CONTINUED)Other considerationsDesigning and implementing hedging strategies can be a time-consuming and costly process, particularly for dynamic hedging, which requires continuous monitoring and trading to rebalance the portfolio. Not only will a company incur transaction costs on its trades, it will also require a dedicated hedging team to oversee everything. In order to minimise transaction costs, companies may have threshold levels below which they will not execute trades. However, if the threshold is too high, it will reduce the effectiveness of the hedging programme.
Given the potential for large trading costs, and large hedging losses if errors occur, many companies may initially seek to outsource the operation of the hedging until such time as they have sufficient knowledge to insource activities and sufficient scale to justify the cost of operating the programme in-house. When insourcing activities, or commencing a hedging programme, companies may decide to complete a period of mock-hedging to test the effectiveness of their operations before going live. Once the process is live, companies will need to monitor the effectiveness of the hedges to help identify if there are unhedged risks which should be hedged and also to identify other issues such as a large level of basis risk.
Given the time required to establish an effective hedging programme, it might not necessarily be an effective recovery and resolution tool (in the short term at least). Companies might choose to start with a simple static hedge (e.g., a currency forward to reduce foreign exchange exposure on its pension scheme assets) to reduce certain risks immediately and to switch to more complex dynamic hedging over time.
6 .4 . OTHER OPTIONSIn addition to reducing the risks on the balance sheet, companies may also reduce their capital requirements through other capital management options. These options may result in a better reflection of the risks that the company is exposed to rather than reducing the underlying risks.
Under Solvency II, firms can potentially reduce capital requirements through the use of Undertaking Specific Parameters (USPs). USPs allow a (re)insurer to replace the factors used in determining capital requirements under the Solvency II Standard Formula with factors that are specific to the undertaking’s risk profile. Currently, it is only possible to use USPs under certain calculations for specific risk modules within the life, non-life, and health underwriting risk modules. The relevant calculations where USPs can be used include the non-life premium and reserve risk sub-module and the life revision risk sub-module. USPs are generally considered to be most effective in reducing capital requirements for non-life (re)insurers.
It should be noted that the use of USPs requires prior regulatory approval. Firms will need to be able to demonstrate that their own parameters are appropriate (particularly where they result in a reduction in capital requirements). Companies will also need to present relatively large volumes of data to support their parameters. Therefore, USPs will take some time to implement, which may reduce their efficacy as a short-term recovery measure.
Another alternative under some risk-based capital regimes, such as Solvency II or the Swiss Solvency Test, would be to use an internal model or partial internal model to calculate capital requirements. Such models have the benefit of reflecting a (re)insurer’s specific risk profile and, as such, they may result in lower capital requirements than the ‘one size fits all’ Standard Formula calculation, especially where a (re)insurer feels it is less risky than a ‘standard company.’ An example of the benefit of using an internal model is that they better cater for the impacts of dynamic hedging programmes, allowing (re)insurers to take more credit for hedging than with the Standard Formula.

MILLIMAN RESEARCH REPORT
Recovery and Resolution Plans: Dealing with financial distress
45 DECEMBER 2016
Designing and implementing internal models involves fitting loss distributions which reflect the likelihood and impact of different risks, so that losses at an extreme level, e.g., a 1-in-200-year level, can be assessed. Allowance then needs to be made for the interaction between these different risks, i.e., risks are not all perfectly correlated. Such a process requires a lot of data, some of which might not be readily available. For example, a newly formed company might not have sufficient data on its mortality or lapse experience to create a full loss distribution of such risks. Industry-wide data could be used to supplement a (re)insurer’s data but then questions would emerge about the appropriateness of industry-wide data for a specific company’s risk profile.
Once a company has successfully designed and built its internal model, it will still need to apply for regulatory approval before it can be used to determine regulatory capital requirements. This is not a trivial task. The (re)insurer will need to be able to convince the regulator that the model is fit for purpose. Under Solvency II, for example, there are six criteria that regulators will consider when assessing an application to use an internal model.
They are:
1. Use Test: Is the model used to make business decisions and manage risks rather than just being used to determine capital requirements?
2. Statistical Quality Standards: Is the probability distribution forecast appropriate?
3. Calibration Standards: Is the model calibrated to focus on a sufficiently extreme event, such as having sufficient capital in a 1-in-200-year event?
4. Validation Standards: Has the model been independently validated to ensure its appropriateness?
5. Profit and Loss Attribution: Can profits and losses arising be attributed to each of the underlying risks?
6. Documentation Standards: Are the design and operational details of the model well documented?
Overall, therefore, whilst internal models might represent a means of reducing capital requirements, the time and resources required might mean that they are not the most appropriate recovery measures, in the short term at least.

MILLIMAN RESEARCH REPORT
Recovery and Resolution Plans: Dealing with financial distress
46 DECEMBER 2016
7. Recovery strategies: restructuring7 .1 . INTRODUCTIONIn previous sections, we looked at options that a company could take to source liquidity, raise capital, or de-risk its balance sheet (with a view to reducing technical provisions or capital requirements). The strategies outlined focused on leaving the structure of the company intact, with the company continuing to operate on a going-concern basis whilst offering the same products and benefits.
Sometimes the best approach for a company or group may be to restructure the organisation. Depending on the strategy chosen this could lead to the company taking a very different form from its current one.
7 .2 . PORTFOLIO TRANSFERSIn order to improve solvency or liquidity over a shorter time period, companies may wish to transfer certain portfolios of business to another company.43 In doing so the company may be able to raise liquidity by converting an illiquid asset, such as the present value of future profits on a given portfolio of business, into a liquid asset. It may also be able to raise capital if the business is profitable and the present value of future profits is not fully taken into account on the regulatory balance sheet, or if the company secures a goodwill payment in respect of future profits, included in its appraisal value. Furthermore, the company may be able to reduce technical provisions and capital requirements by transferring the business to a third party. The company would also need to compensate any third party that is assuming loss-making business so there would be a cost involved.
In addition to the time that it can take to transfer a portfolio, another limiting factor may be the number of potential bidders. Smaller or less profitable portfolios might not offer an attractive investment for third parties, which might affect the level of demand and hence the transaction price. In some circumstances, this might mean that it is not possible to dispose of the portfolio without offering a substantial discount (or without paying an additional premium to the buyer of loss-making business). In extreme circumstances it might not be possible to find a buyer. For example, when Equitable Life ran into financial difficulties, it was unsuccessful in attempting to find a buyer because of the nature of the guarantees on its underlying business (see Section 8.3 for more information). The same may be true for firms operating in niche areas or for firms that are perceived as being inherently riskier, e.g., due to the sale of products with guarantees. These issues may be especially prevalent in times of economic uncertainty within the wider economy.
Of course, there are costs associated with portfolio transfers. Depending on the jurisdiction in question, the process may involve a court approval, which could take several months. For example, in Ireland, two court hearings are required as part of what is known as a ‘Section 13 Portfolio Transfer.’ There is an initial directions hearing when the court is made aware of the proposed transfer and the company agrees to various requirements, such as writing to policyholders to notify them of the proposed transfer and making the public aware of the proposed transfer. Subsequently, there is a second hearing where the court is informed if all requirements previously set out have been complied with and the transfer is approved. In addition to the associated legal fees, other fees may also be incurred, such as fees related to the appointment of an independent actuary to report on the impact of the transfer on both the acquiring company and the disposing company and the security of a policyholder’s benefits.
Subsequent to the transfer, the disposing company may be able to engage in significant cost-saving practices, as staff involved in the management of the business that has been transferred may no longer be needed. In fact, in a situation where all of the business has been transferred to another party, it may be possible to voluntarily liquidate the company, returning any remaining capital to shareholders.
43 The sale of an entire company is covered in Section 7 .8 .2 .

MILLIMAN RESEARCH REPORT
Recovery and Resolution Plans: Dealing with financial distress
47 DECEMBER 2016
7 .3 . OPTIONS RELATED TO NEW BUSINESSA (re)insurance company could reprice its products in an attempt to eliminate losses on new business. This may take time as the company looks to update premium rates or rating factors, which may involve a lot of extra analysis of recent experience. It could also change its underwriting policy to reduce risks such as anti-selection by applying stricter medical claims or financial underwriting procedures or by introducing additional exclusions into its policy conditions. Such approaches may stop future losses from emerging whilst reducing future capital requirements. Overall, these courses of action may result in an improved capital position in the medium to long term. However, it might not help with any short-term solvency problems related to the in-force book of business, which will dominate any impact of new business initially. Any increases in premiums and charges may impact the level of new business written in the future, as premiums become less competitive. Furthermore, adding new exclusions and applying stricter underwriting practices may also deter potential policyholders if they are out of line with market practice, whilst increased underwriting, e.g., more in-depth claims investigations, would normally lead to increased expenses.
7 .4 . OPTIONS RELATED TO EXISTING BUSINESSIn some cases, a life insurer may be able to increase charges for existing policies in order to help improve its solvency position (via reduced technical provisions and ultimately through increases in retained earnings). For example, the policy conditions for many unit-linked products allow insurers to increase fund-related charges in certain circumstances. Likewise, certain non-linked products, e.g., whole of life insurance, will have reviewable premiums at certain points. Whilst increasing charges may increase the profitability of a policy, it may mean that the policyholder is more likely to lapse. Lapses may be beneficial in that they may lead to the release of the technical provisions and capital requirements associated with the policy. However, they may also represent a loss of future profits and this will mean that the expense base is spread over fewer policies, which may impact the profitability of remaining business.
An alternative to increasing charges would be for insurers to reduce benefits. On certain products, such as whole of life contracts, benefits may be reviewed periodically. Companies in financial difficulty could therefore reduce benefits that are unaffordable, leading to a reduction in technical provisions and a possible improvement in solvency coverage. Similarly, on with-profits business, where there is a ring-fenced fund in which surpluses are shared amongst policyholders, benefits may be reduced through reductions in terminal bonus rates. This could be done where there is a lack of surplus in the with-profits fund, thereby removing the need for the insurer to make good any shortfall in the fund. Insurers seeking to reduce with-profits bonus rates should, however, consider Policyholder Reasonable Expectations (PRE) and Treating Customers Fairly (TCF)44 principles—if benefits have not been reduced previously, this might mean that there is an expectation that they won’t be reduced in future. For example, the Equitable Life case study outlined in Section 8.3 discusses how the company was prevented from reducing non-guaranteed terminal bonus rates by the UK courts.
The availability of such options will depend on the extent to which policy conditions allow insurers to take these steps and on the frequency with which changes can be implemented. However, where allowed, it could be relatively straightforward and inexpensive for companies to calculate premium increases or benefit reductions, especially if companies will have existing models and processes to perform such calculations.
Further information in relation to more extreme reductions to policyholder benefits is outlined in Section 8.5.
44 These are principles often referred to in the UK and Ireland that consider the treatment of policyholders . They relate to policyholders forming expectations about their policies (such as what is guaranteed and what is not, whether charges can be increased or not, etc .) . These expectations can be informed by the past practices of the insurer or by communications provided by the insurer .

MILLIMAN RESEARCH REPORT
Recovery and Resolution Plans: Dealing with financial distress
48 DECEMBER 2016
7 .5 . CLOSURE TO NEW BUSINESSCompanies may choose to stop selling unattractive products (e.g., unprofitable products, products with low sales volumes, products with a large initial strain, or products that are capital-intensive), or completely close the company to new business. The closure of the entire company could effectively represent a resolution option45 and may be employed voluntarily by a company (without regulatory intervention), when it has determined that its business model is not viable because, for example, of a failure to reach a sufficient size or due to regulatory or legal changes which may impact future sales. Alternatively, (re)insurers may be forced to close to new business by an administrator if supervisory authorities deem it is necessary to intervene and take control over the running of the company, possibly as part of resolution measures. A group may also decide to close a subsidiary to new business if the operation no longer fits with its overall strategy.
Closure to new business is something that can be effected in a reasonably short time frame, especially if no external parties need to approve such a decision.46 The move should result in a fall in technical provisions and capital requirements over time as the business runs off, which may lead to a gradual improvement in a (re)insurer’s solvency position.
Quite often, closure to new business may be accompanied by an increase in lapse rates, as existing policyholders become unsettled by the reasons surrounding closure (particularly if they are of a financial nature). This may serve to accelerate the rate at which the business runs off. In addition, in order to further increase the rate of run-off, an insurer might offer incentives to policyholders that lapse. For example, any surrender penalties that would otherwise apply may be waived. It should, however, be noted that if a company encourages lapses, and not all policyholders avail of the incentives offered, then it might be left with a small block of remaining business that is not very profitable (which would be due to the relatively fixed overheads associated with maintaining this block of business until it expires).
Another way of quickly reducing policyholder liabilities for a block of business that is closed to new business would be for insurers to buy back benefits from policyholders. The company may already be holding a technical provision that, depending on the relevant jurisdiction, represents either a prudent or best estimate valuation of the liability. If the insurer offers to buy back the policy, this reserve could be released, leading to a fall in its liabilities. At the same time, cash balances would fall by approximately the same amount (assuming the amount paid to the policyholder represents a fair valuation of the policy and is hence aligned with the reserves held).47 Therefore, the fall in assets will be offset by the fall in liabilities and the impact on the balance sheet and the available assets might not be significant. However, by virtue of removing the policy from the company’s balance sheet, the amount of capital requirements associated with the policy will fall and hence the solvency position of the insurer may improve. Companies that are not closed to new business could also use the strategy of buying back policies as a means of reducing capital requirements for lines of business where capital requirements are onerous.
In addition to the possible benefits set out above, another benefit of closing to new business would be that such an action could lead to a reduction in costs. In particular, the company would no longer need to employ teams engaged in product development and pricing, marketing, or new business processing. There may also be scope to reduce the staff count further as the existing business runs off, with less staff required to support the management of this business. In fact, if the company does not reduce its costs then it will be faced with costs being spread over an ever-decreasing number of policies, which could lead to an increase in maintenance expense assumptions and an increase in technical provisions. There will, however, be a limit on the extent to which expenses can be reduced, as companies normally need to maintain certain key functions such as CEO, Chief Financial Officer (CFO), Chief Risk Officer (CRO), or Head of Compliance or Actuarial Function. Some but not all of these roles could be outsourced or fulfilled on a part-time basis, with the exact staffing requirements depending on the regulatory jurisdiction in which the (re)insurer operates. However, it is possible that ultimately the remaining
45 Companies could also close to new business temporarily until such time as any issues have been addressed .
46 Even if regulatory approval is not required, companies that are closed to new business may need to inform supervisors and keep them updated on their runoff plans .
47 In reality, the insurer may offer a more favourable value for the policy in order to entice as many policyholders as possible to avail of the option . However, provided the additional cost of buying the policy (fall in cash less fall in liabilities) is less than the reduction in capital requirements, such transactions should help increase the insurer’s excess assets .

MILLIMAN RESEARCH REPORT
Recovery and Resolution Plans: Dealing with financial distress
49 DECEMBER 2016
business would need to be transferred to another party once it becomes uneconomical for the insurer to manage the run-off of the policies (unless the insurer is successful in buying out all of the policyholder benefits). There are a number of companies that specialise in the acquisition of closed books of business, such as Phoenix Life and Resolution in the UK and global reinsurer Swiss Re’s Admin Re unit.
7 .6 . ENHANCED DIVERSIFICATIONUnder Solvency II, and many other risk-based capital regimes, credit is given for diversification benefits between different risks that are not well correlated, e.g., mortality risk and longevity risk. A company that writes one particular risk may be able to avail of these diversification benefits by assuming certain volumes of the other risk, with little or no impact on capital requirements. This could in theory involve starting to write products with a different risk profile from the in-force book. Of course, product design and pricing will take time and incur costs. There is also a danger that a new entrant into an established market might struggle to gain sufficient market share in the short term. Therefore, a firm in financial difficulty would have neither the financial resources nor the time to analyse and implement such options with a view to improving its solvency position.
One more achievable way of gaining diversifying exposure would be to accept inwards reinsurance on a block of diversifying contracts. Such an approach avoids the costs and time lag associated with designing and marketing a new product, as well as bypassing the time it could take to build up sufficient volumes to obtain a meaningful diversification benefit. For some group companies that write different risks, a series of reinsurance treaties could offer mutual benefits. For example, a hypothetical Company A that incurs large capital requirements for mortality risk could cede come of its risk to a sister company, Company B, which faces large capital requirements for longevity risk. Company B could in turn cede some longevity risk to Company A. Both companies could reduce their capital requirements by ceding some of their primary risks and the associated capital requirements, whilst accepting diversifying risks that will not lead to large increases in capital requirements. With lower capital requirements, both companies may be able to dividend some of their excess assets back to the parent. This may improve the solvency position of the group, particularly where fungibility of capital is constrained by capital held at a subsidiary level. A limitation of this approach would be the situation in which the reinsured liabilities are treated as ring-fenced funds. If this were the case, then diversification benefits may be limited, as each ring-fenced fund might essentially need to be sufficiently capitalised on a stand-alone basis, with limited fungibility of capital. The exact classification and treatment of ring-fenced funds will depend on the regulatory jurisdiction in which the (re)insurer operates.
It would also be possible for a group to obtain diversification benefits by using a branch structure (as discussed in Section 7.8.1) where all of the risks are on a single balance sheet. Similarly, a company could in theory engage in a portfolio transfer, where it purchases a block of business that is uncorrelated with its current liabilities from a third party, thereby leading to diversification benefits. Of course, a company that is facing financial difficulty would likely not have the time or the capital to purchase a portfolio of diversifying products, so this approach might not be practical.
From an availability perspective, the main constraint is that this method involves a (re)insurer finding another (re)insurer (or insurance portfolio) with a different risk profile that would mutually benefit from such a transaction. This might prove difficult. From a cost perspective, the fact that each company would be transferring risk to the other would mean that the payment of a reinsurance premium would be somewhat offset by the receipt of a reinsurance premium. At an individual subsidiary level, depending on the reinsurance premiums for each tranche of business, this might have a small negative impact on the available capital for one company and a small positive impact on the other, but from a group perspective such a transaction could be cost-neutral. In addition, there would likely be costs associated with administering the treaties, e.g., calculating premiums and claims payments on an ongoing basis. One consideration for any group companies involved in such transactions relates to transfer pricing and ensuring that the reinsurance premiums are calculated on an arm’s length basis.48 Companies would also need to ensure that there is a genuine degree of risk transfer and that the deal is not purely a form of regulatory capital arbitrage. Otherwise there could be regulatory or tax implications.
48 Transfer pricing rules may differ across different territories .

MILLIMAN RESEARCH REPORT
Recovery and Resolution Plans: Dealing with financial distress
50 DECEMBER 2016
7 .7 . INTERNAL RESTRUCTURING MEASURESFor companies that are not of a sufficient scale to cover the costs associated with all functions being filled by in-house staff, it may be possible to outsource some functions to a third party, e.g., paying a third-party administrator (TPA) a per policy fee to administer the business or using a fund manager that charges a percentage of funds under management to manage investments.
In many companies, commitments to support a staff defined benefit scheme have led to increased costs in recent years, as poor investment performance and increases in longevity have led to many schemes facing substantial deficits. Employers have therefore had to increase contributions to maintain the level of benefits offered by these schemes. Options available to companies to reduce the burden of staff pension schemes include:
· The closure of staff pension schemes to new entrants (possibly with the introduction of a less costly defined contribution scheme)
· Restructuring the scheme to reduce future benefits, e.g., closing the scheme to future accrual
· Hedging, e.g., introducing longevity swaps to reduce the volatility risk associated with the scheme (an example of this is the Aviva longevity swap discussed in Section 6.2.2 above.)
Options that affect existing members may be particularly difficult to implement and the employer’s ability to enact such options may depend on considerations such as employee’s contracts, scheme rules, and acceptance of changes by trustees and members of the scheme. Such changes may be unpopular with employees.
Examples of internal restructuring are the expense reduction and pension-scheme-related measures taken by the Irish non-life insurer, FBD (see Section 5.3 above).
7 .8 . GROUP RESTRUCTURING7.8.1 Branch structureAt a group level, available capital management options include changing the structure of the group operating model. This may include closing subsidiaries and transferring liabilities for a particular region onto the balance sheet of a single group entity. This single entity could use a branch structure, whereby it maintains a number of branches in the different territories in which the business operates. In the European Economic Area49 (EEA), branches can be established on a Freedom of Establishment basis. Each branch would have a permanent presence in the country and it would pay tax in the local territory based on the profits earned in that territory, but it would not be a separate legal entity from a regulatory capital perspective. Such a model is often called a ‘hub and spoke’ model.
INDUSTRY EXAMPLE: ‘HUB AND SPOKE’ MODELSThere are a number of examples of such models in operation in Europe. For example, MetLife has established a European headquarters in Ireland. From here, it sells into a number of countries, including Poland, Germany, Spain, Italy, and the UK. In a similar manner, the Zurich Insurance Group has established its European hub for both life and non-life business in Ireland.
The advantage of using a branch structure over the operation of a number of different subsidiaries is that the company is better able to avail of any diversification benefits when calculating regulatory capital requirements. Having a single entity, or at least a smaller number of entities, could also enable greater fungibility of capital, with some of the constraints related to moving capital from one entity to another being removed by the use of a single entity instead. That said, it is possible that some constraints on moving capital between different countries’ operations within a single entity might still exist.
Another advantage of the branch structure is that supporting smaller entities that have to hold absolute minimum capital requirements in excess of the amount of the true level of calculated capital requirements would be freed up. For example, under Solvency II the absolute minimum capital requirement for a life company is EUR 3.7 million.
49 This area represents an internal market incorporating European Union member states and other European countries (Iceland, Liechtenstein, and Norway) .
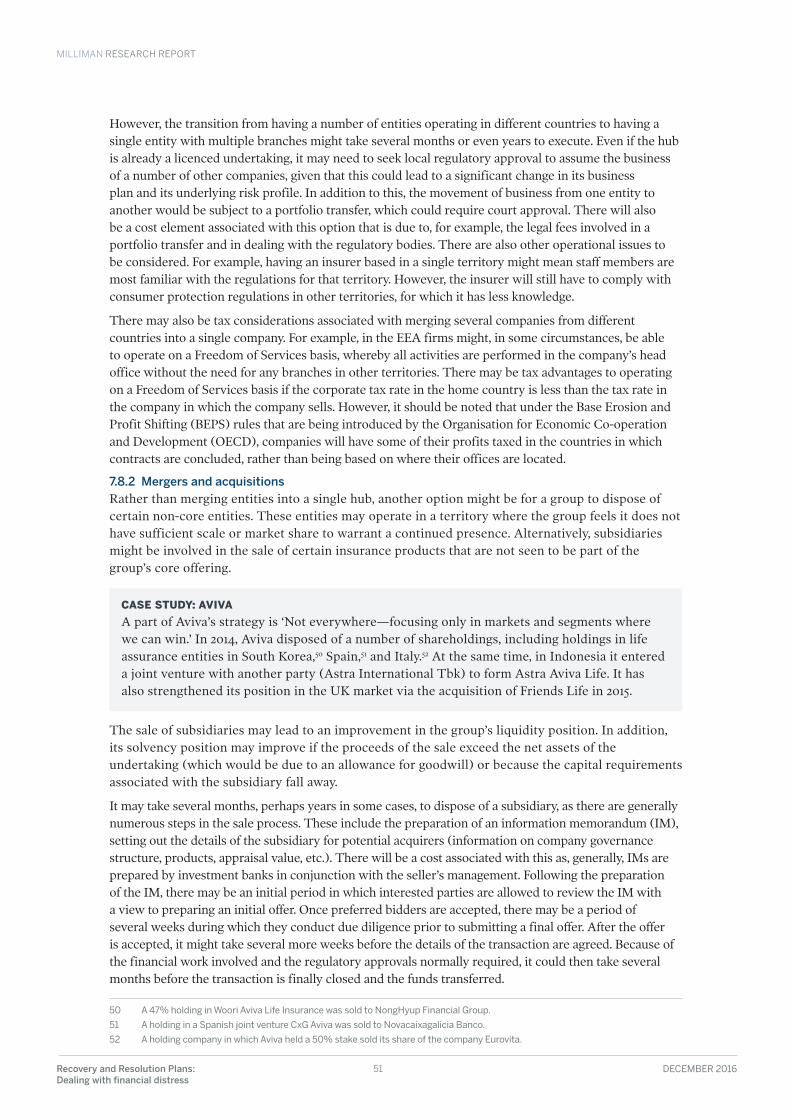
MILLIMAN RESEARCH REPORT
Recovery and Resolution Plans: Dealing with financial distress
51 DECEMBER 2016
However, the transition from having a number of entities operating in different countries to having a single entity with multiple branches might take several months or even years to execute. Even if the hub is already a licenced undertaking, it may need to seek local regulatory approval to assume the business of a number of other companies, given that this could lead to a significant change in its business plan and its underlying risk profile. In addition to this, the movement of business from one entity to another would be subject to a portfolio transfer, which could require court approval. There will also be a cost element associated with this option that is due to, for example, the legal fees involved in a portfolio transfer and in dealing with the regulatory bodies. There are also other operational issues to be considered. For example, having an insurer based in a single territory might mean staff members are most familiar with the regulations for that territory. However, the insurer will still have to comply with consumer protection regulations in other territories, for which it has less knowledge.
There may also be tax considerations associated with merging several companies from different countries into a single company. For example, in the EEA firms might, in some circumstances, be able to operate on a Freedom of Services basis, whereby all activities are performed in the company’s head office without the need for any branches in other territories. There may be tax advantages to operating on a Freedom of Services basis if the corporate tax rate in the home country is less than the tax rate in the company in which the company sells. However, it should be noted that under the Base Erosion and Profit Shifting (BEPS) rules that are being introduced by the Organisation for Economic Co-operation and Development (OECD), companies will have some of their profits taxed in the countries in which contracts are concluded, rather than being based on where their offices are located.
7.8.2 Mergers and acquisitionsRather than merging entities into a single hub, another option might be for a group to dispose of certain non-core entities. These entities may operate in a territory where the group feels it does not have sufficient scale or market share to warrant a continued presence. Alternatively, subsidiaries might be involved in the sale of certain insurance products that are not seen to be part of the group’s core offering.
CASE STUDY: AVIVAA part of Aviva’s strategy is ‘Not everywhere—focusing only in markets and segments where we can win.’ In 2014, Aviva disposed of a number of shareholdings, including holdings in life assurance entities in South Korea,50 Spain,51 and Italy.52 At the same time, in Indonesia it entered a joint venture with another party (Astra International Tbk) to form Astra Aviva Life. It has also strengthened its position in the UK market via the acquisition of Friends Life in 2015.
The sale of subsidiaries may lead to an improvement in the group’s liquidity position. In addition, its solvency position may improve if the proceeds of the sale exceed the net assets of the undertaking (which would be due to an allowance for goodwill) or because the capital requirements associated with the subsidiary fall away.
It may take several months, perhaps years in some cases, to dispose of a subsidiary, as there are generally numerous steps in the sale process. These include the preparation of an information memorandum (IM), setting out the details of the subsidiary for potential acquirers (information on company governance structure, products, appraisal value, etc.). There will be a cost associated with this as, generally, IMs are prepared by investment banks in conjunction with the seller’s management. Following the preparation of the IM, there may be an initial period in which interested parties are allowed to review the IM with a view to preparing an initial offer. Once preferred bidders are accepted, there may be a period of several weeks during which they conduct due diligence prior to submitting a final offer. After the offer is accepted, it might take several more weeks before the details of the transaction are agreed. Because of the financial work involved and the regulatory approvals normally required, it could then take several months before the transaction is finally closed and the funds transferred.
50 A 47% holding in Woori Aviva Life Insurance was sold to NongHyup Financial Group .
51 A holding in a Spanish joint venture CxG Aviva was sold to Novacaixagalicia Banco .
52 A holding company in which Aviva held a 50% stake sold its share of the company Eurovita .

MILLIMAN RESEARCH REPORT
Recovery and Resolution Plans: Dealing with financial distress
52 DECEMBER 2016
CASE STUDY: AIGChapter 1: AIG: U.S. focusIn 2008, American International Group (AIG) fell into financial difficulty, arising mainly from its involvement in trading mortgage-backed securities (MBS) and credit default swaps (CDS) and in securities lending. When the financial markets crashed, collateral calls on these derivatives and falls in the value of assets led to losses and increased liquidity requirements. AIG lost USD 99.2 billion in 2008, with the Federal Reserve Bank of New York (in close co-operation with the U.S. Treasury Department) providing an USD 85 billion loan in September 2008 to prevent AIG from collapsing.53 This step was taken to protect the U.S. economy and the U.S. policyholders of AIG from the possible consequences of the failure of AIG. A further credit facility was approved in October 2008 whereby up to USD 37.8 billion of fixed-income assets could be borrowed from AIG in exchange for collateral in the form of cash.
Interestingly in the context of RRPs, the Federal Reserve Bank of New York notes that54 ‘At the time of AIG’s liquidity crisis, no effective bankruptcy framework existed for a firm of AIG’s type and size. There was no single regulator to step in and manage the company’s failure, no single court that could sort out the demands of creditors and shareholders, and no practical way to coordinate among the hundreds of U.S. and foreign regulators responsible for overseeing all of AIG’s businesses. The absence of a resolution authority, combined with the size and scope of AIG’s businesses and the existing stress on the economy, would have made the consequences of its failure potentially catastrophic, stressing the need for quick, effective action.’ The subsequent actions of the FSB and International Accounting Standards Board (IASB) to identify G-SIFIs and G-SIIs and to require them to have RRPs in place may stem from issues such as this.
In November 2008, AIG’s financial support package was restructured with the introduction of a reduced interest rate and a longer period. Furthermore, the U.S. Treasury Department announced that it would buy USD 40 billion of AIG preference shares using the Troubled Asset Relief Program (TARP). This allowed AIG to reduce the size of its credit facility with the Federal Reserve Bank of New York. Finally, two new SPVs, Maiden Lane II and Maiden Lane III, were set up. The SPVs comprised MBS and CDS issued by AIG subsidiaries (including AIG Financial Products). The Federal Reserve Bank of New York lent money (approximately USD 44 billion) to these SPVs over an agreed period and at an agreed interest rate. The proceeds of the sale of the securities within the SPVs were used to repay these loans.55
In March 2009, it was announced that two of AIG’s subsidiaries, American Life Insurance Company (ALICO) and American International Assurance (AIA) would be placed in SPVs, with preferred interests granted to the Federal Reserve Bank of New York. This transfer took place in June 2009. In total the value of the preferred interests was USD 16 billion for AIA and USD 9 billion for ALICO. AIG maintained control of the companies but the Federal Reserve Bank of New York obtained certain rights to protect its interest. The creation of the SPVs also cleared the way for a potential sale of these companies at a later date.
53 Kellogg Insight (3 August 2015) . What Went Wrong at AIG? Retrieved 26 October 2016 from http://insight.kellogg.northwestern.edu/article/what-went-wrong-at-aig .
54 Federal Reserve Bank of New York . Actions Related to AIG . Markets and Policy Implementation . Retrieved 26 October 2016 from https://www.newyorkfed.org/aboutthefed/aig .
55 Federal Reserve Bank of New York . Maiden Lane Transactions . Markets and Policy Implementation . Retrieved 26 October 2016 from https://www.newyorkfed.org/markets/maidenlane.html .
In addition, as with portfolio transfers, the availability of this option will depend on the attractiveness of the business to bidders and on the general economic outlook at the time of a proposed sale.
The large-scale restructuring that took place at AIG spanned multiple territories across the world and incorporated a number of strategies, including several mergers and acquisitions (M&A) deals, as outlined in the following case study.

MILLIMAN RESEARCH REPORT
Recovery and Resolution Plans: Dealing with financial distress
53 DECEMBER 2016
CASE STUDY: AIG (CONTINUED)In addition, in March 2009, some additional measures were taken to restructure the support offered. They included changes to the terms of the original TARP arrangement and the creation of a further TARP facility that AIG could use if needed.
In order to help to repay this loan, AIG was required to dispose of a number of subsidiaries. In March 2010, AIG announced that it had reached an agreement to sell ALICO to MetLife, in a deal worth approximately USD 15.5 billion. This announced deal comprised MetLife paying USD 6.8 billion in cash plus a further USD 8.7 billion in equity (shares and convertible stock). The cash proceeds were to be used to reduce the Federal Reserve Bank of New York’s preferred interests in the ALICO SPV, with the non-cash items sold over time to reduce the remaining balance. Eventually, the deal was closed in November for approximately USD 16.2 billion, of which USD 7.2 billion was in cash.
On 30 September 2010, AIG announced an agreement on a recapitalisation plan designed to repay all its obligations to American taxpayers. The plan included the repayment and closure of the Federal Reserve Bank of New York’s credit facility. The plan also included the acquisition by the U.S. Treasury Department of the majority of the Federal Reserve Bank of New York’s preferred interests in the AIA and ALICO SPVs, and the conversion of the AIG preferred stock owned by the Treasury Department into equity.
In January 2011, the recapitalisation was closed, ending the involvement of the Federal Reserve Bank of New York. This allowed AIG the freedom to access the private debt markets.
In 2012, the final securities in Maiden Lane II and Maiden Lane III were sold, resulting in the loans being fully repaid with a profit of circa USD 9.5 billion generated for the taxpayer.
In late 2012, the U.S. Treasury sold the last of its AIG shares for USD 7.6 billion, raising the positive return earned by the U.S. Treasury and the Federal Reserve Bank of New York from the bail-out to USD 22.7 billion.56
In March 2013, the U.S. Treasury’s interests in AIG ended when AIG purchased warrants that it had issued to the U.S. Treasury in 2008 and 2009.
Since repaying its debt to the Federal Reserve Bank of New York and the U.S. Treasury, AIG has continued to trade as normal, signifying the success of the measures implemented.
Chapter 2: AIG: Asia focusIn Asia, AIG had holdings in a number of insurance companies, in particular AIA, which operated in several Asian countries.
As discussed in Chapter 1 above, AIG was required to dispose of certain assets (including AIA) in order to repay the Federal Reserve Bank of New York.
Trade sale options for AIA were explored in early 2009, but bids were disappointing, given the ensuing global financial crisis. In March that year it was announced that AIA would be placed in an SPV, with the Federal Reserve Bank of New York gaining preferred interests. In June 2009, the Federal Reserve Bank of New York agreed to receive USD 16 billion of preferred equity in the SPV. Also, in 2009, the Philippine Life and General Insurance Company (Philam Life) was folded into AIA instead of being disposed of separately (Philam Life also formed part of the AIA SPV). It was then decided to pursue an IPO for AIA.
56 U .S . Department of the Treasury (11 December 2013) . Investment in AIG: Program Status . Retrieved 26 October 2016 from https://www.treasury.gov/initiatives/financial-stability/TARP-Programs/aig/Pages/status.aspx .

MILLIMAN RESEARCH REPORT
Recovery and Resolution Plans: Dealing with financial distress
54 DECEMBER 2016
CASE STUDY: AIG (CONTINUED) Initially, an IPO was scheduled for April 2010. However, in March 2010, the UK insurance group, Prudential, announced to the market that it had reached a deal to purchase AIA for USD 35.5 billion. There were still numerous hurdles that Prudential had to negotiate before finalising the deal. They included the perceived high level of the purchase price agreed and Prudential investors’ reluctance to sanction the deal at such a price without there being a clear strategy in place. Prudential attempted to renegotiate the deal at a lower price of USD 30.4 billion. However, AIG declined the revised offer and the deal collapsed in June 2010, with AIG opting to move ahead with an IPO. It was estimated that the collapse of the deal cost Prudential GBP 450 million through the triggering of a break-free clause that Prudential had agreed to pay AIG if the deal did not proceed, as well as through the costs associated with the deal, such as underwriting and investment bank costs.57 Furthermore, Prudential was fined GBP 30 million by the UK Financial Services Authority for failing to inform the regulator of its acquisition plans in due time.58
The IPO process restarted in July 2010 and was completed in October 2010, when AIA was listed on the Hong Kong stock exchange. The IPO raised USD 20.5 billion for a 58% stake of AIA (which was used to make repayments to the U.S. taxpayer). At the time, this was the third-largest IPO on record. AIG sold further stakes in AIA in March and September of 2012 for USD 8 billion. AIG sold its final stake in AIA in December 2012 for USD 6.5 billion.59
AIG had several other Asian subsidiaries. In 2011, two Japanese subsidiaries, AIG Star Life Insurance and AIG Edison Life Insurance, were sold to the U.S. group Prudential Financial for a figure in the region of USD 4.8 billion.60 Also in 2011, the sale of the Taiwanese insurer, Nan Shan, to Ruen Chen Investment Holding Co. earned USD 2.15 billion, which was repaid to the U.S. taxpayer.61
In a sign of its commitment to Asia, throughout its period of difficulty, AIG maintained a large stake in the Chinese insurer People’s Insurance Company of China Property and Casualty (PICC P&C), which it had purchased when the company was listed in 2003. Over 2013 and 2014, AIG also formed a joint life insurance venture with PICC. However, in May 2016, AIG disposed of a large proportion of its shares in PICC P&C for USD 1.25 billion. This followed the sale of USD 750 million of PICC P&C shares in December 2015, and of USD 500 million of PICC P&C shares in March 2013. Finally, in September 2016, AIG disposed of its remaining shares for USD 192 million.62
7.8.3 Splitting up the groupGroups that are not necessarily currently in financial difficulty may choose to dismantle or separate different parts of the business, for example if they have experienced poor financial performance over recent times and if they can foresee financial difficulty affecting the group in future if they continue in their current form. The following case study outlines an example of such a situation, with Old Mutual Life of South Africa.
57 Bowers, S . (2 June 2010) . Prudential’s AIA takeover ‘shambles’ costs £450m . The Guardian . Retrieved 26 October 2016 from https://www.theguardian.com/business/2010/jun/02/prudential-takeover-costs-450m-shambles .
58 Financial Conduct Authority (27 March 2013) . FSA fines Prudential £30 million and censures CEO for failing to inform regulator of 2010 acquisition plans . Press release . Retrieved 26 October 2016 from http://www.fca.org.uk/news/press-releases/fsa-fines-prudential-30-million-and-censures-ceo-for-failing-to-inform-regulator-of-2010-acquisition-plans .
59 Team, T . (20 December 2012) . AIG sells stake in Asia but is still ready for big Asian growth . Forbes . Retrieved 26 October 2016 from http://www.forbes.com/sites/greatspeculations/2012/12/20/aig-sells-stake-in-aia-but-is-still-ready-for-big -asian-growth/#27ba0fe66b46 .
60 http://www.investor.prudential.com/phoenix.zhtml?c=129695&p=irol-newsArticle&ID=1522113 .
61 http://www.bloomberg.com/news/articles/2011-01-12/aig-to-sell-taiwan-s-nan-shan-life-unit-to-ruentex-group-for-2-16-billion .
62 http://www.reuters.com/article/aig-picc-pc-sale-idUSL3N1BH07R.

MILLIMAN RESEARCH REPORT
Recovery and Resolution Plans: Dealing with financial distress
55 DECEMBER 2016
CASE STUDY: OLD MUTUALOld Mutual is an insurance, banking, savings, and investment group, which began in South Africa as a mutual in 1845. The company demutualised in 1999 and listed on various stock exchanges, including London and Johannesburg. The company grew significantly after it was listed in 1999 and it is now an international group comprising the following four entities:
· Old Mutual Emerging Markets: An African financial services leader, providing long-term savings, protection, investment, and lending to retail and corporate customers.
· Nedbank: One of South Africa’s top four banks, providing wholesale and retail banking, insurance, and asset management for individuals and businesses.
· Old Mutual Wealth Management: The leading wealth management business in the UK and international markets.
· Institutional Asset Management: Providing a diverse range of investment strategies and products for institutions, delivered worldwide through seven U.S.-based boutiques.
Old Mutual’s financial position was badly affected by the global financial crisis, particularly in the United States and Bermuda, and the group began a restructuring programme which saw the disposal of its U.S. unit, US Life, for USD 350 million in 2011. In 2012, Old Mutual ceased its Nordic operations for GBP 2.1 billion, and followed in 2014 by disposing of a number of its Skandia entities, including Skandia Germany, Skandia Austria, and Skandia Poland, which resulted in a loss of GBP 70 million.
The group has reported challenges experienced in recent times including:
· Depreciation of the South African rand (ZAR), which represents a large portion of the group’s earnings from South Africa, against the British pound sterling (GBP), the currency in which the group’s dividends are paid
· Volatile market conditions in the second half of 2015
· An inability to take credit for emerging markets and Nedbank surplus under Solvency II rules
At the time of writing, the group is currently in the process of implementing a new strategy focussed on improving its financial position. The strategy, announced in the group’s 2015 annual report, is to separate the four entities so distinctly that the group will ultimately no longer exist by the end of 2018. The precise mechanisms that will be used to do this have not yet been disclosed.
7.8.4 Other options available to groupsIn Section 5.5 above, we discussed the option for a subsidiary to obtain capital from its parent, including the fact that, in most territories, groups have limited liability. As such, they are not seen as liable for subsidiaries’ debts. Therefore, from the group’s perspective, one option when considering restructuring would be to withhold capital support from certain subsidiaries. However, such a decision would not be taken lightly—there will be advantages and disadvantages in deciding to support or not support a subsidiary as outlined above. Groups will need to consider them when deciding on the most appropriate course of action.

MILLIMAN RESEARCH REPORT
Recovery and Resolution Plans: Dealing with financial distress
56 DECEMBER 2016
8. Resolution and extreme recovery measures8 .1 . INTRODUCTIONAs outlined earlier in the paper, the FSB defines resolution as the situation ‘when a firm is no longer viable or likely to be no longer viable, and has no reasonable prospect of becoming so.’ Regulators would typically be heavily involved in the resolution stages, either working with the company to refine and implement the resolution plan or taking over and resolving the situation themselves. During resolution, regulators and/or the companies themselves may take measures in order to write down obligations they owe to others and wind up the company.
Sometimes, there can be a fine line between recovery and resolution. Extreme measures such as closing the entire company to new business or changing the corporate or ownership structure such that the company survives, but in a dramatically different form, probably lie somewhere between recovery and resolution. This section outlines examples of resolution and extreme recovery measures.
8 .2 . WINDING UPThe final phase in the implementation of a resolution plan is typically to wind up the operations of a (re)insurance company. Whilst there may be some differences in winding-up regimes in different territories, the first step usually involves the appointment of a liquidator, who is responsible for the orderly wind-up of operations with as little economic impact as possible. The liquidator will attempt to extract the maximum value from all of the (re)insurer’s assets.
The company will be closed to new business and the authorisation of the (re)insurance company will be withdrawn. Policyholder liabilities would typically be either settled or transferred elsewhere before existing policyholders are notified of their options and rights.
In a winding-up situation, policyholders’ claims often have first call on the assets of the insurer, although senior bondholders may also rank highly during the winding-up process. In some countries, the expenses owing to the winding-up of the insurer, e.g., liquidators’ fees, may take precedence. Rights in rem, where a third party has a legal claim on an asset, may in certain circumstances rank ahead of other claims on an insolvent company’s assets, whilst creditors may be able to set off their claims against the claims of a (re)insurance company.
Creditors will be able to lodge claims, which will be considered equal to similar claims, when the proceeds of the sale of any remaining assets are distributed. However, the amount received by each creditor will depend on what remains after policyholders have been compensated. It will also depend on the level of subordination of the debt in question (discussed in Section 5.4 above).
In addition, in some territories there may be insurance compensation schemes that have been established to cover the claims of insolvent insurers. Insurance guarantee schemes are discussed further in the next section.
8 .3 . DISMANTLING OPERATIONSWhen facing a resolution scenario, whereby the company has no prospects of recovering its financial position, the strategy may be to dismantle the company by selling off portions of it and running off the in-force business which cannot be transferred.
In certain jurisdictions, government assistance may be sought if the company is unable to meet its obligations in relation to those policies it is left with. However, Insurance Guarantee Schemes (IGSs) do not exist in all territories and they can be limited in scope where they do exist. The European Commission defines IGCs as follows:63
Insurance guarantee schemes (IGS) provide last-resort protection to consumers when insurers are unable to fulfil their contract commitment, offering protection against the risk that claims will not be met if an insurance company is closed down.
63 European Commission (12 July 2010) . Insurance Guarantee Schemes (IGS) - Frequently Asked Questions . Press release . Retrieved 26 October 2016 from http://europa.eu/rapid/press-release_MEMO-10-320_en.htm?locale=en .

MILLIMAN RESEARCH REPORT
Recovery and Resolution Plans: Dealing with financial distress
57 DECEMBER 2016
According to the European commission, ‘one-third of the entire EU-EEA insurance market lacks any kind of coverage by an IGS in the event an insurance company has to close down’ as at July 2010. The Organisation for Economic Co-operation and Development (OECD) has stated that 26 of its members have a scheme that covers all or part of the insurance sector.64
The following illustrates the unfortunate case of Equitable Life, which saw a combination of resolution measures enacted.
CASE STUDY: EQUITABLE LIFEEquitable Life is the oldest mutual life insurance company in the UK, established in 1762, and the first company to call its mathematician an “actuary.”65 Its collapse led to losses and financial hardship for many of its policyholders and pensioners. It prompted the independent first review of the actuarial profession,66 following criticism of its involvement outlined in the public inquiry into Equitable Life.67
Equitable Life had total assets of GBP 34 billion in 1999 and had a number of policies with Guaranteed Annuity Rates (GARs), guaranteeing a minimum rate of interest. In preceding years, the option to take up these guaranteed minimum rates was not usually exercised, as market rates were higher than the guarantee. However, during the 1990s, market interest rates fell below the guaranteed rates, which led to a sharp increase in the number of policyholders exercising their option to take up the guaranteed rates. The effect of this was devastating for Equitable Life, as the company did not have sufficient reserves to meet claims based on the guaranteed rate of interest underlying the policyholder liabilities.
Figure 11 shows the historic Bank of England interest rates from 1975 to July 2016. The graph illustrates the fall in the level of interest rates which began in the mid-1990s.
FIGURE 11: BANK OF ENGLAND HISTORIC INTEREST RATES
Source: http://www.bankofengland.co.uk.
64 OECD (2013) . Policyholder Protection Schemes: Selected Considerations .
65 Chris Daykin (June 2012) . The Morris Review of the UK Actuarial Profession .
66 The Morris Report (2005) .
67 The Penrose Report (2004) .
Bank of England Historic Interest Rates
02 Jan 75
Inte
rest
Rat
e %
02 Jan 80
02 Jan 85
02 Jan 90
02 Jan 95
02 Jan 00
02 Jan 05
02 Jan 10
02 Jan 15
0
2
4
6
8
10
12
14
16
18

MILLIMAN RESEARCH REPORT
Recovery and Resolution Plans: Dealing with financial distress
58 DECEMBER 2016
CASE STUDY: EQUITABLE LIFE (CONTINUED)Equitable Life went through protracted legal proceedings during this process. Initially, in 1999, the High Court upheld the company’s strategy of not paying, or reducing, non-guaranteed final bonuses for policies where the guarantee had been exercised, as they had already received more than their ‘asset share’ by receiving the guarantee. The High Court found in favour of Equitable Life, but the Court of Appeal, and subsequently the House of Lords in 2000, ruled against the company.
Unable to meet the additional reserves required following the House of Lords ruling, the company closed to new business in December 2000. Attempts to find a buyer were unsuccessful, given the nature of the in-force GARs.68 The company received GBP 500 million from Halifax in 2001 and a further GBP 250 million in 2002 in exchange for a portion of the company’s assets, staff, and operations. A ‘compromise scheme’ was implemented in 2002, whereby policyholders were given uplifts to their policy values and the open-ended GAR liabilities were removed from Equitable Life’s balance sheet. The company sold its subsidiary, Permanent Insurance, to Liverpool Victoria Friendly Society in 2001, raising GBP 150 million. The company implemented a number of measures to improve its position, such as a reduction in policy values in 2001, which ultimately required a government compensation scheme to be established in order to compensate policyholders who were unfairly treated. The company also significantly increased surrender penalties to 20% in 2002, in an attempt to curb lapses and protect remaining policyholders.69 The company is still being run off at the time of writing, with funds under management of GBP 7 billion as at 31 December 2015.70
An equally disastrous collapse of a large insurer occurred in Australia in 2001 which resulted in a number of resolution measures being enacted, as described in the following case study.
CASE STUDY: HIH INSURANCEHIH Insurance was the second-largest P&C (or non-life) insurance company in Australia before it was placed into liquidation in March 2001. The company’s lines of business included motor insurance, workers’ compensation, travel, commercial insurance, and household buildings and contents.
In April 2003, the findings of the Royal Commission identified a variety of failures which led to the collapse of HIH Insurance. These were:
· Under-pricing and under-reserving
· Corporate governance failures
· Mismanagement (a lack of attention to detail; a lack of accountability for performance; and a lack of integrity in the company’s internal processes and systems)
· Acquisition of FAI (a poor business decision to acquire a financially troubled company)
· Ill-fated international ventures
· Inadequate auditing
The investigation found a deficit of A$5 billion on the company’s balance sheet which led to government assistance of approximately A$1.3 billion, that was provided by territory governments and funded mainly by levies applied to the general insurance industry. In addition, A$0.5 billion was provided through a federal government rescue package, funded by taxpayers.
Other resolution measures included the sale of HIH’s workers’ compensation portfolio to NRMA Insurance in March 2001. Allianz Australia took over much of HIH’s personal insurance lines, such as private motor and household business, while QBE Insurance (Australia) took over HIH’s corporate and travel lines as well as the insurance cover of the Rugby Union and Rugby League competitions. Royal & Sun Alliance Australia offered short-term policies to HIH’s builders warranty insurance policyholders in exchange for an additional premium.
68 Equitable Life Annual Report and Accounts 2001 .
69 Equitable Life Annual Report and Accounts 2002 .
70 http://www.equitable.co.uk/about-us/key-facts/ .

MILLIMAN RESEARCH REPORT
Recovery and Resolution Plans: Dealing with financial distress
59 DECEMBER 2016
CASE STUDY: SCOTTISH REAs introduced earlier in this paper, Scottish Re71 is a reinsurance holding company with principal offices in Bermuda and was once the second-largest reinsurer in the United States.72 The company entered into financial difficulty in 2006 following large Q2 2006 losses and announced that it was looking for a buyer on 31 July 2006. Despite the fall in Scottish Re’s credit rating (from A- to B++73) and in its share price (which fell by 75%), the company initially managed to raise USD 120 million liquidity through entering a reinsurance arrangement. In late 2006, a deal was announced between Scottish Re and investors MassMutual Capital Partners LLC and SRGL Acquisition LDC (an affiliate of Cerberus Capital Management), whereby USD 600 million of convertible preference shares were issued to investors with the option to convert them into 150 million ordinary shares, the equivalent of offering almost 70% voting rights. The conversion price was therefore USD 4.00, a discount from the USD 4.66 share price on the issue date.74 Although this dilution of shares led to a further 12%75 fall in the share price for existing shareholders, the issuance of these shares was effective in keeping the company afloat.
Recovery measures have continued at Scottish Re since it was rescued by MassMutual and Cerberus, including the following:
· Scottish Re closed to new business in 2008 and existing treaties have hence been placed into run-off.76
· During 2009, SRGL negotiated a settlement of USD 46.5 million in order to cancel USD 100 million of debt in respect of the Premium Asset Trust Series (PATS) 2004-4, representing a significant discount. This debt was in the form of an unsecured funding agreement payment obligation, which matured in March 2009.
· During 2009, SRGL also paid USD 51.5 million to repurchase USD 226.7 million outstanding pass-through certificates, and again this was at a significant discount. These pass-through securities represented put options for SRGL to issue funding agreements to investors ‘in return for the assets in a portfolio of 30-day commercial paper.’
· In 2009, Scottish Re sold its ING life reinsurance business to Hannover Re. The company reported a pre-tax gain of USD 703.6 million as a result of this transaction,77 given that the release of liabilities was greater than the transfer of assets.
· During 2011, Scottish Re ceded the ‘Orkney block’ of business to Hannover Re—this was effectively as a sale of the Orkney block.78
71 Scottish Re Group Limited .
72 Dave Howell, ibid .
73 United States District Court Southern District of New York (2 November 2007) . In Re Scottish Re Group Securities Litigation, Opinion and Order .
74 SRGL Financial Statements as at 30 June 2010 .
75 Kuykendall, ibid .
76 Scottish Re (2013) . Profile: Company Overview . Retrieved 26 October 2016 from http://www.scottishre.com/Content/Profile_Overview.asp .
77 Scottish Re 2009 financial statements .
78 Scottish Re 2012 financial statements and Hannover Re, Corporate History, at https://www.hannover-re.com/74898/history .
8 .4 . CHANGING OWNERSHIPOften, when faced with a disastrous financial position, the solution may be to seek investors who will rescue the company. There is a possibility that such investors would take a large portion of the company’s ownership at a heavy discount, but this is not always the case. In this scenario, the company’s financial outlook would not be strong and so raising capital in the normal ways is not a viable option. The new owners would hope to make a return on their investment by implementing additional recovery measures such as selling portions of the business and restructuring the company.
The following case study illustrates the drastic restructuring that took place within the Scottish Re Group following its rescue by investors in 2006.

MILLIMAN RESEARCH REPORT
Recovery and Resolution Plans: Dealing with financial distress
60 DECEMBER 2016
8 .5 . REDUCING POLICYHOLDER BENEFITSSimilar to the ‘bail-in’ approach discussed in Section 8.7 in relation to banks, in certain situations resolution plans for insurance companies have included measures whereby policyholder benefits are reduced.
The FSB guidance paper entitled ‘Developing Effective Resolution Strategies and Plans for Systemically Important Insurers’ states the following in relation to insolvent insurance companies:
Authorities or the courts would need to determine how a potential shortfall is allocated over time and across creditors and policyholders, subject to respect of the creditor hierarchy.
The above suggests policyholder benefits are not immune from absorbing losses. A special case of benefit adjustments may be in situations where an insurer is subjected to resolution measures as set out by a supervisory authority, i.e., administration or liquidation. In such situations, the supervisor (or any party acting on behalf of the supervisor, such as an administrator or liquidator) may restructure benefits in a way that entitles every policyholder to a fair share of the insurer’s assets (with insurance claims generally settled prior to any other creditors’ claims being settled). Policyholders might get back less than the contractual value of their policies but it would be preferable to a situation where they do not receive anything. Examples of such measures can be seen in the case studies regarding resolutions in Japan outlined in Section 8.6.
The list of examples of insurance companies that became bankrupt in the United States and Canada in the 1990s includes Executive Life, First Capital, Confederation Life, and Mutual Benefit. In a number of these cases, policyholders did not receive the full value of their policies, while in other cases there was a delay between the company becoming bankrupt and the policyholders receiving what was due to them. In some, but not all instances, when there were delays in paying policyholder benefits, interest was applied to compensate for the time value of money.
8 .6 . RESOLUTIONS IN JAPANBetween April 1997 and March 2001, seven Japanese life insurers failed. A year earlier, these companies had combined assets of about JPY 25 trillion (about USD 250 billion), accounting for about 13% of the entire private life insurance sector in Japan. While regulators and industry leaders were widely criticised for permitting an environment that led to this crisis, in retrospect, once the crisis emerged, the response could be viewed as laudable. An industrywide meltdown was prevented. Contagion across the broader financial services sector was largely controlled.
8.6.1. Roots of the crisisJapanese life insurance companies achieved phenomenal asset growth in the 1970s and 1980s, mirroring rapid growth in the Japanese economy and reflecting the central role played by the life insurance industry in savings and capital formation. In the mid-1980s, as Japanese politicians and officials struggled to adjust to their nation’s rapid emergences as a force on the world stage—it was a period when both public and private sectors were dealing with the very tangible problem of repatriating or recycling growing foreign exchange balances held offshore—a confluence of factors led to rapid growth in Japan’s real economy and the emergence of an unsustainable equity and real estate bubble.
79 Scottish Re 2015 financial statements .
80 Scottish Re 2008 financial statements .
CASE STUDY: SCOTTISH RE (CONTINUED)The company is still in operation today, with USD 3 billion total assets at end 2015,79 down from USD 12.8 billion total assets at end 2007,80 illustrating the extent of the recovery measures which have been implemented over the years.

MILLIMAN RESEARCH REPORT
Recovery and Resolution Plans: Dealing with financial distress
61 DECEMBER 2016
During the bubble period, life insurers competed fiercely with banks and non-banks for consumer and corporate funds. Insurer assets ballooned. The bubble burst. Long-term guarantees, though consistent with returns that had been achieved during most of the postwar period, proved unsustainable. Equity prices fell by almost 60% from their peak at the end of 1989 to an initial trough in 1992. Real estate prices would soon follow. As shown in the chart in Figure 12, government bonds, which offered yields of approximately 5% to 6% per annum (p.a.) through the early 1990s, fell steadily in the decade after the bubble, settling into a range of 1% to 2% as the failures began.
FIGURE 12: JAPANESE 10-YEAR GOVERNMENT BOND YIELDS %
8.6.2. Defining an approach for resolutionAlthough rumours had surfaced about potential financial difficulties at several of Japan’s insurers, the failure of Nissan Life, in April 1997, came as a shock to regulators, the industry, and the public. Opaque financial reporting practices driven by book value and outdated solvency requirements had masked a deficit of approximately JPY 300 billion, or 15% of reported liabilities. Over the next four years, regulators, industry representatives, academics, and other advisors helped to craft an approach to resolution that aimed to preserve a reasonably high portion of policyholder benefits, while preventing the crisis from leading to a meltdown in the broader financial services sector.
Japan’s evolving approach to resolution can be conceptualised in three stages.
Stage 1: Industry rescue of Nissan Life
When Nissan’s financial situation was revealed to regulators, new sales were suspended, surrenders were temporarily banned, and an administrator was named. It was widely hoped that this might be an isolated incident. The industry, led by the Life Insurance Association of Japan (LIAJ), played a leading role in developing a solution, which had the following components:
· Creation of a new insurance company, owned by the LIAJ (‘Aoba’ Life)
· Replacing senior management of Nissan
· Reduction of policyholder interest rate guarantees to 2.75% (from a typical range of 5% to 6%)
· Introduction of an additional surrender charge grading from 15% to 0% over seven years
· Transfer of restructured policies to Aoba
· Contribution of JPY 200 billion in assets from LIAJ member companies (via a Policyholder Protection Fund that had been established in 1996)
The combination of the lower interest rate guarantee, the temporary additional policyholder surrender charges, and the JPY 200 billion industry contribution created a viable runoff company that was later sold to the French conglomerate Artemis.
Japanese 10 year government bond yields (%)
05 Jul 1986
05 Jul 1988
05 Jul 1990
05 Jul 1992
05 Jul 1994
05 Jul 1996
05 Jul 1998
05 Jul 2000
05 Jul 2002
05 Jul 2004
05 Jul 2006
05 Jul 2008
05 Jul 2010
05 Jul 2012
05 Jul 2014
0
1
2
3
4
5
6
7
8
9
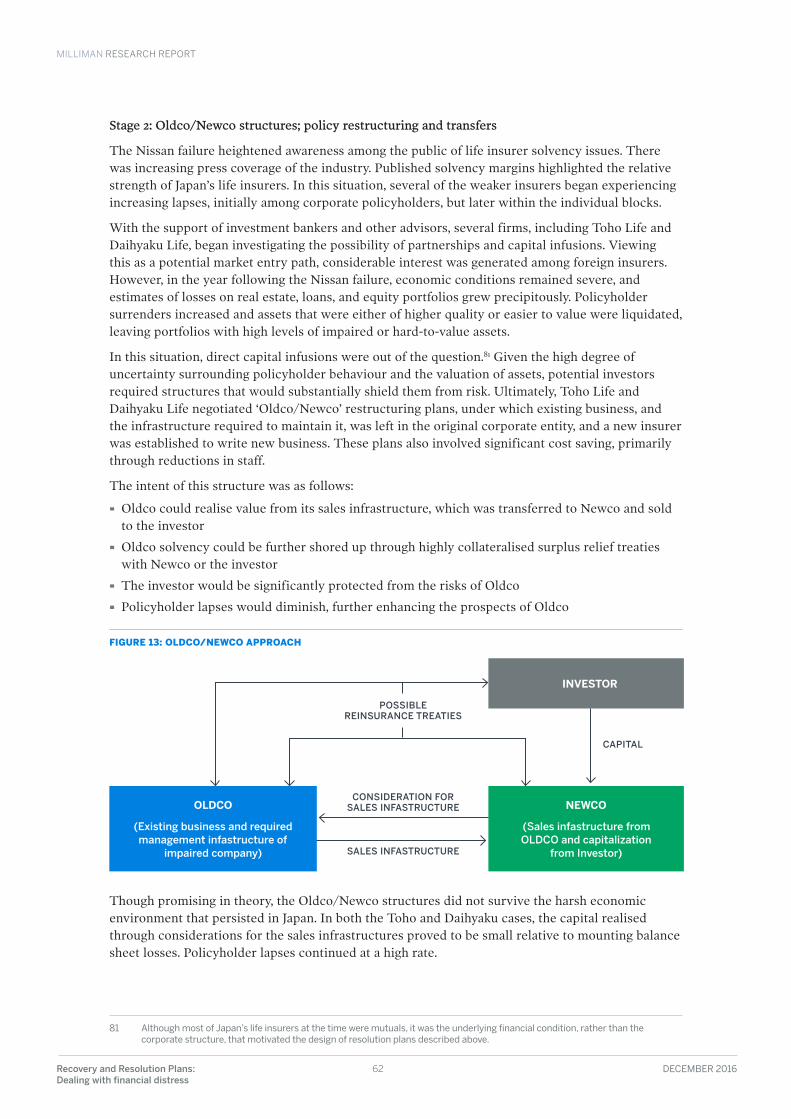
MILLIMAN RESEARCH REPORT
Recovery and Resolution Plans: Dealing with financial distress
62 DECEMBER 2016
Stage 2: Oldco/Newco structures; policy restructuring and transfers
The Nissan failure heightened awareness among the public of life insurer solvency issues. There was increasing press coverage of the industry. Published solvency margins highlighted the relative strength of Japan’s life insurers. In this situation, several of the weaker insurers began experiencing increasing lapses, initially among corporate policyholders, but later within the individual blocks.
With the support of investment bankers and other advisors, several firms, including Toho Life and Daihyaku Life, began investigating the possibility of partnerships and capital infusions. Viewing this as a potential market entry path, considerable interest was generated among foreign insurers. However, in the year following the Nissan failure, economic conditions remained severe, and estimates of losses on real estate, loans, and equity portfolios grew precipitously. Policyholder surrenders increased and assets that were either of higher quality or easier to value were liquidated, leaving portfolios with high levels of impaired or hard-to-value assets.
In this situation, direct capital infusions were out of the question.81 Given the high degree of uncertainty surrounding policyholder behaviour and the valuation of assets, potential investors required structures that would substantially shield them from risk. Ultimately, Toho Life and Daihyaku Life negotiated ‘Oldco/Newco’ restructuring plans, under which existing business, and the infrastructure required to maintain it, was left in the original corporate entity, and a new insurer was established to write new business. These plans also involved significant cost saving, primarily through reductions in staff.
The intent of this structure was as follows:
· Oldco could realise value from its sales infrastructure, which was transferred to Newco and sold to the investor
· Oldco solvency could be further shored up through highly collateralised surplus relief treaties with Newco or the investor
· The investor would be significantly protected from the risks of Oldco
· Policyholder lapses would diminish, further enhancing the prospects of Oldco
FIGURE 13: OLDCO/NEWCO APPROACH
Though promising in theory, the Oldco/Newco structures did not survive the harsh economic environment that persisted in Japan. In both the Toho and Daihyaku cases, the capital realised through considerations for the sales infrastructures proved to be small relative to mounting balance sheet losses. Policyholder lapses continued at a high rate.
81 Although most of Japan’s life insurers at the time were mutuals, it was the underlying financial condition, rather than the corporate structure, that motivated the design of resolution plans described above .
OLDCO
(Existing business and required management infastructure of
impaired company)
NEWCO
(Sales infastructure from OLDCO and capitalization
from Investor)
INVESTOR
CONSIDERATION FORSALES INFASTRUCTURE
POSSIBLEREINSURANCE TREATIES
SALES INFASTRUCTURE
CAPITAL

MILLIMAN RESEARCH REPORT
Recovery and Resolution Plans: Dealing with financial distress
63 DECEMBER 2016
Although a Policyholder Protection Fund had been established in Japan in 1996, there was little precedent or guidance under law regarding the details of an approach to insurer resolution. The Nissan approach to restructuring was very much designed ‘on the fly.’ In December 1998, learning from the Nissan experience and anticipating future insolvencies, a new Policyholder Protection Corporation (PPC) was established to facilitate the resolution process. Industry representatives and regulators worked together to institutionalise an approach, which included guidelines for policyholder benefit cuts and funding of the PPC through annual industry assessments.
When Toho and Daihyaku failed, resolution plans were constructed under the auspices of the new PPC. Toho and Daihyaku policyholders were required to absorb an immediate 10% reduction in reserves and associated cash values. Future interest rate guarantees were reduced to 1.5% in the Toho case and 1.0% in the Daihyaku case. Restructured policies, and the infrastructure necessary to maintain them, were transferred to the previously established Newco entities, which remained wholly owned subsidiaries of the original investors (GE in the case of Toho, and Manulife in the case of Daihyaku).
Stage 3: Judicial resolution and a designated white knight
Following two unsuccessful appeals to an Oldco/Newco structure, and gaining experience through the resolution of these insolvencies, Japan institutionalised a resolution process guided by a court-appointed rehabilitation trustee, working together with the PPC.
As a first step, the trustee worked to identify a potential ‘white knight’ (relief insurance company). If a potential white knight was identified, through a negotiation and due diligence process, the following restructuring components were determined:
· Capital provided by the white knight
· Level of financial assistance provided by the PPC
· New policyholder terms, in particular:
− Policyholder reserve/cash value reduction
− Reduction in guaranteed interest rate
− Level of early surrender charge
− Possible policyholder participation in future upside (dividends)
Many legal structures for the relief company could be possible in theory. For example, the relief company may directly acquire shares of the insolvent company, the insolvent company may be merged into the relief company, or insurance policies may be transferred to the relief company. Regardless of structure, the policy reserve reduction would be limited to 10%; the trustee would aim to negotiate with the relief company to minimise the contribution of the PPC while mitigating negative policyholder impacts.

MILLIMAN RESEARCH REPORT
Recovery and Resolution Plans: Dealing with financial distress
64 DECEMBER 2016
The final three insolvencies that occurred from 1997 to 2001 were handled under this approach. The table in Figure 14 shows key elements of these restructuring plans.
FIGURE 14: KEY ELEMENTS OF RESTRUCTURING PLANS FOR FINAL THREE INSOLVENCIES
Source: Life Insurance Association of Japan.
8.6.3. Lessons learnedEarly action helps to preserve policyholder value
When Japan’s financial problems hit, there was little precedent for dealing with life insurer insolvencies. Given the size of the impaired companies, the high level of balance sheet complexity, and the many competing constituents, it took several years to establish a well-defined resolution process. In developing an approach, it was necessary to balance the interests and views of policyholders, employees, regulators, the broader life insurance industry, and in some cases investors and companies having a close business relationship with the impaired firm.
Several years elapsed from the time that initial rumours began to circulate about corporate impairments and the time that insolvency was officially declared. During this period, high lapses led to substantial cash outflows. Rather than portfolio optimisation, investment management had to focus simply on liquidity—finding assets that could be sold to pay growing policyholder demands.
This is illustrated in the table in Figure 15, which shows reported assets, as at 31 March 1996, of the seven life insurers that failed, and assets as evaluated at the time of failure.
FIGURE 15: ASSETS OF JAPANESE INSURERS
82 Though interest guarantees on new sales were gradually lowered beginning in 1993, a high percentage of the in-force block at these companies had guarantees of roughly 5% to 6% .
INSOLVENT COMPANY CHIYODA LIFE KYOEI LIFE TOKYO LIFE
“WHITE KNIGHT” AIG PRUDENTIAL (US) T&D HOLDINGS
DATE OF INSOLVENCY OCT 13, 2000 OCT 23, 2000 MARCH 31, 2001
DATE OF RESOLUTION APRIL 20, 2001 APRIL 3, 2001 OCT 19, 2001
ASSETS (JPY BILLIONS) 2,233 3,725 690
LIABILITIES (JPY BILLIONS) 2,828 4,414 763
DEFICIT (JPY BILLIONS) 595 689 73
POLICY RESERVE REDUCTION 10% 8% 0%
INTEREST GUARANTEE82 1 .5% 1 .75% 2 .6%
PPC FUNDS PROVIDED 0 0 0
COMPANY ASSETS AT MARCH 31, 1996 (JPY BILLIONS) DATE OF INSOLVENCY ASSETS AT INSOLVENCY
(JPY BILLIONS)
NISSAN 2,167 4/1997 1,823
TOHO 4,994 6/1999 2,190
DAIHYAKU 3,527 5/2000 1,300
TAISHO 238 8/2000 154
CHIYODA 6,443 10/2000 2,233
KYOEI 5,763 10/2000 3,725
TOKYO 1 .556 3/2001 690

MILLIMAN RESEARCH REPORT
Recovery and Resolution Plans: Dealing with financial distress
65 DECEMBER 2016
Had a modern solvency regime and recovery and resolution process been in place in the mid-1990s, regulators and management would have had greater flexibility in designing rehabilitation options. Indeed, had Japan’s current financial reporting and solvency monitoring system been in place 25 years ago, many of the problems that led to insolvency could have been avoided, or they would have been discovered at an earlier stage, allowing implementation of various recovery approaches described elsewhere in this paper.
Benefits of an institutionalised, well-defined process
Over the period from 1997 to 2001, through the course of designing actual resolution plans, a well-defined resolution process was established. Each new situation benefitted from the emergence of experience and establishment of precedents. Given how grave the situation was at Japan’s impaired companies, substantial infrastructure and policyholder value was preserved, especially in the case of the later resolutions.
Think holistically; reflect on all sources of value
When designing an approach to life insurer resolution, it is natural to look first at balance sheet assets and liabilities, in an effort to determine degree of impairment, liquidity needs, and restructuring alternatives. Companies, of course, have significant sources of value beyond balance sheet assets that need to be reflected in the design of a resolution plan, including:
· Sales infrastructure
· Customer base
· Potential unique franchises (e.g., affinity groups)
· Employee expertise
It is critical to appreciate that the fact that a company is impaired does not imply that all aspects of the company are tainted. However, value can dissipate quickly if action is not taken. If sales are through agents, top producers may be poached by rivals. If sales involve brokers or banks, these entities will be quick to distance themselves from a company that is perceived as ‘in trouble.’ Customers, especially group customers, will react quickly to rumours of financial difficulties. Top employees, from investment professionals to IT experts to marketing people will jump ship if their careers are at stake. Thus, while substantial goodwill may exist even in a company with a severely impaired balance sheet, goodwill will diminish quickly with the passage of time.
8 .7 . ‘BAIL-INS’ AND BAIL OUTSThere have been a number of high-profile examples of government bail-outs in the past, whereby public financial support has been provided to financially troubled institutions. The most well-known cases are probably the U.S. government bail-outs of investment banks, such as JPMorgan Chase, Goldman Sachs, and Morgan Stanley, during the global financial crisis in 2008. There are also many high-profile cases of the effects of governments allowing institutions to fail, such as the bankruptcy of Lehman Brothers, also in 2008.
However, following the enormous burden placed on taxpayers in the aftermath of the many government bail-outs that occurred around the globe, regulators are now calling for resolution plans that rely on public financial support as a last resort only.
The FSB Key Attributes Paper states that:
Jurisdictions should have statutory or other policies in place so that authorities are not constrained to rely on public ownership or bail-out funds as a means of resolving firms.

MILLIMAN RESEARCH REPORT
Recovery and Resolution Plans: Dealing with financial distress
66 DECEMBER 2016
THE BANK RECOVERY AND RESOLUTION DIRECTIVEAn example of this is in Europe, where the Bank Recovery and Resolution Directive (BRRD)83 came into force on 1 January 2015 (with the exception of the ‘bail-in tool,’ which came into force on 1 January 2016). The BRRD applies to EU credit institutions (i.e., banks) and large investment firms. Banks subject to direct supervision by the ECB or with a significant84 share of the member state’s financial system must draw up their own Recovery Plans and are the subject of individual Resolution Plans, which are drawn up by resolution authorities,85 sometimes with assistance from the relevant institution.
The Recovery Plans under the BRRD must contain ‘measures to be taken by the institution to restore its financial position following a significant deterioration of its financial situation’ and must be updated at least annually (or following a material change in the bank’s structure or situation). The Recovery Plan may not assume the existence of any extraordinary public financial support. A range of possible recovery measures must be outlined and banks must include a range of severe scenarios, covering both company-specific and relevant general economic stresses. The Recovery Plan should also cover the relevant quantitative or qualitative ‘indicators’ which will be monitored and which will trigger the implementation of the recovery measures outlined within the plan.
The Resolution Plans under the BRRD are drawn up by the resolution authorities,86 sometimes with assistance from the relevant institution. The overall objectives include ensuring the continuity of critical functions and preventing contagion-spreading distress to other institutions, while ensuring shareholders and creditors (as opposed to taxpayers) bear the losses associated with such a failure where possible.
As a last resort, the BRRD states that public financial support may be provided using the following stabilisation tools:
· Public equity support tool: This consists of the state providing capital to the institution in exchange for equity. The business is managed commercially and professionally and sold to the private sector as soon as this is commercially and financially viable.
· Temporary public ownership tool: Shares are transferred to the state and again managed commercially and professionally and sold to the private sector as soon as this is commercially and financially viable.
Notwithstanding the aim of avoiding imposing a financial burden on taxpayers, the BRRD requires that member states establish financial arrangements to the extent necessary to ensure the effective application of the resolution tools, e.g., in order to guarantee the assets/liabilities, provide loans, etc. This may be of the same structure as deposit guarantee schemes. Institutions are required to contribute to this.
Further details are outlined in the following box.
Resolution plans are therefore now required by many regulators to focus on resolution strategies other than public financial support, such as the relatively new phenomenon of a bail-in. This relates to situations whereby investors and/or depositors of institutions would suffer losses in order to recapitalise the institution should it get into financial difficulty.
The Key Attributes Paper outlines the resolution measures open to resolution authorities as part of resolution planning, such as the ability to remove and replace senior management and to carry out a bail-in involving the write-down of equity or other instruments of ownership of the firm, unsecured and uninsured creditor claims and converting unsecured and uninsured creditor claims to equity.
83 Directive 2014/59/EU of the European Parliament and of the Council of 15 May 2014 .
84 ‘Significant’ is defined as the total value of assets exceeding EUR 30 billion or the ratio of total assets over the GDP of the Member State exceeding 20%, unless the total value of assets is below EUR 5 billion .
85 The Resolution Authority is generally the local regulator .
86 Ibid .

MILLIMAN RESEARCH REPORT
Recovery and Resolution Plans: Dealing with financial distress
67 DECEMBER 2016
THE BANK RECOVERY AND RESOLUTION DIRECTIVE (CONTINUED) The BRRD provides for a bail-in tool, which involves resolution authorities using write-down and conversion powers in order to recapitalise the institution (only if there is a reasonable prospect of this leading to a long-term recovery solution for the institution) or in order to convert debt instruments to equity or reduce the principal amount of liabilities or debt (including reducing to zero).
In addition, the BRRD highlights the following other resolution tools, which can be used by regulatory authorities during the resolution of a bank:
· Sale of business tool: Involves the transfer of shares and/or other ownership instruments, or assets, rights, or liabilities, to a third-party purchaser. Every attempt is made to ensure commercial transfer terms.
· Bridge institution tool: Involves the transfer of shares and/or other ownership instruments or assets/rights/liabilities, to a bridge institution which is wholly or partially publically owned and has been created in order to maintain critical functions as an interim solution until the institution is ultimately sold.
· Asset separation tool: involves the transfer of assets, rights or liabilities to an asset management vehicle, which is a wholly or partially publicly owned vehicle and has been created in order to hold the assets, rights or liabilities and either maximise the value with a view to ultimately selling or allowing these to wind down. This tool may only be applied in conjunction with another resolution tool.
The BRRD states that group financial support may only be provided during resolution if there is a reasonable prospect that this support will remedy the financial difficult of the entity. The BRRD gives many powers to supervisory authorities, including the ability to remove senior management or the management body, to appoint an administrator.
The following case study illustrates an example of the actions taken by a government in order to recapitalise failing banks, which resulted in a combination of bail-out and bail-in mechanisms, including many of the resolution tools outlined in the BRRD above. As noted earlier in the paper, the Irish property market crash was one of the most severe crashes experienced globally around the time of the financial crisis. The accompanying financial crisis which occurred in Ireland resulted in a fall in gross national product (GNP) of almost 14% from late 2007 to early 2009 and a steep rise in unemployment.87 The strategies utilised in order to restructure, recapitalise, nationalise, and resolve the Irish banks are worth exploring from the point of view of resolution planning and extreme recovery measures.
CASE STUDY: THE IRISH BANKING CRISISThe Irish banking crisis, which surfaced in 2008, led to a range of government-led resolution strategies. The six Irish banks and building societies which existed at the time were reduced to three, following a combination of nationalisations, liquidations, and mergers. Anglo Irish Bank (Anglo) and Irish Nationwide Building Society (INBS) were nationalised and merged to form Irish Bank Resolution Corporation (IBRC), which was established in order to liquidate these two banks. EBS Building Society was nationalised and merged with Allied Irish Bank (AIB). AIB was itself effectively nationalised. Permanent TSB was separated from the Irish Life and Permanent (IL&P) group, with its insurance arm, Irish Life, being nationalised and eventually sold by the government, while Bank of Ireland received a large government injection but was effectively saved from nationalisation by a group of private investors. In total, the government injected EUR64 billion into the banks and EUR 15.5 billion was raised through Liability Management Exercises such as the conversion of subordinated debt to equity or cash at a large discount.
87 Patrick Honohan (2012) . Recapitalisation of failed banks – some lessons from the Irish experience .

MILLIMAN RESEARCH REPORT
Recovery and Resolution Plans: Dealing with financial distress
68 DECEMBER 2016
CASE STUDY: THE IRISH BANKING CRISIS (CONTINUED)BackgroundWhile many attribute the onset of the Irish banking collapse to the global financial crisis and the drying up of international wholesale funding, the report by the governor of the Central Bank of Ireland (Honohan, 2010) does not share this view. As mentioned in Section 4.1 above, the report outlines how the government misdiagnosed the solvency issues of Irish banks as liquidity issues, mistaking the underlying causes of Ireland’s property bubble for liquidity issues caused by the tightening of credit available on wholesale markets. However, as outlined in the Morgan Kelly University College Dublin working paper entitled ‘The Irish Credit Bubble’ (2009), the problems of Ireland’s banking system were much deeper than that.
Figure 16 illustrates the basic principles of Ireland’s property bubble. The drying up of wholesale funding in September 2008 led to liquidity issues for the Irish banks, but this merely masked the underlying issues at play, which would ultimately have threatened the solvency of many Irish banks, regardless of international events.
FIGURE 16: IRELAND’S PROPERTY BUBBLE
Crisis managementIn September 2008, when the first signs of trouble in the Irish banks began to emerge, the Irish government announced it would guarantee the liabilities of the Irish banking system88 in order to prevent its collapse. This improved the liquidity of Irish banks but it did not address the underlying issues of the banks’ loan portfolios, which were in fact a solvency issue, as described above. The scope of the guarantee included long-term bonds and dated subordinated debt, but not undated (perpetual) subordinated debt.
Resolution strategies employed during Irish banking crisisIt was apparent in late 2008 that the troubles at Anglo Irish Bank were the most serious of the Irish banks. Initially, AIB and Bank of Ireland agreed with the government to provide a total of EUR 5 billion short-term financing (a few days only) for Anglo Irish Bank, which would be guaranteed by the government. The government also made up to EUR 3 billion available through an asset swap in relation to Anglo Irish Bank. However, Anglo was nationalised in January 2009 with a total state investment of EUR 29.3 billion between 2009 and 2010, through a combination of ordinary share capital purchases and the issuance of promissory notes.89
88 Patrick Honohan (2010) . The Irish Banking Crisis Regulatory and Financial Stability Policy 2003-2008 .
89 House of the Oireachtas (January 2016) . Report of the Joint Committee of Inquiry Into the Banking Crisis: Volume 3: Evidence . Retrieved 26 October 2016 from http://opac.oireachtas.ie/AWData/Library3/Banking/BIDOFCoreBook30.pdf .
Boo
m in
construction
Rise in mortgages drives
increasing house prices
drive higher mort
gage
s
Increasing house p
rice
sto property developers
and mortgages
Bo
om in bank lending
Property pricescontinue to rise
Bursts when borrowers cannotborrow any more money andcannot service existing debts.
Vacant properties and largeoutstanding loans to developers.
Mortgage defaults due to riskylending and unemployment.
Economic boom:Increased wages acrossall industry, increasedtax revenue andgovernment spending.
Heavy reliance onwholesale funding.

MILLIMAN RESEARCH REPORT
Recovery and Resolution Plans: Dealing with financial distress
69 DECEMBER 2016
CASE STUDY: THE IRISH BANKING CRISIS (CONTINUED)INBS followed suit, being nationalised in 2010, and later merged with Anglo in July 2011, to form Irish Bank Resolution Corporate (IBRC).90 IBRC entered liquidation in February 2013. The state’s investment in INBS was EUR 5.4 billion, again through a combination of ordinary share capital and promissory notes.
The two main banks, AIB and Bank of Ireland, were also in grave financial difficulty. In February 2009, the government purchased EUR 3.5 billion in preference shares in each of the two largest banks, AIB and Bank of Ireland, in order to improve their financial position. AIB continued to receive government investment, with a further EUR 4.6 billion invested in 2010. AIB merged with EBS, a relatively small building society effectively nationalised following a EUR 0.875 billion government investment, in July 2011.91 Finally, following the Prudential Capital Adequacy Review (PCAR) in 2011, the government invested a further EUR 12.7 billion into AIB and EUR 1.2 billion in Bank of Ireland in order to ensure the banks were sufficiently capitalised to withstand adverse future events.
The Irish Life and Permanent group was separated in 2011, with the banking side, Permanent TSB, requiring state investment of EUR 2.7 billion following the PCAR, and the life insurance arm, Irish Life purchased by the government for EUR 1.3 billion and later sold to Great-West Lifeco in 2013 for the same amount.
The total recapitalisation of Irish banks between 2009 and 2011 was EUR 80 billion, of which EUR 64 billion came from the government and EUR 15.5 billion came from Liability Management Exercises (i.e., burden-sharing with subordinated bondholders).
The breakdown of the government’s EUR 64 billion capitalisation of Irish banks (of which EUR 20.7 billion came from the National Pension Fund Reserve) is outlined in the table in Figure 17.92 The net position for the government after various recoveries, repayments, and returns subsequent to the recapitalisation was EUR 38.1 billion as at 13 April 2015.
FIGURE 17: STATE INVESTMENT IN IRISH BANKS
90 An Ronan Airgeadais Department of Finance (29 March 2012) . What We Do: Irish Bank Resolution Corporation . Retrieved 26 October 2015 from http://www.finance.gov.ie/what-we-do/banking-financial-services/shareholding-management-unit/irish-bank-resolution-corporation.
91 An Ronan Airgeadais Department of Finance (29 March 2012) . What We Do: Allied Irish Banks . Retrieved 26 October 2016 from http://www.finance.gov.ie/what-we-do/banking-financial-services/allied-irish-banks .
92 Report of the Joint Committee of Inquiry Into the Banking Crisis . Appendix 1: Inquiry Framework Overview . Retrieved 26 October 2016 from https://inquiries.oireachtas.ie/banking/volume-1-report/appendix-1 .
BANK INITIAL STATE INVESTMENT (€ BILLION)
ALLIED IRISH BANK / EBS 20 .8
BANK OF IRELAND 4 .7
PERMANENT TSB (IL&P) 4 .0
ANGLO IRISH BANK 29 .3
IRISH NATIONWIDE BUILDING SOCIETY 5 .4
TOTAL 64.1

MILLIMAN RESEARCH REPORT
Recovery and Resolution Plans: Dealing with financial distress
70 DECEMBER 2016
CASE STUDY: THE IRISH BANKING CRISIS (CONTINUED) After the above recapitalisation of the banks, the state owned 99.8% of AIB, 99.2% of Permanent TSB, and 36% of Bank of Ireland. In addition, it had nationalised Anglo Irish Bank, Irish Nationwide Building Society, and effectively EBS, which it merged with AIB. A group of private investors subsequently injected capital into Bank of Ireland during 2011, reducing the government’s stake down to 15%.93
The Liability Management Exercises involved the banks buying back subordinated bonds for cash (at a heavy discount) or converting their subordinated debt to equity. The banks wrote to subordinated bondholders with such offers and, given the lack of options available to such investors, the majority accepted them. The breakdown of the burden shared with the banks is outlined in the table in Figure 18.94
FIGURE 18: IRISH BANKS LIABILITY MANAGEMENT EXERCISES (2009-2011)
Looking ahead, the relatively new concept of a ‘bail-in’ for banks may be the measure used in future if banks get into financial difficulty. The EU BRRD, discussed above, provides for a bail-in tool, which involves resolution authorities using write-down and conversion powers in order to recapitalise the institution (only if there is a reasonable prospect of this leading to a long-term recovery solution for the institution) or in order to convert debt instruments to equity or reduce the principal amount of liabilities or debt (including reducing to zero). This bail-in approach would involve losses being shared with bondholders and depositors rather than solely being borne by the government (i.e., taxpayers).
BANK REDUCTION IN LIABILITIES (€ BILLION)
ALLIED IRISH BANK (AIB) 5 .2
BANK OF IRELAND 4 .6
PERMANENT TSB (IL&P) 1 .0
ANGLO IRISH BANK 3 .7
IRISH NATIONWIDE BUILDING SOCIETY 0 .4
EBS 0 .2
OTHER 0 .4
TOTAL 15.5
Resolution and extreme recovery measures were also taken in order to recapitalise the Spanish banking industry, as outlined in the following case study. Valuable insights into and feedback from the recovery and resolution planning process were also highlighted during this process, which could be taken into account when developing RRPs outside of the banking industry.
93 Bank of Ireland Annual Report (2011) .
94 Report of the Joint Committee of Inquiry Into the Banking Crisis (2013) . Houses of the Oireachtas (Inquiries, Privileges, and Procedures) Act .

MILLIMAN RESEARCH REPORT
Recovery and Resolution Plans: Dealing with financial distress
71 DECEMBER 2016
CASE STUDY: RESOLUTION, RECOVERY, AND RECAPITALISATION OF THE SPANISH BANKING SECTORIn July 2012, the Eurogroup granted financial assistance of up to EUR 100 billion to Spain, of which EUR 41 billion was eventually accessed, in order to rescue the country’s deeply troubled banking industry. The European Commission in its paper on the Financial Sector Assistance Program for Spain (January 2016) states that: ‘The banking crisis in Spain exposed weaknesses in several areas: governance problems in savings banks, inadequate management of macro prudential risks, and lack of adequate crisis resolution tools.’
The dependence of the Spanish economy on a continually rising real estate market, particularly housing, meant that when interest rates began rising (2006) and financing conditions also tightened because of the global financial crisis (2007 to 2008), house prices in Spain started to fall markedly, which negatively affected the real economy in the areas of consumption, investment, and employment. By mid-2008, Spain had entered into recession.
In Spain, as per some other Euro area countries, there was also an important interdependence between banking sector and government credit risks, given the implicit government guarantees underpinning the sector and in turn the large volume of investment by the banks in government securities. As a result, the sovereign debt crisis, which had intensified during 2010 to 2012, extended the banking sector’s and the country’s problems. In mid-2011 Spain had entered into a second recession.
The resolution actions taken to stabilise the Spanish banking sector can be divided into two main waves: before and after June 2012, when Spain informed the EU of its intention to apply for EU financing assistance.
The first wave of resolutions was introduced and implemented gradually and in a haphazard way. The main resolutions directly affecting the banking sector were:
· New laws and regulations were gradually introduced between 2010 and early 2012 addressing the governance, voting rights, and ownership of the savings banks, whose governing bodies up until then were largely dominated by local and regional governments, union representatives, and ex-politicians. However, the pace of change in governance was slow.
· New capital requirements, introduced in February 2011, came into force six months later. The minimum required capital ratio for banks was raised to 8%, and 10% for non-listed banks under certain conditions, effectively the savings banks. The introduction of the higher capital requirements had a marked impact on the sector. Most of the savings banks created a commercial bank into which to transfer their banking operations to take advantage of the lower of the capital requirements. The move also stimulated the real consolidation of the banking sector, which up until then was effected under a mutual type consolidation of savings banks that really had no impact.
· A Fund for Orderly Restructuring of the Banking Sector (FROB) was set up by the Spanish government in 2009, after the first banks had been intervened, in order to manage the reorganisation of the banking sector and to inject equity into the banking entities during the reorganisation. The FROB would later be the channel through which EU financing assistance would go.
In July 2012, the Eurogroup granted financial assistance up to EUR 100 billion to Spain, of which EUR 41 billion was eventually accessed. The assistance was conditional on a number of actions being taken in the areas of banking regulation, segregation of impaired assets, recapitalisation, and restructuring of banks. Importantly, assistance would only be granted to entities that presented restructuring and recapitalisation plans and only after the review and approval of such plans by the European Commission.

MILLIMAN RESEARCH REPORT
Recovery and Resolution Plans: Dealing with financial distress
72 DECEMBER 2016
CASE STUDY: RESOLUTION, RECOVERY, AND RECAPITALISATION OF THE SPANISH BANKING SECTOR (CONTINUED)The actions the Spanish authorities had to take in order to receive Eurogroup financial assistance following Spain’s request in June 2012 were:
· Independent review of the position of each bank: A total 90% of the sector was subject to an independent review by an external consultancy in two main areas: asset quality and valuation, and the results of a sector-wide stress test to determine capital requirements. The stress test and subsequent external review introduced more transparency on the real position of the sector and allowed a credible basis on which to formulate plans.
· Restructuring and recapitalisation plans: Plans for restructuring and recapitalisation were formulated based on capital identified in the stress test and needed to be reviewed and approved by the European Commission in order for Spanish banks to be able to access EU funding. This requirement introduced discipline in the process under tight deadlines.
· Transfer of impaired assets: A separate asset management entity (SAREB) was set up to receive impaired assets from banks that accessed EU funding. The transfer of these assets was a fundamental tool for the recapitalisation of these banks. SAREB is 45% owned by the FROB and 55% by private wholesale investors, including some banks.
Additional actions taken in Spain around this time were:
· Facilitating ‘burden sharing’: Laws were introduced to allow banks to voluntarily finance their recapitalisation through haircuts and/or conversion of preference shares and subordinated debt. This was compulsory for banks controlled by the FROB.
· Temporary financing facility for potentially viable banks: Certain banks had capital shortfalls under the stress tests but had access to private funding and viable restructuring plans. In these cases, they were able to issue contingent convertible bonds (CoCos) that were purchased by the FROB. At 30 June 2013, the bonds needed to be repurchased in the case that the bank had reached its planned funding levels using private means. If these levels were not reached, the bonds would have converted to being equity owned by the FROB, meaning that effectively it had received public assistance.
The experience from the second wave of resolutions associated with the EU’s Financial Sector Assistance Program for Spain highlights the importance and the result of having viable RRPs in place. Six months after Spain applied for EU financing, the RRPs for the eight banks requiring public assistance had been adopted (two others had been absorbed into other banks) and no further public assistance was required thereafter.
The viability of the RRPs was driven by various factors that can be applied to the insurance and other sectors:
· Credible and transparent information: The stress test and the independent review of its results, along with the valuation of assets, gave credible and comparable information on which to base all further actions.
· Critical review of plans: The plans were submitted for review and approval by a third party (EU), which was also a stakeholder in the resolution—the provider of the funding. Furthermore, banks were effectively forced to produce viable RRPs because EU assistance depended on it.
· Availability of tangible solutions: Tangible solutions for recapitalisation had to be available. Therefore, in addition to EU assistance, solutions such as the previously mentioned creation of SAREB and the temporary financing facility gave banks other options.
· Consideration of all stakeholders: The role of all of the stakeholders in the sharing of the costs of recapitalisation was taken into account, allowing for the haircut (in some cases substantial), mainly on preference shares and subordinated debt. Priority was given to the protection of depositors, over other stakeholders.

MILLIMAN RESEARCH REPORT
Recovery and Resolution Plans: Dealing with financial distress
73 DECEMBER 2016
CASE STUDY: RESOLUTION, RECOVERY, AND RECAPITALISATION OF THE SPANISH BANKING SECTOR (CONTINUED) For the Spanish banks that did not access EU funding assistance, recapitalisation was still a necessity and a significant challenge during the financial crisis, which was due to, for example, tightening funding conditions, large write-offs on and provisioning against bad loans, a marked increase in non-performing loans, and increases in capital requirements. A number of actions were taken, including:
· Sale of certain insurance operations: through distribution agreements on future new business, and outright (partial) sale of insurance operations and monetisation of future profits in life insurance risk protection portfolios.
· Sale of other assets and business units: through non-performing loan portfolios, holdings in real estate assets on bank balance sheets, asset/fund management operations, strategic participations in foreign banks or non-financial institutions.
· Absorption of distressed banks: at sometimes favourable rates and with government guarantees limiting potential losses.
· Restructuring of financing: dividend reduction, rights issues, on-market issue of debt.
· Large investment: in high-yielding Spanish government securities.
· Operational improvements to improve expenses: integration of local business units and distribution networks, and significant reduction in the number of bank branches.

MILLIMAN RESEARCH REPORT
Recovery and Resolution Plans: Dealing with financial distress
74 DECEMBER 2016
9. ReferencesAn Roinn Airgeadais Department of Finance (20 July 2015), Shareholding Management Unit. Retrieved 27 October 2016 from http://www.finance.gov.ie/what-we-do/banking-financial-services/shareholding-management-unit/shareholding-management-unit.
Clarke, S. et al. (July 2014), Capital Management in a Solvency II World. Milliman Research Report. Retrieved 27 October 2016 from http://www.milliman.com/uploadedFiles/insight/2014/capital-management-solvency-II.pdf.
European Banking Authority (2014). Recovery, Resolution, and DGS. Regulation and Policy. Retrieved 27 October 2016 from https://www.eba.europa.eu/regulation-and-policy/recovery-and-resolution/-/topic-documents/Xi4OFof6bLJc/more.
European Banking Authority (2015), Guidelines on Business Reorganisation Plans. Regulation and Policy. Retrieved 27 October 2016 from https://www.eba.europa.eu/regulation-and-policy/recovery-and-resolution/guidelines-on-business-reorganisation-plans/-/regulatory-activity/press-release.
European Banking Authority (5 March 2015), Recovery Planning: Comparative Report on the Approach to Determining Critical Functions and Core Business Lines in Recovery Plans. EBA Report. Retrieved 27 October 2016 from https://www.eba.europa.eu/documents/10180/950548/EBA+Report+-+CFs+and+CBLs+benchmarking.pdf.
European Banking Authority (8 December 2015). Recovery Planning: Comparative Report on the Approach Taken on Recovery Plan Scenarios. EBA Report. Retrieved 27 October 2016 from https://www.eba.europa.eu/documents/10180/950548/Report+on+benchmarking+scenarios+in+recovery+plans.pdf.
European Banking Authority (5 July 2016). EBA Publishes Analysis on Governance Arrangements and Indicators for Recover Plans. Press release. Retrieved 27 October 2016 from https://www.eba.europa.eu/-/eba-publishes-analysis-on-governance-arrangements-and-indicators-for-recovery-plans.
European Central Bank (February 2014), Experimental Indicators of Commercial Property Prices. ECB Monthly Bulletin. Retrieved 27 October 2016 from https://www.ecb.europa.eu/pub/pdf/other/mb201402_focus07.en.pdf.
European Insurance and Occupational Pensions Authority (11 January 2016). EIOPA Annual Work Programme 2016. Retrieved 27 October 2016 from https://eiopa.europa.eu/Publications/Administrative/AWP_2016.pdf.
European Parliament and Council (15 May 2014). Directive 2014/59/EU of the European Parliament and of the Council of 15 May 2014 (The Bank Recovery and Resolution Directive). Retrieved 27 October 2016 from http://eur-lex.europa.eu/legal-content/en/TXT/?uri=CELEX%3A32014L0059.
European Parliament and Council (25 November 2009). Directive 2009/138/EC of the European Parliament and of the Council of 25 November 2009 (Solvency II). Retrieved 27 October 2016 from http://eur-lex.europa.eu/legal-content/EN/TXT/?uri=CELEX%3A02009L0138-20140523.
Financial Stability Board (October 2011). Key Attributes of Effective Resolution Regimes for Financial Institutions. Retrieved 27 October 2016 from http://www.fsb.org/wp-content/uploads/r_111104cc.pdf?page_moved=1.
Financial Stability Board (2014). Key Attributes of Effective Resolution Regimes for Financial Institutions. Retrieved 27 October 2016 from http://www.fsb.org/2014/10/r_141015/.
Financial Stability Board (6 June 2016). Developing Effective Resolution Strategies and Plans for Systemically Important Insurers. Retrieved 27 October 2016 from http://www.fsb.org/2016/06/developing-effective-resolution-strategies-and-plans-for-systemically-important-insurers/.
MILLIMAN RESEARCH REPORT
Recovery and Resolution Plans: Dealing with financial distress
75 DECEMBER 2016
Financial Stability Board (18 August 2016). Guidance on Arrangements to Support Operational Continuity in Resolution. Retrieved 27 October 2016 from http://www.fsb.org/2016/08/guidance-on-arrangements-to-support-operational-continuity-in-resolution/.
Financial Stability Board (18 August 2016). Guiding Principles on the Temporary Funding Needed to Support the Orderly Resolution of a Global Systemically Important Bank (‘G-SIB’) Retrieved 27 October 2016 from http://www.fsb.org/2016/08/guiding-principles-on-the-temporary-funding-needed-to-support-the-orderly-resolution-of-a-global-systemically-important-bank-g-sib/.
Financial Stability Board (18 August 2016). Resilience Through Resolvability – Moving From Policy Design to Implementation. Retrieved 27 October 2016 from http://www.fsb.org/2016/08/resilience-through-resolvability-moving-from-policy-design-to-implementation/.
Honohan, P., Governor of the Central Bank (31 May 2010), The Irish Banking Crisis Regulatory and Financial Stability Policy 2003-2008. Retrieved 27 October 2016 from http://www.bankinginquiry.gov.ie/The%20Irish%20Banking%20Crisis%20Regulatory%20and%20Financial%20Stability%20Policy%202003-2008.pdf.
International Association of Insurance Supervisors (18 July 2013). Global Systemically Important Insurers: Initial Assessment Methodology. Retrieved 27 October 2016 from http://www.iaisweb.org/page/supervisory-material/financial-stability-and-macroprudential-policy-and-surveillance/file/34257/final-initial-assessment-methodology-18-july-2013.
International Association of Insurance Supervisors (18 July 2013). Global Systemically Important Insurers: Policy Measures. Retrieved 27 October 2016 from http://www.iaisweb.org/page/supervisory-material/financial-stability-and-macroprudential-policy-and-surveillance/file/34256/final-g-siis-policy-measures-18-july-2013.
International Association of Insurance Supervisors (16 June 2016). Global Systemically Important Insurers: Updated Assessment Methodology. Retrieved 27 October 2016 from http://www.iaisweb.org/page/supervisory-material/financial-stability-and-macroprudential-policy-and-surveillance/file/61179/updated-g-sii-assessment-methodology-16-june-2016.
Kelly, M. (15 January 2009). The Irish Property Bubble: Causes and Consequences. Retrieved 27 October 2016 from http://www.irisheconomy.ie/Crisis/KellyCrisis.pdf.
Kelly, M. (December 2009). The Irish Credit Bubble. University College Dublin Centre for Economic Research Working Paper. Retrieved 27 October 2016 from https://www.ucd.ie/t4cms/wp09.32.pdf.
Mitchell, S. and Inserra, L. (July 2013). VIF Monetisation for European Life Insurers: A Re-emerging Trend. Milliman White Paper. Retrieved 27 October 2016 from http://ie.milliman.com/uploadedFiles/insight/2013/vif-monetisation.pdf.
Oireachtas (2016), Report of the Joint Committee of Inquiry Into the Banking Crisis. Retrieved 27 October 2016 from https://inquiries.oireachtas.ie/banking/.
Oireachtas (January 2016). Report of the Joint Committee of Inquiry into the Banking Crisis: Volume 3: Evidence. Retrieved 27 October 2016 from http://opac.oireachtas.ie/AWData/Library3/Banking/BIDOFCoreBook30.pdf#page=039.
Phelan, E. and O’Malley, P. (4 December 2013). ORSA: An International Requirement. Milliman Research Report. Retrieved 27 October 2016 from http://us.milliman.com/insight/2013/ORSA-An-international-requirement/.
Prudential Regulation Authority (December 2013), Policy Statement: Recovery and Resolution Plans. Retrieved 27 October 2016 from http://www.bankofengland.co.uk/pra/Documents/publications/policy/2013/recoveryresolution8-13.pdf.

Milliman is among the world’s largest providers of actuarial and
related products and services . The firm has consulting practices in
life insurance and financial services, property & casualty insurance,
healthcare, and employee benefits . Founded in 1947, Milliman is an
independent firm with offices in major cities around the globe .
milliman.com
CONTACT
Eoin [email protected]
Bridget [email protected]
©2016 Milliman, Inc. All Rights Reserved. The materials in this document represent the opinion of the authors and are not representative of the views of Milliman, Inc. Milliman does not certify the information, nor does it guarantee the accuracy and completeness of such information. Use of such information is voluntary and should not be relied upon unless an independent review of its accuracy and completeness has been performed. Materials may not be reproduced without the express consent of Milliman.
U.S. Federal Reserve (28 July 2015). Agencies Provide Feedback to Nonbank Firms on Resolution Plans. Press release. Retrieved 27 October 2016 from https://www.federalreserve.gov/newsevents/press/bcreg/20150728a.htm.
U.S. Federal Reserve (13 April 2016). Agencies Announce Determination and Provide Feedback on Resolution Plans of Eight Systemically Important, Domestic Banking Institutions. Press release. Retrieved 27 October 2016 from https://www.federalreserve.gov/newsevents/press/bcreg/20160413a.htm.
U.S. Federal Reserve (13 April 2016), Resolution Plan Assessment Framework and Firm Determinations (2016). Retrieved 27 October 2016 from https://www.federalreserve.gov/newsevents/press/bcreg/bcreg20160413a2.pdf.
U.S. Federal Reserve (30 June 2016). Resolution Plans. Retrieved 27 October 2016 from https://www.federalreserve.gov/bankinforeg/resolution-plans.htm.