recycling and reuse of treated wastewater in urban india · 2017-07-10 · resource recovery &...
TRANSCRIPT
RESOURCE RECOVERY & REUSE SERIES 8
Recycling and Reuse of Treated Wastewater in
Urban India
A Proposed Advisory and Guidance Document
8

About the Resource Recovery and Reuse Series Resource Recovery and Reuse (RRR) is a subprogram of the CGIAR Research Program on Water, Land and Ecosystems (WLE) dedicated to applied research on the safe recovery of water, nutrients and energy from domestic and agro-industrial waste streams. This subprogram aims to create impact through different lines of action research, including (i) developing and testing scalable RRR business models, (ii) assessing and mitigating risks from RRR for public health and the environment, (iii) supporting public and private entities with innovative approaches for the safe reuse of wastewater and organic waste, and (iv) improving rural-urban linkages and resource allocations while minimizing the negative urban footprint on the peri-urban environment. This sub-program works closely with the World Health Organization (WHO), Food and Agriculture Organization of the United Nations (FAO), United Nations Environment Programme (UNEP), United Nations University (UNU), and many national and international partners across the globe. The RRR series of documents present summaries and reviews of the sub-program’s research and resulting application guidelines, targeting development experts and others in the research for development continuum.
Science with a human face
IN PARTNERSHIP WITH:

Recycling and Reuse of Treated Wastewater in Urban India
A Proposed Advisory and Guidance Document
RESOURCE RECOVERY & REUSE SERIES 8

ii
World Bank. Water and Sanitation Program (WSP); International Water Management Institute (IWMI). 2016. Recycling and reuse of treated wastewater in urban India: A proposed advisory and guidance document. Colombo, Sri Lanka: International Water Management Institute (IWMI). CGIAR Research Program on Water, Land and Ecosystems (WLE). 57p. (Resource Recovery and Reuse Series 8). doi: 10.5337/2016.203
ISSN 2478-0510e-ISSN 2478-0529ISBN 978-92-9090-834-0
/ wastewater treatment / water reuse / recycling / sewage / urban areas / urban development / policy making / wastewater irrigation / water resources / water supply / freshwater / water demand / groundwater irrigation / pumping / sanitation / pollution / economic value / cost recovery / agriculture / nutrients / industrial uses / fertilizers / greenhouse gases / energy consumption / farm income / farmers / India /
Copyright © 2016, CGIAR Research Program on Water, Land and Ecosystems, International Water Management Institute (IWMI).
Unless otherwise noted, you are free to copy, duplicate or reproduce, and distribute, display, or transmit any part of this paper or portions thereof without permission, and to make translations, adaptations or other derivative works under the following conditions:
ATTRIBUTION. The work must be attributed but not in any way that suggests endorsement by WLE or the author(s).
NON-COMMERCIAL. This work may not be used for commercial purposes.
SHARE ALIKE. If this work is altered, transformed, or built upon, the resulting work must be distributed only under the same or similar Creative Commons license to this one.
Front cover photograph: Woman working on a farm in Tamil Nadu, India (photo: Hamish John Appleby/IWMI).
Designer: W. D. A. S. Manike
The authorsThe Water and Sanitation Program (WSP) is a multi-donor partnership, part of the World Bank Group’s Water Global Practice, supporting poor people in obtaining affordable, safe and sustainable access to water and sanitation services. WSP works directly with client governments at the local and national level in 25 countries through regional offices in Africa, East and South Asia, Latin America and the Caribbean, and Washington DC. The program places a strong focus on capacity building by forming partnerships with academia, civil society organizations, donors, governments, media, private sector and others. The International Water Management Institute (IWMI) is a non-profit, scientific research organization focusing on the sustainable use of water and land resources in developing countries. It is headquartered in Colombo, Sri Lanka, with regional offices across Asia and Africa. IWMI works in partnership with governments, civil society and the private sector to develop scalable agricultural water management solutions that have a real impact on poverty reduction, food security and ecosystem health. IWMI is a member of CGIAR, a global research partnership for a food-secure future.

iii
ContEntsList of Figures ................................................................................................................................................iv
List of Tables ..................................................................................................................................................iv
List of Boxes ...................................................................................................................................................v
List of Appendixes .........................................................................................................................................vi
Acknowledgements ......................................................................................................................................vii
Abbreviations and Acronyms .....................................................................................................................viii
Advisory and Guidance – Notes for Policy Makers ......................................................................................1
Purpose and Scope .........................................................................................................................................4
Introduction ................................................................................................................................................4
Water Demands by Sectors and the Demand–Supply Gap .............................................................................4
The Growing Urban Sanitation Challenge .......................................................................................................6
Recycled Wastewater – an Alternative Water Resource ..................................................................................6
Regulatory and Policy Guidance on Wastewater Recycling and Reuse ...........................................................6
Technological Options and Treatment Levels ..................................................................................................7
Economic and Financial Benefits of Wastewater Recycling and Reuse ..................................................10
Recycled Wastewater – an Additional, Reliable and Cost Effective Source of Water ......................................11
Wastewater Recycling – Offsetting the Need for Additional Sources of Water .........................................11
Recycled Wastewater – an Affordable and Assured Source of Water for Industries .................................11
Wastewater Recycling to Meet Agricultural Water Demand .....................................................................12
Wastewater Recycling in New Urban Growth Areas – Planned Reuse for
Non-potable Requirements ....................................................................................................13
Sale of Recycled Water – a Source of Revenue for Urban Local Bodies (ULBs) ............................................13
Valuing the Nutrients Present in Wastewater .................................................................................................14
Economic Value of the Nutrient Load in Wastewater ...............................................................................14
Reduction in Fertilizer Use on Account of Wastewater Irrigation ..............................................................14
Increase in Overall Farm Income Due to Wastewater Irrigation ................................................................14
Reduction in Ground Water Pumping Due to Wastewater Irrigation ..............................................................16
iv
Reduction in Energy Requirements Due to Reduced Water Pumping for Irrigation ..................................16
Greenhouse Gas Mitigation from Use of Treated Wastewater for Irrigation ..............................................16
Way Forward ..............................................................................................................................................16
Initiatives at the State Level ..........................................................................................................................17
Initiatives at the Utility Level ..........................................................................................................................18
References ..............................................................................................................................................20
Appendixes ....................................................................................................................................................22
LIst of fIGuREs Figure 1. Cost of supplying water to industries in selected Indian cities. .............................................................5
Figure 2. Balancing treatment with recycled wastewater use..............................................................................9
Figure 3. Unit capital cost of treatment for different types of wastewater treatment. .........................................10
Figure 4. Financial and economic analysis of wastewater recycling solutions. ..................................................11
Figure 5. Cost and energy requirements versus P recovery for different recovery options. ................................15
Figure A1.1 Current and projected water demands in India. .............................................................................22
Figure A3.1. Cost of inadequate sanitation (billion INR). ...................................................................................26
Figure A3.2. Sanitation, treatment and access to water in India .......................................................................27
Figure A7.1. Water deficit till 2031, accounting for technical losses. .................................................................33
Figure A8.1. Revenue comparison for WW recycling and the distant surface water option for
Hyderabad. ...........................................................................................................................36
Figure A11.1. A generic example of the multiple-barrier approach for consumption-related risks
along the food chain as applied in wastewater irrigation. ........................................................45
LIst of tAbLEsTable 1. Industrial tariff levied for freshwater in various states/cities. .................................................................12
Table 2. Comparison of ground water irrigation and wastewater irrigation potential for different
crop season ..........................................................................................................................16
Table A1.1. Water consumption in the industrial sector in India ...................................................................... 23

v
Table A2.1. Indian city water source .................................................................................................................24
Table A4.1. Classification of water reuse applications ......................................................................................28
Table A7.1. Total water demand estimates for Hyderabad till 2031...................................................................33
Table A7.2. Water supply situation and wastewater availability for recycling and reuse .....................................34
Table A9.1. List of major industrial clusters in India ...........................................................................................38
Table A9.2. Wastewater generation and potential for industrial reuse. ..............................................................39
Table A9.3. Potential for industrial reuse in Indian states and UTs. ....................................................................39
Table A10.1. Water quality guidelines for various reuse applications .................................................................40
Table A10.2. Examples of different kinds of hazards associated with municipal wastewater which
are of concern in reuse applications. ......................................................................................41
Table A10.3. Examples of indicator organisms for human pathogens in wastewater. ........................................42
Table A10.4. Removal levels of microorganisms (in log reductions) and chemicals (in %) using
treatment options. .................................................................................................................43
Table A10.5. Health-protection control measures and associated pathogen reductions. ..................................44
Table A13.1. Incremental benefits delivered due to wastewater irrigation in selected cities. ..............................47
LIst of boxEsBox 1. Cities sourcing water from distant/expensive sources. ............................................................................5
Box 2. The basics of wastewater recycling. .......................................................................................................7
Box 3. On-site, decentralized and off-site wastewater treatment systems. .........................................................8
Box 4. Decentralized sewage treatment and recycling of water in Auroville, Pondicherry. ...................................8
Box 5. Benefits of wastewater recycling to industries. ......................................................................................12
Box 6. Constraints on financial sustainability of wastewater recycling for agricultural reuse. .............................13
Box 7. Phosphorus recovery from wastewater. ................................................................................................15
Box A8.1. Bangalore. ......................................................................................................................................35
Box A8.2. Water supply situation in Chennai. ...................................................................................................37

vi
LIst of APPEndIxEsAppendix 1. Current and Projected Water Demands in India ............................................................................22
Appendix 2. Cities Sourcing Water from Distant Sources .................................................................................24
Appendix 3. Economic Costs of Inadequate Sanitation ....................................................................................26
Appendix 4. International Guiding Frameworks for Wastewater Recycling and Reuse ......................................28
Appendix 5. Implementation Arrangement for Management of Wastewater Treatment Facilities .......................29
Appendix 6. International Experience on Wastewater Recycling .......................................................................31
Appendix 7. Hyderabad: The Supply-Demand Gap and Using Wastewater Recycling to Meet
the Deficit ..............................................................................................................................33
Appendix 8. Comparison of Financial Implications of Options to Augment Water Supply in Cities ....................35
Appendix 9. Potential for Industrial Reuse in India ............................................................................................38
Appendix 10. Health Considerations When Using Recycled and Treated Wastewater ......................................40
Appendix 11. Safe Use of Wastewater for Irrigation without Sufficient Conventional Treatment ........................45
Appendix 12. Examples of Sale of Treated Wastewater to Industries ................................................................46
Appendix 13. Review of Incremental Benefits Delivered Due to Wastewater Irrigation ......................................47

vii
ACknoWLEdGEmEntsThe Task Team Leader for supervising the development of this Advisory Note was Joseph Ravi Kumar. The research and drafting team comprised Rajiv Raman and Shubhra Jain.
The drafting team appreciates the support provided by the Central Public Health and Environmental Engineering Organization, Ministry of Urban Development, Delhi, and is grateful for the data and support provided by the cities of Hyderabad (HMWSSB), Chennai (CMWSSB) and Bangalore (BWSSB).
The team appreciates inputs and advice received from the International Water Management Institute (IWMI), especially Dr. Priyanie Amerasinghe, Dr. Pay Drechsel and Krishna Rao. Researchers from IWMI provided valuable inputs on the health implications of wastewater recycling and approaches
to ensure safe water reuse and designed several components of the suggested advisory. IWMI also contributed to the discussion on nutrient recovery from wastewater along with other inputs throughout the document.
The team further appreciates the insights and critique provided by our reviewers. Reviewers included Rajesh Balasubramanian - World Bank, Manzoor Qadir - United Nations University Institute for Water, Environment and Health (UNU-INWEH), Isabel Blackett - Water and Sanitation Program (WSP), Payden and David Sutherland - World Health Organization (WHO), Somnath Sen - Indian Institute for Human Settlements (iihs), as well as officials from the Ministry of Urban Development.
Responsibility for any errors or omissions rests with the drafting team.

viii
AbbREvIAtIons And ACRonymsASP Activated Sludge ProcessBCM Billion Cubic Meters BOD Biochemical Oxygen DemandBWSSB Bangalore Water Supply and Sewerage BoardCAPEX Capital ExpenditureCGWB Central Ground Water BoardCMWSSB Chennai Metropolitan Water Supply and Sanitation BoardCPCB Central Pollution Control BoardCPHEEO Central Public Health and Environmental Engineering OrganizationEPA Environmental Protection ActFAO Food and Agriculture Organization of the United NationsFYP Five Year Plan GDP Gross Domestic Product GoI Government of India HH householdHMWSSB Hyderabad Metropolitan Water Supply and Sanitation BoardHPEC High Powered Expert CommitteeJDA Jaipur Development AuthorityJNNURM Jawaharlal Nehru National Urban Renewal MissionkL kilo liter (equivalent to 1 m3)lpcd liters per capita per dayMGI McKinsey Global InstituteMLD Million liters per dayMoEF Ministry of Environment and ForestsMoUD Ministry of Urban DevelopmentMoWR Ministry of Water Resources MWh Mega Watt-hourNPV Net Present ValueNRCP National River Conservation PlanNUSP National Urban Sanitation PolicyO&M Operation and MaintenancePC Planning CommissionPPP Public-Private PartnershipRSC Residual Sodium Carbonate RWH Rain Water HarvestSAR Sodium Absorption Ratio SLB Service Level BenchmarkingSPCB State Pollution Control BoardSTP Sewage Treatment PlantTDS Total Dissolved SolidsUASBR Upflow Anaerobic Sludge Blanket ReactorUF Ultra-filtrationULB Urban Local BodyUSEPA United States Environmental Protection AgencyUT Union TerritoryVGF Viability Gap FundingWHO World Health OrganizationWSP Water and Sanitation ProgramWSSB Water Supply and Sewerage BoardWWI Wastewater Irrigation

1
Recycling and Reuse of tReated wastewateR in uRban india
AdvIsoRy And GuIdAnCE – notEs foR PoLICy mAkERs
Urban India faces significant challenges in terms of availability of adequate water supply and sanitation infrastructure. Water supply in most cities and towns is often insufficient to meet the growing demand for water by all economic sectors. Wastewater generated in urban India is often discharged in the open leading to unhygienic conditions and environmental pollution. Wastewater treatment and management, whether on site, decentralized or off site, are part of the full sanitation cycle and influence public health and the environment; it is very important to recognize that both central government and state governments must work together to tackle this issue. Recycling and reuse of treated wastewater are an important part of the sanitation cycle and critical in an environment of decreasing freshwater availability and increasing costs for delivering acceptable quality water supply to cities for multiple uses. Recycling and reuse of treated wastewater reinforce the economic benefits arising from the public good of achieving the total sanitation cycle. This note on wastewater recycling and reuse in urban India focuses on identifying the economic benefits (and in some cases the financial benefits too) of wastewater recycling from the perspective of public spending. The note also provides supporting information on the evolution and current practices of wastewater recycling internationally and the international and national regulatory and policy frameworks that guide wastewater recycling. In the latter context, the document presents possible strategies for city and state planners and policy makers to initiate the discourse on wastewater recycling and reuse in the local milieu for planned forward movement.
This document also targets the sanitation situation and the role of wastewater recycling in the larger cities in India (Class I and II cities and towns with populations above 50,000) and focuses on recycling at the end of sewerage systems after treatment at sewage treatment plants. Smaller towns would need to assess the suitability of other wastewater management options which may be more feasible and economically viable.
Water supply and sanitation infrastructure in urban India: Urban India is growing rapidly and this poses significant challenges for urban infrastructure and services like water supply, sanitation, solid waste management, wastewater collection and treatment, and drainage. Inadequate sanitation resulting in poor hygienic practices leads to huge economic and social losses for the country. WSP (2011) estimated that the total annual economic impact of inadequate sanitation in India amounted to a loss of INR 2.4 trillion (USD 53.8 billion) in 2006, which was equivalent to about 6.4% of India’s gross domestic product (GDP) in 2006. These losses and economic impacts are disproportionately borne by the poorer sections of the society due to the lower levels of access to improved sanitation and water supply and relatively more densely populated living conditions.
Collection, treatment and reuse of municipal wastewater provides an opportunity for not only environmental rehabilitation, but also meeting the increasing water needs of different economic sectors. In addition to recycled wastewater becoming an additional and valuable water source, there are opportunities to recover nutrients and energy from wastewater. It is estimated that if 80% of urban wastewater could be collected and treated by 2030, there would be a total volume of around 17 billion m3 (BCM) per year; an increase of around 400% in the volume of available treated wastewater. This 17 BCM of treated wastewater resource, if captured, treated safely and recycled, is equivalent to almost 75% of the projected industrial demand in 2025 (MoWR 2006) and almost a quarter of the total projected drinking water requirements in the country.
Policy and guidance on wastewater recycling: The concept of wastewater recycling and reuse and the need to include the same in all water supply and wastewater management programs is recognized by most policy frameworks and institutions in India. While policy and guiding frameworks in India recognize the need for wastewater recycling, little has been done in terms of detailed guidance on treatment

2
RESOURCE RECOVERY & REUSE SERIES 8
standards, types of reuse applications, design and O&M considerations for the management of wastewater recycling projects and tariff structures for the sale of recycled water for various applications. However there are national and international guiding frameworks for wastewater recycling and reuse for various applications including the guidance provided in the recently revised and updated Manual on Sewerage and Sewage Treatment Systems (CPHEEO 2013), the WHO’s guidelines, first published in 1989 and revised in 2006 and the USEPA (2012) water reuse guidelines.
Selection of technology: The choice of technology to treat and recycle domestic wastewater has to be guided by the physical constraints as well as the intended use of the treated wastewater. Treating wastewater to a quality beyond that required for its safe use for a particular application will burden the service provider with higher capital costs and higher O&M costs, with not enough revenue realization in the absence of demand for this high quality water. Various studies have demonstrated that the cost of treating wastewater increases rapidly when advanced treatment systems, such as membrane ultra-filtration (UF) and reverse osmosis are included. Such systems should be incorporated into the sewage treatment plant (STP) design only after careful and detailed assessment of the local recycled water demand and cost recovery mechanisms. Given the significant impact of the chosen treatment technology on the overall cost of the project, at both the construction stage and throughout the operational life of an STP, it is important to consider all funding and revenue options when planning and designing the wastewater treatment facility.
Benefits of wastewater recycling: Many cities in India encourage wastewater recycling but, with few exceptions, there are no clear incentives or mandate from the respective metropolitan administrations for wastewater recycling. There is a natural advantage to wastewater recycling, and this note discusses this in detail. Some of the key benefits of wastewater recycling are summarized below.
A. Recycled wastewater: an additional source of water 1. Recycled wastewater and its allocation to industrial
customers frees up freshwater hitherto used, which could be reallocated to other users with greater net benefits. This option is less expensive compared to other options to augment existing water supplies from distant water sources or expensive treatment such as desalination.
2. Use of treated wastewater can provide industries with a reliable source of water supply, and in most cases, a supply that is cheaper than freshwater. This can result in significant cost savings for industrial enterprises given that the water tariffs for industrial use are steep and rising consistently.
3. Recycled wastewater also plays an important role in
providing a reliable source of water for agriculture. Several countries use treated wastewater to varying degrees to meet agricultural water demand. The practice of using treated or untreated wastewater for agriculture has also been historically prevalent in India; however, there is a need to understand the economic, environmental, social and health implications of using untreated wastewater and mitigating any deleterious effects from its use. In coastal areas, reclaimed wastewater (discharged to the sea) is an additional resource to meet irrigation demand, and in upstream locations, use of reclaimed water in agriculture frees up freshwater for domestic and industrial consumption. In India, the urban wastewater generated (estimated currently at about 38,000 million liters a day [MLD]) would provide 14 BCM1 of irrigation water, which could safely irrigate (if treated) an area ranging between 1 and 3 million hectares (ha), depending on the type of crop cultivated and its irrigation requirement. This wastewater irrigation (WWI) potential (taken at 2 million ha) is 44% of the major and medium potential created and nearly three times the surface water-based minor irrigation potential created in the 10th five year plan (FYP). This is also significant when considering our national circumstances as 70% of India’s population relies on agriculture for sustenance and agriculture, and is heavily reliant on rain-fed irrigation in large parts of the country.
B. Source of revenue for utilities Utilities, with well-functioning STPs, are in a position to sell the treated effluent to industrial customers depending on the need and availability of other water sources. Utilities may charge these industrial customers for this recycled wastewater based on the required level of treatment provided and quality of wastewater. Being industrial customers, it is possible to charge these customers the actual cost incurred for the treatment and provision of water, allowing the utility to recover a significant share of O&M costs. Revenue from sale of secondary treated wastewater can cover the O&M costs of STPs. It is desirable therefore, that cities, whenever possible, should promote the use and sale of recycled wastewater to industrial customers, even making this practice mandatory through changes in state/local regulations. By 2030, treated wastewater from Class I and II cities2 has the potential to meet about a quarter of the current industrial water demand (17 BCM including the water demand for energy production in the country).
C. Nutrient recycling through wastewater recyclingIn addition to being a water resource, wastewater also contains valuable nutrients (nitrogen, phosphorus and potassium [NPK], among others), which aid in crop growth and could reduce the need for synthetic fertilizers in India
1 BCM – billion cubic meters (1,000 million cubic meters).2 Class I cities are cities with populations above 100,000; Class II cities are cities with populations between 50,000 and 100,000.

3
Recycling and Reuse of tReated wastewateR in uRban india
by up to 40% (Minhas 2002; Silva and Scott 2002; Kaur et al. 2012). Wastewater, a valuable source of plant nutrients, needs to be viewed as an economic resource by the planning authorities at national, state and local levels.
1. Several studies have estimated the daily nutrient potential in wastewater in the range of 0.054-0.073 tonnes MLD-1 (adapted from Minhas 2002; Silva and Scott 2002; CPCB 2009a; WII 2006). Thus, the total wastewater generated from Class I and II cities in India has an estimated nutrient load of about 2,500 tonnes day-1. At an estimated nutrient value of INR 8,000 tonne-1 (USD 1653) of nutrients (CPCB 2009a estimate), this indicates a potential value of about INR 500 MLD-1 (USD 10.334) of wastewater or about INR 19.5 million (USD 0.4 million5) daily for the total amount of wastewater being generated in Class I and II cities in the country at present.
2. Analysis presented in various studies (WII 2006; Londhe et al. 2004; Amerasinghe et al. 2013) also suggests a 30% increase in annual farm income to farmers utilizing treated and untreated wastewater for irrigation compared to freshwater. The increase in farm income is a result of an increase in yield, multiple cropping seasons and lower fertilizer requirement.
D. Reduction in ground water pumping requirement:1. The use of treated wastewater for irrigation also has
potential to reduce ground water irrigation, and hence pumping and the associated energy requirement and associated costs.
2. Conservation of energy as a result of using wastewater for irrigation has a concomitant benefit of reducing harmful greenhouse gas (GHG) emissions that would have been generated during the production of an equivalent amount of electricity. These GHG emissions can be avoided through adoption of wastewater irrigation which reduces ground water pumping requirements.
3. Estimates in this advisory suggest that the avoided ground water pumping due to wastewater irrigation has the potential to reduce about 1.75 million MWh of electricity, which is equivalent to reducing about 1.5 million tonnes of CO2e (tCO2) GHG emissions.
While treated wastewater presents potential economic and environmental benefits to consumers (industrial, agricultural), city governments and states–an assured and reliable water supply, the nutrients present in the wastewater, and avoided costs of ground water pumping – utilities and state/city governments will need to develop more sustainable business models. These models should aim at different user categories – industry, agriculture, institutions/commercial establishments–which in collaboration with partner agencies
ensure financial viability, follow water allocation rules and support peri-urban agriculture. The predominant options for recycling of treated wastewater include reuse by industries or reuse in agriculture. While the benefits of both these options are substantial, the cost recovery of the O&M costs of the STP through these two recycling options is very different. While revenue generated from industrial reuse is adequate to meet the O&M expenses, agricultural reuse generates negligible revenue for utilities. It may be desirable to promote industrial reuse in all cities in a state, however this reuse may be limited by the availability of industrial customers in the vicinity.
In the Indian context, the practice of recycling wastewater is just emerging for the industrial sector, however the use of untreated or partially treated wastewater for agriculture is quite common (Amerasinghe et al. 2013). Given this common practice, regulatory authorities need assistance on how to move from informal to formal reuse as the alternative would be to ban informal reuse which would be a challenge given the large number of dependent livelihoods. If the source water for treatment is municipal wastewater, and the treatment is inadequate, it would have serious health impacts especially diarrhea and helminth infections.
This advisory highlights the growing demand for water from the domestic (household), industrial and agriculture sectors, the limits of available freshwater resources and the potentially increasing costs of supplying freshwater in urban areas, over the period up to 2030. The potential for wastewater recycling and reuse exists for various end uses in the domestic, industrial and agriculture sectors. There are various national and international guidelines on water quality for the safe use of treated wastewater depending on its intended use. While the benefits of wastewater recycling and reuse may be known to the different stakeholders, city governments and water utilities face operational obstacles owing to the overlapping remits of institutions such as public health and engineering departments, departments of agriculture, departments of industries, state pollution control boards and so forth that are mandated to manage water in its different uses. This needs to be addressed through coordinated efforts at the national, state and city levels of administration. Reforms will be required to a) promote the collection and treatment of domestic wastewater and b) promote the recycling and use of treated wastewater in a safe manner. This will require a diverse set of reforms to be implemented at national, state and city levels to address the policy and regulatory gaps for the safe use of treated wastewater, provide a framework to ensure rapid scaling up in use of treated wastewater for different economic activities and finally allow the urban local bodies (ULBs) to operate in a manner that will be financially sustainable in the long term.
3 2009 exchange rate INR 48.42 = USD 1. Source for all rates in the report http://www.oanda.com/currency/average. 4 Ibid.5 Ibid.

4
RESOURCE RECOVERY & REUSE SERIES 8
PuRPosE And sCoPEWater supply and sanitation is a state subject6 constitutionally, and the states are vested with the responsibility for planning, implementation and operation of water supply and sanitation projects. Wastewater treatment and management, whether on site, decentralized or offsite, are part of the full sanitation cycle and influence public health and environment; it is very important to recognize that both national government and state governments must work together to tackle this problem. Recycling and reuse of treated wastewater is an important part of the sanitation cycle and critical in an environment of decreasing availability of freshwater and increasing costs of delivering acceptable quality water supply to cities for multiple uses.
Recycling and reuse of treated wastewater reinforces the economic benefits arising from the public good of achieving the total cycle of sanitation. This document focuses on identifying these economic benefits (and in some cases the financial benefits too) of wastewater recycling from the perspective of public spending. It also provides supporting information on the evolution and current practices of wastewater recycling internationally and the international and national regulatory and policy frameworks guiding the practice of wastewater recycling. In the latter context, the document presents possible strategies for city and state planners and policy makers to initiate the discourse on wastewater recycling and reuse in the local milieu for planned forward movement.
It is important to note that this note targets the sanitation situation and the role of wastewater recycling in the larger cities in India (Class I and II cities and towns with populations above 50,000). The discussion therefore is focused on recycling at the end of sewerage systems after treatment at sewage treatment plants, which are economically viable options for the larger cities targeted in this note. A variety of other wastewater management options may be more feasible and economically viable in smaller towns.
IntRoduCtIonThe increased demand for drinking water from urban centers, increase in demand for water by other economic sectors, climate variability and its implications on the availability of water resources combined with continued pollution of freshwater sources due to inadequate collection and treatment of the return flows, is a statement of challenge and also a window of opportunity, i.e., to use the municipal wastewater7
generated in urban centers for productive use. Technological advances over the last two decades have demonstrated the
feasibility of treating wastewater to desired quality levels at competitive costs. The increasing costs of augmenting water supply from distant sources or via desalinization seem to suggest that the time has come to examine reuse and recycling of treated wastewater as a potential option and view wastewater as a key asset of any ‘circular economy’, not just in view of water availability but also nutrient and energy recovery.
Water Demands by Sectors and the Demand—Supply GapThe existing utilizable water resources in India, estimated at about 1,123 BCM, were historically expected to be sufficient to meet both the existing water demand of about 800 BCM (in 2010, Ministry of Water Resources [MoWR] estimates) as well as the projected demand in 2025 of 1,093 BCM. The Planning Commission in the 12th FYP, however, refers to more recent calculations on projected water demand in the country, based on more realistic estimates of the amount of water lost to the atmosphere by evapotranspiration, which are less reassuring. The 12th FYP notes that “2030 Water Resources Group (2009) estimates that if the current pattern of water demand in the Country continues, about half of the demand for water will be unmet by 2030”. This projection has to be considered optimistic as it does not capture regional or temporal variation in supply and demand. Appendix 1 discusses the current and projected sector-wise water demands in more detail.
India’s Second National Communication to the United Nations Framework Convention on Climate Change (UNFCCC) (MoEF 2012) notes that “Indian society is an agrarian society with 70% of the population almost completely dependent on agriculture, even though the share of agriculture in the gross domestic product (GDP) has been continuously declining. Spatially, it is the most widespread economic pursuit, claiming more than 40% of the country’s total area”. It is to be noted however that despite the huge amount of water supply diverted and planned to be diverted to meet current and future agricultural needs (discussed in detail in Appendix 1) more than 50% of Indian agriculture relies solely on rainfall for irrigation. Analysis of rainfall in five-year periods (corresponding to the country’s five-year planning process) over the period 1998-2002 indicates a decreasing trend of mean rainfall and higher variability of rainfall in each successive plan periods (PC 2011). The period 2008-2011 had rainfall below 95% of the long-term average, compared to earlier reporting over a 15-year period. This variability in quantity, time and duration of rainfall impacts agricultural output and places the farmer at risk. India’s Planning Commission reiterates this reality, noting that poverty is highest in regions, states and districts where a larger share of agriculture is rain-fed; the 100 poorest districts
6 States subjects are subjects defined and enlisted under List II of the seventh schedule of the Constitution of India, which form the exclusive domain of each one of the state governments within India.
7 Municipal wastewater may be defined as “waste (mostly liquid) originating from a community; may be composed of domestic wastewaters and/or industrial discharges”. It is major source of water pollution in India, particularly in and around large urban centers (CPCB 2009b).

5
Recycling and Reuse of tReated wastewateR in uRban india
BOX 1. CITIES SOuRCING WATER FROM dISTANT/EXPENSIvE SOuRCES.
� Chennai: Sources water from Lake Veeranam, 235 km from the city; it has now installed desalination plants (200 MLD in operation), with
high cost in producing good-quality water.
� Bangalore: Sources water from the Cauvery River 95 km from the city, requiring pumping at 1,000 m elevation.
� Hyderabad: Sources water from the Krishna River, 130 km from the city, requiring expensive multi-stage pumping.
� Bhopal/Indore: Source water from the Narmada River, pumping water over more than 30 km.
� Agra: Sources water from the Yamuna River which requires extensive treatment.
Details of other cities sourcing water from distance sources or through expensive treatment are provided in Appendix 2.
in the country are almost entirely located in rain-fed areas (PC 2011). The availability of water and concerns over estimated demand supply gaps may be exacerbated by climate variability and its impact on the availability of water resources both spatially and temporally. Competing water demands and limited availability of freshwater are already a cause for
concern for many cities in India, with many such cities being forced to source water from distant or expensive water sources (see Box 1).
These challenges translate into a higher cost for providing water for various uses in these cities. Figure 1 illustrates the increasing cost of supplying water to industries in selected cities in India.
fIGuRE 1. Cost of suPPLyInG WAtER to IndustRIEs In sELECtEd IndIAn CItIEs.
Cost
of W
ater
(IN
R / k
L)
Year
45
40
35
30
25
20
15
10
5
0
1995 2000 2005 2010 2015
Chennai
HyderabadBangalore
Delhi

6
RESOURCE RECOVERY & REUSE SERIES 8
The Growing Urban Sanitation ChallengeUrban India is also growing rapidly and this poses significant challenges for the provision of urban infrastructure and services like water, sanitation, solid waste management and drainage. While 87% of the country’s urban population has access to household or community sanitation, the collection, treatment and disposal of wastewater is a cause for concern. Only one-third of all households are covered by sewer networks, with 47% of households relying on on-site sanitation systems. The low coverage is also compounded by the grossly insufficient treatment capacities in urban centers. According to the assessment made by the Central Pollution Control Board (CPCB) on the status of wastewater generation and treatment in Class I cities and Class II towns during 2009, about 38,255 MLD of wastewater were generated in Class I cities and Class II towns in India (housing more than 70% of the urban population). The wastewater treatment capacity developed so far is only 11,788 MLD accounting for about 31% of total wastewater generated in these two classes of urban centers. The existing treatment plants are not utilized at full capacity and operate at about 72% utilization (CPCB 2009a). Consequently more than 75% of the wastewater generated in Class I and II urban towns and cities is discharged on land or in various water bodies without any treatment, resulting in large-scale environmental pollution and creating a health hazard for the general public. The discharge of untreated or partially treated wastewater on land or surface water bodies is a major source of pollution, contaminating 80% of the country’s surface water (CPCB 2007b).
Inadequate sanitation resulting in poor hygienic practices leads to huge economic and social losses for the country. WSP (2011) estimated that the total annual economic impact of inadequate sanitation in India amounted to a loss of INR 2.4 trillion (USD 53.8 billion) in 2006, which was equivalent to about 6.4 percent of India’s GDP in 2006, and is discussed further Appendix 3. These losses and economic impacts are disproportionately borne by the poorer sections of society due to the lower levels of access to improved sanitation and water supply and relatively more densely populated living conditions.
Recycled Wastewater – an Alternative Water ResourceTreatment and reuse of municipal wastewater provides an opportunity for not only environmental rehabilitation, but also meeting the increasing water needs of different economic sectors. The Planning Commission, GoI, also recognizes the need to recycle wastewater, and deems it a critical component of any sustainable solution for water and wastewater management in India. It observes that “we must begin to learn that we will have to reuse every drop of our sewage (see Box 2). It is even technically possible to turn it into drinking water but at the very least we should plan to recycle and reuse it in our gardens, in our industries or use it (after treatment) to rejuvenate natural water bodies”.
Considering that the most of the water consumed is used for non-potable needs, whether in industry, for agriculture, or for non-potable uses such as toilet flushing, bathing, washing etc. by domestic users, there is tremendous potential to reuse water by providing varying levels of treatment.
An indication of the scale of the opportunity in urban wastewater recycling in India is discussed below:
� A total of 723 of India’s cities and towns, with populations of 50,000 and above, generate about 38,000 MLD of wastewater (CPCB 2009a). In these towns, existing wastewater treatment capacities amount to only 31% of the wastewater generated. At least 67% of the wastewater generated from Class I cities and more than 90% of wastewater generated from Class II cities in India is not treated and is therefore a cause of environmental pollution and unavailable for beneficial and safe reuse of wastewater. With current population growth (1.7% per annum) and the current rate of urbanization (3% per decade), the urban population is expected to increase by more than 50% from 377 million in 2011 to 590 million by 2030 (MGI 2010), with a proportionate increase in the volume of urban wastewater, to nearly 60,000 MLD.
� If 80% of urban wastewater could be treated by 2030, there would be a total volume of around 17 billion BCM per year; an increase of around 400% in the volume of available treated wastewater!
� This additional 17 BCM of treated wastewater resource, if captured, treated safely and recycled, is equivalent to almost 75% of the projected industrial demand in 2025 (MoWR 2006) and almost a quarter of the total projected drinking water requirement in the country.
Regulatory and Policy Guidance on Wastewater Recycling and Reuse The concept of wastewater recycling and reuse and the need to include the same in all water supply and wastewater management programs is recognized by most policy frameworks and institutions in India, as summarized below:
1. The Planning Commission (as part of the water and waste management strategy in the 12th five year plan).
2. The Ministry of Urban Development (as part of the National Urban Sanitation Policy (NUSP) (http://moud.gov.in/NUSPpolicy), the National Mission on Sustainable Habitat (http://moud.gov.in/NMSH) and the Service Level Benchmarking (SLB) framework (http://moud.gov.in/servicelevel).
3. The Ministry of Water Resources (as part of the National Water Policy, 2012 (http://www.wrmin.nic.in/index1.asp?linkid=201&langid=1), the National Water Mission under the National Action Plan on Climate Change, and the draft National Water Framework Law (http://www.wrmin.nic.in/index1.asp?linkid=220&langid=1)).

7
Recycling and Reuse of tReated wastewateR in uRban india
4. The Ministry of Environment and Forests (as part of the National Environment Policy 2006 (http://envfor.nic.in/sites/default/files/introduction-nep2006e.pdf)).
While policy and guiding frameworks in India recognize the need for wastewater recycling, there has been little in terms of detailed guidance on the treatment standards, types of reuse applications, design and O&M considerations for management of wastewater recycling projects and tariff structures for sale of recycled wastewater for various applications. Such projects, while being undertaken by various states and cities in India, are largely structured individually and developed in isolation at the local level.
The Ministry of Urban Development has been addressing this issue and recently developed specific guidelines for the recycling and reuse of wastewater. While this ministry has issued various advisories in recent years covering various aspects of urban sanitation including wastewater recycling, detailed guidance has formally been included for the first time in the recently revised and updated Manual on Sewerage and Sewage Treatment Systems (2013) (CPHEEO 2013). These guidelines take a lead in specifying for the first time the water quality guidelines for treated water based on its intended use, along with identifying best practices and examples of other recycling and reuse programs both in India and internationally.
Other international guiding frameworks for wastewater recycling and reuse include the WHO international guidelines on wastewater recycling in agriculture and aquaculture and recommendations for wastewater treatment and crop restrictions. These guidelines, first published in 1989 and revised in 2006, are also a commonly cited guiding framework for reuse. Others include the USEPA (2012) water reuse guidelines and the reuse standards developed by selected states in the USA, such as California, which were among some of the first authorities to develop reuse standards and regulations to guide the application of treated wastewater for different purposes. Appendix 4 presents a summary of some of these guidelines/standards.
Technological Options and Treatment LevelsTreatment technologies for wastewater can be categorized based on the location where treatment is provided and the type of treatment provided. The location of the treatment system will make the management system either an on-site system, decentralized system or an off-site system requiring extensive underground sewerage to carry wastewater to the off-site treatment facility. Each of these systems has different geographical, demographical and financial conditions.
box 2. thE bAsICs of WAstEWAtER RECyCLInG.
Water recycling is reusing treated wastewater for beneficial purposes such as agricultural and landscape irrigation, industrial processes, domestic potable and non-potable reuse, and replenishing a ground water basin (ground water recharge). Wastewater treatment can be tailored to meet the water quality requirements of planned reuse and can meet the water need in a very competitive cost structure.
Water reuse accomplishes three fundamental functions:
� More water is made available for beneficial purposes; � Untreated effluent is kept out of streams, lakes, etc., reducing the pollution of surface and ground water; and � Protection of public health if compliance with safety measures is addressed.
Recycled water has many applications and can be used to fulfil most water needs, subject to the level of treatment given to the wastewater.

8
RESOURCE RECOVERY & REUSE SERIES 8
The Manual on Sewerage and Sewage Treatment Systems (2013) discusses in detail the different types of treatment technologies suitable under different conditions, including decentralized wastewater treatment technologies. The manual provides details on the design considerations and operating requirements for a variety of technologies which will be suitable for different urban agglomerations.The WSP had also published a compendium of wastewater treatment technologies specifically suited to the urban context (WSP 2008), which provides guidance on the suitability of different options under different geographical, demographical and physical contexts.
The other significant classification criterion is the type of treatment provided – primary treatment, secondary treatment or tertiary treatment. Primary treatment essentially consists of removing the suspended solids present in the wastewater through physical sedimentation or coarse screening methods. Secondary treatment involves some form of biological treatment which removes the organic
matter lowering the bio-chemical oxygen demand (BOD) of the wastewater. Tertiary treatment provides the most advanced level of treatment, reducing BOD and the total dissolved solids (TDS) levels to very low levels and can also effective in removing dissolved impurities and nutrients such as nitrogen and phosphorus that may be present in the water. The type of advanced treatment (nutrient removal/reverse osmosis/advanced disinfection) will depend on the type of reuse application, and is usually significantly capital-intensive along with high O&M costs compared to conventional secondary treatment alone. Of particular interest are anaerobic treatment systems with still lower energy demands (Libhaber and Orozco-Jaramillo 2013). The choice of treatment technology has to be guided by the physical constraints (as discussed in Box 3) combined with the intended use of the treated water (see Box 4). Figure 2 illustrates this concept, demonstrating the link between the levels of treatment, intended use of treated water, cost of treatment and extent of cost recovery.8 Choosing to provide a
box 3. on-sItE, dECEntRALIzEd And off-sItE WAstEWAtER tREAtmEnt systEms.
Sanitation systems may be:
� On site, retaining wastes in the vicinity of the toilet in a pit, septic tank or vault. � Off site, removing wastes from the vicinity of the toilet for disposal elsewhere. � Hybrid, retaining solids close to the latrine but removing liquids for off-site disposal elsewhere.
Wastewater and fecal sludge require treatment before they are used either as an input to agriculture or returned to the environment. Waste collection and treatment systems may serve anything from a residential area of a few hundred houses to large urban areas. Hybrid and off-site systems require provision for transporting wastewater from the toilet via a system of sewers to the treatment facility.
Recycling and reuse of wastewater in hybrid or off-site systems should ideally occur after stabilization of pathogenic organisms and removal of toxic chemicals/metals present in the wastewater to avoid negative health impacts on farmers, handlers and consumers of the produce irrigated with such water.
box 4. dECEntRALIzEd sEWAGE tREAtmEnt And RECyCLInG of WAtER In AuRovILLE, PondIChERRy.
The Sangamam Housing Project (CPCB 2008), implemented on the outskirts of Auroville (12 km north of Pondicherry and 150 km south of Chennai) has been very effective in implementing decentralized wastewater treatment and recycling the treated wastewater, along with implementing rain water harvesting, to reduce the demand for potable freshwater. The sewage treatment system consists of an anaerobic up flow reactor as a primary treatment and a Root Zone Treatment system as a secondary treatment system followed by maturation ponds.
As assessment conducted by CPCB in 2008 concluded that demand for freshwater declined from 221 liters per capita per day (lpcd) before commissioning the recycling system to about 101 lpcd after commissioning of the recycling system, a 45% reduction in freshwater consumption. The savings resulted from using treated wastewater for activities such as toilet flushing, gardening etc.
8 Cost recovery is intended as an indication of the potential for revenue generation to cover the O&M costs of treatment.

9
Recycling and Reuse of tReated wastewateR in uRban india
9 2012 exchange rate INR 53.46 = USD 110 Ibid.11 Ibid.12 2013 exchange rate INR 58.44 = USD 1
fIGuRE 2. bALAnCInG tREAtmEnt WIth RECyCLEd WAstEWAtER usE.
level of treatment which treats water to a quality beyond that required for its safe use for a particular application will burden the service provider with higher capital costs and higher O&M costs, with not enough revenue realization in the absence of demand for this high quality water (Murray and Buckley 2010).
An analysis by CPCB (CPCB 2007a; Kaur et al. 2012) estimated the typical treatment costs (both capital and O&M expenses) associated with different levels of treatment provided to wastewater. The analysis estimated that the cost of treating wastewater escalates rapidly when advanced treatment systems, such as membrane ultra-filtration (uF) and reverse osmosis are included. The annual treatment cost (including annualized capital cost and O&M expenses) increase from about INR 34/kL (USD 0.649) for conventional secondary treatment to about INR 52/kL (USD 0.9710) when UF is added, which further increases to INR 73/kL (USD 1.3711) when the water is also treated using a reverse osmosis module.
Analysis by WSP (2014) (Figure 312)on capital costs of different treatment technologies also indicates more than two-fold escalation in the unit cost or treatment when switching from conventional secondary treatment
(activated sludge process treatment) to advanced treatment (membrane systems, nutrient removal etc.).
Given the significant implications of the chosen treatment technology on the overall cost of the project, at both the construction stage and throughout the operational life of an STP, it is important to consider all funding and revenue options when planning and designing the wastewater treatment facility. Utilities may choose to treat water to the regulatory standards and provide it to industrial and other customers who may further treat it through advanced levels of treatment based on their needs. Alternatively, if high grade treated water is a popular requirement in the region and the utility is able to charge appropriately for its provision, the cost of advanced treatment can be passed on to customers. The choice should be based on sound financial assessment of the investment required, the appetite for treated wastewater in the region, and customer profiles and their willingness to pay for the treated water. Some implementation options adopted by different cities, including accessing central or state government program funds and public-private partnership, are presented in Appendix 5.
Increasing cost recovery
Technology Requirements and Cost
Irrigation
RestrictedUrban Reuse
Industrial Non-Potable Reuse
IndirectPotable Reuse
DirectPotable orHigh QualityProcess
SecondaryTreatment
Tertiary Filtration
Tertiary membranceFiltration
N&P Control
RO & Disinfection

10
RESOURCE RECOVERY & REUSE SERIES 8
fIGuRE 3. unIt CAPItAL Cost of tREAtmEnt foR dIffEREnt tyPEs of WAstEWAtER tREAtmEnt.
Source: WSP 2014.
EConomIC And fInAnCIAL bEnEfIts of WAstEWAtER RECyCLInG And REusERecycled water can provide an additional and valuable source of water. This resource also presents opportunities to recover nutrients and energy from wastewater. The recovery of phosphorus and potassium is particularly attractive because India imports most of its phosphorus and all of its potassium needs to meet demand. Use of recycled wastewater for irrigation can help to circumvent ground water pumping and hence reduce energy requirements for
irrigation. Reduction in the use of energy also reduces GHGs, which are typically produced during the production and combustion of fuel and energy. There are also opportunities to tap into carbon credits as an additional revenue stream as and when the carbon market becomes viable and subject to demand and supply constraints. Figure 4 illustrates the financial and economic cost benefit concepts related to recycling and reuse of wastewater. It is apparent that while the financial costs of wastewater recycling and reuse may outweigh the pure financial returns, it makes immense economic sense to mainstream this practice owing to the considerable environmental, social and health benefits generated. The various financial and economic benefits of wastewater recycling are discussed in more detail in the following sections.
-
5
10
15
20
25
30
35
40
0 50 100 150 200 250
Cost
per
MLD
(Mill
ion
INR/
MLD
)
Capacity (MLD)
Capital Cost v/s Capacity for Conventional ASP Plantsand Advanced Treatment Plants
ASP Data ASP with Nitrification and Denitrification UASB Data

11
Recycling and Reuse of tReated wastewateR in uRban india
Recycled Wastewater – an Additional, Reliable and Cost Effective Source of WaterTreated wastewater has an important role to play in providing a reliable source of water to meet industrial and agricultural water requirements. Several countries have adopted recycling and reuse of wastewater to varying degrees and for a range of activities. Appendix 6 discusses the extent of wastewater recycling in various countries and the evolution of such programs. Most countries with successful wastewater recycling programs follow a systematic approach, leading to the development of their recycling and reuse programs. Water scarcity that threatens human society or the survival of natural systems is the inherent driver in all countries that necessitates the development of such a program.
Wastewater recycling can meet different water requirements, i.e., in industries, for irrigation in agriculture and also within urban areas for horticultural/municipal needs. Two significant users of recycled wastewater are industries and agriculture, as discussed below.
Wastewater Recycling – offsetting the need for Additional sources of WaterUse of treated wastewater for industrial applications frees up freshwater which can be used by water utilities to increase coverage and meet domestic water requirements. Appendixes 7 and 8 present findings from a study undertaken for the cities of Hyderabad, Bangalore and Chennai to assess the impact of recycling wastewater
to meet the water demand-supply gap in these cities. Appendix 8 presents the findings from a study undertaken to assess the impact of various water supply augmentation options (including wastewater recycling to offset demand) on municipal finances and operational revenues. The study found that wastewater recycling to offset freshwater demand from industries can be a viable alternative to augmenting freshwater sources to meet the steadily increasing demand in these cities.
The study also highlights that wastewater recycling targeted for non-potable uses could start making economic sense to cities and ULBs when they are able to estimate non-potable demand and meet it through investments in dual-piping (with or without consumer participation). Current consumer databases with water supply and sewerage boards (WSSBs) do not seem to have this information, and this poses a significant challenge when planning for such schemes. Appendix 9 presents a broad estimation of state-wise wastewater recycling potential industrial consumers.
Recycled Wastewater – an Affordable and Assured source of Water for IndustriesIndustrial water requirement constitutes almost 10% of all non-irrigation water demand in the country, and is expected to increase to almost 17% by 2050. Industrial reuse of wastewater presents many benefits to both utilities and the industrial customers. The revised Manual (2013) identifies several important industrial applications where treated wastewater may be used instead of using freshwater.
fIGuRE 4. fInAnCIAL And EConomIC AnALysIs of WAstEWAtER RECyCLInG soLutIons.
Source: Hanjra et al. 2014 based on GWI 2010.
$$
Financial analysis Economic analysis
Costs Revenue Costs Bene�ts
Distribution costs
Sales Revenue(water, nutrients,sludge, energy,carbon)
Storage costs
Retro�t costs
Treatment costs
Distribution costs
Environmental costs
Social costs
Storage costs
Retro�t costs
Treatment costs
Bene�t of increasedprosperity and resilientcommunities
Bene�t of improved waterquality and �ows
Bene�t of cost savings(new supply)
Bene�t of cost savings(disposal)
Bene�t of protected publichealth and ecosystems

12
RESOURCE RECOVERY & REUSE SERIES 8
Water reuse can result in significant cost savings for the industrial enterprises given that water tariffs for industrial
use are high and rising consistently, as illustrated in Table 1.
tAbLE 1. IndustRIAL tARIff LEvIEd foR fREshWAtER In vARIous stAtEs/CItIEs.
STATE/CITy INduSTRIAL WATER TARIFF (INR kL-1) INduSTRIAL WATER TARIFF (IN uSd13 kL-1)
West Bengal 12-15 0.19 – 0.23
Uttar Pradesh 10-35 0.16 – 0.55
Madhya Pradesh 24 0.38
Punjab 7.60 0.12
Jharkhand 9.90 0.16
Chennai, Bangalore and Mumbai 60 0.94
Use of treated wastewater can provide industries with a reliable source of water supply, and in most cases, a supply that is cheaper than procuring freshwater. This is illustrated in Box 5 which presents the examples
of Chennai Petroleum Corporation Limited (CPCL) in Tamil Nadu and Mahagenco in Maharashtra, two industries using recycled wastewater to meet their water demand.
box 5. bEnEfIts of WAstEWAtER RECyCLInG to IndustRIEs.
The CPCL plant in Chennai encountered acute water shortage and scarcity of supply in the wake of severe water shortages in the city. The plant had to rely on expensive tanker-supplied water. During a 20-year period, the cost of water also increased seven-fold as demand increased. The plant was also forced to occasionally halt operations due to lack of water resulting in business and revenue losses for the company. Recognizing that water supply from the water utility was not only unreliable but also uneconomical, the industry set up a wastewater recycling plant to treat partially treated wastewater from the water utility. The cost of recycled wastewater to the industry worked out at INR 45/KL (USD 0.7014) compared to INR 60/KL (USD 0.7015) for the water purchased from the water utility. Besides being economically attractive, this amount (of partially treated wastewater supplied) was also able to meet the industry’s current and future water needs.
The case of Mahagenco in Maharashtra is similar. In 2008 the company needed an additional 130 MLD water supply for expansion of its 1,980 MW Koradi Thermal Power Station (TPS). No municipal or command area projects could accommodate this need. Mahagenco decided to reuse the treated wastewater from the city of Nagpur to supply Koradi TPS and to secure this source took responsibility for construction, operation and maintenance of the sewage treatment plant. The treatment and provision of water through this arrangement will cost Mahagenco about INR 3.4 m-3 (USD 0.0516), which would have been significantly higher if the company had decided to source freshwater from another municipal or irrigation command project (about INR 9.6 m-3 (USD 0.1517) for recent projects). The project is currently under construction and details of the cost sharing and revenue arrangements are discussed in Appendix 5.
Wastewater Recycling to meet Agricultural Water demandIn India, the urban wastewater generated (estimated currently at about 38,000 MLD in Class I and II cities), if treated and channeled to meet agricultural irrigation requirements, would provide 14 BCM18 of irrigation water, which could potentially irrigate an area ranging between 1 to 3 million hectares (ha).19 Amerasinghe et al. (2013)
also arrived at similar estimates (1.1 million ha) on the additional area that can be brought under direct and indirect irrigation using wastewater generated in Class -I and Class-II cities and towns. While this quantum (14 BCM based on 2009 wastewater generation estimates) might not seem significant compared to the total irrigation water demand in 2025 (910 BCM according to MoWR estimates), its significance should be viewed in relation
13 2015 exchange rate INR 64.03 = USD1.14 Ibid.15 Ibid.16 Ibid.17 Ibid.18 Billion cubic meters (1,000 million cubic meters).19 Depending on the type of crop cultivated and its irrigation requirement.

13
Recycling and Reuse of tReated wastewateR in uRban india
to the national efforts to increase area under irrigation during recent five-year plan (FYP) periods. During the 10th FYP period, the major and medium irrigation potential created was 4.59 million ha, while the surface water-fed minor irrigation potential developed was 0.71 million ha (MoWR 2011). The wastewater irrigation (WWI) potential (~2 million ha) is 44% of the major and medium potential created and nearly three times the surface water-based
minor irrigation potential created in the 10th plan (see Box 6). This is significant when considering our national circumstances as 70% of India’s population relies on agriculture for sustenance and agriculture, and in turn, is heavily reliant on rain-fed irrigation in large parts of the country. This reliance on rainfall for irrigation presents risks to farmers (i.e., crop failure) and therefore to the country in the context of food shortages.
Currently it is estimated that India has a cultivated area of more than 40,000 ha irrigated with untreated wastewater (World Bank 2010). Historically, the use of treated or untreated wastewater has been common in India; however there is a need to understand the economic, environmental, social and health implications of the use of untreated wastewater and mitigating any deleterious side-effects from its use.
Using untreated or partially treated wastewater exposes farmers and crop consumers to potential health risks. Ideally wastewater should be treated before using it for irrigation; health and risk aspects, along with international guidelines for treatment are discussed in detail in Appendix 10. While 100% treatment is absolutely desirable, in reality, large parts of the country already use untreated or partially treated wastewater for irrigation. A practical solution in the short term under such circumstances is to follow the generally accepted multibarrier Hazard Analysis and Critical Control Points (HACCP) approach, discussed in more detail in Appendix 11.
Wastewater Recycling in new urban Growth Areas – Planned Reuse for non-potable RequirementsRecycling and reuse of wastewater is also being planned as an integral component of the urban water and sanitation projects being developed in new urban areas in some cities such as Jaipur, Rajasthan. Ground water is the predominant
box 6. ConstRAInts on fInAnCIAL sustAInAbILIty of WAstEWAtER RECyCLInG foR AGRICuLtuRAL REusE.
The 13th Finance Commission recommended charging INR 1,175 (USD 24.2720 ) in major irrigation command areas and INR 588 (USD 12.1421) in minor irrigation command areas for one hectare of irrigated land to cover the O&M expenditure of irrigation projects. While this is a significant increase from the irrigation fees charged in the past, this works out to only 10-25 paise KL-1 (USD 0.002-0.00522), depending on crop and water use assumptions. The cost of treating wastewater is significantly higher in comparison. While revenue generated from industrial reuse is adequate to meet the O&M expenses, agricultural reuse generates negligible revenue for utilities. It may be desirable to promote industrial reuse in all cities in a state, however this is limited by the availability of industrial customers in the vicinity.
Source: ThFC 2009
source of water in most areas in Rajasthan, with 90% of rural and 80% of urban water supply schemes based on its exploitation. The state is experiencing progressive deterioration in the yield and quality of ground water to meet increasing demands. Of the 243 blocks in the state, 172 belong to the ‘overexploited’ category (2011 assessment), which is a stark increase from the overexploited blocks in 1984, which stood at just 41. Jaipur has therefore embarked on a project to treat and reuse the wastewater generated in the city for use in industries, as well as for non-potable domestic applications such as flushing (through a dual piping system in all new urban growth areas under development). The projects are under development and detailed project reports for the scheme are in preparation.
Sale of Recycled Water – a Source of Revenue for Urban Local Bodies (ULBs)Utilities, when operating well-managed STPs, are in a position to sell the treated effluent to industrial customers depending on the need for and availability of other water sources. Utilities may charge industrial customers for supplying recycled wastewater based on the treatment provided and quality of wastewater. Experience from Chennai demonstrates that treated wastewater is being sold to industries at INR 8-11 KL-1 (USD 0.13 - 0.1823), and the resulting revenue generated through this sale is adequate to cover the O&M costs of the
20 2009 exchange rate INR 48.42 = USD 121 Ibid.22 Ibid.23 2014 exchange rate INR 60.89 = USD 1

14
RESOURCE RECOVERY & REUSE SERIES 8
treatment plants (WSP 2014). Being industrial customers, it is possible to charge them the actual cost incurred for the treatment and provision of water, allowing the utility to recover a significant share of its O&M costs.
While several utilities supply treated wastewater to different industrial users, the reuse and sale of treated wastewater is largely anecdotal throughout the country. Appendix 12 briefly discusses some initiatives taken by various ULBs towards wastewater recycling and sale of treated wastewater (IIR 2013; GWI 2010).
Valuing the Nutrients Present in WastewaterWastewater contains valuable nutrients (NPK), which may either be recovered as a resource or recycled when treated wastewater is reused for irrigation or other applications. When using treated wastewater for irrigation, these nutrients aid crop growth and could reduce the need for synthetic fertilizers in India by up to 40% (Minhas 2002; Silva and Scott 2002; Kaur et al. 2012). While farmers in India rarely pay any significant amount for the provision or use of this resource, it is important to understand its economic benefits. This section attempt to quantify the nutrient value in wastewater. In doing so, it is to be borne in mind that these benefits may often be implicit and beyond those physically realized in the field. Nevertheless, wastewater is a valuable source of plant nutrients and needs to be viewed as an economic resource by the planning authorities at national, state and local levels.
Economic value of the nutrient Load in WastewaterIn its review of wastewater generated in the coastal cities in India, the Central Pollution Control Board (CPCB 2009a) estimated a nutrient load of 347.56 tonnes day-1 in about 6,400 MLD of wastewater generated from these cities daily (the treatment capacity against this is about 3,050 MLD, which is about 47% of the total wastewater generation). Several other studies have also estimated the nutrient potential in wastewater which ranges from 0.054 to 0.073 tonnes MLD-1 (adapted from Minhas 2002; Silva and Scott 2002; CPCB 2009b; WII 2006). Thus, the total wastewater generated from Class I and II cities in India has an estimated nutrient load of about 2,500 tonnes per day (see Box 7). At an estimated nutrient value of INR 8,000 tonne-1 (USD 16524) of nutrients (CPCB 2009b estimate), this translates into a theoretical monetary value of about INR 500 MLD-1 (USD 10.3325) of wastewater or about INR 19.5 million (USD 0.4 million26) daily for the total amount of wastewater being generated by Class I and II cities in the country at present.
When valuing the nutrients present in wastewater, it is important to also consider other constituents which may impact suitability when reusing treated or untreated wastewater in agriculture. The high salinity of wastewater is of particular concern, as there may be short- to long-term effects on the salinity of soils and river water receiving treated wastewater. The impact on agricultural produce will depend on the exact nature of wastewater and the salinity thresholds of the crop being cultivated (McCartney et al. 2008).
Reduction in fertilizer use on Account of Wastewater IrrigationThe availability of affordable fertilizer is critical to the performance of the agriculture sector in India, which is heavily dependent on government subsidies on agricultural fertilizers. Indian soils are generally deficient in both K and P. Therefore the country has to depend upon imports (100% potash and around 90% phosphate) for meeting these fertilizer needs. Urea (a source of N) is the only fertilizer which is produced in India and can meet a significant share (about 80%) of the indigenous requirement. The fertilizer subsidy burden for the central government in 2012-2013 was about INR 700 billion (USD 13.36 billion27), which is expected to double by the end of the 12th FYP in 2016-2017.
Use of treated wastewater and sludge for agriculture has the potential to reduce reliance on fertilizer by about 40% in areas irrigated with treated wastewater due to its inherent nutrient content. Based on current wastewater generation, irrigation potential estimated for wastewater in India and the associated potential to reduce fertilizer consumption in wastewater irrigated areas, it can be estimated that the annual fertilizer subsidy could be reduced by about INR 1.3 billion. (USD 243 million28).29
Increase in overall farm Income due to Wastewater IrrigationAnalysis presented in various studies (WII 2006; Londhe et al. 2004; Amerasinghe et al. 2013) suggests increased economic benefits for farmers engaged in cultivation with treated and untreated wastewater compared to freshwater, due to increase in yields, lower fertilizer requirement and improved quality of yield resulting in higher prices for the produce. Appendix 13 presents more information on the incremental benefits accruing to farmers engaged in cultivation in various cities across India using wastewater compared to freshwater.
24 2009 exchange rate INR 48.42 = USD 1.25 Ibid.26 Ibid.27 2012 exchange rate INR 53.46 = USD 1.28 Ibid.29 This estimate is based on average fertilizer consumption of 156 kg ha-1 in freshwater irrigated areas in India, the irrigation potential created from using treated wastewater of 2 million ha and
40% savings in fertilizer use in areas irrigated with treated wastewater.
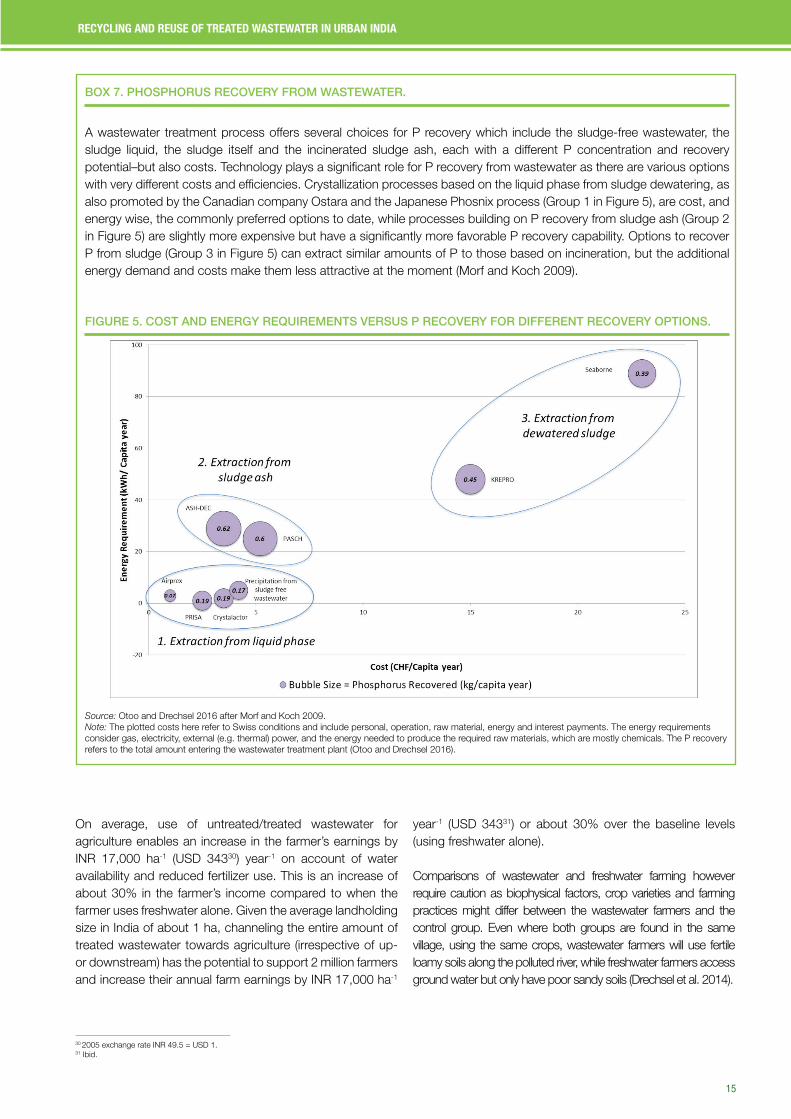
15
Recycling and Reuse of tReated wastewateR in uRban india
box 7. PhosPhoRus RECovERy fRom WAstEWAtER.
A wastewater treatment process offers several choices for P recovery which include the sludge-free wastewater, the sludge liquid, the sludge itself and the incinerated sludge ash, each with a different P concentration and recovery potential–but also costs. Technology plays a significant role for P recovery from wastewater as there are various options with very different costs and efficiencies. Crystallization processes based on the liquid phase from sludge dewatering, as also promoted by the Canadian company Ostara and the Japanese Phosnix process (Group 1 in Figure 5), are cost, and energy wise, the commonly preferred options to date, while processes building on P recovery from sludge ash (Group 2 in Figure 5) are slightly more expensive but have a significantly more favorable P recovery capability. Options to recover P from sludge (Group 3 in Figure 5) can extract similar amounts of P to those based on incineration, but the additional energy demand and costs make them less attractive at the moment (Morf and Koch 2009).
fIGuRE 5. Cost And EnERGy REquIREmEnts vERsus P RECovERy foR dIffEREnt RECovERy oPtIons.
Source: Otoo and Drechsel 2016 after Morf and Koch 2009.
Note: The plotted costs here refer to Swiss conditions and include personal, operation, raw material, energy and interest payments. The energy requirements consider gas, electricity, external (e.g. thermal) power, and the energy needed to produce the required raw materials, which are mostly chemicals. The P recovery refers to the total amount entering the wastewater treatment plant (Otoo and Drechsel 2016).
On average, use of untreated/treated wastewater for agriculture enables an increase in the farmer’s earnings by INR 17,000 ha-1 (USD 34330) year-1 on account of water availability and reduced fertilizer use. This is an increase of about 30% in the farmer’s income compared to when the farmer uses freshwater alone. Given the average landholding size in India of about 1 ha, channeling the entire amount of treated wastewater towards agriculture (irrespective of up- or downstream) has the potential to support 2 million farmers and increase their annual farm earnings by INR 17,000 ha-1
year-1 (USD 34331) or about 30% over the baseline levels (using freshwater alone).
Comparisons of wastewater and freshwater farming however require caution as biophysical factors, crop varieties and farming practices might differ between the wastewater farmers and the control group. Even where both groups are found in the same village, using the same crops, wastewater farmers will use fertile loamy soils along the polluted river, while freshwater farmers access ground water but only have poor sandy soils (Drechsel et al. 2014).
30 2005 exchange rate INR 49.5 = USD 1.31 Ibid.

16
RESOURCE RECOVERY & REUSE SERIES 8
Reduction in Ground Water Pumping Due to Wastewater IrrigationMore than 60% of the country’s irrigation requirements are met by ground water (IDFC 2011), which requires energy-intensive ground water pumping. Table 2 illustrates the potential to reduce ground water irrigation, and hence pumping, if the entire amount of wastewater generated in urban areas can be channeled towards irrigation in ground water-irrigated areas.
tAbLE 2. ComPARIson of GRound WAtER IRRIGAtIon And WAstEWAtER IRRIGAtIon PotEntIAL foR dIffEREnt CRoP sEAson.
IRRIGATION TyPE IRRIGATEd AREA/POTENTIAL
FOR IRRIGATION
Net area irrigated by ground water 39 Mha
Potential through WWI32 1-2 Mha
Potential that can be met through
WWI (%) ~5%
Reduction in Energy Requirements due to Reduced Water Pumping for IrrigationThe energy required for ground water irrigation is usually sourced through grid electricity (subsidized significantly by state governments) or by using diesel pump sets, and either of these options requires a significant financial expenditure for the individual farmer or for the state. Also, the increasing use of ground water has led to the depletion of ground water tables and allied problems in many parts of the country. As evident from Table 2, the use of treated wastewater for irrigation has the potential to reduce ground water requirements in these areas and hence leads to a reduction in associated energy use. With the availability of a continuous supply of wastewater, reliance on ground water extraction could be reduced. There are currently about 18 million electricity-powered pump sets reported in use (BEE 2011). Considering the substitution potential of wastewater irrigation and assuming a reduction of pumping use by at least a third of the current use in these wastewater-irrigated areas, the savings in grid electricity supply requirements would be significant and are estimated to save (the state government and the electricity utility) about INR 6 billion (USD 128 million33) annually.34
Greenhouse Gas mitigation from use of treated Wastewater for IrrigationConservation of energy as a result of using wastewater for irrigation has the concomitant benefit of reducing harmful GHG emissions that would have been generated during the production of an equivalent amount of electricity using fossil fuels. These GHG emissions can be avoided through adoption of wastewater irrigation which reduces ground water pumping requirements, as discussed in the preceding section.
`Our estimate suggests that avoided ground water pumping due to wastewater irrigation has the potential to reduce about 1.75 million MWh of electricity annually, which is equivalent to reducing about 1.5 million tonnes of CO2e (tCO2) GHG emissions. There is significant scope to create additional income streams for treatment plant operators through the Clean Development Mechanism as recently proposed for China (GTZ 2009).
Way Forward This advisory highlights the growing demand for water from the domestic (household), industrial and agriculture sectors, the limits of available freshwater resources and the potentially increasing costs of supplying freshwater in urban areas, over the period up to 2030. There is potential for wastewater recycling and reuse in the domestic, industrial and agriculture sectors. There are various national and international guidelines on water quality for the safe use of treated wastewater depending on its intended purpose. While the benefits of wastewater recycling and reuse may be known to different stakeholders, city governments and water utilities face operational constraints owing to the overlapping remits of institutions mandated to manage water in its different uses. This needs to be addressed through coordinated efforts at national, state and city levels of administration. The central government envisions the following roles for reforms in promoting wastewater recycling:
1. Support interministerial coordination — MoEF, MoUD, MoA, MoH&FW, MoF, MoWR, DIPP – for guidance on a regulatory framework for water resource management. Water resources need to be managed at the basin level and across urban and rural domains for more efficient and equitable use. Current models of allocation followed within river basins and states focus on freshwater allocation. The initiatives taken up in states like Maharashtra such as the setting up of a water resource regulatory
32 Calculated based on average annual irrigation requirements of 700 mm. 33 2011 exchange rate INR 46.84 = USD 1.34 This is a conservative estimate of savings due to the decreased energy demand and based on assumptions of at least 3% of ground water irrigation being substituted by wastewater
irrigation; 30% reduction in energy use by a similar proportion of pump sets (rated on average at 5 horsepower); 20% transmission and distribution losses for the energy supplier; and a cost to serve of INR 3.5 kWh-1.

17
Recycling and Reuse of tReated wastewateR in uRban india
authority and its throughput, indicate an evolving strategy towards water resource allocation, as more information on water resources and quality and end use is being assimilated for regulatory oversight. The amount of water made available to the basin resource system through wastewater treatment in the larger urban centers opens up possibilities35 for regulatory action on intersectoral swaps that could aid increased urban entitlements from the river basin.
2. Interministerial coordination36—MoEF, MoUD, MoA, MoH&FW, MoF, MoWR, DIPP—for guidance on recycled wastewater standards based on intended use. The quality of water required for different end uses is different and prescribed standards would aid city planners and water utilities in planning and addressing these potential demands, which otherwise continue to depend on scarce freshwater resources or make do with untreated wastewater, putting the users at risk. The designated end use and prescribed standards would also make clear to city planners the optimal choice of technologies for water treatment as the sale of such treated water has different revenue-earning potential with different categories of end users (notably industry).
3. Prioritize development of recycled wastewater schemes through national programs. The MoUD has a target of recycling and reuse of 20% of the wastewater generated, as part of the SLB framework for cities to achieve. The 13th Finance Commission has put aside a small portion of grants to states for use by local bodies as performance-based grants and linked this to successful reporting on current and targeted service-level benchmarks, among a set of eight other compliance conditions (ThFC 2009). While this move laid some focus on development and reporting on service levels, wastewater recycling and reuse are only two of the several benchmarks included in the SLB framework. Specific focus on developing wastewater recycling projects is required in central government programs and schemes.
4. A review of progress achieved to date on the creation and management of sewerage infrastructure could possibly indicate the next levels of achievement that need to be targeted and in designing incentives for cities to reach them.
5. Incentives for wastewater recycling and reuse – cities and users. This could include: � Additional funds for states or cities achieving
predefined targets on recycling of treated wastewater;
� Including the recycling of wastewater and a detailed plan to achieve this a prerequisite to facilitate any central government funds under new schemes;
� Awards, recognition schemes, support for other urban development aspects such as water resource planning, lake rejuvenation, etc. if SLB on wastewater recycling and reuse is achieved; and
� Incentives for users (especially commercial and institutional users) through a rebate on water supply tariff if a certain share of their total demand is met from purchase of recycled wastewater. Alternatively, levy a tax/penalty on such users if treated wastewater, available and provisioned by the city, is not being used to meet at least part of the water demand.
The following section identifies both the immediate and long-term actions that can be implemented by state governments, as well as the approach that may be adopted by the ULB to promote wastewater recycling.
Initiatives at the state LevelSome initiatives that may be taken up at the state level to promote recycling and reuse are discussed hereunder.
A. Immediate to short-term reforms:1. Mandate that only treated wastewater will be
made available to industries for their non-potable applications and actively promote this in partnership with industry departments.
2. Ensure that all wastewater treatment plants are set up at a minimum recycle and reuse rate of 20% of the wastewater treated at the plant.
3. Development of by-laws for ULBs on wastewater reuse. Fifty of the 63 mission cities under the Jawaharlal Nehru National Urban Renewal Mission (JNNURM) have instituted by-laws for Rain Water Harvest (RWH) and wastewater reuse. However, implementation/enforcement is reportedly tardy. While some of the ULBs have notified the by-laws making the separation of grey water and its reuse mandatory for larger premises (plot area greater than a prescribed threshold) and large consumers (water consumption per day greater than the prescribed threshold), some have brought all new properties under the ambit and specified that existing properties will be notified in due time. Monitoring and enforcement are required preliminary steps and remain weak to date. Also, cities need to make related improvements gradually through identification of water consumptive end uses within city environs, developing the by-law to bring about targeted reduction in freshwater use. The municipal administration/urban development department will need to assist the movement of cities to a better information base on water demands and use within
35 The MWRRA (cf Bulk Water Tariff Order 2013016) had to necessarily intervene and assist the cities in enabling reuse. “WRD, in all their agreements with domestic water user entities, should take note of this circular and permit the ULB to recycle and reuse upto 20% of the total sewage for the purposes envisaged in the GR of UDD without insisting for its release after treatment into a natural water courses provided there are no prior irrigation or other commitments downstream.”
36 The Ministry of Environment and Forests, Ministry of Urban Development, Ministry of Agriculture, Ministry of Health & Family Welfare, Ministry of Water Resources, Department for Industrial Promotion and Policy and Ministry of Finance.

18
RESOURCE RECOVERY & REUSE SERIES 8
the city environs, estimating potential consumers of wastewater use and preparing action plans for an outcome-based movement towards more efficient use of existing water flows within the city. i. Enact and enforce by-laws for reuse of recycled
wastewater, making treated wastewater the only source for all non-potable applications in industries.
ii. Mandate that ULBs, over a predefined timeframe, make treated water available at specific locations within the city/town for use by large non-potable water users.
iii. Enact and enforce by-laws requiring all new developments to have provision for dual piping that allows reuse of treated water for toilet flushing and other non-potable uses.
4. Revoke or limit the water consent permits for withdrawal of ground water/alternate sources of water for non-potable applications among non-domestic customers.
B. Long-term planning and reforms to promote recycling and reuse of treated wastewater:
1. Identify state-level potential for recycling and reuse of treated wastewater and initiate appropriate swaps: a. Creation of an apex body for water resource
planning and management in urban areas. Alignment of state departments – water resources/irrigation, municipal administration/urban development, panchayat raj (local government)/rural development, agriculture – for regional planning, allocation and management of water resources. Some of the states have moved forward with part of the agenda through the creation of independent regulatory authorities (e.g. Maharashtra) or through the setting up of apex bodies like the Water Resources Department. Most of these have focused on sectoral allocation of water, creation of water resource projects and tariff fixation for irrigation and special supply provisions (e.g., for industrial clusters).
b. Integrated planning and direction would provide clarity for the ULB/water boards on the extent of reclamation/reuse permissible. For instance, in cases where there are prior irrigation commitments downstream and accounting for minimum environmental flows required in basin management, the urban center would be required to return that predetermined (specific) amount of treated wastewater into the river. The volume of treated wastewater in excess of this commitment is what the ULB/water board can work on for reclamation/reuse for other uses.
c. The introduction of treated wastewater flows in water resource planning and management deliberations at the regional level would
also provide the opportunity to examine the possibility of other allocative methods/principles like ‘swap’, where the ULB/water board can be provided with additional allocation of water upstream equivalent to the excess volume (and quality) that the urban center delivers downstream after treatment and meeting other prior commitments.
2. Preparation of state-specific recycled wastewater standards based on intended use. This would require inputs from multiple departments and institutions and should be guided by the industry/manufacturing and agricultural policies and practices in the state, especially in urban and peri-urban environs. It would also be guided by any national standards prescribed by the appropriate authority and could improve, depending on the local conditions, the social and environmental objectives of the state administration. It is expected that they would be based on appropriate baseline information on industry water requirements and agricultural products prevalent in the state.
Initiatives at the utility Level
A. Reforms to promote collection and treatment of wastewater:
1. Create a database on consumers, water use and wastewater generation. a) ULBs and water boards report data on water
supplied and these are underestimates of actual water use by designated consumers within the supply’s jurisdiction. While a few ULBs and water boards have graduated to metering bulk supplies and auditing transmission infrastructure, metering at the consumption side is limited to only a few cities. Also, even in metropolitan centers, industrial consumption of water is rather low and seemingly does not reflect actual industrial water requirements. Ground water access and use in urban centers is a guesstimate and has tended to assumptions that half the municipal water requirements are met from ground water (take the allocation assumptions in any water tribunal directive).
b) With these types of data, estimates on water and wastewater flows within urban environs do not lend themselves to meaningful planning of infrastructure. Such national efforts could also contribute to global-, regional- and country-level data needs on wastewater generation, treatment and use as they will be required for the SDGs (Sato et al. 2013).

19
Recycling and Reuse of tReated wastewateR in uRban india
c) In urban centers, water supplied for parks and other recreation spaces is better accounted for as it is generally conveyed through tankers and managed by the ULB/water board.
2. Planning for treatment and recycling/reuse of wastewater. From the perspective of wastewater treatment, reclamation/reuse, it is essential for the water management agency to have more usable data on water consumption by different end users, especially users that can be satisfied with nonpotable water. � With the reforms adopted in the urban sphere
over the last planning period, many of the larger urban centers have updated their property databases and even made them geographically explicit (i.e. GIS-based). For these cities, these data could be a useful starting point to locate large residential (apartment complexes or layouts), industrial and commercial users, cluster them spatially and build up estimates of water use based on property size. Other cities will need to start from scratch in building a database of industrial/commercial customers within their jurisdictions.
� Prioritization could be made for industrial estates or clusters that have arisen in the urban/peri-urban area.
� Data from the Department of Industries should be accessed and used to estimate water demands in key industrial sectors within the urban jurisdiction and possibly its periphery. These are potential consumers of treated wastewater.
� After identification of the potential type of consumers for treated wastewater – industry, institutional, commercial – within the urban area, conducting public consultations with representatives would help to identify the range of end users and quality requirements. This will need to be fine-tuned further with selected major water consumers.
� Water-use surveys on a sample basis will need to be carried out to assess:o Present and projected water use in
identified industrial, commercial, institutional (educational campuses) and recreational facilities;
o Current sources of supply and costs of water;
o Potential opportunities for utilizing reclaimed water.
� Prepare an estimate of treated wastewater production – present and projected.
� Analyze historical O&M costs of wastewater treatment and prepare unit cost estimates for treated wastewater, accounting for energy charges and projecting possible increases.
� Examine the feasibility and costs of developing dedicated transmission infrastructure for treated wastewater and develop scenarios for different supply amount and investment recovery periods.
B. Reforms to ensure provision of treated wastewater:
1. Identify options for provision of treated wastewater � Analyze historical quality parameters of treated
wastewater to finalize what treated wastewater products are feasible to supply.
� Probe Department of Industry or industry development boards or area development boards to understand planned infrastructure investments (next five years), the type of industries, water requirements for different end uses and the possibility of bulk dual water supply arrangements.
� Start engagement with identified potential consumers within 10 km supply distance of available treatment plants, if consumers are dispersed spatially OR engaged with identified major water consumers who are located in discrete locations (industrial estates, special economic zones, software parks, large residential layouts).
� Start with pilot projects centered around a treatment plant and aimed at offtake of a limited portion of the treated wastewater. Scale up after review.
2. Keeping O&M costs low. Reduce the costs of recycled wastewater through energy recover/power generation at the treatment facility, where possible. Incorporate in future treatment plant design to ensure improved financial viability.
3. Enhance by-laws and building rules. Supply of treated wastewater would require the construction and alignment of separate conveyance systems. Norms for them will need to be incorporated in ULB by-laws and urban road construction plans. Reuse of dual quality water would also require suitable access points and storage facilities at receiving properties. The standards will need to be incorporated in the building rules.

20
RESOURCE RECOVERY & REUSE SERIES 8
REfEREnCEsAmerasinghe, P.; Bhardwaj, R.M.; Scott, C.; Jella, K.; Marshall, F. 2013. Urban
wastewater and agricultural reuse challenges in India. IWMI Research Report 147. Colombo: IWMI. 36p.
Amoah, P.; Keraita, B.; Akple, M.; Drechsel, P.; Abaidoo, R.C.; Konradsen, F. 2011. Low cost options for health risk reduction where crops are irrigated with polluted water in West Africa. IWMI Research Report 141. Colombo: IWMI. Available at http://www.iwmi.cgiar.org/Publications/IWMI_Research_Reports/PDF/PUB141/RR141.pdf
BEE (Bureau of Energy Efficiency). 2011. Mitigation initiatives through agriculture demand side management. Presentation made in August 2011 by Sarabjit Singh Saini, Bureau of Energy Efficiency, Ministry of Power, Government of India.
CDM (Camp, Dresser & McKee – International). 2005. Hyderabad municipal wastewater recycling project: Draft final report, Camp, Dresser & McKee – International.
Census of India. 2011. Household amenities and assets. The Office of Registrar General and Census Commissioner, Govt. of India.
CPCB (Central Pollution Control Board). 2007a. Performance evaluation of sewage treatment plants in India. New Delhi: CPCB, Ministry of Environment and Forests, Govt. of India.
CPCB. 2007b. Evaluation of operation and maintenance of sewage treatment plants in India-2007. Control of Urban Pollution Series: CUPS/68/2007. India: CPCB.
CPCB. 2008. A study of pilot project on decentralized treatment and recycling of domestic wastewater - an integrated approach to water management at Sangamam community - a village model in out-skirts of Aoruoville. India: Central Pollution Control Board.
CPCB. 2009a. Status of water supply, wastewater generation and treatment in Class-I cities and Class-II towns of India. Control of urban pollution series: CUPS 70/2009-100. New Delhi: CPCB, Ministry of Environment and Forests, Govt. of India.
CPCB. 2009b. Comprehensive environmental assessment of industrial clusters. New Delhi: CPCB, Ministry of Environment and Forests.
CPHEEO (Central Public Health and Environmental Engineering Organization). 2013. Manual on sewerage and sewage treatment systems. New Delhi: Ministry of Urban Development, CPHEEO.
Drechsel, P.; Seidu, R. 2011. Cost-effectiveness of options for reducing health risks in areas where food crops are irrigated with wastewater. Water International 36 (4) 535-548.
Drechsel, P.; Qadir, M.; Wichelns, D. 2014. Wastewater: an economic asset in an urbanizing world. Springer.
GTZ (German Technical Cooperation Agency). 2009. The Chinese waste water treatment sector. CDM Perspectives in China. Opportunities for German know-how and CDM application. Beijing: GTZ.
GWI (Global Water Intelligence). 2010. Municipal water reuse markets. Oxford, UK: GWI.
Hanjra, M.A.; Drechsel, P.; Mateo-Sagasta, J.; Otoo, M.; Hernandez, F. 2014. Assessing the finance and economics of resource recovery and reuse solutions across scales. In: Drechsel, P.; Qadir, M.; Wichelns, D. 2014. Wastewater: an economic asset in an urbanizing world. Springer.
IDFC (Infrastructure Development Finance Company). 2011. India Infrastructure Report. Water: Policy and Performance for Sustainable Development. Oxford University Press. New Delhi
IIR (India Infrastructure Research). 2013. Sewage Treatment Market
Kaur, R.; Wani, S.P.; Singh, A.K.; Lal, K. 2012. Wastewater production, treatment and use in India. New Delhi: Water Technology Centre, Indian Agricultural Research Institute.
Kelkar, U.G. 2012a. Wastewater recycle and reuse – technology evolution and costs. Presentation made at ‘Wastewater Recycle and Reuse: The Need of the Hour’ workshop organized by the Ministry of Urban Development, Government of India at New Delhi on April 18, 2012. Available at http://www.urbanindia.nic.in/programme/ uwss/wwrr.htm. Accessed November 28, 2013.
Kelkar, U.G. 2012b. Wastewater recycle and reuse – Indian experience. Presentation made at ‘Wastewater Recycle and Reuse: The Need of the Hour’ workshop organized by the Ministry of Urban Development, Government of India at New Delhi on April 18, 2012.
Keraita, B.; Drechsel, P.; Klutse, A.; Cofie, O. 2014. On-farm treatment options for wastewater, greywater and fecal sludge with special reference to West Africa. Colombo, Sri Lanka: IWMI.CGIAR Research Program on Water, Land and Ecosystems (WLE). 32p
Kumar, V.C. 2013. Presentation on ‘Wastewater status and reuse of water’. Resource Recovery and Reuse: From Research to Implementation. Inception Workshop, Bangalore, India, April 24, 2013.
Londhe, A., J. Talati, L.K. Singh, M. Vilayasseril, S. Dhaunta, B. Rawlley, K.K. Ganapathy and R. P. Mathew. 2004. Urban-Hinterland Water Transactions: A Scoping Study if Six Class I Indian Cities. Paper Presented at IWMI-Tata Annual Partners Meeting, Anand, India.
Libhaber M.; Orozco-Jaramillo, A. 2013 Sustainable treatment of municipal wastewater. Water21 (October 2013): 25-28.
McCartney, M.; Scott, C.; Ensink, J.; Jiang, B.B.; Biggs, T. 2008. Salinity implications of wastewater irrigation in the Musi River catchment in India. Ceylon Journal of Science (Biological Sciences) 37(1): 49-59.
MGI (McKinsey Global Institute). 2010. India’s urban awakening: Building inclusive cities, sustaining economic growth. April 2010. McKinsey Global Institute.
Minhas, P.S. 2002. Use of sewage in agriculture: Some experience. Presentation at workshop on ‘Wastewater Use in Irrigated Agriculture: Confronting Livelihoods and Environmental Realities’. Hyderabad: IWMI.
MoEF. 2012. India Second National Communication to the United Nations Framework Convention on Climate Change. New Delhi: MoEF.
Morf, L.; Koch, M. 2009. Synthesebericht für interessierte Fachpersonen, Zürcher Klärschlamm-entsorgung unter besonderer Berücksichtigung der Ressourcenaspekte. Zurich: Baudirection.
MoWR (Ministry of Water Resources). 2006. Report of the working group on water resources for the XI Five Year Plan (2007-2012). New Delhi: MoWR.
MoWR. 2011. Report of the working group on major & medium irrigation and command area development for the XII Five Year Plan (2012-2017). New Delhi: MoWR.
Murray, A.; Buckley, C. 2010. Designing reuse-oriented sanitation infrastructure: the design for service planning approach. In: Drechsel, P.; Scott, C.A.; Raschid-Sally, L.; Redwood, M.; Bahri, A. (eds.). Wastewater irrigation and health: Assessing and mitigation risks in low-income countries. UK: Earthscan-IDRC-IWMI. pp 303-318.
NRC (National Research Council). 2012. Potential for expanding the nation’s water supply through reuse of municipal wastewater. Washington, D.C.: National Research Council.
Otoo, M.; Drechsel, P. 2016. Resource recovery from waste: business models for energy, nutrient and water reuse. Earthscan.
PC (Planning Commission). 2011. Final report of minor irrigation and watershed management for the Twelfth Five Year Plan (2012-2017). New Delhi: Planning Commission.
PC. 2013. Twelfth Five Year Plan (2012–2017). Faster, more inclusive and sustainable growth. Volume I. India: Planning Commission (Government of India).
Raman, R. 2009. Economic valuation of wastewater – An urban perspective. Presentation made at ‘Round Table on Public Private Partnerships for Improved Sanitation’ workshop organized by the Ministry of Urban Development at Bangalore, June 3, 2009.
Sato, T., Qadir, M., Yamamoto, S., and Zahoor, A. 2013. Global, regional and country level need for data on wastewater generation, treatment, and use. Agricultural Water Management 130 1-13. Elsevier. B. V.
Sharma, A. 2013. Mahagenco - Nagpur Municipal Corporation waste water reuse project at Nagpur: water supply for (3x660 MW) Koradi TPS. Presentation at MoUD workshop on wastewater recycling, New Delhi.

21
Recycling and Reuse of tReated wastewateR in uRban india
Silva, P.; Scot, C. 2002. What are the wastewater treatment plant effects on wastewater irrigation benefits? Presentation at workshop on ‘Wastewater Use in Irrigated Agriculture: Confronting Livelihoods and Environmental Realities’. Hyderabad: IWMI.
ThFC (Thirteenth Finance Commission). 2009. Volume 1: Report. Thirteenth Finance Commission, Government of India, New Delhi.
UN-Water. 2011. Industrial wastewater reclamation technology for urban irrigation. Presented by Piet DuPisani, Head of the Water and Wastewater Department of the City of Windhoek. Water in the Green Economy in Practice: Towards Rio+20. UN-Water International Conference, Zaragoza, Spain. October 3-5, 2011.
USEPA (United States Environmental Protection Agency). 2012. Guidelines for water reuse. Washington, DC: USEPA, Cincinnati, OH: Office of Research and Development.
World Bank. 2010. Improving wastewater use in agriculture: An emerging priority. The World Bank.
WHO (World Health Organization). 2006. Guidelines for the safe use of wastewater, greywater and excreta in agriculture and aquaculture. Geneva, Switzerland: WHO.
WHO. 2010. Second information kit: The guidelines for the safe use of wastewater, excreta and greywater in agriculture and aquaculture. Geneva: WHO-FAO-IDRC-IWMI. Available at http://www.who.int/water_sanitation_health/wastewater/human_waste/en/.
WII (Winrock International). 2006. Urban wastewater: Livelihoods, health and environmental impacts in India. New Delhi: Winrock International.
WSP (Water and Sanitation Program). 2008. Technology options for urban sanitation in India. New Delhi: Water and Sanitation Program.
WSP. 2011. Economic Impact of Inadequate Sanitation in India. New Delhi: Water and Sanitation Program
WSP. 2014. Cost of wastewater treatment recovery in sewerage and sewage treatment. New Delhi: Water and Sanitation Program.

22
RESOURCE RECOVERY & REUSE SERIES 8
APPEndIxEs
Appendix 1. Current and Projected Water Demands in India
The dominant demand driver in the future will continue to be the agriculture sector in India, the current share of which was about 85% of total water demand in 2010, expected to become about 74% by 2050. The demand from the industrial sector is expected to triple in the same period, with demand for water in the energy sector (currently at less than 1% of total water demand) anticipated to increase
37 Figure A1.1 is based on MoWR estimates, which differ slightly from estimates prepared by the National Council for Integrated Water Resource and Development (NCIWRD). NCIWRD data are lower than those presented here and developed by the Standing Subcommittee of the Ministry of Water Resources (PC 2013).
fIGuRE A1.1. CuRREnt And PRojECtEd WAtER dEmAnds In IndIA.
2010 2025 2050Irrigation 688 910 1072Drinking Water 56 73 102Energy 5 15 130Industry 12 23 63Others 52 72 80
0%
10%
20%
30%
40%
50%
60%
70%
80%
90%
100%
Sector Wise Water Demand - MoWR Projections
to almost 9% of the total demand by 2050. The current (2010 requirement) and projected water demands (2025 and 2050 estimates) for various sectors (CPCB 2009b; PC 2013) are presented in Figure A1.137 Table A1.1 identifies the most water-intensive industrial sectors in India and presents their water consumption and wastewater generation (IDFC 2011).

23
Recycling and Reuse of tReated wastewateR in uRban india
tAbLE A1.1. WAtER ConsumPtIon In thE IndustRIAL sECtoR In IndIA.
INduSTRIAL SECTOR ANNuAL WASTEWATER ANNuAL CONSuMPTION PROPORTION OF TOTAL
dISCHARGE (MILLION (MILLION CuBIC METERS) WATER CONSuMEd IN
CuBIC METERS) INduSTRy (PER CENT)
Thermal power plants 27,000.9 35,157.4 87.87
Engineering 1551.3 2019.9 5.05
Pulp and paper 695.7 905.8 2.26
Textiles 637.3 829.8 2.07
Steel 396.8 516.6 1.29
Sugar 149.7 194.9 0.49
Fertilizer 56.4 73.5 0.18
Others 241.3 314.2 0.78
Total 30,729.2 40,012 100
Source: IDFC 2011

24
RESOURCE RECOVERY & REUSE SERIES 8
Ap
pen
dix
2. C
itie
s S
our
cing
Wat
er f
rom
Dis
tant
So
urce
sIn
Indi
a, c
ities
get
thei
r w
ater
from
sig
nific
ant d
ista
nces
. Tab
le A
2.1
prov
ides
the
dist
ance
s fo
r di
ffere
nt c
ities
.
tAb
LE A
2.1.
Ind
IAn
CIt
y W
AtE
R s
ou
RC
E.
CIT
y
TR
Ad
ITIO
NA
L S
Ou
RC
E
dIS
TAN
CE
FR
OM
S
uB
SE
qu
EN
T S
Ou
RC
E
dIS
TAN
CE
FR
OM
C
uR
RE
NT
/Fu
Tu
RE
SO
uR
CE
d
ISTA
NC
E F
RO
M
CIT
y (K
M)
C
ITy
(KM
)
CIT
y (K
M)
Agr
a R
iver
Yam
una
With
in th
e ci
ty
Riv
er Y
amun
a W
ithin
the
city
M
athu
ra-V
rinda
van
wat
er s
uppl
y 40
0
s
chem
e
Raj
kot
Bar
rage
s on
Riv
er A
ji 11
B
hada
r D
am
65
Riv
er N
arm
ada
wat
er fr
om M
alia
40
0
(R
iver
Bha
dar)
ca
nal
Del
hi
Ste
pwel
ls
With
in th
e ci
ty
Tehr
i Dam
>
300
Ren
uka
Dam
32
5
(R
iver
Gan
ga)
Che
nnai
R
edhi
lls a
nd P
oond
i lak
es
50-7
0 Ve
eran
am la
ke
235
Jodh
pur
Ste
pwel
ls a
nd la
kes
With
in th
e ci
ty
Indi
ra G
andh
i Can
al
205
Aur
anga
bad
Sha
llow
wel
ls
With
in th
e ci
ty
Nat
h S
agar
Dam
42
N
andu
r M
adhm
eshw
ar D
am
185
(R
iver
God
avar
i)
Dew
as
Ste
pwel
ls
With
in th
e ci
ty
Riv
er S
hipr
a 12
R
iver
Nar
mad
a 16
8
Bhi
lwar
a M
eja
Dam
11
G
roun
d w
ater
from
the
bed
9
Bis
alpu
r D
am
138
of
the
Riv
er B
anas
(Riv
er C
ham
bal)
Tum
kur
Mai
dala
tank
W
ithin
the
city
B
ugud
anah
alli
Res
ervo
ir 8
Heb
baka
Tan
k 13
3
H
emav
ati T
ank
Mat
hura
G
roun
d w
ater
W
ithin
the
city
G
roun
d w
ater
and
Riv
er
Nea
rby
Upp
er G
anga
Can
al
130
(s
hallo
w w
ells
)
Yam
una
Mum
bai
Prio
r to
187
0, s
hallo
w w
ells
W
ithin
the
city
B
hats
a Ta
nk
100-
110
Mid
dle
Vaita
rna
120
U
pper
Vai
tarn
a, T
ulsi
,
V
ihar
Lak
es
Hyd
erab
ad
Riv
er M
usi a
nd H
ussa
in
With
in th
e ci
ty
Osm
an S
agar
Lak
e 15
M
anjir
a, S
ingu
r IV
and
59
-80
S
agar
Lak
e
Him
ayat
Sag
ar L
ake
9.6
Nag
arju
na S
agar
Dam
11
6
Sol
apur
H
ippa
raga
Lak
e N
earb
y ci
ty
Riv
er B
him
a an
d U
jani
Dam
27
110
Ben
galu
ru
Riv
er A
rkav
athi
25
R
iver
Cau
very
10
0
Jhan
si
Sha
llow
, ope
n w
ells
W
ithin
the
city
M
atat
ila D
am o
n th
e
45
Raj
ghat
Dam
on
the
Riv
er B
etw
a 95
R
iiver
Bet
wa
Sur
at
Bor
ewel
ls a
nd r
anne
y w
ells
W
ithin
the
city
R
iver
Tap
i 90
R
iver
Tap
i 5
(U
kai D
am)
Gur
gaon
G
roun
d w
ater
W
ithin
the
city
G
roun
d w
ater
and
69
Ya
mnu
na C
anal
(s
hallo
w w
ells
)
Yam
nuna
Can
al
(th
roug
h pi
pelin
e)
70
Indo
re
Yash
wan
t Sag
ar D
am a
nd
8-12
R
iver
Nar
mad
a 70
B
ilwal
i Tan
k
(Con
tinue
d)

25
Recycling and Reuse of tReated wastewateR in uRban india
tAb
LE A
2.1.
Ind
IAn
CIt
y W
AtE
R s
ou
RC
E. (
C0n
tIn
uE
d)
CIT
y
TR
Ad
ITIO
NA
L S
Ou
RC
E
dIS
TAN
CE
FR
OM
S
uB
SE
qu
EN
T S
Ou
RC
E
dIS
TAN
CE
FR
OM
C
uR
RE
NT
/Fu
Tu
RE
SO
uR
CE
d
ISTA
NC
E F
RO
M
CIT
y (K
M)
C
ITy
(KM
)
CIT
y (K
M)
Bho
pal
Upp
er a
nd L
ower
Lak
es
With
in th
e ci
ty
Kol
ar D
am
44
Riv
er N
arm
ada
55
Than
e S
hallo
w a
nd o
pen
wel
ls
With
in th
e ci
ty
Bha
tsa
Dam
58
Te
mgh
ar D
am
26
Hub
li-D
harw
ad
Sha
llow
wel
ls
With
in th
e ci
ty
Nee
ra S
agar
Lak
e an
d
30
Mal
apra
bha
Res
ervo
ir 30
/55
M
alap
rabh
a R
eser
voir
55
Uda
ipur
S
tepw
ells
and
lake
s W
ithin
the
city
Ja
isam
and
Lake
50
M
ansi
, Wak
al a
nd D
ewas
Dam
42
-45
Bar
amat
i Le
ft ba
nk c
anal
from
R
iver
Nee
ra
Nea
r th
e ci
ty
Uja
ni D
am
50
(R
iver
Bhi
ma)
Thiru
vana
ntha
pura
m
Aru
vikk
ara
Dam
acr
oss
16
P
eppa
ra D
am
45
R
iver
Kar
aman
a
(Riv
er K
aram
ana)
Nag
pur
Riv
er K
anna
n 20
G
orew
ada
Lake
10
P
ench
Dam
45
M
unda
li D
am
40
Bhu
bane
swar
R
iver
Kua
khai
and
Day
a 2-
3 R
iver
Mah
anad
i 30
Dha
nbad
S
hallo
w o
pen
wel
ls
With
in th
e ci
ty
Topc
hanh
i lak
e 20
M
aith
an D
am a
cros
s th
e 35
R
iver
Dam
odar
22
R
iver
Bar
akar
Gw
alio
r S
hallo
w o
pen
wel
ls
With
in th
e ci
ty
Tigh
ara
Dam
27
Srin
agar
S
hallo
w w
ells
and
Dal
Lak
e W
ithin
the
city
R
iver
Doo
dhga
nga
15
Sin
d nu
llah
(trib
utar
y of
the
25
H
arva
n Ta
rn
21
Riv
er J
helu
m)
Ujja
in
Riv
er K
ship
ra
With
in th
e ci
ty
Riv
er G
ambi
r 22
Deh
radu
n O
pen
wel
ls a
nd s
prin
gs
With
in th
e ci
ty
Gro
und
wat
er, s
prin
gs
8-10
D
am o
n R
iver
Son
g 20
an
d ca
nals
Ran
chi
Sha
llow
wel
ls
With
in th
e ci
ty
Kan
ke a
nd R
ukka
Dam
s
7-20
an
d D
hurv
a R
eser
voir
Aiz
wal
S
prin
gs a
nd ro
ofto
p
With
in th
e ci
ty
Tlw
ang
Riv
er
18
ra
inw
ater
Jaip
ur
Ram
garh
Lak
e 27
G
roun
d w
ater
W
ithin
the
city
B
isal
pur
Dam
12
Pun
e O
pen
wel
ls a
nd s
hallo
w
With
in th
e ci
ty
Kha
dakw
asla
Dam
12
bo
rew
ells
Mus
soor
ie
Spr
ingw
ater
from
Jin
isi
6-7
dow
n th
e va
lley
Spr
ingw
ater
from
Jin
isi
6-7
dow
n th
e va
lley
Har
dy F
alls
10
-12
an
d B
hila
r
and
Bhi
lar
Utt
arka
shi
Riv
er A
ssi G
anga
8
Koh
ri G
had
11
Bas
unga
spr
ing
5
Kan
pur
Riv
er G
anga
(sha
llow
wel
ls)
With
in th
e ci
ty
Riv
er G
anga
(sha
llow
wel
ls)
With
in th
e ci
ty
Luv-
Kus
h B
arra
ge
10
(R
iver
Gan
ga)
Haz
arib
agh
Haz
arib
agh
Lake
3
Chh
arw
a D
am
8
Srik
akul
am
Sha
llow
ope
n w
ells
W
ithin
the
city
R
iver
Nag
aval
i 5
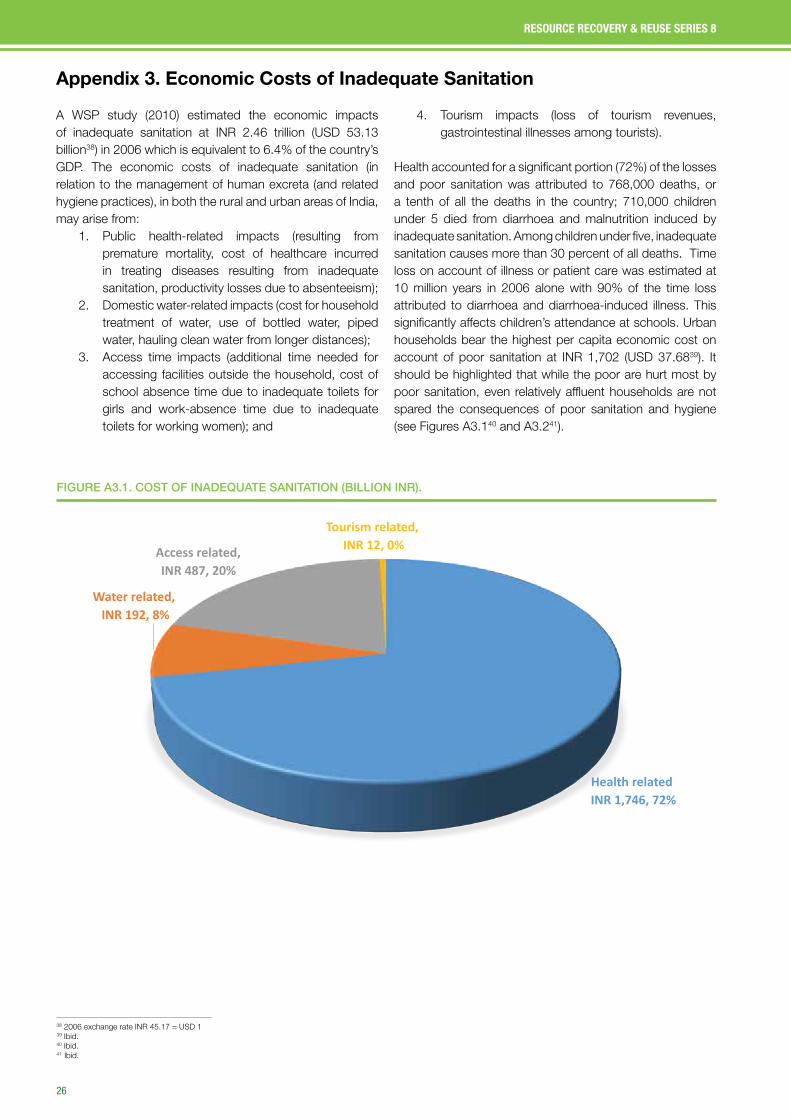
26
RESOURCE RECOVERY & REUSE SERIES 8
Appendix 3. Economic Costs of Inadequate Sanitation
A WSP study (2010) estimated the economic impacts of inadequate sanitation at INR 2.46 trillion (USD 53.13 billion38) in 2006 which is equivalent to 6.4% of the country’s GDP. The economic costs of inadequate sanitation (in relation to the management of human excreta (and related hygiene practices), in both the rural and urban areas of India, may arise from:
1. Public health-related impacts (resulting from premature mortality, cost of healthcare incurred in treating diseases resulting from inadequate sanitation, productivity losses due to absenteeism);
2. Domestic water-related impacts (cost for household treatment of water, use of bottled water, piped water, hauling clean water from longer distances);
3. Access time impacts (additional time needed for accessing facilities outside the household, cost of school absence time due to inadequate toilets for girls and work-absence time due to inadequate toilets for working women); and
fIGuRE A3.1. Cost of InAdEquAtE sAnItAtIon (bILLIon InR).
38 2006 exchange rate INR 45.17 = USD 139 Ibid.40 Ibid.41 Ibid.
Health relatedINR 1,746, 72%
Water related, INR 192, 8%
Access related,INR 487, 20%
Tourism related,INR 12, 0%
4. Tourism impacts (loss of tourism revenues, gastrointestinal illnesses among tourists).
Health accounted for a significant portion (72%) of the losses and poor sanitation was attributed to 768,000 deaths, or a tenth of all the deaths in the country; 710,000 children under 5 died from diarrhoea and malnutrition induced by inadequate sanitation. Among children under five, inadequate sanitation causes more than 30 percent of all deaths. Time loss on account of illness or patient care was estimated at 10 million years in 2006 alone with 90% of the time loss attributed to diarrhoea and diarrhoea-induced illness. This significantly affects children’s attendance at schools. Urban households bear the highest per capita economic cost on account of poor sanitation at INR 1,702 (USD 37.6839). It should be highlighted that while the poor are hurt most by poor sanitation, even relatively affluent households are not spared the consequences of poor sanitation and hygiene (see Figures A3.140 and A3.241).
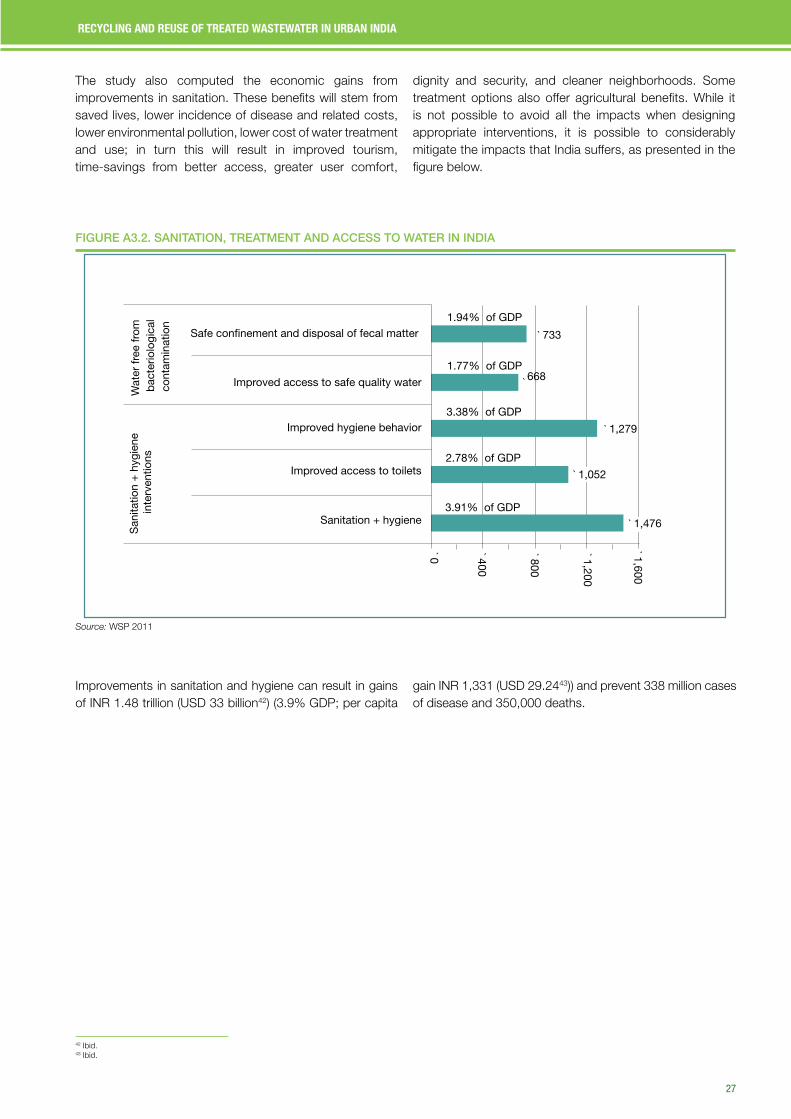
27
Recycling and Reuse of tReated wastewateR in uRban india
Improvements in sanitation and hygiene can result in gains of INR 1.48 trillion (USD 33 billion42) (3.9% GDP; per capita
The study also computed the economic gains from improvements in sanitation. These benefits will stem from saved lives, lower incidence of disease and related costs, lower environmental pollution, lower cost of water treatment and use; in turn this will result in improved tourism, time-savings from better access, greater user comfort,
dignity and security, and cleaner neighborhoods. Some treatment options also offer agricultural benefits. While it is not possible to avoid all the impacts when designing appropriate interventions, it is possible to considerably mitigate the impacts that India suffers, as presented in the figure below.
fIGuRE A3.2. sAnItAtIon, tREAtmEnt And ACCEss to WAtER In IndIA
`0 `400
`800
`1,200
`1,600
` 1,052
` 1,279
668`
` 733
3.91% of GDP
2.78% of GDP
3.38% of GDP
1.77% of GDP
1.94% of GDP
Sanitation + hygiene
Improved access to toilets
Improved hygiene behavior
Improved access to safe quality water
Safe confinement and disposal of fecal matter
San
itatio
n +
hyg
iene
in
terv
entio
nsW
ater
free
from
b
acte
riolo
gica
l co
ntam
inat
ion
` 1,476
Source: WSP 2011
42 Ibid.43 Ibid.
gain INR 1,331 (USD 29.2443)) and prevent 338 million cases of disease and 350,000 deaths.

28
RESOURCE RECOVERY & REUSE SERIES 8
tAbLE A4.1. CLAssIfICAtIon of WAtER REusE APPLICAtIons.
Appendix 4. International Guiding Frameworks for Wastewater Recycling and Reuse
uSEPA Guidelines for Water Reuse: These guidelines provide a detailed framework for the planning and regulation of water reuse projects based on the different standards used across the USA. The prescribed water quality considerations are based on the type of intended use (as described in Table A4.1). For each reuse application, the guidelines specify the extent of treatment required, the quality standards, the monitoring parameters and frequency of monitoring, setback distances for potable water supply wells and additional commentary. The guidelines also specify the degree and type of restriction required for a particular use based on the detailed water quality considerations. See http://nepis.epa.gov/Adobe/PDF/P100FS7K.pdf
WHO Guidelines, 2006: WHO initially published Guidelines for the Safe Use of Wastewater and Excreta in Agriculture and Aquaculture in 1989 and later revised this to ‘Guidelines for the Safe Use of Wastewater,
Excreta and Grey Water’ (WHO 2006). These guidelines are concerned with the health implications of using wastewater for agriculture and aquaculture applications and aim to protect the health of farmers (and their families), local communities and product consumers. The 2006 guidelines moved away from traditional water quality thresholds to provide options also for low- and middle-income countries for step-wise achievement of so-called health-based targets which describe the allowed exposure of the farmer or consumer. The revised guidelines promote a multibarrier approach to minimize the risk and allow greater flexibility in reuse, depending for example on the type of crop being irrigated and looking at viral, bacterial and protozoan pathogens and helminth eggs. The revised 2006 guidelines also evaluate the use of excreta and treated faecal sludge when used in agriculture or aquaculture. The four volumes of the 2006 edition are available at http://www.who.int/water_sanitation_health/wastewater/gsuww/en/.
Source: USEPA 2012
CATEGORy OF REuSE dESCRIPTION
Urban Reuse Unrestricted The use of reclaimed water for nonpotable applications in municipal settings where public access is not restricted
Restricted The use of reclaimed water for nonpotable applications in municipal settings where public access is controlled or restricted by physical or institutional barriers, such as fencing, advisory signage, or temporal access restriction
Agricultural Food Crops The use of reclaimed water to irrigate food crops that are intended for human Reuse consumption
Processed Food The use of reclaimed water to irrigate crops that are either processed before Crops and Non-food human consumption or not consumed by humans Crops
Impoundments Unrestricted The use of reclaimed water in an impoundment in which no limitations are imposed on body-contact water recreation activities
Restricted The use of reclaimed water in an impoundment where body contact is restricted
Environmental Reuse The use of reclaimed water to create, enhance, sustain, or augment water bodiesincludingwetlands,aquatichabitats,orstreamflow
Industrial Reuse The use of reclaimed water in industrial applications and facilities, power production, and extraction of fossil fuels
Groundwater Recharge - The use of reclaimed water to recharge acquifers that are not used as a Nonpotable Reuse potable water source
Potable Reuse IPR Augmentation of a drinking water source (surface or groundwater) with reclaimed water followed by an environmental buffer that precedes normal drinking water treatment
DPR The introduction of reclaimed water (with or without retention in an engineered storage buffer) directly into a water treatment plant, either collocated or remote from the advanced wastewater treatment system

29
Recycling and Reuse of tReated wastewateR in uRban india
Appendix 5. Implementation Arrangement for Management of Wastewater Treatment Facilities
A. Accessing Program Funds
The traditional approach adopted by urban local bodies (ULBs)/water boards/utilities in India to finance the construction of STPs is through program grants from the national/state government, grants or subsidies from the state government or a combination thereof and charge for the supply of treated wastewater to meet the O&M expenses of the plant. The effectiveness of this strategy to recover the cost of O&M relies on the customer’s willingness to pay for the treated wastewater, which is implicitly higher when the water is supplied to industrial customers, but will depend on the specific treatment and water grade requirements of these customers. Some cities also strive towards keeping O&M efficient (and hence lowering costs) through third-party O&M management contracts. The water boards/utilities in the cities of Chennai and Bangalore have effectively used this model to construct, operate and manage their treatment facilities, as discussed below.
As of August, 2013 Bangalore has had sewerage treatment infrastructure capable of treating 721 MLD of wastewater. This includes 73 MLD of tertiary treatment capacity and the balance being secondary treatment. Additional facilities for treating 339 MLD are proposed under the centrally-sponsored JNNURM and National River Conservation Plan (NRCP) schemes. In the current treatment infrastructure, most of the older treatment plants were funded through grants under the NRCP, mega city schemes and from the state government. Apart from this, OECF funds and state government investments in the Cauvery Water Supply Scheme Stage IV, Phase I helped in the setting up of part of the secondary treatment facilities. Seventy MLD of the tertiary treatment facilities have become available through funding for the Bangalore Water Supply and Sewerage Board (BWSSB) under the Indo-French protocol. Bangalore is supplying treated wastewater from the tertiary plants to existing industries, newly formed industry clusters and establishments like the international airport. Two small-scale (1.5 MLD) tertiary plants have also been set up to raise public awareness on the benefits of wastewater recycling and reuse.
At present the sewage generated in Chennai is being treated in nine treatment plants: total capacity is 486 MLD. The O&M for several of the plants is conducted through third party contracts. The Koyambedu STP Zone III (34 MLD) is run by CMWSSB with maintenance provided by Detech. Human resource and management expenses amount to INR 1 lakh per month (USD 1,56144). Repairs are borne
by CMWSSB. Koyambedu New STP Zone III (60 MLD) is managed by Enviro Control Associates with a budget of INR 14 crore (107) (USD 2.2 million45) for O&M. B. Public-Private Partnerships
A utility may choose to manage the wastewater through different arrangements. The obvious and most frequently chosen option (in cities where wastewater treatment is being provided) is to treat the wastewater collected from its service area to the standards required according to applicable regulations (the minimum requiring treatment levels to be consistent with conventional secondary treatment plants). However, utilities may also consider arrangements involving public-private partnership (PPPs) models whereby some or the entire burden of constructing and operating the treatment plant becomes the responsibility of the private operator, with different forms of revenue and cost sharing depending on the specific circumstances of the city/PPP partner. Some examples of PPP arrangements in the sanitation sector being implemented in Indian cities are as follows:
Nagpur: The City of Nagpur (Nagpur Municipal Corporation (NMC)) has entered into an MoU with the Maharashtra Power Generation Company Limited (Mahagenco), a public sector company, for “Construction and Operating Agreement of Treatment and Transmission Facilities for Reclaimed Water Usage”, whereby NMC will provide 110 MLD of untreated, raw sewage to Mahagenco at the rate of INR 15 crore/year (USD 2.8 million46), will allocate land at no additional cost to the company and pass on to the central capital a grant of INR 90 crore (50% of project cost) (USD 16.8 million47) received under JNNURM to Mahagenco for project construction. Mahagenco in turn will be responsible for the construction, operation and maintenance of the STP according to the requirements, including provision of the remaining 50% of the project capital requirement (Sharma 2013).
Tuticorin: The City of Tuticorin or Thoothukudi is a rapidly expanding industrial town and a commercial hub for industrial import and export. The Thoothukudi Municipal Corporation (TMC) is responsible for providing water and sanitation services to a population of 3,76,439 (Census of India 2011). Before the corporation began its current project for the construction of a 24 MLD wastewater treatment plant, facilities for water treatment were almost nonexistent in the city. TMC approached the Commissionerate of Municipal Administration (CMA) to help undertake the
44 2015 exchange rate INR 64.03 = USD 145 Ibid.46 2012 exchange rate INR 53.46 = USD 147 Ibid.

30
RESOURCE RECOVERY & REUSE SERIES 8
project and the CMA, through a Transaction Advisor (CRISIL Risk and Infrastructure Solution Ltd), structured the wastewater treatment plant (WWTP) on a DBFOT basis. The project is being implemented on a PPP basis for a concession period of 30 years (including two years of construction), with the TMC responsible for providing land for construction and supply of sewage free of cost at the inlet. The concessionaire is free to sell the treated water to industrial units with a tariff structure of his choice during the concession period. The bidding parameter selected was a grant quoted for the project.
The developer selected for the project offered a negative grant to TMC, which was feasible given the prevalence of saline water in the city limits, drinking water being procured from long distances and high demand for industrial water with industries purchasing water from private suppliers at INR 65-70/ KL (USD 1.07 – 1.1548).
The project will benefit all stakeholders, ensuring that untreated sewage is not discharged into the sea, thereby controlling water pollution resulting from rampant dumping of untreated sewage and providing industries access to a reliable alternate source of water.
Kolhapur: The city was faced with sanitation challenges due to partial/untreated sewage being dumped into the
Panchganga River. The Maharashtra Pollution Control Board (MPCB) issued notice and filed a criminal case against Kolhapur Municipal Corporation (KMC) for not controlling the quality of sewage discharged into the river. While KMC had envisaged and designed two STPs of 76 MLD and 17 MLD capacity each, the corporation’s finances did not permit KMC to implement these projects through available revenue surplus. The city decided to use Viability Gap Funding (VGF) and explore a PPP model for implementation of these projects. The 76 MLD project availed NCRD grants (70%) and the 17 MLD project availed grants under the state MSJNMA scheme (50%) and secured the balance funds through private developers.
The developers were obligated to construct, operate and maintain the STPs according to state water quality norms, while having the right to sell treated water and sludge over a 15-year concession period. KMC was responsible for providing land free of cost, providing right of way for laying pipelines, assisting in obtaining necessary approvals, providing a predefined contribution on the project cost and transporting wastewater generated in the city to the identified pumping stations. The payments to be made by KMC included fixed and variable charges (for electricity and consumable cost depending upon the amount of wastewater treated).
48 2014 exchange rate INR 60.89 = USD 1

31
Recycling and Reuse of tReated wastewateR in uRban india
Appendix 6. International Experience on Wastewater Recycling
Several countries have adopted the recycling and reuse of wastewater to varying degrees and for a range of activities, including meeting agricultural water demand. Arid parts of the USA, Israel, Mexico, China, Spain, Namibia, Australia and several Middle Eastern countries are recycling their wastewater as irrigation water. China, India, Mexico and Chile each has a cultivated area of more than 40,000 ha that is irrigated with untreated wastewater (World Bank 2010). The revised and updated Manual on Sewerage and Sewage Treatment Systems, 2013 also discusses countries reusing treated wastewater for different applications, including for agricultural, industrial and commercial applications.
Countries such as Israel, Singapore and the coastal states of the USA all began their extensive reuse programs to mitigate their water scarcity challenges. The programs all began with the development of policy/regulations for the recycling of wastewater, followed by detailed guidelines prescribing the quality of treated water required for various uses. Policy formulation led to the implementation of pilot programs and R&D activities to test the suitability of different technologies for treatment and impact of use of the treated water for various applications. Extensive public awareness, outreach and awareness/educational campaigns were also initiated to gain public support and acceptability for the use of treated and recycled wastewater.
The culmination of all these policy, institutional, R&D and testing efforts is the flourishing wastewater recycling programs in these countries. The most significant benefit realized in countries with the propagation of such programs is the creation of an alternate, reliable source of water supply for meeting appropriate uses, at cost that is less than the cost of producing an equal quantity of freshwater from alternative sources. Countries using treated water for agriculture also value the environmental benefit created by avoiding the inflow of excess nutrients present in wastewater into surface water bodies resulting in environmental pollution and eutrophication. Still others, such as the city of Windhoek, Namibia, have realized economic benefits from recycling wastewater aiming at an increase in land value from €2,500-20,000 ha-1 due to water availability and creation of jobs and higher incomes (UN-Water 2011).
Wastewater treatment and use and/or disposal in the humid regions of developed countries, such as the eastern part of North America, northern Europe and Japan are motivated by stringent effluent discharge regulations and public preferences regarding environmental quality. Treated wastewater is also used for irrigation, but this end use is not substantial in humid areas. The situation is different in the arid and semi-arid areas of developed countries, such as western North America, Australia, parts of the Middle East and southern Europe, where
treated wastewater is used primarily for irrigation, given the increasing competition for water between agriculture and other sectors. In developing countries, wastewater treatment is limited, as investments in treatment facilities have not kept pace with persistent increases in population and the consequent increases in wastewater volume in many countries. Thus, much of the wastewater generated is not treated, and much of the untreated wastewater is used for irrigation in dry areas by small-scale farmers with little ability to optimize the volume or quality of the wastewater they receive (Sato et al. 2013).
Israel started to perform massive water reuse in irrigation in the 1970s, for cotton production. Many lessons have been learned since those years, and many types of crops are presently irrigated with reclaimed water. Today, more than 70% of Israel’s sewage is reused in agricultural irrigation and treated wastewater is seen as an integral part of the water resources of the country.
Widespread uptake of wastewater irrigation in Israel is a combination of resource scarcity experienced in the country as well as policy and technology thrusts provided by the government and research institutions. Some key policy interventions have been:
• WastewaterirrigationwasincludedintheNationalPolicy on Sustainable Agriculture and Rural Development (SARD);
• TheMinistryofEnvironmentworksincollaborationwith the Ministry of Agriculture for the long-term strategies for sustainable agriculture;
• FormationofanInter-MinisterialCommittee(Inbar),which developed regulations on water quality; and
• Mandatory requirements for farmers to acquirepermits for irrigation with effluent water.
Policy interventions were supported by intensive research and development efforts, with focused water sector planning, and studies on the short- and long-term effects of wastewater irrigation on crops and the environment. Israel also created a government extension service focused on transferring knowledge from research to the farmer and identifying farmers’ problems and bringing them to research training courses.
Australia: A country faced with unpredictable floods and droughts, Australia has embarked upon an aggressive wastewater recycling program, especially for reuse of treated water in agriculture. The program is led by policy action at both state and national levels, supplemented with guidance on recycling contained in the National Guidelines for Water Recycling and Reuse. The guidelines prescribe quality standards for recycled water

32
RESOURCE RECOVERY & REUSE SERIES 8
depending on the type of reuse, and outline best practices and key considerations. While agricultural reuse is the most ubiquitous form of reuse practiced in Australia, heavy manufacturing with water-intensive industrial customers has also entered into agreements with water providers for the purchase of recycled water. Earlier reuse projects such as Rose Hills in Sydney are now entering into forward selling contracts with other customers.
uSA: Various states in the USA are at the forefront of wastewater recycling, largely owing to the limited availability of freshwater supplies and the water demand-supply gap in the region. Almost 90% of all reuse in the USA occurs in just four states: Arizona, California, Florida and Texas. California and Florida continue to be the two largest users of recycled (reclaimed) water. While the largest use for recycled water in California is for agricultural use and for natural systems, Florida consumes more than 50% of all recycled water used just for urban reuse (landscape irrigation, golf courses). Both states also use reclaimed water for industrial reuse and ground water recharge.
Different states started wastewater recycling for different purposes and have developed state-specific reuse standards to support the reuse of
reclaimed wastewater for different purposes. The US Environmental Protection Agency (USEPA) has also prescribed Guidelines for Reuse, which were most recently revised in 2012.
Singapore: The NEWater recycling and reuse program of the Government of Singapore is a manifestation of the country’s limitations vis-à-vis availability of freshwater and its desire to become self-sufficient in terms of water supply in the next few decades. Officially declared a ‘water poor’ state by the Food and Agriculture Organization of the United Nations (FAO), Singapore relies on freshwater imports from Malaysia (about 30% of total demand), and the remainder through rainfall and more than a dozen reservoirs located throughout the state.
To end reliance on international imports of freshwater, the government-owned Public Utilities Board began its NEWater program with the establishment of four recycling/reuse plants which supply water primarily to meet industrial water need as well as for indirect potable reuse to augment supply reserves in the city’s reservoirs. The government has also initiated public awareness and education campaigns to ensure the acceptability of its NEWater program.

33
Recycling and Reuse of tReated wastewateR in uRban india
Appendix 7. Hyderabad: The Supply-Demand Gap and Using Wastewater Recycling to Meet the Deficit
tAbLE A7.1. totAL WAtER dEmAnd EstImAtEs foR hydERAbAd tILL 2031.
SECTOR 2001 2011 2021 2031
Domestic (MLD) 862.65 1,376.85 1,538.03 1,772.16
Nondomestic/commercial (MLD) n.a. 80.38 120.57 141.37
Industrial (assumed constant) (MLD) 275 275 275 275
Total demand (MLD) 1,137.65 1,732.23 1,933.6 2,188.53
Source: CDM 2005.
Current water supply situation: The total water supply currently taken in by the Hyderabad Metropolitan Water Supply and Sanitation Board (HMWSSB) is 1,135 MLD. It is estimated that 34% of the current supply is nonrevenue water (NRW), (18% is accounted as technical loss) and thus only a net supply of 931 MLD is managed against a demand of about 1,325 MLD (using the trend line for 2006), i.e. there is a deficit of about 400 MLD or 34%. The estimated demand for domestic use and industrial use over the next 20 years is presented in Table A7.1.
Using the projected demand and supply estimates (up to 2031), it is observed that HMWSSB will
continue to have real deficits in the future as depicted in Figure A7.1. This would be higher if the commercial losses component of the NRW is not addressed.
Current sanitation situation: In 2006, the total wastewater generation from Hyderabad was estimated at 850 MLD, out of which 133 MLD (16%) receives treatment, and the rest is discharged into Musi River untreated. To clean the Musi River, HMWSSB implemented the Musi River Conservation Project under the National River Conservation Directorate (NRCD).
fIGuRE A7.1. WAtER dEfICIt tILL 2031, ACCountInG foR tEChnICAL LossEs.
1325
17321833
1933
2188
931
1267
1435
1603 1603
394465
398330
585
0
500
1000
1500
2000
2500
2006 2011 2016 2021 2031
Qua
ntity
(MLD
)
Total demand Net supply Deficit

34
RESOURCE RECOVERY & REUSE SERIES 8
The design treatment capacities and the projected future sewage flow rates to these plants indicate wastewater flow figures as provided in Table A7.2.
From Table A7.2, it is clear that more than 500 MLD of secondary-treated wastewater will be available from the 2011 which could be treated and/or reused in industries, freeing up freshwater hitherto supplied to augment the water supply and meet the water supply demand.
tAbLE A7.2. WAtER suPPLy sItuAtIon And WAstEWAtER AvAILAbILIty foR RECyCLInG And REusE.
yEAR WATER dEMANd TOTAL SuPPLy WASTEWATER INFLOW WASTEWATER AvAILABLE
(MLd) (MLd) TO STPsa (MLd) FOR RECyCLING ANd REuSEb (MLd)
2011 1,732 1,545 1,004 534
2016 1,833 1,750 1,138 665
2031 2,188 1,955 1,271 795
Source: CDM 2005.
a 65% of supply;
b After deducting 2% for STP loss and 450 MLD towards ‘right of access’ (to meet the objective of the NRCD), all the treated wastewater cannot be reused. Therefore, a portion of the treated wastewater will be discharged into the Musi River to maintain river flow and the ‘right of access’ of downstream farmers (source: http://www.soulhyd.org/hussain_sagar/CHAP07.pdf).
This appears to be a more sustainable approach compared to the present attempts by water utilities to draw freshwater from distance sources to meet the growing demands in the cities. Besides requiring considerable resources, the system may also require pumping (to lift the water) and the sources are either drying up due to overexploitation or are overallocated due to political and economic forces. Closing the gap between demand and supply for any city administration is a challenge and wastewater recycling and reuse is a promising solution.

35
Recycling and Reuse of tReated wastewateR in uRban india
Appendix 8. Comparison of Financial Implications of Options to Augment Water Supply in Cities
box A8.1. bAnGALoRE.
Bangalore has a tertiary level treatment capacity of 73 MLD spread across four of the 14 STPs. The V. Valley tertiary stage was built to supply water to the Bidadi power plant. However, it is now serving different industries for non-potable reuse. The cost of production is between INR 10-12 m-3 (USD 0.17 – 0.2149) and the treated effluent is sold at INR 15 m-3 (USD 0.2650) for plant side supply and at INR 25 m-3 (USD 0.4351) (Kumar 2013) for supply piped to consumer premises (with the pipe-laying cost borne by the consumer). The Yelhanka treatment plant is the second biggest tertiary level treatment plant in Bangalore, with a tertiary treatment capacity of 10 MLD and an actual flow of 5.2 MLD. It currently supplies wastewater to the city’s international airport, Rail Wheel Factory and other industries. Finally, Cubbon Park and Lalbagh tertiary treatment plants are the smallest plants with capacity of 1.5 MLD and serve the respective parks. According to BWSSB officials the monthly revenue generated by the four treatment plants is about INR 4 million (USD 68,44652).
The utilities could augment existing water supplies through two means:
(a) Transporting water from a distant surface water source using multistage pumping or desalination and other expensive treatment options, and
(b) Wastewater recycling and reuse because supply of treated wastewater for non-potable applications to industries frees up the stock of water available with the utility, enabling augmentation of water supply to the city.
The results of the study clearly bring out the benefits of recycling treated wastewater for the utility. In the case of
HMWSSB, while the utility continues to incur operational losses under both supply augmentation scenarios (assuming that all other operational considerations remain the same (tariff, distribution and revenue collection efficiencies), the operational revenue loss when augmenting the city’s water supply with recycled wastewater is 40% of the losses incurred when augmenting with freshwater from distant sources. While the utility continues to remain loss-making under both options on account of inefficiencies in the system (leakages, tariffs and revenue collection), the projected losses could be brought down significantly if the wastewater recycling option was exercised by a factor of 2.5 (see Figure A8.153), compared to the option of developing the distant water source and pumping water to the city.
49 2013 exchange rate INR 58.44 = USD 150 Ibid.51 Ibid.52 Ibid.53 2008 exchange rate INR 43.62 = USD 1
In order to examine and quantify the benefits of wastewater recycling and reuse to water utilities, WSP undertook a study to compare the impact on the operating revenues of select water utilities as a result of augmenting water supply. This analysis was undertaken for the cities of Hyderabad, Bangalore and Chennai.
Implications of Water supply Augmentation in hyderabad and bangalore
Key features related to water supply and wastewater treatment in Bangalore are presented in Box A8.1.

36
RESOURCE RECOVERY & REUSE SERIES 8
fIGuRE A8.1. REvEnuE ComPARIson foR WW RECyCLInG And thE dIstAnt suRfACE WAtER oPtIon foR hydERAbAd.
A similar analysis of the BWSSB was undertaken which presents comparable findings. The study compared the investment required for augmenting water supply by 200 MLD (through the Cauvery Water Supply System Stage IV, Phase II was carried out through 2006-2014) and the alternate option of WWRR targeted at industries for swap. BWSSB incurred an operational deficit of about INR 2,500 million (USD 46.76 million54) on an annual operating expenditure of about INR 9,500 million (USD 177 million55) in FY 2012-13. If we consider capital investments for both options as being financed by loans, the operating deficit of BWSSB under the Cauvery Stage IV scheme would have increased slightly more than 4 times the current deficit owing largely to the interest burden and the continuing deficit realization from unit water supplied. In comparison, the WWRR-to-industries option would have reduced the deficit by 15%. If the additional water obtained from the Cauvery had been somehow channeled to
Industry, it would have reduced the deficit by 70%, owing to the high realization from industry for potable water. However, this would have been possible only with assured industrial off-take at such rates.
In both Bangalore and Hyderabad (more so the former), the WSSB needs to increase the share of industrial or nondomestic consumption in its consumer portfolio. For Bangalore, of the total water supplied/billed (~600 MLD), industry accounts for less than 20 MLD, while nondomestic (partially and fully) absorbs about 125 MLD. WWRR targeted for non-potable uses would start making economic sense to WSSBs when they are able to estimate non-potable demand and meet it through investments in dual-piping (with or without consumer participation). Current consumer databases with the WSSBs do not seem to have this information.
54 2012 exchange rate INR 53.46 = USD 155 Ibid.
-5,000 -4,000 -3,000 -2,000 -1,000 0
Total Revenue (new source)
Total Revenue: WW Reuse
Net Revenue from Additional Water Rs. (in Milllions)
Net Revenue
Source: Raman (2009).
37
Recycling and Reuse of tReated wastewateR in uRban india
Implication of Water supply Augmentation in Chennai
In 2010, the CMWSSB was supplying about 637 MLD of water to various categories of consumers. The supply increased to 827 MLD in 2012 owing to generation from the desalination plant and additional flows in that year from the surface water sources. In 2010 before the desalination option was activated, CMWSSB reported operational surplus of INR 169 million (USD 3.7 million56) on an expenditure of INR 3,753 million (USD 82.1 million57) (Box A8.2).
An analysis was carried out to assess the implications of water augmentation options on utility operational performance with consideration of two alternate options for ensuring a reliable and an augmented supply (100 MLD) of water for Chennai. The options considered were (1) seawater desalination (Desal) and (2) wastewater
recycling and supply to industry for swap. While the Desal option required a capital investment that implied an annual payout of INR 2,357 million (USD 44.1 million58), the corresponding burden with the WWR option was only INR 421 million (USD 7.88 million59) – an 82% reduction. Since the Desal option was executed through a DBOOT contract and CMWSSB had negligible capital investment, operational revenues were compared for the two options taking only the operational revenue and expenditure into account. The high cost of Desal water (INR 48.66 KL-1 (USD 0.9160)) resulted in the CMWSSB reporting operating deficits by FY 2012. Comparison of the two options indicated that the WWR-and-swap option would have decreased the operating deficit by half and also lessened significantly – by 40% - the gap-funding provided by the Government of Tamil Nadu (GoTN) to the utility, which stood at INR 1,380 million (USD 25.81 million61) in FY 2012.
box A8.2. WAtER suPPLy sItuAtIon In ChEnnAI.
In Chennai’s case, the CMWSSB sources water from surface and ground water sources for the drinking water requirements of the CMA. The surface water sources receive water during the northeast monsoon (normally from October to December) and thus have variable quantities; this dependency on the monsoon places Chennai’s requirements at risk. Acute water scarcity and failure of the monsoon in 2003 necessitated the search for a sustainable and secure source of water supply. The CMWSSB thus opted for seawater desalinization to augment the reliable and assured source of water for Chennai. This was initiated at Minjur for 100 MLD capacity on a design, build, own, operate and transfer basis (DBOOT). The augmented supply of water through the desalinization project became operational in FY 2012.
56 2010 exchange rate INR 45.71 = USD 157 Ibid.58 2012 exchange rate INR 53.46 = USD 159 Ibid.60 Ibid.61 Ibid.

38
RESOURCE RECOVERY & REUSE SERIES 8
CITya STATE CITy STATE
Agra Uttar Pradesh Kala Amb Himachal Pradesh
Ahmedabad Gujarat Kanpur Uttar Pradesh
Aligarh Uttar Pradesh Kathedan Andhra Pradesh
Angul Talcher Orissa Korba Chhattisgarh
Ankleshwar Gujarat Kukatpalli Andhra Pradesh
Asansole West Bengal Ludhiana Punjab
Aurangabad Maharashtra Manali Tamil Nadu
Bada Jamtara Jharkhand Mandi Gobind Garh Punjab
Baddi Himachal Pradesh Mangalore Karnataka
Batala Punjab Mathura Uttar Pradesh
Bhadravati Karnataka Meerut Uttar Pradesh
Bhavnagar Gujarat Mettur Tamilnadu
Bhillai- Durg Chhattisgarh Moradabad Uttar Pradesh
Bhiwadi Rajasthan Nagda Madhya Pradesh
Bidar Karnataka Nashik Maharashtra
Bulandsahar-Khurza Uttar Pradesh Navi Mumbai Maharashtra
Burnihat Assam Nazafgarh drain basin including Delhi
Anand Parvet, Naraina, Okhla,
Wazirpur
Chandrapur Maharashtra Noida Uttar Pradesh
Chembur Maharashtra Pali Rajasthan
Coimbatore Tamil Nadu Panipat Haryana
Greater Cochin Kerala Paradeep Orissa
Cuddalore Tamil Nadu Parwanoo Himachal Pradesh
Dewas Madhya Pradesh Patancheru- Andhra pradesh
Dhanbad Jharkhand Pimpari-Chinchwad Maharashtra
Digboi Assam Pinia Karnataka
Dombivalli Maharashtra Pitampur Madhya Pradesh
Durgapur West Bengal Raichur Karnataka
Erode Tamil Nadu Raipur Chhatisgarh
Faridabad Haryana Rajkot Gujarat
Ferozabad Uttar Pradesh Ramgarh Jharkhand
Ghaziabad Uttar Pradesh Saraikela Jharkhand
Gwalior Madhya Pradesh Singhbhum, West Bihar
Hajipur Bihar Singrauli Uttar Pradesh
Appendix 9. Potential for Industrial Reuse in India
Wastewater recycling is beneficial both for utility and industrial customers to offset at least a part of their industrial water needs, depending on processed water quality considerations. Industrial customers are in a position to adequately pay for the use of treated wastewater. It is desirable that cities, whenever possible, should promote the use and sale of recycled wastewater to industrial customers, even making this practice mandatory through changes in state/local regulations.
An MoEF and CPCB assessment (CPCB 2009b) undertaken to assess the status of environmental pollution
across various industrial clusters in India identified a total of 88 industrial clusters spread across 21 states. The complete list of these industrial clusters is included as Table A9.1. A rapid assessment of the wastewater generated in the cities within these 88 industrial clusters reveals that it may be possible to recycle for industrial reuse about one-third of the total wastewater generated across all Class I and Class II towns in India, as summarized in Table A9.2. Recycled wastewater from Class I and II cities has the potential to meet about a quarter of the total current industrial water demand (17 BCM including demand for energy).
tAbLE A9.1. LIst of mAjoR IndustRIAL CLustERs In IndIA.
(Continued)

39
Recycling and Reuse of tReated wastewateR in uRban india
tAbLE A9.1. LIst of mAjoR IndustRIAL CLustERs In IndIA. (ContInuEd)
CITya STATE CITy STATE
Haldia West Bengal Surat Gujarat
Haridwar Uttarakhand Tarapur Maharashtra
Howrah West Bengal Tirupur Tamil Nadu
Indore Madhya Pradesh Udhamsingh Nagar Uttarakhand
Ib Valley Orissa Vadodara Gujarat
Jaipur Rajasthan Vapi Gujarat
Jalandhar Punjab Varansi-Mirzapur Uttar Pradesh
Jamshedpur Jharkhand Vatva Gujarat
Jharsuguda Orissa Vellore North Arcot Tamil Nadu
Jodhpur Rajasthan Vijaywada Andhra Pradesh
Junagarh Gujarat Vishakhapatnam Andhra Pradesh
tAbLE A9.2. WAstEWAtER GEnERAtIon And PotEntIAL foR IndustRIAL REusE.
Wastewater generated in the state (in Class I and II Cities) (MLD) 39,500
Potential for industrial reuse (MLD) 14,260
Industrial reuse potential as a percentage of total wastewater generation 36%
States can also be categorized based on the potential for industrial reuse in the state, as presented in Table A9.3.
tAbLE A9.3. PotEntIAL foR IndustRIAL REusE In IndIAn stAtEs And uts.
POTENTIAL FOR INduSTRIAL STATES quANTITy OF
WASTEWATER RECyCLING62 WASTEWATER (MLd)
Nil/negligible Andaman & Nicobar Islands; Arunachal Pradesh; Assam; Bihar; Negligible
Chandigarh; Dadra & Nagar Haveli; Daman & Diu; Goa; Jammu &
Kashmir; Lakshadweep; Manipur; Mizoram; Meghalaya;
Nagaland; Pondicherry; Sikkim; Tripura
5-20% Andhra Pradesh; Himachal Pradesh; Karnataka; Kerala; 1,050
Orissa; Tamil Nadu; Uttarakhand; West Bengal
20-30% Haryana; Madhya Pradesh 590
30-50% Jharkhand; Maharashtra; Punjab; Rajasthan; Uttar Pradesh 8,000
>50% Chhattisgarh; Gujarat; NCT of Delhi 4,600
62 As a percent of total WW generated in the state. Potential for wastewater has been estimated based on the 88 industrial clusters identified by CPCB/MoEF (CPCB 2009b) and assuming that the entire quantity of wastewater generated in the cities identified in the industrial cluster can be recycled for industrial reuse. The wastewater generation from cities has been estimated based on the population (Census of India 2011) and the average per capita water supplied in the State (CPCB 2009a).
a Source: CPCB 2009b

40
RESOURCE RECOVERY & REUSE SERIES 8
Appendix 10. Health Considerations When Using Recycled and Treated Wastewater
The potential health risks of water reuse by any stakeholder exposed to the water or a product produced with it, depends on the one hand on the degree of exposure, and on the other hand on the adequacy, effectiveness and reliability of the treatment processes adopted. Non-potable use of treated wastewater is a common phenomenon in many countries, and usually takes place under stringent regulatory conditions (WHO 2006; USEPA 2012). As the goal of wastewater treatment is to protect public and environmental health, the same applies to water reuse, however, while not discouraging its practice and value especially under water-constrained conditions. Based on the planned reuse, such as for agriculture (food and nonfood crops), industry, aquifer recharge etc., the needed treatment levels and reuse-specific health guidelines should be targeted (Murray and
tAbLE A10.1. WAtER quALIty GuIdELInEs foR vARIous REusE APPLICAtIons.
Source: Adapted from USEPA 2012.
Buckley 2010; NRC 2012). In the Indian context, recycled and treated wastewater use are emerging, especially in the industrial sector, while in agriculture the use of untreated or partially treated water remains common (Amerasinghe et al. 2013). Given the widespread nature of the practice, regulatory authorities need assistance on how to move from informal to formal reuse as the alternative would be to ban informal reuse which would be a challenge given the large number of dependent livelihoods.
Table A10.1. gives an overview of water quality standards for different reuse applications as used in the USA (USEPA 2012). These standards are based on the capacity to have wastewater treatment plants in place where needed, which is not yet the case in India.
pH BOd Turbidity TSS Fecal coliform Residual
(mg L-1) (NTu) (mg L-1) (100 mL-1) Cl2(mg L-1)
Urban reuse Unrestricted 6.0-9.0 ≤10 ≤2 - No 1
detectable
Restricted 6.0-9.0 ≤30 - 30 ≤200 1
Agricultural reuse Food crops 6.0-9.0 ≤10 ≤2 - No 1
detectable
Processed food/
nonfood crops 6.0-9.0 ≤30 - 30 ≤200 1
Impoundments Unrestricted 6.0-9.0 ≤10 ≤2 - No 1
detectable
Restricted - ≤30 - 30 ≤200 1
Environmental reuse Environmental - ≤30 - 30 ≤200 1
reuse
Industrial reuse Once, through - ≤30 - 30 ≤200 1
cooling
Recirculating - ≤30 - 30 ≤200 1
cooling towers
Ground water Non-potable reuse Site-specific and use-dependent
recharge
Indirect potable 6.5-8.5 Meet drinking ≤2 ≤2 TOC of No 1
use – aquifer drinking water waste-water detectable
recharge, standards origin water
augmentation of
surface reservoirs
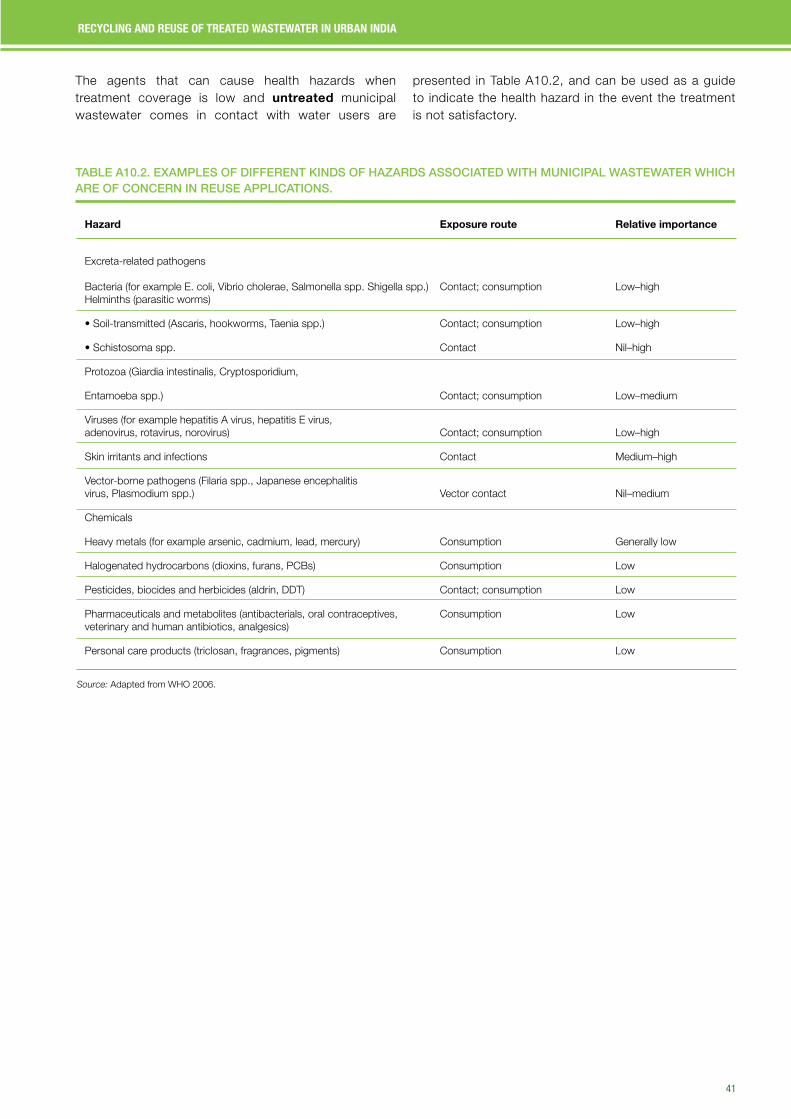
41
Recycling and Reuse of tReated wastewateR in uRban india
tAbLE A10.2. ExAmPLEs of dIffEREnt kInds of hAzARds AssoCIAtEd WIth munICIPAL WAstEWAtER WhICh ARE of ConCERn In REusE APPLICAtIons.
Hazard Exposure route Relative importance
Excreta-related pathogens Bacteria (for example E. coli, Vibrio cholerae, Salmonella spp. Shigella spp.) Contact; consumption Low–high Helminths (parasitic worms)
•Soil-transmitted(Ascaris,hookworms,Taeniaspp.) Contact;consumption Low–high
•Schistosomaspp. Contact Nil–high
Protozoa (Giardia intestinalis, Cryptosporidium,
Entamoeba spp.) Contact; consumption Low–medium
Viruses (for example hepatitis A virus, hepatitis E virus, adenovirus, rotavirus, norovirus) Contact; consumption Low–high
Skin irritants and infections Contact Medium–high
Vector-borne pathogens (Filaria spp., Japanese encephalitis virus, Plasmodium spp.) Vector contact Nil–medium
Chemicals
Heavy metals (for example arsenic, cadmium, lead, mercury) Consumption Generally low
Halogenated hydrocarbons (dioxins, furans, PCBs) Consumption Low
Pesticides, biocides and herbicides (aldrin, DDT) Contact; consumption Low
Pharmaceuticals and metabolites (antibacterials, oral contraceptives, Consumption Low veterinary and human antibiotics, analgesics)
Personal care products (triclosan, fragrances, pigments) Consumption Low
The agents that can cause health hazards when treatment coverage is low and untreated municipal wastewater comes in contact with water users are
presented in Table A10.2, and can be used as a guide to indicate the health hazard in the event the treatment is not satisfactory.
Source: Adapted from WHO 2006.
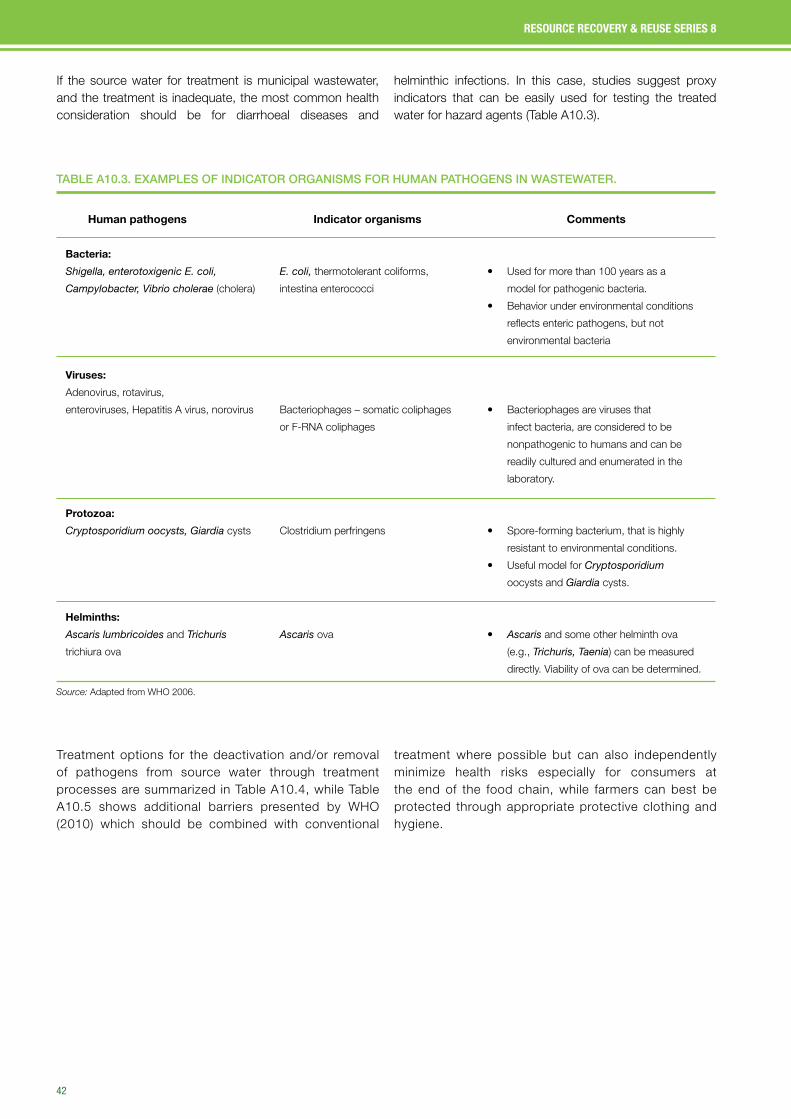
42
RESOURCE RECOVERY & REUSE SERIES 8
tAbLE A10.3. ExAmPLEs of IndICAtoR oRGAnIsms foR humAn PAthoGEns In WAstEWAtER.
Human pathogens Indicator organisms Comments
Bacteria:
Shigella, enterotoxigenic E. coli, E. coli, thermotolerant coliforms, � Used for more than 100 years as a
Campylobacter, Vibrio cholerae (cholera) intestina enterococci model for pathogenic bacteria.
� Behavior under environmental conditions
reflects enteric pathogens, but not
environmental bacteria
viruses:
Adenovirus, rotavirus,
enteroviruses, Hepatitis A virus, norovirus Bacteriophages – somatic coliphages � Bacteriophages are viruses that
or F-RNA coliphages infect bacteria, are considered to be
nonpathogenic to humans and can be
readily cultured and enumerated in the
laboratory.
Protozoa:
Cryptosporidium oocysts, Giardia cysts Clostridium perfringens � Spore-forming bacterium, that is highly
resistant to environmental conditions.
� Useful model for Cryptosporidium
oocysts and Giardia cysts.
Helminths:
Ascaris lumbricoides and Trichuris Ascaris ova � Ascaris and some other helminth ova
trichiura ova (e.g., Trichuris, Taenia) can be measured
directly. Viability of ova can be determined.
Source: Adapted from WHO 2006.
Treatment options for the deactivation and/or removal of pathogens from source water through treatment processes are summarized in Table A10.4, while Table A10.5 shows additional barriers presented by WHO (2010) which should be combined with conventional
treatment where possible but can also independently minimize health risks especially for consumers at the end of the food chain, while farmers can best be protected through appropriate protective clothing and hygiene.
If the source water for treatment is municipal wastewater, and the treatment is inadequate, the most common health consideration should be for diarrhoeal diseases and
helminthic infections. In this case, studies suggest proxy indicators that can be easily used for testing the treated water for hazard agents (Table A10.3).

43
Recycling and Reuse of tReated wastewateR in uRban india
tAbLE A10.4. REmovAL LEvELs of mICRooRGAnIsms (In LoG REduCtIons) And ChEmICALs (In %) usInG tREAtmEnt oPtIons.
Secondary Media Membrene Aquifer UV Advanced
treatment filtration filtration storage Ozonation disinfection oxidation Chlorination
Indicator E. coli (for bacteria) 1-3 0-1 4->6 1-5 2-6 2->6 >6 2->6
microorganisms Clostridium perfringens 0.5-1 0-1 >6 N/A 0-0.5 N/A N/A 1-2
(in log reductions) Phage (virus) 0.5-2.5 1-4 2->6 1-4 2-6 3->6 >6 0 - 2 . 5
Pathogenic Enteric bacteria 1-3 0-1 >6 1-5 2-6 2->6 >6 2->6
microorganisms Enteric viruses 0.5-1 0.5-3 2->6 1-4 3-6 1->6 >6 1-3
(in log reductions) Giardia lamblia 0.5-2.5 1-3 >6 3-4 2-4 3->6 >6 0.5-1.5
Cryptosporidium 0.5-1 1.5-2.5 4->6 1-3.5 1-2 3->6 >6 0-0.5
parvum
Helminths 0-2 2-3 >6 1.5->3 N/A N/A N/A 0-1
Organic B(a)p* nd nd >80 nd >80 - - >80
chemicals Antibiotics 10-50 <20 50->95 50-90 >95 20->80 50-80 >80
(in %) Pharmaceuticals nd <20 50->95 10-50 50-80 <20 50-80 20-50
Hormones, steroid >90 <20 50->95 >90 >95 >80 >80 >80
Source: Multiple sources reviewed and reported by USEPA 2012. Note: * benzo(a)pyrene
The 2006 revision of the WHO guidelines adopted an approach which moves the control point from, in many countries unachievable, water quality standards to a health-based target expressed in Disability Adjusted Life Years (DALY). The guidelines translate the health-based target into a performance target of 6-7 log units’ pathogen reduction which should be achieved along
the food chain or till the point of exposure. This new approach offers authorities more options for reducing risks especially where conventional water treatment is still limited. Table A10.5 shows the possible log reductions through different treatment and other risk reduction options which can be used in combination (multi-barrier approach).

44
RESOURCE RECOVERY & REUSE SERIES 8
tAbLE A10.5. hEALth-PRotECtIon ContRoL mEAsuREs And AssoCIAtEd PAthoGEn REduCtIons.
Control measure Pathogen reduction Notes
(log units)
A. Wastewater treatment 6-7 Pathogen reduction depends on type and degree of treatment selected.
B. On-farm options
Crop restriction (i.e., no food 6-7 Depends on (a) effectiveness of local enforcement of crop restriction,
crops eaten uncooked) and (b) comparative profit margin of the alternative crop(s).
On-farm treatment:
(a) Three-tank system 1-2 One pond is being filled by the farmer, one is settling and the settled water
from the third is being used for irrigation.
(b) Simple sedimentation 0.5-1 Sedimentation for ~18 hours.
(c) Simple filtration 1-3 Value depends on filtration system used.
Method of wastewater application:
(a) Furrow irrigation 1-2 Crop density and yield may be reduced.
(b) Low-cost drip irrigation 2-4 2-log unit reduction for low-growing crops, and 4-log unit reduction for high-
growing crops.
(c) Reduction of splashing 1-2 Farmers trained to reduce splashing when watering cans used (splashing
adds contaminated soil particles on to crop surfaces which can be minimized).
Pathogen die-off (cessation) 0.5-2 Die-off between last irrigation and harvest (value depends on climate, crop
per day type, etc.).
C. Postharvest options at local markets
Overnight storage in baskets 0-1 Selling produce after overnight storage in baskets (rather than overnight
storage in sacks or selling fresh produce without overnight storage).
Produce preparation prior to sale 1-2 (a) Washing salad crops, vegetables and fruit with clean water.
2-3 (b) Washing salad crops, vegetables and fruit with running tap water.
1-3 (c) Removing the outer leaves on cabbages, lettuces, etc.
d. In-kitchen produce preparation options
Produce disinfection 2-3 Washing salad crops, vegetables and fruit with an appropriate
disinfectant solution and rinsing with clean water.
Produce peeling 2 Fruits, root crops.
Produce cooking 5-6 Option depends on local diet and preference for cooked food.
Source: WHO 2010.

45
Recycling and Reuse of tReated wastewateR in uRban india
Appendix 11. Safe Use of Wastewater for Irrigation without Sufficient Conventional Treatment
fIGuRE A11.1. A GEnERIC ExAmPLE of thE muLtIPLE-bARRIER APPRoACh foR ConsumPtIon-RELAtEd RIsks ALonG thE food ChAIn As APPLIEd In WAstEWAtER IRRIGAtIon.
Source: Amoah et al. 2011.
Wastewater generation
Farmer/ Producer
Traders/Retailers
Street food kitchens
Consumer
Wastewater treatment
Safe IrrigationPractices
HygienicHandlingPractices
Safe food washing and preparation
Awareness creation to create
demand for safe produce
Facilitating behaviour change via education, market & non -market incentives, and regular inspections
Wastewater generation
Farmer/ Producer
Traders/Retailers
Street food kitchens
Consumer
Wastewater treatment
Safe irrigationpractices
Hygienichandlingpractices
Safe food washing and preparation
Awareness creation to create
demand for safe produce
Facilitating behavior change via education, market and nonmarket incentives, andregular inspections
63 The DALY is a measure of overall disease burden, expressed as the number of years lost due to ill-health, disability or early death. It is a metric which is independent of the type of the disease allowing cross-disease comparisons.
In India, treatment capacity exists for less than a third of the 38,000 MLD of wastewater generated. Of this capacity, 40% fails to meet environmental protection standards and is discharged into water bodies. Due to its perennial nature, wastewater has been used by farmers for irrigating their land exposing farmers and consumers of the crop potentially to health risks. A solution is to follow the generally accepted HACCP approach, i.e. introducing a multi-barrier approach which adds safe on- and off-farm practices as recommended by WHO (2006) to any existing treatment. There are various options verified under high pollution situations in Africa by Amoah
et al. (2011) (see Figure A11.1) and Keraita et al. (2014) and used in FAO Farmer Field School Manuals and recent WHO updates to its 2006 guidelines (http://www.who.int/water_sanitation_health/wastewater/human_waste/en/). Farmer training institutes can incorporate these recommended practices in their curriculum to support farmers where wastewater treatment capacities are still under construction. Compared to conventional treatment, introducing a multi low-cost barrier approach can have a high-cost affectiveness of USD 20-80 per averted DALY63 with a return on investment of USD 4.9 per dollar invested (Drechsel and Seidu 2011).

46
RESOURCE RECOVERY & REUSE SERIES 8
Appendix 12. Examples of Sale of Treated Wastewater to Industries
delhi supplies treated sewage to industrial establishments like power plants, industrial areas and hospitals. In 2004, the Delhi government denied Pragati Power Corporation Limited (PPCL) freshwater linkage to operate its 330 MW gas–based power plant. However, the Delhi government gave an option to PPCL to operate two of the DJB’s 20 MLD STPs to meet its water requirement. The treated water is sourced from the Rithala STP, Sen Nursing Home Nallah STP and Delhi Gate Nallah STP. The O&M of the services is undertaken by Degremont Limited. The current O&M cost incurred by PPCL stands at about INR 4 kL-1 (USD 0.07564) (IIR 2013). The Delhi Jal Board (DJB) has also evaluated technologies to retrofit the existing 113 MLD portion of the Okhla sewage treatment plant (STP) for recycling and reuse of wastewater for nonpotable applications in the nearby industrial units. It has identified prospective end users of treated sewage. These include the Okhla industrial area, upcoming townships, and cooling water for NTPC’s power plant in Badarpur (Kelkar 2012a, 2012b).
The Bangalore Water Supply and Sewerage Board (BWSSB) is one of the few agencies involved in tertiary treatment of wastewater and supplying the same to nearby industries/plants. Currently, four of the seven STPs undertake tertiary treatment. The average cost of tertiary treatment comes to about INR 10–15 kL-1 (USD 0.19 – 0.2865) (IIR 2013). Notably, Bengaluru charges INR 60 kL-1 (USD 1.1266) for freshwater to be used for industrial purposes. The treated sewage from the 180 MLD Vrishabhavathi Valley treatment plant is supplied to a number of industries and is expected to supply treated sewage water to the upcoming Bidadi power plant. Further, treated wastewater from the 10 MLD Yelahanka Tertiary treatment plant is being supplied to Bengaluru International Airport, Bharath Electronic Limited, Indian Tobacco Company, Rail Wheel Factory and Indian Air Force. Further, BWSSB has initiated a scheme on the Integrated Water Resource Management Reuse of Wastewater from Vrishabhavathi Valley (V Valley). It consists of a 135 MLD reuse process scheme to be undertaken in four phases. The landed cost of high quality treated water from V Valley to River Arkavathy will be INR 12 Kl-1 1 (USD 0.2267).68
64 2012 exchange rate INR 53.46 = USD 165 Ibid.66 Ibid.67 Ibid.68 Source: http://bwssb.org/sewage-treatment-5/69 2012 exchange rate INR 53.46 = USD 170 Ibid.71 Source: http://sulabhenvis.nic.in/LatestNewsArchieve.aspx?Id=2870&Year=2012; Kelkar (2012).72 2015 exchange rate INR 64.03 = USD 173 Ibid.74 Ibid.75 Source: http://chandigarh.gov.in/cmp2031/physical-infra.pdf
The Surat Municipal Corporation (SMC) is also involved in the supply of treated wastewater to industrial units in the Pandesara Industrial Estate. The treated wastewater is supplied from the Bamroli STP. The SMC is also developing a 40 MLD tertiary treatment plant at Bamroli on a PPP basis. The plant is being developed by city–based Enviro Control Associates. The project, which was expected to be scheduled for commissioning in 2013, is expected to bring down the cost of procuring freshwater from the current level of INR 22 kL-1 (USD 0.4169) for industrial use (Kelkar 2012a,b).
In addition, cities like Hyderabad, Nagpur and Pimpri–Chinchwad are also undertaking initiatives to promote the use of treated wastewater. Hyderabad is planning to implement a project to recycle wastewater at its three major STPs (Amberpet, Nagole and Nallacheruvu) and supply it to industries. Recently, the Japan International Cooperation Agency (JICA) gave its approval for providing financial assistance to the project. HMWSSB charges INR 1 kL-1 (USD 0.01970) for treated water available for reuse.71
The Gurgaon district Authority has made it mandatory for all construction firms to use treated wastewater from its STPs for construction and other nonpotable purposes. The Authority has started supplying tertiary treated wastewater from two STPs – Behrampur (15 MLD) and Dhanwapur (25 MLD) at a rate of INR 4 kL-1 (USD 0.06272).
The Jaipur Municipal Corporation has implemented an Asian Development Bank (ADB)–funded STP in Delawas. The treated wastewater from the 62.5 MLD STP is supplied to nearby small–scale industrial units and for irrigation purposes. Also, the sludge generated is used as manure for agriculture and nursery purposes. The STP was commissioned in September 2006.
Chandigarh municipality charges INR 500 acre-1 (USD 7.8173) for supplying treated wastewater to be used for agricultural irrigation and charges INR 50 kanal-1 (USD 0.7874) (500 yards2) month-1 for irrigation of green spaces.75

47
Recycling and Reuse of tReated wastewateR in uRban india
Appendix 13. Review of Incremental Benefits Delivered Due to Wastewater Irrigation
Table A13.1 summarizes the incremental benefits reported as accruing to farmers engaged in cultivation using wastewater, compared to freshwater.
tAbLE A13.1. InCREmEntAL bEnEfIts dELIvEREd duE to WAstEWAtER IRRIGAtIon In sELECtEd CItIEs.
City Crop cultivated Increase in decrease Increase in Average annual
yield (%) in fertilizer pesticide incremental
consumption consumption benefit**
(%) (%) (INR ha-1)76
Indore Wheat (Rabi)/ 30-40% 50% Almost double 36,752
vegetables
(summer)
nagpur Wheat (Rabi)/
vegetables
(summer) 30-40% 33% Almost double 26,951
jaipur Wheat (Rabi)/ 30-40% 50% Almost double 37,790
vegetables
(summer)
bangalore Rice (Rabi),
sapota and flowers
(summer) 30-40% 100% Almost double 33,849
Ahmedabad* Rice and wheat
(Rabi) - - - -14,640
delhi okra 67% 60% Increased by 50% 8,500
kanpur Paddy and wheat Reported 6,166 (paddy)
decrease in yield - - 954 (wheat)
Source: Adapted from Amerasinghe et al. 2013; WII 2006; Londhe et al. 2004.
Notes: * This decrease in net benefit in Ahmedabad is believed to be due to higher levels of pollution in Ahmedabad as compared to other cities. The study also reported that continued application of partial/untreated wastewater affects soil fertility increasing fertilizer and pesticide consumption. Thus farmers engaged in wastewater irrigation were spending more on fertilizers and pesticides, compared to farmers practicing freshwater irrigation.
** This incorporates the impact of increased yield, change in fertilizer and pesticide use, wherever reported.
76 2005 exchange rate INR 49.5 = USD 1


CGIAR Research Program on Water, Land and Ecosystems
The CGIAR Research Program on Water, Land and Ecosystems (WLE) combines the resources of 11 CGIAR centers, the Food and Agriculture Organization of the United Nations (FAO) and numerous national, regional and international partners to provide an integrated approach to natural resource management research. WLE promotes a new approach to sustainable intensification in which a healthy functioning ecosystem is seen as a prerequisite to agricultural development, resilience of food systems and human well-being. This program is led by the International Water Management Institute (IWMI) and is supported by CGIAR, a global research partnership for a food-secure future.
Resource Recovery and Reuse (RRR) is a subprogram of WLE dedicated to applied research on the safe recovery of water, nutrients and energy from domestic and agro-industrial waste streams. This subprogram aims to create impact through different lines of action research, including (i) developing and testing scalable RRR business models, (ii) assessing and mitigating risks from RRR for public health and the environment, (iii) supporting public and private entities with innovative approaches for the safe reuse of wastewater and organic waste, and (iv) improving rural-urban linkages and resource allocations while minimizing the negative urban footprint on the peri-urban environment. This sub-program works closely with the World Health Organization (WHO), Food and Agriculture Organization of the United Nations (FAO), United Nations Environment Programme (UNEP), United Nations University (UNU), and many national and international partners across the globe. The RRR series of documents present summaries and reviews of the sub-program’s research and resulting application guidelines, targeting development experts and others in the research for development continuum.
CGIAR Research Program on Water, Land and EcosystemsInternational Water Management Institute (IWMI)127 Sunil Mawatha, PelawattaBattaramulla, Sri LankaEmail: [email protected]: wle.cgiar.orgAgriculture and Ecosystems Blog: wle.cgiar.org/blogs
Pho
to: N
eil P
alm
er/C
IAT
Science with a human face
IN PARTNERSHIP WITH:
ISSN 2478-0510
e-ISSN 2478-0529 ISBN 978-92-9090-834-0