recycling now and in the future - friends of the earth | home · recycling now and in the future....
TRANSCRIPT

Richard Swannell
Director – Retail & Organics
WRAP
Recycling now and in the future

Content
How recycling has developed
Recycling in a Recession
Challenges for the future
Conclusions

WRAP: Delivery resource efficiency

How recycling has developed?

Household waste recycling – EnglandHousehold waste sent for recycling in England
0
1,000
2,000
3,000
4,000
5,000
6,000
7,000
8,000
9,000
10,000
2000/01
2001/02
2002/03
2003/04
2004/05r
2005/06
2006/07
2007/08
00
0 t
on
nes
Other
Co-mingled
Scrap metals &white goods
Compost
Textiles
Plastics
Cans
Glass
Paper & card

Household waste recycling and Committed Recycler rates in England
0%
10%
20%
30%
40%
50%
60%
70%
Sep-02 Jan-04 May-05 Oct-06 Feb-08 Jul-09
Perc
en
tag
e
Committed recyclers Household recycling rate

Total UK Recycling 2007
0%
20%
40%
60%
80%
100%
Total UK - 110Mt Municipal - 10Mt
Other
Plastics
Wood
Glass
Green / food
Paper and card
Metals
Aggregates

Markets: Glass – 1.6 Mt Recycled
Containers: 665 ktpa
Export: 340 ktpa
Glass wool: 145 ktpa
Aggregates: 450 ktpa

UK RecyclingEnvironmental Impact:
18 Mt/y CO2 e
=
5 million cars off the
road
OR
Closing down 3 coal
fired power stations

Recycling in the Recession

Latest economic situation
Substantial falls in prices of some (not all) recovered materials
Why?
Global economic and financial conditions
weaker demand for products & cut backs in supply
fewer raw materials needed, including recovered materials
Also affecting primary commodity markets

Prices for recovered paper
monthly average £ per tonne
Last updated 21 April 2009
0
20
40
60
80
100
120
Apr-
08
May-
08
Jun-
08
Jul -
08
Aug-
08
Sep-
08
Oct-
08
Nov-
08
Dec-
08
Jan-
09
Feb-
09
Mar-
09
Apr-
09
Mixed paper & board
News & pams
OCC
Source: WRAP Materials Pricing Report
Paper & Card (£/t)

Recovered Plastic Bottles (£/t)Prices for recovered plastic bottles
monthly average £ per tonne
Last updated 21 April 2009
0
50
100
150
200
250
Apr-
08
M ay-
08
Jun-
08
Jul-
08
Aug-
08
Sep-
08
Oct-
08
Nov-
08
Dec-
08
Jan-
09
Feb-
09
M ar-
09
Apr-
09
Clear PET
Coloured PET
Mixed HDPE
Mixed polymers
Source: WRAP Materials Pricing Reports

Aluminium & Steel Cans (£/t)

Glass (£/t)

Summary
Markets appear to have stabilised after excessive volatility
Prices for most recovered materials picking up from lowest points
Materials are moving, overseas buyers are returning
High quality materials are experiencing fewer difficulties, achieving value and finding markets
LA survey indicates no significant stockpiles
EA data also suggests no significant increase in storage

Recycling in the Future

Targets & Trends
Landfill Tax escalator
Landfill Directive targets
England: 50% target by 2020
Scotland: 70% by 2025 (check)
Wales: similarly ambitious
Increasing interest in C&I

% of local authorities collecting materials via kerbside schemes in England 2007/08
Organic
recyclingDry recycling
0%
10%
20%
30%
40%
50%
60%
70%
80%
90%
100%
Paper
Card
Glass
Meta
l cans
/ tin
s / a
eroso
lsFoil
Plast
ic b
ottle
s
Mix
ed pla
stic
s
Batterie
s
Textiles
Garden
CardFood
Separate
food
% o
f lo
cal
au
tho
rie
s co
lle
ctin
g m
ate
ria
l
England’s kerbside infrastructure 2007/08

How to hit 50%?
00
0 t
on
ne
s
0
500
1,000
1,500
2,000
2,500
3,000
3,500P
ap
er
Card
Pla
stic
(rig
ids
&
flex
ible
s)
Gla
ss
Alu
min
ium
& s
teel
pack
ag
ing
Oth
er
meta
l /
Scr
ap
Gard
en
wast
e
Fo
od
wast
e
Tex
tile
s
Wo
od
/
Fu
rnit
ure
Batt
eri
es
an
d o
ther
haza
rdo
us
En
gin
e o
il
Current recycling Additional material required

This will require…
Waste minimisation
Increase in capture
Increase in material streams e.g.
Food waste
Mixed plastics
Building high quality end markets

Food is 20% of UK GHG emissionFood is 20% of UK GHG emission

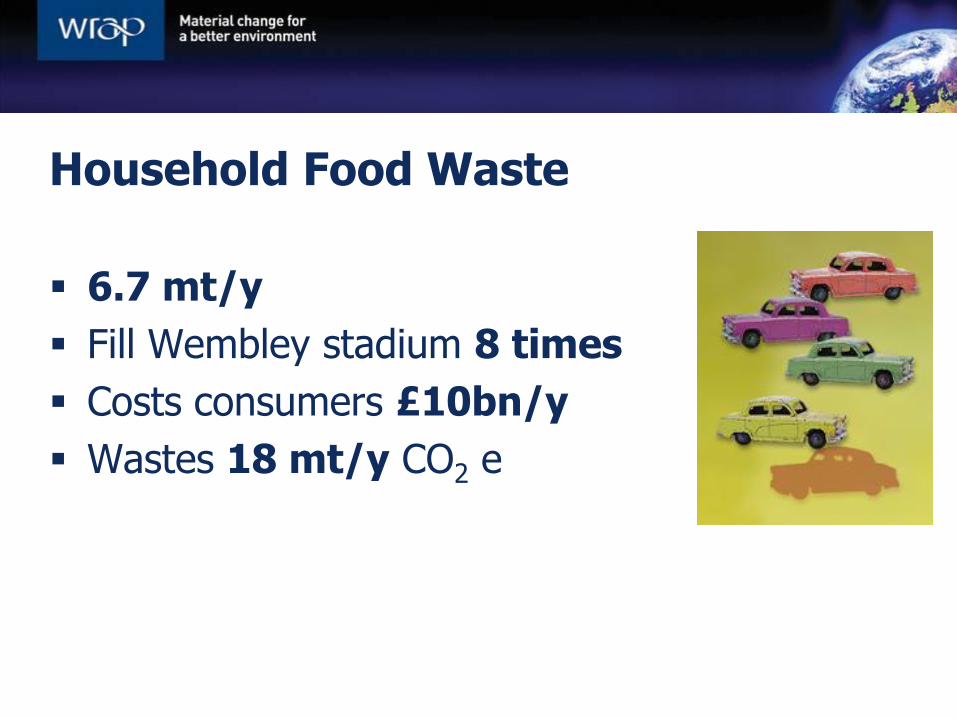
Household Food Waste
6.7 mt/y
Fill Wembley stadium 8 times
Costs consumers £10bn/y
Wastes 18 mt/y CO2 e

www.lovefoodhatewaste.com

Impact
1.8 million more UK households reducing food waste
Saving of £300 M/y
Reduction of 137,000 t in food waste
Reduction of 600kt CO2 e

Food Collection: Target 2 Mt/y by 2020
130 kg/hld/y
Low contamination
Reduced residual waste disposal
40 kg/hld/y
Higher contamination
More residual waste

ADAD Renewable Energy
Produces Biofertiliser
Gate fee £35-55/t
Produces compost
Gate fee £35-55/t
Treatment
IVC

Base System: Fortnightly free garden only, refuse alt
weekly in bin
-£800,000
-£600,000
-£400,000
-£200,000
£0
£200,000
£400,000
£600,000
£800,000
Weekly food only, no change to
residual
Switch to fortnightly mixed food
and garden collection, no change
to residual
Switch: No change to residual
Co
sts
(m
illi
on
£)
Cost of collection switch
Net effect on biowaste treatment
Net effect on residual wastetreatment inc avoided disposal
Net effect on dry recyclingrevenues
Total incremental cost
Costs of food waste collection

Conclusions

Conclusions
Recycling rates are increasing
Collection infrastructure is improving
Recession posed problems for the sector
There are signs ofimprovement and WRAP is monitoring the situation
Brings significant environmental benefits

The future
Maintain and grow confidence in recycling
Capture more
Emphasis on quality
Develop infrastructure
New material streams:
Food waste (AD?)
Mixed plastics
WEEE

Thank you